Attached files
Table of Contents
UNITED STATES
SECURITIES AND EXCHANGE COMMISSION
Washington, D.C. 20549
Form 10-K
| x | Annual Report Pursuant to Section 13 or 15(d) of the Securities Exchange Act of 1934 |
For the fiscal year ended August 28, 2010
Or
| ¨ | Transition Report Pursuant to Section 13 or 15(d) of the Securities Exchange Act of 1934 |
Commission file number 1-6807
FAMILY DOLLAR STORES, INC.
(Exact name of registrant as specified in its charter)
| Delaware | 56-0942963 | |
| (State or other jurisdiction of incorporation or organization) |
(I.R.S. Employer Identification No.) | |
| 10401 Monroe Road, Matthews, North Carolina |
28105 | |
| (Address of principal executive offices) | (Zip Code) | |
P.O. Box 1017, Charlotte, North Carolina 28201-1017
(Mailing address)
Registrant’s telephone number, including area code: (704) 847-6961
Securities registered pursuant to Section 12(b) of the Act:
| Title of each class |
Name of each exchange on which registered | |
| Common Stock, $.10 Par Value | New York Stock Exchange |
Securities registered pursuant to Section 12(g) of the Act: None
Indicate by check mark if the registrant is a well-known seasoned issuer, as defined in Rule 405 of the Securities Act. Yes x No ¨
Indicate by check mark if the registrant is not required to file reports pursuant to Section 13 or Section 15(d) of the Act. Yes ¨ No x
Indicate by check mark whether the registrant (1) has filed all reports required to be filed by Section 13 or 15(d) of the Securities Exchange Act of 1934 during the preceding 12 months (or for such shorter period that the registrant was required to file such reports), and (2) has been subject to such filing requirements for the past 90 days. Yes x No ¨
Indicate by check mark whether the registrant has submitted electronically and posted on its corporate Web site, if any, every Interactive Data File required to be submitted and posted pursuant to Rule 405 of Regulation S-T (§232.405 of this chapter) during the preceding 12 months (or for such shorter period that the registrant was required to submit and post such files). Yes ¨ No ¨
Indicate by check mark if disclosure of delinquent filers pursuant to Item 405 of Regulation S-K is not contained herein, and will not be contained, to the best of registrant’s knowledge, in definitive proxy or information statements incorporated by reference in Part III of this Form 10-K or any amendment to this Form 10-K. x
Indicate by check mark whether the registrant is a large accelerated filer, an accelerated filer, a non-accelerated filer, or a smaller reporting company. See the definitions of “large accelerated filer,” “accelerated filer” and “smaller reporting company” in Rule 12b-2 of the Exchange Act.
| Large accelerated filer x | Accelerated filer ¨ | |
| Non-accelerated filer ¨ (Do not check if a smaller reporting company) | Smaller reporting company ¨ |
Indicate by check mark whether the registrant is a shell company (as defined in Rule 12b-2 of the Act). Yes ¨ No x
The aggregate market value of voting and non-voting common equity held by non-affiliates computed by reference to the price at which the common equity was last sold, as of the last day of the registrant’s most recently completed second fiscal quarter, on February 27, 2010, was approximately $4.1 billion.
The number of shares of the registrant’s Common Stock outstanding as of October 8, 2010, was 125,885,609.
DOCUMENTS INCORPORATED BY REFERENCE
The information required in Part III of this Form 10-K is incorporated by reference to the registrant’s definitive proxy statement to be filed for the Annual Meeting of Stockholders to be held in January 2011.
Table of Contents
2
Table of Contents
We have provided information in this Annual Report on Form 10-K (this “Report”) regarding the operations of Family Dollar Stores, Inc., and its subsidiaries (“we,” “Family Dollar” or the “Company”) related to the fiscal years ended on August 28, 2010 (“fiscal 2010”); August 29, 2009 (“fiscal 2009”); August 30, 2008 (“fiscal 2008”); September 1, 2007 (“fiscal 2007”); and August 26, 2006 (“fiscal 2006”); and anticipated operations for the fiscal year ending on August 27, 2011 (“fiscal 2011”). You should review the discussion and analysis provided in this Report in conjunction with our Consolidated Financial Statements and the Notes to Consolidated Financial Statements, which are included elsewhere in this Report.
CAUTIONARY STATEMENT REGARDING FORWARD-LOOKING STATEMENTS
Certain statements contained in this Report, or in other public filings, press releases, or other written or oral communications made by Family Dollar or our representatives, which are not historical facts, are forward-looking statements that are subject to the safe harbor provisions of the Private Securities Litigation Reform Act of 1995. These forward-looking statements address, among other things, our plans, activities or events which we expect will or may occur in the future and may include express or implied projections of revenue or expenditures; statements of plans and objectives for future operations, growth or initiatives; statements of future economic performance, including, but not limited to, investment and financing plans, net sales, comparable store sales, cost of sales, SG&A expenses, earnings per diluted share, dividends and share repurchases; or statements regarding the outcome or impact of pending or threatened litigation. These forward-looking statements may be identified by the use of the words “believe,” “plan,” “estimate,” “expect,” “anticipate,” “probably,” “should,” “project,” “intend,” “continue,” and other similar terms and expressions. Various risks, uncertainties and other factors may cause our actual results to differ materially from those expressed or implied in any forward-looking statements. Factors, uncertainties and risks that may result in actual results differing from such forward-looking information include, but are not limited to, those listed in Part I – Item 1A below, as well as other factors discussed throughout this Report, including, without limitation, the factors described under “Critical Accounting Policies” in Part II – Item 7 below, or in other filings or statements made by us. All of the forward-looking statements in this Report and other documents or statements are qualified by these and other factors, risks and uncertainties.
You should not place undue reliance on the forward-looking statements included in this Report. We assume no obligation to update any forward-looking statements, even if experience or future changes make it clear that projected results expressed or implied in such statements will not be realized, except as may be required by law. In evaluating forward-looking statements, you should consider these risks and uncertainties, together with the other risks described from time to time in our other reports and documents filed with the Securities and Exchange Commission (“SEC”).
3
Table of Contents
PART I
General
We operate a chain of more than 6,800 general merchandise retail discount stores in 44 states, providing primarily low- and middle-income consumers with a selection of competitively priced merchandise in convenient neighborhood stores. Our merchandise assortment includes consumables, home products, apparel and accessories, and seasonal and electronics. We sell merchandise at prices that generally range from less than $1 to $10.
We opened our first Family Dollar store in Charlotte, North Carolina, in 1959. In subsequent years, we opened additional stores and organized separate corporations to operate these stores. Family Dollar Stores, Inc. was incorporated in Delaware in 1969, and all then-existing corporate entities became its wholly-owned subsidiaries.
The mailing address of our executive offices is P.O. Box 1017, Charlotte, North Carolina 28201-1017, and our telephone number is (704) 847-6961. Our website address is www.familydollar.com. You can find our press releases for the past five years on our website. We also make available free of charge through our website all of our reports filed with or furnished to the SEC pursuant to the Securities Exchange Act of 1934, as amended (the “Exchange Act”), including our Annual Reports on Form 10-K, Quarterly Reports on Form 10-Q, Current Reports on Form 8-K and amendments to those reports, as soon as reasonably practicable after they are electronically filed with or furnished to the SEC. These reports and amendments also are available on the SEC’s website at www.sec.gov.
Overview of Business Operations
Our Mission and Vision
Our mission is to provide customers with a compelling place to shop, our team members with a compelling place to work, and investors with a compelling place to invest. Our vision is to be the best small-format convenience and value retailer serving the needs of families in our neighborhoods.
Our Customers
We serve the basic needs of customers primarily in the low- and middle-income brackets. Typically, our customer is a female head-of-household. According to Nielsen’s 2010 Homescan® data, approximately 55% of our customers had an annual gross income of less than $40,000 and approximately 24% had an annual gross income of less than $20,000. Approximately 34% of our customers were African American or Hispanic, and approximately 68% of our customers were age 45 or older.
Our Stores
A Family Dollar store is typically between 7,500 and 9,500 square feet and generally serves customers who live within five miles of the store. Our stores are located in urban, suburban, small town and rural markets. See Item 2 – “Properties” in this Report for more information. The relatively small size of a Family Dollar store allows us to select store locations that provide neighborhood convenience to our customers in each of these market areas. Family Dollar stores are generally open seven days a week and accept cash, checks, PIN-based debit cards, credit cards, and other electronic payment types, including food stamps.
Our Merchandise
We provide customers with quality merchandise at everyday low prices. We offer a focused assortment of merchandise in a number of core categories, such as health and beauty aids, packaged food and refrigerated products, home cleaning supplies, housewares, stationery, seasonal goods, apparel and home fashions. Our stores operate on a self-service basis, and our low overhead enables us to sell merchandise at a relatively moderate markup. In the typical Family Dollar store, the majority of the products are priced at $10 or less, with many of the products priced at $1 or less. In fiscal 2010, the average customer transaction was $9.91.
4
Table of Contents
Current Strategic Initiatives
We believe that balancing initiatives targeted to deliver short-term financial results with investments that may require longer-term development will help us weather difficult macro-environments and enable us to achieve our long-term financial goals.
Several years ago, we began to slow new store growth to focus more on improving returns in existing stores and the chain overall. Since then, we have completed an end-to-end re-engineering of our merchandising and supply chain processes, enhanced the performance of our store teams, refreshed our store technology platform, and created a store layout for new stores that is more convenient and easier to shop. As a result of these investments, we upgraded our operational capabilities, increased profitability, gained productivity and expanded our financial returns. More importantly, these investments provide us with a strong foundation to accelerate revenue growth going forward.
Building on the improvements we have made over the past several years, we plan to continue to strengthen our value and convenience proposition in fiscal 2011. In addition, we plan to re-accelerate our new store growth while also launching a comprehensive store renovation program.
Our new store performance has improved significantly in the last several years as a result of the utilization of stronger site selection tools as well as enhancements driven by our strategic initiatives. Our operational improvements, combined with softening real estate markets and a growing customer base, have resulted in additional opportunities for new store growth. During fiscal 2011, we plan to open approximately 300 new stores, a 50% increase over fiscal 2010 openings. We also expect to build the pipeline for further acceleration of our new store growth over the next two to three years.
Leveraging our concept renewal efforts, enhanced merchandising and supply chain capabilities, a refreshed store technology platform, and a better-trained and more productive workforce, we are initiating a comprehensive renovation program intended to re-energize the Family Dollar brand. During fiscal 2011, we plan to renovate 600 to 800 stores at a projected cost of $100,000 to $130,000 per store. The renovations will address both the interior and exterior of the stores and will create more customer-focused assortments and layouts, rejuvenated physical stores and more customer-centric teams.
While we are making significant investments to drive revenue growth, we also continue to pursue opportunities to further enhance our profitability and financial returns. Key areas of focus will include the continued expansion of our private brand programs and the continued development of our global sourcing capabilities, as well as our ongoing efforts to improve operational productivity.
In fiscal 2010, we launched or refreshed several Family Dollar brands, increasing sales of private brand merchandise from 19% of net sales in fiscal 2009 to 22% of net sales in fiscal 2010. In fiscal 2011, we plan to continue to enhance and develop our private brand programs with an increased focus on consumable categories, and we plan to leverage our enhanced marketing capabilities to drive greater brand awareness and strengthen our overall quality perception.
Our efforts to expand our global sourcing capabilities will also support our private brand goals. Since launching our global sourcing effort, we have improved the quality of our private brands through the establishment of standardized product specifications and more rigorous testing protocols. We believe that we have additional opportunity to manage our costs better through the diversification of our supplier network, and we expect to establish a local presence in China during the first half of fiscal 2011.
Over the last several years, we have stabilized our workforce, significantly increased our store-level training and raised our performance expectations. As a result, we have improved both our execution for the customer and our workforce productivity. To help us drive further improvements, we are introducing new technology tools and processes to improve workflow management and leverage our labor hours more effectively.
Store Operations
We operate more than 6,800 stores in 44 states. All of our stores are managed and operated by us. A store manager manages each store and is responsible for hiring and training store employees, managing the financial performance of the store, and providing quality customer service. The store manager reports to a district manager or area operations manager. A district manager or area operations manager is typically responsible for 15 to 25 stores. During fiscal 2010, no single store accounted for more than one-quarter of one percent of sales.
5
Table of Contents
Merchandise
Our stores offer a variety of general merchandise. The following table summarizes the percentage of net sales attributable to each product category over the last three fiscal years:
| Product Category |
2010 | 2009 | 2008 | |||||||||
| Consumables |
65.1 | % | 64.4 | % | 61.0 | % | ||||||
| Home Products |
13.2 | % | 13.4 | % | 14.4 | % | ||||||
| Apparel and Accessories |
10.7 | % | 11.2 | % | 13.1 | % | ||||||
| Seasonal and Electronics |
11.0 | % | 11.0 | % | 11.5 | % | ||||||
The following table describes our product categories in more detail:
| Consumables |
Household chemicals | |||
| Paper products | ||||
| Food, including candy and snacks | ||||
| Health and beauty aids | ||||
| Hardware and automotive supplies | ||||
| Pet food and supplies | ||||
| Home Products |
Domestics, including blankets, sheets and towels | |||
| Housewares | ||||
| Giftware | ||||
| Home décor | ||||
| Apparel and Accessories |
Men’s clothing | |||
| Women’s clothing | ||||
| Boys’ and girls’ clothing | ||||
| Infants’ clothing | ||||
| Shoes | ||||
| Fashion accessories | ||||
| Seasonal and Electronics |
Toys | |||
| Stationery and school supplies | ||||
| Seasonal goods | ||||
| Personal electronics, including pre-paid cellular phones and services | ||||
During fiscal 2010, nationally advertised brand name merchandise accounted for approximately 51% of sales. Merchandise sold under our private brand program, across all merchandise categories, accounted for approximately 22% of sales. Merchandise sold under other brands and labels, or which was unlabeled, accounted for the balance of sales. During fiscal 2010, closeout merchandise accounted for approximately 1% of sales.
We purchase merchandise from a wide variety of suppliers and generally have not experienced difficulty in obtaining adequate quantities of merchandise. In fiscal 2010, no single supplier accounted for more than 9% of the merchandise sold by us. We imported approximately 9% of our merchandise purchases (at cost) during fiscal 2010. While most of our merchandise is shipped to our distribution centers from domestic suppliers, a substantial amount of such merchandise is manufactured outside the United States and imported by the domestic suppliers. Our vendor arrangements provide for payment in U.S. dollars.
We maintain a substantial variety and depth of merchandise inventory in stock in our stores (and in our distribution centers for weekly store replenishment) to attract customers and meet their shopping needs. We negotiate vendors’ trade payment terms to help finance the cost of carrying this inventory. We balance the value of maintaining high inventory levels required to meet customer demand with the potential risk of having inventories at levels that exceed such demand and that may need to be marked down in price in order to sell.
6
Table of Contents
Distribution and Logistics
During fiscal 2010, the manufacturer or distributor shipped approximately 7% of our merchandise purchases directly to stores. The balance of the merchandise was shipped to one of our nine distribution centers listed below. To provide consistent, cost-effective service, we enlist the services of several national transportation companies throughout the U.S. as well as our own private fleet of trucks to deliver merchandise to stores from our distribution centers. During fiscal 2010, approximately 92% of the merchandise sent from our distribution centers to our stores was delivered by common or contract carriers. At the end of fiscal 2010, the number of stores served by each of our distribution centers was as follows:
| Distribution Center |
Number of
Stores Served |
|||
| Matthews, NC |
739 | |||
| West Memphis, AR |
615 | |||
| Front Royal, VA |
817 | |||
| Duncan, OK |
749 | |||
| Morehead, KY |
941 | |||
| Maquoketa, IA |
809 | |||
| Odessa, TX |
774 | |||
| Marianna, FL |
674 | |||
| Rome, NY |
667 | |||
| Total |
6,785 | |||
Technology
We utilize a variety of technological systems to conduct our business, including point-of-sale technology, inventory management tools, supply chain systems, and financial and human resource applications.
During fiscal 2010, we completed the roll-out of new register and point-of-sale technology in our stores. The new technology platform facilitates the acceptance of additional payment types, including credit cards and food stamps, and includes a number of computer-based tools designed to provide our store managers with better training, analytics and workflow management.
We maintain by-item inventories for all stores and employ a demand forecasting system for replenishment of our distribution centers. We also utilize software applications for centralized store replenishment of basic merchandise and for allocation of non-basic merchandise. We have centralized merchandise financial planning, assortment optimization, price optimization, and space management applications and processes. These systems aid us in the planning and forecasting of sales, cost of sales and inventory metrics by product category to position us to achieve our financial goals and to ensure proper allocation and flow of inventory. These systems allow us to optimize merchandise in-stock positions in stores, reduce markdowns and improve inventory turnover.
To minimize transportation costs and maximize our efficiency, we rely on a web-enabled transportation management system to track shipments, to maximize trailer loads and routes, and to secure low rates from our trucking partners. To maximize the productivity of our distribution centers, we utilize voice-recognition software, radio-frequency technology and high-speed sortation systems in each of our nine distribution centers.
To manage our extensive library of store leases, we utilize a lease management system that contains the key terms and conditions abstracted from our active store lease contracts. This electronic repository provides us with better visibility to key property management issues such as property taxes, common area maintenance fees and renewal options.
Our centralized procurement organization utilizes an on-line procurement system for many non-merchandise purchases. This system allows us to centralize these purchases, enabling us to leverage our buying power and control costs.
We utilize an online hiring system designed to provide consistent pre-employment assessments and interviews for prospective team members in all of our stores. To improve our customer service and drive productivity, we also utilize an online training system in our stores.
7
Table of Contents
Competition
Our industry is highly competitive. The principal competitive factors include store locations, convenience, price and quality of merchandise, in-stock consistency, merchandise assortment and presentation, and customer service. We compete for sales and store locations in varying degrees with international, national, regional and local retailing establishments, including discount stores, department stores, variety stores, dollar stores, discount clothing stores, drug stores, grocery stores, convenience stores, outlet stores, warehouse stores and other stores. Many other large U.S. retailers have stores in areas in which we operate. We believe that the relatively small size of our stores permits us to operate new stores in most areas, including rural areas and large urban markets, in locations convenient to our target customer.
Seasonality
Our sales are slightly seasonal. Historically, sales have been highest in the second fiscal quarter (December, January, and February) in connection with the holiday season, representing approximately 27% of total annual sales over the last five fiscal years. Our quarterly results also can be impacted by the timing of certain holidays. We purchase significant amounts of seasonal inventory during the first quarter in anticipation of the holiday season.
Trademarks
We have registered with the U.S. Patent and Trademark Office the names Family Dollar® and Family Dollar Stores® as service marks, and also have registered, or have filed registration applications for, other names and designs as trademarks for certain merchandise sold in our stores, such as Family Gourmet™, Family Pet™, and Kidgets®.
Employees
As of August 28, 2010, we had approximately 30,000 full-time employees and approximately 20,000 part-time employees. None of our employees are covered by collective bargaining agreements. We consider our employee relations generally to be good.
NYSE Certification
In accordance with New York Stock Exchange (the “NYSE”) rules, on February 23, 2010, we filed the annual certification by our Chief Executive Officer that, as of the date of the certification, Family Dollar was in compliance with the NYSE listing standards. For the fiscal year ended August 28, 2010, our Chief Executive Officer and our Chief Financial Officer executed the certifications required by Section 302 of the Sarbanes-Oxley Act of 2002, which are filed as exhibits to this Report.
8
Table of Contents
Executive Officers
The following information is furnished with respect to each of the executive officers of Family Dollar as of October 1, 2010:
| Name |
Position and Office |
Age | ||
| Howard R. Levine |
Chairman of the Board and Chief Executive Officer |
51 | ||
| R. James Kelly |
President and Chief Operating Officer |
63 | ||
| Dorlisa K. Flur |
Executive Vice President-Chief Merchandising Officer |
45 | ||
| Charles S. Gibson, Jr. |
Executive Vice President-Supply Chain |
49 | ||
| Barry Sullivan |
Executive Vice President-Store Operations |
46 | ||
| Kenneth T. Smith |
Senior Vice President-Chief Financial Officer |
48 | ||
| James C. Snyder, Jr. |
Senior Vice President-General Counsel and Secretary |
46 | ||
| C. Martin Sowers |
Senior Vice President-Finance |
52 | ||
| Bryan E. Venberg |
Senior Vice President-Human Resources |
42 | ||
Mr. Howard R. Levine was employed by the Company in various capacities in the Merchandising Department from 1981 to 1987, including employment as Senior Vice President-Merchandising and Advertising. From 1988 to 1992, Mr. Levine was President of Best Price Clothing Stores, Inc., a chain of ladies’ apparel stores. From 1992 to April 1996, he was self-employed as an investment manager. He rejoined the Company in April 1996 and was elected Vice President-General Merchandise Manager: Softlines in April 1996; Senior Vice President-Merchandising and Advertising in September 1996; President and Chief Operating Officer in April 1997; Chief Executive Officer in August 1998; and Chairman of the Board in January 2003. He is the son of Leon Levine, the founder and former Chairman of the Board of the Company.
Mr. R. James Kelly was employed by the Company as Vice Chairman-Chief Financial and Administrative Officer in January 1997 and was promoted to President and Chief Operating Officer in August 2006.
Ms. Dorlisa K. Flur was employed by the Company as Senior Vice President-Strategy and Business Development in June 2004 and was promoted to Executive Vice President-Strategy and Marketing in October 2008 and to Executive Vice President-Chief Merchandising Officer in August 2009.
Mr. Charles S. Gibson, Jr., was employed by the Company as Vice President-Logistics in September 1997 and was promoted to Senior Vice President-Distribution and Logistics in October 1999 and to Executive Vice President-Supply Chain in September 2003.
Mr. Barry Sullivan was employed by the Company as Vice President-Store Operations in September 2002 and was promoted to Senior Vice President-Store Operations in May 2005 and to Executive Vice President-Store Operations in October 2007.
9
Table of Contents
Mr. Kenneth T. Smith was employed by the Company as a Financial Analyst in March 1990. He was promoted to Controller in October 1995, Vice President-Loss Prevention in April 1997, Vice President-IT in January 2001, Vice President-Internal Audit in February 2003, Vice President-Finance in September 2004, and Senior Vice President-Chief Financial Officer in April 2007.
Mr. James C. Snyder, Jr., was employed by the Company as Senior Vice President-General Counsel and Secretary in April 2009. Prior to his employment by the Company, he was employed by The Home Depot, Inc., a chain of home improvement stores, from July 2001 to March 2009, where his last position was Vice President and Associate General Counsel for Legal and Risk Management.
Mr. C. Martin Sowers was employed by the Company as an accountant in October 1984 and was promoted to Assistant Controller in January 1985. He was promoted to Controller in January 1986, Vice President-Controller in July 1989 and Senior Vice President-Finance in December 1991. Mr. Sowers is the Company’s principal accounting officer.
Mr. Bryan E. Venberg was employed by the Company as Senior Vice President-Human Resources in February 2008. Prior to his employment by the Company, he was employed by ShopNBC, a multi-media retailer, from May 2004 to November 2007, where his last position was Senior Vice President-Operations, Customer Service and Human Resources.
All executive officers of the Company are elected annually by, and serve at the pleasure of, the Board of Directors until their successors are duly elected.
The risks described below could materially and adversely affect our business, financial condition and results of operations. We also may be adversely affected by risks not currently known or risks that we do not currently consider to be material to our business.
General economic conditions could impact our business adversely in various respects.
A slowdown in the U.S. economy or other economic conditions affecting disposable consumer income, such as employment levels, inflation, business conditions, fuel and energy costs, consumer debt levels, lack of available credit, interest rates, and tax rates, may affect our business adversely by reducing overall consumer spending or by causing customers to shift their spending to products other than those sold by us or to products sold by us that are less profitable than other product choices, all of which could result in lower net sales, decreases in inventory turnover or a reduction in profitability due to lower margins. The current global economic uncertainty, the impact of recessions, and the potential for failures or realignments of financial institutions and the related impact on available credit may impact our suppliers, our landlords, our customers and our operations in an adverse manner including, but not limited to, our inability to readily access liquid funds or credit, increases in the cost of credit, bankruptcy of our suppliers or landlords, and other impacts, which we are currently unable to fully anticipate.
Our profitability is vulnerable to cost increases, inflation and energy prices.
Future increases in our costs, such as the cost of merchandise, shipping rates, freight and fuel costs, and store occupancy costs, may reduce our profitability. These cost changes may be the result of inflationary pressures that would further reduce our sales or profitability. Increases in other operating costs, including changes in energy prices, wage rates and lease and utility costs, may increase our costs of goods or operating expenses and reduce our profitability. For example, increases in the cost of diesel fuel will likely result in an increase in transportation costs, which will increase our overall operating costs and possibly lower profitability.
10
Table of Contents
Our growth is dependent upon our ability to increase sales in existing stores and the success of our new store-opening program, our store renovation program and other operating and infrastructure initiatives.
Our growth is dependent on both increases in sales in existing stores and our ability to open profitable new stores. Increases in sales in existing stores are dependent on factors such as competition, merchandise selection, store operations and customer satisfaction. If we fail to realize our goals of successfully managing our store operations and increasing our customer retention and recruitment levels, our sales may not increase and our growth may be impacted adversely. Our ability to open profitable new stores depends on many factors, including our ability to identify suitable markets and sites for new stores, negotiate leases and development agreements with acceptable terms, gain name recognition in the new markets and successfully compete against local competition, while managing expenses and costs. Unavailability of attractive store locations, delays in the acquisition or opening of new stores, delays, disruptions or costs associated with remodeling and renovating existing stores, delays or costs resulting from a decrease in commercial development due to capital constraints, difficulties in staffing and operating new store locations, and lack of customer acceptance of stores in new market areas or our renovated store design all may impact our new store growth negatively and the costs or the profitability associated with new, remodeled or renovated stores.
In addition, higher costs or any failure to achieve targeted results associated with the implementation of new programs or initiatives could adversely affect our results of operations. We are undertaking a variety of operating initiatives and infrastructure initiatives related to, among other things, a comprehensive store renovation program, private brand expansion, global sourcing initiatives, and store workflow management. These changes may result in temporary disruptions to our business and negatively impact sales, and the failure to properly execute any of these initiatives or the failure to obtain the anticipated results of such initiatives could have an adverse impact on our future operating results.
We operate in a highly competitive environment and, as a result, we may not be able to compete effectively or maintain or increase our sales, market share or margins, particularly if the prolonged global economic conditions intensify.
We operate in the highly competitive discount retail merchandise sector with numerous competitors, some of which may have greater resources than us. We compete for customers, merchandise, real estate locations and employees. This competitive environment subjects us to various risks, including the ability to continue our store and sales growth and to provide attractive merchandise to our customers at competitive prices that allow us to maintain our profitability. Price reductions by our competitors may result in the reduction of our prices and a corresponding reduction in our profitability. Consolidation in our retail sector, changes in pricing of merchandise, or offerings of other services by competitors could have a negative impact on the relative attractiveness of our stores to consumers. Many of our large box competitors are or may be developing small box formats, and the opening of smaller stores may produce more competition, particularly in urban markets. Our ability to provide convenience in a small box retail format while offering attractive, competitively-priced products could be impacted by various actions of our competitors that are beyond our control. See Item 1 – “Competition” for further discussion of our competitive position.
We depend heavily on technology systems that support all aspects of our operations; the failure of existing or new technology to provide anticipated benefits could affect our results of operations adversely.
Our merchandising, finance, human resources, distribution and logistics and store operations functions depend heavily upon the efficient operation of our technological resources. A failure in our information technology systems or controls could impact our operations negatively. In addition, we continuously upgrade our current technology or install new technology. Our inability to implement in a timely manner such upgrades or installations, to train our employees effectively in the use of our technology, or to obtain the anticipated benefits of our technology could impact our operations or profitability adversely.
If we are unable to secure our customers’ confidential and credit card information, or other private data relating to our employees or the Company, we could be subject to negative publicity, costly government enforcement actions, or private litigation, which could damage our business reputation and adversely affect our profitability.
The protection of our customer, employee, and company data is critical to us. We have procedures and technology in place to safeguard our customers’ debit and credit card information, our employees’ private data, and the Company’s records and intellectual property. However, if we experience a data security breach of any kind, we could be exposed to negative publicity, government enforcement actions, private litigation and costly response measures. In addition, our reputation within the business community and with our customers may be affected, which could result in our customers discontinuing the use of debit or credit cards in our stores, or not shopping in our stores altogether. This could cause us to lose market share to our competitors and have an adverse effect on our financial results.
11
Table of Contents
New accounting guidance or changes in the interpretation or application of existing accounting guidance could affect our financial performance adversely.
New accounting guidance may require systems and other changes that could increase our operating costs and/or change our financial statements. For example, implementing future accounting guidance related to leases, contingencies, and other areas impacted by the current convergence project between the Financial Accounting Standards Board (“FASB”) and the International Accounting Standards Board (“IASB”) could require us to make significant changes to our lease management system or other accounting systems, and could result in changes to our financial statements.
Unanticipated changes in the interpretation or application of existing accounting guidance could result in material charges or restatements of our financial statements, which may further result in litigation or regulatory actions which could have an adverse effect on our financial condition and results of operations.
Changes in state or federal legislation or regulations, including the effects of legislation and regulations on wage levels, employee rights, health care, social welfare and entitlement programs could increase our cost of doing business.
We are exposed to the risk that federal or state legislation, particularly related to our team members, may negatively impact our operations. Changes in federal or state wage requirements, employee rights (including changes in the process for our employees to join a union), health care, social welfare or entitlement programs such as health insurance, paid leave programs, or other changes in workplace regulation or tax rates could adversely impact our ability to achieve our financial targets.
In 2010, Congress enacted comprehensive health care reform legislation which, among other things, includes guaranteed coverage requirements, eliminates pre-existing condition exclusions and annual and lifetime maximum limits, restricts the extent to which policies can be rescinded, and imposes new and significant taxes on health insurers and health care benefits. Due to the breadth and complexity of the health reform legislation, the current lack of implementing regulations and interpretive guidance, and the phased-in nature of the implementation, it is difficult to predict the overall impact of the health reform legislation on our business over the coming years. Possible adverse effects of the health reform legislation include increased costs, exposure to expanded liability and requirements for us to revise ways in which we conduct business.
Product safety concerns and the effects of legislation and regulations on product safety and quality could affect our sales and results of operations adversely.
We are exposed to the risk that federal or state legislation and regulations regarding product quality and safety may negatively impact our operations. Any changes in product safety or quality legislation or regulations may lead to product recalls and the disposal or write-off of merchandise inventories, as well as certain fines or penalties and reputational damage. Our inability to comply on a timely basis with regulatory requirements, or to execute product recalls in a timely manner, could also result in substantial fines or penalties, which could have an adverse effect on our financial results. In addition, negative customer perceptions regarding the safety of the products we sell could cause us to lose market share to our competitors. If this occurs, it may be difficult for us to regain lost sales.
12
Table of Contents
Any disruption in our ability to select, obtain and market merchandise attractive to customers at prices that allow us to profitably sell such merchandise could impact our business negatively.
We generally have been able to select and obtain sufficient quantities of attractive merchandise at prices that allow us to profitably sell such merchandise. If we are unable to continue to select products that are attractive to our customers, to obtain such products at costs that allow us to sell such products at a profit, or to market such products effectively to consumers, our sales or profitability could be affected adversely. In addition, the success of our business depends in part on our ability to identify and respond promptly to evolving trends in demographics and consumer preferences, expectations and needs. Failure to maintain attractive stores and to timely identify or effectively respond to changing consumer needs, preferences and spending patterns could adversely affect our relationship with customers, the demand for our products and our market share.
Any disruption in the supply or increase in pricing of our merchandise could negatively impact our ability to achieve anticipated operating results. A significant amount of our merchandise is manufactured outside the United States, and changes in the prices and flow of these goods for any reason could have an adverse impact on our operations. For example, because a substantial amount of our merchandise is manufactured in China, a change in the Chinese currency or other policies could negatively impact our merchandise costs. The United States and other countries have occasionally proposed and enacted protectionist trade legislation, which may result in changes in tariff structures and trade policies and restrictions that could increase the cost of or reduce the availability of certain merchandise. Any of these or other measures or events relating to suppliers and the countries in which they are located, some or all of which are beyond our control, can negatively impact our operations, increase costs, and lower our margins. Such events or circumstances include, but are not limited to:
| ¡ | political and economic instability; |
| ¡ | the financial instability and labor problems of suppliers; |
| ¡ | the availability of raw materials; |
| ¡ | merchandise quality issues; |
| ¡ | changes in currency exchange rates; and |
| ¡ | transportation availability and cost. |
In addition, we are currently implementing global sourcing programs and vendor and product quality requirements that could negatively impact our ability to find qualified suppliers or their ability to provide merchandise at attractive prices. These and other factors affecting our suppliers and our access to products could affect our financial performance adversely.
Operational difficulties, including those associated with our ability to develop and operate our stores and distribution facilities, could impact our business adversely.
Our stores are decentralized and are managed through a network of geographically dispersed management personnel. Our inability to operate our stores effectively and efficiently, including the ability to control losses resulting from inventory shrinkage, may negatively impact our sales or profitability.
In addition, we rely upon our distribution and logistics network to provide goods to stores in a timely and cost-effective manner. Any disruption, unanticipated expense or operational failure related to this process could impact our store operations negatively. We maintain a network of distribution facilities throughout our geographic territory and build new facilities to support our growth objectives. Delays in opening distribution facilities or stores could adversely affect our future operations by slowing the unit growth, which may in turn reduce revenue growth. Adverse changes in the cost of operating distribution facilities and stores, such as changes in labor, utility and other operating costs, could have an adverse impact on our financial performance. Adverse changes in our inventory shrinkage at the store level or in distribution facilities could also impact our results negatively.
We rely on third-party shippers and carriers whose operations are outside our control, and any failure by them to deliver products in a timely manner may damage our reputation and could cause us to lose customers.
We rely on arrangements with third-party shippers and carriers such as independent shipping companies for timely delivery of products to stores and distribution operations throughout the country. As a result, we are subject to carrier disruptions and increased costs due to factors that are beyond our control, including labor strikes, inclement weather and increased fuel costs. If the services of any of these third parties become unsatisfactory, we may experience delays in meeting our customers’ product demands and we may not be able to find a suitable replacement on a timely basis or on commercially reasonable terms. Any failure to deliver products in a timely manner may damage our reputation and could cause us to lose customers.
13
Table of Contents
Adverse impacts associated with legal proceedings and claims could affect our business negatively.
We are involved in a number of legal proceedings which include employment, tort, real estate, commercial and other litigation. Certain of these lawsuits, if decided adversely to us or settled by us, may result in liability material to our results of operations, financial condition and liquidity. The number of employment-related class actions filed each year has continued to increase, and recent changes and proposed changes in federal and state laws may cause claims to rise even more. We are currently a defendant in numerous employment cases containing class-action allegations in which the plaintiffs have alleged violations of federal and state wage and hour laws. We are also a defendant in Scott, et al. v. Family Dollar Stores, Inc., a class action in which the plaintiffs have alleged that the Company engaged in a pattern and practice of discriminating against female store managers. The cost to defend these class-action lawsuits may be significant. Plaintiffs in these types of cases may seek recovery of very large or indeterminate amounts, and the magnitude of the potential loss relating to these lawsuits may remain unknown for substantial periods of time. In addition, certain of these lawsuits, if decided adversely to us or settled by us, may result in liability material to our financial statements as a whole or may negatively affect our operating results if changes to our business operation are required. There also may be adverse publicity associated with litigation that could negatively affect customer perception of our business, regardless of whether the allegations are valid or whether we are ultimately found liable. As a result, litigation may adversely affect our business, financial condition and results of operations. See Note 10 to the Consolidated Financial Statements included in this Report for further details regarding certain of these pending matters.
Inability to attract and retain employees could affect our business.
Our growth could be adversely impacted by our inability to attract and retain employees at the store operations level, in distribution facilities, and at the corporate level, including our senior management team, at costs which allow us to profitably conduct our operations. For example, we believe that the retention of managers at the store level is one factor in reducing inventory shrinkage resulting from employee theft. Various other factors, such as overall labor availability, wage rates, union organizing activity, regulatory or legislative impacts and various benefit costs could all impact our ability to attract and retain employees negatively and may affect our results of operations adversely.
Our business is slightly seasonal, and adverse events during the holiday season could impact our operating results negatively.
Our business is slightly seasonal, with the highest percentage of sales (approximately 27% of total annual sales over the last five fiscal years) occurring during the second fiscal quarter (December, January, and February). We purchase significant amounts of seasonal inventory in anticipation of the holiday season. Adverse events, such as deteriorating economic conditions, higher unemployment, higher gas prices, public transportation disruptions, or unusual weather could result in lower-than-planned sales during the holiday season. This could lead to lower sales or to unanticipated markdowns, impacting our financial condition and results of operations negatively.
We are exposed to the risk of natural disasters, unusual weather, pandemic outbreaks, war and terrorism that could disrupt business and result in lower sales, increased operating costs and capital expenditures.
Our headquarters, store locations and distribution centers, as well as certain of our vendors and customers, are located in areas which could be subject to natural disasters such as floods, hurricanes, tornadoes or earthquakes. Adverse weather conditions or other extreme changes in the weather, including resulting electrical and technological failures, may disrupt our business and may adversely affect our ability to sell and distribute products. In addition, we operate in markets that may be susceptible to pandemic outbreaks, war or terrorism. Our business may be harmed if our ability to sell and distribute products is impacted by any such events, any of which could influence customer trends and purchases and may negatively impact our net sales, properties or operations. Such events could result in physical damage to one or more of our properties, the temporary closure of some or all of our stores or distribution centers, the temporary lack of an adequate work force in a market, temporary or long-term disruption in the transport of goods, delay in the delivery of goods to our distribution centers or stores, disruption of our technology support or information systems, or fuel shortages or dramatic increases in fuel prices, which increase the cost of doing business. Any of these factors, or combination thereof, could affect our operations adversely.
Failure to comply with our debt covenants could affect our capital resources, financial condition and liquidity adversely.
Our debt agreements contain certain restrictive covenants, which impose various operating and financial restrictions on us. Such restrictions include, but are not limited to, a consolidated debt to consolidated capitalization ratio, a fixed charge coverage ratio, and a priority debt ratio. Our failure to comply with the restrictive covenants in our debt agreements, as a result of one or more of the factors listed in this section, could result in an event of default, which, if not cured or waived, could result in us having to repay our borrowings before their due dates. If we are forced to refinance these borrowings on less favorable terms, our results of operations or financial condition could be harmed. In addition, if we are in default under any of our existing or future debt facilities, we will be unable to borrow additional amounts under those facilities to the extent that they would otherwise be available. Our ability to obtain future financing may also be impacted negatively.
14
Table of Contents
Our ability to obtain additional financing on favorable terms, if needed, could be adversely affected by volatility in the capital markets.
We obtain and manage liquidity from the positive cash flow we generate from our operating activities and our access to capital markets, including our credit facilities with a consortium of banks. There is no assurance that our ability to obtain additional financing through the capital markets, if needed, will not be adversely impacted by economic conditions. Tightening in the credit markets, low liquidity and volatility in the capital markets could result in diminished availability of credit, higher cost of borrowing and lack of confidence in the equity market, making it more difficult to obtain additional financing on terms that are favorable to us.
Funds associated with auction rate securities may not be liquid or readily available.
Our portfolio of investment securities currently consists of auction rate securities ($154.2 million at fair value as of August 28, 2010), which are not currently liquid or readily available to convert to cash. We do not believe that the current liquidity issues related to our auction rate securities will impact our ability to fund our ongoing business operations, but if the global credit crisis persists or intensifies, it is possible that we will be required to write down the fair value of our auction rate securities further. If we determine that the decline in the fair value of our auction rate securities is other than temporary, it would result in an impairment charge being recognized in our Consolidated Statements of Income, and this charge could be material and could adversely affect our financial results for the periods in which the charges occur. See Note 2 to the Consolidated Financial Statements included in this Report for more information on our auction rate securities.
ITEM 1B. UNRESOLVED STAFF COMMENTS
None.
We operate a chain of self-service retail discount stores. As of October 1, 2010, there were 6,817 stores in 44 states and the District of Columbia as follows:
| Texas |
862 | Arkansas |
100 | |||||||
| Ohio |
424 | New Mexico |
100 | |||||||
| Florida |
419 | Missouri |
95 | |||||||
| North Carolina |
376 | Maryland |
92 | |||||||
| Michigan |
365 | New Jersey |
85 | |||||||
| Georgia |
321 | Minnesota |
69 | |||||||
| New York |
290 | Utah |
61 | |||||||
| Pennsylvania |
275 | Maine |
51 | |||||||
| Louisiana |
242 | Connecticut |
50 | |||||||
| Illinois |
227 | Kansas |
33 | |||||||
| Virginia |
218 | Idaho |
32 | |||||||
| South Carolina |
206 | Iowa |
32 | |||||||
| Tennessee |
206 | Nebraska |
32 | |||||||
| Indiana |
200 | Nevada |
27 | |||||||
| Kentucky |
189 | New Hampshire |
26 | |||||||
| Alabama |
146 | South Dakota |
25 | |||||||
| Arizona |
138 | Rhode Island |
24 | |||||||
| Wisconsin |
131 | Delaware |
22 | |||||||
| Oklahoma |
129 | Wyoming |
21 | |||||||
| Mississippi |
120 | North Dakota |
13 | |||||||
| West Virginia |
117 | Vermont |
11 | |||||||
| Colorado |
109 | District of Columbia |
3 | |||||||
| Massachusetts |
103 |
As of October 1, 2010, we had, in the aggregate, approximately 57.9 million square feet of total store space (including receiving rooms and other non-selling areas) and approximately 48.3 million square feet of selling space.
15
Table of Contents
The number of stores we operated at the end of each of our last five fiscal years was:
| Fiscal Year |
Number of Stores at Year End | |||
| 2006 |
6,173 | |||
| 2007 |
6,430 | |||
| 2008 |
6,571 | |||
| 2009 |
6,655 | |||
| 2010 |
6,785 | |||
During fiscal 2010, we opened 200 stores, closed 70 stores, relocated 13 stores, expanded 15 stores, and renovated 89 stores. In addition, during fiscal 2010, we continued to re-align the space in our stores to accommodate strong customer demand for consumable merchandise and to improve the in-store shopping experience. These efforts included re-aligning the space in our stores to support an expanded assortment of key traffic-driving categories, improving merchandise adjacencies and enhancing merchandise presentations. Since we began these efforts in fiscal 2009, approximately 65% of our stores have completed the layout changes. We occupy most of our stores under operating leases. Store opening, closing, relocation, and renovation plans, as well as overall capital expenditure plans, are continually reviewed and may change. From August 29, 2010, through October 1, 2010, we opened 33 new stores, closed 2 stores, relocated 1 store, expanded 2 stores, and renovated 100 stores.
Our stores are located in urban, suburban, small town and rural markets, and they are typically freestanding or located in shopping centers. At the end of fiscal 2010, approximately 22% of our stores were located in large urban markets (markets with populations above 200,000), and approximately 20% of our stores were located in small urban markets or suburban areas (markets with populations greater than 25,000 but less than 200,000). During fiscal 2010, approximately 33% of our new store locations were opened in large urban markets, and 18% of our new locations were opened in small urban or suburban markets.
All of our stores are leased except for 509 stores that we own. Most of our leases have an initial term of five or ten years and provide for fixed rentals, and most of our leases require additional payments based upon a percentage of sales, property taxes, insurance premiums, or common area maintenance charges.
Of our 6,308 leased stores at October 1, 2010, all but 526 leases grant us options to renew for additional terms, in most cases for a number of successive five-year periods. The following table sets forth certain data concerning the expiration dates of all leases with renewal options as of October 1, 2010:
| Fiscal Years |
Approximate Number of Leases Expiring Assuming No Exercise of Renewal Options |
Approximate Number of Leases Expiring Assuming Full Exercise of Renewal Options |
||||||
| 2011 |
970 | 51 | ||||||
| 2012-2014 |
3,175 | 256 | ||||||
| 2015-2017 |
1,721 | 368 | ||||||
| 2018-2020 |
414 | 523 | ||||||
| 2021 and thereafter |
28 | 5,110 | ||||||
We own our corporate headquarters and a distribution center located on a 108-acre tract of land in Matthews, North Carolina, just outside of Charlotte, in two buildings containing approximately 1.24 million square feet. We use approximately 930,000 square feet for the distribution center, which includes receiving, warehousing, shipping and storage facilities, and we use approximately 310,000 square feet for the corporate headquarters.
We also own eight additional full-service distribution centers, described in the table below:
| Facility Size | ||||||||||||
| Distribution Center |
Land | Building | Date Operational | |||||||||
| West Memphis, AR |
75 acres | 850,000 sq. ft. | April 1994 | |||||||||
| Front Royal, VA |
108 acres | 907,000 sq. ft. | January 1998 | |||||||||
| Duncan, OK |
85 acres | 907,000 sq. ft. | July 1999 | |||||||||
| Morehead, KY |
94 acres | 907,000 sq. ft. | June 2000 | |||||||||
| Maquoketa, IA |
74 acres | 907,000 sq. ft. | March 2002 | |||||||||
| Odessa, TX |
89 acres | 907,000 sq. ft. | July 2003 | |||||||||
| Marianna, FL |
76 acres | 907,000 sq. ft. | January 2005 | |||||||||
| Rome, NY |
87 acres | 907,000 sq. ft. | April 2006 | |||||||||
16
Table of Contents
Information for this item is included in Note 10 to the Consolidated Financial Statements included in this Report, and incorporated herein by reference.
17
Table of Contents
PART II
ITEM 5. MARKET FOR REGISTRANT’S COMMON EQUITY, RELATED STOCKHOLDER MATTERS AND ISSUER PURCHASES OF EQUITY SECURITIES
Our common stock is traded on the New York Stock Exchange under the ticker symbol FDO. At October 1, 2010, there were approximately 2,740 holders of record of our common stock. The accompanying tables give the high and low sales prices of our common stock and the dividends declared per share for each quarter of fiscal 2010 and fiscal 2009. We expect that dividends will continue to be declared quarterly for the foreseeable future.
Market Prices and Dividends
| 2010 |
High | Low | Dividend | |||||||||
| First Quarter |
$ | 31.63 | $ | 25.52 | $ | .13 1/2 | ||||||
| Second Quarter |
33.57 | 27.15 | .15 1/2 | |||||||||
| Third Quarter |
42.07 | 32.30 | .15 1/2 | |||||||||
| Fourth Quarter |
44.03 | 35.31 | .15 1/2 | |||||||||
| 2009 |
High | Low | Dividend | |||||||||
| First Quarter |
$ | 32.50 | $ | 19.70 | $ | .12 1/2 | ||||||
| Second Quarter |
29.47 | 21.79 | .13 1/2 | |||||||||
| Third Quarter |
35.00 | 26.06 | .13 1/2 | |||||||||
| Fourth Quarter |
32.97 | 27.50 | .13 1/2 | |||||||||
Issuer Purchases of Equity Securities
The following table sets forth information with respect to purchases of shares of our common stock made during the quarter ended August 28, 2010, by us, on our behalf or by any “affiliated purchaser” as defined by Rule 10b-18(a)(3) of the Exchange Act.
| Period |
Total Number of Shares Purchased |
Average Price Paid per Share |
Total Number of Shares Purchased as Part of Publicly Announced Plans or Programs(1) |
Maximum Number of Shares that May Yet Be Purchased Under the Plans or Programs(1)(2) |
||||||||||||
| June (5/30/10 - 7/3/10) |
524,100 | $ | 38.84 | 524,100 | 4,927,181 | |||||||||||
| July (7/4/10 - 7/31/10) |
775,331 | 38.24 | 775,331 | 4,601,880 | ||||||||||||
| August (8/1/10 - 8/28/10) |
1,435,136 | 42.16 | 1,435,136 | 2,994,418 | ||||||||||||
| Total |
2,734,567 | $ | 40.41 | 2,734,567 | 2,994,418 | |||||||||||
| (1) | On November 18, 2009, we announced that the Board of Directors authorized the purchase of up to $400 million of our outstanding common stock from time to time as market conditions warrant. As of August 28, 2010, there was $129.8 million remaining under this authorization. |
| (2) | Remaining dollar amounts are converted to shares using the closing stock price as of the end of the fiscal month. |
The stock repurchases in the table above include both open market purchases and purchases made in connection with structured repurchase agreements. See Note 12 to the Consolidated Financial Statements included in this Report for more information.
On September 29, 2010, subsequent to the end of fiscal 2010, we announced that the Board of Directors authorized the purchase of up to $750 million of our outstanding common stock. The remaining amount under the previous authorization was cancelled. On October 5, 2010, we entered into an accelerated share repurchase agreement with a large financial institution for $250.0 million. See Note 12 to the Consolidated Financial Statements included in this Report for more information.
Equity Compensation Plan Information
This information will be included in our proxy statement to be filed for the Annual Meeting of Stockholders to be held in January 2011, under the caption “Equity Compensation Plan Information” and is incorporated herein by reference.
18
Table of Contents
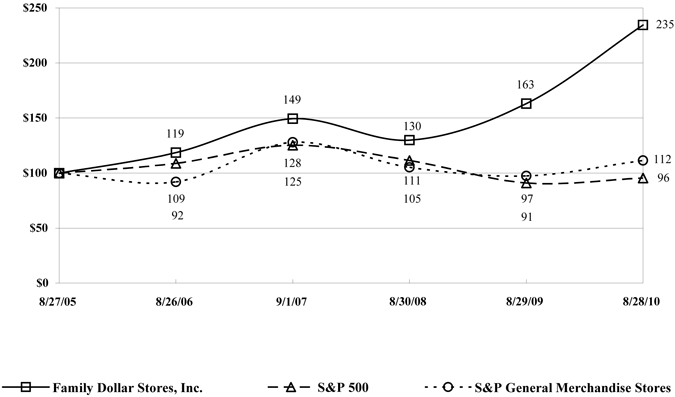
Stock Performance Graph
The following graph sets forth the yearly percentage change in the cumulative total shareholder return on our common stock during the five fiscal years ended August 28, 2010, compared with the cumulative total returns of the S&P 500 Index and the S&P General Merchandise Stores Index. The comparison assumes that $100 was invested in Family Dollar common stock on August 27, 2005, and in each of the foregoing indices on August 31, 2005, and that dividends were reinvested.
COMPARISON OF 5 YEAR CUMULATIVE TOTAL RETURN
Among Family Dollar Stores, Inc., the S&P 500 Index
and the S&P General Merchandise Stores Index
19
Table of Contents
ITEM 6. SELECTED FINANCIAL DATA
Summary of Selected Financial Data
| Years Ended | ||||||||||||||||||||
| (in thousands, except per share amounts and store data) |
August 28, 2010 |
August 29, 2009 |
August 30, 2008 |
September 1, 2007 |
August 26, 2006(2) |
|||||||||||||||
| Net sales |
$ | 7,866,971 | $ | 7,400,606 | $ | 6,983,628 | $ | 6,834,305 | $ | 6,394,772 | ||||||||||
| Cost of sales and operating expenses |
$ | 7,291,373 | $ | 6,943,337 | $ | 6,618,322 | $ | 6,445,672 | $ | 6,077,467 | ||||||||||
| Income before income taxes |
$ | 563,858 | $ | 450,925 | $ | 361,762 | $ | 381,896 | $ | 311,144 | ||||||||||
| Income taxes |
$ | 205,723 | $ | 159,659 | $ | 128,689 | $ | 139,042 | $ | 116,033 | ||||||||||
| Net income |
$ | 358,135 | $ | 291,266 | $ | 233,073 | $ | 242,854 | $ | 195,111 | ||||||||||
| Diluted net income per common share |
$ | 2.62 | $ | 2.07 | $ | 1.66 | $ | 1.62 | $ | 1.26 | ||||||||||
| Dividends declared |
$ | 80,394 | $ | 74,012 | $ | 68,537 | $ | 66,361 | $ | 62,757 | ||||||||||
| Dividends declared per common share |
$ | 0.60 | $ | 0.53 | $ | 0.49 | $ | 0.45 | $ | 0.41 | ||||||||||
| Total assets(1) |
$ | 2,982,057 | $ | 2,877,802 | $ | 2,703,846 | $ | 2,657,979 | $ | 2,508,963 | ||||||||||
| Working capital(1) |
$ | 605,721 | $ | 686,723 | $ | 421,397 | $ | 558,140 | $ | 523,086 | ||||||||||
| Long-term investment securities |
$ | 147,108 | $ | 163,545 | $ | 222,104 | $ | — | $ | — | ||||||||||
| Long-term debt |
$ | 250,000 | $ | 250,000 | $ | 250,000 | $ | 250,000 | $ | 250,000 | ||||||||||
| Shareholders’ equity |
$ | 1,421,554 | $ | 1,440,060 | $ | 1,254,083 | $ | 1,174,641 | $ | 1,208,393 | ||||||||||
| Stores opened |
200 | 180 | 205 | 300 | 350 | |||||||||||||||
| Stores closed |
70 | 96 | 64 | 43 | 75 | |||||||||||||||
| Number of stores – end of year |
6,785 | 6,655 | 6,571 | 6,430 | 6,173 | |||||||||||||||
| (1) | The prior year amounts have been adjusted to conform to the current year presentation. See Note 1 to the Consolidated Financial Statements included in this Report for more information on the adjustments. |
| (2) | Our results for fiscal 2006 include a $45.0 million (a net impact of approximately $0.18 per diluted share) litigation charge associated with an adverse litigation judgment and cumulative charges of $10.5 million (a net impact of approximately $0.04 per diluted share) to record non-cash stock-based compensation and income tax related interest expense. |
20
Table of Contents
ITEM 7. MANAGEMENT’S DISCUSSION AND ANALYSIS OF FINANCIAL CONDITION AND RESULTS OF OPERATIONS
The following discussion summarizes the significant factors affecting our consolidated results of operations and financial condition for fiscal 2010, fiscal 2009 and fiscal 2008 and our expectations for fiscal 2011. You should read this discussion in conjunction with our Consolidated Financial Statements and the Notes to Consolidated Financial Statements, which are included in this Report. Our discussion contains forward-looking statements which are based upon our current expectations and which involve risks and uncertainties. Actual results and the timing of events could differ materially from those anticipated in these forward-looking statements as a result of a number of factors, including those set forth in the “Cautionary Statement Regarding Forward-Looking Statements” in the General Information section of this Report and the “Risk Factors” listed in Part I – Item 1A of this Report.
Our fiscal year generally ends on the Saturday closest to August 31 of each year, which generally results in an extra week every six years. Fiscal 2010, fiscal 2009 and fiscal 2008 were 52-week years.
Executive Overview
We operate a chain of more than 6,800 general merchandise retail discount stores in 44 states, providing primarily low- and middle-income consumers with a selection of competitively priced merchandise in convenient neighborhood stores. Our merchandise assortment includes Consumables, Home Products, Apparel and Accessories, and Seasonal and Electronics. We sell merchandise at prices that generally range from less than $1 to $10.
During fiscal 2010 as compared with fiscal 2009, our net sales increased 6.3% to $7.9 billion, our net income increased 23.0% to $358.1 million, and our diluted net income per common share increased 26.6% to $2.62. Comparable store sales (stores open more than 13 months) for fiscal 2010 increased 4.8% compared with fiscal 2009. Our strong performance during fiscal 2010 was due primarily to our strong sales performance and improvements in cost of sales and selling, general and administrative (“SG&A”) expenses, both as a percentage of net sales.
Over the past several years, we made investments to improve processes, build merchandising capabilities and improve the productivity of our workforce. As a result of these investments, we are now building more compelling merchandise assortments, managing inventories more effectively and executing at the store level more consistently. These investments have also allowed us to shift our focus to driving stronger revenue growth.
While general economic conditions may be stabilizing, we believe pressures on low- and lower-middle-income customers continue to be significant. We believe our strategy of providing both value and convenience positions us well to increase our market share. During fiscal 2010, customer traffic continued to be the primary driver of our comparable store sales increase, while the dollar value of the average transaction was approximately flat. Basic consumable needs continue to be the primary driver of recurring shopping trips, but we are also seeing improvement in certain discretionary categories. For example, during fiscal 2010, we experienced strong sales in the Seasonal and Electronics category as a result of our increased focus on value, combined with appealing in-store presentations and customer communications. Sales in the Home Products and the Apparel and Accessories categories showed improvement over the prior year. The various components affecting our results for fiscal 2010 are discussed in more detail below.
During fiscal 2010, we focused on four key priorities: increase relevancy to the customer; drive increased profitability; manage risk; and build great employee teams. The following are some of the highlights from these efforts.
| ¡ | We completed the roll-out of new register and point-of-sale technology in all our stores. The new technology platform facilitates the acceptance of additional payment types, including credit cards and food stamps, and includes a number of computer-based tools designed to provide our store managers with better training, analytics and workflow management. |
| ¡ | We expanded our operating hours in substantially all of our stores to increase the convenience of the shopping experience. In addition, to reinforce our value proposition and increase awareness of and loyalty to the Family Dollar brand, we worked to better integrate all of our customer communications. We increased the frequency of our communications to customers, and we improved our in-store communications to reinforce our values and brand offering. |
| ¡ | We continued our space re-alignment efforts to accommodate strong customer demand for consumable merchandise and improve the in-store shopping experience. These efforts included re-aligning the space in our stores to support an expanded assortment of key traffic-driving categories, improving merchandise adjacencies and enhancing merchandise presentations. Since we began these efforts in fiscal 2009, approximately 65% of our stores have completed the layout changes. |
21
Table of Contents
| ¡ | Through our price management work, the continued development of our private brand offering, and our global sourcing efforts, we improved our purchase mark-ups and offset the impact of the shift in the merchandise mix to more lower-margin consumable merchandise. |
| ¡ | We continued to focus on inventory productivity, and we lowered our inventory levels in more discretionary merchandise categories. While our total inventories increased at the end of fiscal 2010, due primarily to the expansion of our assortment of consumable merchandise and to support higher sales growth, our inventory levels remain well controlled. Lower levels of discretionary merchandise have reduced our exposure to seasonal markdowns, and we believe our focus on inventory productivity has contributed to lower inventory shrinkage and a reduction in workers’ compensation and general liability claims. |
| ¡ | We made great progress in our efforts to be a more compelling place to work. We strengthened our pay-for-performance culture and expanded our training and development programs. As a result, we drove continued improvement in our employee retention and internal promotion metrics, delivering more consistent execution for customers, increasing productivity and reducing costs. |
Fiscal 2011 Outlook
Building on the improvements we have made over the past several years, we plan to continue to strengthen our value and convenience proposition in fiscal 2011. In addition, we plan to re-accelerate our new store growth while also launching a comprehensive store renovation program.
Our new store performance has improved significantly in the last several years as a result of the utilization of stronger site selection tools as well as enhancements driven by our strategic initiatives. Our operational improvements, combined with softening real estate markets and a growing customer base, have resulted in additional opportunities for new store growth. During fiscal 2011, we plan to open approximately 300 new stores, a 50% increase over fiscal 2010 openings. We also expect to continue building the pipeline for further acceleration of our new store growth over the next two to three years.
Leveraging our concept renewal efforts, enhanced merchandising and supply chain capabilities, a refreshed store technology platform, and a better trained and more productive workforce, we are initiating a comprehensive renovation program intended to re-energize the Family Dollar brand. During fiscal 2011, we plan to renovate 600 to 800 stores at a projected cost of $100,000 to $130,000 per store. The renovations will address both the interior and exterior of the stores and will create more customer-focused assortments and layouts, rejuvenated physical stores and more customer-centric teams.
While we are making significant investments to drive revenue growth, we also continue to pursue opportunities to further enhance our profitability and financial returns. Key areas of focus will include the continued expansion of our private brand programs and the continued development of our global sourcing capabilities, as well as our ongoing efforts to improve operational productivity. See Part I – Item 1 – “Business” for more information on our current strategic initiatives.
During fiscal 2011, we expect net sales to grow due to the acceleration of our new store growth and an increase in comparable stores sales. We expect comparable store sales to increase as a result of our current strategic initiatives, including our store renovation program and private brand programs, as well as continued benefits from expanded operating hours and other operational improvements over the past several years. We expect sales will continue to be strongest in the Consumables category, as customers continue to constrain their discretionary spending. We expect cost of sales, as a percentage of net sales, to be approximately flat, as expected benefits from lower markdowns, the expansion of our private brand program, improvements in price optimization, and lower inventory shrinkage are expected to be offset by the investments we are making to improve quality and protect our price perception, combined with continued pressure from transportation expense. We expect SG&A expenses, as a percentage of net sales, to decrease as a result of our comparable store sales growth and continued productivity improvements, which we expect will offset pressure from expanded operating hours, the acceleration of our new store growth and our renovation program.
22
Table of Contents
Results of Operations
Our results of operations for fiscal 2010, fiscal 2009 and fiscal 2008 are highlighted in the table below and discussed in the following paragraphs:
| Years Ended | ||||||||||||
| (in thousands) |
August 28, 2010 | August 29, 2009 | August 30, 2008 | |||||||||
| Net sales |
$ | 7,866,971 | $ | 7,400,606 | $ | 6,983,628 | ||||||
| Cost and expenses: |
||||||||||||
| Cost of sales |
5,058,971 | 4,822,401 | 4,637,826 | |||||||||
| % of net sales |
64.3 | % | 65.2 | % | 66.4 | % | ||||||
| Selling, general and administrative |
2,232,402 | 2,120,936 | 1,980,496 | |||||||||
| % of net sales |
28.4 | % | 28.7 | % | 28.4 | % | ||||||
| Cost of sales and operating expenses |
7,291,373 | 6,943,337 | 6,618,322 | |||||||||
| % of net sales |
92.7 | % | 93.8 | % | 94.8 | % | ||||||
| Operating profit |
575,598 | 457,269 | 365,306 | |||||||||
| % of net sales |
7.3 | % | 6.2 | % | 5.2 | % | ||||||
| Interest income |
1,597 | 6,595 | 11,042 | |||||||||
| % of net sales |
0.0 | % | 0.1 | % | 0.2 | % | ||||||
| Interest expense |
13,337 | 12,939 | 14,586 | |||||||||
| % of net sales |
0.2 | % | 0.2 | % | 0.2 | % | ||||||
| Income before income taxes |
563,858 | 450,925 | 361,762 | |||||||||
| % of net sales |
7.2 | % | 6.1 | % | 5.2 | % | ||||||
| Income taxes |
205,723 | 159,659 | 128,689 | |||||||||
| % of net sales |
2.6 | % | 2.2 | % | 1.8 | % | ||||||
| Net Income |
$ | 358,135 | $ | 291,266 | $ | 233,073 | ||||||
| % of net sales |
4.6 | % | 3.9 | % | 3.3 | % | ||||||
Net Sales
Net sales increased 6.3% in fiscal 2010 compared to fiscal 2009 and 6.0% in fiscal 2009 compared to fiscal 2008. The net sales increases in fiscal 2010 and fiscal 2009 reflect increases in comparable store sales of 4.8% and 4.0%, respectively, with the balance of the increases due primarily to sales from new stores opened as part of our store growth program. Comparable store sales includes stores that have been open more than 13 months. Stores that have been renovated, relocated or expanded are included in the comparable store sales calculation to the extent that they had sales during comparable weeks in each year. The method of calculating comparable store sales varies across the retail industry. As a result, our comparable store sales calculation may not be comparable to similarly titled measures reported by other companies.
The 4.8% increase in comparable store sales in fiscal 2010 resulted primarily from an increase in customer traffic, as measured by the number of register transactions in comparable stores. During fiscal 2010, the customer count increased approximately 4.3% and the average customer transaction increased approximately 0.5% to $9.91 compared to fiscal 2009. Sales during fiscal 2010, on a comparable store basis, were strongest in the Consumables and the Seasonal and Electronics categories.
The 4.0% increase in comparable store sales in fiscal 2009 resulted from an increase in customer traffic, as measured by the number of register transactions in comparable stores and an increase in the dollar value of the average customer transaction. During fiscal 2009, the customer count increased approximately 2.8% and the average customer transaction increased approximately 1.2% to $9.84 compared to fiscal 2008. Sales during fiscal 2009, on a comparable store basis, were strongest in the Consumables category. Sales in more discretionary categories were soft.
During fiscal 2010, we opened 200 stores and closed 70 stores for a net addition of 130 stores, compared with the opening of 180 stores and closing of 96 stores for a net addition of 84 stores during fiscal 2009, and the opening of 205 stores and closing of 64 stores for a net addition of 141 stores during fiscal 2008.
23
Table of Contents
Cost of Sales
Cost of sales increased 4.9% in fiscal 2010 compared to fiscal 2009 and 4.0% in fiscal 2009 compared to fiscal 2008. These increases were due primarily to additional sales volume. Cost of sales, as a percentage of net sales, was 64.3% in fiscal 2010, 65.2% in fiscal 2009 and 66.4% in fiscal 2008. The decrease in cost of sales, as a percentage of net sales, during fiscal 2010 as compared to fiscal 2009, was due primarily to lower inventory shrinkage, higher purchase mark-ups, lower freight expense, and lower markdown expense, which more than offset increased sales of lower-margin consumable merchandise. We believe that inventory shrinkage benefited from higher store manager retention, lower levels of discretionary merchandise and improved analytics and monitoring processes. We continue to focus on improving our purchase mark-ups through our price management work, the continued development of our private brand offering, and our global sourcing efforts. Freight expense benefited from improvements in inventory productivity, the impact of lower diesel costs on the first half of fiscal 2010, and increased transportation productivity and efficiency. Markdown expense benefited from strong sales of seasonal merchandise, our continued focus on improving inventory productivity and managing inventory risk, and the absence of any markdown expense during fiscal 2010 for products containing lead/phthalates. We incurred approximately $6.8 million of lead/phthalate markdown expense during fiscal 2009 in connection with new product safety legislation.
The decrease in cost of sales, as a percentage of net sales, during fiscal 2009 as compared to fiscal 2008, was due primarily to lower freight expense, lower inventory shrinkage, and lower seasonal markdowns. In addition, higher purchase mark-ups more than offset the effect of stronger sales of lower-margin consumable merchandise.
Selling, General and Administrative Expenses
SG&A expenses increased 5.3% in fiscal 2010 compared to fiscal 2009 and 7.1% in fiscal 2009 compared to fiscal 2008. The increases in these expenses were due in part to additional sales volume and additional costs arising from the continued growth in the number of stores in operation. SG&A expenses, as a percentage of net sales, were 28.4% in fiscal 2010, 28.7% in fiscal 2009 and 28.4% in fiscal 2008. Most costs in fiscal 2010, including occupancy costs, were leveraged as a result of a 4.8% increase in comparable store sales and continued productivity improvements. As a percentage of net sales, decreases in insurance expense (approximately 0.2% of net sales) and utility expense (approximately 0.2% of net sales) more than offset an increase in store payroll expense (approximately 0.3% of net sales). Insurance expense continues to benefit from favorable trends in workers’ compensation and general liability costs, and our energy management efforts contributed to the decrease in utility expense. The increase in store payroll expense was due primarily to the expansion of our store operating hours.
The increase in SG&A expenses, as a percentage of net sales, in fiscal 2009 as compared to fiscal 2008, was due primarily to higher incentive compensation and higher insurance expense. Most other costs decreased as a percentage of net sales, including payroll costs and occupancy costs, as a result of a 4.0% increase in comparable store sales and our continued focus on expense control.
Interest Income
Interest income decreased $5.0 million in fiscal 2010 compared to fiscal 2009 and $4.4 million in fiscal 2009 compared to fiscal 2008. The decreases in both years were due to lower interest rates.
Interest Expense
Interest expense increased $0.4 million in fiscal 2010 compared to fiscal 2009 and decreased $1.6 million in fiscal 2009 compared to fiscal 2008. The increase in fiscal 2010 was due to lower capitalized interest. We did not borrow under our credit facilities during fiscal 2010 or fiscal 2009. During fiscal 2008, we incurred $1.7 million in interest expense related to credit facility borrowings.
Income Taxes
The effective tax rate was 36.5% for fiscal 2010, 35.4% in fiscal 2009 and 35.6% in fiscal 2008. The increase in the effective tax rate in fiscal 2010 as compared to fiscal 2009 was due primarily to a decrease in federal jobs tax credits, changes in state income taxes, and lower tax-exempt interest income, offset partially by a decrease in our liabilities for uncertain tax positions. The decrease in the effective rate in fiscal 2009 compared to fiscal 2008 was due primarily to an increase in certain federal jobs tax credits and changes in state income tax, offset partially by changes in our liabilities for uncertain tax positions and a decrease in tax-exempt interest income.
24
Table of Contents
Liquidity and Capital Resources
General
We have consistently maintained a strong liquidity position. Cash provided by operating activities during fiscal 2010 was $591.5 million compared to $529.2 million in fiscal 2009 and $515.7 million in fiscal 2008. Our operating cash flows are generally sufficient to fund our regular operating needs, capital expenditure program, cash dividend payments, interest payments, and share repurchases. We believe operating cash flows and existing credit facilities will provide sufficient liquidity for our ongoing operations and growth initiatives. We plan to fund future share repurchases through a combination of cash on hand, cash from operations, and potential debt financings.
Credit Facilities
On December 16, 2009, we entered into an unsecured revolving credit facility with a syndicate of lenders for short-term borrowings of up to $250 million. The credit facility has an initial term of 364 days and provides for two one-year extensions that require lender consent. Any borrowings under the credit facility accrue interest at a variable rate based on short-term market interest rates. The credit facility replaced our previous $250 million 364-day credit facility.
We also maintain a $350 million unsecured revolving credit facility that matures on August 24, 2011. Any borrowings under this credit facility also accrue interest at a variable rate based on short-term market interest rates. Outstanding standby letters of credit ($153.9 million as of August 28, 2010) reduce the amount available for borrowing under the $350 million credit facility.
There were no borrowings under the credit facilities during fiscal 2010. The credit facilities contain certain restrictive financial covenants, which include a consolidated debt to consolidated capitalization ratio, a fixed charge coverage ratio, and a priority debt to consolidated net worth ratio. As of August 28, 2010, we were in compliance with all such covenants.
Our credit facilities mature within the next twelve months. We are considering various options to extend the maturity profile of our credit facilities. The availability and terms of any new credit agreement will depend on conditions in the credit markets.
Long-Term Debt
On September 27, 2005, we obtained $250 million through a private placement of unsecured Senior Notes (the “Notes”) to a group of institutional accredited investors. The Notes were issued in two tranches at par and rank pari passu in right of payment with our other unsecured senior indebtedness. The first tranche has an aggregate principal amount of $169 million, is payable in a single installment on September 27, 2015, and bears interest at a rate of 5.41% per annum from the date of issuance. The second tranche has an aggregate principal amount of $81 million, matures on September 27, 2015, with amortization commencing on September 27, 2011, and bears interest at a rate of 5.24% per annum from the date of issuance. The second tranche has a required principal payment of $16.2 million on September 27, 2011, and on each September 27 thereafter to and including September 27, 2015. Interest on the Notes is payable semi-annually in arrears on the 27th day of March and September of each year. The Notes contain certain restrictive financial covenants, which include a consolidated debt to consolidated capitalization ratio, a fixed charge coverage ratio, and a priority debt to consolidated net worth ratio. As of August 28, 2010, we were in compliance with all such covenants.
We are considering incurring additional debt in order to fund part of our $750 million stock repurchase program, which we announced on September 29, 2010. We have not yet determined whether to do so or in what form, and the terms and availability of debt financing will depend on market conditions. To facilitate new borrowing, we may make amendments to our existing credit facilities and/or the Notes. In analyzing our credit we consider our ability to service not only our financial indebtedness but also our lease obligations.
Other Considerations
Our merchandise inventories at the end of fiscal 2010 were 3.4% higher than at the end of fiscal 2009. Inventory per store at the end of fiscal 2010 was approximately 1.5% higher than inventory per store at the end of fiscal 2009. The increases were due primarily to the expansion of our assortment of consumable merchandise and to support higher sales growth. We continue to constrain our purchases of discretionary merchandise as our customers continue to focus on basic consumables.
Our merchandise inventories at the end of fiscal 2009 were 3.8% lower than at the end of fiscal 2008. Inventory per store at the end of fiscal 2009 was approximately 5.0% lower than inventory per store at the end of fiscal 2008. The decrease in total inventory and inventory per store during fiscal 2009 was due to a decrease in discretionary merchandise. During fiscal 2009, we reduced our purchases of discretionary merchandise and focused on meeting higher customer demand for consumable merchandise.
25
Table of Contents
Capital expenditures for fiscal 2010 were $212.4 million compared with $155.4 million in fiscal 2009 and $167.9 million in fiscal 2008. The increase in capital expenditures during fiscal 2010 as compared to fiscal 2009 was due primarily to the investments we made to drive revenues, including improvements and upgrades to existing stores, distribution center improvements and technology-related projects. We also purchased 20 of our existing stores from our landlords during fiscal 2010 and opened 200 new stores compared to 180 stores during fiscal 2009. The decrease in capital expenditures during fiscal 2009 as compared to fiscal 2008 was due primarily to a decrease in distribution- and corporate-office-related projects, which offset increases in technology-related projects and improvements and upgrades to existing stores. Capital expenditures for fiscal 2011 are expected to be between $300 and $350 million. The planned increase in capital expenditures in fiscal 2011 is due primarily to the acceleration of our new store growth and the launch of a comprehensive store renovation program. The remaining expenditures relate primarily to technology-related projects and costs to begin construction of our tenth distribution center.
In fiscal 2010, we opened 200 stores, closed 70 stores and expanded, relocated, or renovated 117 stores. In addition, we continued our space re-alignment efforts to accommodate strong customer demand for consumable merchandise and to improve the in-store shopping experience. These efforts included re-aligning the space in our stores to support an expanded assortment of key traffic-driving categories, improving merchandise adjacencies and enhancing merchandise presentations. Approximately 18% of the chain was impacted by these efforts during fiscal 2010. Since we began these efforts in fiscal 2009, approximately 65% of our stores have completed the layout changes. We occupy most of our stores under operating leases. Store opening, closing, expansion, relocation, and renovation plans, as well as overall capital expenditure plans, are continually reviewed and may change. During fiscal 2011, we plan to open approximately 300 stores and close 80 to 100 stores. In addition, we plan to renovate 600 to 800 stores at a projected cost of $100,000 to $130,000 per store in connection with a comprehensive renovation program that will create more customer-focused assortments and layouts, rejuvenated physical stores and more customer-centric teams.
During fiscal 2010, we purchased 9.4 million shares of our common stock at a cost of $332.2 million. During fiscal 2009, we purchased 2.3 million shares at a cost of $71.1 million, and during fiscal 2008, we purchased 3.7 million shares at a cost of $97.7 million. As of August 28, 2010, we had outstanding authorizations to purchase a total of $129.8 million of our common stock.
On September 29, 2010, subsequent to the end of fiscal 2010, we announced that the Board of Directors authorized the purchase of up to $750 million of our outstanding common stock. The remaining amount under the previous authorization was cancelled. On October 5, 2010, we entered into an accelerated share repurchase agreement with a large financial institution for $250.0 million. See Note 12 to the Consolidated Financial Statements included in this Report for more information.
The timing and amount of any shares repurchased have been and will continue to be determined by management based on its evaluation of market conditions and other factors. Our share repurchase program does not have a stated expiration date, and purchases may be made through open market purchases, private market transactions or other structured transactions.
Our wholly-owned captive insurance subsidiary maintains certain balances in cash and cash equivalents and investment securities that are used in connection with our retained workers’ compensation, general liability and automobile liability risks and are not designated for general corporate purposes. As of the end of fiscal 2010, these cash and cash equivalents and investment securities balances were $42.1 million and $104.1 million, respectively.
Cash flows from operating activities
Cash provided by operating activities increased $62.3 million during fiscal 2010 as compared to fiscal 2009. The increase was due primarily to an increase in net income. An increase in our merchandise inventories was offset by an increase in accounts payable and accrued liabilities and changes in our income tax receivable/payable amounts, all in the ordinary course of business.
Cash provided by operating activities increased $13.5 million during fiscal 2009 as compared to fiscal 2008. The increase was due primarily to an increase in net income, partially offset by changes in income tax receivable/payable amounts. The changes in the income tax receivable/payable amounts were due primarily to a tax refund received during fiscal 2008 in connection with the formation of our captive insurance subsidiary.
Cash flows from investing activities
During fiscal 2010, we had a cash outflow of $306.9 million compared to a cash outflow of $109.4 million in fiscal 2009. The increase was due to an increase in purchases of investment securities and an increase in capital expenditures. We purchased $142.7 million of investment securities during fiscal 2010 compared to no purchases during fiscal 2009. As the financial markets and global economy begin to stabilize, we are placing more of our available cash in short-term investment securities. Our long-term investment securities consist of auction rate securities that are not currently liquid. See Note 2 to the Consolidated Financial Statements included in this Report for more information.
26
Table of Contents
During fiscal 2009, we had a cash outflow of $109.4 million compared to a cash outflow of $199.6 million in fiscal 2008. The decrease was due primarily to changes in the purchase/sale of investment securities. Due to volatility in the financial markets and the liquidity issues surrounding our auction rate securities, we did not purchase any investment securities during fiscal 2009 and only liquidated $44.9 million of investment securities. During fiscal 2008, we had a net cash outflow of $32.5 million related to investment securities.
Cash flows from financing activities
During fiscal 2010, we had a cash outflow of $340.7 million compared to a cash outflow of $139.5 million during fiscal 2009. The increase was due primarily to an increase in repurchases of common stock, offset partially by changes in cash overdrafts. We paid $332.2 million for purchases of our common stock during fiscal 2010 compared to $71.1 million in fiscal 2009. Cash overdrafts increased $49.7 million during fiscal 2010 compared with a $27.3 million decrease in fiscal 2009. See Note 1 to the Consolidated Financial Statements included in this Report for an explanation of our cash overdrafts.
During fiscal 2009, we had a cash outflow of $139.5 million compared to a cash outflow of $244.9 million during fiscal 2008. The decrease was due primarily to changes in cash overdrafts, an increase in proceeds from the exercise of stock options, and a decrease in purchases of our common stock. Cash overdrafts decreased $27.3 million in fiscal 2009 compared to fiscal 2008 and $79.7 million in fiscal 2008 compared to fiscal 2007. Proceeds from the exercise of stock options increased $31.3 million in fiscal 2009 as compared to fiscal 2008. Purchases of our common stock decreased $26.6 million in fiscal 2009 compared to fiscal 2008.
Contractual Obligations and Other Commercial Commitments
The following table shows our obligations and commitments to make future payments under contractual obligations at the end of fiscal 2010:
| Payments Due During the Period Ending | ||||||||||||||||||||||||||||
| (in thousands) Contractual Obligations |
Total | August 2011 |
August 2012 |
August 2013 |
August 2014 |
August 2015 |
Thereafter | |||||||||||||||||||||
| Long-term debt |
$ | 250,000 | $ | — | $ | 16,200 | $ | 16,200 | $ | 16,200 | $ | 16,200 | $ | 185,200 | ||||||||||||||
| Interest |
65,141 | 13,387 | 12,609 | 11,760 | 10,911 | 10,063 | 6,411 | |||||||||||||||||||||
| Merchandise letters of credit |
217,417 | 217,417 | — | — | — | — | — | |||||||||||||||||||||
| Operating leases |
1,490,872 | 345,997 | 307,881 | 257,971 | 204,189 | 144,176 | 230,658 | |||||||||||||||||||||
| Construction obligations |
15,335 | 15,335 | — | — | — | — | — | |||||||||||||||||||||
| Minimum royalties(1) |
11,600 | 2,550 | 2,750 | 2,800 | 2,800 | 700 | — | |||||||||||||||||||||
| Total |
$ | 2,050,365 | $ | 594,686 | $ | 339,440 | $ | 288,731 | $ | 234,100 | $ | 171,139 | $ | 422,269 | ||||||||||||||
| (1) | Minimum royalty payments related to an exclusive agreement to sell certain branded merchandise. |
At the end of fiscal 2010, approximately $79.3 million of the merchandise letters of credit were included in accounts payable and accrued liabilities on our Consolidated Balance Sheet. Most of our operating leases provide us with an option to extend the term of the lease at designated rates. See Part I – Item 2 – “Properties” in this Report.
As of August 28, 2010, we had $23.4 million in liabilities related to our uncertain tax positions. At this time, we cannot reasonably determine the timing of any payments related to these liabilities, except for $5.2 million, which were classified as current liabilities and may become payable within the next 12 months. See Note 8 to the Consolidated Financial Statements included in this Report for more information on our tax liabilities.
The following table shows our other commercial commitments at the end of fiscal 2010:
|
Other Commercial Commitments (in thousands) |
Total Amounts Committed |
|||
| Standby letters of credit |
$ | 153,882 | ||
| Surety bonds |
3,419 | |||
| Total |
$ | 157,301 | ||
A substantial portion of the outstanding amount of standby letters of credit (which are primarily renewed on an annual basis) is used as surety for future premium and deductible payments to our workers’ compensation and general liability insurance carrier. We accrue for these future payment liabilities as described in the “Critical Accounting Policies” section of this discussion.
27
Table of Contents
Recent Accounting Pronouncements
In June 2009, the Financial Accounting Standards Board (“FASB”) issued a new accounting standard which established the FASB Accounting Standards Codification (“ASC”) as the source of authoritative accounting principles recognized by the FASB to be applied by nongovernmental entities in the preparation of financial statements in conformity with generally accepted accounting principles (“GAAP”). Rules and interpretive releases of the SEC under authority of federal securities laws are also considered sources of authoritative GAAP for SEC registrants. The ASC combines all non-SEC authoritative standards into a comprehensive database organized by topic. The ASC is effective for interim and annual periods ending after September 15, 2009. We adopted the ASC during the first quarter of fiscal 2010. The adoption of the ASC did not have an impact on our Consolidated Financial Statements.
In September 2006, the FASB issued fair value guidance (ASC 820) that defines fair value, establishes a framework for measuring fair value in GAAP and expands disclosures about fair value measurements. We adopted the guidance with respect to financial assets and liabilities during the first quarter of fiscal 2009. The guidance became effective for non-financial assets and liabilities for the first annual period beginning after November 15, 2008. We adopted the fair value guidance for non-financial assets and liabilities during the first quarter of fiscal 2010. The adoption did not have an impact on our Consolidated Financial Statements.
In January 2010, the FASB issued Accounting Standards Update (“ASU”) No. 2010-06 “Fair Value Measurements and Disclosures – Improving Disclosures about Fair Value Measurements” (“ASU 2010-06”). ASU 2010-06 requires new disclosures for significant transfers in and out of Level 1 and 2 of the fair value hierarchy and the activity within Level 3 of the fair value hierarchy. The updated guidance also clarifies existing disclosures regarding the level of disaggregation of assets or liabilities and the valuation techniques and inputs used to measure fair value. The updated guidance is effective for interim and annual reporting periods beginning after December 15, 2009, with the exception of the new Level 3 activity disclosures, which are effective for interim and annual reporting periods beginning after December 15, 2010. We adopted the applicable disclosure requirements during the third quarter of fiscal 2010. The adoption did not have an impact on our Consolidated Financial Statements.
In February 2010, the FASB issued ASU No. 2010-09 “Subsequent Events – Amendments to Certain Recognition and Disclosure Requirements” (“ASU 2010-09”). ASU 2010-09 reiterates that an SEC filer is required to evaluate subsequent events through the date that the financial statements are issued and removes the requirement for an SEC filer to disclose the date through which subsequent events have been evaluated. The updated guidance was effective upon issuance. We adopted ASU 2010-09 during the second quarter of fiscal 2010. The adoption did not have an impact on our Consolidated Financial Statements.
Critical Accounting Policies
Our financial statements have been prepared in accordance with accounting policies generally accepted in the United States of America. Our discussion and analysis of our financial condition and results of operations are based on these financial statements. The preparation of these financial statements requires the application of accounting policies in addition to certain estimates and judgments by our management. Our estimates and judgments are based on currently available information, historical results and other assumptions we believe are reasonable. Actual results could differ from these estimates.
We believe the following accounting principles are critical because they involve significant judgments, assumptions and estimates used in the preparation of our Consolidated Financial Statements.
Merchandise Inventories:
Our inventories are valued using the retail method, based on retail prices less mark-on percentages, which approximates the lower of first-in, first-out (FIFO) cost or market. We record adjustments to inventory through cost of goods sold when retail price reductions, or markdowns, are taken against on-hand inventory. In addition, we make estimates and judgments regarding, among other things, initial markups, markdowns, future demand for specific product categories and market conditions, all of which can significantly impact inventory valuation. These estimates and judgments are based on the application of a consistent methodology each period. While we believe that we have sufficient current and historical knowledge to record reasonable estimates for these components, if actual demand or market conditions are different than our projections, it is possible that actual results could differ from recorded estimates. This risk is generally higher for seasonal merchandise than for non-seasonal merchandise. We estimate inventory losses for damaged, lost or stolen inventory (inventory shrinkage) for the period from the most recent physical inventory to the financial statement date. The accrual for estimated inventory shrinkage was $49.5 million as of the end of fiscal 2010 and $56.2 million as of the end of fiscal 2009. The accrual for estimated inventory shrinkage is based on the trailing twelve-month actual inventory shrinkage rate and can fluctuate from period to period based on the timing of the physical inventory counts. Stores receive a physical inventory at least annually. There were no material changes in the estimates or assumptions related to the valuation of inventory during fiscal 2010.
28
Table of Contents
Property and Equipment:
We state property and equipment at cost. We calculate depreciation for financial reporting purposes using the straight-line method over the estimated useful lives of the related assets. For leasehold improvements, this depreciation is over the shorter of the term of the related lease (generally five or ten years) or the asset’s useful economic life. The valuation and classification of these assets and the assignment of useful depreciable lives involves significant judgments and the use of estimates. We generally do not assign salvage value to property and equipment. We review property and equipment for impairment whenever events or changes in circumstances indicate that the carrying amount of an asset may not be recoverable. Historically, our impairment losses on fixed assets, which typically relate to normal store closings, have not been material to our financial position and results of operations. There were no material changes in the estimates or assumptions related to the valuation and classification of property and equipment during fiscal 2010. See Notes 1 and 4 to the Consolidated Financial Statements included in this Report for more information on property and equipment.
Insurance Liabilities:
We are primarily self-insured for health care, property loss, workers’ compensation, general liability, and auto liability costs. These costs are significant primarily due to the large number of our retail locations and employees. Our self-insurance liabilities are based on the total estimated costs of claims filed and estimates of claims incurred but not reported, less amounts paid against such claims, and are not discounted. We review current and historical claims data in developing our estimates. We also use information provided by outside actuaries with respect to medical, workers’ compensation, general liability, and auto liability claims. The insurance liabilities we record are mainly influenced by changes in payroll expense, sales, number of vehicles, and the frequency and severity of claims. The estimates of more recent claims are more volatile and more likely to change than older claims. If the underlying facts and circumstances of the claims change or the historical trend is not indicative of future trends, then we may be required to record additional expense or a reduction in expense, which could be material to our reported financial condition and results of operations.
As of August 28, 2010, we recorded our liabilities for workers’ compensation, general liability and auto liability costs on a gross basis, and recorded a separate insurance asset for amounts recoverable under stop-loss insurance policies. In addition, our gross liabilities and the related insurance asset were separated into current and non-current amounts on the Consolidated Balance Sheets. The insurance liabilities in our previous filings were recorded net of amounts recoverable under stop-loss insurance policies, and were classified as current liabilities. The prior year amounts in this Report have also been adjusted to properly reflect the gross insurance liabilities and related insurance asset, as well as the current and non-current classification on the Consolidated Balance Sheets. The changes were not material and had no impact on the Consolidated Statements of Income or Shareholders’ Equity. While certain changes were made to the operating section of the Consolidated Statements of Cash Flows to reflect the changes in operating assets and liabilities, there was no impact on total cash flows from operating activities, investing activities or financing activities.
Our total liabilities for workers’ compensation, general liability and auto liability costs were $249.4 million ($63.7 million current and $185.7 million non-current) as of the end of fiscal 2010 and $255.6 million ($56.7 million current and $198.9 million non-current) as of the end of fiscal 2009. The current portion of the liabilities is included in accrued liabilities on the Consolidated Balance Sheets, and the non-current portion is included in other liabilities. The insurance assets related to these amounts totaled $37.9 million ($3.2 million current and $34.7 million non-current) as of the end of fiscal 2010 and $45.5 million ($4.0 million current and $41.5 million non-current) as of the end of fiscal 2009. The current portion of the assets is included in prepayments and other current assets on the Consolidated Balance Sheets, and the non-current portion is included in other assets. There were no other material estimates for insurance liabilities during fiscal 2010 or fiscal 2009. Our insurance expense during fiscal 2010, fiscal 2009, and fiscal 2008 was impacted by changes in our liabilities for workers’ compensation, general liability and auto liability costs. See our discussion of SG&A expenses under “Results of Operations” above for more information.
Contingent Income Tax Liabilities:
We are subject to routine income tax audits that occur periodically in the normal course of business and we record contingent income tax liabilities related to our uncertain tax positions. Our liabilities related to uncertain tax positions require an assessment of the probability of the income-tax-related exposures and settlements and are influenced by our historical audit experiences with various state and federal taxing authorities as well as by current income tax trends. If circumstances change, we may be required to record adjustments that could be material to our reported financial condition and results of operations. Our liabilities related to uncertain tax positions were $23.4 million as of the end of fiscal 2010 and $39.4 million as of the end of fiscal 2009. The decrease was due primarily to the settlement of an income tax examination related to U.S. federal income taxes for fiscal years 2008 and prior. There were no material changes in the estimates or assumptions used to determine contingent income tax liabilities during fiscal 2010. See Note 8 to the Consolidated Financial Statements included in this Report for more information on our contingent income tax liabilities.
29
Table of Contents
Contingent Legal Liabilities:
We are involved in numerous legal proceedings and claims. Our accruals, if any, related to these proceedings and claims are based on a determination of whether or not the loss is both probable and estimable. We review outstanding claims and proceedings with external counsel to assess probability and estimates of loss. We re-evaluate the claims and proceedings each quarter or as new and significant information becomes available, and we adjust or establish accruals, if necessary. If circumstances change, we may be required to record adjustments that could be material to our reported financial condition and results of operations. Our total legal liabilities were $4.0 million as of the end of fiscal 2010 and $53.3 million as of the end of fiscal 2009. The decrease was due primarily to the payment of the litigation judgment and other costs that were accrued in connection with the Morgan litigation. There were no material changes in the estimates or assumptions used to determine contingent legal liabilities during fiscal 2010. See Note 10 to the Consolidated Financial Statements included in this Report for more information on our contingent legal liabilities.
Stock-based Compensation Expense:
We measure stock-based compensation expense based on the estimated fair value of the award on the grant date. The determination of the fair value of our employee stock options on the grant date is calculated using a Black-Scholes option-pricing model and is affected by our stock price as well as by assumptions regarding a number of complex and subjective variables. These variables include, but are not limited to, the expected stock price volatility over the term of the awards, and actual and projected employee stock option exercise behaviors. We also grant performance share rights and adjust compensation expense each quarter based on the ultimate number of shares expected to be issued. If factors change and we employ different assumptions to measure stock-based compensation in future periods, the compensation expense recorded may differ significantly from the amount recorded in the current period. Our results for fiscal 2010, fiscal 2009 and fiscal 2008 include stock-based compensation expense of $15.7 million, $13.3 million and $11.3 million, respectively. There were no material changes in the estimates or assumptions used to determine stock-based compensation during fiscal 2010. See Note 11 to the Consolidated Financial Statements included in this Report for more information on stock-based compensation.
ITEM 7A. QUANTITATIVE AND QUALITATIVE DISCLOSURES ABOUT MARKET RISK
We are subject to market risk from exposure to changes in interest rates based on our financing, investing and cash management activities. We maintain unsecured revolving credit facilities at variable rates of interest to meet the short-term needs of our expansion program and seasonal inventory increases. During fiscal 2010 and fiscal 2009, we did not incur any interest expense related to our credit facilities. During fiscal 2008 we incurred $1.7 million in interest expense related to our credit facilities. Our $250.0 million of long-term debt bears interest at fixed rates ranging from 5.24% to 5.41%.
We are also subject to market risk from exposure to changes in the fair value of our investment securities. Our investment securities currently include auction rate securities that are subject to failed auctions and are not currently liquid. As of August 28, 2010, we had a $11.4 million unrealized loss ($7.2 million net of taxes) related to these investments. We believe that we will be able to liquidate our auction rate securities at par at some point in the future as a result of issuer calls or refinancings, repurchases by the broker dealers, or upon maturity. However, volatility in the credit markets could continue to negatively impact the timing of future liquidity related to these investments and lead to additional adjustments to their carrying value. See Note 2 to the Consolidated Financial Statements included in this Report and “Risk Factors” set forth in Part I — Item IA of this Report for more information.
30
Table of Contents
ITEM 8. FINANCIAL STATEMENTS AND SUPPLEMENTARY DATA
INDEX TO CONSOLIDATED FINANCIAL STATEMENTS
FAMILY DOLLAR STORES, INC.
31
Table of Contents
REPORT OF INDEPENDENT REGISTERED PUBLIC ACCOUNTING FIRM
To the Board of Directors and Shareholders of Family Dollar Stores, Inc.:
In our opinion, the accompanying consolidated financial statements listed in the accompanying index present fairly, in all material respects, the financial position of Family Dollar Stores, Inc., and its subsidiaries at August 28, 2010 and August 29, 2009, and the results of their operations and their cash flows for each of the three fiscal years in the period ended August 28, 2010, in conformity with accounting principles generally accepted in the United States of America. Also in our opinion, the Company maintained, in all material respects, effective internal control over financial reporting as of August 28, 2010, based on criteria established in Internal Control – Integrated Framework issued by the Committee of Sponsoring Organizations of the Treadway Commission (COSO). The Company’s management is responsible for these financial statements, for maintaining effective internal control over financial reporting and for its assessment of the effectiveness of internal control over financial reporting, included in Management’s Report on Internal Control over Financial Reporting appearing in Item 9A elsewhere in this Report. Our responsibility is to express opinions on these financial statements and on the Company’s internal control over financial reporting based on our integrated audits. We conducted our audits in accordance with the standards of the Public Company Accounting Oversight Board (United States). Those standards require that we plan and perform the audits to obtain reasonable assurance about whether the financial statements are free of material misstatement and whether effective internal control over financial reporting was maintained in all material respects. Our audits of the financial statements included examining, on a test basis, evidence supporting the amounts and disclosures in the financial statements, assessing the accounting principles used and significant estimates made by management, and evaluating the overall financial statement presentation. Our audit of internal control over financial reporting included obtaining an understanding of internal control over financial reporting, assessing the risk that a material weakness exists, and testing and evaluating the design and operating effectiveness of internal control based on the assessed risk. Our audits also included performing such other procedures as we considered necessary in the circumstances. We believe that our audits provide a reasonable basis for our opinions.
A company’s internal control over financial reporting is a process designed to provide reasonable assurance regarding the reliability of financial reporting and the preparation of financial statements for external purposes in accordance with generally accepted accounting principles. A company’s internal control over financial reporting includes those policies and procedures that (i) pertain to the maintenance of records that, in reasonable detail, accurately and fairly reflect the transactions and dispositions of the assets of the company; (ii) provide reasonable assurance that transactions are recorded as necessary to permit preparation of financial statements in accordance with generally accepted accounting principles, and that receipts and expenditures of the company are being made only in accordance with authorizations of management and directors of the company; and (iii) provide reasonable assurance regarding prevention or timely detection of unauthorized acquisition, use, or disposition of the company’s assets that could have a material effect on the financial statements.
Because of its inherent limitations, internal control over financial reporting may not prevent or detect misstatements. Also, projections of any evaluation of effectiveness to future periods are subject to the risk that controls may become inadequate because of changes in conditions, or that the degree of compliance with the policies or procedures may deteriorate.
/s/ PricewaterhouseCoopers LLP
Charlotte, North Carolina
October 26, 2010
32
Table of Contents
FAMILY DOLLAR STORES, INC., AND SUBSIDIARIES
CONSOLIDATED STATEMENTS OF INCOME
| Years Ended | ||||||||||||
| (in thousands, except per share amounts) |
August 28, 2010 |
August 29, 2009 |
August 30, 2008 |
|||||||||
| Net sales |
$ | 7,866,971 | $ | 7,400,606 | $ | 6,983,628 | ||||||
| Cost and expenses: |
||||||||||||
| Cost of sales |
5,058,971 | 4,822,401 | 4,637,826 | |||||||||
| Selling, general and administrative |
2,232,402 | 2,120,936 | 1,980,496 | |||||||||
| Cost of sales and operating expenses |
7,291,373 | 6,943,337 | 6,618,322 | |||||||||
| Operating profit |
575,598 | 457,269 | 365,306 | |||||||||
| Interest income |
1,597 | 6,595 | 11,042 | |||||||||
| Interest expense |
13,337 | 12,939 | 14,586 | |||||||||
| Income before income taxes |
563,858 | 450,925 | 361,762 | |||||||||
| Income taxes |
205,723 | 159,659 | 128,689 | |||||||||
| Net income |
$ | 358,135 | $ | 291,266 | $ | 233,073 | ||||||
| Net income per common share — basic |
$ | 2.64 | $ | 2.08 | $ | 1.66 | ||||||
| Weighted average shares — basic |
135,745 | 139,894 | 140,193 | |||||||||
| Net income per common share — diluted |
$ | 2.62 | $ | 2.07 | $ | 1.66 | ||||||
| Weighted average shares — diluted |
136,596 | 140,522 | 140,494 | |||||||||
The accompanying notes are an integral part of the consolidated financial statements.
33
Table of Contents
FAMILY DOLLAR STORES, INC., AND SUBSIDIARIES
CONSOLIDATED BALANCE SHEETS
| (in thousands, except per share and share amounts) |
August 28, 2010 |
August 29, 2009 |
||||||
| Assets |
||||||||
| Current assets: |
||||||||
| Cash and cash equivalents |
$ | 382,754 | $ | 438,890 | ||||
| Investment securities |
120,325 | 5,801 | ||||||
| Merchandise inventories |
1,028,022 | 993,797 | ||||||
| Deferred income taxes |
66,102 | 82,707 | ||||||
| Income tax refund receivable |
— | 8,618 | ||||||
| Prepayments and other current assets |
63,005 | 63,205 | ||||||
| Total current assets |
1,660,208 | 1,593,018 | ||||||
| Property and equipment, net |
1,111,966 | 1,056,449 | ||||||
| Investment securities |
147,108 | 163,545 | ||||||
| Other assets |
62,775 | 64,790 | ||||||
| Total assets |
$ | 2,982,057 | $ | 2,877,802 | ||||
| Liabilities and Shareholders’ Equity |
||||||||
| Current liabilities: |
||||||||
| Accounts payable |
$ | 676,975 | $ | 528,104 | ||||
| Accrued liabilities |
359,065 | 376,515 | ||||||
| Income taxes |
18,447 | 1,676 | ||||||
| Total current liabilities |
1,054,487 | 906,295 | ||||||
| Long-term debt |
250,000 | 250,000 | ||||||
| Other liabilities |
203,857 | 236,643 | ||||||
| Deferred income taxes |
52,159 | 44,804 | ||||||
| Commitments and contingencies (Note 10) |
||||||||
| Shareholders’ equity: |
||||||||
| Preferred stock, $1 par; authorized and unissued 500,000 shares |
||||||||
| Common stock, $.10 par; authorized 600,000,000 shares; issued 146,496,237 shares at August 28, 2010, and 145,485,734 shares at August 29, 2009, and outstanding 130,452,959 shares at August 28, 2010, and 138,795,832 shares at August 29, 2009 |
14,650 | 14,549 | ||||||
| Capital in excess of par |
243,831 | 210,349 | ||||||
| Retained earnings |
1,665,646 | 1,387,905 | ||||||
| Accumulated other comprehensive loss |
(7,046 | ) | (8,960 | ) | ||||
| 1,917,081 | 1,603,843 | |||||||
| Less: common stock held in treasury, at cost (16,043,278 shares at August 28, 2010, and 6,689,902 shares at August 29, 2009) |
495,527 | 163,783 | ||||||
| Total shareholders’ equity |
1,421,554 | 1,440,060 | ||||||
| Total liabilities and shareholders’ equity |
$ | 2,982,057 | $ | 2,877,802 | ||||
The accompanying notes are an integral part of the consolidated financial statements.
34
Table of Contents
FAMILY DOLLAR STORES, INC., AND SUBSIDIARIES
CONSOLIDATED STATEMENTS OF SHAREHOLDERS’ EQUITY
Years Ended August 28, 2010, August 29, 2009, and August 30, 2008
| (in thousands, except per share |
Common stock |
Capital in excess of par |
Retained earnings |
Accumulated other comprehensive loss |
Treasury stock |
Total | ||||||||||||||||||
| Balance, September 1, 2007 |
$ | 17,989 | $ | 187,855 | $ | 1,722,859 | $ | — | $ | (754,062 | ) | $ | 1,174,641 | |||||||||||
| ASC 740 Adoption |
912 | 912 | ||||||||||||||||||||||
| Balance as adjusted, September 1, 2007 |
17,989 | 187,855 | 1,723,771 | — | (754,062 | ) | 1,175,553 | |||||||||||||||||
| Net income for the year |
233,073 | 233,073 | ||||||||||||||||||||||
| Unrealized loss on investment securities |
(4,862 | ) | (4,862 | ) | ||||||||||||||||||||
| Comprehensive income |
228,211 | |||||||||||||||||||||||
| Issuance of 65,014 common shares under |
6 | 201 | 207 | |||||||||||||||||||||
| Purchase of 3,719,054 common shares for treasury |
(97,674 | ) | (97,674 | ) | ||||||||||||||||||||
| Issuance of 14,290 shares of treasury under |
(56 | ) | 302 | 246 | ||||||||||||||||||||
| Retirement of 35,818,927 shares of |
(3,582 | ) | (37,408 | ) | (717,655 | ) | 758,645 | — | ||||||||||||||||
| Stock-based compensation |
16,077 | 16,077 | ||||||||||||||||||||||
| Dividends on common stock, $.49 per share |
(68,537 | ) | (68,537 | ) | ||||||||||||||||||||
| Balance, August 30, 2008 |
14,413 | 166,669 | 1,170,652 | (4,862 | ) | (92,789 | ) | 1,254,083 | ||||||||||||||||
| Net income for the year |
291,266 | 291,266 | ||||||||||||||||||||||
|
Unrealized gains (losses) on investment securities |
(4,626 | ) | (4,626 | ) | ||||||||||||||||||||
| Reclassification adjustment for (gains) losses |
528 | 528 | ||||||||||||||||||||||
| Comprehensive income |
287,168 | |||||||||||||||||||||||
| Issuance of 1,353,413 common shares |
136 | 31,450 | 31,586 | |||||||||||||||||||||
| Purchase of 2,271,528 common shares for treasury |
(71,067 | ) | (71,067 | ) | ||||||||||||||||||||
| Issuance of 9,405 shares of treasury stock |
197 | 73 | 270 | |||||||||||||||||||||
| Stock-based compensation |
12,033 | 12,033 | ||||||||||||||||||||||
| Dividends on common stock, $.53 per share |
(74,013 | ) | (74,013 | ) | ||||||||||||||||||||
| Balance, August 29, 2009 |
14,549 | 210,349 | 1,387,905 | (8,960 | ) | (163,783 | ) | 1,440,060 | ||||||||||||||||
| Net income for the year |
358,135 | 358,135 | ||||||||||||||||||||||
| Unrealized gains (losses) on investment securities |
1,914 | 1,914 | ||||||||||||||||||||||
| Comprehensive income |
360,049 | |||||||||||||||||||||||
| Issuance of 1,010,503 common shares |
101 | 21,045 | 21,146 | |||||||||||||||||||||
| Purchase of 9,370,908 common shares for treasury |
(332,189 | ) | (332,189 | ) | ||||||||||||||||||||
| Issuance of 17,532 shares of treasury stock |
95 | 445 | 540 | |||||||||||||||||||||
| Stock-based compensation |
12,342 | 12,342 | ||||||||||||||||||||||
| Dividends on common stock, $.60 per share |
(80,394 | ) | (80,394 | ) | ||||||||||||||||||||
| Balance, August 28, 2010 |
$ | 14,650 | $ | 243,831 | $ | 1,665,646 | $ | (7,046 | ) | $ | (495,527 | ) | $ | 1,421,554 | ||||||||||
The accompanying notes are an integral part of the consolidated financial statements.
35
Table of Contents
FAMILY DOLLAR STORES, INC., AND SUBSIDIARIES
CONSOLIDATED STATEMENTS OF CASH FLOWS
| Years Ended | ||||||||||||
| (in thousands) |
August 28, 2010 |
August 29, 2009 |
August 30, 2008 |
|||||||||
| Cash flows from operating activities: |
||||||||||||
| Net income |
$ | 358,135 | $ | 291,266 | $ | 233,073 | ||||||
| Adjustments to reconcile net income to net cash provided by operating activities: |
||||||||||||
| Depreciation and amortization |
172,037 | 159,808 | 149,598 | |||||||||
| Deferred income taxes |
8,123 | 4,426 | 6,878 | |||||||||
| Excess tax benefits from stock-based compensation |
(1,676 | ) | (704 | ) | — | |||||||
| Stock-based compensation |
13,163 | 11,538 | 10,073 | |||||||||
| Loss on disposition of property and equipment, including impairment |
7,244 | 9,924 | 6,298 | |||||||||
| Other gains and losses |
— | 1,228 | — | |||||||||
| Changes in operating assets and liabilities: |
||||||||||||
| Merchandise inventories |
(34,225 | ) | 38,888 | 33,213 | ||||||||
| Income tax refund receivable |
8,618 | (1,611 | ) | 37,387 | ||||||||
| Prepayments and other current assets |
200 | 238 | (6,088 | ) | ||||||||
| Other assets |
2,666 | 6,027 | (4,714 | ) | ||||||||
| Accounts payable and accrued liabilities |
57,405 | 13,798 | 21,415 | |||||||||
| Income taxes |
16,771 | 210 | 1,466 | |||||||||
| Other liabilities |
(16,922 | ) | (5,837 | ) | 27,139 | |||||||
| 591,539 | 529,199 | 515,738 | ||||||||||
| Cash flows from investing activities: |
||||||||||||
| Purchases of investment securities |
(142,730 | ) | — | (1,071,570 | ) | |||||||
| Sales of investment securities |
46,888 | 44,943 | 1,039,115 | |||||||||
| Capital expenditures |
(212,435 | ) | (155,401 | ) | (167,932 | ) | ||||||
| Proceeds from dispositions of property and equipment |
1,329 | 1,103 | 831 | |||||||||
| (306,948 | ) | (109,355 | ) | (199,556 | ) | |||||||
| Cash flows from financing activities: |
||||||||||||
| Revolving credit facility borrowings |
— | — | 736,300 | |||||||||
| Repayment of revolving credit facility borrowings |
— | — | (736,300 | ) | ||||||||
| Payment of debt issuance costs |
(651 | ) | (624 | ) | (304 | ) | ||||||
| Repurchases of common stock |
(332,189 | ) | (71,067 | ) | (97,674 | ) | ||||||
| Change in cash overdrafts |
49,687 | (27,256 | ) | (79,727 | ) | |||||||
| Proceeds from exercise of employee stock options |
19,663 | 31,525 | 257 | |||||||||
| Excess tax benefits from stock-based compensation |
1,676 | 704 | — | |||||||||
| Payment of dividends |
(78,913 | ) | (72,738 | ) | (67,408 | ) | ||||||
| (340,727 | ) | (139,456 | ) | (244,856 | ) | |||||||
| Net change in cash and cash equivalents |
(56,136 | ) | 280,388 | 71,326 | ||||||||
| Cash and cash equivalents at beginning of year |
438,890 | 158,502 | 87,176 | |||||||||
| Cash and cash equivalents at end of year |
$ | 382,754 | $ | 438,890 | $ | 158,502 | ||||||
| Supplemental disclosures of cash flow information: |
||||||||||||
| Purchases of property and equipment awaiting processing for payment, included in accounts payable |
$ | 22,848 | $ | 4,575 | $ | 6,579 | ||||||
| Cash paid during the period for: |
||||||||||||
| Interest, net of amounts capitalized |
12,568 | 12,192 | 14,340 | |||||||||
| Income taxes, net of refunds |
175,915 | 158,486 | 58,891 | |||||||||
The accompanying notes are an integral part of the consolidated financial statements.
36
Table of Contents
FAMILY DOLLAR STORES, INC., AND SUBSIDIARIES
NOTES TO CONSOLIDATED FINANCIAL STATEMENTS
| 1. | Description of Business and Summary of Significant Accounting Policies: |
Description of business
The Company operates a chain of more than 6,800 general merchandise retail discount stores in 44 contiguous states, providing low- and middle-income consumers with a selection of competitively priced merchandise in convenient neighborhood stores. The Company’s products include health and beauty aids, packaged food and refrigerated products, home cleaning supplies, housewares, stationery, seasonal goods, apparel and domestics. In the typical Family Dollar store, the majority of the products are priced at $10 or less, with many of the products priced at $1 or less. The Company manages its business on the basis of one operating segment.
Principles of consolidation
The consolidated financial statements include the accounts of the Company and its subsidiaries, all of which are wholly owned. All significant intercompany balances and transactions have been eliminated.
Fiscal year
The Company’s fiscal year generally ends on the Saturday closest to August 31 of each year, which generally results in an extra week every six years. Fiscal 2010, fiscal 2009 and fiscal 2008 were 52-week years.
Use of estimates
The preparation of the Company’s consolidated financial statements, in conformity with accounting principles generally accepted in the United States of America, requires management to make estimates and assumptions. These estimates and assumptions affect the reported amounts of assets and liabilities, the disclosure of contingent assets and liabilities at the date of the financial statements and the reported amounts of revenues and expenses during the reporting period. Actual results could differ from these estimates.
Adjustments and Reclassifications
As of August 28, 2010, the Company recorded its liabilities for workers’ compensation, general liability and auto liability costs on a gross basis, and recorded a separate insurance asset for amounts recoverable under stop-loss insurance policies. In addition, the Company’s gross liabilities and the related insurance asset were separated into current and non-current amounts on the Consolidated Balance Sheets. The insurance liabilities in the Company’s previous filings were recorded net of amounts recoverable under stop-loss insurance policies, and were classified as current liabilities. The prior year amounts in this Report have also been adjusted to properly reflect the gross insurance liabilities and related insurance asset, as well as the current and non-current classification on the Consolidated Balance Sheets. The Company’s deferred income taxes related to these insurance liabilities were also adjusted to reflect both current and non-current amounts. The changes noted above were not material and had no impact on the Consolidated Statements of Income or Shareholders’ Equity. While certain changes were made to the operating section of the Consolidated Statements of Cash Flows to reflect the changes in operating assets and liabilities, there was no impact on total cash flows from operating activities, investing activities or financing activities.
The Company’s total liabilities for workers’ compensation, general liability and auto liability costs were $249.4 million ($63.7 million current and $185.7 million non-current) as of the end of fiscal 2010 and $255.6 million ($56.7 million current and $198.9 million non-current) as of the end of fiscal 2009. The current portion of the liabilities is included in accrued liabilities on the Consolidated Balance Sheets, and the non-current portion is included in other liabilities. The insurance assets related to these amounts totaled $37.9 million ($3.2 million current and $34.7 million non-current) as of the end of fiscal 2010 and $45.5 million ($4.0 million current and $41.5 million non-current) as of the end of fiscal 2009. The current portion of the assets is included in prepayments and other current assets on the Consolidated Balance Sheets, and the non-current portion is included in other assets.
In addition to the adjustments noted above, certain prior year amounts have been reclassified to conform to the current year presentation. The Company’s long-term income tax liabilities related to uncertain tax positions, which were previously broken out as a separate line on the Consolidated Balance Sheets, have been reclassified and included in other liabilities.
37
Table of Contents
The adjustments and reclassifications to Consolidated Balance Sheet as of the end of fiscal 2009 are summarized in the table below.
| (in thousands) |
As Reported August 29, 2009 |
Adjustments and Reclassifications |
Revised August 29, 2009 |
|||||||||
| Assets |
||||||||||||
| Deferred income taxes |
$ | 93,164 | $ | (10,457 | ) | $ | 82,707 | |||||
| Prepayments and other current assets |
$ | 59,168 | $ | 4,037 | $ | 63,205 | ||||||
| Total current assets |
$ | 1,599,438 | $ | (6,420 | ) | $ | 1,593,018 | |||||
| Other assets |
$ | 23,290 | $ | 41,500 | $ | 64,790 | ||||||
| Total assets |
$ | 2,842,722 | $ | 35,080 | $ | 2,877,802 | ||||||
| Liabilities |
||||||||||||
| Accrued liabilities |
$ | 529,927 | $ | (153,412 | ) | $ | 376,515 | |||||
| Total current liabilities |
$ | 1,059,707 | $ | (153,412 | ) | $ | 906,295 | |||||
| Other liabilities |
$ | — | $ | 236,643 | $ | 236,643 | ||||||
| Deferred income taxes |
$ | 55,261 | $ | (10,457 | ) | $ | 44,804 | |||||
| Income taxes |
$ | 37,694 | $ | (37,694 | ) | $ | — | |||||
| Total liabilities |
$ | 1,402,662 | $ | 35,080 | $ | 1,437,742 | ||||||
Cash equivalents
The Company considers all highly liquid investments with an original maturity of three months or less to be cash equivalents. The carrying amount of the Company’s cash equivalents approximates fair value due to the short maturities of these investments and consists primarily of money market funds and other overnight investments. The Company maintains cash deposits with major banks, which from time to time may exceed federally insured limits. The Company periodically assesses the financial condition of the institutions and believes that the risk of any loss is minimal. Payments due from banks for third-party credit card, debit card and electronic benefit transactions are generally processed within 24-72 hours and are classified as cash equivalents.
The Company maintains zero balance cash disbursement accounts with certain banks. Outstanding checks in excess of funds on deposit with respect to these banks, referred to as cash overdrafts, are classified as accounts payable on the Consolidated Balance Sheets, and totaled $49.7 million at the end of fiscal 2010. There were no cash overdrafts at the end of fiscal 2009. Changes in these overdraft amounts are recorded as financing activities on the Consolidated Statements of Cash Flows.
The Company’s wholly-owned captive insurance subsidiary maintains balances in cash and cash equivalents that are used in connection with the Company’s retained workers’ compensation, general liability and automobile liability risks and are not designated for general corporate purposes. These cash and cash equivalents balances totaled $42.1 million as of the end of fiscal 2010 and $58.6 million as of the end of fiscal 2009.
Investment securities
The Company classifies all investment securities as available-for-sale. Securities accounted for as available-for-sale are required to be reported at fair value with unrealized gains and losses, net of taxes, excluded from net income and shown separately as a component of accumulated other comprehensive income within shareholders’ equity. The Company’s short-term investment securities currently consist primarily of debt securities such as municipal bonds, variable-rate demand notes, agency bonds, discount notes and commercial paper. The Company’s long-term investment securities currently consist of auction rate securities. See Notes 2 and 3 for more information on the Company’s investment securities.
In addition to the cash and cash equivalents balances discussed above, the Company’s wholly-owned captive insurance subsidiary also maintains balances in investment securities that are not designated for general corporate purposes. These investment securities balances totaled $104.1 million as of the end of fiscal 2010 and $59.3 million as of the end of fiscal 2009.
38
Table of Contents
Merchandise inventories
Inventories are valued using the retail method, based on retail prices less mark-on percentages, which approximates the lower of first-in, first-out (FIFO) cost or market. The Company records adjustments to inventory through cost of goods sold when retail price reductions, or markdowns, are taken against on-hand inventory. In addition, the Company makes estimates and judgments regarding, among other things, initial markups, markdowns, future demand for specific product categories and market conditions, all of which can significantly impact inventory valuation. These estimates and judgments are based on the application of a consistent methodology each period. The Company estimates inventory losses for damaged, lost or stolen inventory (inventory shrinkage) for the period from the most recent physical inventory to the financial statement date. The accrual for estimated inventory shrinkage is based on the trailing twelve-month actual inventory shrinkage rate and can fluctuate from period to period based on the timing of the physical inventory counts. Stores receive a physical inventory at least annually.
Property and equipment
Property and equipment is stated at cost. Depreciation for financial reporting purposes is calculated using the straight-line method over the estimated useful lives of the related assets. For leasehold improvements, this depreciation is over the shorter of the term of the related lease (generally five or ten years) or the asset’s useful economic life.
| Estimated useful lives are as follows: |
||||
| Buildings and building improvements |
10-40 years | |||
| Furniture, fixtures and equipment |
3-10 years | |||
| Transportation equipment |
3-10 years | |||
| Leasehold improvements |
5-10 years | |||
The Company capitalizes certain costs incurred in connection with developing, obtaining and implementing software for internal use. Capitalized costs are amortized over the expected economic life of the assets, generally ranging from three to eight years.
Property and equipment is reviewed for impairment whenever events or changes in circumstances indicate that the carrying amount of an asset may not be recoverable. Historically, impairment losses on fixed assets, which typically relate to normal store closings, have not been material to the Company’s financial position or results of operations.
Revenues
The Company recognizes revenue, net of returns and sales tax, at the time the customer tenders payment for and takes possession of the merchandise. Sales of prepaid services such as phone cards are recorded on a net basis. As a result, only the markup on the sales of these products is recorded as revenue.
Cost of sales
Cost of sales includes the purchase cost of merchandise and transportation costs to the Company’s distribution centers and stores. Buying, distribution center and occupancy costs, including depreciation, are not included in cost of sales. As a result, cost of sales may not be comparable to those of other retailers that may include these costs in their cost of sales.
Selling, general and administrative expenses
All operating costs, except transportation costs to the Company’s distribution centers and stores, are included in selling, general, and administrative expenses (“SG&A”). Buying, distribution center and occupancy costs, including depreciation, are included in SG&A rather than cost of sales.
Insurance liabilities
The Company is primarily self-insured for health care, property loss, workers’ compensation, general liability, and auto liability costs. These liabilities are based on the total estimated costs of claims filed and estimates of claims incurred but not reported, less amounts paid against such claims, and are not discounted. See “Adjustments and Reclassifications” above for more information.
Advertising costs
Advertising costs, net of co-op recoveries from vendors, are expensed during the period of the advertisement and amounted to $12.4 million, $9.8 million and $15.3 million in fiscal 2010, fiscal 2009 and fiscal 2008, respectively.
39
Table of Contents
Vendor allowances
Cash consideration received from a vendor is presumed to be a reduction of the purchase cost of merchandise and is reflected as a reduction of cost of sales, unless it can be demonstrated that it offsets an incremental expense, in which case it is netted against that expense.
Store opening and closing costs
The Company charges pre-opening costs against operating results when incurred. For properties under operating lease agreements, the present value of any remaining liability under the lease, net of expected sublease and lease termination recoveries, is expensed when the closing occurs.
Operating leases
Except for its corporate headquarters and distribution centers, the Company generally conducts its operations from leased facilities. Generally, store real estate leases have an initial term of five or ten years with multiple renewal options for additional five-year periods. The Company also has leases for equipment generally with lease terms of five years to ten years.
All of the Company’s store leases are classified as operating leases. The Company recognizes rental expense for its store leases on a straight-line basis over the base, non-cancelable lease term. For purposes of recognizing incentives, premiums and minimum rental expenses, the Company uses the date of initial possession to begin amortization, which is generally when the Company enters the space and begins to make improvements in preparation for intended use. For tenant improvement allowances and rent holidays, the Company records a deferred rent liability at the inception of the lease term and amortizes the deferred rent over the terms of the leases as reductions to rent expense on the Consolidated Statements of Income.
Certain leases provide for contingent rental payments based upon a percentage of store sales. The Company accrues for contingent rental expense as it becomes probable that specified sales targets will be met.
Capitalized interest
The Company capitalizes interest on borrowed funds during the construction of property and equipment. The Company capitalized $0.8 million, $1.2 million and $0.8 million of interest costs during fiscal 2010, fiscal 2009 and fiscal 2008, respectively.
Income taxes
The Company records deferred income tax assets and liabilities for the expected future tax consequences of temporary differences between the financial reporting bases and the income tax bases of its assets and liabilities. The Company estimates contingent income tax liabilities based on an assessment of the probability of the income-tax-related exposures and settlements related to uncertain tax positions. See Note 8 for more information on the Company’s income taxes.
Stock-based compensation
The Company recognizes compensation expense related to its stock-based awards based on the fair value of the awards on the grant date. The Company utilizes the Black-Scholes option-pricing model to estimate the grant-date fair value of its stock option awards. The grant-date fair value of the Company’s performance share rights awards is based on the stock price on the grant date. Compensation expense for the Company’s stock-based awards is recognized on a straight-line basis, net of estimated forfeitures, over the service period of each award. See Note 11 for more information on the Company’s stock-based compensation plans.
40
Table of Contents
New accounting pronouncements
In June 2009, the Financial Accounting Standards Board (“FASB”) issued a new accounting standard which established the FASB Accounting Standards Codification (“ASC”) as the source of authoritative accounting principles recognized by the FASB to be applied by nongovernmental entities in the preparation of financial statements in conformity with generally accepted accounting principles (“GAAP”). Rules and interpretive releases of the Securities and Exchange Commission (“SEC”) under authority of federal securities laws are also considered sources of authoritative GAAP for SEC registrants. The ASC combines all non-SEC authoritative standards into a comprehensive database organized by topic. The ASC is effective for interim and annual periods ending after September 15, 2009. The Company adopted the ASC during the first quarter of fiscal 2010. The adoption of the ASC did not have an impact on the Company’s Consolidated Financial Statements.
In September 2006, the FASB issued fair value guidance (ASC 820) that defines fair value, establishes a framework for measuring fair value in GAAP and expands disclosures about fair value measurements. The Company adopted the guidance with respect to financial assets and liabilities during the first quarter of fiscal 2009. The guidance became effective for non-financial assets and liabilities for the first annual period beginning after November 15, 2008. The Company adopted the fair value guidance for non-financial assets and liabilities during the first quarter of fiscal 2010. The adoption did not have an impact on the Company’s Consolidated Financial Statements.
In January 2010, the FASB issued Accounting Standards Update (“ASU”) No. 2010-06 “Fair Value Measurements and Disclosures – Improving Disclosures about Fair Value Measurements” (“ASU 2010-06”). ASU 2010-06 requires new disclosures for significant transfers in and out of Level 1 and 2 of the fair value hierarchy and the activity within Level 3 of the fair value hierarchy. The updated guidance also clarifies existing disclosures regarding the level of disaggregation of assets or liabilities and the valuation techniques and inputs used to measure fair value. The updated guidance is effective for interim and annual reporting periods beginning after December 15, 2009, with the exception of the new Level 3 activity disclosures, which are effective for interim and annual reporting periods beginning after December 15, 2010. The Company adopted the applicable disclosure requirements during the third quarter of fiscal 2010. The adoption did not have an impact on the Company’s Consolidated Financial Statements.
In February 2010, the FASB issued ASU No. 2010-09 “Subsequent Events – Amendments to Certain Recognition and Disclosure Requirements” (“ASU 2010-09”). ASU 2010-09 reiterates that an SEC filer is required to evaluate subsequent events through the date that the financial statements are issued and removes the requirement for an SEC filer to disclose the date through which subsequent events have been evaluated. The updated guidance was effective upon issuance. The Company adopted ASU 2010-09 during the second quarter of fiscal 2010. The adoption did not have an impact on the Company’s Consolidated Financial Statements.
41
Table of Contents
| 2. | Fair Value Measurements: |
Fair value accounting standards define fair value as the price that would be received to sell an asset or paid to transfer a liability in an orderly transaction between market participants at the measurement date. The following fair value hierarchy prioritizes the inputs used to measure fair value into three levels, with Level 1 being of the highest priority.
| ¡ | Level 1 – Quoted prices in active markets for identical assets or liabilities. |
| ¡ | Level 2 – Inputs other than quoted prices included within Level 1 that are observable for the asset or liability, either directly or indirectly, such as quoted prices for similar assets or liabilities in active markets, quoted prices for identical or similar assets or liabilities in markets that are not active, inputs other than quoted prices that are observable for the asset or liability, or inputs that are derived principally from or corroborated by observable market data by correlation or other means. |
| ¡ | Level 3 – Inputs that are unobservable for the asset or liability. |
The unobservable inputs in Level 3 can only be used to measure fair value to the extent that observable inputs in Level 1 and Level 2 are not available. The following table represents the Company’s fair value hierarchy as of August 28, 2010, and August 29, 2009, for items that are required to be measured at fair value on a recurring basis:
| August 28, 2010 | ||||||||||||||||
| (in thousands) |
Fair Value | Level 1 | Level 2 | Level 3 | ||||||||||||
| Cash equivalents: |
||||||||||||||||
| Money market funds |
$ | 287,003 | $ | 287,003 | $ | — | $ | — | ||||||||
| Investment securities: |
||||||||||||||||
| Auction rate securities |
154,158 | — | 7,050 | 147,108 | ||||||||||||
| Other debt securities |
111,306 | 111,306 | — | — | ||||||||||||
| Equity securities |
1,969 | 1,969 | — | — | ||||||||||||
| Other assets: |
||||||||||||||||
| Mutual funds(1) |
11,402 | 11,402 | — | — | ||||||||||||
| August 29, 2009 | ||||||||||||||||
| (in thousands) |
Fair Value | Level 1 | Level 2 | Level 3 | ||||||||||||
| Cash equivalents: |
||||||||||||||||
| Money market funds |
$ | 167,475 | $ | 167,475 | $ | — | $ | — | ||||||||
| Investment securities: |
||||||||||||||||
| Auction rate securities |
166,545 | — | 3,000 | 163,545 | ||||||||||||
| Equity securities |
2,801 | 2,801 | — | — | ||||||||||||
| Other assets: |
||||||||||||||||
| Mutual funds(1) |
7,744 | 7,744 | — | — | ||||||||||||
| (1) | Represents assets held pursuant to a deferred compensation plan for certain key management employees. |
On a non-recurring basis, the Company adjusts certain property and equipment to fair value through impairment charges. Property and equipment is reviewed for impairment whenever events or changes in circumstances indicate that the carrying amount of an asset may not be recoverable. The fair value of the property and equipment is determined based on a discounted cash flow analysis using Level 3 inputs. The Company estimates future cash flows based on historical experience and its expectations of future cash flows. Impairment charges were not material during fiscal 2010.
42
Table of Contents
Auction Rate Securities
The Company’s investment securities include student loan auction rate securities that were measured at fair value using either Level 2 or Level 3 inputs. The auction rate securities are tax-exempt bonds that are collateralized by federally guaranteed student loans. While the underlying securities generally have long-term nominal maturities that exceed one year, the interest rates reset periodically in scheduled auctions (generally every 7-35 days). The Company generally has the opportunity to sell its investments during such periodic auctions subject to the availability of buyers.
Beginning in the second quarter of fiscal 2008, issues in the global credit and capital markets led to failed auctions with respect to substantially all of the Company’s auction rate securities. A failed auction typically occurs when the number of securities submitted for sale in the auction exceeds the number of purchase bids. As of August 28, 2010, all of the Company’s $165.6 million par value investments were subject to failed auctions. As a result of the failed auctions, the interest rates on the investments reset to the established rates per the applicable investment offering statements. The Company will not be able to liquidate the investments until a successful auction occurs, a buyer is found outside the auction process, the securities are called or refinanced by the issuer, the securities are repurchased by the broker dealers, or the securities mature.
The Company does not currently expect to liquidate any auction rate securities going forward through the normal auction process. However, the Company does expect to be able to liquidate substantially all of its remaining auction rate securities at par through issuer calls or refinancings, repurchases by the broker dealers, or upon maturity. During fiscal 2010, the Company liquidated $16.2 million of auction rate securities at par as a result of issuer calls. Subsequent to the end of fiscal 2010, the Company liquidated an additional $7.1 million of auction rate securities at par as a result of issuer calls. Because the Company received notice of the calls prior to the end of fiscal 2010, the securities were classified as current assets on the Consolidated Balance Sheet and measured at fair value using Level 2 inputs. The Company’s remaining auction rate securities were classified as long-term assets due to the continued failure of the auction process and the continued uncertainty regarding the timing of future liquidity, and were measured at fair value using Level 3 inputs, as discussed below.
Historically, the carrying value (par value) of the auction rate securities approximated fair market value due to the resetting rates, and the Company had no cumulative gross unrealized or realized gains or losses from these investments prior to fiscal 2008. However, due to the liquidity issues noted above, the Company had a temporary gross unrealized loss of $11.4 million ($7.2 million, net of taxes) with respect to these investments as of August 28, 2010. Changes in the unrealized loss are included in Accumulated Other Comprehensive Loss within Shareholders’ Equity on the Consolidated Balance Sheets. Because there is no active market for the Company’s auction rate securities, the fair value of each security was determined through the use of a discounted cash flow analysis using Level 3 inputs. The terms used in the analysis were based on management’s estimate of the timing of future liquidity, which assumes that the securities will be called or refinanced by the issuer or repurchased by the broker dealers prior to maturity. The discount rates used in the analysis were based on market rates for similar liquid tax-exempt securities with comparable ratings and maturities. Due to the uncertainty surrounding the timing of future liquidity, the discount rates were adjusted further to reflect the illiquidity of the investments. The Company’s valuation is sensitive to market conditions and management’s judgment and can change significantly based on the assumptions used. A 100 basis point increase or decrease in the discount rate along with a 12-month increase or decrease in the term could result in a gross unrealized loss ranging from $4.3 million to $21.4 million.
The Company evaluated each of its auction rate securities for other-than-temporary impairment. The Company determined that there was no material other-than-temporary impairment as of August 28, 2010. The Company’s evaluation was based on an analysis of the credit rating and parity ratio of each security. The parity ratio is the ratio of trust assets available for distribution to creditors to the trust obligations to those creditors. The credit quality of the Company’s auction rate securities portfolio remains high (78% AAA rated, 15% AA rated, and 7% A rated) and the securities had a weighted average parity ratio of 109% as of August 28, 2010.
The following table summarizes the change in the fair value of the Company’s auction rate securities measured using Level 3 inputs during fiscal 2010 and fiscal 2009:
| (in thousands) |
Fiscal 2010 | Fiscal 2009 | ||||||
| Beginning Balance |
$ | 163,545 | $ | 222,104 | ||||
| Net unrealized gains (losses) included in other comprehensive income |
3,813 | (7,409 | ) | |||||
| Sales |
(13,200 | ) | (48,150 | ) | ||||
| Transfers out of Level 3 |
(7,050 | ) | (3,000 | ) | ||||
| Ending Balance |
$ | 147,108 | $ | 163,545 | ||||
The transfers out of Level 3 during fiscal 2010 and fiscal 2009 resulted from issuer call notices (at par). The Company treated the call notices as quoted prices in an inactive market (Level 2 inputs).
43
Table of Contents
Additional Fair Value Disclosures
The estimated fair value of the Company’s $250.0 million par value long-term debt was $277.8 million as of August 28, 2010, and $266.2 million as of August 29, 2009. Because the Company’s debt was a private placement and there are no quoted prices in active markets, the fair value was determined through the use of a discounted cash flow analysis using Level 3 inputs. The discount rate used in the analysis was based on borrowing rates available to the Company for debt of the same remaining maturities, issued in the same private placement debt market. The fair value was greater than the carrying value of the debt by $27.8 million as of August 28, 2010, and $16.2 million as of August 29, 2009. See Note 5 for more information on the Company’s long-term debt.
| 3. | Investment Securities: |
All of the Company’s investment securities are currently classified as available-for-sale due to the fact that the Company does not intend to hold the securities to maturity and does not purchase the securities for the purpose of selling them to make a profit on short-term differences in price. Available-for-sale securities are carried at estimated fair value, with unrealized gains and losses, if any, reported as a component of shareholders’ equity.
The Company’s investments consisted of the following available-for-sale securities at the end of fiscal 2010 and fiscal 2009 (in thousands):
| August 28, 2010 |
Amortized Cost | Gross Unrealized Holding Gains |
Gross Unrealized Holding Losses |
Fair Value | ||||||||||||
| Auction Rate Securities |
$ | 165,600 | — | 11,442 | (1) | $ | 154,158 | |||||||||
| Other Debt Securities |
111,140 | 166 | — | 111,306 | ||||||||||||
| Equity Securities |
1,979 | — | 10 | 1,969 | ||||||||||||
| (1) | The gross unrealized holding losses for fiscal 2010 were in a continuous unrealized loss position for 12 months or longer. |
| August 29, 2009 |
Amortized Cost | Gross Unrealized Holding Gains |
Gross Unrealized Holding Losses |
Fair Value | ||||||||||||
| Auction Rate Securities |
$ | 181,800 | — | 15,255 | (1) | $ | 166,545 | |||||||||
| Equity Securities |
1,979 | 822 | — | 2,801 | ||||||||||||
| (1) | The gross unrealized holding losses for fiscal 2009 were in a continuous unrealized loss position for 12 months or longer. |
As noted in Note 2 above, the Company’s auction rate securities are not currently liquid and have contractual maturities ranging from 15 years to 46 years. The Company’s other debt securities include municipal bonds, variable-rate demand notes, agency bonds, discount notes, and commercial paper, and have weighted average maturities of less than one year. While the variable rate demand notes have underlying contractual maturities beyond one year, the securities are traded in the short-term as a result of 7-day put options.
Proceeds from sales of investment securities available-for-sale during fiscal 2010 were $46.9 million compared to $44.9 million in fiscal 2009 and $1.0 billion in fiscal 2008. The decrease in proceeds from the sale of investment securities over the past three fiscal years is due primarily to the failure of the auction rate securities market beginning in fiscal 2008. No material gains or losses were realized on those sales for fiscal 2010, fiscal 2009 and fiscal 2008.
The Company also holds investments in mutual funds in connection with a deferred compensation plan for certain key management employees. These investments are classified as trading securities and are included, at fair value, in other assets on the Consolidated Balance Sheet. The Company records an offsetting deferred compensation liability in accrued liabilities. Changes in the fair value of the investments are reflected in SG&A on the Consolidated Income Statement as an increase/decrease in deferred compensation expense with an offsetting increase/decrease in investment income. The fair value of the deferred compensation plan assets was $11.4 million as of the end of fiscal 2010 and $7.7 million as of the end of fiscal 2009. See Note 9 below for more information on the deferred compensation plan.
44
Table of Contents
| 4. | Property and Equipment: |
Property and equipment is recorded at cost and consisted of the following at the end of fiscal 2010 and fiscal 2009:
| (in thousands) |
August 28, 2010 | August 29, 2009 | ||||||
| Buildings and building improvements |
$ | 537,647 | $ | 515,344 | ||||
| Furniture, fixtures and equipment |
1,291,282 | 1,170,099 | ||||||
| Transportation equipment |
80,161 | 77,216 | ||||||
| Leasehold improvements |
357,768 | 344,466 | ||||||
| Construction in progress |
19,831 | 14,980 | ||||||
| 2,286,689 | 2,122,105 | |||||||
| Less: accumulated depreciation and amortization |
1,250,881 | 1,133,672 | ||||||
| 1,035,808 | 988,433 | |||||||
| Land |
76,158 | 68,016 | ||||||
| $ | 1,111,966 | $ | 1,056,449 | |||||
| 5. | Current and Long-Term Debt: |
Current and long-term debt consisted of the following at the end of fiscal 2010 and fiscal 2009:
| (in thousands) |
August 28, 2010 | August 29, 2009 | ||||||
| 5.24% Notes |
$ | 81,000 | $ | 81,000 | ||||
| 5.41% Notes |
169,000 | 169,000 | ||||||
| 250,000 | 250,000 | |||||||
| Less: current portion |
— | — | ||||||
| Long-term portion |
$ | 250,000 | $ | 250,000 | ||||
On September 27, 2005, the Company obtained $250 million through a private placement of unsecured Senior Notes (the “Notes”) to a group of institutional accredited investors. The Notes were issued in two tranches at par and rank pari passu in right of payment with the Company’s other unsecured senior indebtedness. The first tranche has an aggregate principal amount of $169 million, is payable in a single installment on September 27, 2015, and bears interest at a rate of 5.41% per annum from the date of issuance. The second tranche has an aggregate principal amount of $81 million, matures on September 27, 2015, with amortization commencing on September 27, 2011, and bears interest at a rate of 5.24% per annum from the date of issuance. The second tranche has a required principal payment of $16.2 million on September 27, 2011, and on each September 27 thereafter to and including September 27, 2015. Interest on the Notes is payable semi-annually in arrears on the 27th day of March and September of each year. The Notes contain certain restrictive financial covenants, which include a consolidated debt to consolidated capitalization ratio, a fixed charge coverage ratio, and a priority debt to consolidated net worth ratio. As of August 28, 2010, the Company was in compliance with all such covenants.
On December 16, 2009, the Company entered into an unsecured revolving credit facility with a syndicate of lenders for short-term borrowings of up to $250 million. The credit facility has an initial term of 364 days and provides for two one-year extensions that require lender consent. Any borrowings under the credit facility accrue interest at a variable rate based on short-term market interest rates. The credit facility replaced the Company’s previous $250 million 364-day credit facility.
The Company also maintains a $350 million unsecured revolving credit facility that matures on August 24, 2011. Any borrowings under this credit facility also accrue interest at a variable rate based on short-term market interest rates. Outstanding standby letters of credit ($153.9 million as of August 28, 2010) reduce the amount available for borrowing under the $350 million credit facility.
There were no borrowings under the credit facilities during fiscal 2010 and fiscal 2009. The credit facilities contain certain restrictive financial covenants, which include a consolidated debt to consolidated capitalization ratio, a fixed charge coverage ratio, and a priority debt to consolidated net worth ratio. As of August 28, 2010, the Company was in compliance with all such covenants.
45
Table of Contents
| 6. | Accrued Liabilities: |
Accrued liabilities consisted of the following at the end of fiscal 2010 and fiscal 2009:
| (in thousands) |
August 28, 2010 | August 29, 2009 | ||||||
| Compensation |
$ | 110,932 | $ | 110,035 | ||||
| Self-insurance liabilities |
64,004 | 57,197 | ||||||
| Taxes other than income taxes |
88,672 | 72,067 | ||||||
| Deferred rent |
38,316 | 37,733 | ||||||
| Litigation |
3,990 | 53,330 | ||||||
|
Other(1) |
53,151 | 46,153 | ||||||
| $ | 359,065 | $ | 376,515 | |||||
| (1) | Other accrued liabilities consist primarily of store utility accruals, certain store rental accruals, deferred compensation accruals, and accrued interest. |
| 7. | Other Liabilities: |
Other liabilities consisted of the following at the end of fiscal 2010 and fiscal 2009:
| (in thousands) |
August 28, 2010 | August 29, 2009 | ||||||
| Self-insurance liabilities |
$ | 185,676 | $ | 198,949 | ||||
| Income taxes |
18,181 | 37,694 | ||||||
| $ | 203,857 | $ | 236,643 | |||||
46
Table of Contents
| 8. | Income Taxes: |
The provisions for income taxes in fiscal 2010, fiscal 2009 and fiscal 2008 were as follows:
| (in thousands) |
2010 | 2009 | 2008 | |||||||||
| Current: |
||||||||||||
| Federal |
$ | 174,384 | $ | 137,600 | $ | 111,723 | ||||||
| State |
23,272 | 17,633 | 10,033 | |||||||||
| 197,656 | 155,233 | 121,756 | ||||||||||
| Deferred: |
||||||||||||
| Federal |
8,565 | 4,971 | 1,555 | |||||||||
| State |
(498 | ) | (545 | ) | 5,378 | |||||||
| 8,067 | 4,426 | 6,933 | ||||||||||
| Total |
$ | 205,723 | $ | 159,659 | $ | 128,689 | ||||||
The following table summarizes the components of income tax expense in fiscal 2010, fiscal 2009 and fiscal 2008:
| 2010 | 2009 | 2008 | ||||||||||||||||||||||
| (in thousands) |
Income tax expense |
% of pre-tax income |
Income tax expense |
% of pre-tax income |
Income tax expense |
% of pre-tax income |
||||||||||||||||||
| Computed federal income tax |
$ | 197,351 | 35.0 | % | $ | 157,823 | 35.0 | % | $ | 126,610 | 35.0 | % | ||||||||||||
| State income taxes, net of federal income tax benefit |
15,885 | 2.8 | 11,599 | 2.6 | 7,863 | 2.2 | ||||||||||||||||||
| Valuation allowance |
(1,286 | ) | (0.2 | ) | (653 | ) | (0.2 | ) | 6,350 | 1.8 | ||||||||||||||
| Other |
(6,227 | ) | (1.1 | ) | (9,110 | ) | (2.0 | ) | (12,134 | ) | (3.4 | ) | ||||||||||||
| Actual income tax expense |
$ | 205,723 | 36.5 | % | $ | 159,659 | 35.4 | % | $ | 128,689 | 35.6 | % | ||||||||||||
The tax effects of temporary differences that give rise to significant portions of the deferred tax assets and deferred tax liabilities as of the end of fiscal 2010 and the end of fiscal 2009, were as follows:
| (in thousands) |
August 28, 2010 | August 29, 2009 | ||||||
| Deferred income tax liabilities: |
||||||||
| Excess of book over tax basis of property and equipment |
$ | 73,341 | $ | 81,129 | ||||
| Deferred income tax assets: |
||||||||
| Excess of tax over book basis of inventories |
$ | 10,403 | $ | 11,307 | ||||
| Nondeductible accruals for: |
||||||||
| Insurance |
20,057 | 32,264 | ||||||
| Compensation |
32,426 | 36,964 | ||||||
| Deferred rent |
13,913 | 13,691 | ||||||
| Litigation charge |
508 | 16,569 | ||||||
| Other |
12,410 | 14,120 | ||||||
| Gross deferred income tax assets |
89,717 | 124,915 | ||||||
| Less: valuation allowance |
(2,433 | ) | (5,883 | ) | ||||
| Net deferred tax assets |
$ | 87,284 | $ | 119,032 | ||||
The Company had net operating loss carryforwards of $95.6 million as of August 28, 2010, and $153.1 million as of August 29, 2009, in various states. These carryforwards expire at different intervals up to fiscal year 2030. Management considers all available evidence in determining the likelihood that a deferred tax asset will not be realized. As a result, the Company established valuation allowances related to these loss carryforwards. The valuation allowance was adjusted to reflect improved profitability resulting in utilization of loss carryforwards for which a valuation allowance was previously provided.
47
Table of Contents
The Company classifies accrued interest expense and penalties related to uncertain tax positions as a component of income tax expense. During fiscal 2010, fiscal 2009 and fiscal 2008, interest and penalties reduced income tax expense by $1.5 million, $0.2 million and $1.4 million, respectively. The reductions were due to settlements of uncertain tax positions and the expiration of the statute of limitations with respect to uncertain tax positions.
As of August 28, 2010, the Company had a liability related to uncertain tax positions of $23.4 million, including a gross unrecognized tax benefit of $18.3 million and accrued interest and penalties of $5.1 million. The non-current deferred tax asset balance was $10.0 million as of August 28, 2010. If the Company was to prevail on all unrecognized tax benefits recorded, approximately $13.4 million of the gross unrecognized tax benefits, including penalties and tax effected interest of $5.1 million, would benefit the effective income tax rate in a future period. A reconciliation of the beginning and ending amount of total unrecognized tax benefits is as follows:
| (in thousands) |
Unrecognized Tax Benefit |
Interest and Penalties |
Total | |||||||||
| Balance at September 1, 2007 |
$ | 38,351 | $ | 9,134 | $ | 47,485 | ||||||
| Increases related to prior year tax positions |
4,901 | 1,257 | 6,158 | |||||||||
| Decreases related to prior year tax positions |
(1,897 | ) | (384 | ) | (2,281 | ) | ||||||
| Increases related to current year tax positions |
2,829 | 356 | 3,185 | |||||||||
| Settlements during the period |
(2,099 | ) | (1,175 | ) | (3,274 | ) | ||||||
| Lapse of statute of limitations |
(10,570 | ) | (1,521 | ) | (12,091 | ) | ||||||
| Balance at August 30, 2008 |
$ | 31,515 | $ | 7,667 | $ | 39,182 | ||||||
| Increases related to prior year tax positions |
3,033 | 2,076 | 5,109 | |||||||||
| Decreases related to prior year tax positions |
(4,867 | ) | (202 | ) | (5,069 | ) | ||||||
| Increases related to current year tax positions |
12,037 | 285 | 12,322 | |||||||||
| Settlements during the period |
(3,097 | ) | (863 | ) | (3,960 | ) | ||||||
| Lapse of statute of limitations |
(5,376 | ) | (2,841 | ) | (8,217 | ) | ||||||
| Balance at August 29, 2009 |
$ | 33,245 | $ | 6,122 | $ | 39,367 | ||||||
| Increases related to prior year tax positions |
849 | 2,004 | 2,853 | |||||||||
| Decreases related to prior year tax positions |
(327 | ) | (21 | ) | (348 | ) | ||||||
| Increases related to current year tax positions |
2,260 | 411 | 2,671 | |||||||||
| Settlements during the period |
(16,907 | ) | (3,066 | ) | (19,973 | ) | ||||||
| Lapse of statute of limitations |
(785 | ) | (354 | ) | (1,139 | ) | ||||||
| Balance at August 28, 2010 |
$ | 18,335 | $ | 5,096 | $ | 23,431 | ||||||
On a quarterly and annual basis, the Company accrues for the effects of open uncertain tax positions and the related interest and penalties. The Company is subject to U.S. federal income tax as well as income tax in multiple state and local jurisdictions. In the fourth quarter of fiscal 2010, the Company concluded an income tax examination related to U.S. federal income taxes for fiscal years 2008 and prior. As of August 28, 2010, the Company was subject to income tax examinations for its U.S. federal income taxes for fiscal years ending subsequent to 2006. With few exceptions, the Company is subject to state and local income tax examinations for fiscal years ending subsequent to 2006.
The amount of future unrecognized tax positions may be reduced because the statute of limitations has expired or the tax position is resolved with the taxing authority. It is reasonably possible that during the next 12 months the unrecognized tax benefit may be reduced by a range of zero to $5.3 million due to settlements of audits by taxing authorities. Such unrecognized tax benefits relate primarily to state tax issues.
48
Table of Contents
| 9. | Employee Benefit Plans: |
Incentive compensation plan
The Company has an incentive profit-sharing plan which allows for payments to certain employees and officers at an aggregate annual amount not to exceed 7% of the Company’s consolidated income before income taxes and certain incentive compensation. Expenses under the profit-sharing plan were $28.8 million in fiscal 2010, $34.3 million in fiscal 2009 and $8.7 million in fiscal 2008.
Compensation deferral plans
The Company has a voluntary compensation deferral plan, under Section 401(k) of the Internal Revenue Code, available to eligible employees. At the discretion of the Board of Directors, the Company makes contributions to the plan which are allocated to participants, and in which they become vested, in accordance with formulas and schedules defined by the plan. Company expenses for contributions to the plan were $4.2 million in fiscal 2010, $3.2 million in fiscal 2009 and $2.8 million in fiscal 2008, and are included in SG&A on the Consolidated Statements of Income.
The Company has a deferred compensation plan to provide certain key management employees the ability to defer a portion of their base compensation and bonuses. The plan is an unfunded nonqualified plan. The deferred amounts and earnings thereon are payable to participants, or designated beneficiaries, at either specified future dates, or upon separation from service or death. The Company does not make contributions to this plan or guarantee earnings.
| 10. | Commitments and Contingencies: |
Operating leases and other contractual obligations
Rental expenses on all operating leases, both cancelable and non-cancelable, for fiscal 2010, fiscal 2009 and fiscal 2008 were as follows:
| (in thousands) |
2010 | 2009 | 2008 | |||||||||
| Minimum rentals, net of minor sublease rentals |
$ | 399,319 | $ | 382,530 | $ | 371,639 | ||||||
| Contingent rentals |
7,590 | 5,444 | 4,553 | |||||||||
| $ | 406,909 | $ | 387,974 | $ | 376,192 | |||||||
The following table shows the Company’s obligations and commitments to make future payments under contractual obligations, including future minimum rental payments required under operating leases that have initial or remaining non-cancelable lease terms in excess of one year at the end of fiscal 2010:
| Payments Due During the Period Ending | ||||||||||||||||||||||||||||
| (in thousands) | August | August | August | August | August | |||||||||||||||||||||||
| Contractual Obligations |
Total | 2011 | 2012 | 2013 | 2014 | 2015 | Thereafter | |||||||||||||||||||||
| Long-term debt |
$ | 250,000 | $ | — | $ | 16,200 | $ | 16,200 | $ | 16,200 | $ | 16,200 | $ | 185,200 | ||||||||||||||
| Interest |
65,141 | 13,387 | 12,609 | 11,760 | 10,911 | 10,063 | 6,411 | |||||||||||||||||||||
| Merchandise letters of credit |
217,417 | 217,417 | — | — | — | — | — | |||||||||||||||||||||
| Operating leases |
1,490,872 | 345,997 | 307,881 | 257,971 | 204,189 | 144,176 | 230,658 | |||||||||||||||||||||
| Construction obligations |
15,335 | 15,335 | — | — | — | — | — | |||||||||||||||||||||
| Minimum royalties(1) |
11,600 | 2,550 | 2,750 | 2,800 | 2,800 | 700 | — | |||||||||||||||||||||
| Total |
$ | 2,050,365 | $ | 594,686 | $ | 339,440 | $ | 288,731 | $ | 234,100 | $ | 171,139 | $ | 422,269 | ||||||||||||||
| (1) | Minimum royalty payments related to an exclusive agreement to sell certain branded merchandise. |
At the end of fiscal 2010, approximately $79.3 million of the merchandise letters of credit were included in accounts payable on the Company’s Consolidated Balance Sheet. Most of the Company’s operating leases provide the Company with an option to extend the term of the lease at designated rates.
As of August 28, 2010, the Company had $23.4 million in liabilities related to its uncertain tax positions. At this time the Company cannot reasonably determine the timing of any payments related to these liabilities, except for $5.2 million, which were classified as current liabilities and may become payable within the next 12 months. See Note 8 above for more information on the Company’s tax liabilities.
49
Table of Contents
The following table shows the Company’s other commercial commitments at the end of fiscal 2010:
| Other Commercial Commitments (in thousands) |
Total Amounts Committed |
|||
| Standby letters of credit |
$ | 153,882 | ||
| Surety bonds |
3,419 | |||
| Total |
$ | 157,301 | ||
A substantial portion of the outstanding amount of standby letters of credit (which are primarily renewed on an annual basis) is used as surety for future premium and deductible payments to the Company’s workers’ compensation and general liability insurance carrier. The Company accrues for these liabilities based on the total estimated costs of claims filed and claims incurred but not reported, and are not discounted.
Litigation
Since 2004, individuals who have held the position of Store Manager for the Company have filed lawsuits alleging that the Company violated the Fair Labor Standards Act (“FLSA”), and/or similar state laws, by classifying them as “exempt” employees who are not entitled to overtime compensation. The majority of the complaints in each action also request that the cases proceed as collective actions under the FLSA or as class actions under state laws and request recovery of overtime pay, liquidated damages, and attorneys’ fees and court costs. The Company currently has 21 such cases pending against it. As previously disclosed in the Company’s Annual Report on Form 10-K for fiscal 2009, on October 5, 2009, the Supreme Court decided not to hear the Company’s appeal of the store manager classification litigation known as the Morgan case. During the first quarter of fiscal 2010, the Company paid the judgment of $35.6 million, plus interest, attorneys’ fees and other related costs, thus concluding the Morgan litigation.
Grace v. Family Dollar Stores, Inc. and Ward v. Family Dollar Stores, Inc. are both pending in the U.S. District Court for the Western District of North Carolina, Charlotte Division (the “N.C. Federal Court”). In those cases, the court has returned orders finding that the plaintiffs were not similarly situated and, therefore, that neither nationwide notice nor collective treatment under the FLSA is appropriate. Hence, the Grace and Ward cases are proceeding as approximately 43 individual plaintiff cases.
On July 9, 2009, the Court granted summary judgment against Irene Grace on the merits of her misclassification claim under the FLSA. The Company has filed summary judgment motions related to each of the remaining 42 plaintiffs in the Grace and Ward cases. On September 9, 2009, the plaintiffs appealed certain rulings of the N.C. Federal Court to the United States Court of Appeals for the Fourth Circuit including the court’s summary judgment order against Irene Grace. Briefing related to the appeal was completed on August 20, 2010. In the event that summary judgment is denied with respect to any of the individual Grace and Ward plaintiff’s claims, the court has stated it will conduct what it has referred to as “mini-trials” of a few plaintiffs at a time. We intend to vigorously defend the Company in these actions; however, no assurances can be given that the Company will be successful in the defense of these matters.
Including Grace and Ward, a total of seventeen class and/or collective or single plaintiff misclassification cases are now pending before the N.C. Federal Court. All of these cases have been either transferred by U.S. District Courts in various states to the N.C. Federal Court or were the subject of an order entered by the United States Judicial Panel on Multidistrict Litigation (“MDL Panel”) transferring the cases from United States district courts in various states to the N.C. Federal Court for coordination of discovery with the other pending cases. The N.C. Federal Court has stayed all discovery in these cases pending the outcome of the Grace and Ward appeals. Presently, there are a total of 64 named plaintiffs and/or opt-ins in these cases.
The Company has received four additional class action lawsuits in which the sole or dispositive issue is the exempt status of Store Managers under various state laws. Twila Walters et. al. v. Family Dollar Stores of Missouri, Inc., alleging violations of the Missouri Minimum Wage Law, was originally filed on January 26, 2010, in the Circuit Court of Jackson County, Missouri. The Company removed it to federal court, and the plaintiff voluntarily dismissed. The plaintiff later re-filed the case in the Circuit Court of Jackson County. The MDL Panel has ordered that three other state-law misclassification cases should not be (or should not remain) consolidated with the related MDL cases pending in the N.C. Federal Court. Barker v. Family Dollar, Inc., alleging violations of the Kentucky Wages and Hours Law, was filed in Circuit Court in Jefferson County, Kentucky on February 17, 2010, and removed to the United States District Court for the Western District of Kentucky. The MDL Panel declined to transfer and consolidate this case with the related misclassification cases. Youngblood, et al. v. Family Dollar Stores, Inc., Family Dollar, Inc., Family Dollar Stores of New York, Inc. and Does 1 through 10, 3:09-cv-1941, was filed in the United States District Court for the Southern District of New York on April 2, 2009. Rancharan v. Family Dollar Stores, Inc., was filed in the Supreme Court of the State of New York, Queens County on March 4, 2009, and removed to the United States District Court for the Eastern District of New York on May 6, 2009. Both Youngblood and Rancharan involve alleged violations of the New York Labor Law. These cases had been transferred to the N.C. Federal Court and consolidated with the MDL cases, on June 8, 2009, and June 30, 2009, respectively, but the MDL Panel remanded them on August 17, 2010. The plaintiffs in these cases seek recovery of overtime pay, liquidated damages, and attorneys’ fees and court costs.
50
Table of Contents
In general, the Company continues to believe that its Store Managers are “exempt” employees under the FLSA and have been and are being properly compensated under both federal and state laws. The Company further believes that these actions are not appropriate for collective or class action treatment. The Company intends to vigorously defend the claims in these actions. While the N.C. Federal Court has previously found that the Grace and Ward actions are not appropriate for collective action treatment, at this time it is not possible to predict whether one or more of the remaining cases may be permitted to proceed collectively on a nationwide or other basis. No assurances can be given that the Company will be successful in the defense of these actions, on the merits or otherwise. The Company cannot reasonably estimate the possible loss or range of loss that may result from these actions.
If at some point in the future the Company determines that a reclassification of some or all of its Store Managers as non-exempt employees under the FLSA is required, such action could have a material adverse effect on the Company’s financial position, liquidity or results of operation. At this time, the Company cannot quantify the impact of such a determination.
Two putative state law class actions have been filed on behalf of store Team Members who are paid on an hourly basis. The first case, McCauley et al. v. Family Dollar, Inc., was filed on April 27, 2010, in Circuit Court in Jefferson County, Kentucky, and was removed to the United States District Court for the Western District of Kentucky. The plaintiffs allege that they and a putative class of similarly situated store Team Members throughout Kentucky were required to work off the clock and without breaks in violation of the Kentucky Wages and Hours Law. The plaintiffs seek the value of their unpaid wages (off-the-clock time and statutory breaks), liquidated damages in an equal amount, attorneys’ fees and costs, and pre- and post-judgment interest. The second case, Wright v. Family Dollar, Inc., was filed in the Circuit Court of Cook County, Illinois on June 11, 2010, and was removed to the United States District Court for the Northern District of Illinois on July 15, 2010. Plaintiffs claim that they were required to work off the clock in violation of the Illinois Minimum Wage Law and the Illinois Wage Payment and Collections Act. The plaintiffs seek the value of their unpaid wages (off-the-clock time), liquidated damages in an equal amount, equitable relief, attorneys’ fees and costs, and pre-judgment interest. The Company maintains strict policies prohibiting off-the-clock work and requiring employees to take all breaks required by applicable law, and intends to vigorously defend these actions. The Company cannot reasonably estimate the possible loss or range of loss that may result from these actions.
On October 14, 2008, a complaint was filed in the U.S. District Court in Birmingham, Alabama, captioned Scott, et al. v. Family Dollar Stores, Inc., alleging discriminatory pay practices with respect to the Company’s female store managers. This case was pled as a putative class action or collective action under applicable statutes on behalf of all Family Dollar female store managers. The plaintiffs seek recovery of compensatory and punitive money damages, recovery of attorneys’ fees and equitable relief. The case has been transferred to the N.C. Federal Court. Presently, there are 48 named plaintiffs in the Scott case, with no additional opt-ins. The Company is vigorously defending the allegations in the Scott case. The Company cannot reasonably estimate the possible loss or range of loss that may result from this action.
The Company is involved in numerous other legal proceedings and claims incidental to its business, including litigation related to alleged failures to comply with various state and federal employment laws, some of which are or may be pled as class or collective actions, and litigation related to alleged personal or property damage, as to which the Company carries insurance coverage and/or has established accrued liabilities as set forth in the Company’s financial statements. While the ultimate outcome cannot be determined, the Company currently believes that these proceedings and claims, both individually and in the aggregate, should not have a material adverse effect on the Company’s financial position, liquidity or results of operations. However, the outcome of any litigation is inherently uncertain and, if decided adversely to the Company, or, if the Company determines that settlement of such actions is appropriate, the Company may be subject to liability that could have a material adverse effect on the Company’s financial position, liquidity or results of operations.
| 11. | Stock-Based Compensation: |
The Family Dollar Stores, Inc. 2006 Incentive Plan (the “2006 Plan”) permits the granting of a variety of compensatory award types. The Company currently grants non-qualified stock options and performance share rights under the 2006 Plan. Shares issued related to stock options and performance share rights represent new issuances of common stock. A total of 12.0 million common shares are reserved and available for issuance under the 2006 Plan, plus any shares awarded under the Company’s previous plan (1989 Non-Qualified Stock Option Plan) that expire or are canceled or forfeited after the adoption of the 2006 Plan. As of August 28, 2010, there were 10.6 million shares remaining available for grant under the 2006 Plan. The Company also issues shares under the 2006 Plan in connection with director compensation. These shares are currently issued out of treasury stock and are not material.
The Company’s results for fiscal 2010, fiscal 2009 and fiscal 2008 include stock-based compensation expense of $15.7 million, $13.3 million and $11.3 million, respectively. These amounts are included within SG&A on the Consolidated Statements of Income. Tax benefits recognized in fiscal 2010, fiscal 2009 and fiscal 2008 for stock-based compensation totaled $5.8 million, $4.9 million and $4.2 million, respectively.
51
Table of Contents
Stock Options
The Company grants stock options to key employees at prices not less than the fair market value of the Company’s common stock on the grant date. The Company’s practice for a number of years has been to make a single annual grant to all employees participating in the stock option program and generally to make other grants only in connection with employment or promotions. Options expire five years from the grant date and are exercisable to the extent of 40% after the second anniversary of the grant and an additional 30% at each of the following two anniversary dates on a cumulative basis. Compensation cost is recognized on a straight-line basis, net of estimated forfeitures, over the requisite service period. The Company uses the Black-Scholes option-pricing model to estimate the grant-date fair value of each option. The fair values of options granted were estimated using the following weighted-average assumptions:
| Years Ended | ||||||||||||
| August 28, 2010 | August 29, 2009 | August 30, 2008 | ||||||||||
| Expected dividend yield |
2.27 | % | 2.51 | % | 2.08 | % | ||||||
| Expected stock price volatility |
35.20 | % | 34.00 | % | 29.00 | % | ||||||
| Weighted average risk-free interest rate |
2.07 | % | 2.23 | % | 4.28 | % | ||||||
| Expected life of options (years) |
4.50 | 4.43 | 4.45 | |||||||||
The expected dividend yield is based on the projected annual dividend payment per share divided by the stock price on the grant date. Expected stock price volatility is derived from an analysis of the historical and implied volatility of the Company’s publicly traded stock. The risk-free interest rate is based on the U.S. Treasury rates on the grant date with maturity dates approximating the expected life of the option on the grant date. The expected life of the options is based on an analysis of historical and expected future exercise behavior, as well as certain demographic characteristics. These assumptions are evaluated and revised for future grants, as necessary, to reflect market conditions and experience. There were no significant changes made to the methodology used to determine the assumptions during fiscal 2010. The weighted-average grant-date fair value of stock options granted was $7.33 during fiscal 2010, $5.78 during fiscal 2009 and $6.89 during fiscal 2008.
The following table summarizes the transactions under the stock option plans during fiscal 2010:
| (in thousands, except per share |
Options Outstanding |
Weighted- Average Exercise Price |
Weighted-Average Remaining Contractual Life in Years |
Aggregate Intrinsic Value |
||||||||||||
| Balance at August 29, 2009 |
3,174 | $ | 25.17 | |||||||||||||
| Granted |
826 | 28.20 | ||||||||||||||
| Exercised |
846 | 23.20 | ||||||||||||||
| Forfeited |
195 | 26.08 | ||||||||||||||
| Expired |
190 | 27.59 | ||||||||||||||
| Balance at August 28, 2010 |
2,769 | $ | 26.47 | 2.90 | $ | 46,686 | ||||||||||
| Exercisable at August 28, 2010 |
430 | $ | 28.36 | 1.53 | $ | 6,422 | ||||||||||
The total intrinsic value of stock options exercised was $9.1 million during fiscal 2010, $7.1 million during fiscal 2009 and $0.1 million during fiscal 2008. As of August 28, 2010, there was approximately $7.1 million of unrecognized compensation cost related to outstanding stock options. The unrecognized compensation cost will be recognized over a weighted-average period of 2.4 years.
52
Table of Contents
Performance Share Rights
The Company grants performance share rights to key employees on an annual basis and in connection with employment or promotion. Performance share rights give employees the right to receive shares of the Company’s common stock at a future date based on the Company’s performance relative to a peer group. Performance is measured based on two pre-tax metrics: Return on Equity and Income Growth. The Compensation Committee of the Board of Directors establishes the peer group and performance metrics. The performance share rights vest at the end of the performance period (generally three years) and the shares are issued shortly thereafter. The actual number of shares issued can range from 0% to 200% of the employee’s target award depending on the Company’s performance relative to the peer group. The following table summarizes the transactions under the performance share rights program during fiscal 2010:
| (in thousands, except per share amounts) |
Performance Share Rights Outstanding |
Weighted Average Grant-Date Fair Value |
||||||
| Nonvested – August 29, 2009 |
666 | $ | 26.20 | |||||
| Granted |
247 | 28.37 | ||||||
| Vested |
(237 | ) | 29.08 | |||||
| Cancellations |
(24 | ) | 26.16 | |||||
| Adjustments |
42 | N/A | ||||||
| Nonvested – August 28, 2010 |
694 | $ | 26.27 | |||||
The grant-date fair value of the performance share rights is based on the stock price on the grant date. The weighted-average grant-date fair value of performance share rights granted was $28.37 during fiscal 2010, $23.56 during fiscal 2009 and $26.96 during fiscal 2008. Compensation cost is recognized on a straight-line basis, net of estimated forfeitures, over the requisite service period and adjusted quarterly to reflect the ultimate number of shares expected to be issued. The adjustments of performance share rights outstanding in the table above represent the performance adjustment for shares vested during the period. The total fair value of performance share rights vested was $6.9 million during fiscal 2010, $5.3 million during fiscal 2009 and $2.3 million during fiscal 2008. As of August 28, 2010, there was approximately $10.8 million of unrecognized compensation cost related to outstanding performance share rights, based on the Company’s most recent performance analysis. The unrecognized compensation cost will be recognized over a weighted-average period of 1.5 years.
53
Table of Contents
| 12. | Stock Repurchases: |
During fiscal 2010, the Company purchased 9.4 million shares of its common stock at a cost of $332.2 million. During fiscal 2009, the Company purchased 2.3 million shares of its common stock at a cost of $71.1 million, and during fiscal 2008, the Company purchased 3.7 million shares at a cost of $97.7 million.
All of the share repurchases during fiscal 2010 were made in the open market, with the exception of $100.0 million, which was repurchased under two structured repurchase agreements with large financial institutions. In connection with each agreement, the Company made a prepayment of $50.0 million to the financial institution. The financial institution purchased shares of the Company’s common stock in the open market and delivered shares to the Company at specified intervals during the contract term. The number of shares delivered was based on the volume weighted average price (“VWAP”) of the Company’s common stock during the purchase period less an agreed upon discount. The Company received 2.7 million shares under the agreements, which were completed prior to the end of fiscal 2010.
All shares are purchased pursuant to share repurchase authorizations approved by the Board of Directors. On November 18, 2009, the Company announced that the Board of Directors authorized the Company to purchase up to $400 million of the Company’s outstanding common stock from time to time as market conditions warrant. As of August 28, 2010, the Company had $129.8 million remaining under this authorization.
On September 29, 2010, subsequent to the end of fiscal 2010, the Company announced that the Board of Directors authorized the Company to purchase up to $750 million of the Company’s outstanding common stock. The remaining amount under the previous authorization was cancelled. On October 5, 2010, the Company entered into an accelerated share repurchase agreement with a large financial institution. In connection with the agreement, the Company made a prepayment of $250.0 million to the financial institution and immediately received 4.4 million shares (80% of the prepayment amount). The financial institution will purchase shares of the Company’s common stock in the open market over an averaging period in order to cover its position with respect to shares it borrowed for the initial delivery and for any shares payable upon settlement. The averaging period began on October 7, 2010, and is expected to end during the second quarter of fiscal 2011, but the financial institution may accelerate the end of the averaging period. The number of shares to be delivered upon settlement of the agreement will be based on the VWAP during the averaging period less an agreed upon discount. In the event that the total number of shares to be delivered is less than the initial delivery amount, the Company will be required, at its option, to deliver either shares or cash to the financial institution for the difference.
There is no expiration date related to the above referenced authorization. Shares purchased under the share repurchase authorizations are generally held in treasury or have been cancelled and returned to the status of authorized but unissued shares.
On November 2, 2007, the Company retired 35.8 million shares of its common stock held in treasury. The shares were returned to the status of authorized but unissued shares. As a result, treasury stock decreased approximately $758.7 million. The Company reduced common stock, capital in excess of par, and retained earnings by approximately $3.6 million, $37.4 million, and $717.7 million, respectively.
54
Table of Contents
| 13. | Earnings per Share: |
Basic net income per common share is computed by dividing net income by the weighted average number of shares outstanding during each period. Diluted net income per common share gives effect to all securities representing potential common shares that were dilutive and outstanding during the period. Certain stock options and performance share rights were excluded from the calculation of diluted net income per common share because their effects were antidilutive (0.6 million, 1.7 million and 4.2 million shares for fiscal 2010, fiscal 2009 and fiscal 2008, respectively). In the calculation of diluted net income per common share, the denominator includes the number of additional common shares that would have been outstanding if the Company’s outstanding dilutive stock options and performance share rights had been exercised, as determined pursuant to the treasury stock method.
The following table sets forth the computation of basic and diluted net income per common share:
| (in thousands, except per share amounts) |
2010 | 2009 | 2008 | |||||||||
| Basic Net Income Per Share: |
||||||||||||
| Net income |
$ | 358,135 | $ | 291,266 | $ | 233,073 | ||||||
| Weighted average number of shares outstanding |
135,745 | 139,894 | 140,193 | |||||||||
| Net income per common share — basic |
$ | 2.64 | $ | 2.08 | $ | 1.66 | ||||||
| Diluted Net Income Per share: |
||||||||||||
| Net income |
$ | 358,135 | $ | 291,266 | $ | 233,073 | ||||||
| Weighted average number of shares outstanding |
135,745 | 139,894 | 140,193 | |||||||||
| Effect of dilutive securities — stock options |
406 | 262 | 47 | |||||||||
| Effect of dilutive securities — performance share rights |
445 | 366 | 254 | |||||||||
| Weighted average shares — diluted |
136,596 | 140,522 | 140,494 | |||||||||
| Net income per common share — diluted |
$ | 2.62 | $ | 2.07 | $ | 1.66 | ||||||
| 14. | Comprehensive Income: |
The following table provides a reconciliation of net income to comprehensive income. The unrealized gains and losses on investment securities are shown net of tax ($1.2 million income tax expense in fiscal 2010, $2.5 million income tax benefit in fiscal 2009 and $3.0 million income tax benefit in fiscal 2008).
| Years Ended | ||||||||||||
| (in thousands) |
August 28, 2010 | August 29, 2009 | August 30, 2008 | |||||||||
| Net income |
$ | 358,135 | $ | 291,266 | $ | 233,073 | ||||||
| Other comprehensive income (loss): |
||||||||||||
| Unrealized gains (losses) on investment securities |
1,914 | (4,626 | ) | (4,862 | ) | |||||||
| Reclassification adjustment for (gains) losses realized in net income |
— | 528 | — | |||||||||
| Comprehensive income |
$ | 360,049 | $ | 287,168 | $ | 228,211 | ||||||
55
Table of Contents
| 15. | Segment Information: |
The Company operates a chain of more than 6,800 general merchandise retail discount stores in 44 states, serving the basic needs of customers primarily in the low- and middle-income brackets. The stores are supported by nine distribution centers and one corporate headquarters. All of the stores operate under the Family Dollar name and are substantially the same in terms of size, merchandise, customers, distribution and operations. The Company has no franchised locations, foreign operations or other lines of business. The Company manages the business on the basis of one operating segment and therefore, has only one reportable segment. The following table presents net sales by classes of similar products.
| Years Ended | ||||||||||||
| (in thousands) |
August 28, 2010 | August 29, 2009 | August 30, 2008 | |||||||||
| Classes of similar products: |
||||||||||||
| Consumables |
$ | 5,119,911 | $ | 4,764,835 | $ | 4,263,681 | ||||||
| Home Products |
1,035,944 | 988,550 | 1,002,110 | |||||||||
| Apparel and Accessories |
840,929 | 831,321 | 915,155 | |||||||||
| Seasonal and Electronics |
870,187 | 815,900 | 802,682 | |||||||||
| Net Sales |
$ | 7,866,971 | $ | 7,400,606 | $ | 6,983,628 | ||||||
The following table describes the Company’s product categories in more detail:
| Consumables |
Household chemicals | |||
| Paper products | ||||
| Food, including candy and snacks | ||||
| Health and beauty aids | ||||
| Hardware and automotive supplies | ||||
| Pet food and supplies | ||||
| Home Products |
Domestics, including blankets, sheets and towels | |||
| Housewares | ||||
| Giftware | ||||
| Home décor | ||||
| Apparel and Accessories |
Men’s clothing | |||
| Women’s clothing | ||||
| Boys’ and girls’ clothing | ||||
| Infants’ clothing | ||||
| Shoes | ||||
| Fashion accessories | ||||
| Seasonal and Electronics |
Toys | |||
| Stationery and school supplies | ||||
| Seasonal goods | ||||
| Personal electronics, including pre-paid cellular phones and services | ||||
56
Table of Contents
| 16. | Unaudited Summaries of Quarterly Results: |
| (in thousands, except per share amounts) |
First Quarter | Second Quarter | Third Quarter | Fourth Quarter | ||||||||||||
| 2010 |
||||||||||||||||
| Net sales |
$ | 1,822,906 | $ | 2,090,230 | $ | 1,996,989 | $ | 1,956,846 | ||||||||
| Gross profit |
658,222 | 740,831 | 730,228 | 678,719 | ||||||||||||
| Net income |
67,621 | 112,209 | 104,351 | 73,954 | ||||||||||||
| Net income per common share(1) |
$ | 0.49 | $ | 0.81 | $ | 0.77 | $ | 0.56 | ||||||||
| 2009 |
||||||||||||||||
| Net sales |
$ | 1,753,833 | $ | 1,992,260 | $ | 1,843,089 | $ | 1,811,424 | ||||||||
| Gross profit |
614,453 | 671,304 | 667,192 | 625,256 | ||||||||||||
| Net income |
59,289 | 84,140 | 87,721 | 60,116 | ||||||||||||
| Net income per common share(1) |
$ | 0.42 | $ | 0.60 | $ | 0.62 | $ | 0.43 | ||||||||
| (1) | Figures represent diluted earnings per share. The sum of the quarterly net income per common share may not equal the annual net income per common share due to rounding. |
| 17. | Related Party Transactions: |
There were no material related party transactions during fiscal 2010 or fiscal 2009. Related party transactions totaled approximately $0.8 million during fiscal 2008. The related party transactions during fiscal 2008 were for Company purchases of merchandise in the ordinary course of business from entities owned or represented by non-employee family members of the Company’s Chairman of the Board and Chief Executive Officer.
| 18. | Subsequent Events: |
On September 29, 2010, the Company announced that the Board of Directors authorized the Company to purchase up to $750 million of the Company’s outstanding common stock. The remaining amount under the previous authorization was cancelled. On October 5, 2010, the Company entered into an accelerated share repurchase agreement with a large financial institution for $250.0 million. See Note 12 above for more information.
57
Table of Contents
ITEM 9. CHANGES IN AND DISAGREEMENTS WITH ACCOUNTANTS ON ACCOUNTING AND FINANCIAL DISCLOSURE
None.
ITEM 9A. CONTROLS AND PROCEDURES
Disclosure Controls and Procedures
We maintain disclosure controls and procedures that are designed to provide reasonable assurance that information required to be disclosed in our periodic reports to the Securities and Exchange Commission (“SEC”) is recorded, processed, summarized and reported within the time periods specified in the SEC’s rules and forms and that such information is accumulated and communicated to management, including our Chief Executive Officer and Chief Financial Officer, as appropriate to allow timely decisions regarding required disclosures.
We evaluated the design and operating effectiveness of our disclosure controls and procedures as of August 28, 2010. This evaluation was performed under the supervision and with the participation of management, including our Chief Executive Officer and Chief Financial Officer. Based on this evaluation, the Chief Executive Officer and Chief Financial Officer concluded that our disclosure controls and procedures were effective as of August 28, 2010.
Management’s Report on Internal Control Over Financial Reporting
Management is responsible for establishing and maintaining adequate internal control over financial reporting for the Company. Internal control over financial reporting is a process designed to provide reasonable assurance regarding the reliability of financial reporting and the preparation of financial statements for external purposes in accordance with generally accepted accounting principles. Internal control over financial reporting includes those policies and procedures that: (i) pertain to the maintenance of records that in reasonable detail accurately and fairly reflect the transactions and dispositions of the assets of the Company; (ii) provide reasonable assurance that transactions are recorded as necessary to permit preparation of financial statements in accordance with generally accepted accounting principles, and that receipts and expenditures of the Company are made only in accordance with authorizations of management and directors of the Company; and (iii) provide reasonable assurance regarding prevention or timely detection of unauthorized acquisition, use, or disposition of the Company’s assets that could have a material effect on the financial statements.
Because of its inherent limitations, internal control over financial reporting may not prevent or detect misstatements. Also, projections of any evaluation of effectiveness to future periods are subject to the risk that controls may become inadequate because of changes in conditions or that the degree of compliance with the policies or procedures may deteriorate.
Management (with the participation of the principal executive officer and principal financial officer) conducted an evaluation of the effectiveness of the Company’s internal control over financial reporting based on the framework in Internal Control — Integrated Framework issued by the Committee of Sponsoring Organizations of the Treadway Commission (COSO). Based on this evaluation, management concluded that the Company’s internal control over financial reporting was effective as of August 28, 2010.
PricewaterhouseCoopers LLP, the independent registered public accounting firm that audited the Consolidated Financial Statements included in this Annual Report on Form 10-K, has also audited the effectiveness of the Company’s internal control over financial reporting as of August 28, 2010, as stated in their attestation report which is included under Item 8 of this Report.
Attestation Report of the Registered Public Accounting Firm
Included in Item 8 of this Report.
Changes in Internal Control over Financial Reporting
There were no changes in the Company’s internal control over financial reporting during the Company’s fourth fiscal quarter that have materially affected, or are reasonably likely to materially affect, the Company’s internal control over financial reporting.
None
58
Table of Contents
PART III
ITEM 10. DIRECTORS, EXECUTIVE OFFICERS AND CORPORATE GOVERNANCE
The information required by this item as to the Company’s directors, director nominees, audit committee financial expert, audit committee, and procedures for stockholders to recommend director nominees will be included in the Company’s proxy statement to be filed for the Annual Meeting of Stockholders to be held in January 2011 (the “2011 Proxy Statement”), under the captions “Election of Directors” and “Corporate Governance Matters and Committees of the Board of Directors” and is incorporated by reference herein. The information required by this item as to compliance by the Company’s directors, executive officers and beneficial owners of the Company’s Common Stock with Section 16(a) of the Securities Exchange Act of 1934 also will be included in the 2011 Proxy Statement under the caption “Section 16(a) Beneficial Ownership Reporting Compliance” and also is incorporated herein by reference.
Executive Officers
The section entitled “Executive Officers” in Part I of this Report is incorporated by reference herein.
Code of Ethics
The Company has adopted: (i) a Code of Ethics that applies to the principal executive officer and senior financial officers, including the principal financial officer, the principal accounting officer and the controller; (ii) a Code of Business Conduct that governs the actions of all Company employees, including officers; and (iii) a Board of Directors Code of Business Conduct applicable to all directors (collectively the “Codes of Conduct”). The Codes of Conduct are posted in the Investors section of the Company’s website at www.familydollar.com. The Company will provide a copy of the Codes of Conduct to any stockholder upon request. Any amendments to and/or any waiver from a provision of any of the Codes of Conduct granted to any director, executive officer or any senior financial officer, must be approved by the Board of Directors and will be disclosed on the Company’s website within three business days following the amendment or waiver. The information contained on or connected to the Company’s website is not incorporated by reference into this Form 10-K and should not be considered part of this or any other report that the Company files with or furnishes to the SEC.
ITEM 11. EXECUTIVE COMPENSATION
The information required by this item will be included in the Company’s 2011 Proxy Statement, under the captions “Compensation Discussion and Analysis,” “2010 Summary Compensation Table,” “2010 Grants of Plan-Based Awards,” “Employment and Severance Agreements,” “2010 Outstanding Equity Awards at Fiscal Year End,” “2010 Option Exercises and Stock Vested,” “Non-Qualified Deferred Compensation,” “Potential Payments upon Termination or Change in Control,” “Director Compensation,” and “Compensation Committee Report” and is incorporated herein by reference.
ITEM 12. SECURITY OWNERSHIP OF CERTAIN BENEFICIAL OWNERS AND MANAGEMENT AND RELATED STOCKHOLDER MATTERS
The information required by this item as to security ownership by beneficial owners and management will be included in the Company’s 2011 Proxy Statement, under the caption “Ownership of the Company’s Securities” and is incorporated herein by reference. The information required by this item as to securities authorized for issuance under equity compensation plans also will be included in said proxy statement under the caption “Equity Compensation Plan Information” and is also incorporated herein by reference.
ITEM 13. CERTAIN RELATIONSHIPS AND RELATED TRANSACTIONS, AND DIRECTOR INDEPENDENCE
The information required by this item will be included in the Company’s 2011 Proxy Statement, under the captions “Transactions with Related Persons” and “Corporate Governance Matters and Committees of the Board of Directors” and is incorporated herein by reference.
ITEM 14. PRINCIPAL ACCOUNTING FEES AND SERVICES
The information required by this item will be included in the Company’s 2011 Proxy Statement, under the caption “Independent Registered Public Accounting Firm’s Fees and Services” and is incorporated herein by reference.
59
Table of Contents
PART IV
ITEM 15. EXHIBITS AND FINANCIAL STATEMENT SCHEDULES
| (a) | Documents filed as part of this report: |
| 1. | See Part II – Item 8 – “Financial Statements and Supplementary Data – Index to Consolidated Financial Statements”, of this Report. |
| 2. | All schedules for which provision is made in the applicable accounting regulations of the SEC are not required under the related instructions, are inapplicable or the information is included in the Consolidated Financial Statements, and therefore, have been omitted. |
The Financial Statements of Family Dollar Stores, Inc., (Parent Company) are omitted because the registrant is primarily a holding company and all subsidiaries included in the consolidated financial statements being filed, in the aggregate, do not have minority equity and/or indebtedness to any person other than the registrant or its consolidated subsidiaries in amounts which together exceed 5 percent of the total assets as shown by the most recent year-end consolidated balance sheet.
| 3. | The Exhibits listed below in item (b). |
| (b) | The accompanying Index to Exhibits is incorporated herein by reference. |
60
Table of Contents
SIGNATURES
Pursuant to the requirements of Section 13 or 15(d) of the Securities Exchange Act of 1934, the registrant has duly caused this report to be signed on its behalf by the undersigned, thereunto duly authorized.
| FAMILY DOLLAR STORES, INC. | ||||
| (Registrant) | ||||
| Date: October 26, 2010 |
By | /s/ Howard R. Levine | ||
| Howard R. Levine | ||||
| Chairman of the Board (Chief Executive Officer) | ||||
Pursuant to the requirements of the Securities Exchange Act of 1934, this report has been signed by the following persons on behalf of the registrant and in the capacities and on the date indicated.
| Signature |
Title |
Date | ||
| /s/ Howard R. Levine Howard R. Levine |
Chairman of the Board, Chief Executive Officer and Director (Principal Executive Officer) |
October 26, 2010 | ||
| /s/ Kenneth T. Smith Kenneth T. Smith |
Senior Vice President- Chief Financial Officer (Principal Financial Officer) |
October 26, 2010 | ||
| /s/ C. Martin Sowers C. Martin Sowers |
Senior Vice President-Finance (Principal Accounting Officer) |
October 26, 2010 | ||
| /s/ Mark R. Bernstein Mark R. Bernstein |
Director |
October 26, 2010 | ||
| /s/ Pamela L. Davies Pamela L. Davies |
Director |
October 26, 2010 | ||
| /s/ Sharon Allred Decker Sharon Allred Decker |
Director |
October 26, 2010 | ||
| /s/ Edward C. Dolby Edward C. Dolby |
Director |
October 26, 2010 | ||
| /s/ Glenn A. Eisenberg Glenn A. Eisenberg |
Director |
October 26, 2010 | ||
| /s/ George R. Mahoney, Jr. George R. Mahoney, Jr. |
Director |
October 26, 2010 | ||
| /s/ James G. Martin James G. Martin |
Director |
October 26, 2010 | ||
| /s/ Harvey Morgan Harvey Morgan |
Director |
October 26, 2010 | ||
| /s/ Dale C. Pond Dale C. Pond |
Director |
October 26, 2010 | ||
61
Table of Contents
EXHIBIT INDEX
Exhibits incorporated by reference:
| 3.1 | Restated Certificate of Incorporation, dated November 8, 2006 (filed as Exhibit 3.1 to the Company’s Report on Form 10-K for the fiscal year ended August 26, 2006) | |||
| 3.2 | Bylaws (filed as Exhibit 3.2 (a) to the Company’s Report on Form 8-K filed with the SEC on August 22, 2008) | |||
| 4.1 | Sections FOURTH, SIXTH and SEVENTH of the Company’s Restated Certificate of Incorporation (included as Exhibit 3.1) and Articles II, VII, VIII, XII and XIV of the Company’s Bylaws (included as Exhibit 3.2) | |||
| 4.2 | Form of certificate representing shares of the Company’s Common Stock (filed as Exhibit 4.2 to the Company’s Form 10-K filing for the fiscal year ended August 27, 2005) | |||
| 10.1 | Note Purchase Agreement dated as of September 27, 2005, between Family Dollar Stores, Inc., Family Dollar, Inc., and the various purchasers named therein, relating to $169,000,000 5.41% Series 2005-A Senior Notes, Tranche A, due September 27, 2015; and, $81,000,000 5.24% Series 2005-A Senior Notes, Tranche B, due September 27, 2015 (filed as Exhibit 10.2 to the Company’s Form 10-Q for the quarter ended February 27, 2010) | |||
| 10.2 | $350,000,000 Credit Agreement dated August 24, 2006, between the Company and Family Dollar, Inc., as Borrowers, and Wachovia Bank, National Association, as Administrative Agent, Swingline Lender and Fronting Bank, and various other Lenders named therein (filed as Exhibit 10 to the Company’s Report on Form 8-K filed with the SEC on August 28, 2006) | |||
| 10.3 | $250 million 364-Day Credit Agreement between the Company and Family Dollar, Inc., as Borrowers, and Wachovia Bank, National Association, as Administrative Agent and Swingline Lender, and various other lenders named therein (filed as Exhibit 10.3 to the Company’s Form 10-Q for the quarter November 28, 2009) | |||
| * | 10.4 | Retirement Agreement dated September 30, 2002, between the Company and Leon Levine (filed as Exhibit 10 to the Company’s Report on Form 8-K filed with the SEC on October 2, 2002) | ||
| * | 10.5 | Policy Regarding Tax Adjustments for Certain Severance Benefits (filed as Exhibit 10.2 to the Company’s Report on Form 8-K filed with the SEC on November 21, 2008) | ||
| * | 10.6 | Form of Indemnification Agreement between the Company and its Directors (filed as Exhibit 10.1 to the Company’s Report on Form 8-K filed with the SEC on November 21, 2008) | ||
| * | 10.7 | Employment Agreement effective October 7, 2008, between the Company and Howard R. Levine (filed as Exhibit 10.1 to the Company’s Report on Form 8-K filed with the SEC on October 14, 2008) | ||
| * | 10.8 | Employment Agreement effective October 7, 2008, between the Company and R. James Kelly (filed as Exhibit 10.2 to the Company’s Report on Form 8-K filed with the SEC on October 14, 2008) | ||
| * | 10.9 | Form of Severance Agreement for Executive Vice Presidents (filed as Exhibit 10.3 to the Company’s Report on Form 8-K filed with the SEC on October 14, 2008) | ||
| * | 10.10 | Form of Severance Agreement for Senior Vice Presidents (filed as Exhibit 10.4 to the Company’s Report on Form 8-K filed with the SEC on October 14, 2008) | ||
| * | 10.11 | Medical Expense Reimbursement Plan, amended as of November 2, 2004 (filed as Exhibit 10(v) to the Company’s Form 10-K for the fiscal year ended August 28, 2004) | ||
| * | 10.12 | Summary of Family Dollar Stores, Inc., Executive Supplemental Disability Income Plan (filed as Exhibit 10.25 to the Company’s Form 10-K for the fiscal year ended August 27, 2005) | ||
| * | 10.13 | Family Dollar Stores, Inc., Executive Life Plan (filed as Exhibit 10.26 to the Company’s Form 10-K for the fiscal year ended August 27, 2005) | ||
| * | 10.14 | Relocation Policy applicable to executive officers of the Company (filed as Exhibit 10.27 to the Company’s Form 10-K for the fiscal year ended August 27, 2005) | ||
| * | 10.15 | Amended and Restated Family Dollar Compensation Deferral Plan (filed as Exhibit 10.3 to the Company’s Form 10-Q for the quarter ended March 1, 2008) | ||
62
Table of Contents
| * | 10.16 | Summary of compensation arrangements of the Company’s named executive officers for fiscal 2010 (filed under Item 5.02 in the Company’s Report on Form 8-K filed with the SEC on October 16, 2009) | ||
| * | 10.17 | Summary of compensation arrangements of the Company’s named executive officers for fiscal 2011 (filed under Item 5.02 in the Company’s Report on Form 8-K filed with the SEC on October 15, 2010) | ||
| * | 10.18 | Family Dollar Stores, Inc., 2006 Incentive Plan (filed as Exhibit 10.4 to the Company’s Form 10-Q filed with the SEC on January 7, 2009) | ||
| * | 10.19 | Family Dollar Stores Inc., 2006 Incentive Plan Directors’ Share Awards Guidelines (filed as Exhibit 10.1 to the Company’s Report on Form 8-K filed with the SEC on August 21, 2006) | ||
| * | 10.20 | Family Dollar Stores Inc., 2006 Incentive Plan 2006 Non-Qualified Stock Option Grant Program (filed as Exhibit 10.3 to the Company’s Report on Form 8-K filed with the SEC on January 25, 2006) | ||
| * | 10.21 | Family Dollar Stores, Inc., 2006 Incentive Plan Guidelines for Annual Cash Bonus Awards (filed as Exhibit 10.2 to the Company’s Report on Form 8-K filed with the SEC on October 16, 2009) | ||
| * | 10.22 | Family Dollar Stores, Inc., 2006 Incentive Plan Guidelines for Long Term Incentive Performance Share Rights Awards (filed as Exhibit 10.1 to the Company’s Report on Form 8-K filed with the SEC on October 16, 2009) | ||
| * | 10.23 | Form of Performance Share Rights Award Certificate Awards (filed as Exhibit 10.2 to the Company’s Report on Form 8-K filed with the SEC on September 29, 2005) | ||
| * | 10.24 | Stipulation and Agreement of Compromise, Settlement and Release (filed as Exhibit 10.1 to the Company’s Report on Form 8-K filed with the SEC on June 26, 2007) | ||
| * | 10.25 | Family Dollar Stores, Inc., 1989 Non-Qualified Stock Option Plan (filed as Exhibit 10.36 to the Company’s Report on Form 10-K filed with the SEC on October 28, 2008) | ||
Exhibits filed herewith:
| ** | 10.26 | Issuer Accelerated Share Repurchase Transaction Confirmation dated October 5, 2010, between Family Dollar Stores, Inc., and Wells Fargo Bank, N.A. | ||
| 21 | Subsidiaries of the Company | |||
| 23 | Consent of Independent Registered Public Accounting Firm | |||
| 31.1 | Certification of Principal Executive Officer Pursuant to Rules 13a-14(a) and 15d-14(a) under the Securities Exchange Act of 1934, as adopted pursuant to Section 302 of the Sarbanes-Oxley Act of 2002 | |||
| 31.2 | Certification of Principal Financial Officer Pursuant to Rules 13a-14(a) and 15d-14(a) under the Securities Exchange Act of 1934, as adopted pursuant to Section 302 of the Sarbanes-Oxley Act of 2002 | |||
| 32 | Certification of Principal Executive Officer and Principal Financial Officer Pursuant to 18 U.S.C. Section 1350 as adopted pursuant to Section 906 of the Sarbanes-Oxley Act of 2002 | |||
| * | Exhibit represents a management contract or compensatory plan |
| ** | Confidential treatment has been requested with respect to certain information in this exhibit pursuant to a confidential treatment request |
63