Attached files
| file | filename |
|---|---|
| 8-K - FORM 8-K - LODGENET INTERACTIVE CORP | c60860e8vk.htm |
| EX-99.1 - EX-99.1 - LODGENET INTERACTIVE CORP | c60860exv99w1.htm |
Exhibit 99.2

| Certain statements in this presentation constitute "forward-looking statements." When used in this presentation and in the prepared remarks during our October 26th conference call, as well as in response to the questions during the conference call, the words "intends," "expects," "anticipates," "estimates," "believes," "goal," "no assurance" and similar expressions, and statements which are made in the future tense or refer to future events or developments, including, without limitation, those related to our fourth quarter 2010 guidance, including revenue, adjusted operating cash flow, and net income (loss), as well as information regarding covenant compliance and our strategic initiatives outlook, are intended to identify such forward-looking statements. Such forward-looking statements are subject to risks, uncertainties and other factors that could cause the actual results, performance or achievements to be materially different from any future results, performance or achievements expressed or implied by such forward- looking statements. Such factors include, among others, the following: the effects of economic conditions, including general financial conditions; the economic condition of the lodging industry, which can be particularly affected the financial conditions referenced above, as well as by high gas prices, levels of unemployment, consumer confidence, acts or threats of terrorism and public health issues; competition from providers of similar services and from alternative systems for accessing in-room entertainment; competition from HSIA providers; changes in demand for our products and services; programming availability, timeliness, quality and costs; technological developments by competitors; developmental costs, difficulties and delays; relationships with customers and property owners, in particular as we reduce capital investment; the availability of capital to finance growth; compliance with credit facility covenants; the impact of governmental regulations; potential effects of litigation; risks of expansion into new markets; risks related to the security of our data systems; and other factors detailed, from time to time, in our filings with the Securities and Exchange Commission. For any of the foregoing reasons, our guidance and our actual financial results may not meet our expectations. These forward-looking statements speak only as of the date of this presentation. We expressly disclaim any obligation or undertaking to release publicly any updates or revisions to any forward-looking statements contained herein to reflect any change in our expectations with regard thereto or any change in events, conditions or circumstances on which any such statement is based. |

| Focus on Free Cash Flow and Strategic Growth Strategic Initiatives Positioned to Drive Future Revenue Growth Revenue per room up 12.9% With Significant Margin Expansion HD Conversions: Expected to Accelerate in Fourth Quarter Substantial Free Cash Flow $15.3 Million in Third Quarter Trailing Four Quarters Free Cash Flow = $80.0 Million Conservative Operating Plan Continues Operating Expenses down vs. Last Quarter and Last Year Lowered Average HD Investment per Upgraded Room by 22.8% Balance Sheet Strengthened Leverage Ratio Now at 3.40x (Net Debt) with $14 million in Debt Reduction Final Covenant Stepdown Achieved Third Quarter 2010 Highlights |
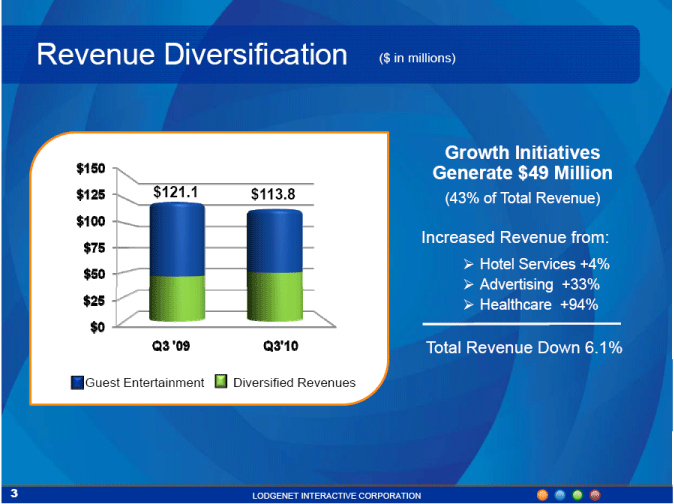
| $113.8 $121.1 Total Revenue Down 6.1% Increased Revenue from: Hotel Services +4% Advertising +33% Healthcare +94% Growth Initiatives Generate $49 Million (43% of Total Revenue) Guest Entertainment Diversified Revenues Revenue Diversification ($ in millions) |
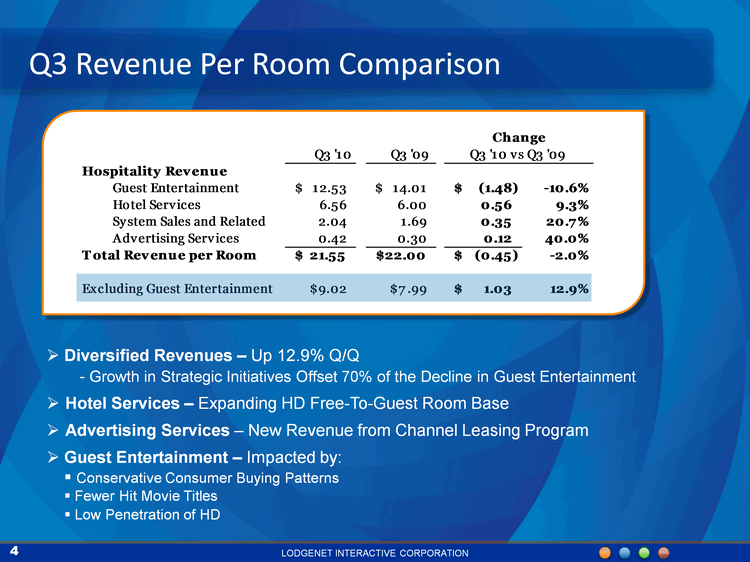
| Diversified Revenues - Up 12.9% Q/Q - Growth in Strategic Initiatives Offset 70% of the Decline in Guest Entertainment per Room Hotel Services - Expanding HD Free-To-Guest Room Base Advertising Services - New Revenue from Channel Leasing Program Guest Entertainment - Impacted by: Conservative Consumer Buying Patterns Fewer Hit Movie Titles Low Penetration of HD Q3 Revenue Per Room Comparison |

| Attractive High Definition System Economics HD Rooms = 60% Higher Revenue / Month vs. Analog Rooms 51% More Guest Entertainment 82% More TV Programming HD Room Revenue Down 0.5% (vs. prior 4 quarters) Guest Entertainment Down (0.8)% Compare: Guest Entertainment Down (10.3)% Solid Return on Capital Investment $175 to $245 Investment per Room Capital Returned within 18 to 24 Months New 5-7 Year Contracts Upon Signing / Renewal Guest Entertainment TV Programming Monthly Revenue per Room Prior Four Quarters HD Systems Now in 254,000 Rooms (Only 15% of Room Base) Significant Revenue Opportunity as HD Penetration Increases +60% |

| Q3 Gross Margin Comparison Strong Gross Margin Performance Across All Service Lines Guest Entertainment - Impacted by: Lower Hotel Commissions Lower Royalty Expense Advertising Services - Revenue Growth With Fixed Cost Structure Healthcare - Achieved 50%+ Margins with 94% Revenue Growth |
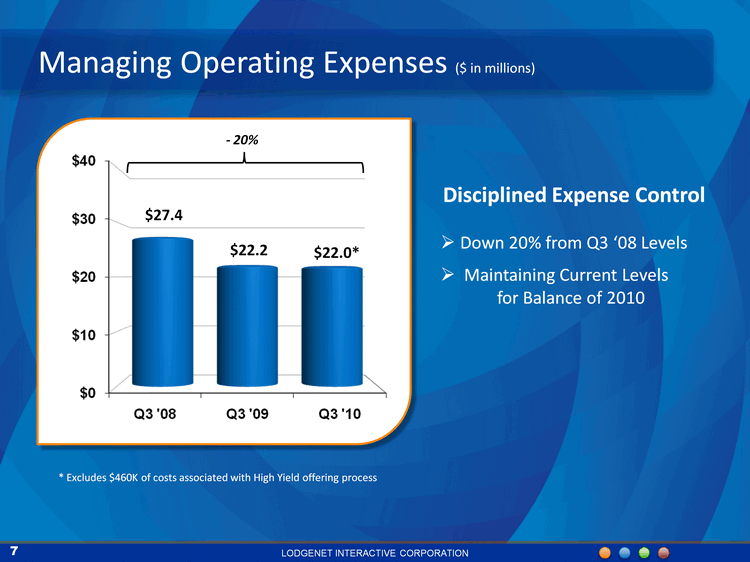
| Managing Operating Expenses ($ in millions) $22.0* $22.2 $27.4 Disciplined Expense Control Down 20% from Q3 '08 Levels Maintaining Current Levels for Balance of 2010 - 20% * Excludes $460K of costs associated with High Yield offering process |
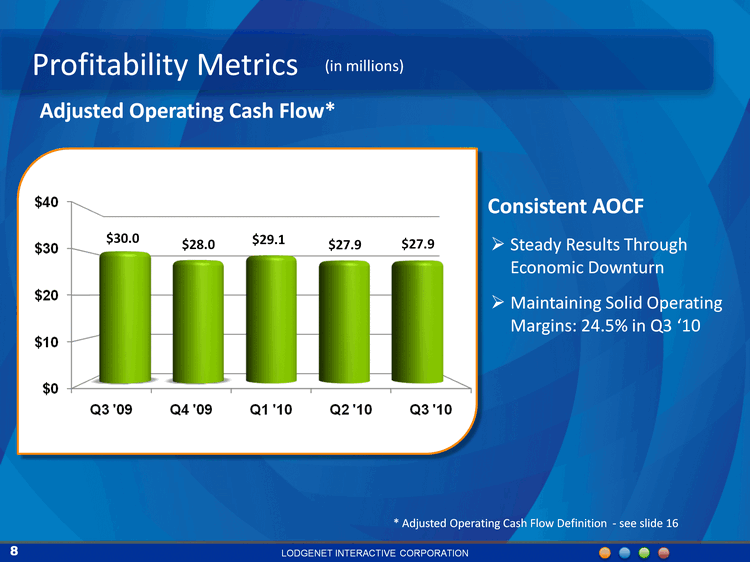
| Profitability Metrics (in millions) * Adjusted Operating Cash Flow Definition - see slide 16 Adjusted Operating Cash Flow* $27.9 $30.0 $28.0 $29.1 $27.9 Consistent AOCF Steady Results Through Economic Downturn Maintaining Solid Operating Margins: 24.5% in Q3 '10 |
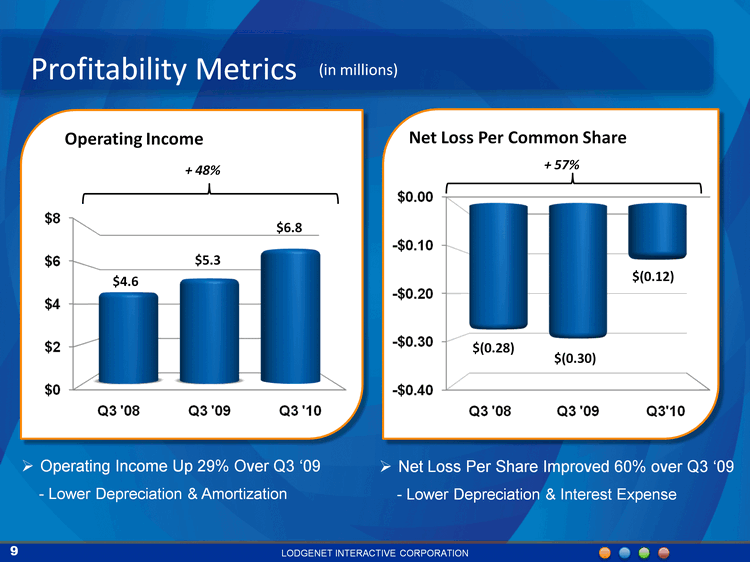
| Profitability Metrics (in millions) Operating Income Up 29% Over Q3 '09 - Lower Depreciation & Amortization v $6.8 $4.6 $5.3 $(0.28) $(0.30) $(0.12) Operating Income Net Loss Per Common Share Net Loss Per Share Improved 60% over Q3 '09 - Lower Depreciation & Interest Expense + 48% + 57% |
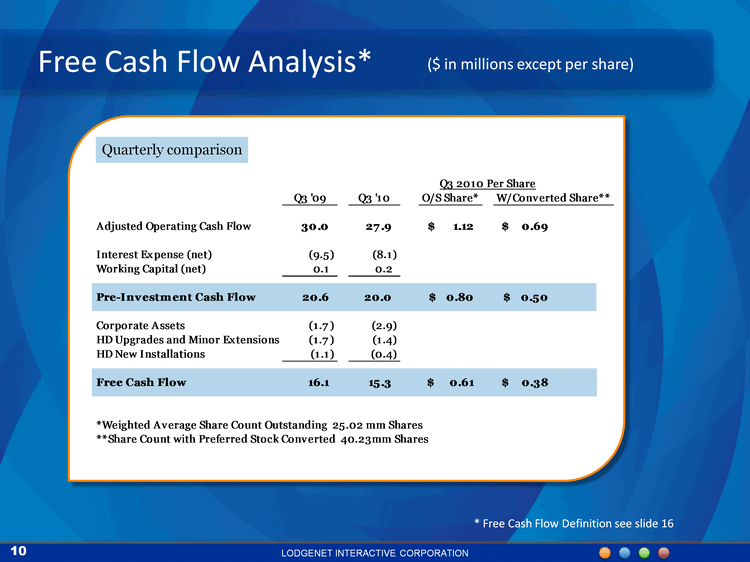
| Free Cash Flow Analysis* ($ in millions except per share) Quarterly comparison * Free Cash Flow Definition see slide 16 |
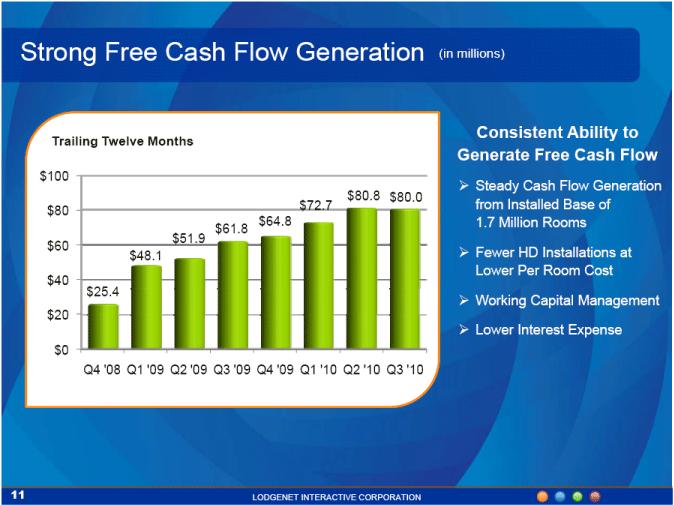
| Strong Free Cash Flow Generation Trailing Twelve Months Consistent Ability to Generate Free Cash Flow Steady Cash Flow Generation from Installed Base of 1.7 Million Rooms Fewer HD Installations at Lower Per Room Cost Working Capital Management Lower Interest Expense (in millions) |

| Decreasing Debt Levels* ($ in millions) 4.28x 3.72x 3.40x * Debt, Net of Cash Net Debt & Leverage Ratio Debt Reduced by $14 Million in Third Quarter Achieved Final Covenant Stepdown Debt at $382.4 Million (net of Cash on Balance Sheet) |

| Reducing Leverage ($ in millions) Final Covenant Step Down Achieved |
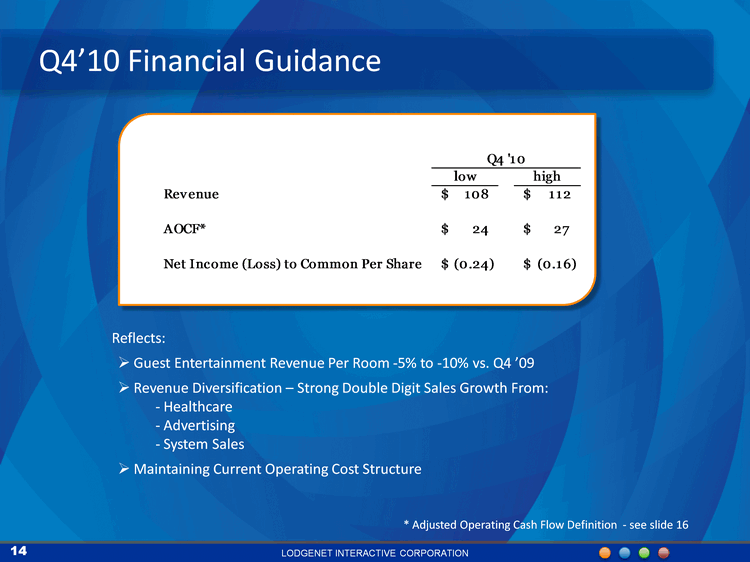
| Q4'10 Financial Guidance Reflects: Guest Entertainment Revenue Per Room -5% to -10% vs. Q4 '09 Revenue Diversification - Strong Double Digit Sales Growth From: Healthcare Advertising System Sales Maintaining Current Operating Cost Structure * Adjusted Operating Cash Flow Definition - see slide 16 |

| 2010 - 2011 Outlook Strategic Initiatives Position for Future Growth HDTV Continues to Outperform Analog Platforms Generating Nearly 60% Higher Revenues than Analog Rooms Increased Upgrade Activity Expected in Q4 and 2011 Initiatives Underway to Improve Guest Entertainment Performance - Dedicated Team Engaged to Drive Revenue and New Services Testing Program Initiated in Fourth Quarter to Identify Short-Term Opportunities Other Strategic Initiatives Represent Solid Growth Prospects - Hotel Services: Increases Driven by HDTV installs and Broadband Upgrades - Advertising Services: Solid YTD Growth Expected to Continue - Healthcare: Significant Backlog of Installations for Q4 and 2011 Envision: "Cloud Connected" Interactive Television New Opportunities from Subscription and Transactional Revenues Initial Deployments Early in 2011 |

| Reconciliation of Operating Income to Adjusted Operating Cash Flow Reconciliation of Free Cash Flow Cash from Operations Less: Cash Used for Investing Activities, including Growth-Related Capital Equals: Free Cash Flow |
