Attached files
| file | filename |
|---|---|
| 8-K - FORM 8-K - NETFLIX INC | d8k.htm |
| EX-99.1 - PRESS RELEASE - NETFLIX INC | dex991.htm |
Exhibit 99.2
Safe Harbor Statement
Today’s management commentary contains forward-looking statements relating to future events or future financial performance that involve risks and uncertainties. Actual results may differ materially from those anticipated in these statements based on a number of factors, including those identified in the company’s annual report on Form 10-K filed with the SEC on February 22, 2010.
This commentary also contains references to non-GAAP financial measures. A presentation of and reconciliation to the most directly comparable GAAP financial measure, where such can be done without unreasonable effort, can be found on our Web site at http://ir.netflix.com.
Reed Hastings, CEO, Netflix
The third quarter of 2010 was another extraordinary quarter of growth for Netflix. On a year-over-year basis, our subscriber growth was 52%, our revenue growth was 31%, and EPS grew 35%.
For Q4, we are forecasting, at the midpoint, subscriber growth of 58%, revenue growth of 33%, and EPS growth of 19%. In other words, we are forecasting even more subscriber growth in the fourth quarter.
Driving these results is the strength of our consumer streaming offering. Three years ago we were a DVD-by-mail company that offered some streaming. We are very proud to announce that by every measure we are now a streaming company, which also offers DVD-by-mail. In Q4, we’ll spend more on streaming content than DVD content, and we’ll deliver many more hours of entertainment via streaming than on DVD. More impressively, a majority of our subs will watch more content streamed from Netflix than delivered by us on DVD. DVD-by-mail shipments are still growing, but streaming for us is much larger and growing much faster.
In terms of the economics of this evolution, our revenue in Q3 grew about 30% but our disc shipments only grew about 10%, which has allowed us to take up our streaming spend. We plan to continue to drive this trend with more streaming content spend, consistent with our operating margins goals. Since we still spend over $500m per year just on postage there is plenty of
1
financial room for more investment in streaming content going forward. In a few leading markets, such as the San Francisco Bay Area, the tide has already turned, and DVD-by-mail shipments are slightly down from a year ago, while streaming usage grew dramatically and subscriber growth is strong. The virtuous cycle for us is: acquire more streaming content which helps grow our subscriber base and lessen our DVD-by-mail expense, which in turn provides us with greater financial resources to acquire more streaming content, improve the user interface and continue to grow the subscriber base.
As the reputation of Netflix streaming gains strength among consumers, we become an essential application on every internet connected device. Apple launched their terrific $99 AppleTV, and Netflix is one of the few non-Apple applications included. Similarly, Google is launching their Google TV platform, built into a Sony TV, and Netflix is a key application on the platform. Google and Apple are driving their internet platforms to the TV, which, along with Microsoft, Nintendo, and Sony game consoles, Blu-ray players, Internet TVs, and Roku’s, are making the enjoyment of internet video on the TV easier and easier.
Not only are we adding new partner devices, but we are also improving the experience on our existing partner devices. Until this week, subscribers had to insert a game disc into their PS3 or Wii to start the Netflix application. Now we have new, much improved, versions of our TV-screen UI that is directly downloadable and updatable on the Wii and PS3, with no disc required to install or operate the application.
The volume and the quality of our streaming content in the U.S. continues to grow, with big new infusions of great movies and TV episodes. In Q3, we began our long-term relationship with the studio-owned pay TV service EPIX. We have already added nearly 1,000 new titles from Paramount, MGM and Lionsgate through this new deal, with more to come. Coupled with our existing Starz deal, we now have the complete theatrical output from Sony, Disney, Paramount, Lionsgate and MGM studios. TV shows are of equal importance to our content strategy and with our recent TV content additions, TV shows are now viewed on Netflix about the same number of hours as are movies. In the quarter, we renewed and expanded our deal with NBC Universal. This includes the addition of current network series like “Parks and Recreation” and new seasons of “30 Rock” and the entire library of “Saturday Night Live.” More importantly, we added series from NBCU’s cable networks, like the USA shows “Psych” and “Monk.” Current F/X series “Archer” and “Louie, Louie,” are also now available. Our studio and Indie output
2
movie deals now cover a higher percentage of movies than any Pay TV service and we now stream the most complete offering of previous seasons of TV shows from most of the network and cable channels. Of course, there is more to come as we can afford to spend more. As we grow, we are reinvesting our additional revenue back into growing our streaming content to make it as compelling as possible and extend our competitive lead.
In Q3, we began our international expansion with our launch of the Netflix service in Canada. We are encouraged by our results, and we are on track to be profitable in Canada late next year. To review, our primary costs in serving Canadians are licensing content and marketing our service, and our revenue is from subscriptions. We break even when we have enough subscribers to cover the costs of content and marketing. If we continue to gain confidence in a large return on our Canadian investment, and we have confidence in the financial return on further geographic expansion, then we’ll look to grow beyond North America starting in the second half of 2011. In that case, we would invest approximately $50m for beyond-North-America expansion in the second half of 2011, and our addressable market would increase significantly. As I said on last quarter’s Q&A, we plan to operate the very fast growing North American business with a 12% or better annual operating margin next year, independent of our possible beyond-North-America expansion. Our advantages on a global basis are our relationships with global CE companies, our technology for dynamic personalization and streaming, our process knowledge of building an internet content subscription business, and our relationships with content companies.
The internet is naturally global in a way that isn’t true of regulated broadcast spectrum or local cable. When you look at Skype revenue or Comscore reporting of YouTube users, both representative of globally-available pure-broadband services, approximately 80% comes from outside the US. We see the upside of becoming a global broadband entertainment firm as expanding our addressable market considerably. Just as we did with our expansion from DVD-by-mail to streaming, we’ll exercise prudence in going step by step in our global expansion; for example, waiting until we have confidence in a large ROI on our Canadian expansion before going beyond North America. Other Netflix expansions, such as from DVD-by-mail to streaming, and into Canada, we’ve accomplished while at the same time increasing consolidated operating margin. The difference here is the relatively large size of the global opportunity as broadband becomes world-wide, and the competitive window that will be open only temporarily.
3
Our success with our pure streaming offering in Canada at $7.99 has encouraged us to test this model in the USA. If our results are as strong as we think they will be, then we will look to start this offering later in this Q4. Pure streaming could become our core offering in the USA, and DVD would be offered as a supplement for an additional charge, like we offer Blu-ray today. We’ll know by the holiday season if consumers would prefer this more streaming-centric approach.
The competitive landscape is continuing to evolve. There are rumors of Amazon entering subscription; Hulu Plus is in beta; and TV Everywhere is getting more widely adopted. We’ve expanded our TV show selection and have become as strong in TV shows as we are in movies. Despite the competitive environment, our 52% subscriber growth last quarter continues to underscore the compelling nature of our offering.
Looking forward to 2011, we see many of the same forces at play in 2010: video store closures, more Netflix devices, improved Netflix user-interface, more Netflix streaming content, more awareness of streaming generally, and increasing competition. Going into next year, we will be growing subscribers by over 50% year-over-year, and we’ll work hard to keep that extraordinary momentum going through 2011.
Barry McCarthy, CFO, Netflix
“Growth” was again the dominant theme in the third quarter, fueled by the broad-based appeal and rapid growth of streaming. For 9 of the last 11 quarters, subscriber growth has been accelerating. Not since the third quarter of 2006 has the year-over-year growth in ending subscribers been this fast.
Last quarter I suggested that the financial results year-to-date and our guidance through 2010 should give you confidence that the business model is working well and our financial results are solid. Our Q3 results underscore the point.
Q3 Results
Revenue growth accelerated last quarter by 670 bps on a Y/Y basis on the strength of our subscriber growth. Faster subscriber growth in the U.S., along with our growth in Canada, explains the relatively high percentage of free to paid subscribers at quarter end.
4
Gross margin of 37.7% increased by 280 bps Y/Y. Lower DVD-related costs, expressed as a percent of revenue, were the principal drivers of higher margin, despite the Y/Y increase in shipments of DVD’s. This reduction includes content, postage and labor costs. The margin expansion related to these costs more than offset the significantly higher costs of growing our streaming content library, which only reflected a partial quarter of Epix related licensing expense. An additional 63 bps of margin expansion was related to a change in the estimate of royalty rates used for the accrual of license fees for music rights.
On prior earnings calls you’ve heard Reed say there are at least two ways to invest in growth. One is to spend more on marketing. Another is to improve the value proposition of our service, either in the form of lower prices, or better service, or both. The financial expression of this interplay is the relationship between gross margin, SAC, and churn.
Record low SAC in the quarter of $19.81 and record low churn of 3.8% reflects the impact of our ongoing investment in growing the Netflix ecosystem for streamed content, which drives more organic growth, longer customer life, and more lifetime value. We expect the trend to continue.
As it relates to Q3 churn, subscriber engagement in streaming drove a 20 bps improvement in churn Q/Q and a 60 bps improvement Y/Y. Overall churn is lowest among subscribers engaged in both DVD and streaming behavior, followed by streaming only subs, followed by DVD only subs. The trend toward lower churn from streaming-related subs reflects the significant investments we’ve made to improve the overall user experience.
Lower churn, which drives greater lifetime value, and more organic growth, which drives lower SAC, are two of the ways in which we expect to recoup our investment in licensing more streamed content, which pressures gross margin, both in the U.S. and as we grow our international business.
Free cash flow of $7.8 million declined sharply on a Y/Y and Q/Q basis. Prepayment on the Epix license agreement was the primary contributor to the decline. Other than Epix, the Q3 cash flow attributes of our business remained strong, and we’ll return to more normalized FCF levels in Q4, with FCF more in line with NI.
5
We finished the quarter with $257 million in cash and short-term investments and $200 million in debt, which matures in 2017. As many of you know, we used the proceeds of the debt offering to repurchase Netflix stock.
During the quarter, we continued to use excess cash for share repurchases. In total we spent $58.6 million to purchase 530 thousand shares at an average cost of $110.
In terms of future buybacks, we have no plans to dip below $260 million in cash and cash equivalents.
Q4 Guidance
Today’s earnings release includes our revised Q4 guidance. As in prior years, we’ll release our 2011 guidance on the Q4 earnings call in January.
We expect the current momentum to continue through the fourth quarter and beyond. This explains our upwardly revised subscriber guidance for Q4. Faster subscriber growth results, in part, from our investments in licensing additional streamed content, which improves the Netflix value proposition. New license deals in the U.S. and Canada, plus a full quarter of Epix license fee expense, will pressure gross margins in Q4 and reduce operating margins somewhat from Q3 levels. Y/Y reductions in marketing spending will mostly fund the increased content spending as we balance the tradeoffs between growing even faster and short term profits.
Reed’s comments mentioned that in Q4 we’ll spend more on streaming content and deliver more hours of entertainment via streaming than on DVD. And a majority of our subs will watch more content streamed from Netflix than delivered by us on DVD. With that transition in our business from mostly DVD to mostly streaming, this will be the last quarter we report the percent of subs that streamed more than 15 minutes of streamed content in the last 91 days.
Closing Thoughts
The promise of “streaming” has become a reality faster than many of us expected. And the balance of risks and rewards that we all associated with managing the evolution of our business model across the digital divide has shifted in our favor more quickly than we forecast it would.
6
As a consequence, we have more upside in the business than ever before, both domestically and abroad.
Continuous improvements in the Netflix service have been a key component in our success. Done correctly, it drives organic growth, lower gross margin, lower SAC, lower churn and higher lifetime value.
Our overarching objective is to drive that same virtuous cycle of success in international markets. And we look forward to reporting on our progress in the years to come.
7
 Q3’10 Financial Highlights |
October 20, 2010 |
 This presentation contains forward-looking statements relating to
future
events
or
future
financial
performance
that
involve
risks
and
uncertainties. Actual results may differ materially from those
anticipated in these statements based on a number of factors,
including those identified in
the company’s annual report on Form 10-K filed with the SEC on
February 22, 2010.
This presentation also contains references to non-GAAP financial
measures. A presentation of and reconciliation to the most directly
comparable GAAP financial measure, where such can be done
without unreasonable effort,
can be found on our Web site at http://ir.netflix.com.
Forward-Looking Statements and
Non-GAAP Financial Measurements |
 Q3
Results Actual
Q3’10 Guidance
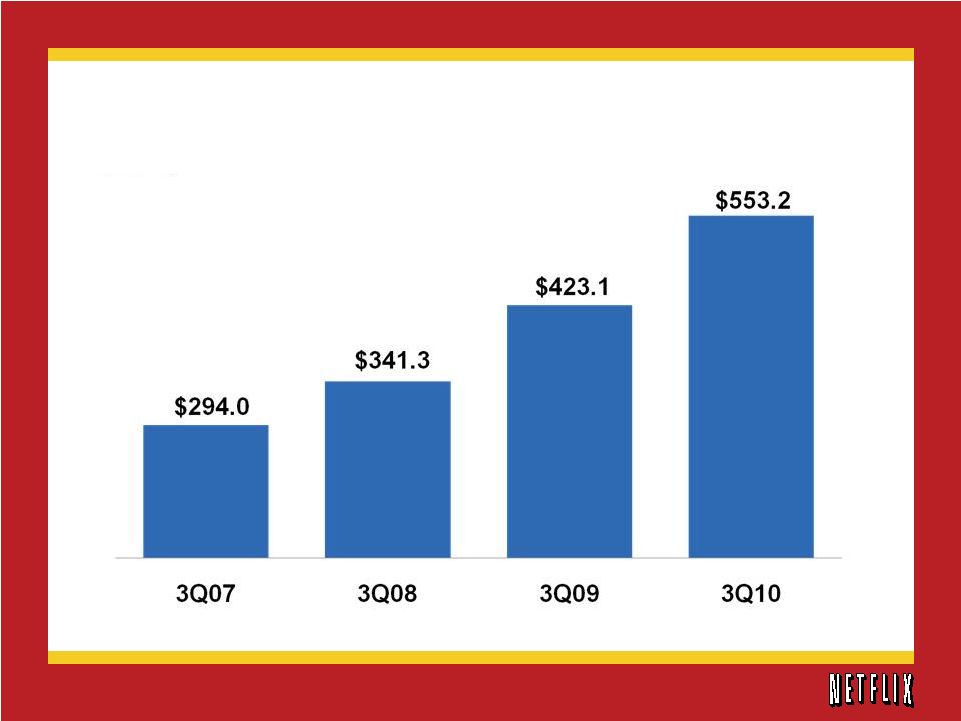
$546m
$554m
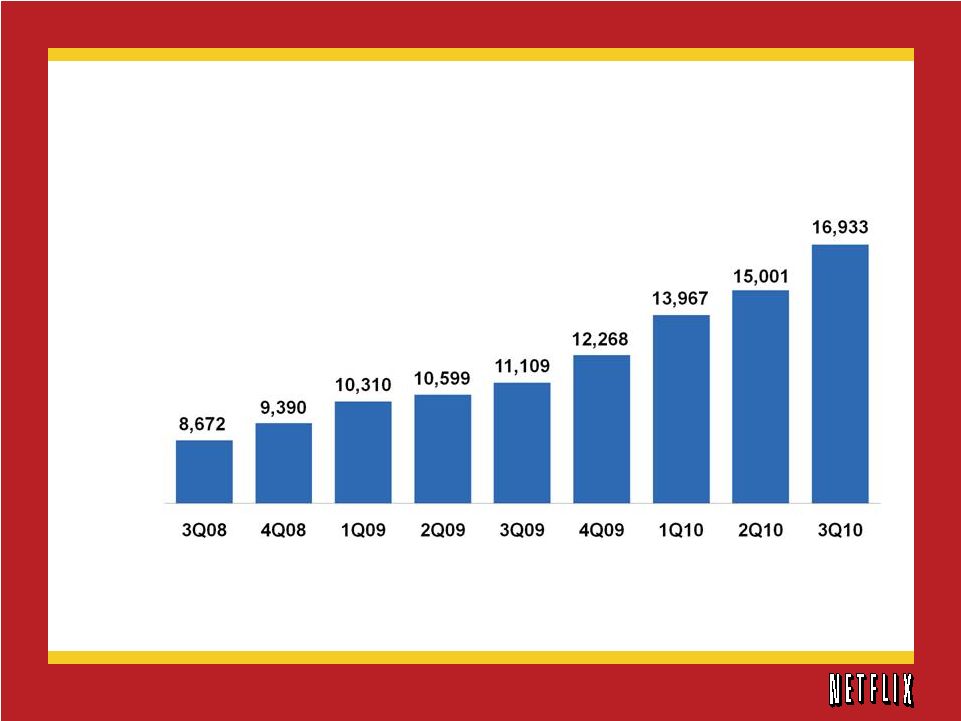
16,300k
16,700k
$33m
$40m
16,933k
$553.2m
$38.0m
Subscribers
Revenue
GAAP Net Income |
 (in
thousands) Netflix Subscribers
Subscriber Growth |
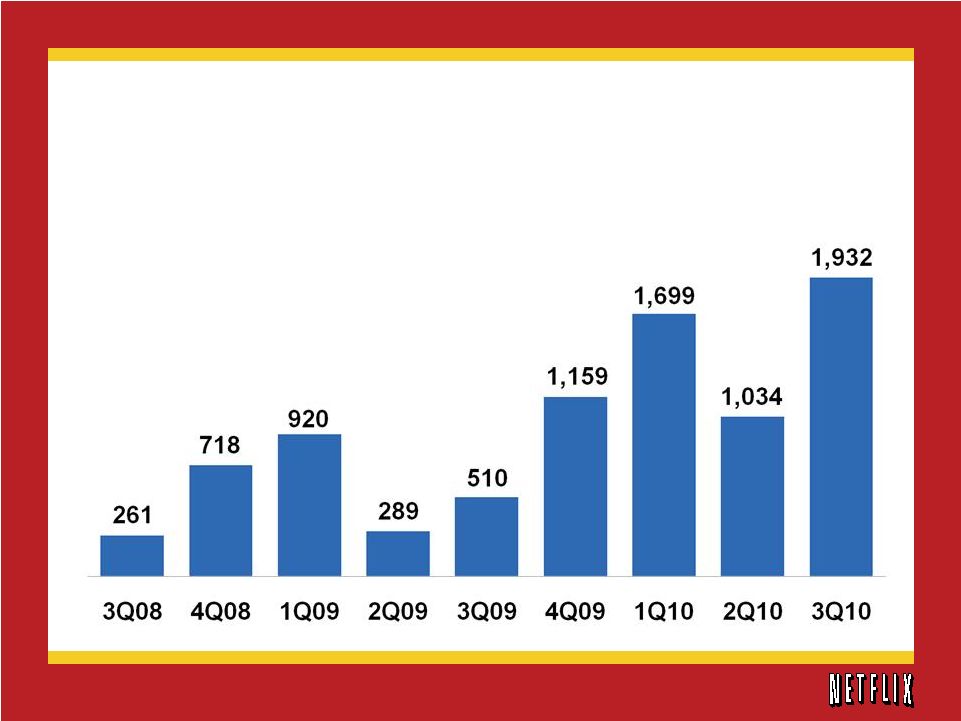 Net
Additions (in thousands)
Net Subscriber Additions |
 Note: Netflix implemented price reductions in July 2007
Q3 Revenue
(in millions)
Total Revenue |
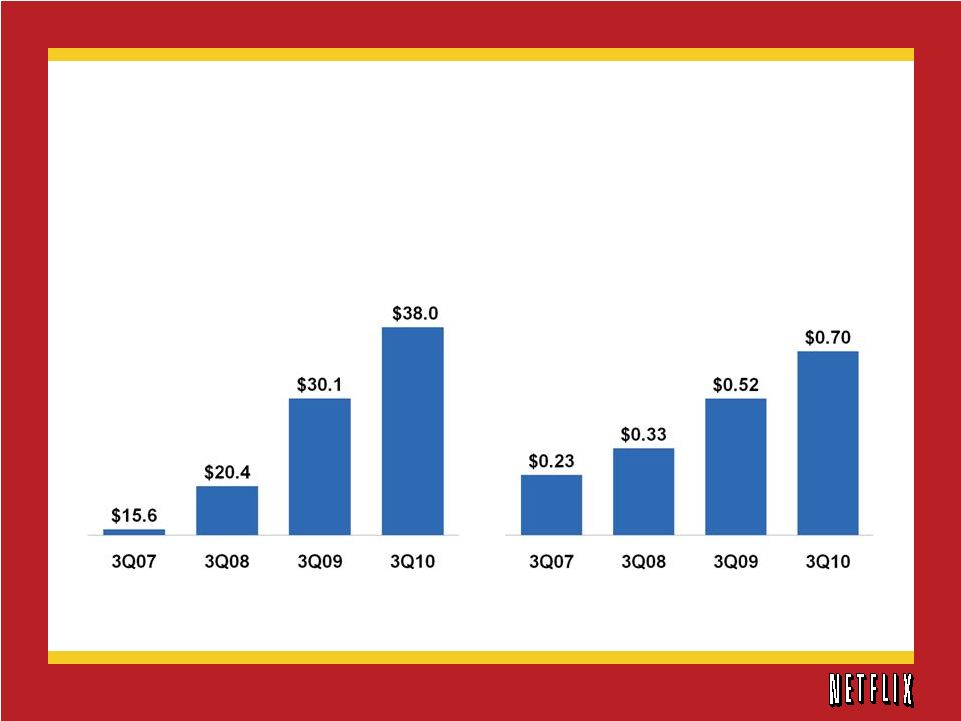 Q3
GAAP Net Income & Fully Diluted EPS (in millions)
Net Income
Earnings per Share |
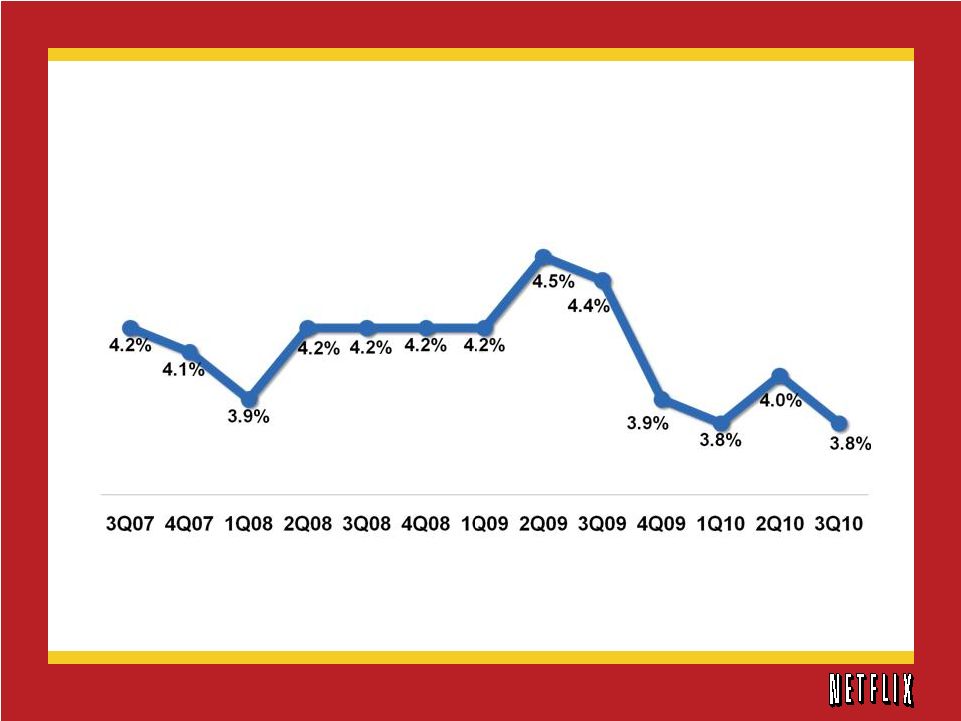 Churn |
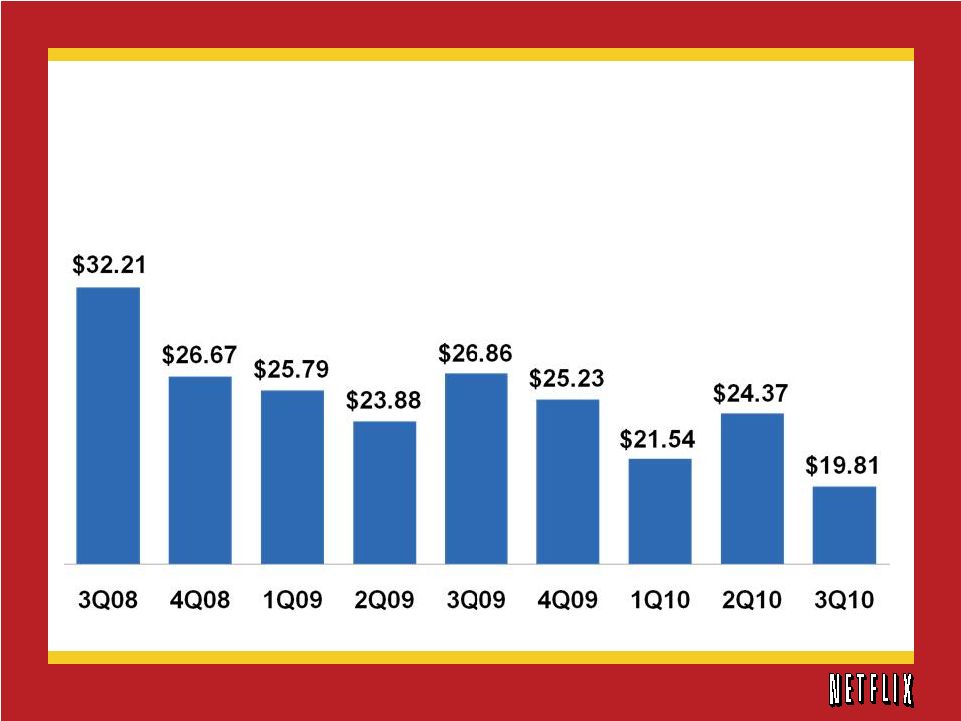 Subscriber Acquisition Cost |
 Free
Cash Flow 3Q09
4Q09
1Q10
2Q10
3Q10
Non-GAAP Free Cash Flow
Reconciliation:
Net cash provided by operating
activities
$78,311
$105,817
$77,205
$60,252
$42,227
Purchases of property and
equipment
(9,994)
(22,433)
(6,393)
(5,671)
(7,342)
Acquisition of intangible asset
(130)
(375)
Acquisitions of DVD content library
(46,273)
(57,048)
(36,902)
(24,191)
(29,900)
Proceeds from sale of DVDs
3,345
3,934
3,984
3,815
3,109
Other assets
134
(72)
(172)
10
48
Non-GAAP Free Cash Flow
$25,523
$30,198
$37,592
$34,215
$7,767
(in thousands) |
 4Q10
FY’10
Subscribers
19.0 –
19.7M
19.0 –
19.7M
Revenue
$586 –
598M
$2.15 –
2.16B
GAAP Net
Income
$32 –
40M
$146 –
154M
GAAP EPS*
$0.59 –
0.74
$2.68 –
2.83
*Fully Diluted
Business Outlook |
 2Q09
3Q09
4Q09
1Q10
2Q10
3Q10
Subscribers (M)
10.6
11.1
12.3
14.0
15.0
16.9
Y/Y Change
26%
28%
31%
35%
42%
52%
Revenue (M)
$409
$423
$445
$494
$520
$553
Y/Y Change
21%
24%
24%
25%
27%
31%
Operating Profit (M)
$53
$49
$53
$58
$77
$70
Y/Y Change
54%
45%
41%
60%
47%
41%
Net Income (M)
$32
$30
$31
$32
$44
$38
Y/Y Change
22%
48%
36%
44%
34%
26%
EPS*
$0.54
$0.52
$0.56
$0.59
$0.80
$0.70
Y/Y Change
29%
58%
47%
59%
48%
35%
% of Subscribers
Watching Instantly > 15
minutes
37%
41%
48%
55%
61%
66%
Quarterly Summary Financials
*Fully Diluted |
 2005
2006
2007
2008
2009
Mid-point of
Guidance
2010
Subscribers (M)
4.2
6.3
7.5
9.4
12.3
19.4
Y/Y Change
60%
51%
18%
26%
31%
58%
Revenue (M)
$682
$997
$1,205
$1,365
$1,670
$2,159
Y/Y Change
36%
46%
21%
13%
22%
29%
Operating Profit (M)
$3
$65
$92
$122
$192
--
Y/Y Change
-86%
2387%
41%
32%
58%
Net Income (M)
$42
$49
$67
$83
$116
$150
Y/Y Change
96%
17%
36%
25%
40%
29%
EPS*
$0.64
$0.71
$0.97
$1.32
$1.98
$2.76
Y/Y Change
94%
11%
37%
36%
50%
39%
% of Subscribers
Watching Instantly > 15
minutes
NA
NA
NA
28%
48%
--
Fiscal Year Summary Financials
*Fully Diluted |
 Q3’10 Financial Highlights |
October 20, 2010 |