Attached files
| file | filename |
|---|---|
| 8-K - POLARIS INDUSTRIES INC. 8-K - Polaris Inc. | a6472838.htm |
| EX-99.1 - EXHIBIT 99.1 - Polaris Inc. | a6472838ex99_1.htm |
Exhibit 99.2
0 Polaris Industries Inc. Third Quarter 2010 Earnings Results October 19, 2010
1 Safe Harbor Except for historical information contained herein, the matters set forth in this document, including but not limited to management’s expectations regarding 2010 sales, shipments, net income, cash flow, and manufacturing realignment transition costs and savings, are forward-looking statements that involve certain risks and uncertainties that could cause actual results to differ materially from those forward-looking statements. Potential risks and uncertainties include such factors as product offerings, promotional activities and pricing strategies by competitors; manufacturing realignment transition costs; warranty expenses; impact of changes in Polaris stock prices on incentive compensation; foreign currency exchange rate fluctuations; effects of the KTM relationship; environmental and product safety regulatory activity; effects of weather; commodity costs; uninsured product liability claims; uncertainty in the retail and wholesale credit markets; changes in tax policy and overall economic conditions, including inflation, consumer confidence and spending and relationships with dealers and suppliers. Investors are also directed to consider other risks and uncertainties discussed in our 2009 annual report and Form 10-K filed by the Company with the Securities and Exchange Commission. The Company does not undertake any duty to any person to provide updates to its forward-looking statements. The data source for retail sales figures included in this presentation is registration information provided by Polaris dealers in North America and compiled by the Company or Company estimates. The Company must rely on information that its dealers supply concerning retail sales, and other retail sales data sources and this information is subject to revision.

2 Polaris Industries Inc. 3rd Quarter 2010 Earnings Results Scott Wine CEO
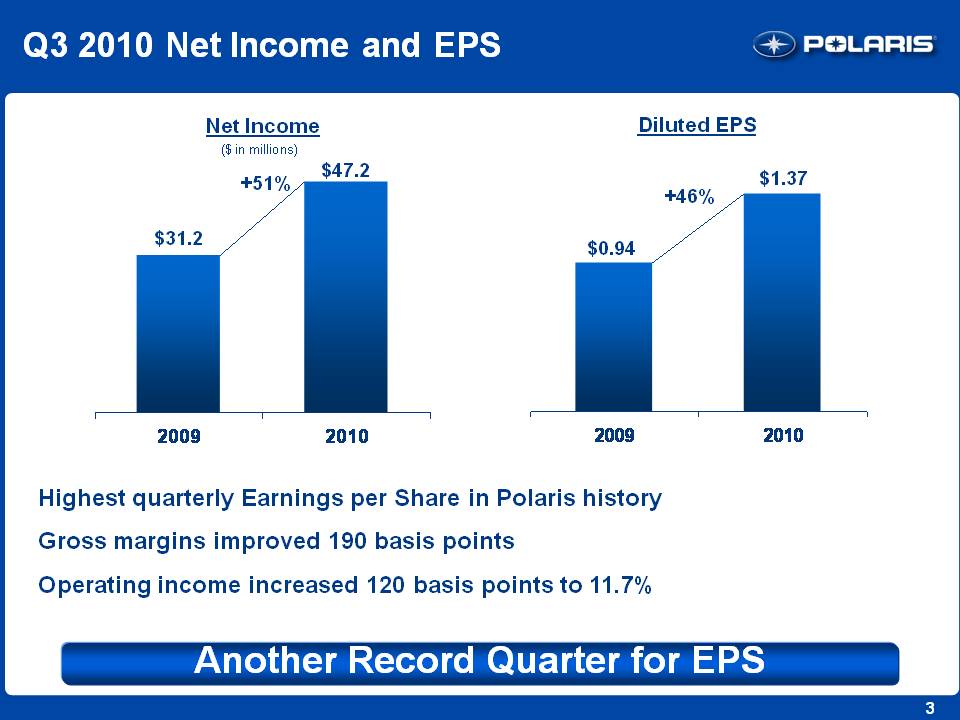
3 Q3 2010 Net Income and EPS Net Income ($ in millions) Diluted EPS $0.94 $1.37 +46% $31.2 $47.2 +51% 2009 2010 2009 2010 Highest quarterly Earnings per Share in Polaris history Gross margins improved 190 basis points Operating income increased 120 basis points to 11.7% Another Record Quarter for EPS
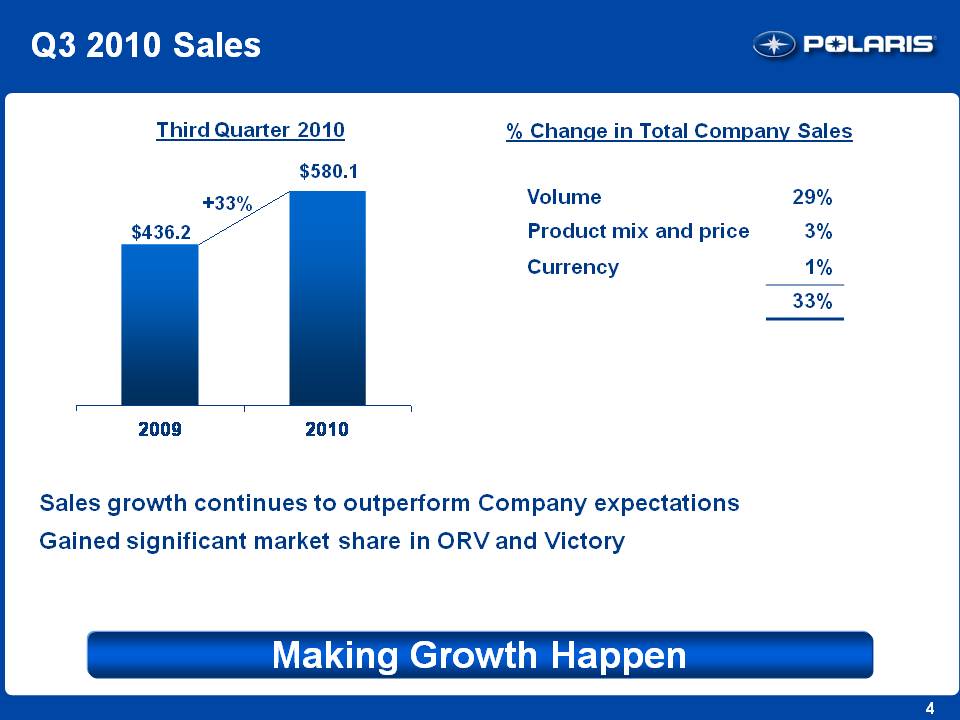
4 Q3 2010 Sales Third Quarter 2010 % Change in Total Company Sales Sales growth continues to outperform Company expectations Gained significant market share in ORV and Victory Making Growth Happen $436.2 $580.1 +33% 2009 2010 Volume 29% Product mix and price 3% Currency 1% 33%
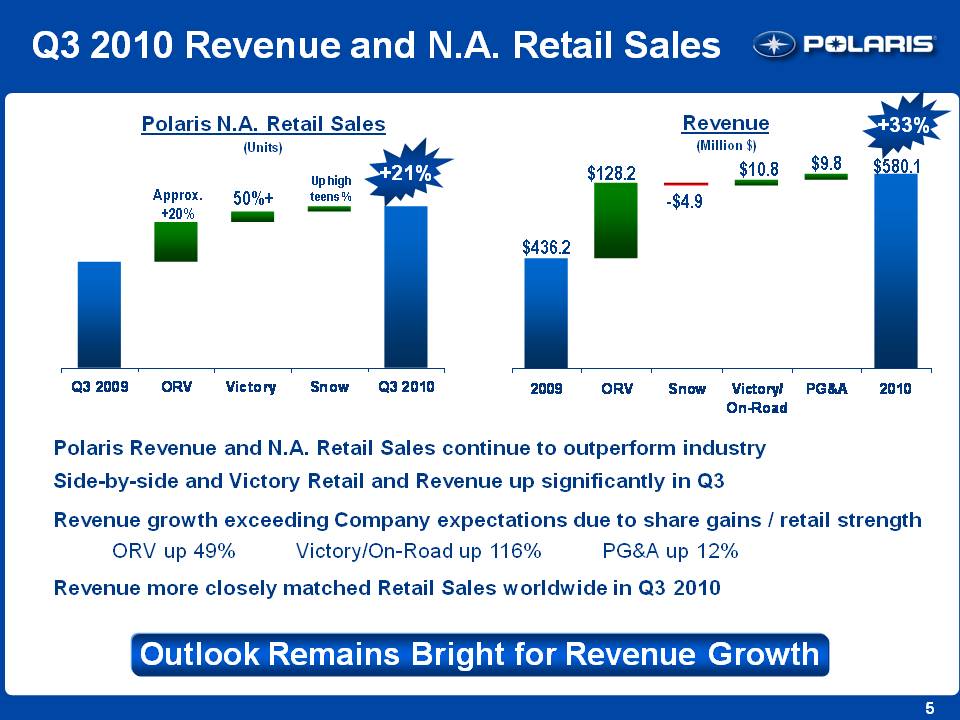
5 Q3 2010 Revenue and N.A. Retail Sales Revenue (Million $) $436.2 $128.2 -$4.9 $10.8 $9.8 $580.1 +33% 2009 ORV Snow Victory/On-Road PG&A 2010 Polaris N.A. Retail Sales (Units) Approx. +20% 50%+ Up high teens % +21% Q3 2009 ORV Victory Snow Q3 2010 Polaris Revenue and N.A. Retail Sales continue to outperform industry Side-by-side and Victory Retail and Revenue up significantly in Q3Revenue growth exceeding Company expectations due to share gains / retail strength ORV up 49% Victory/On-Road up 116% PG&A up 12% Revenue more closely matched Retail Sales worldwide in Q3 2010 Outlook Remains Bright for Revenue Growth
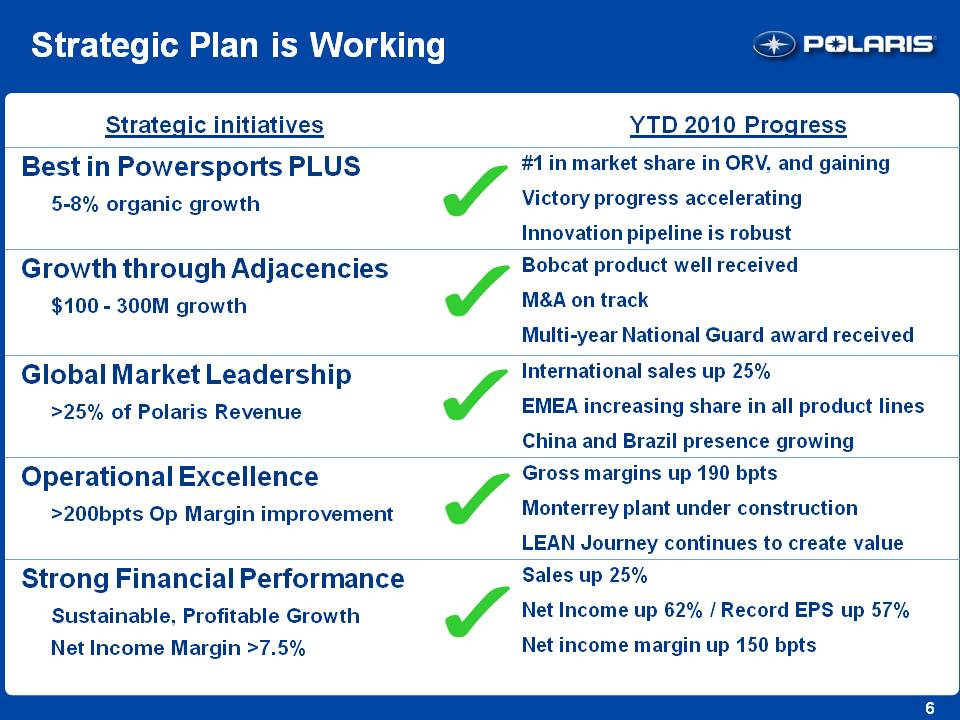
6 Strategic Plan is Working Best in Powersports PLUS 5-8% organic growth #1 in market share in ORV, and gaining Victory progress accelerating Innovation pipeline is robust Growth through Adjacencies $100 - 300M growth Bobcat product well received M&A on track Multi-year National Guard award received Global Market Leadership >25% of Polaris Revenue International sales up 25% EMEA increasing share in all product lines China and Brazil presence growing Operational Excellence >200bpts Op Margin improvement Gross margins up 190 bpts Monterrey plant under construction LEAN Journey continues to create value Strong Financial Performance Sustainable, Profitable Growth Net Income Margin >7.5% Sales up 25% Net Income up 62% / Record EPS up 57% Net income margin up 150 bpts
7 Polaris Industries Inc. 3rd Quarter 2010 Earnings Results Bennett Morgan President & COO
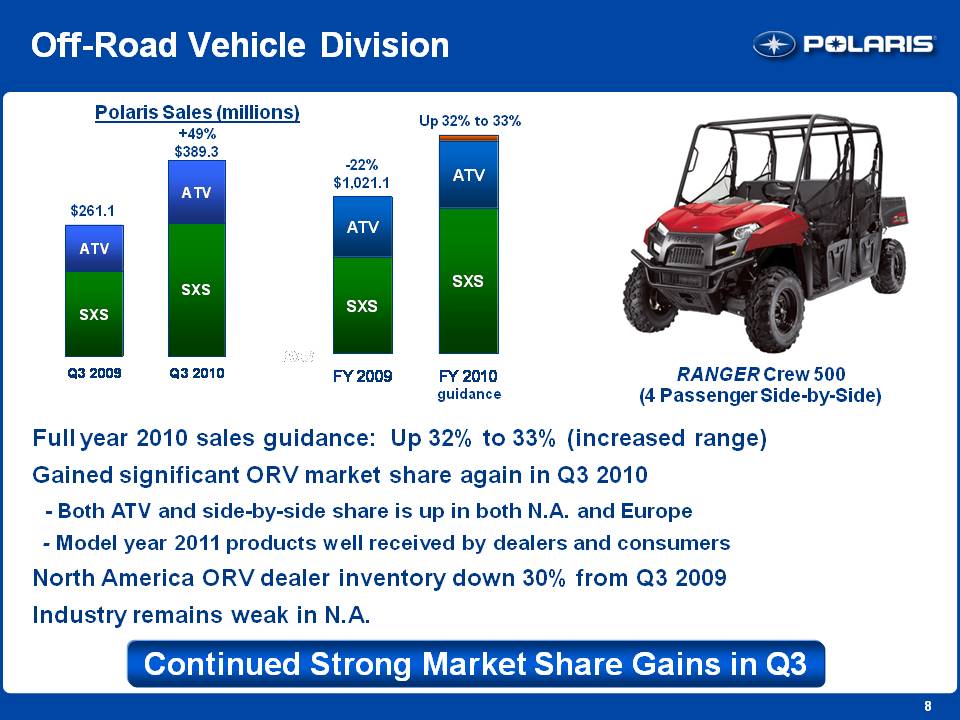
8 Off-Road Vehicle Division Polaris Sales (millions) $261.1 +49% $389.3 Q3 2009 Q3 2010 Full year 2010 sales guidance: Up 32% to 33% (increased range)Gained significant ORV market share again in Q3 2010 - Both ATV and side-by-side share is up in both N.A. and Europe - Model year 2011 products well received by dealers and consumers North America ORV dealer inventory down 30% from Q3 2009 Industry remains weak in N.A. -22% $1,021.1 Up 32% to 33% FY 2009 FY 2010 guidance RANGER Crew 500(4 Passenger Side-by-Side) Continued Strong Market Share Gains in Q3

9 Adjacencies Military / Bobcat Alliance Bobcat Strategic AllianceSourced vehicle launched Co-developed vehicle on-track to push further into Work side-by-sides Bobcat Partnership – On-track MilitaryAdded new products to serve more markets Polaris EV LSV (Low speed vehicle) RANGER dieselReceived $67 million multi-year National Guard AwardRequest for quote activity up substantially Polaris Defense – Strong Returns
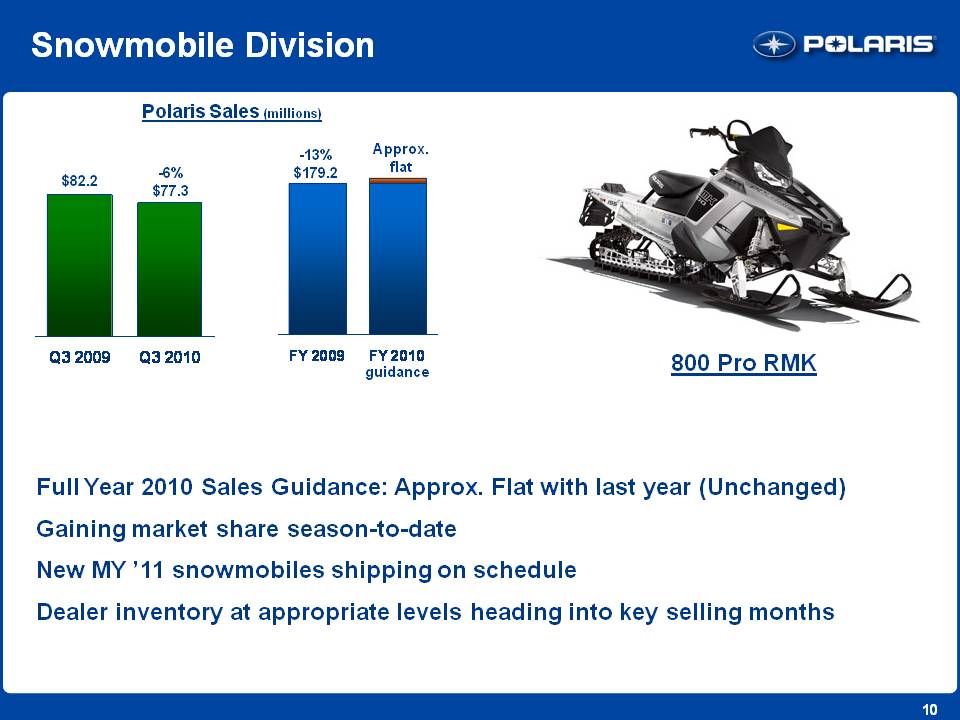
10 Snowmobile Division 800 Pro RMK Polaris Sales (millions) $82.2 -6% $77.3 Q3 2009 Q3 2010 -13% $179.2 Approx. flat FY 2009 FY 2010 guidance Full Year 2010 Sales Guidance: Approx. Flat with last year (Unchanged) Gaining market share season-to-dateNew MY ’11 snowmobiles shipping on schedule Dealer inventory at appropriate levels heading into key selling months
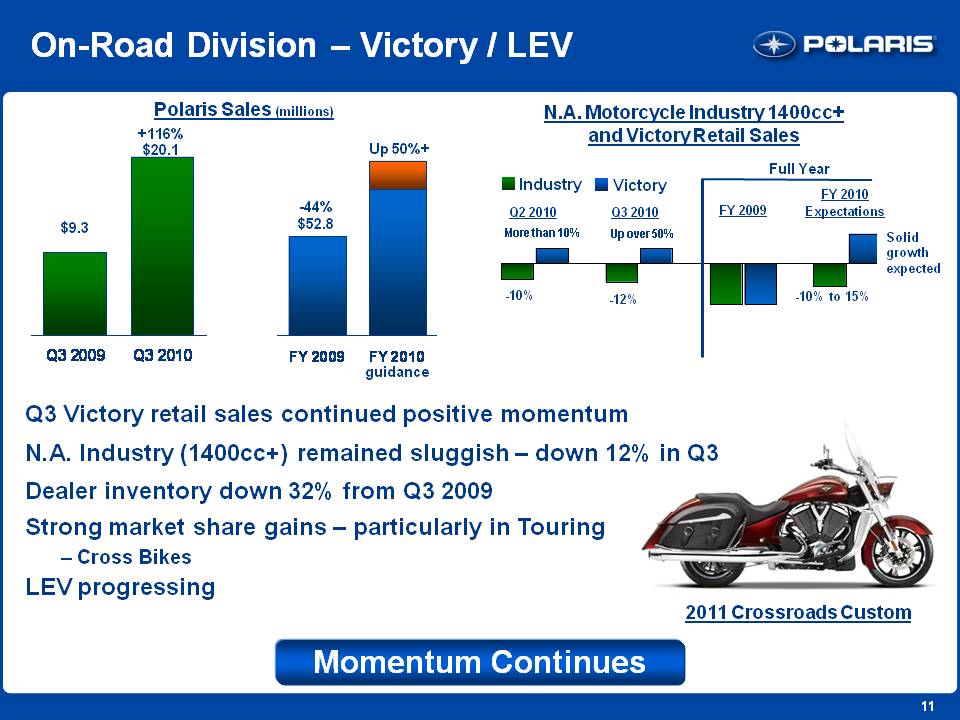
11 On-Road Division – Victory / LEV Polaris Sales (millions) $9.3 +116% $20.1 Q3 2009 Q3 2010 -44% $52.8 Up 50%+ FY 2009 FY 2010 guidance 2011 Crossroads Custom N.A. Motorcycle Industry 1400cc+ and Victory Retail Sales Q2 2010 Q3 2010 More than 10% Up over 50% Full Year FY 2009 FY 2010 Expectations Industry Victory -10% -12% -10% to 15% Solid growth expected Q3 Victory retail sales continued positive momentumN.A. Industry (1400cc+) remained sluggish – down 12% in Q3Dealer inventory down 32% from Q3 2009 Strong market share gains – particularly in Touring – Cross Bikes LEV progressing Momentum Continues
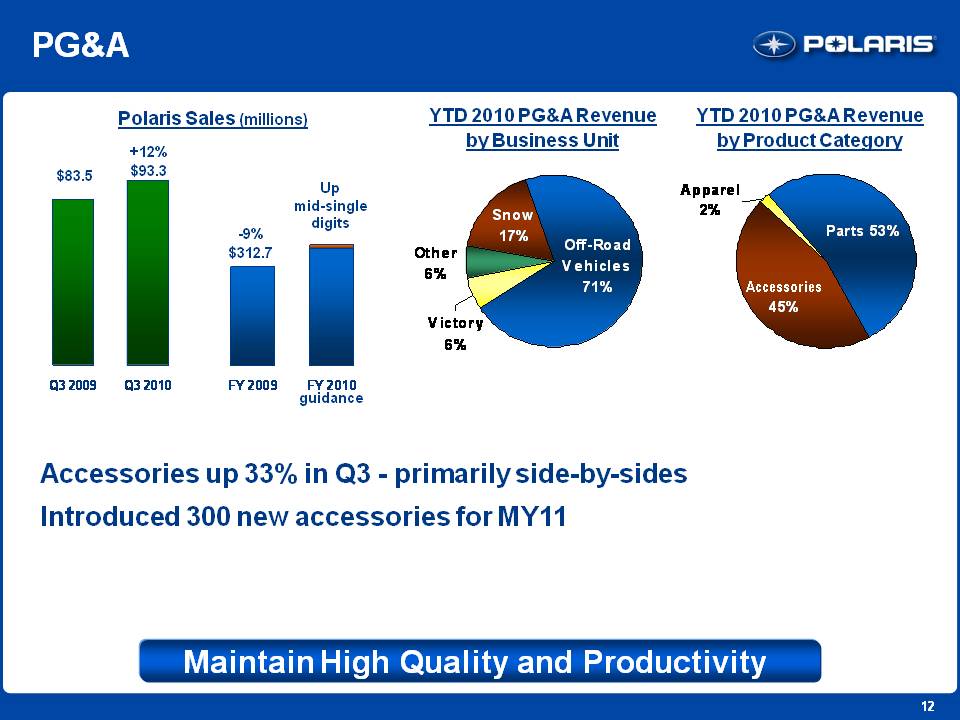
12 PG&A Polaris Sales (millions) YTD 2010 PG&A Revenue by Business Unit YTD 2010 PG&A Revenue by Product Category $83.5 +12% $93.3 Q32009 Q3 2010 -9% $312.7 Up mid-single digits FY 2009 FY 2010 guidance Off-Road Vehicles 71% Snow 17% Other 6% Victory 6% Parts 53% Accessories 45% Apparel 2% Accessories up 33% in Q3 - primarily side-by-sides Introduced 300 new accessories for MY11 Maintain High Quality and Productivity
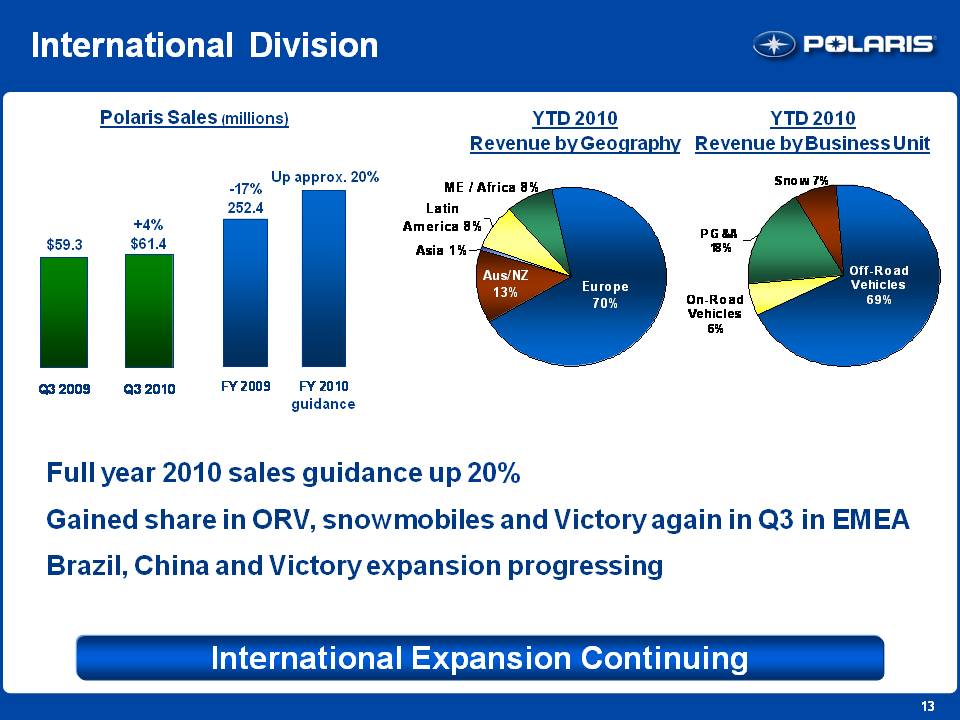
13 International Division Polaris Sales (millions) YTD 2010 Revenue by Geography YTD 2010 Revenue by Business Unit $59.3 +4% $61.4 Q3 2009 Q3 2010 -17% 252.4 Up approx. 20% FY 2009 FY 2010 guidance Europe 70% Aus/NZ 13% Latin America 8% ME / Africa 8% Asia 1% Off-Road Vehicles 69% PG&A 18% Snow 7% On-Road Vehicles 6% Full year 2010 sales guidance up 20%Gained share in ORV, snowmobiles and Victory again in Q3 in EMEA Brazil, China and Victory expansion progressing International Expansion Continuing
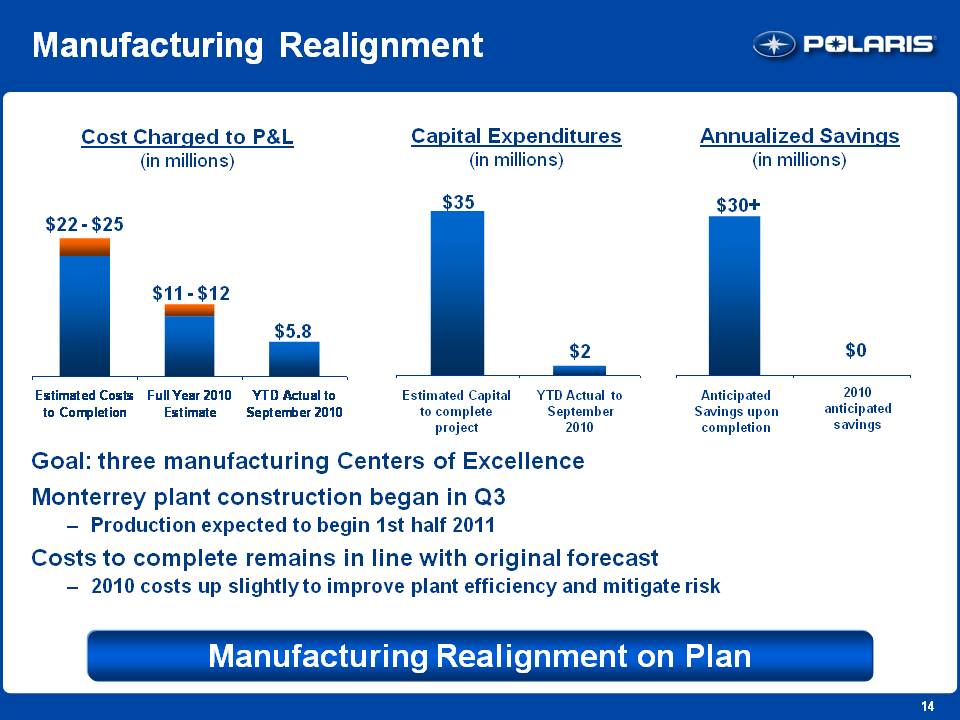
14 Manufacturing Realignment Cost Charged to P&L (in millions) Capital Expenditures (in millions) Annualized Savings (in millions) $22 - $25 Estimated Costs to Completion $11 - $12 Full Year 2010 Estimate $5.8 YTD Actual to September 2010 $35 Estimated Capital to complete project $2 YTD Actual to September 2010 $30+ Anticipated Savings upon completion $0 2010 anticipated savings Goal: three manufacturing Centers of ExcellenceMonterrey plant construction began in Q3 Production expected to begin 1st half 2011Costs to complete remains in line with original forecast 2010 costs up slightly to improve plant efficiency and mitigate risk Manufacturing Realignment on Plan
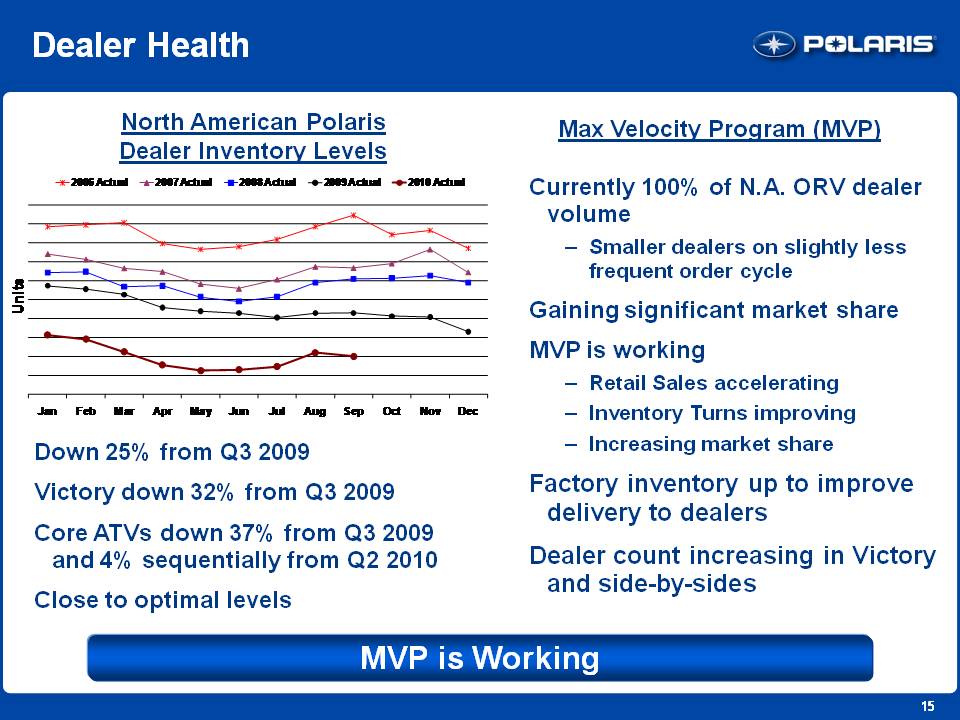
15 Dealer Health North American Polaris Dealer Inventory Levels Down 25% from Q3 2009Victory down 32% from Q3 2009Core ATVs down 37% from Q3 2009 and 4% sequentially from Q2 2010Close to optimal levels Max Velocity Program (MVP) Currently 100% of N.A. ORV dealer volumeSmaller dealers on slightly less frequent order cycle Gaining significant market shareMVP is workingRetail Sales accelerating Inventory Turns improvingIncreasing market shareFactory inventory up to improve delivery to dealers Dealer count increasing in Victory and side-by-sides MVP is Working
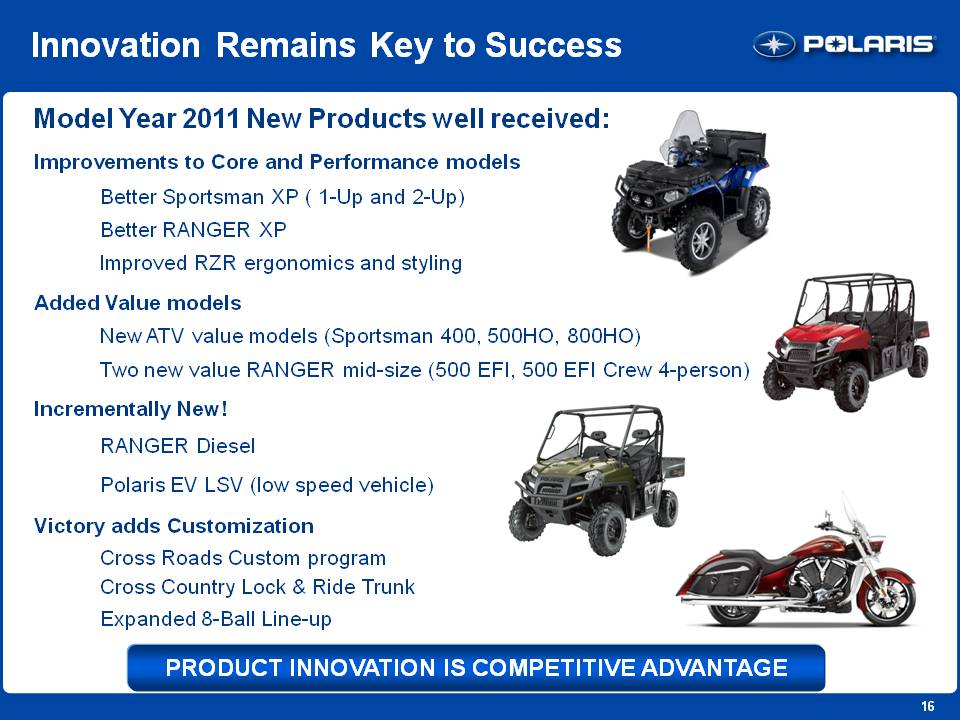
16 Innovation Remains Key to Success Model Year 2011 New Products well received: Improvements to Core and Performance models Better Sportsman XP ( 1-Up and 2-Up) Better RANGER XP Improved RZR ergonomics and styling Added Value models New ATV value models (Sportsman 400, 500HO, 800HO) Two new value RANGER mid-size (500 EFI, 500 EFI Crew 4-person)Incrementally New! RANGER Diesel Polaris EV LSV (low speed vehicle) Victory adds Customization Cross Roads Custom program Cross Country Lock & Ride Trunk Expanded 8-Ball Line-up PRODUCT INNOVATION IS COMPETITIVE ADVANTAGE
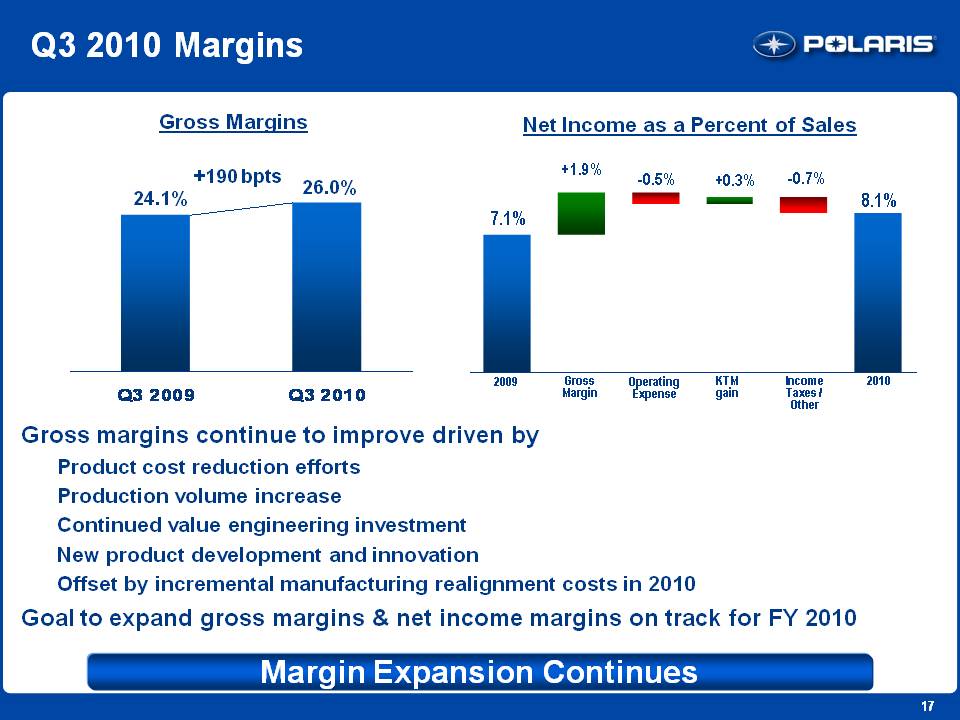
17 Q3 2010 Margins Gross Margins 24.1% 26.0% +190 bpts Q3 2009 Q3 2010 Net Income as a Percent of Sales 2009 Gross Margin Operating Expense KTM gain Income Taxes / Other 2010 7.1% +1.9% -0.5% +0.3% -0.7% 8.1% Gross margins continue to improve driven by Product cost reduction efforts Production volume increase Continued value engineering investment New product development and innovationOffset by incremental manufacturing realignment costs in 2010Goal to expand gross margins & net income margins on track for FY 2010 Margin Expansion Continues
18 Polaris Industries Inc. 3rd Quarter 2010 Earnings Results Mike Malone V.P. Finance and CFO
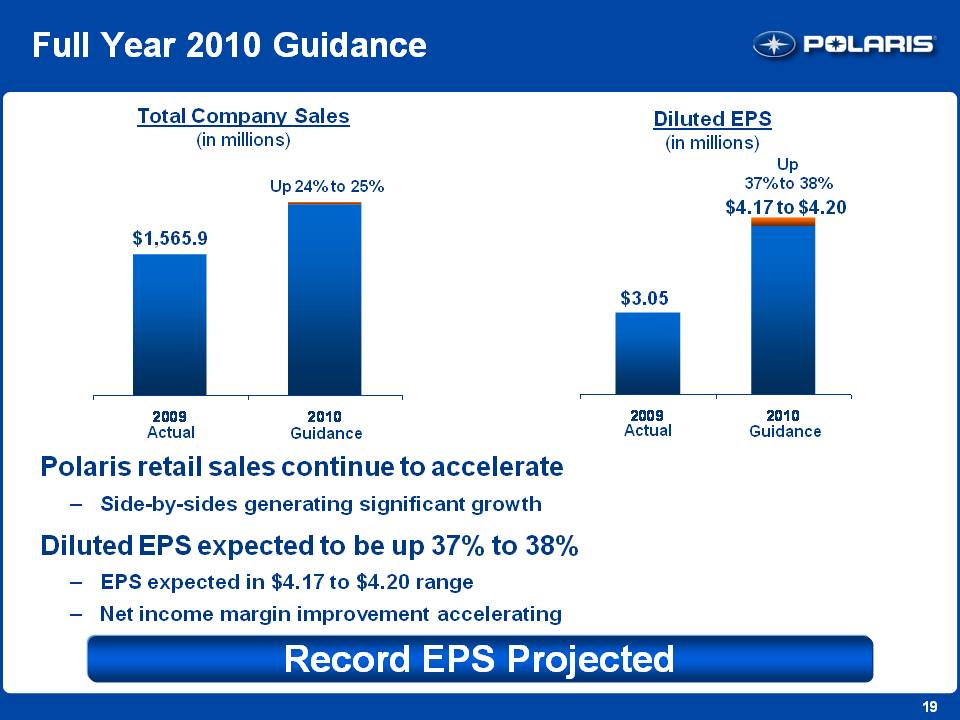
19 Full Year 2010 Guidance Total Company Sales (in millions) $1,565.9 Up 24% to 25% 2009 Actual 2010 Guidance Polaris retail sales continue to accelerateSide-by-sides generating significant growth Diluted EPS expected to be up 37% to 38% EPS expected in $4.17 to $4.20 range Net income margin improvement accelerating Diluted EPS (in millions) $3.05 Up 37% to 38% $4.17 to $4.20 2009 Actual 2010 Guidance Record EPS Projected
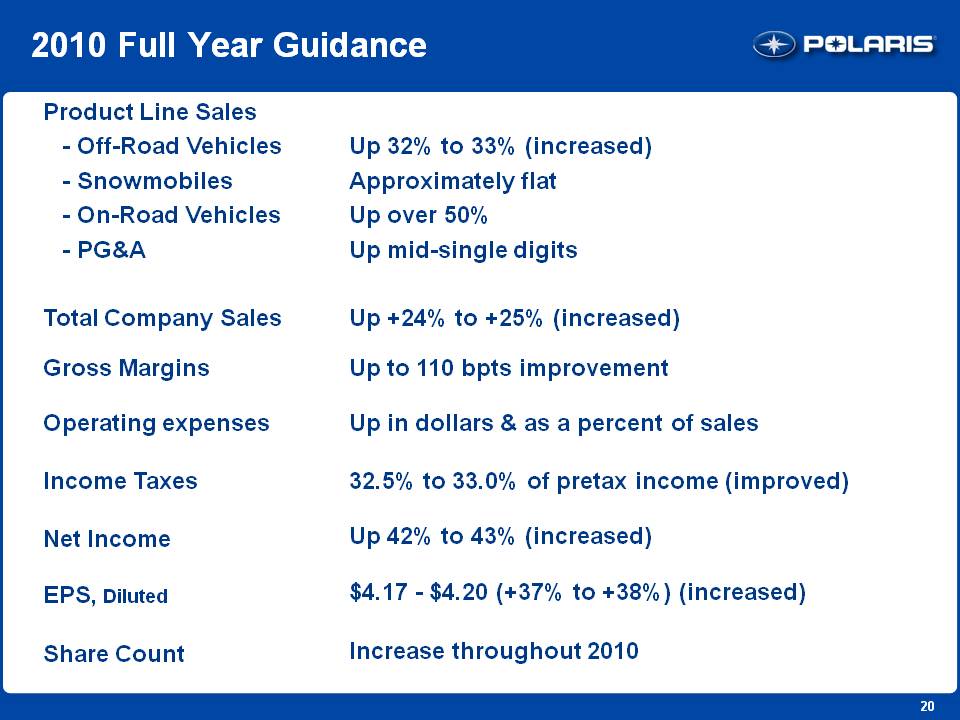
20 2010 Full Year Guidance Product Line Sales - Off-Road Vehicles Up 32% to 33% (increased) - Snowmobiles Approximately flat - On-Road Vehicles Up over 50% - PG&A Up mid-single digits Total Company Sales Up +24% to +25% (increased) Gross Margins Up to 110 bpts improvement Operating expenses Up in dollars & as a percent of sales Income Taxes 32.5% to 33.0% of pretax income (improved) Net Income Up 42% to 43% (increased) EPS, Diluted $4.17 - $4.20 (+37% to +38%) (increased) Share Count Increase throughout 2010
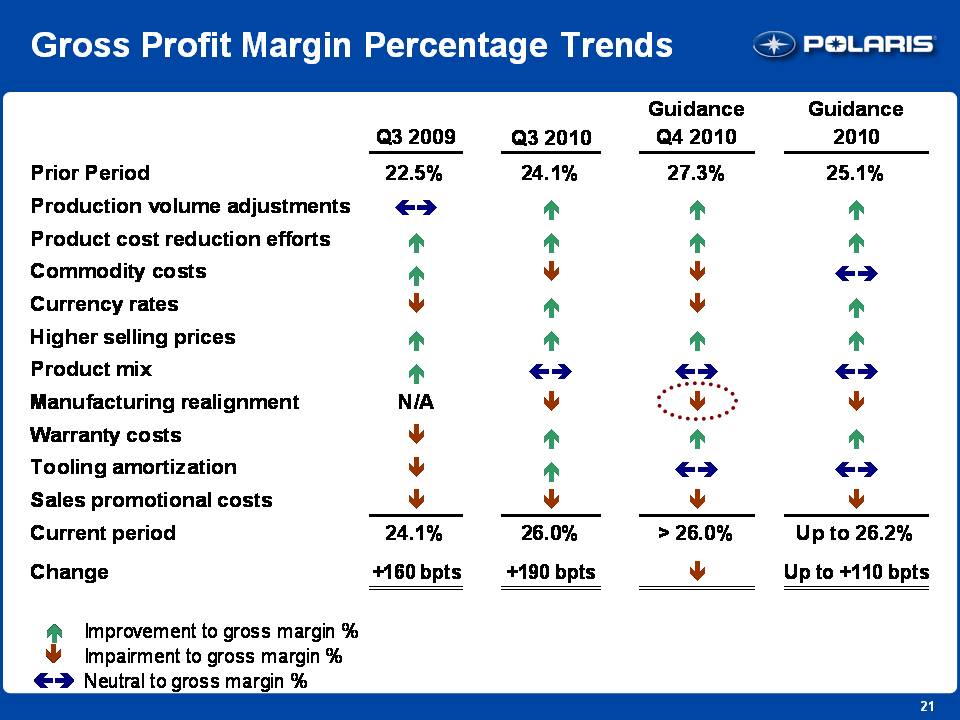
21 Gross Profit Margin Percentage Trends Q3 2009 Q3 2010 Guidance Q4 2010 Guidance 2010 Prior Period 22.5% 24.1% 27.3% 25.1% Production volume adjustments Product cost reduction efforts Commodity costs Currency rates Higher selling prices Product mix Manufacturing realignment Warranty costs Tooling amortization Sales promotional costs Current period 24.1% 26.0% >26.0% Up to 26.2% Change +160 bpts + 190bpts Up to +110 bpts Improvement to gross margin % Impairment to gross margin % Neutral to gross margin %
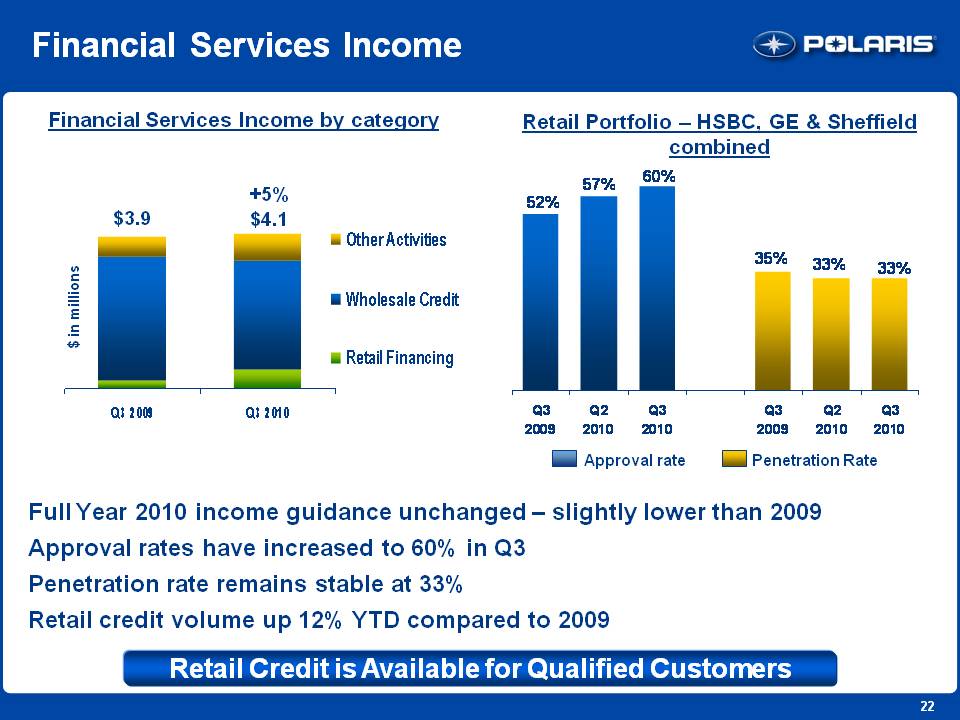
22 Financial Services Income Financial Services Income by category $3.9 +5% $4.1 $ in millions Q3 2009 Q3 2010 Other Activities Wholesale Credit Retail Financing Retail Portfolio – HSBC, GE & Sheffield combined 52% 57% 60% Q3 2009 Q2 2010 Q3 2010 35% 33% 33% Q3 2009 Q2 2010 Q3 2010 Approval rate Penetration Rate Full Year 2010 income guidance unchanged – slightly lower than 2009 Approval rates have increased to 60% in Q3 Penetration rate remains stable at 33% Retail credit volume up 12% YTD compared to 2009 Retail Credit is Available for Qualified Customers
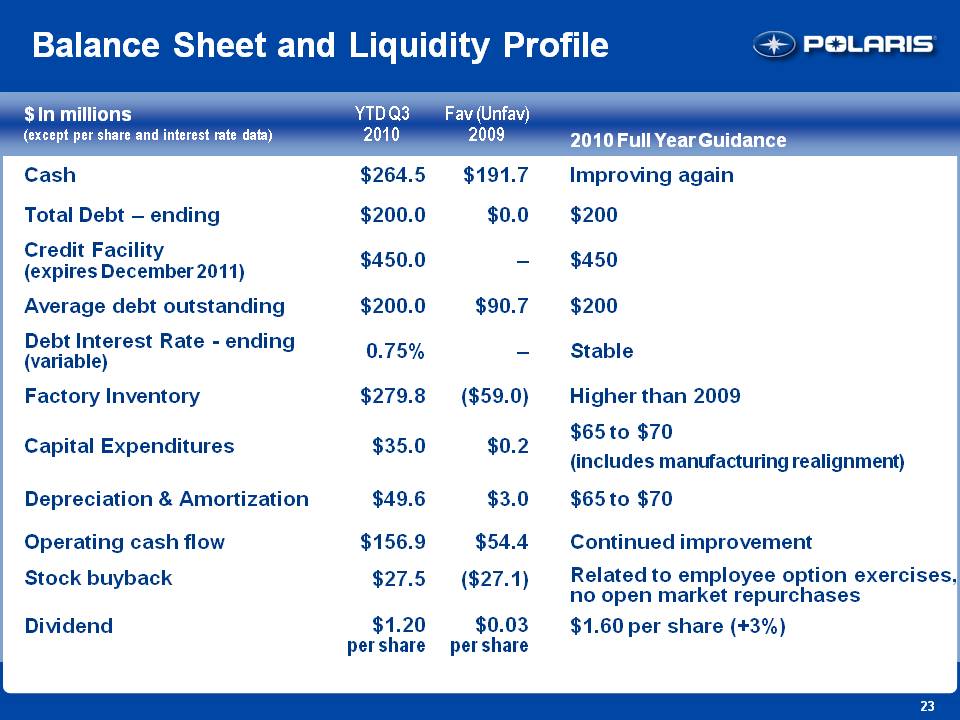
23 Balance Sheet and Liquidity Profile $ In millions (except per share and interest rate data) YTD Q3 2010 Fav (Unfav) 2009 2010 Full Year Guidance Cash $264.5 $191.7 Improving again Total Debt – ending $200.0 $0.0 $200 Credit Facility (expires December 2011) $450.0 – $450 Average debt outstanding $200.0 $90.7 $200 Debt Interest Rate - ending (variable) 0.75% – Stable Factory Inventory $279.8 ($59.0) Higher than 2009 Capital Expenditures $35.0 $0.2 $65 to $70 (includes manufacturing realignment) Depreciation & Amortization $49.6 $3.0 $65 to $70 Operating cash flow $156.9 $54.4 Continued improvement Stock buyback $27.5 ($27.1) Related to employee option exercises, no open market repurchases Dividend $1.20 per share $0.03 per share $1.60 per share (+3%)
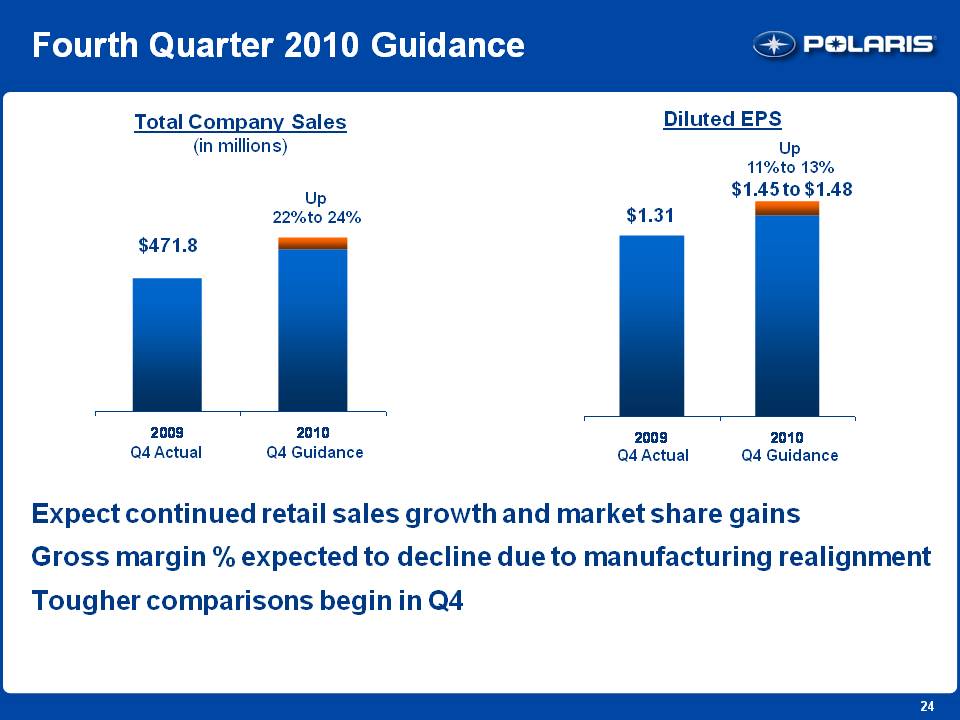
24 Fourth Quarter 2010 Guidance Total Company Sales (in millions) Up 22% to 24% $471.8 2009 Q4 Actual 2010 Q4 Guidance Diluted EPS Up 11% to 13% $1.31 $1.45 to $1.48 2009 Q4 Actual 2010 Q4 Guidance Expect continued retail sales growth and market share gains Gross margin % expected to decline due to manufacturing realignment Tougher comparisons begin in Q4
25 Polaris Industries Inc. 3rd Quarter 2010 Earnings Results Scott Wine CEO
26 2011 – Initial Thoughts U.S & European economies expected to slowly improve Powersports market growth remains muted “Make Growth Happen” theme continues International presence and growth accelerate – China, Brazil Market share expansion throughout the world; again Victory momentum to continueMonterrey plant expected to begin production mid-year Acquisition strategy begins to produce results Will drive for net margin expansion; againOperational Excellence initiatives and momentum will help Capitalize on Momentum Generated in 2010
27 Polaris Industries Inc. Thank you. Q & A