Attached files
| file | filename |
|---|---|
| 8-K - SIRIUS XM HOLDINGS INC. | c62903_8-k.htm |

Liberty Media Investor Meeting
Mel Karmazin, CEO
October 1, 2010

Disclaimer on
forward-looking statements
The guidance contained herein are based upon a number of assumptions and estimates that, while considered reasonable by us when
taken as a whole, are inherently subject to significant
business, economic and competitive uncertainties and contingencies, many of
which are beyond our control. In addition, the guidance is based upon specific assumptions with respect to future business
conditions, some or all of which will change.
The guidance, like any forecast, is necessarily speculative in nature and it can be
expected that the assumptions upon which the guidance is based will not prove to be valid or will vary from actual results. Actual
results will vary from the guidance
and the variations may be material. Consequently, the guidance should not be regarded as a
representation by us or any other person that the subscribers, synergies, revenue, and adjusted EBITDA will actually be achieved. You
are cautioned
not to place undue reliance on this information.
This communication contains “forward-looking statements” within the meaning of the Private Securities Litigation Reform Act of
1995. Such statements include,
but are not limited to, statements about future financial and operating results, the combined company’s
plans, objectives, expectations and intentions with respect to future operations, products and services; and other statements identified
by
words such as “will likely result,” “are expected to,” “will continue,” “is anticipated,” “estimated,” “intend,” “plan,” “projection,”
“outlook” or words of
similar meaning. Such forward-looking statements are based upon the current beliefs and expectations of
SIRIUS XM’s management and are inherently subject to significant business, economic and competitive uncertainties and
contingencies, many
of which are difficult to predict and generally beyond the control of SIRIUS and XM. Actual results may differ
materially from the results anticipated in these forward-looking statements.
The following factors, among others, could cause actual results to differ materially from the anticipated results or other expectations
expressed in the forward-looking statement:
our dependence upon automakers and other third parties, the substantial indebtedness of
SIRIUS and XM; the useful life of our satellites; and our competitive position versus other forms of audio and video
entertainment. Additional factors that
could cause SIRIUS’ and XM’s results to differ materially from those described in the forward-
looking statements can be found in SIRIUS’ Annual Report on Form 10-K for the year ended December 31, 2009 and its Quarterly Report
on Form
10-Q for the period ending June 30, 2010 and XM’s Annual Report on Form 10-K for the year ended December 31, 2009 and its
Quarterly Report on Form 10-Q for the period ending June 30, 2010, which are filed with the Securities and Exchange Commission
(the
“SEC”) and available at the SEC’s Internet site (http://www.sec.gov). The information set forth herein speaks only as of the date hereof,
and SIRIUS and XM disclaim any intention or obligation to update any forward looking statements
as a result of developments
occurring after the date of this communication.

Tremendous Growth Since Our 2001 Launch
Despite New Competition
1994 – Internet radio streaming
2001 – Satellite radio begins service
2001 – Apple iPods introduced
2003 – HD radio broadcasts begin
2005 – MP3 connectivity in vehicles

SIRIUS XM Highlights
Expected YE subscribers of ~20.1 million
Adj. Revenue to approach $2.8 billion in
2010
Adj. EBITDA approx. $575 million in 2010
Adj. EBITDA increase of over $1.1 billion
from 2007 to 2010E

Competitive Advantages
Satellite delivery system with 99.9%
continental U.S. coverage
Over 130 channels of curated content
Long term OEM agreements
Approximately $8 billion of NOL’s
Subscription model
Focused, pure-play satellite radio
company

Growth Statistics and Improvements
1H09
1H10
CHANGE
Penetration rate
55%
60%
+500 bp
Conversion rate
44.5%
45.9%
+140 bp
Churn rate
2.1%
1.9%
-20 bp
Subscribers
18.4 mm
19.5 mm
+6%
Adj. ARPU
$10.57
$11.65
+10%
Source: Company reports

Service Changes and Fees Continue to Drive Revenue
Best of SIRIUS/XM, October 2008
$4 premium upgrade
$8.99 multi-receiver pricing, March 2009
$2.99 streaming, March 2009
U.S. Music Royalty Fee, August 2009
Infotainment services

Launched iPhone, BlackBerry and
Android-Powered Smartphone Apps
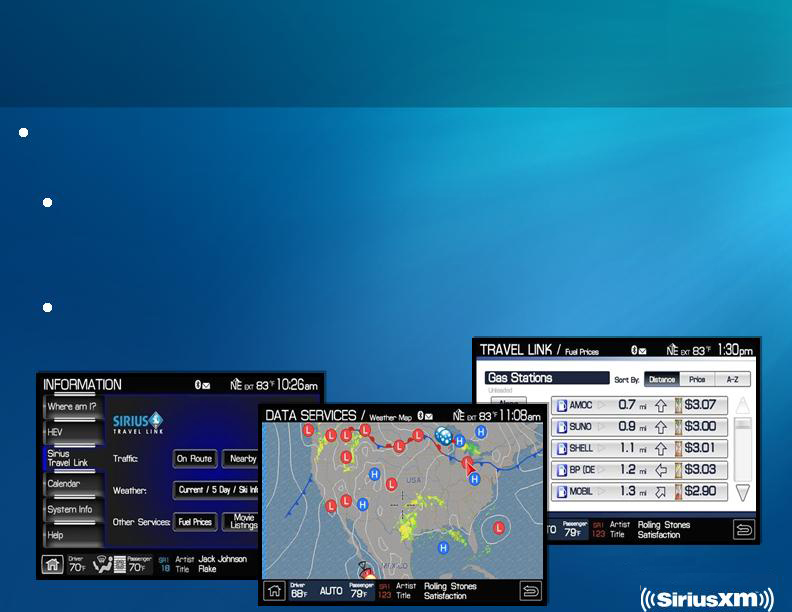
Growth Opportunity in Services
Multiple infotainment services offered and
planned:
Traffic, weather, sports tracking, fuel listings,
movie listings, airport and flight conditions, red
light cameras
Other new services and audio features in
development

Coming in 2011: Satellite Radio 2.0
Anticipated availability in retail
stores in the fourth quarter 2011
Satellite Radio 2.0 expected to
provide more channels and
increased functionality
Positive OEM reaction

SIRIUS XM’s Superior Content is a
Significant Competitive Advantage
Over 69 Channels of Commercial-Free Music
Live Coverage of Every Major Sport
The Best in News, Talk and Entertainment

RENEWALS:
NBA, Oprah Radio, Martha Stewart,
expanded Book Radio and expanded
season of Metropolitan Opera
Programming: Cost Savings
and Continued Innovation
Pop-Up Channels including
Michael Jackson Tribute,
Woodstock and
The Who
NEW PROGRAMMING:
Rosie Radio, Glenn Beck,
Fantasy Sports,
John Madden,
Cooking with Emeril and MSNBC
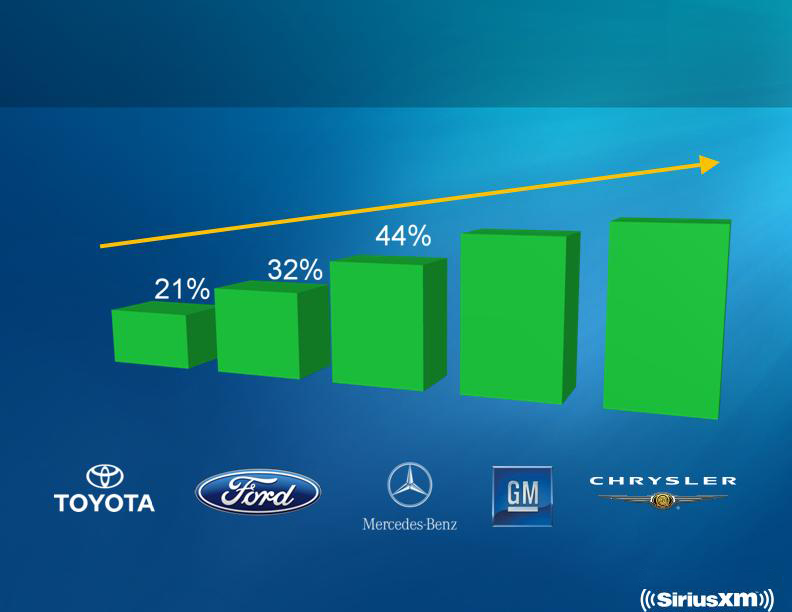
Penetration Gains at Automakers
OEM penetration as a percentage of U.S. auto sales
2006
2007
2008
2009
Source: Total US light vehicle sales per Global Insight and company estimates of SIRIUS XM
enabled sales; Represents factory and port installs only
55%
~60%
2010E
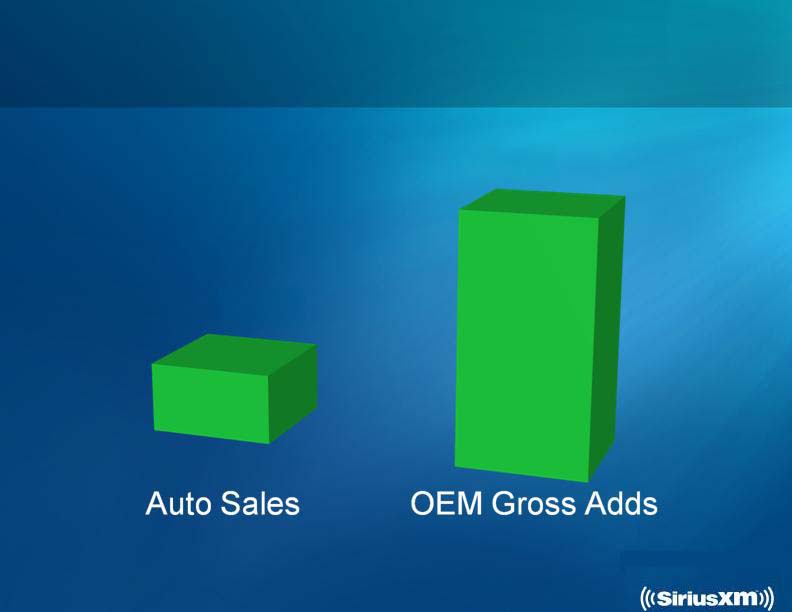
First Half 2010: Auto Sales Improve and
SIRIUS XM OEM Gross Adds Outperform
Source: Company data and industry sources
+14%
+49%
OEM Sales and
SIRIUS XM OEM Gross Adds
OEM Sales (mm)
SIRIUS XM OEM Gross Adds
Source: Company data and industry sources

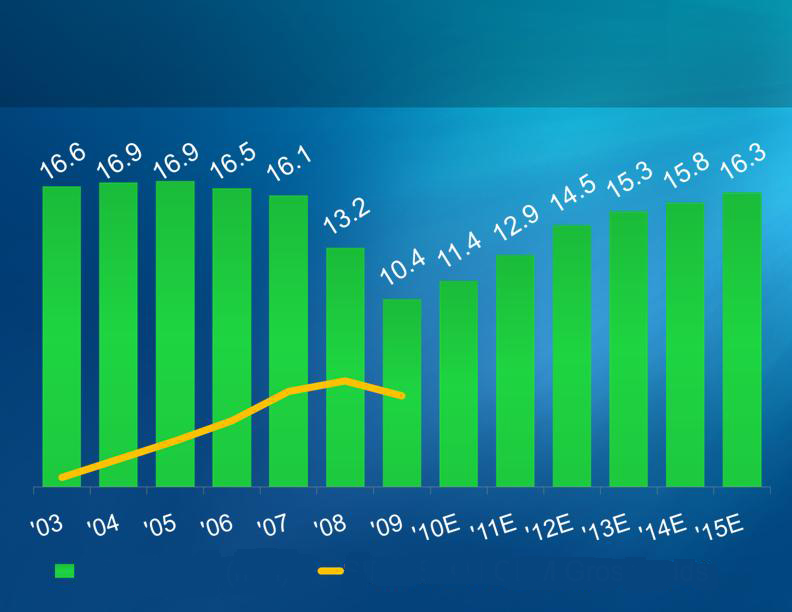
Factory-Enabled Vehicles in Operation to
Increase Dramatically (mm)
Source: Company estimates based on external industry estimates of 2010-15 automotive sales

Certified Preowned Program (CPO)
Launched with
Acura, Audi, BMW,
Honda, General Motors, Mercedes-Benz,
Porsche, Volkswagen, Volvo and Ford
Additional programs expected to be
launched
OEM revenue sharing creates strong
arrangements

Continuing Growth Delivers
Record Number of Subscribers
Source: Company filings
Ending Subscribers 2003-2010E (mm)
1.6
4.4
9.2
13.7
19.0
17.3
18.8
~20.1

Focus on Subscriber Retention
Yields Results
4.0%
1.8%
1.8%
1.5%
Netflix
SIRIUS
XM
DISH
DTV 1
Source: Public filings and industry estimates
1 DTV churn shown for DTV US only
2Q10 Comparative Monthly Churn Rates
4-5%
HBO/
Showtime/
Starz
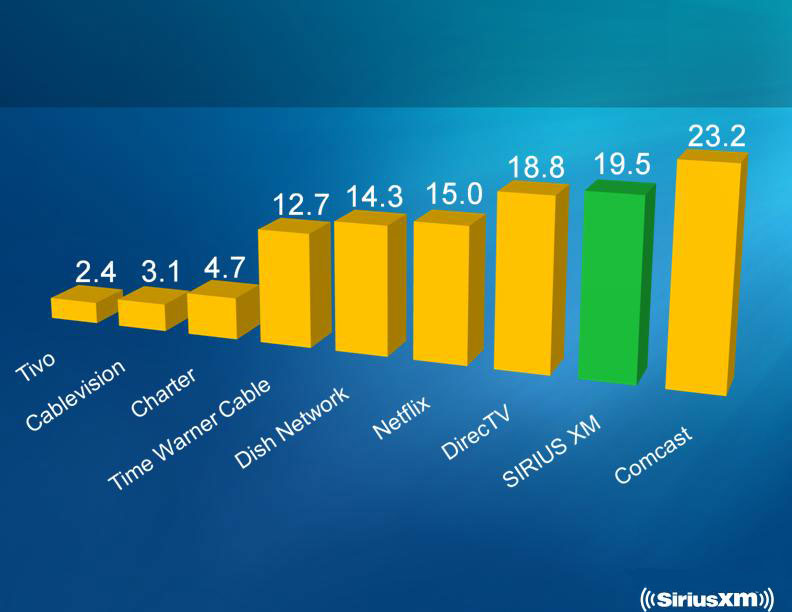
Among Largest U.S. Subscription
Media Businesses
2Q10 Total Basic Subscribers (in mm)
Source: Public filings
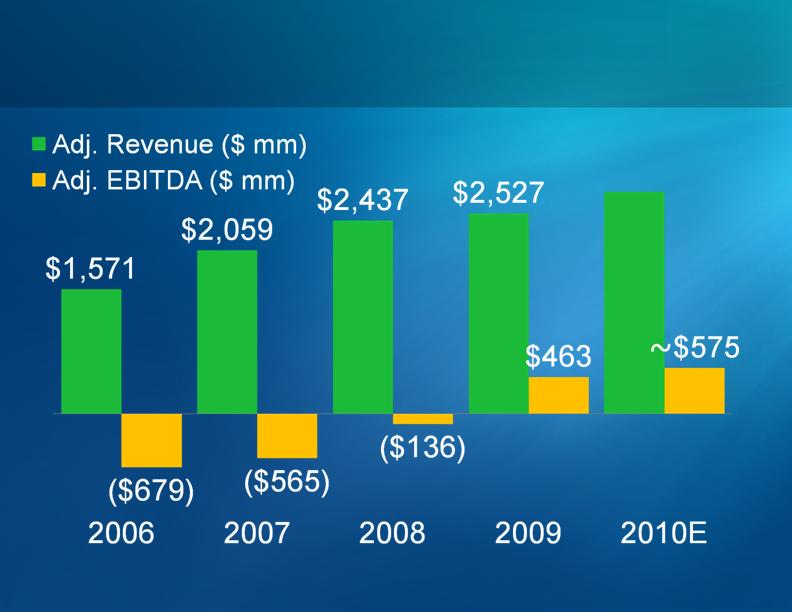
Significant Revenue and
EBITDA Growth
Source: Company reports
Approaching
$2,800

Arbitron Study Reveals More than
40 Million Listeners
1
Study conducted in October and November 2009. Based on a typical 2.75 hr. listening average
among subscribers in their cars; excludes music channels
SIRIUS XM is the preferred choice in the car1
SIRIUS XM

Radio Revenue
2001
2010E
Terrestrial Radio:
CCU, CBS, Citadel,
ETM, CMLS, etc.
$18 b (100%)
$15 b (80%)
IP Radio:
Last .fm, Slacker,
Pandora, Rhapsody,
etc., etc.
nil
< $1 b (5%)
Satellite Radio:
SIRIUS XM
nil
$2.8 b (15%)
TOTAL
$18.0 b
$18.8 b
Source: analyst estimates and industry reports

2010E Subscription Radio Revenue
TOTAL: $3.1 billion
Satellite Radio: $2.8 billion
Internet Radio: ~$0.3 billion
SIRIUS XM’s share of pay radio: 90%
Source: analyst estimates and industry reports

SIRIUS XM’s Superior Revenue Model
Internet
Radio
~$1.25
/ User
SIRIUS XM
$72
/ Listener
Source: Public filings and industry estimates
Terrestrial
Radio
$10-$20
/ Listener
2009E Annual Revenue
SIRIUS XM
$136
/ Subscriber

Investment Thesis: Improved Operating
Performance Lowers Borrowing Costs
February 2009: 15% secured
June 2009: 12.875% secured
August 2009: 10.375% secured
March 2010: 8.75% unsecured
Note: February 2009 transaction also included restructuring fees and equity issuance

Investment Thesis:
Operational Leverage Drives EBITDA
Contribution margin exceeds 70%
Adjusted EBITDA Margins
2008
2009
2010E
At
Maturity
(6%)
18%
21%
35%+
Source: Company reports
EBITDA margin improves dramatically as
we scale subscribers and revenue

Solid Balance Sheet and
Strong Liquidity Position
Year end 2010 cash balance should
approach $430 million based on FCF
guidance
Leverage ratio currently at
approximately 4.6x, a historic low for
our company, and will improve
No significant maturities until 2013
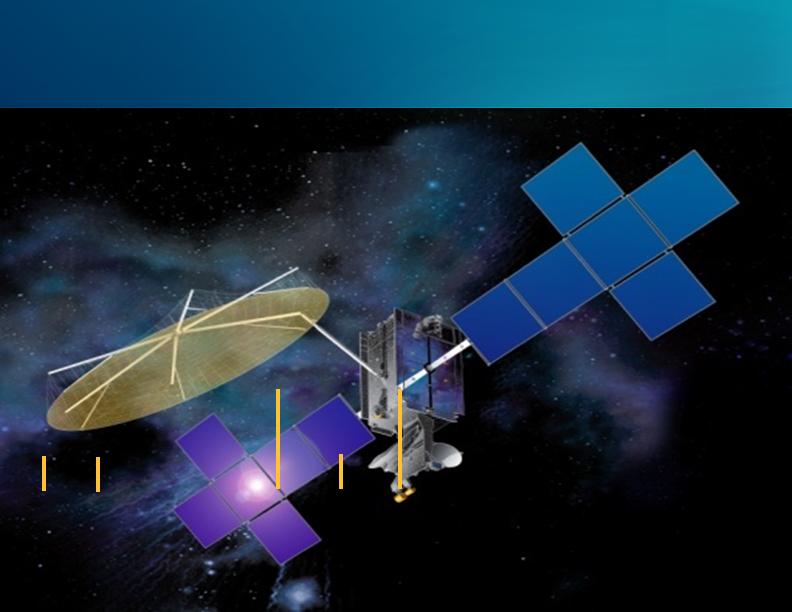
Investment Thesis: Completion of Satellite
Build Translates to More FCF
2005 • 2006 • 2007 • 2008 • 2009 • 2010 • 2011 • 2012 • 2013 • 2014 • 2015 • 2016 • 2017
XM
3
XM
4
SIRIUS
5
XM
5
SIRIUS
6
LAUNCH DATE

Investment Thesis: Free Cash Flow
Higher Adjusted EBITDA
+ Lower Interest Expense
+ Lower Capital Expenditures
+ Cash Savings from NOL Use
= Free Cash Flow Growth

Management Priorities
Grow subscribers
Grow revenue
Continue to innovate
Manage churn
Continue cost reductions
Manage balance sheet
Cash flow growth

Reconciliation for SIRIUS XM
Q1 2008
Q2 2008
Q3 2008
Q4 2008
Q1 2009
Q2 2009
Q3 2009
Q4 2009
Q1 2010
Q2 2010
FY2005
FY2006
FY2007
FY2008
FY2009
As Reported Total Revenue
270,350
283,017
488,443
622,183
586,979
590,829
618,656
676,173
663,784
699,761
242,245
637,235
922,066
1,663,992
2,472,638
Predecessor Financial Information
308,454
318,035
104,704
-
-
-
-
-
558,266
933,417
1,136,542
731,194
-
Purchase Price Accounting Adjustments
-
-
19,629
21,925
18,501
17,007
10,951
7,606
6,779
5,799
-
-
-
41,554
54,065
Adjusted Total Revenue
578,804
601,052
612,776
644,108
605,480
607,836
629,607
683,779
670,563
705,560
800,511
1,570,652
2,058,608
2,436,740
2,526,703
As Reported Total Operating Expenses
358,975
351,066
5,315,420
675,281
545,918
553,594
552,301
592,500
538,644
574,127
1,071,385
1,704,959
1,435,156
6,700,741
2,244,312
Predecessor Financial Information
402,138
400,753
158,770
-
-
-
-
-
1,113,801
1,336,515
1,647,979
961,663
-
Purchase Price Accounting Adjustments
-
-
(4,709,722)
47,910
55,202
57,184
64,619
63,886
62,610
64,857
-
-
-
(4,661,812)
240,891
Adjusted Total Operating Expenses
761,113
751,819
764,468
723,191
601,120
610,778
616,920
656,386
601,254
638,984
2,185,186
3,041,474
3,083,135
3,000,592
2,485,203
As Reported Income (Loss) from
Operations
(88,625)
(68,049)
(4,826,977)
(53,098)
41,061
37,235
66,355
83,673
125,140
125,634
(829,140)
(1,067,724)
(513,090)
(5,036,749)
228,326
Predecessor Financial Information
(93,684)
(82,718)
(54,066)
-
-
-
-
-
(555,535)
(403,098)
(511,437)
(230,469)
-
Purchase Price Accounting Adjustments
-
-
4,729,351
(25,985)
(36,701)
(40,177)
(53,668)
(56,280)
(55,831)
(59,058)
-
-
-
4,703,366
(186,826)
Adjusted Income (Loss) from Operations
(182,309)
(150,767)
(151,692)
(79,083)
4,360
(2,942)
12,687
27,393
69,309
66,576
(1,384,675)
(1,470,822)
(1,024,527)
(563,852)
41,500
As Reported Depreciation and
Amortization
26,906
27,113
66,774
82,958
82,367
77,158
72,100
77,826
70,265
69,230
98,555
105,749
106,780
203,752
309,450
Predecessor Financial Information
45,483
32,438
10,828
-
-
-
-
-
-
-
145,870
168,880
187,196
88,749
-
Adjusted Depreciation and Amortization
72,389
59,551
77,602
82,958
82,367
77,158
72,100
77,826
70,265
69,230
244,425
274,629
293,976
292,501
309,450
As Reported Share-based Payment
Expense
22,262
17,151
24,005
23,987
20,179
29,701
17,674
6,427
17,182
15,901
163,078
437,918
78,900
87,405
73,981
Predecessor Financial Information
17,504
12,947
4,033
-
-
-
-
-
-
-
5,966
68,046
86,199
34,485
-
Purchase Price Accounting Adjustments
-
-
1,771
958
1,321
1,302
1,125
1,053
1,001
803
-
-
-
2,729
4,801
Adjusted Share-based Payment Expense
39,766
30,098
29,809
24,945
21,500
31,003
18,799
7,480
18,183
16,704
169,044
505,964
165,099
124,619
78,782

Reconciliation for SIRIUS XM
Q1 2008
Q2 2008
Q3 2008
Q4 2008
Q1 2009
Q2 2009
Q3 2009
Q4 2009
Q1 2010
Q2 2010
FY2005
FY2006
FY2007
FY2008
FY2009
As Reported Restructuring, Impairments
and Related Costs
-
-
7,430
2,977
614
27,000
2,554
2,640
-
1,803
-
10,917
-
10,434
32,807
Predecessor Financial Information
-
-
-
-
-
-
-
-
-
-
-
-
-
-
-
Purchase Price Accounting Adjustments
-
-
-
-
-
-
-
-
-
-
-
-
-
-
-
Adjusted Restructuring, Impairments and
Related Costs
-
-
7,430
2,977
614
27,000
2,554
2,640
-
1,803
-
10,917
-
10,434
32,807
As Reported Impairment Goodwill
-
-
4,750,859
15,331
-
-
-
-
-
-
-
-
-
4,766,190
-
Predecessor Financial Information
-
-
-
-
-
-
-
-
-
-
-
-
-
-
-
Purchase Price Accounting Adjustments
-
-
(4,750,859)
(15,331)
-
-
-
-
-
-
-
-
-
(4,766,190)
-
Adjusted Impairment of Goodwill
-
-
-
-
-
-
-
-
-
-
-
-
-
-
-
Adjusted Total Operating Expenses
761,113
751,819
764,468
723,191
601,120
610,778
616,920
656,386
601,254
638,984
2,185,186
3,041,474
3,083,135
3,000,592
2,485,203
Less Adjusted:
Depreciation and Amortization
72,389
59,551
77,602
82,958
82,367
77,158
72,100
77,826
70,265
69,230
244,425
274,629
293,976
292,501
309,450
Share-based Payment Expense
39,766
30,098
29,809
24,945
21,500
31,003
18,799
7,480
18,183
16,704
169,044
505,964
165,099
124,619
78,782
Restructuring, Impairments and Related
Costs
-
-
7,430
2,977
614
27,000
2,554
2,640
-
1,803
-
10,917
-
10,434
32,807
Impairment of Goodwill
-
-
-
-
-
-
-
-
-
-
-
-
-
-
-
Adjusted Cash Operating Expenses
648,958
662,170
649,627
612,311
496,639
475,617
523,467
568,440
512,806
551,247
1,771,717
2,249,964
2,624,060
2,573,038
2,064,164
Adjusted Income (Loss) from Operations
(182,309)
(150,767)
(151,692)
(79,083)
4,360
(2,942)
12,687
27,393
69,309
66,576
(1,384,675)
(1,470,822)
(1,024,527)
(563,852)
41,500
Add back Adjusted:
Depreciation and Amortization
72,389
59,551
77,602
82,958
82,367
77,158
72,100
77,826
70,265
69,230
244,425
274,629
293,976
292,501
309,450
Share-based Payment Expense
39,766
30,098
29,809
24,945
21,500
31,003
18,799
7,480
18,183
16,704
169,044
505,964
165,099
124,619
78,782
Restructuring, Impairments and Related
Costs
-
-
7,430
2,977
614
27,000
2,554
2,640
-
1,803
-
10,917
-
10,434
32,807
Impairment of Goodwill
-
-
-
-
-
-
-
-
-
-
-
-
-
-
-
Adjusted EBITDA
(70,154)
(61,118)
(36,851)
31,797
108,841
132,219
106,140
115,339
157,757
154,313
(971,206)
(679,312)
(565,452)
(136,298)
462,539

Reconciliation for SIRIUS XM
ARPU is derived from total earned subscriber revenue, net advertising revenue and other subscription-related
revenue, net of purchase price accounting adjustments, divided by the
number of months in the period, divided by
the daily weighted average number of subscribers for the period. Other subscription-related revenue includes
amounts recognized on account of the U.S. Music Royalty Fee since the third quarter of 2009. Purchase
price
accounting adjustments include the recognition of deferred subscriber revenues not recognized in purchase price
accounting. ARPU is calculated as follows (in thousands, except for subscriber and per subscriber amounts):
Unaudited
For the Six Months Ended
June 30,
2010
2009
Subscriber revenue (GAAP)
$ 1,181,139
$ 1,121,151
Net advertising revenue (GAAP)
30,323
24,869
Other subscription-related revenue (GAAP)
104,641
-
Purchase price accounting adjustments
8,952
31,883
$ 1,325,055
$ 1,177,903
Daily weighted average number of subscribers
18,962,580
18,575,219
ARPU
$ 11.65
$ 10.57

Everything worth listening to is on