Attached files
| file | filename |
|---|---|
| 8-K - FORM 8-K - CALPINE CORP | d8k.htm |
 Bank
of America Merrill Lynch 2010 Power & Gas Leaders Conference
September 29, 2010
Thad Hill
Executive Vice President, CCO
Exhibit 99.1 |
 1
1
Safe Harbor
Statement
Forward-Looking Statements
The information contained in this presentation includes certain estimates, projections
and other forward-looking information that reflect Calpine’s current
views with respect to future events and financial performance. These estimates,
projections and other forward-looking information are based on assumptions that
Calpine believes, as of the date hereof, are reasonable. Inevitably, there will
be differences between such estimates and actual results, and those differences may
be material.
There can be no assurance that any estimates, projections or forward-looking
information will be realized. All such estimates, projections and
forward-looking information speak only as of the date hereof. Calpine undertakes no
duty to update or revise the information contained herein.
You are cautioned not to place undue reliance on the estimates, projections and other
forward-looking information in this presentation as they are based on
current expectations and general assumptions and are subject to various risks,
uncertainties and other factors, including those set forth in Calpine’s Annual
Report on Form 10-K for the year ended December 31, 2009, Quarterly Report
on Form 10-Q for the quarters ended March 31 and June 30, 2010, and in other
documents that Calpine files with the SEC. Many of these risks,
uncertainties and other factors are beyond Calpine’s control
and may cause actual results to differ materially from the views, beliefs and estimates
expressed herein. Calpine’s reports and other information filed with the
SEC, including the risk factors identified in its Annual Report on Form 10-K for the year
ended December 31, 2009, and Quarterly Report on Form 10-Q for the quarters ended
March 31 and June 30, 2010, can be found
on
the
SEC’s
website at www.sec.gov
and on Calpine’s website at www.calpine.com.
Reconciliation to GAAP Financial Information
The
following
presentation
includes
certain
“non-GAAP
financial
measures”
as
defined in Regulation G under the Securities
Exchange Act of 1934. Schedules are included herein that reconcile the
non-GAAP financial measures included in the following
presentation
to
the
most
directly
comparable
financial
measures
calculated and presented in accordance with
GAAP. |
 2
Agenda
•
Introduction to Calpine
•
Look Back at Last Two Years
•
2012 & Beyond |
 3
3
3
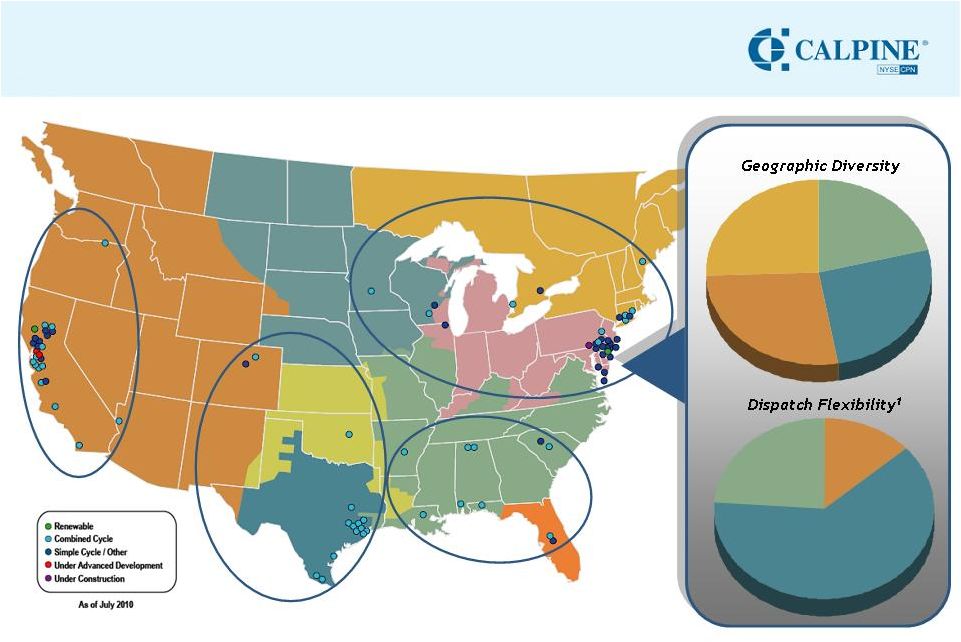
National Portfolio of Nearly 29,000 MW
Southeast
6,083 MW
North
7,336 MW
26%
West
7,817 MW
27%
Texas
26%
Baseload
3,801 MW
13%
Peaking
6,852 MW
24%
Intermediate
18,016 MW
63%
21%
7,433 MW
1
Note: Projects Under Advanced Development include Russell City Energy Center and upgrade at existing
Los Esteros Critical Energy Facility. Colorado assets to be sold in December 2010. Based on estimated generation for 2009. |
 4
6,000
8,000
10,000
CPN
DYN
RRI
NRG
MIR
12,000
4
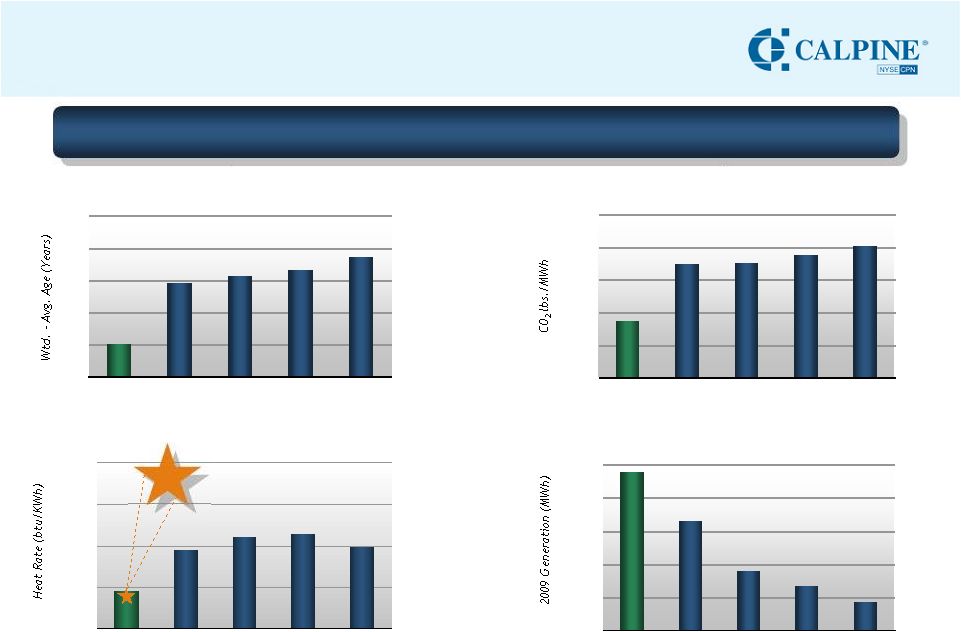
Source: Energy Velocity (2009).
Source: Energy Velocity (2009).
Clean
Modern
Source: 2009 SEC filings.
Efficient
Source: Energy Velocity (2009). Not adjusted for steam, and excluding
non-fossil fuel generation.
Scale
Unique Independent Power Producer
Note: CPN figures (excluding steam-adjusted heat rate) have been adjusted to
include estimated impacts from Conectiv Energy. DYN figures have been adjusted to remove estimated impacts of plants
sold to LS Power during 2009.
-
10
20
30
40
50
CPN
DYN
RRI
NRG
MIR
-
20,000
40,000
60,000
80,000
100,000
CPN
NRG
DYN
RRI
MIR
-
500
1,000
1,500
2,000
2,500
CPN
NRG
DYN
MIR
RRI
14,000
Calpine is the nation’s largest baseload
renewable,
natural gas and cogeneration power provider
Our steam-adjusted
heat rate is 7,263 |
 5
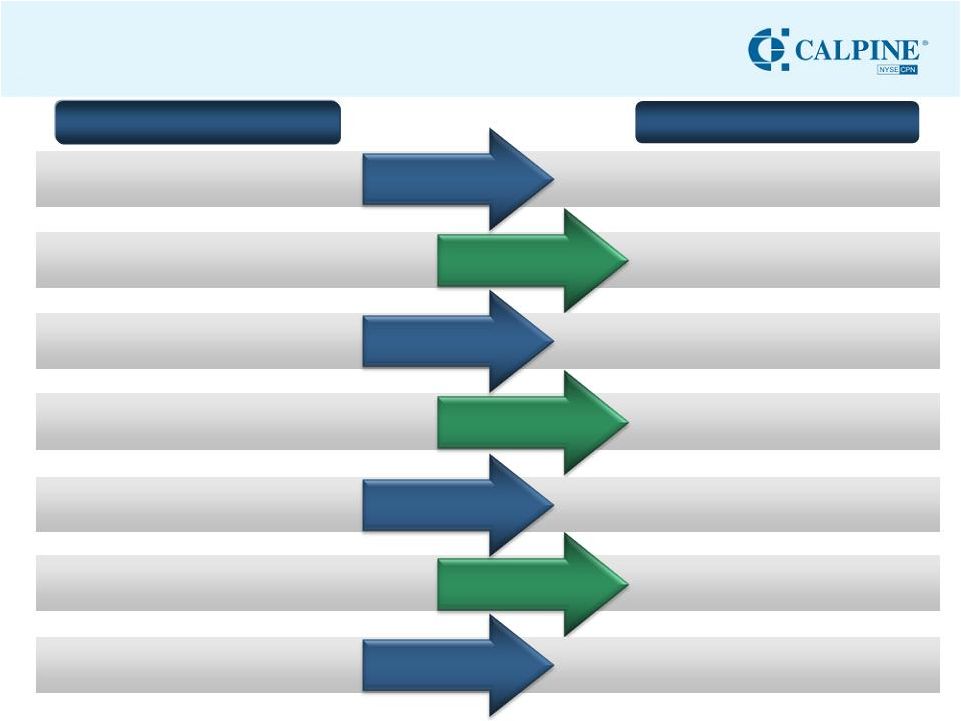
Progress Over the Past Two Years
5
Costs
Operations
New Calpine
Old Calpine
Regional Focus
Commercial
Balance Sheet
Strategic Focus
Investor
Transparency
Premier Operating Company
•
Outstanding safety performance
•
92% fleet-wide availability in 2009
3 Scale Regions: West, Texas & North
•
Conectiv acquisition
•
Colorado sale
Strong Operating Cost Performance
•
Savings of over $100 million vs
2008
Opportunistically Termed Out ~$4B of Debt
Focus on Free Cash Flow
Customer Focused
Maintained Clean Profile: Natural Gas &
Geothermal
Avoided large scale renewables
Improved Disclosures
Clarity around Calpine story
Technically Capable
Main Focus the West & Texas;
Scattered Southeast
Not Focused
•
No central procurement
•
Multiple offices
Significant Maturity Towers
•
~$7B of Debt in ’11 and ’14
1
Trading Focused
Potential Coal Merger Discussions
Little Contact with the Street
1
As presented on our 3Q08 Earnings Presentation. |
 6
$-
$200
$400
$600
$800
$1,000
Past
Current
Plant Operating Expense
SG&A
-
350,000
700,000
1,050,000
1,400,000
1,750,000
July/Aug 2010
July/Aug 2009
Peakers
6
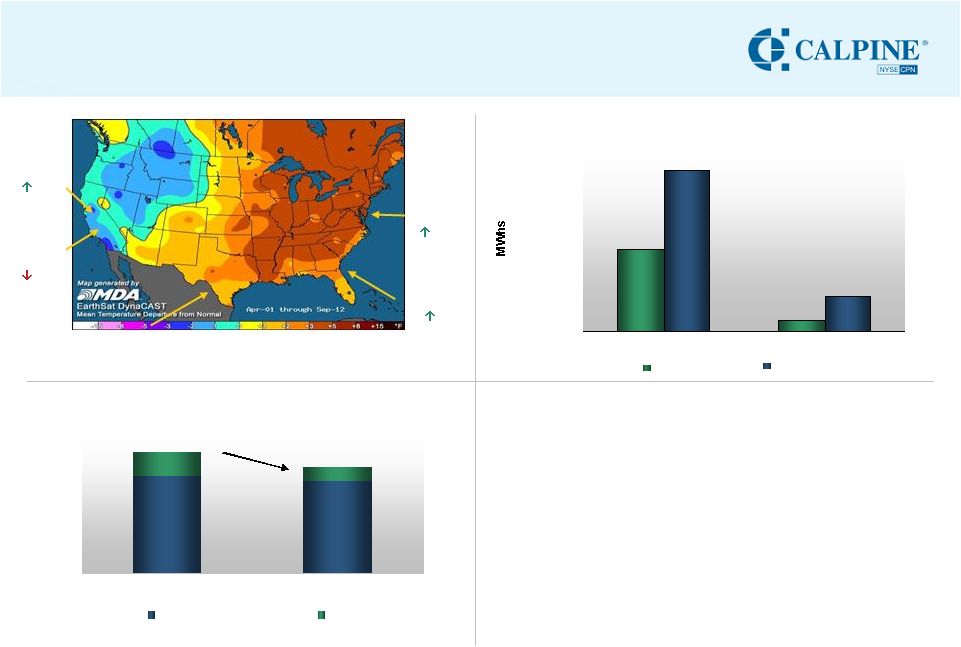
Snap-Shots of 2010 Performance
6
Weather Drove Performance
Source:
MDA
Earthsat.
April
1-
Sept.
12
Average
Temperature.
Generation
April-August
2009
vs
2010.
CCGT
Conectiv Beating Expectations
Costs Focus Delivering Impact
$106 million
•
SDG&E at The Geysers
•
PG&E at The Geysers, Peakers, Los Esteros, & Delta
•
LADWP extension of wind firming contract
•
SPS at Oneta
•
BPA wind flexibility at Hermiston
•
SCE at Pastoria
•
TVA at Decatur
•
AEP at Oneta
•
Entergy at Carville
Customer Focused Origination Helping Protect the Top Line
1
1
Annualized first half of year. Includes Colorado plants, but excludes
Conectiv. 1
North
Generation
135%
Texas
Generation Flat
Southeast
Generation
7%
West
Generation
11%
Geothermal
Generation
2% |
 7
139 GW
317 GW
0.00
10.00
20.00
30.00
40.00
50.00
2005
2006
2007
2008
2009
2010
2011
2012
2013
2014
Real Secular Shifts Underway
Shale Gas = Shrinking Coal Margins
Activist EPA = Massive Investment
Required
+
Total
U.S. Coal
U.S. Coal
without SO2
Controls
At ~$420/kW
for New
Scrubbers =
~$58B Retrofit
Spend
Challenges
for
Coal
&
Renewables
=
Benefits
to
Gas
Generation
Views of Potential Retirements:
•
Wood Mack-
60GW
•
PIRA-
40GW
•
Bernstein-
65GW
•
Barclays-
38GW
•
Credit Suisse-
60GW
•
BofA
ML-
40GW
Sources:
Energy
Velocity,
EPRI,
Wood
Mackenzie,
PIRA,
Bernstein,
Barclays,
Credit
Suisse,
and
Bank of America Merrill Lynch.
U.S. Coal
to be
Retrofitted
38-65 GW
Potential
Coal
Retirements
74-101 GW
Source: Energy Velocity. Reflects CAPP coal and PJM West on-peak power prices,
$15 per ton transport, 10 heat rate, and $4 VOM. Forward prices as of
9/20/10. |
 8
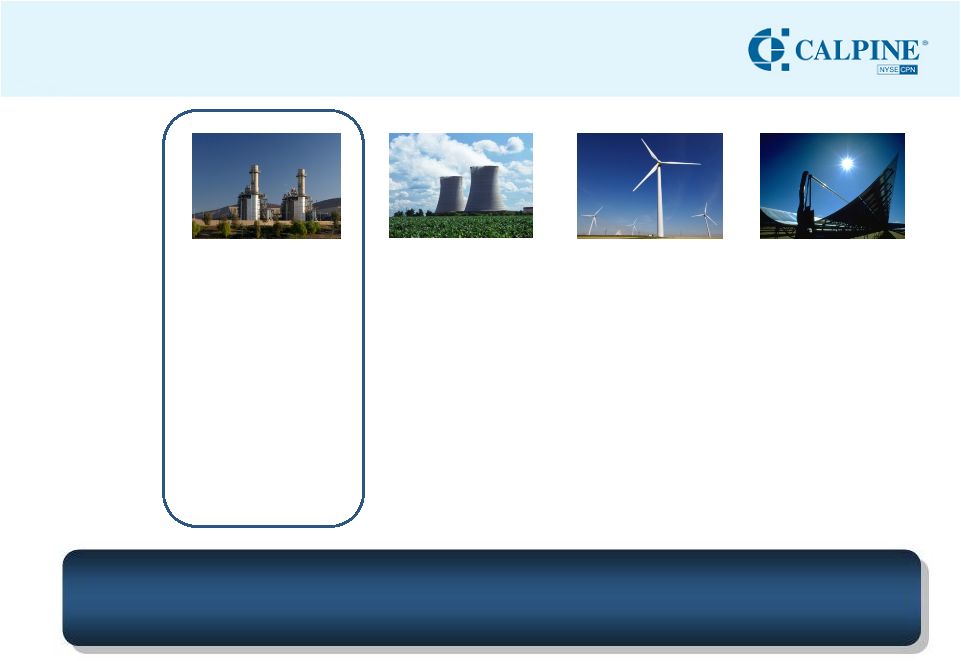
Gas-Fired Generation: A Solution for Tomorrow, Today
Otay
Mesa Energy Center
Nuclear Plant
Wind Farm
Cost ($/KW)
~$950
$3,000 -
$4,500
$1,900 -
$2,200
$4,500 -
$6,000
Construction
Period
1
29 mos.
60 –
84 mos.
12 –
18 mos.
30 –
42 mos.
Land Usage
1/20
th
acre / MW
Up to 2 acres / MW
Up to 83 acres / MW
Up to 10 acres / MW
Water usage
2
~15 gal/ MWh
Up to 750 gal / MWh
Negligible
Up to 800 gal / MWh
Subsidies
Required
3
None
Largest
Large
Larger
In a world of scarce natural and financial resources,
gas-fired
generation
offers
a
path
to
a
cleaner
footprint
with
lower
capital
requirements
8
Solar Field (CSP)
Sources: EIA, E3, AWEA, DOE, CEC, Calpine, Public data.
Does not include permitting period.
Otay Mesa features air cooled system. Nuclear usage assumes recirculating cooling
system. Assuming mid-level natural gas price.
1
2
3 |
 9
Current Public Policy & Commodity
Price Impact on Generation Attractiveness
Renewables
Natural Gas Generation
Calpine’s
View of the World
Real Life Impacts:
•
Driving competitor M&A
activity towards gas
•
State commissions’
rejection of renewable
projects
•
Massive slow down of
new renewable projects
•
Coal retirement
announcements
Natural Resource
Clean
+
Heavy
Government
Support
Focus on
Cost of Service
Only
Gas as Scarce Resource
Abundant Shale Gas
Clean
+
Cost of Service
Existing Baseload
New
Nuclear
New
Coal
Current
state
of
world
will
lead
to
expansion
of
value
of
existing
Calpine
fleet
9 |
 10
10
10
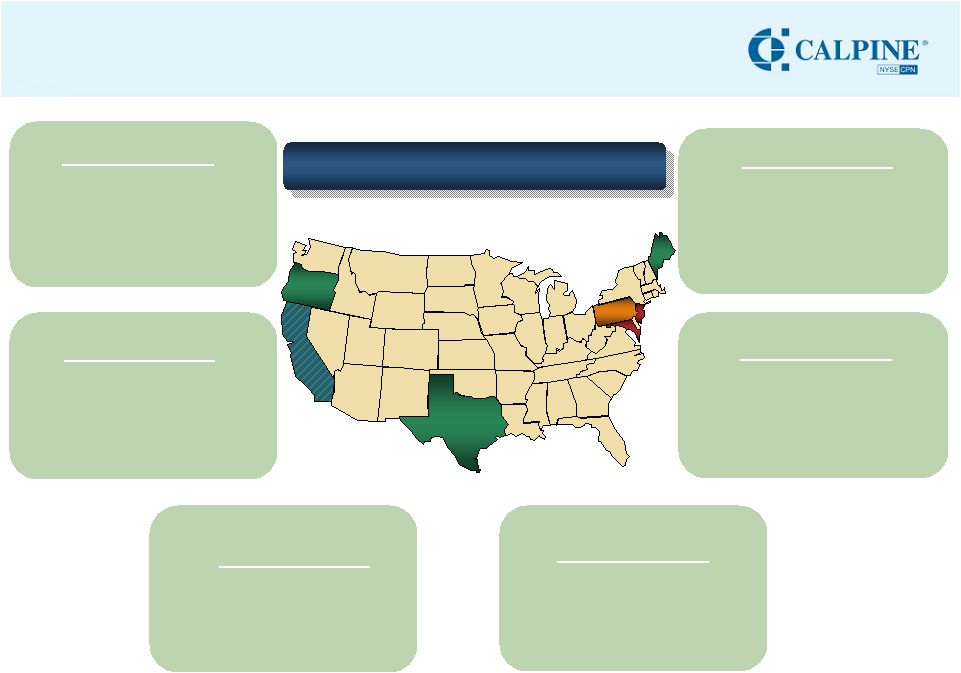
Focusing on the Growth of Calpine Fleet
•
CPUC
approval
July
29
th
•
Scheduled mobilization for early 2011
•
Summer 2013 COD
Los Esteros
Critical Energy Facility
Russell City Energy
Center
•
CPUC approved contract amendment
•
Executed EPC agreement
•
Expect to mobilize in 4Q 2010
•
Summer 2013 COD
•
Project is ~80% complete; on-time &
on budget
•
“First fire”
as soon as next month
•
Summer 2011 COD
York Energy Center
(Delta)
Turbine Upgrades
North Geysers Expansion
•
11 out of 13 scheduled wells have
successfully been completed
•
Steam potential for 40-80 MWs
•
Potential new unit(s): Summer 2013 COD
Green: Upgrades
Orange: Construction
Blue: Advanced Development
Red: Early Development
1
IHR = Incremental Heat Rate in MMBtu/MWh.
PJM Projects
(Early Stage)
•
Sites identified
•
Transmission planning underway
•
Permit(s) under preparation
10
•
501F:
~15
MWs
&
~4.8
IHR
o
4 Completed
o
3 To go in 2010 & 2011
•
7FA:
~10MW
&
sub-5.00
IHR
1
o
Several starting late 2010 –
2011/2012
2010 –
2011 Growth Projects
1 |
 11
11
Stabilize
balance sheet
•
Simplify and optimize capital
structure
•
Improve credit metrics
•
Opportunistically access credit
markets
Our Vision
Three scale
regions
Expand baseload
presence / Organic
growth
Leader in
environmental
responsibility
Premier operating
company
•
Capture embedded opportunities
at existing sites
•
Disciplined M&A (i.e. Conectiv)
•
New builds with contracts
•
Enhance strong presence in
West, Texas, and Northeast
•
Be opportunistic, but financially
disciplined
•
Buy vs. build economics
•
Be recognized for top tier
operations performance
-
Safety
-
Availability
-
Cost
•
Meet or exceed plant-level
business plans
•
Utilize modern fleet to deliver
lower-carbon energy solution
•
Ensure seat at the table for
environmental regulations
•
Leverage geothermal expertise
Customer-oriented
origination business
•
Optimize commercial value of
existing assets
•
Cultivate customer-led growth |
 12
12
APPENDIX |
 13
13
13
13
1
Generation has been adjusted to include net interest in generation from deconsolidated
projects in all periods. Selected Operating Statistics
2Q10
2Q09
2Q10
2Q09
Total MWh
Generated (in thousands)
1
20,737
19,940
Average Capacity Factor, excl. Peakers
42.5%
42.3%
West
6,294
6,724
West
40.2%
46.0%
Texas
8,567
7,922
Texas
52.4%
48.7%
Southeast
4,222
3,957
Southeast
35.3%
34.8%
North
1,654
1,337
North
31.3%
26.3%
Average Availability
87.7%
90.6%
Steam Adjusted Heat Rate (Btu/KWh)
7,306
7,274
West
88.4%
90.7%
West
7,359
7,458
Texas
88.4%
90.7%
Texas
7,222
7,132
Southeast
87.1%
87.7%
Southeast
7,319
7,241
North
85.4%
96.0%
North
7,648
7,687
YTD10
YTD09
YTD10
YTD09
Total MWh
Generated (in thousands)
1
42,518
40,030
Average Capacity Factor, excl. Peakers
44.3%
42.3%
West
16,463
15,661
West
54.2%
54.9%
Texas
15,634
13,503
Texas
47.8%
41.3%
Southeast
7,647
7,836
Southeast
32.8%
34.7%
North
2,774
3,031
North
28.8%
28.6%
Average Availability
89.0%
90.6%
Steam Adjusted Heat Rate (Btu/KWh)
7,266
7,239
West
90.8%
89.9%
West
7,298
7,340
Texas
85.5%
89.5%
Texas
7,169
7,086
Southeast
91.4%
90.9%
Southeast
7,305
7,235
North
88.9%
94.0%
North
7,613
7,658 |
 14
14
14
14
Calpine Operating Power Plants –
As of July 30, 2010
Technology
Load
Type
Location
COD
With
Peaking
Capacity
CPN
Interest
With Peaking
Capacity, Net
West
Region
Agnews
Power Plant*
Natural Gas
Intermediate
CA
1990
28
100%
28
Blue Spruce Energy Center
Natural Gas
Peaking
CO
2003
310
100%
310
Creed Energy Center
Natural Gas
Peaking
CA
2003
47
100%
47
Delta Energy Center
Natural Gas
Intermediate
CA
2002
857
100%
857
Feather River Energy Center
Natural Gas
Peaking
CA
2002
47
100%
47
Geysers (15 plants)
Geothermal
Baseload
CA
1971 -
1989
725
100%
725
Gilroy Cogeneration Plant*
Natural Gas
Intermediate
CA
1988
128
100%
128
Gilroy Energy Center
Natural Gas
Peaking
CA
2002
141
100%
141
Goose Haven Energy Center
Natural Gas
Peaking
CA
2003
47
100%
47
Greenleaf 1 Power Plant*
Natural Gas
Intermediate
CA
1989
50
100%
50
Greenleaf 2 Power Plant*
Natural Gas
Intermediate
CA
1989
49
100%
49
Hermiston Power Project
Natural Gas
Intermediate
OR
2002
616
100%
616
King City Cogeneration Plant*
Natural Gas
Intermediate
CA
1989
120
100%
120
King City Peaking Energy Center
Natural Gas
Peaking
CA
2002
44
100%
44
Lambie
Energy Center
Natural Gas
Peaking
CA
2003
47
100%
47
Los Esteros
Critical Energy Facility
Natural Gas
Peaking
CA
2003
188
100%
188
Los Medanos
Energy Center*
Natural Gas
Intermediate
CA
2001
560
100%
560
Metcalf Energy Center
Natural Gas
Intermediate
CA
2005
605
100%
605
Otay
Mesa Energy Center
Natural Gas
Intermediate
CA
2009
608
100%
608
Pastoria
Energy Center
Natural Gas
Intermediate
CA
2005
729
100%
729
Riverview Energy Center
Natural Gas
Peaking
CA
2003
47
100%
47
Rocky Mountain Energy Center
Natural Gas
Intermediate
CO
2004
621
100%
621
South Point Energy Center
Natural Gas
Intermediate
AZ
2001
530
100%
530
Sutter Energy Center
Natural Gas
Intermediate
CA
2001
578
100%
578
Wolfskill
Energy Center
Natural Gas
Peaking
CA
2003
48
100%
48
Yuba City Energy Center
Natural Gas
Peaking
CA
2002
47
100%
47
Total -
West Region
7,817
Texas Region
Baytown Energy Center*
Natural Gas
Intermediate
TX
2002
800
100%
800
Brazos Valley Power Plant
Natural Gas
Intermediate
TX
2003
594
100%
594
Channel Energy Center*
Natural Gas
Intermediate
TX
2001
608
100%
608
Clear Lake Power Plant*
Natural Gas
Intermediate
TX
1985
400
100%
400
Corpus Christi Energy Center*
Natural Gas
Intermediate
TX
2002
500
100%
500
Deer Park Energy Center*
Natural Gas
Intermediate
TX
2003
1,001
100%
1,001
Freeport Energy Center*
Natural Gas
Intermediate
TX
2007
236
100%
236
Freestone Energy Center
Natural Gas
Intermediate
TX
2002
994
100%
994
Hidalgo Energy Center
Natural Gas
Intermediate
TX
2000
476
79%
374
Magic Valley Generation Station
Natural Gas
Intermediate
TX
2002
692
100%
692
Pasadena Power Plant*
Natural Gas
Intermediate
TX
1998
781
100%
781
Texas City Power Plant*
Natural Gas
Intermediate
TX
1987
453
100%
453
Total -
Texas Region
7,433 |
 15
15
15
15
Calpine Operating Power Plants (cont’d) –
As of July 30, 2010
Technology
Load
Type
Location
COD
With
Peaking
Capacity
CPN
Interest
With Peaking
Capacity, Net
North Region
Bayview
Oil
Peaking
VA
1963
12
100%
12
Bethlehem
Natural Gas / Oil
Intermediate
PA
2003
1,130
100%
1,130
Bethpage Energy Center 3
Natural Gas
Intermediate
NY
2005
80
100%
80
Bethpage Peaker
Natural Gas
Peaking
NY
2002
48
100%
48
Bethpage Power Plant
Natural Gas
Intermediate
NY
1989
56
100%
56
Conectiv Peakers**
Natural Gas / Oil
Peaking
NJ/DE/MD/VA
1964-1991
569
100%
569
Cumberland
Natural Gas / Oil
Peaking
NJ
1990/2009
191
100%
191
Deepwater
Natural Gas / Oil
Peaking
NJ
1954/1958
158
100%
158
Edge Moor
Natural Gas / Oil
Peaking
DE
1973
725
100%
725
Greenfield Energy Centre
Natural Gas
Intermediate
Ontario, CA
2008
1,038
50%
519
Hay Road
Natural Gas / Oil
Intermediate
DE
1989
1,130
100%
1,130
Kennedy Int'l Airport Power Plant*
Natural Gas
Intermediate
NY
1995
121
100%
121
Mankato Power Plant
Natural Gas
Intermediate
MN
2006
375
100%
375
Riverside Energy Center
Natural Gas
Intermediate
WI
2004
603
100%
603
RockGen Energy Center
Natural Gas
Peaking
WI
2001
503
100%
503
Stony Brook Power Plant*
Natural Gas
Intermediate
NY
1995
47
100%
47
Vineland Solar
Solar
Peaking
NJ
2009
4
100%
4
Westbrook Energy Center
Natural Gas
Intermediate
ME
2001
537
100%
537
Whitby Cogen*
Natural Gas
Intermediate
Ontario, CA
1998
50
50%
25
Zion Energy Center
Natural Gas
Peaking
IL
2002
503
100%
503
Total - North Region
7,336
Southeast Region
Auburndale Peaking Energy Center
Natural Gas
Peaking
FL
2002
117
100%
117
Broad River Energy Center
Natural Gas
Peaking
SC
2000
847
100%
847
Carville Energy Center*
Natural Gas
Intermediate
LA
2003
501
100%
501
Columbia Energy Center*
Natural Gas
Intermediate
SC
2004
606
100%
606
Decatur Energy Center
Natural Gas
Intermediate
AL
2002
795
100%
795
Hog Bayou Energy Center
Natural Gas
Intermediate
AL
2001
237
100%
237
Morgan Energy Center*
Natural Gas
Intermediate
AL
2003
807
100%
807
Oneta Energy Center
Natural Gas
Intermediate
OK
2002
1,134
100%
1,134
Osprey Energy Center
Natural Gas
Intermediate
FL
2004
599
100%
599
Pine Bluff Energy Center*
Natural Gas
Intermediate
AR
2001
215
100%
215
Santa Rosa Energy Center
Natural Gas
Intermediate
FL
2003
225
100%
225
Total - Southeast Region
6,083
TOTAL - CALPINE
28,669
* Indicates cogeneration plant
** Includes: Carll's Corner, Cedar, Christiana, Delaware City, Mickleton, Middle,
Missouri Avenue, Sherman Avenue, Tasley, and West |
 |
