Attached files
| file | filename |
|---|---|
| 8-K - POPE RESOURCES, A DELAWARE LIMITED PARTNERSHIP 8-K - POPE RESOURCES LTD PARTNERSHIP | a6436195.htm |
Exhibit 99.1
POPE RESOURCES L.P. ( POPE RESOURCES L.P. (Nasdaq:POPE Nasdaq:POPE) Investor Presentation September 2010
Safe Harbor Safe Harbor This presentation contains forward-looking statements. These forward- looking statements are subject to a number of risks and should not be relied upon as predictions of future events or promises of a given course of action. Some of the forward-looking statements can be identified by the use of forward-looking words such as “believes”, “expects”, “may”, “will”, “should”, “seeks”, “approximately”, “intends”, “plans”, “estimates”, “projects”, “strategy” or “anticipates” or the negative of those words or other comparable terminology. Forward-looking statements involve inherent risks and uncertainties. A number of important factors could cause actual results to differ materially from those described in the forward-looking statements. Some of these factors include environmental issues affecting our properties; changes in forestry, land use, environmental, and other governmental regulations; risk of losses from fires, floods, windstorms, and other natural disasters; risk of loss from insect infestations or tree diseases; changes in economic conditions and competition in our domestic and export markets; an unanticipated reduction in the demand for timber products and/or an unanticipated increase in the supply of timber products; and other factors described from time to time in our filings with the Securities and Exchange Commission.
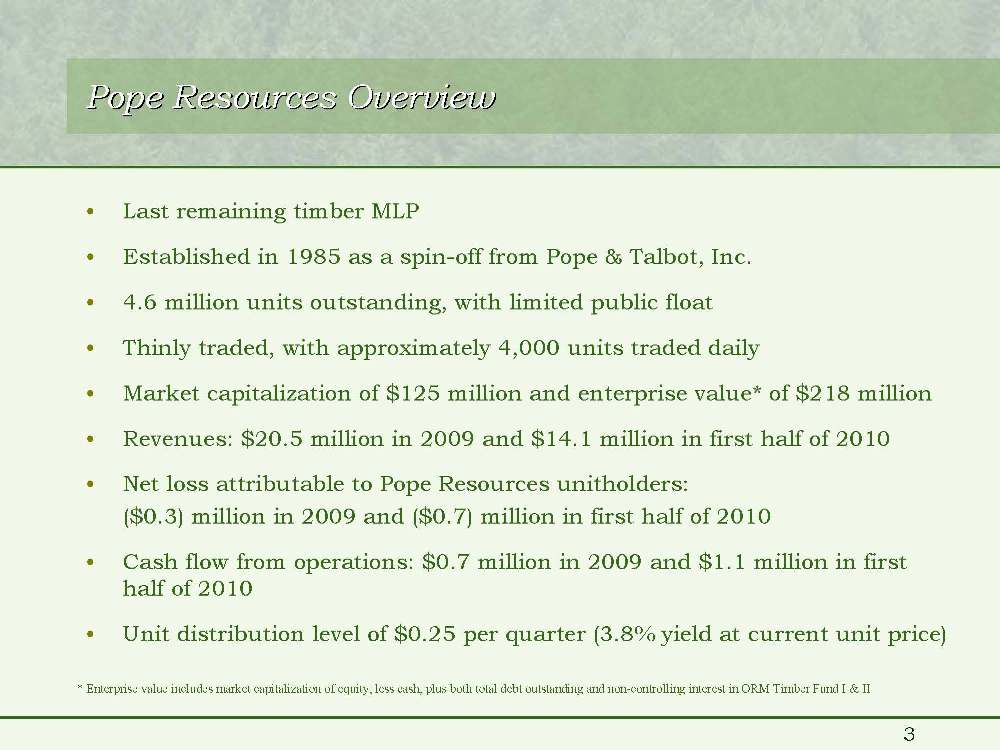
• Last remaining timber MLP • Established in 1985 as a spin-off from Pope & Talbot, Inc. • 4.6 million units outstanding, with limited public float • Thinly traded, with approximately 4,000 units traded daily • Market capitalization of $125 million and enterprise value* of $218 million • Revenues: $20.5 million in 2009 and $14.1 million in first half of 2010 • Net loss attributable to Pope Resources unitholders: ($0.3) million in 2009 and ($0.7) million in first half of 2010 • Cash flow from operations: $0.7 million in 2009 and $1.1 million in first half of 2010 • Unit distribution level of $0.25 per quarter (3.8% yield at current unit price) Pope Resources Overview Pope Resources Overview * Enterprise value includes market capitalization of equity, less cash, plus both total debt outstanding and non-controlling interest in ORM Timber Fund I & II
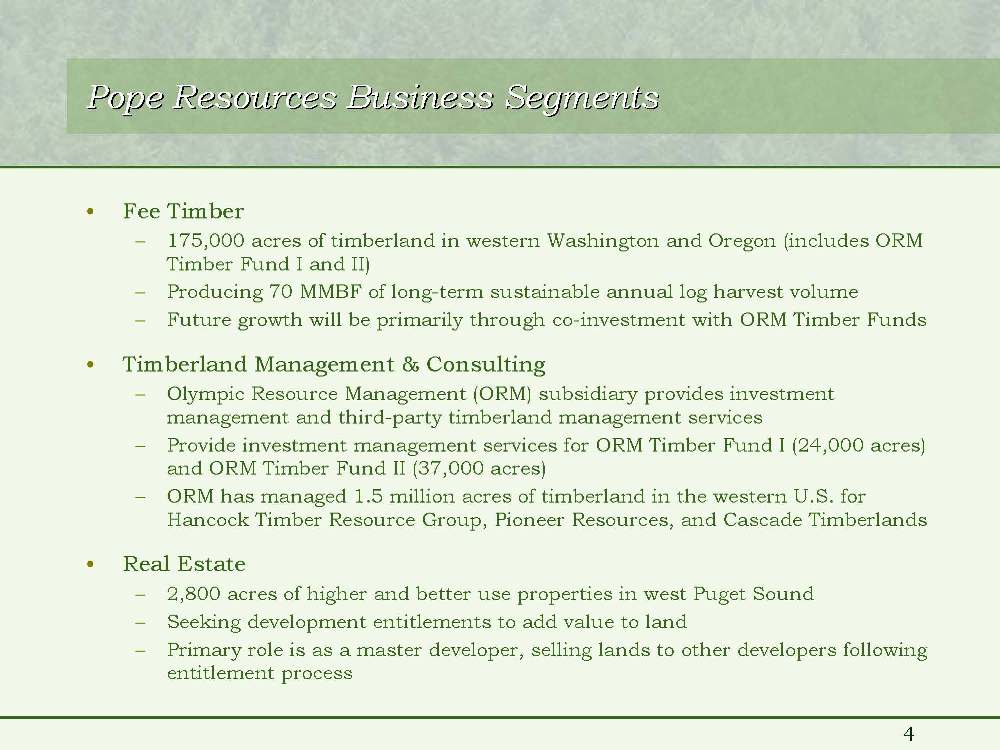
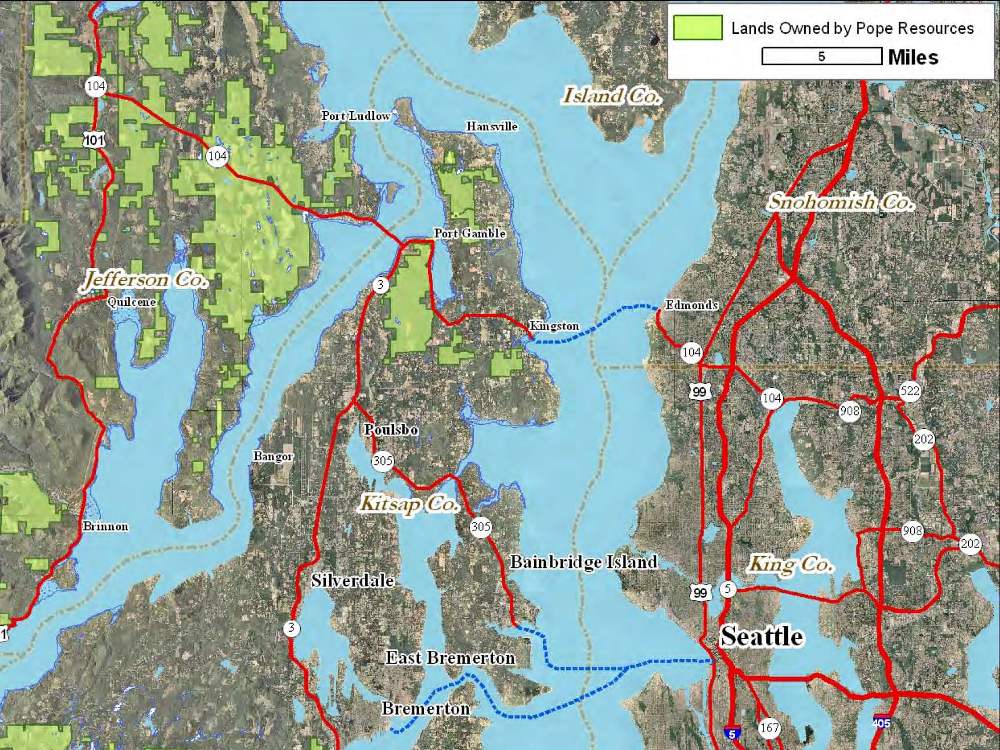
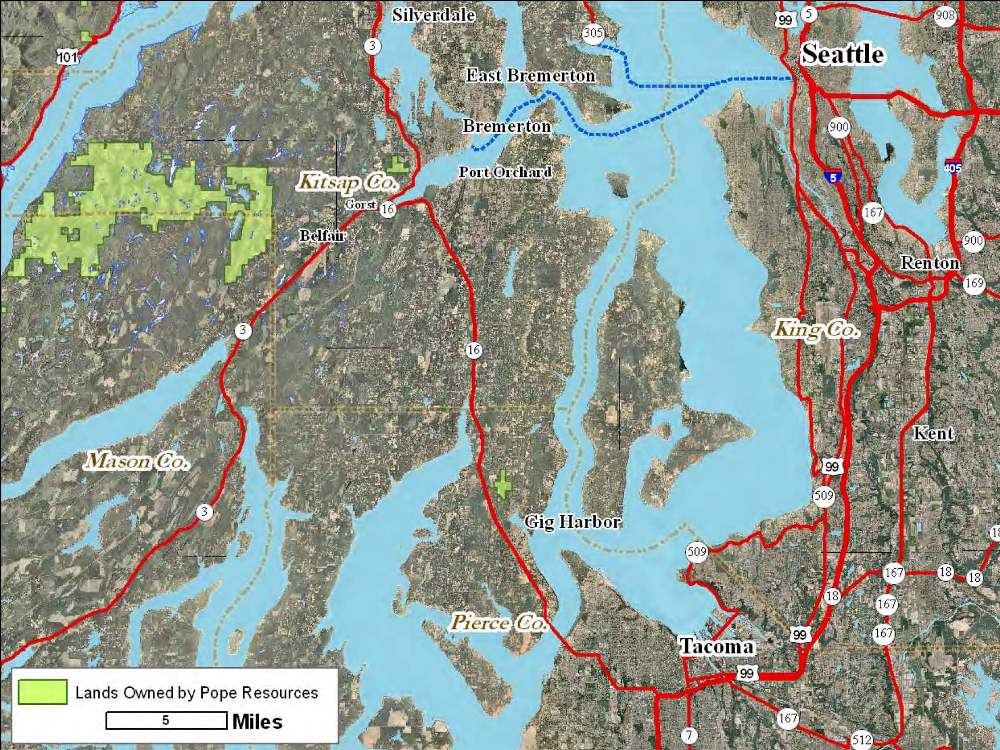
Pope Resources Business Segments Pope Resources Business Segments• Fee Timber– 175,000 acres of timberland in western Washington and Oregon (includes ORM Timber Fund I and II)– Producing 70 MMBF of long-term sustainable annual log harvest volume – Future growth will be primarily through co-investment with ORM Timber Funds• Timberland Management & Consulting – Olympic Resource Management (ORM) subsidiary provides investment management and third-party timberland management services – Provide investment management services for ORM Timber Fund I (24,000 acres) and ORM Timber Fund II (37,000 acres)– ORM has managed 1.5 million acres of timberland in the western U.S. for Hancock Timber Resource Group, Pioneer Resources, and Cascade Timberlands • Real Estate– 2,800 acres of higher and better use properties in west Puget Sound– Seeking development entitlements to add value to land– Primary role is as a master developer, selling lands to other developers following entitlement process
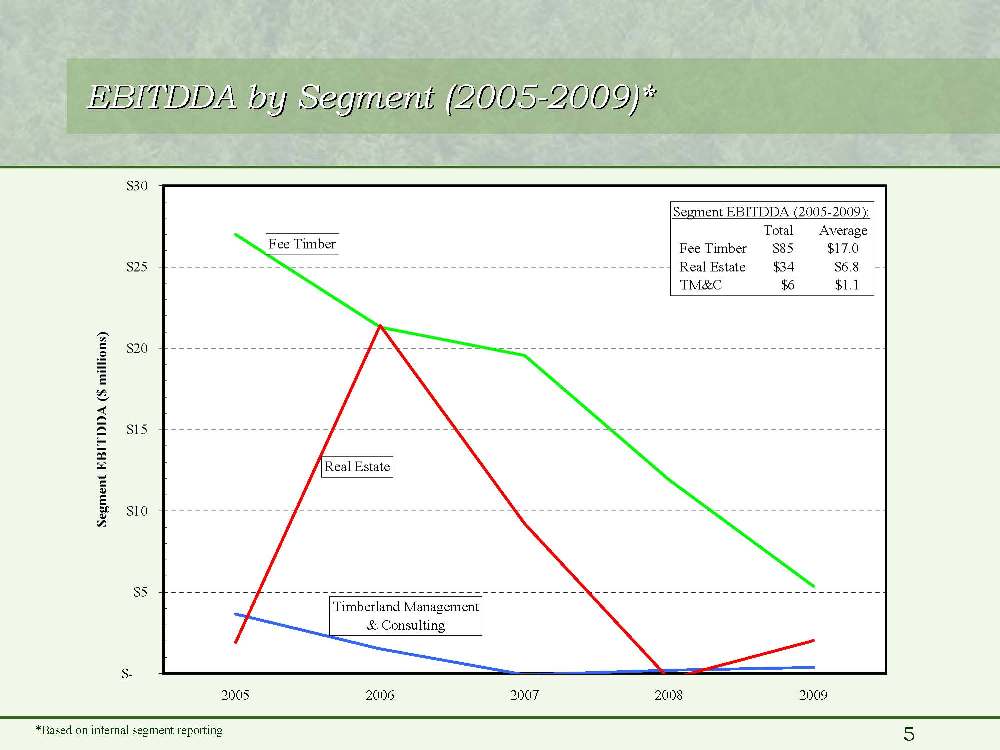
EBITDDA by Segment (2005 EBITDDA by Segment (2005-2009)* 2009)*$-$5$10$15$20$25$3020052006200720082009Segment EBITDDA ($ millions)Real EstateTimberland Management & ConsultingFee TimberSegment EBITDDA (2005-2009): Total Average Fee Timber $85 $17.0 Real Estate $34 $6.8 TM&C $6 $1.1 *Based on internal segment reporting
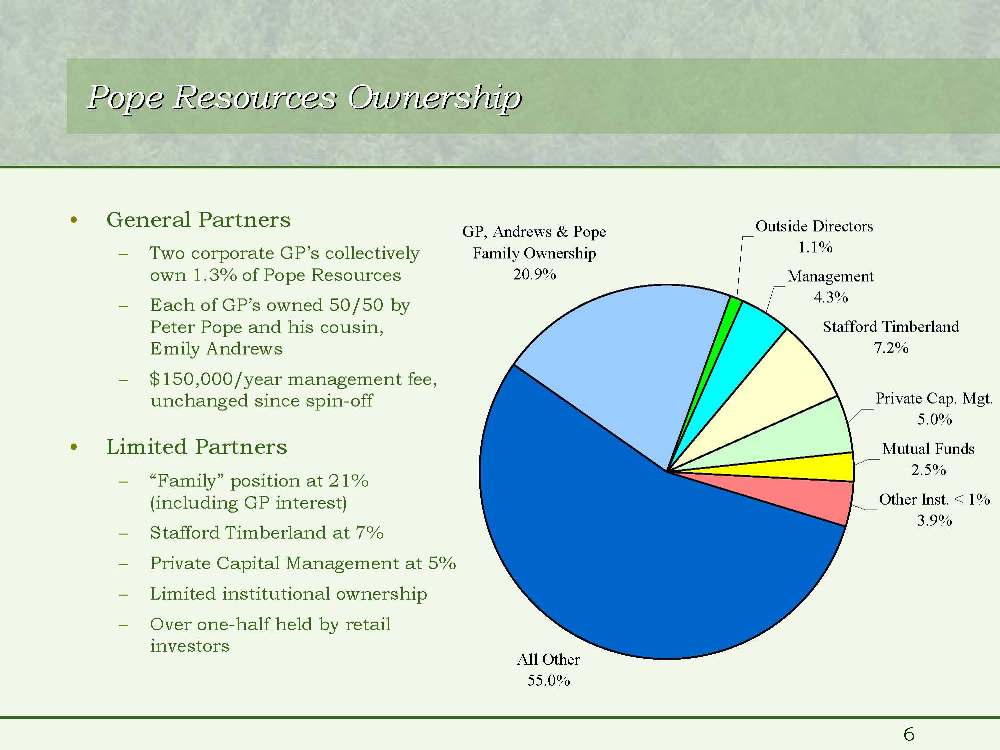
Pope Resources Ownership Pope Resources Ownership• General Partners– Two corporate GP’s collectively own 1.3% of Pope Resources– Each of GP’s owned 50/50 by Peter Pope and his cousin, Emily Andrews– $150,000/year management fee, unchanged since spin-off• Limited Partners– “Family” position at 21% (including GP interest)– Stafford Timberland at 7%– Private Capital Management at 5%– Limited institutional ownership– Over one-half held by retail investorsOutside Directors1.1%Management4.3%Stafford Timberland7.2%Private Cap. Mgt.5.0%Mutual Funds2.5%Other Inst. < 1%3.9%All Other55.0%GP, Andrews & Pope Family Ownership20.9%
Recent Trends in POPE Trading Activity Recent Trends in POPE Trading Activity• Improved liquidity– Increased trading volume during the past five years, spurred originally by investment newsletter article in early 2005– Average daily trading volume has increased significantly• 1,300 units per day during 2000-2004 • 5,100 units per day during 2005-2009– Average trade size has declined to under 200 units in past few years from over 500 units during the early part of this decade– Much more market maker interest and tighter bid-ask spreads• Significant change in institutional ownership over past few years– Two largest institutional owners greatly decreased their positions, putting downward pressure on unit price – Modest increase in mutual fund and other institutional ownership– Increases in ownership by retail investors, management, and outside directors• Unit repurchase programs dating back to late 2007 have retired 252,000 units, or 5.3% of total units previously outstanding
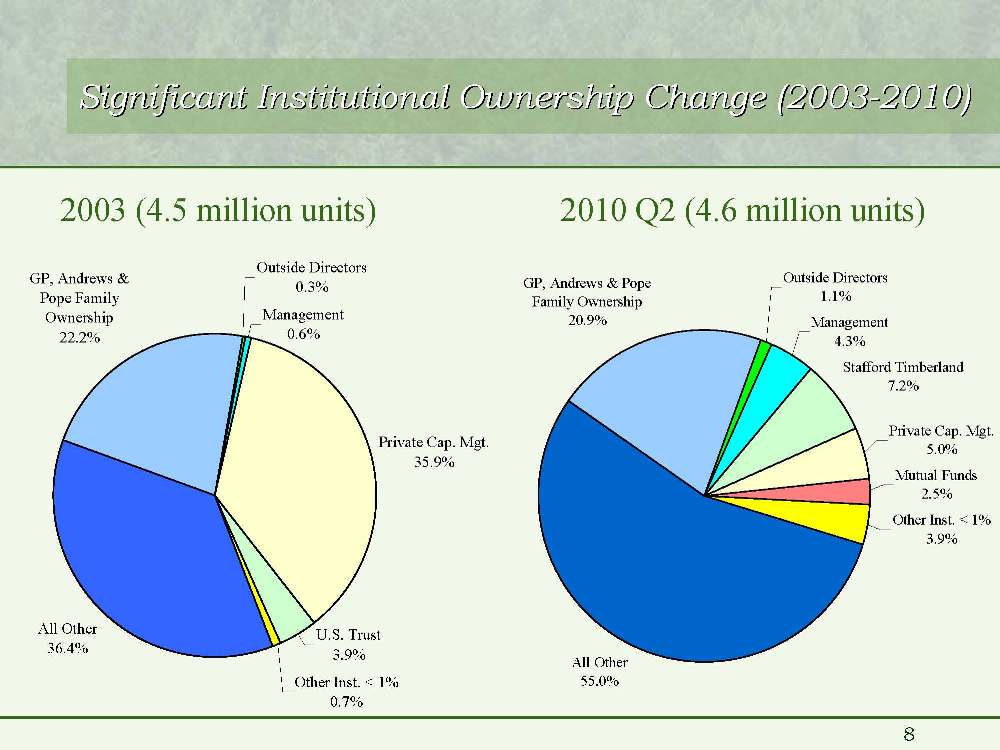
Significant Institutional Ownership Change (2003 Significant Institutional Ownership Change (2003-2010) 2010)Outside Directors0.3%Management0.6%Private Cap. Mgt.35.9%U.S. Trust3.9%Other Inst. < 1%0.7%All Other36.4%GP, Andrews & Pope Family Ownership22.2%2003 (4.5 million units) 2010 Q2 (4.6 million units)Outside Directors1.1%Management4.3%Stafford Timberland7.2%Private Cap. Mgt.5.0%Mutual Funds2.5%Other Inst. < 1%3.9%All Other55.0%GP, Andrews & Pope Family Ownership20.9%
Pope Resources Pope Resources - Summary of Investment Opportunity Summary of Investment Opportunity• Deep discount to NAV– Imputed value of all lands (fee timber, 20% of ORM Timber Fund I & II, and real estate portfolio) is approximately $1,200 per acre• Substantially below comparable timberland sales values and less than half the price of recent Timber Fund acquisitions– Current Unit price appears to place no value on real estate portfolio, which is positioned to capitalize on recovering west Puget Sound real estate market• If real estate portfolio was only worth its book value of $27 million, the implied value of timber portfolio would be approximately $1,000 per acre• Highly tax-efficient vehicle for investing in timberland asset class– Efficient flow-through tax treatment– Competitive after-tax distribution yield relative to timber REITs– Compelling diversification benefits of timberland asset class• Adding value through use of free cash flow – Co-investment in ORM Timber Funds– Periodic repurchase of units• Improved alignment with increased insider ownership in recent years
Market Perceptions Contributing to High Discount to NAV Market Perceptions Contributing to High Discount to NAV• Small size– Enterprise value of peer companies substantially larger than Pope Resources (Deltic 3x, Potlatch 8x, Rayonier 20x, Plum Creek 42x larger as of YE 2009)• Very low liquidity– Limited float with over one-quarter of the units essentially not traded• K-1 tax reporting limits potential investor pool• Pope Resources cut quarterly distribution by 75% in 2009– While distribution was recently increased, it is still 38% lower than in 2008• Difficulty of characterizing real estate portfolio– Breadth of project type within portfolio adds to challenge– Real estate portfolio creating “lumpy” cash flows • Timber has never been efficiently valued in public markets– Markets do not account for varied age-class structures– Exacerbated by reductions in harvest beginning in 2008
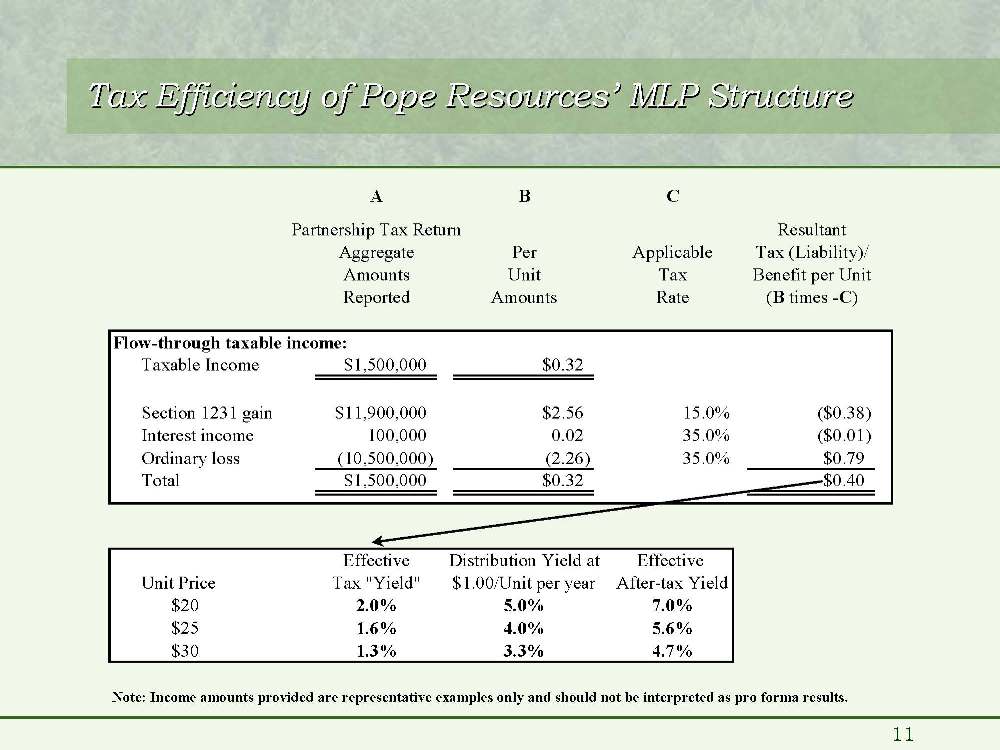
Tax Efficiency of Pope Resources Tax Efficiency of Pope Resources’ MLP Structure MLP StructureABCPartnership Tax ReturnResultantAggregatePerApplicableTax (Liability)/AmountsUnitTaxBenefit per UnitReportedAmountsRate(B times -C)Flow-through taxable income:Taxable Income$1,500,000$0.32Section 1231 gain$11,900,000$2.5615.0%($0.38)Interest income100,0000.02 35.0%($0.01)Ordinary loss(10,500,000)(2.26) 35.0%$0.79Total $1,500,000$0.32$0.40EffectiveDistribution Yield atEffective Unit PriceTax "Yield"$1.00/Unit per yearAfter-tax Yield$202.0%5.0%7.0%$251.6%4.0%5.6%$301.3%3.3%4.7%Note: Income amounts provided are representative examples only and should not be interpreted as pro forma results.
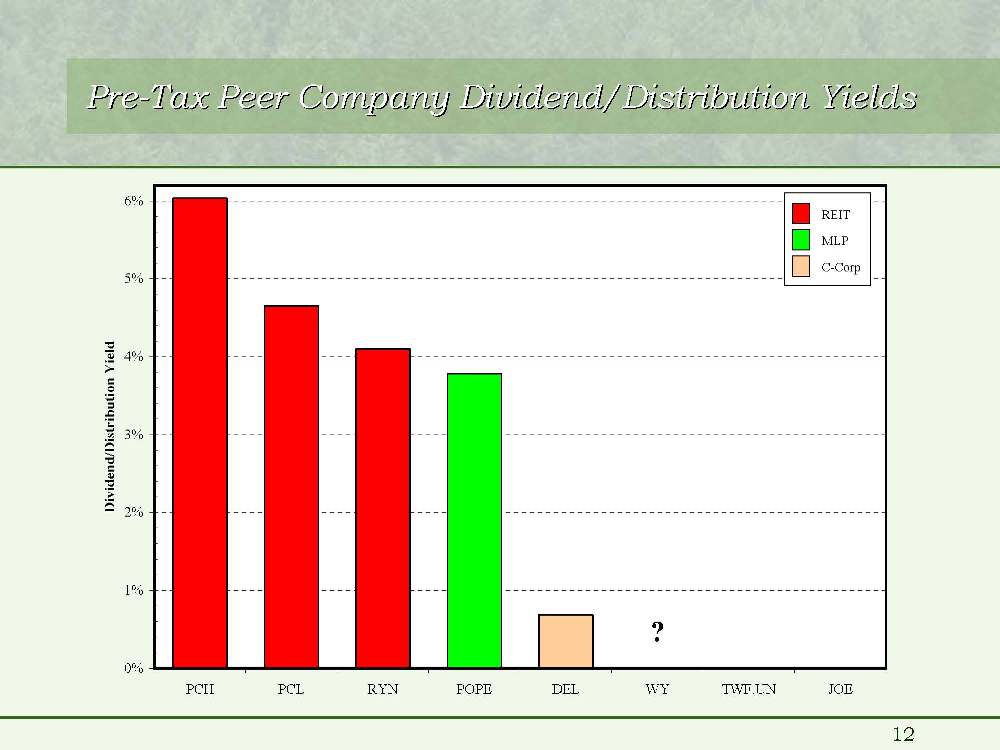
Pre Pre-Tax Peer Company Dividend/Distribution Yields Tax Peer Company Dividend/Distribution Yields0%1%2%3%4%5%6%PCHPCLRYNPOPEDELWYTWF.UNJOEDividend/Distribution YieldC-CorpMLPREIT ?
Capital Allocation Strategy and Growth Capital Capital Allocation Strategy and Growth Capital• Free cash flow planned for: – Quarterly distributions– Co-investment in ORM Timber Funds– Where appropriate, investing in real estate projects– Periodically repurchasing units in open market– Opportunistically pursuing fee (owned) timberland acquisitions• Growth Capital– Near-term growth expected to be fueled primarily by organic cash flow generation• Free cash flow generation from timber harvest• “Lumpy” monetization of Real Estate portfolio – Untapped $20 million line of credit along with incremental debt capacity positions Pope Resources to be able to capitalize on investment opportunities– No current expectation for secondary or rights offering of units• Equity “currency” too cheap to issue new units
Pope Pope’s Four Responses to Collapse in Housing Market s Four Responses to Collapse in Housing Market• Deferred harvest– Beginning in 2008, we aggressively reduced harvest levels– Deferred 15 MMBF in 2008, 20 MMBF in 2009, and 11 MMBF in 2010E– With biological growth, deferred volume will total over 50 MMBF at YE 2010• Cut costs– Acted quickly in Q1 2009 by reducing staffing and cutting full-year operating expenses by 25% relative to 2008 – Reduced capital expenditures across all business lines• Restructured debt– Refinanced two timber mortgages set to expire in 2011, resulting in lower interest expense going forward, no scheduled principal amortization, and spreading our the maturities into four tranches• Grew our timber fund business– Closed our second timber fund and invested $92 million over past year– Able to buy four quality tree farms at attractive prices– 20% co-investment will result in significant incremental cash flows

Debt Restructuring in 2009-2010 2010• Pope had two timber mortgages totaling $27.8 million, with a weighted average interest rate of 8.25%, that were both set to expire in April 2011• To reduce refinancing risk, lower interest expense, and spread out the term length, both mortgages were refinanced over the past year• Each mortgage had a make-whole premium which was rolled into the new mortgages (total of $2.4 million)• The two new mortgages are both interest-only mortgages, with the following interest rates and remaining term to maturity:– $5.0 million: 4.10% 5-year– $5.0 million: 4.85% 7-year– $9.8 million: 6.40% 9-year– $10.0 million: 6.05% 15-year– $29.8 million: 5.64% 10-year weighted average term• ORM Timber Fund II has a 10-year, interest-only mortgage for $11 million with an interest rate of 4.85%
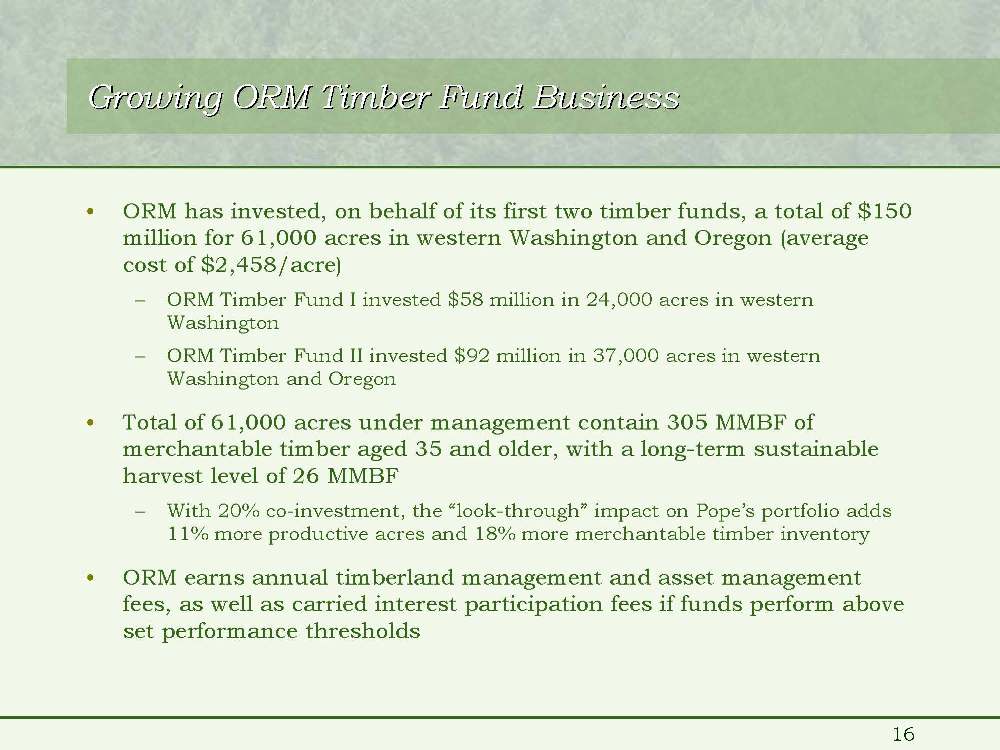
Growing ORM Timber Fund Business Growing ORM Timber Fund Business• ORM has invested, on behalf of its first two timber funds, a total of $150 million for 61,000 acres in western Washington and Oregon (average cost of $2,458/acre)– ORM Timber Fund I invested $58 million in 24,000 acres in western Washington– ORM Timber Fund II invested $92 million in 37,000 acres in western Washington and Oregon• Total of 61,000 acres under management contain 305 MMBF of merchantable timber aged 35 and older, with a long-term sustainable harvest level of 26 MMBF– With 20% co-investment, the “look-through” impact on Pope’s portfolio adds 11% more productive acres and 18% more merchantable timber inventory• ORM earns annual timberland management and asset management fees, as well as carried interest participation fees if funds perform above set performance thresholds
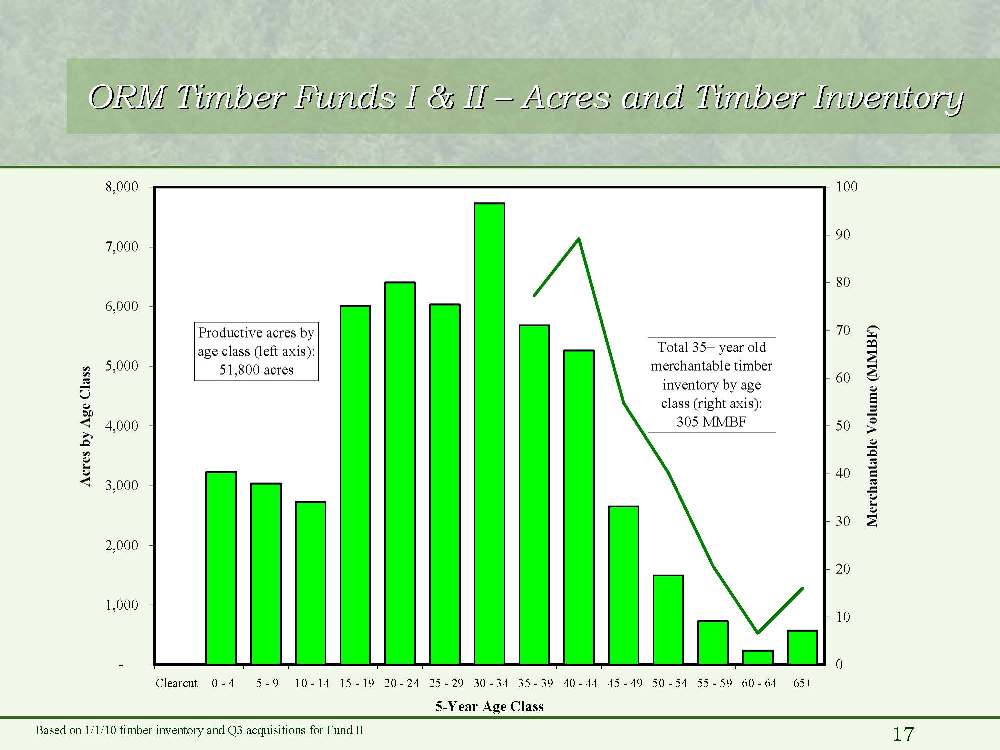
ORM Timber Funds I & II ORM Timber Funds I & II – Acres and Timber Inventory Acres and Timber InventoryBased on 1/1/10 timber inventory and Q3 acquisitions for Fund II-1,0002,0003,0004,0005,0006,0007,0008,000Clearcut 0 - 4 5 - 9 10 - 14 15 - 19 20 - 24 25 - 29 30 - 34 35 - 39 40 - 44 45 - 49 50 - 54 55 - 59 60 - 6465+5-Year Age ClassAcres by Age Class0102030405060708090100Merchantable Volume (MMBF)Productive acres by age class (left axis):51,800 acresTotal 35+ year oldmerchantable timber inventory by age class (right axis):305 MMBF
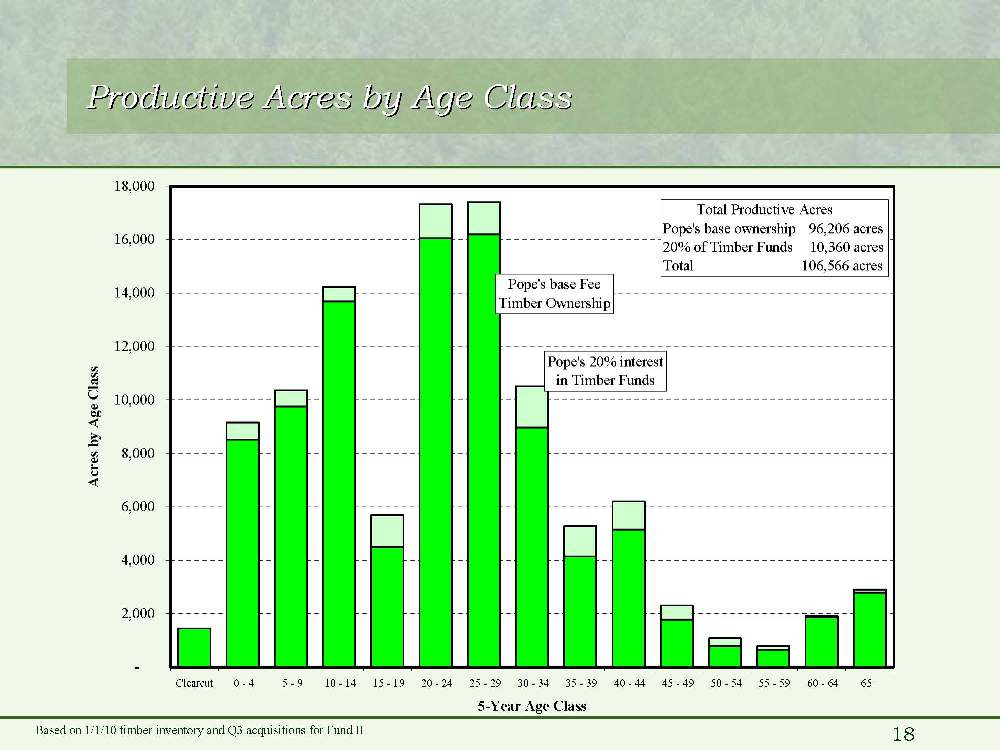
Productive Acres by Age Class Productive Acres by Age ClassBased on 1/1/10 timber inventory and Q3 acquisitions for Fund II-2,0004,0006,0008,00010,00012,00014,00016,00018,000Clearcut 0 - 4 5 - 9 10 - 14 15 - 19 20 - 24 25 - 29 30 - 34 35 - 39 40 - 44 45 - 49 50 - 54 55 - 59 60 - 6465+5-Year Age ClassAcres by Age ClassPope's 20% interest in Timber FundsPope's base Fee Timber Ownership Total Productive AcresPope's base ownership 96,206 acres20% of Timber Funds 10,360 acresTotal 106,566 acres
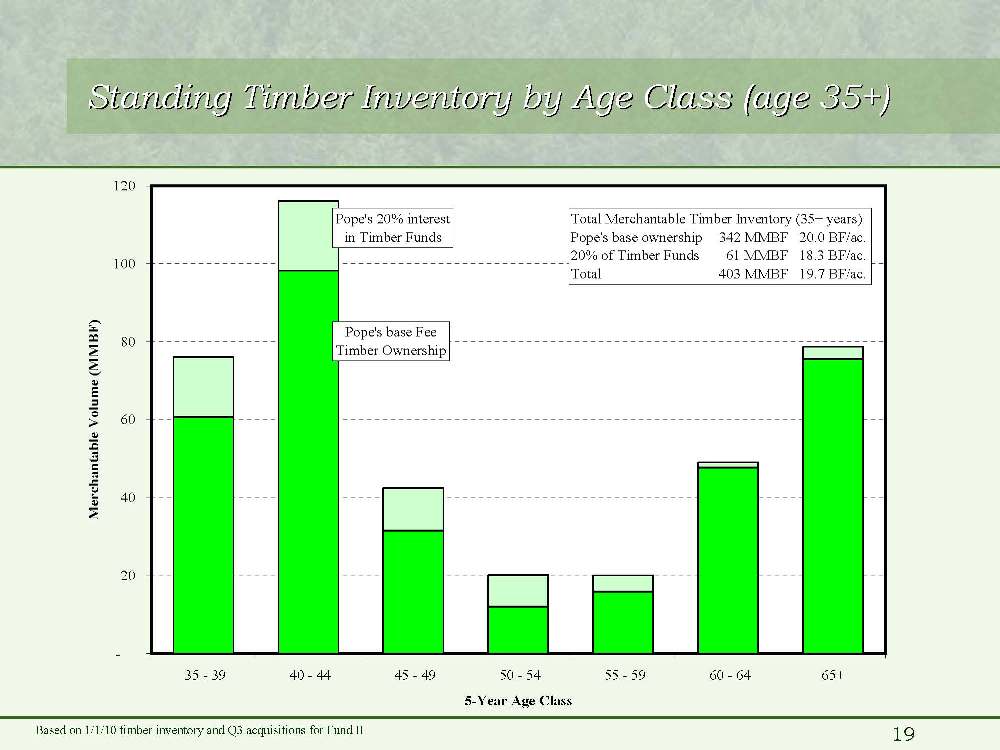
Standing Timber Inventory by Age Class (age 35+) Standing Timber Inventory by Age Class (age 35+)Based on 1/1/10 timber inventory and Q3 acquisitions for Fund II-20406080100120 35 - 39 40 - 44 45 - 49 50 - 54 55 - 59 60 - 6465+5-Year Age ClassMerchantable Volume (MMBF)Pope's 20% interest in Timber FundsPope's base Fee Timber OwnershipTotal Merchantable Timber Inventory (35+ years)Pope's base ownership 342 MMBF 20.0 BF/ac.20% of Timber Funds 61 MMBF 18.3 BF/ac.Total 403 MMBF 19.7 BF/ac.
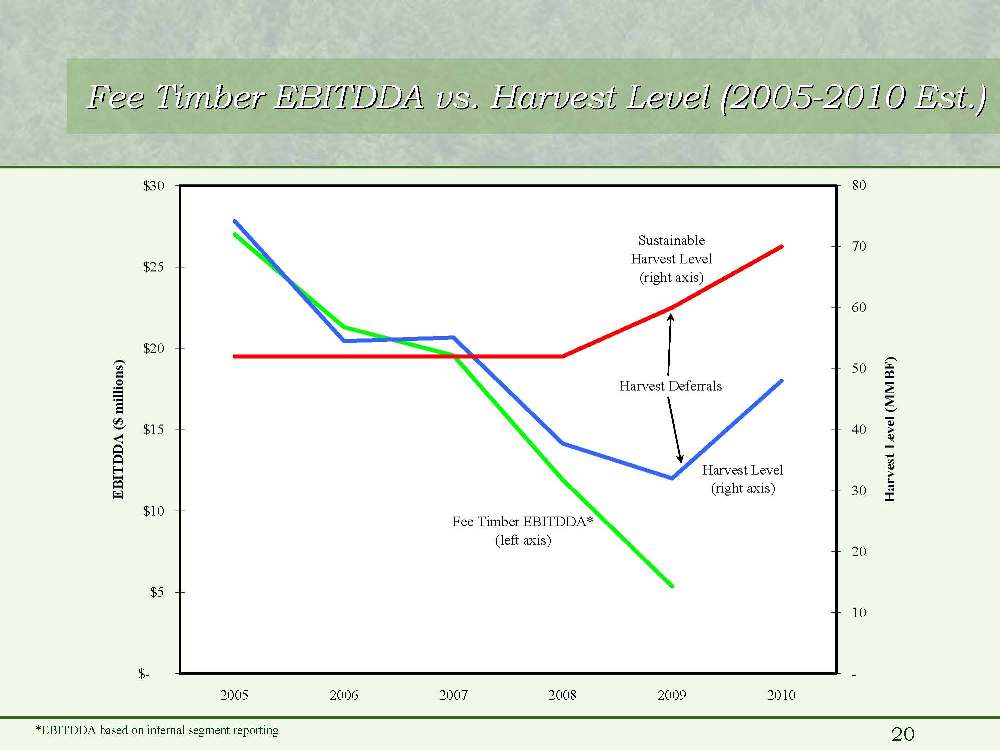
Fee Timber EBITDDA vs. Harvest Level (2005-2010 Est.) 2010 Est.)*EBITDDA based on internal segment reporting$-$5$10$15$20$25$30200520062007200820092010EBITDDA ($ millions)-1020304050607080Harvest Level (MMBF)Harvest DeferralsFee Timber EBITDDA* (left axis)Harvest Level (right axis)SustainableHarvest Level (right axis)
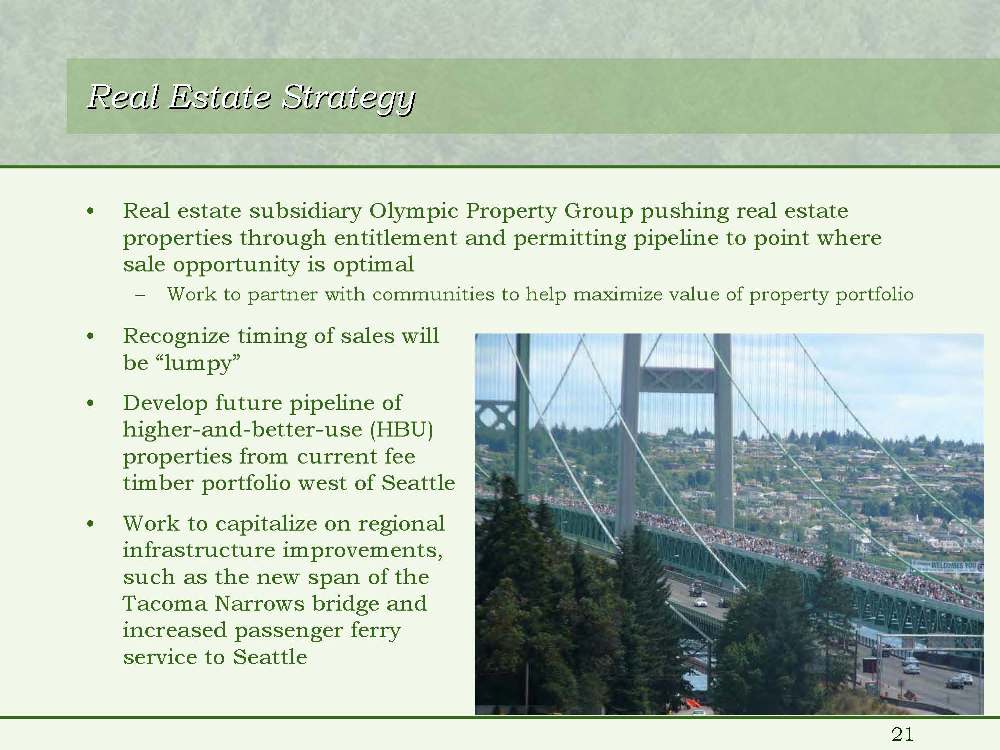
Real Estate Strategy Real Estate Strategy • Real estate subsidiary Olympic Property Group pushing real estate properties through entitlement and permitting pipeline to point where sale opportunity is optimal – Work to partner with communities to help maximize value of property portfolio• Recognize timing of sales will be “lumpy”• Develop future pipeline of higher-and-better-use (HBU) properties from current fee timber portfolio west of Seattle• Work to capitalize on regional infrastructure improvements, such as the new span of the Tacoma Narrows bridge and increased passenger ferry service to Seattle
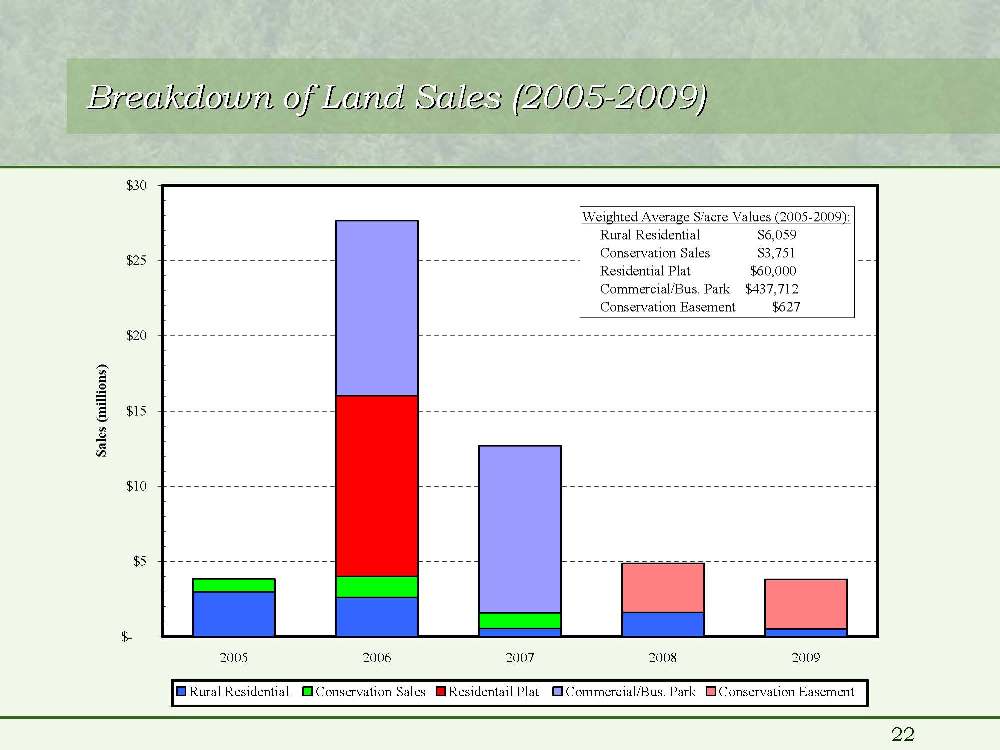
Breakdown of Land Sales (2005 Breakdown of Land Sales (2005-2009) 2009)$-$5$10$15$20$25$3020052006200720082009Sales (millions)Rural Residential Conservation Sales Residentail Plat Commercial/Bus. Park Conservation Easement Weighted Average $/acre Values (2005-2009): Rural Residential $6,059 Conservation Sales $3,751 Residential Plat $60,000 Commercial/Bus. Park $437,712 Conservation Easement $627
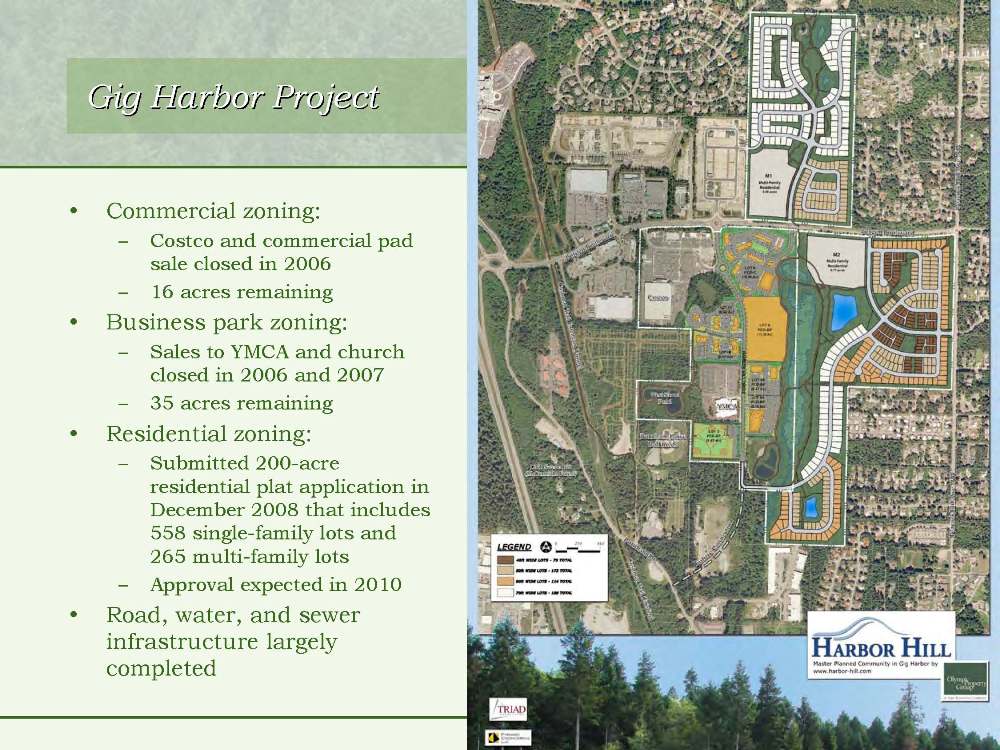
Gig Harbor Project Gig Harbor Project• Commercial zoning:– Costco and commercial pad sale closed in 2006 – 16 acres remaining• Business park zoning:– Sales to YMCA and church closed in 2006 and 2007– 35 acres remaining• Residential zoning:– Submitted 200-acre residential plat application in December 2008 that includes 558 single-family lots and 265 multi-family lots – Approval expected in 2010• Road, water, and sewer infrastructure largely completed
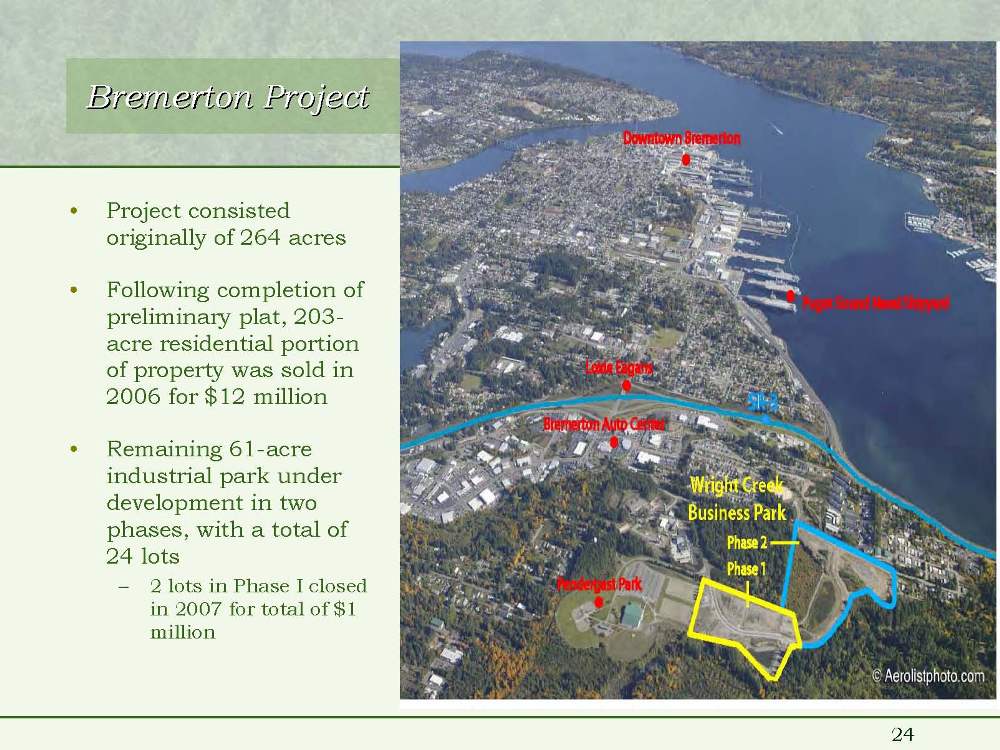
Bremerton Project Bremerton Project• Project consisted originally of 264 acres• Following completion of preliminary plat, 203- acre residential portion of property was sold in 2006 for $12 million • Remaining 61-acre industrial park under development in two phases, with a total of 24 lots– 2 lots in Phase I closed in 2007 for total of $1 million
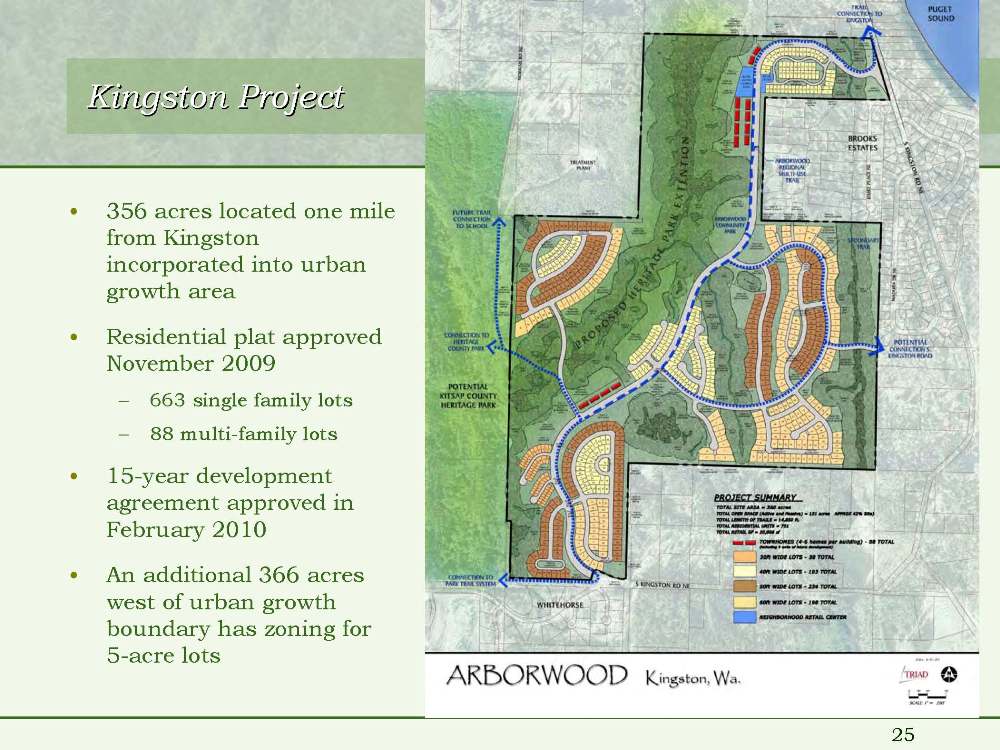
Kingston Project• 356 acres located one mile from Kingston incorporated into urban growth area• Residential plat approved November 2009 – 663 single family lots– 88 multi-family lots• 15-year development agreement approved in February 2010• An additional 366 acres west of urban growth boundary has zoning for 5-acre lots
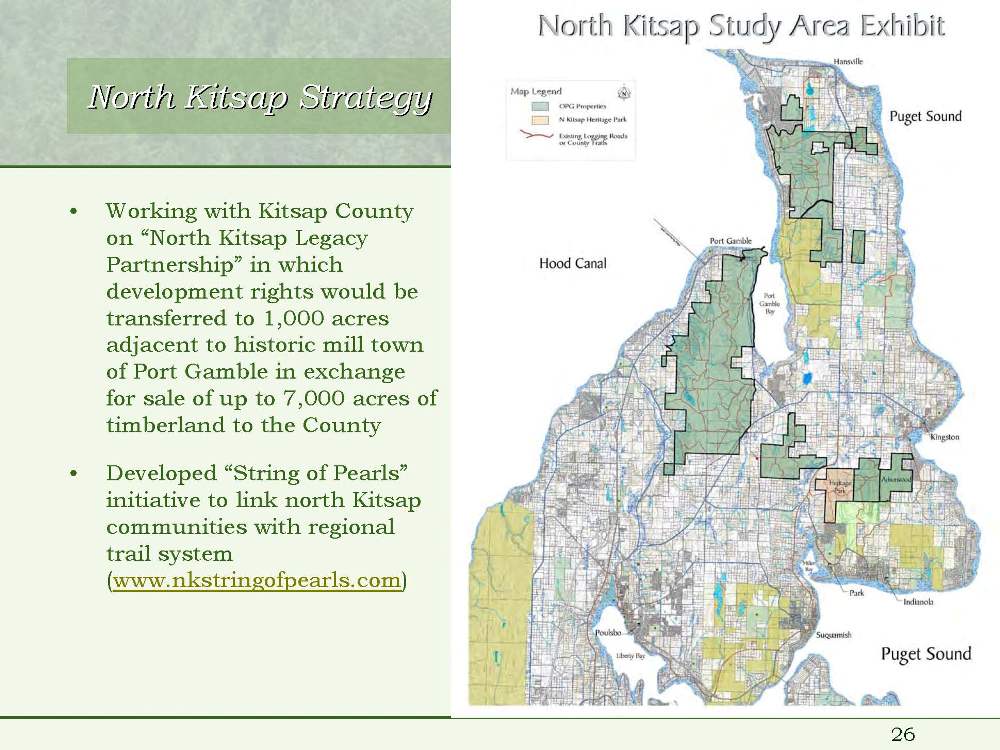
North Kitsap Strategy North Kitsap Strategy• Working with Kitsap County on “North Kitsap Legacy Partnership” in which development rights would be transferred to 1,000 acres adjacent to historic mill town of Port Gamble in exchange for sale of up to 7,000 acres of timberland to the County• Developed “String of Pearls” initiative to link north Kitsap communities with regional trail system (www.nkstringofpearls.com)
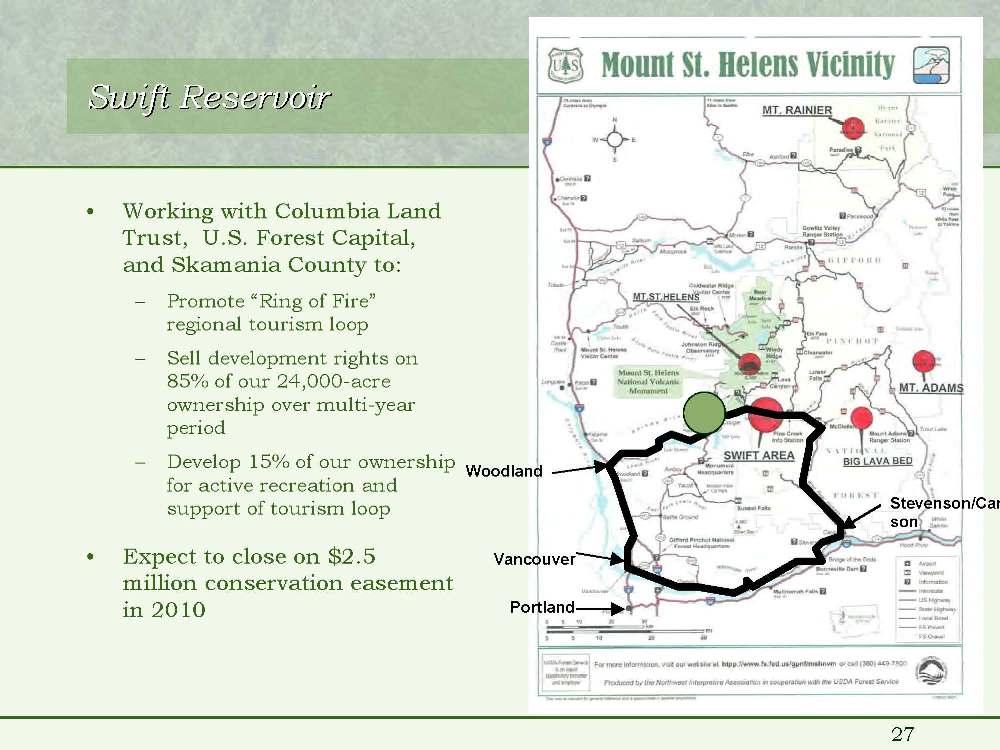
Swift Reservoir Swift Reservoir• Working with Columbia Land Trust, U.S. Forest Capital, and Skamania County to:– Promote “Ring of Fire” regional tourism loop– Sell development rights on 85% of our 24,000-acre ownership over multi-year period– Develop 15% of our ownership for active recreation and support of tourism loop• Expect to close on $2.5 million conservation easement in 2010
POPE RESOURCES POPE RESOURCES – APPENDIX MATERIALS APPENDIX MATERIALS
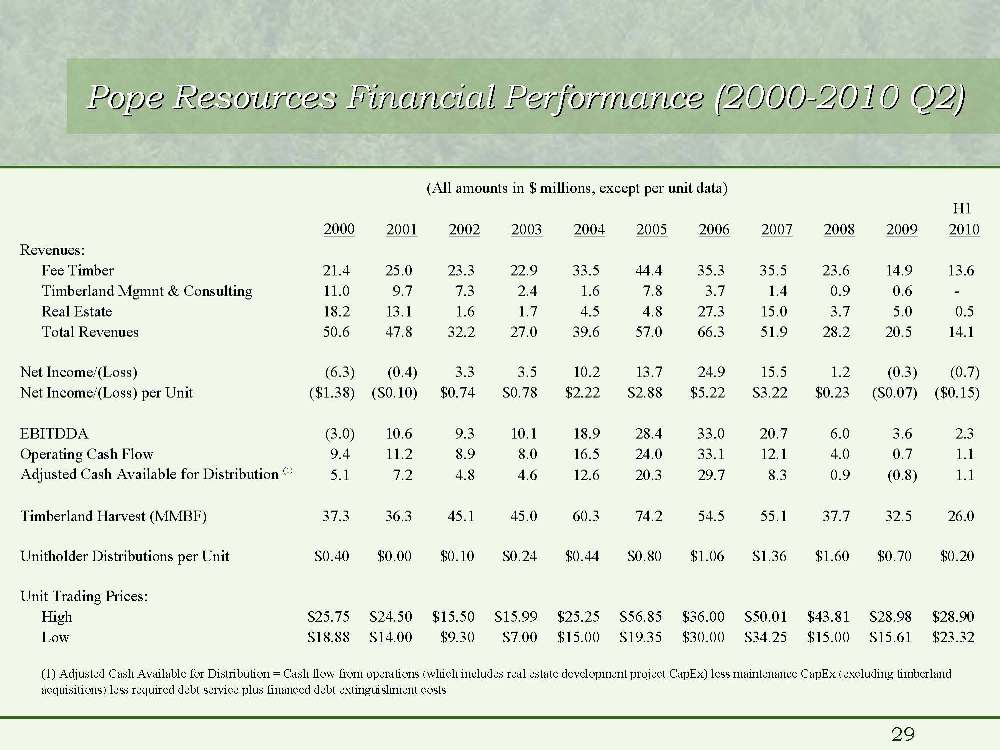
Pope Resources Financial Performance (2000-2010 Q2) 2010 Q2)H1 20002001200220032004200520062007200820092010Revenues:Fee Timber21.4 25.0 23.3 22.9 33.5 44.4 35.3 35.5 23.6 14.9 13.6 Timberland Mgmnt & Consulting11.0 9.7 7.3 2.4 1.6 7.8 3.7 1.4 0.9 0.6 - Real Estate18.2 13.1 1.6 1.7 4.5 4.8 27.3 15.0 3.7 5.0 0.5 Total Revenues50.6 47.8 32.2 27.0 39.6 57.0 66.3 51.9 28.2 20.5 14.1 Net Income/(Loss)(6.3) (0.4) 3.3 3.5 10.2 13.7 24.9 15.5 1.2 (0.3) (0.7) Net Income/(Loss) per Unit($1.38)($0.10)$0.74$0.78$2.22$2.88$5.22$3.22$0.23($0.07)($0.15)EBITDDA(3.0) 10.6 9.3 10.1 18.9 28.4 33.0 20.7 6.0 3.6 2.3 Operating Cash Flow9.4 11.2 8.9 8.0 16.5 24.0 33.1 12.1 4.0 0.7 1.1 Adjusted Cash Available for Distribution (1)5.1 7.2 4.8 4.6 12.6 20.3 29.7 8.3 0.9 (0.8) 1.1 Timberland Harvest (MMBF)37.3 36.3 45.1 45.0 60.3 74.2 54.5 55.1 37.7 32.5 26.0 Unitholder Distributions per Unit$0.40$0.00$0.10$0.24$0.44$0.80$1.06$1.36$1.60$0.70$0.20Unit Trading Prices:High$25.75$24.50$15.50$15.99$25.25$56.85$36.00$50.01$43.81$28.98$28.90Low$18.88$14.00$9.30$7.00$15.00$19.35$30.00$34.25$15.00$15.61$23.32(All amounts in $ millions, except per unit data)(1) Adjusted Cash Available for Distribution = Cash flow from operations (which includes real estate development project CapEx) less maintenance CapEx (excluding timberland acquisitions) less required debt service plus financed debt extinguishment costs
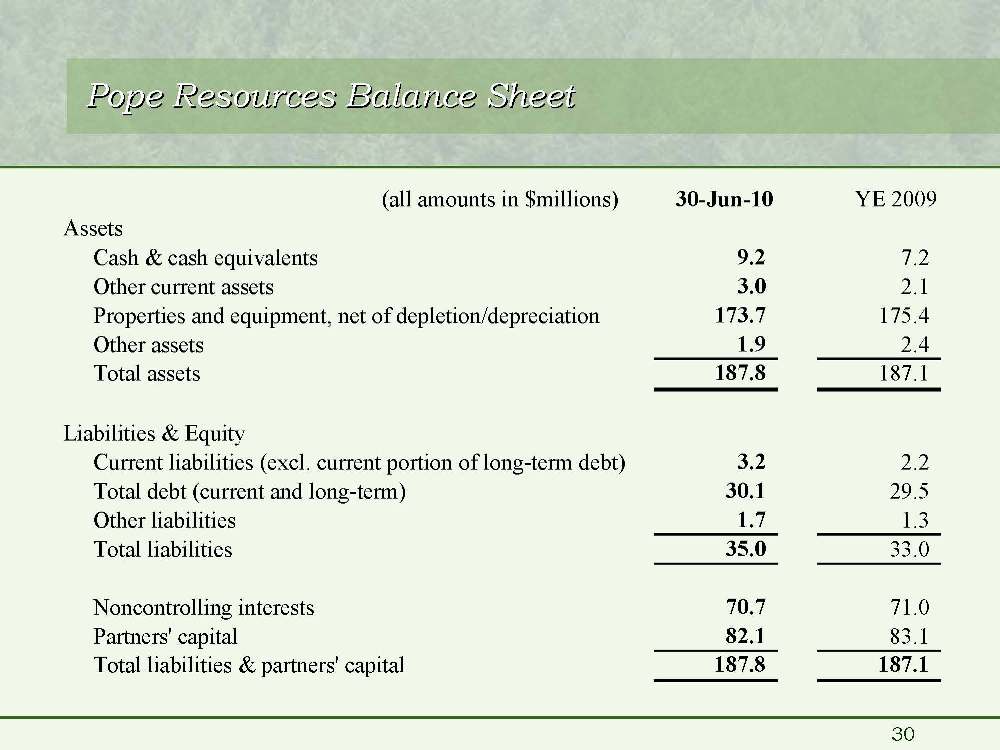
Pope Resources Balance Sheet Pope Resources Balance Sheet(all amounts in $millions)30-Jun-10YE 2009AssetsCash & cash equivalents9.2 7.2 Other current assets3.0 2.1 Properties and equipment, net of depletion/depreciation173.7 175.4 Other assets1.9 2.4 Total assets187.8 187.1 Liabilities & EquityCurrent liabilities (excl. current portion of long-term debt)3.2 2.2 Total debt (current and long-term)30.1 29.5 Other liabilities1.7 1.3 Total liabilities35.0 33.0 Noncontrolling interests70.7 71.0 Partners' capital82.1 83.1 Total liabilities & partners' capital187.8 187.1