Attached files
| file | filename |
|---|---|
| EXCEL - IDEA: XBRL DOCUMENT - POPE RESOURCES LTD PARTNERSHIP | Financial_Report.xls |
| EX-32.2 - EXHIBIT 32.2 - POPE RESOURCES LTD PARTNERSHIP | a51049870ex32_2.htm |
| EX-23.1 - EXHIBIT 23.1 - POPE RESOURCES LTD PARTNERSHIP | a51049870ex23_1.htm |
| EX-31.2 - EXHIBIT 31.2 - POPE RESOURCES LTD PARTNERSHIP | a51049870ex31_2.htm |
| EX-31.1 - EXHIBIT 31.1 - POPE RESOURCES LTD PARTNERSHIP | a51049870ex31_1.htm |
| EX-21.1 - EXHIBIT 21.1 - POPE RESOURCES LTD PARTNERSHIP | a51049870ex21_1.htm |
| EX-32.1 - EXHIBIT 32.1 - POPE RESOURCES LTD PARTNERSHIP | a51049870ex32_1.htm |
| EX-10.40 - EXHIBIT 10.40 - POPE RESOURCES LTD PARTNERSHIP | a51049870ex10_40.htm |
| EX-10.41 - EXHIBIT 10.41 - POPE RESOURCES LTD PARTNERSHIP | a51049870ex10_41.htm |
| EX-10.39 - EXHIBIT 10.39 - POPE RESOURCES LTD PARTNERSHIP | a51049870ex10_39.htm |
| EX-10.37 - EXHIBIT 10.37 - POPE RESOURCES LTD PARTNERSHIP | a51049870ex10_37.htm |
| EX-10.38 - EXHIBIT 10.38 - POPE RESOURCES LTD PARTNERSHIP | a51049870ex10_38.htm |
SECURITIES AND EXCHANGE COMMISSION
Washington, D.C. 20549
FORM 10-K
(Mark one)
| x |
Annual Report Pursuant to Section 13 or 15(d) of the Securities Exchange Act of 1934
|
|
For the fiscal year ended December 31, 2014
|
|
| or | |
| o |
Transition report pursuant to Section 13 or 15(d) of the Securities Exchange Act of 1934. For the transition period from to________
|
Commission File No. 1-9035
Pope Resources, A Delaware Limited Partnership
(Exact name of registrant as specified in its charter)
|
Delaware
(State of Organization)
|
91-1313292
(IRS Employer I.D. No.)
|
19950 Seventh Avenue NE, Suite 200, Poulsbo, WA 98370
(Address of principal executive offices, Zip Code)
Registrant's telephone number, including area code: (360) 697-6626
Securities registered pursuant to Section 12(b) of the Act:
|
Title of each class
|
Name of each exchange on which registered
|
|
| Depositary Receipts (Units) | NASDAQ |
Indicate by check mark if the registrant is a well-known seasoned issuer, as defined in Rule 405 of the Securities Act. Yes o No x
Indicate by check mark if the registrant is not required to file reports pursuant to Section 13 or 15(d) of the Act. Yes o No x
Indicate by check mark whether the registrant (1) has filed all reports required to be filed by Section 13 or 15(d) of the Securities Exchange Act of 1934 during the preceding 12 months (or for such shorter period than the registrant was required to file such reports), and (2) has been subject to such filing requirements for the past 90 days. Yes x No o
Indicate by check mark whether the registrant has submitted electronically and posted on its corporate Web site, if any, every Interactive Data File required to be submitted and posted pursuant to Rule 405 of Regulation S-T during the preceding 12 months (or for such shorter period that the registrant was required to submit and post such files). Yes x No o
Indicate by check mark if disclosure of delinquent filers pursuant to Item 405 of Regulation S-K (Section 229.405 of this chapter) is not contained herein, and will not be contained, to the best of registrant's knowledge, in definitive proxy or information statements incorporated by reference in Part III of this Form 10-K or any amendment to this Form 10-K. x
Indicate by check mark whether the registrant is a large accelerated filer, an accelerated filer, a non-accelerated filer, or a smaller reporting company. See definitions of “large accelerated filer,” “accelerated filer” and “smaller reporting company” in Rule 12b-2 in Rule 12b-2 of the Exchange Act.
| Large Accelerated Filer o | Accelerated Filer x |
| Non-Accelerated Filer o (Do not check if a smaller reporting company) | Smaller reporting company o |
Indicate by check mark whether the registrant is a shell company (as defined in rule 12b-2 of the Act). Yes o No x
At June 30, 2014, the aggregate market value of the non-voting equity units of the registrant held by non-affiliates was approximately $226,424,782.
The number of the registrant’s limited partnership units outstanding as of February 17, 2015 was 4,335,573.
Documents incorporated by reference: None
1
Pope Resources, A Delaware Limited Partnership
Form 10-K
For the Fiscal Year Ended December 31, 2014
Index
|
Part I
|
Page
|
||
|
Part II
|
|||
|
Part III
|
|||
|
Part IV
|
|||
2
PART I
OVERVIEW
When we refer to the “Partnership,” the “Company,” “we,” “us,” or “our,” we mean Pope Resources, A Delaware Limited Partnership and its consolidated subsidiaries. References to notes to the financial statements refer to the Notes to the Consolidated Financial Statements of Pope Resources, A Delaware Limited Partnership included in Item 8 of this form. The Partnership was formed in 1985 as a result of the spinoff of certain timberlands and development properties from Pope & Talbot, Inc.
The Partnership currently operates in three primary business segments: (1) Fee Timber, (2) Timberland Management and (3) Real Estate. Fee Timber operations consist of growing and harvesting timber from the 191,000 acres that we own or co-own with our timber fund investors as tree farms. Our Timberland Management segment is engaged in organizing and managing private equity timber funds using capital invested by third parties and the Partnership. Our Real Estate segment’s operations are focused on a portfolio of approximately 2,600 acres in the west Puget Sound region of Washington. This segment’s activities consist of efforts to enhance the value of our land by obtaining the entitlements and, in some cases, building the infrastructure necessary to enable further development. Our Real Estate operations also include ownership and management of Port Gamble, Washington, now an historic town. Port Gamble was established by Pope & Talbot in 1853 and was operated as a company town and logging mill for more than 100 years. Copies of the Partnership’s reports filed or furnished under the Securities Exchange Act, including our annual reports on Form 10-K, our quarterly reports on Form 10-Q and our current reports on Form 8-K, and all amendments to these reports, are available free of charge at www.poperesources.com. The information contained in or connected to our web site is not incorporated by reference into this Annual Report on Form 10-K and should not be considered part of this or any other report filed with or furnished to the Securities and Exchange Commission. The public may read and copy any material we file with the SEC at the SEC’s Public Reference Room at 100 F Street, NE, Washington, DC 20549. The public may also obtain information on the operation of the Public Reference Room by calling the SEC at 1-800-SEC-0330. The SEC also maintains an internet site at www.sec.gov that also contains our current and periodic reports and all of our other securities filings.
DESCRIPTION OF BUSINESS SEGMENTS
Fee Timber
Operations. As indicated above, our Fee Timber operations consist primarily of growing, harvesting, and marketing timber. Statements of intention, belief or expectation reflect intent, beliefs and expectations of our executive officers as of the date of this report, based on information known to them as of that date. Delivered log sales to domestic manufacturers and export brokers represent the overwhelming majority of Fee Timber revenue, but we also occasionally sell rights to harvest timber (timber deed sale) from our tree farms. In addition, our tree farms generate revenue from commercial thinning operations, ground leases for cellular communication towers, and royalties from gravel mines and quarries. The 191,000 timberland acres that we own or manage under the banner of this segment break down into two categories. The first of these categories consists of the approximately 69,000-acre Hood Canal tree farm, located in the Hood Canal area of Washington, and the 42,000-acre Columbia tree farm located in southwest Washington. Management views the Hood Canal and Columbia tree farms as the Partnership’s core holdings, and manages them as a single operating unit. When we refer to these two tree farms, we will describe them as the “Partnership’s tree farms”. We have owned the Hood Canal tree farm, substantially as currently comprised, since our formation in 1985, while we acquired the bulk of the Columbia tree farm in 2001.
This segment also includes as a second category the operations of ORM Timber Fund I, LP (Fund I), ORM Timber Fund II, Inc. (Fund II), and ORM Timber Fund III (REIT), Inc. (Fund III), which are consolidated into our financial statements. When referring to all the Funds collectively, depending on context, we will use the designations “Fund” or “the Funds” interchangeably. The Funds’ assets consist of 80,000 acres of timberland located in western Washington, northwestern Oregon and northern California. The Partnership’s ownership interest is 20% in both Funds I and II and is 5% in Fund III. The Fund’s tree farms consist of the following:
3
|
Acquisition
|
|||||||||||||
|
Fund
|
Date
|
Location
|
Acres
|
Sold
|
|||||||||
|
Fund I
|
Q4 2006 |
Western Washington
|
15,000 | Q4 2014 | |||||||||
| Q4 2006 |
Western Washington
|
9,000 | Q4 2014 | ||||||||||
|
Fund II
|
Q4 2009 |
Northwestern Oregon
|
11,000 | N/A | |||||||||
| Q3 2010 |
Western Washington
|
13,000 | N/A | ||||||||||
| Q3 2010 |
Northwestern Oregon
|
13,000 | N/A | ||||||||||
|
Fund III
|
Q4 2012 |
Northern California
|
19,000 | N/A | |||||||||
| Q4 2013 |
Southwestern Washington
|
11,000 | N/A | ||||||||||
| Q4 2014 |
Northwestern Oregon
|
13,000 | N/A | ||||||||||
When referring to the Partnership and Fund tree farms together we will refer to them as the “Combined tree farms”. When referring to the combination of the Partnership’s tree farms and the aggregate proportion of each of the Funds owned by the Partnership, we will refer to the sums as “Look-through totals”. Our Fee Timber segment produced 75%, 79% and 84% of our consolidated revenue in 2014, 2013 and 2012, respectively.
Inventory. Timber volume is generally expressed in thousand board feet (MBF) or million board feet (MMBF). In the discussion below, we present merchantable volume, productive acres and projected harvest level data for the Partnership’s and Funds’ tree farms on both a stand-alone and Look-through basis. On our Washington and Oregon tree farms, we define “merchantable volume” to mean timber inventory in productive stands that are 35 years of age and older. On our California tree farm, which has historically utilized uneven age management wherein stands consist of trees of a variety of age classes, we classify merchantable volume based on the tree’s diameter at breast height (DBH). Trees with a DBH greater than or equal to 16 inches are considered merchantable and less than 16 inches are considered pre-merchantable. Accordingly, merchantable volume from our California tree farm is reflected in the tables below as “16+”.
|
Partnership merchantable volume (in MMBF) as of December 31:
|
||||||||||||||||
|
2014
|
||||||||||||||||
|
Merch Class
|
Sawtimber
|
Pulpwood
|
Total
|
2013 Total
|
||||||||||||
|
35 to 39 yrs.
|
122 | 26 | 148 | 117 | ||||||||||||
|
40 to 44 yrs.
|
54 | 8 | 62 | 71 | ||||||||||||
|
45 to 49 yrs.
|
31 | 4 | 35 | 38 | ||||||||||||
|
50 to 54 yrs.
|
4 | 1 | 5 | 6 | ||||||||||||
|
55 to 59 yrs.
|
5 | 1 | 6 | 8 | ||||||||||||
|
60 to 64 yrs.
|
8 | 1 | 9 | 14 | ||||||||||||
|
65+ yrs.
|
26 | 3 | 29 | 35 | ||||||||||||
| 250 | 44 | 294 | 289 | |||||||||||||
4
|
Fund merchantable volume (in MMBF) as of December 31:
|
||||||||||||||||
|
2014
|
||||||||||||||||
|
Merch Class
|
Sawtimber
|
Pulpwood
|
Total
|
2013 Total
|
||||||||||||
|
35 to 39 yrs.
|
84 | 9 | 93 | 123 | ||||||||||||
|
40 to 44 yrs.
|
114 | 14 | 128 | 112 | ||||||||||||
|
45 to 49 yrs.
|
69 | 9 | 78 | 67 | ||||||||||||
|
50 to 54 yrs.
|
40 | 5 | 45 | 45 | ||||||||||||
|
55 to 59 yrs.
|
17 | 1 | 18 | 26 | ||||||||||||
|
60 to 64 yrs.
|
1 | 0 | 1 | 6 | ||||||||||||
|
65+ yrs.
|
7 | 1 | 8 | 18 | ||||||||||||
|
16+ inches
|
177 | 0 | 177 | 174 | ||||||||||||
| 509 | 39 | 548 | 571 | |||||||||||||
|
Look-through merchantable volume (in MMBF) as of December 31:
|
|||||||||||||||||||
|
2014 Volume
|
2013 Volume
|
||||||||||||||||||
|
Partnership
|
Partnership
|
||||||||||||||||||
| 100% |
Share of
|
Look-
|
100% |
Share of
|
Look-
|
||||||||||||||
|
Merch Class
|
Owned
|
Funds
|
through
|
Owned
|
Funds
|
through
|
|||||||||||||
|
35 to 39 yrs.
|
148 | 15 | 163 | 117 | 23 | 140 | |||||||||||||
|
40 to 44 yrs.
|
62 | 19 | 81 | 71 | 18 | 89 | |||||||||||||
|
45 to 49 yrs.
|
35 | 13 | 48 | 38 | 12 | 50 | |||||||||||||
|
50 to 54 yrs.
|
5 | 8 | 13 | 6 | 8 | 14 | |||||||||||||
|
55 to 59 yrs.
|
6 | 3 | 9 | 8 | 5 | 13 | |||||||||||||
|
60 to 64 yrs.
|
9 | 0 | 9 | 14 | 1 | 15 | |||||||||||||
|
65+ yrs.
|
29 | 1 | 30 | 35 | 3 | 38 | |||||||||||||
|
16+ inches
|
0 | 9 | 9 | 0 | 9 | 9 | |||||||||||||
| 294 | 68 | 362 | 289 | 79 | 368 | ||||||||||||||
Merchantable volume estimates are updated annually. Of the timber stands older than 24 years, 10% to 20% are physically re-measured each year using a statistical sampling process called “cruising”. Adjustments are made for depletion of areas harvested, growth, changes in acres, and associated timber volume resulting from acquisitions, dispositions, and reclassification of acres as available or unavailable for harvest.
The dominant timber species on the Partnership’s tree farms is Douglas-fir, which has unique structural characteristics that make it generally preferable to other softwoods and hardwoods for the production of construction grade lumber and plywood. A secondary softwood conifer species on the Partnership’s tree farms is western hemlock, which is similar in color and structural characteristics to a number of other minor softwood conifer timber species, including Sitka spruce and the true firs. These secondary species are thus purchased and manufactured into lumber generically, and referred to as “whitewoods”. There is also a minor amount of another softwood conifer species, western red cedar, which is used in siding and fencing. Hardwood species on the Partnership’s tree farms include red alder and minor volumes of other hardwood species.
The merchantable timber inventory on Fund properties contains a greater proportion of whitewoods than do the Partnership’s timberlands. With the acquisition of timberland by Fund III in northern California, we added ponderosa pine and white fir to the Combined species inventory mix. Ponderosa pine is used for shelving, lumber, and parts for windows, doors, and furniture. White fir is a member of the whitewood species group and is used primarily for lumber and core layers in plywood.
5
|
Look-through merchantable volume (in MMBF) as of December 31:
|
||||||||||||||||
|
2014 Volume
|
||||||||||||||||
|
Partnership
|
||||||||||||||||
| 100% |
Share of
|
Look-
|
Percent
|
|||||||||||||
|
Species
|
Owned
|
Funds
|
through
|
of total
|
||||||||||||
|
Douglas-fir
|
215 | 29 | 244 | 67 | % | |||||||||||
|
Western hemlock
|
27 | 20 | 47 | 13 | % | |||||||||||
|
Western red cedar
|
14 | 1 | 15 | 4 | % | |||||||||||
|
Pine
|
0 | 3 | 3 | 1 | % | |||||||||||
|
Other conifer
|
16 | 12 | 28 | 8 | % | |||||||||||
|
Red alder
|
19 | 3 | 22 | 6 | % | |||||||||||
|
Other hardwood
|
3 | 0 | 3 | 1 | % | |||||||||||
|
Total
|
294 | 68 | 362 | 100 | % | |||||||||||
|
Look-through merchantable volume (in MMBF) as of December 31:
|
||||||||||||||||
|
2013 Volume
|
||||||||||||||||
|
Partnership
|
||||||||||||||||
|
100%
|
Share of
|
Look-
|
Percent
|
|||||||||||||
|
Species
|
Owned
|
Funds
|
through
|
of total
|
||||||||||||
|
Douglas-fir
|
207 | 36 | 243 | 66 | % | |||||||||||
|
Western hemlock
|
34 | 22 | 56 | 15 | % | |||||||||||
|
Western red cedar
|
14 | 0 | 14 | 4 | % | |||||||||||
|
Pine
|
0 | 3 | 3 | 1 | % | |||||||||||
|
Other conifer
|
12 | 15 | 27 | 7 | % | |||||||||||
|
Red alder
|
19 | 3 | 22 | 6 | % | |||||||||||
|
Other hardwood
|
3 | 0 | 3 | 1 | % | |||||||||||
|
Total
|
289 | 79 | 368 | 100 | % | |||||||||||
The Partnership’s tree farms as of December 31, 2014 consist of approximately 111,000 acres. Of this total, approximately 93,400 acres are designated as productive acres, meaning land that is capable of growing merchantable timber and where the harvesting of that timber is not constrained by physical, environmental or regulatory restrictions. The Funds’ tree farms as of December 31, 2014 totaled approximately 80,000 acres, of which almost 70,600 were designated as productive acres. Productive acres on a Look-through basis, as of December 31, 2014, were 101,700 acres. Approximately 33% of the Partnership’s acreage and 16% of the Funds’ Washington and Oregon acreage is in the 25-34 year age class, much of which will begin moving from pre-merchantable to merchantable timber volume over the next five years. There is no age-class associated with the California tree farm and its productive acres are shown in the following tables under the heading “California.”
6
Look-through productive acres are spread by timber age-class as follows as of December 31, 2014:
|
12/31/2014 Productive Acres (in thousands)
|
|||||||||||||||||||||
|
Age
|
100% |
Share of
|
Look-
|
||||||||||||||||||
|
Class
|
Owned
|
%
|
Funds
|
%
|
through
|
%
|
|||||||||||||||
|
Clear-cut
|
2.0 | 2 | % | 0.3 | 4 | % | 2.3 | 2 | % | ||||||||||||
|
0 to 4
|
7.3 | 8 | % | 0.7 | 8 | % | 8.0 | 8 | % | ||||||||||||
|
5 to 9
|
9.2 | 10 | % | 0.7 | 8 | % | 9.9 | 10 | % | ||||||||||||
|
10 to 14
|
9.6 | 10 | % | 0.5 | 6 | % | 10.1 | 10 | % | ||||||||||||
|
15 to 19
|
13.6 | 15 | % | 0.3 | 4 | % | 13.9 | 14 | % | ||||||||||||
|
20 to 24
|
4.6 | 5 | % | 0.7 | 8 | % | 5.3 | 5 | % | ||||||||||||
|
25 to 29
|
15.8 | 17 | % | 0.6 | 7 | % | 16.4 | 16 | % | ||||||||||||
|
30 to 34
|
15.4 | 16 | % | 0.7 | 8 | % | 16.1 | 16 | % | ||||||||||||
|
35 to 39
|
9.1 | 10 | % | 0.9 | 11 | % | 10.0 | 10 | % | ||||||||||||
|
40 to 44
|
3.2 | 3 | % | 1.0 | 12 | % | 4.2 | 4 | % | ||||||||||||
|
45 to 49
|
1.6 | 2 | % | 0.6 | 7 | % | 2.2 | 2 | % | ||||||||||||
|
50 to 54
|
0.2 | 0 | % | 0.3 | 4 | % | 0.5 | 0 | % | ||||||||||||
|
55 to 59
|
0.4 | 0 | % | 0.1 | 1 | % | 0.5 | 0 | % | ||||||||||||
|
60 to 64
|
0.3 | 0 | % | - | 0 | % | 0.3 | 0 | % | ||||||||||||
|
65+
|
1.1 | 1 | % | - | 0 | % | 1.1 | 1 | % | ||||||||||||
|
California
|
- | 0 | % | 1.0 | 12 | % | 1.0 | 1 | % | ||||||||||||
| 93.4 | 8.4 | 101.8 | |||||||||||||||||||
Look-through productive acres are spread by timber age-class as follows as of December 31, 2013:
|
12/31/2013 Productive Acres (in thousands)
|
|||||||||||||||||||||
|
Age
|
100% |
Share of
|
Look-
|
||||||||||||||||||
|
Class
|
Owned
|
%
|
Funds
|
%
|
through
|
%
|
|||||||||||||||
|
Clear-cut
|
1.8 | 2 | % | 0.4 | 3 | % | 2.2 | 2 | % | ||||||||||||
|
0 to 4
|
7.0 | 8 | % | 0.7 | 6 | % | 7.7 | 7 | % | ||||||||||||
|
5 to 9
|
9.9 | 11 | % | 0.7 | 6 | % | 10.6 | 10 | % | ||||||||||||
|
10 to 14
|
9.3 | 10 | % | 0.8 | 7 | % | 10.1 | 10 | % | ||||||||||||
|
15 to 19
|
11.8 | 13 | % | 0.5 | 4 | % | 12.3 | 12 | % | ||||||||||||
|
20 to 24
|
7.7 | 8 | % | 1.3 | 11 | % | 9.0 | 9 | % | ||||||||||||
|
25 to 29
|
15.3 | 16 | % | 1.4 | 12 | % | 16.7 | 16 | % | ||||||||||||
|
30 to 34
|
14.7 | 16 | % | 1.2 | 10 | % | 15.9 | 15 | % | ||||||||||||
|
35 to 39
|
7.6 | 8 | % | 1.5 | 13 | % | 9.1 | 9 | % | ||||||||||||
|
40 to 44
|
3.7 | 4 | % | 1.1 | 9 | % | 4.8 | 5 | % | ||||||||||||
|
45 to 49
|
1.8 | 2 | % | 0.6 | 5 | % | 2.4 | 2 | % | ||||||||||||
|
50 to 54
|
0.4 | 0 | % | 0.3 | 3 | % | 0.7 | 1 | % | ||||||||||||
|
55 to 59
|
0.5 | 1 | % | 0.2 | 2 | % | 0.7 | 1 | % | ||||||||||||
|
60 to 64
|
0.5 | 1 | % | - | 0 | % | 0.5 | 0 | % | ||||||||||||
|
65+
|
1.3 | 1 | % | 0.1 | 1 | % | 1.4 | 1 | % | ||||||||||||
|
California
|
- | 0 | % | 0.9 | 8 | % | 0.9 | 1 | % | ||||||||||||
| 93.3 | 11.7 | 105.0 | |||||||||||||||||||
Site Index. The site index for a given acre of timberland is a measure of the soil’s potential to grow timber. In the Partnership’s operating region, site index is expressed in feet and is a measure of the tree’s projected height at age 50. Current tree heights and age are collected during the cruising process and used to calculate site index. Site index is an important input into the models used for projecting harvest levels on a tree farm. The Partnership’s properties have an estimated weighted average site index of 115 feet and on a Look-through basis the weighted average site index is 112 feet.
7
Long-term Harvest Planning. Long-term harvest plans for the Partnership’s tree farms and the Funds’ tree farms reflect the different ownership time horizons associated with each group. Plans for the Partnership timberlands are designed to maintain sustainable harvest levels, assuming perpetual ownership. Plans for the Funds’ tree farms, on the other hand, reflect the 10-13 year combined investment and drawdown term of each fund, and take into account further the different mix of age classes in each fund. The harvest level for the Funds’ tree farms is developed to maximize the total return during each of the Fund’s respective investment periods by blending harvest income with the value of the portfolio upon disposition. This will result in more harvest variability between years than is the case with the Partnership’s tree farms.
Assuming full operations on the Funds’ existing tree farms, at December 31, 2014 the long-term planned annual harvest level for the Partnership and Fund tree farms (and on a Look-through basis) can be found in the table below:
|
(amounts in MMBF)
|
Look-through
|
|||||||
|
Planned annual
|
planned annual
|
|||||||
|
harvest volume
|
harvest volume
|
|||||||
|
Partnership Properties
|
44 | 44 | ||||||
|
Fund Properties
|
55 | 7 | ||||||
|
Total
|
99 | 51 | ||||||
Marketing and Markets. The following marketing and markets discussion applies to the Combined tree farms. We market timber by selling finished logs to wood manufacturers or to export brokers. To do so, we engage independent logging and trucking contractors to harvest the standing timber, manufacture it into logs, and deliver it to our customers on the open market. We retain title to the logs until delivery takes place, which normally occurs at a customer log yard.
Historically, Japanese customers have paid a premium for the highest quality logs from which visually appealing beams for residential construction are produced. U.S. mills, on the other hand, manufacture mostly framing lumber requiring structural integrity for wall systems that are concealed by drywall and do not need to have as high of an aesthetic quality. Accordingly, those logs sold to the domestic market are more of a commodity relative to logs headed for the Japanese market, and thus command a lower price.
Beginning in 2010, the reduction in China’s log imports from Russia opened up an opportunity for North American log producers to supply a larger portion of the growing Chinese market. This resulted in the migration of the U.S. Pacific Northwest (PNW) export market from one almost exclusively focused on Japan to a market that now comprises China, Japan, and Korea with China representing the largest market within those countries. This export market has provided support to log prices over the last few years of weak domestic housing markets. Sawlogs sold to China are used chiefly for concrete forms, pallets, and other low-end uses that can be satisfied with the commoditized logs traditionally purchased by domestic sawmills. The lower average sawlog quality and more diverse species mix flowing to China, combined with the limited volume of high-quality Douglas-fir flowing to Japan, has narrowed the overall export premium received for sales of logs into these export markets relative to the domestic market.
The logs that we sell to China, Japan, and Korea are actually sold to U.S.-based brokers who in turn sell directly to offshore customers. Our decision to sell through intermediaries is predicated on risk management. Mitigation of foreign exchange risk, loss prevention, and minimizing cash collection risks inform our decision to sell through brokers.
8
Customers. Logs from the Combined tree farms are sold to a number of customers in both the domestic and export markets. Domestic customers include lumber mills and other wood fiber processors located throughout western Washington, western Oregon, and northern California. Export customers consist of intermediaries located at the ports of Longview, Tacoma, Port Angeles, and Olympia, Washington and St. Helens and Astoria, Oregon. Whether destined for export or domestic markets, the cost of transporting logs limits the destinations to which the Partnership can profitably deliver and sell its logs.
The ultimate decision on where to sell logs is based on the net proceeds we receive after taking into account both the delivered log prices paid by a prospective customer and the hauling cost needed to deliver logs to that customer. In instances where harvest operations are closer to a domestic mill than the log yard of an export broker, we may earn a higher net stumpage from selling to a domestic mill even though the delivered log price is lower. As such, realized log price movements are influenced by marketing decisions predicated on net stumpage values rather than focusing exclusively on the delivered log price. In such instances our reported log realizations may reflect more of our own proximity to customers rather than the broader market trend.
Weyerhaeuser was the largest customer for our Fee Timber segment in 2014, representing 12% of segment revenue, followed by Pacific Lumber & Shipping which represented 11% of segment revenue. The Combined tree farms delivered logs to 54 separate customers during 2014, compared to 41 during 2013.
Competition. Most of our competitors are comparable in size or larger. Log sellers like the Partnership compete on the basis of quality, pricing, and the ability to satisfy volume demands for various types and grades of logs to particular markets. Management believes that the location, type, and grade of timber from the Combined tree farms will enable it to compete effectively in these markets. However, our products are subject to some competition from a variety of non-wood and engineered wood products as well as competition from foreign-produced logs and lumber.
Forestry and Stewardship Practices. Timberland management activities on the Combined tree farms include reforestation, control of competing brush in young stands, thinning of the timber to achieve optimal spacing after stands are established, and road maintenance. During 2014, we planted 1.4 million seedlings on 3,900 acres of the Combined tree farms compared to 1.2 million seedlings on 3,300 acres in each of 2013 and 2012. Seedlings are generally planted from December to April, depending on weather and soil conditions, to restock plantations that were harvested during the preceding twelve months. Planting will vary from year to year based upon harvest level, the timing of harvest, and seedling availability. Management’s policy is to return all timberlands to productive status in the first planting season after harvest.
All harvest and road construction activities are conducted in compliance with federal environmental laws and state forest practice laws and regulations. Many of these regulations are programmatic and include, for example; limitations on the size of clearcuts, reforestation following harvest, retention of trees for wildlife and water quality, and sediment management on forest roads. The regulations also require project-specific permits or notifications that govern a defined set of forest operations. An application for harvest or road construction may require more specific guidance to avoid potential impact to public resources. For example, we often consult third-party, state-qualified geo-technical specialists for operations that have the potential to impact unstable slopes in order to avoid, minimize, or mitigate risks to safety and public resources.
Sustainable Forestry Initiative (SFI®). Since 2003, we have been a member of the SFI forest certification program, an independent environmental review and certification program that promotes sustainable forest management, focusing on water quality, biodiversity, wildlife habitat, and species protection. With our voluntary entry into this certification program, we have been subject to annual independent audits of the required standards for the program. Management views this certification as an important indication of our commitment to manage our lands sustainably while continually seeking ways to improve our management practices. We believe this commitment is an important business practice that contributes positively to our reputation and to the long-term value of our assets.
9
Our certifications are current for all of the Combined tree farms. We believe this certification allows us to obtain the broadest market penetration for our logs while protecting the core timberland assets of the Partnership and the Funds.
Timberland Management
Background. In 1997, the Partnership formed two wholly owned subsidiaries, ORM, Inc. and Olympic Resource Management LLC (“ORMLLC”), to facilitate the Timberland Management activities. Our Timberland Management segment earns management fees and incurs expenses resulting from raising, investing, and managing capital invested in PNW timberland on behalf of third-party investors. Since the launch of our timberland private equity fund strategy in 2003, the activities in this segment have consisted of attracting third-party investment capital for the Funds and then acquiring and managing properties on their behalf. When we discuss the Timberland Management properties we will refer to either the acquisition values, defined as contractually agreed-upon prices paid for the properties, or the value of assets under management, defined as the current appraised value of the properties. As of December 31, 2014, we manage 80,000 acres of timberland properties in Washington, Oregon, and California in this business segment with combined appraised values of $312 million.
In total, ORMLLC has called $271 million of equity capital and borrowed $57 million of debt capital for the Funds. Our cumulative co-investment in the Funds totaled $35 million prior to the sale of Fund I’s two tree farms. Subsequent to these sales, our cumulative co-investment in the Funds as of December 31, 2014 is $23 million. In July 2012 we completed our final close of Fund III with commitments totaling $180 million, including our co-investment commitment of $9 million. Fund III has $51 million of remaining committed capital, including our co-investment of $3 million. In 2014 we sold the two properties held by Fund I which marks our first Fund liquidation event. The following table provides detail behind cumulative committed and called capital by the Funds as of December 31, 2014.
|
Total Fund
|
Co-investment
|
|||||||||||||||||||
|
(in millions)
|
Commitment
|
Called Capital
|
Commitment
|
Called Capital
|
Distributions
Received
|
|||||||||||||||
|
Fund I *
|
$ | 62 | $ | 59 | $ | 12 | $ | 12 | $ | 13 | ||||||||||
|
Fund II
|
$ | 84 | $ | 83 | $ | 17 | $ | 17 | $ | 7 | ||||||||||
|
Fund III
|
$ | 180 | $ | 129 | $ | 9 | $ | 6 | $ | 0 | ||||||||||
|
Total
|
$ | 326 | $ | 271 | $ | 38 | $ | 35 | $ | 20 | ||||||||||
|
* Fund I assets were sold in Q3 2014 and Q4 2014.
|
Operations. The Timberland Management segment’s key activity is to provide investment and timberland management services to the Funds. We anticipate growth in this segment as we continue to manage the Funds, together with any future funds established by the Partnership. The Timberland Management segment represented less than 1% of consolidated revenue for each of the three years ended December 31, 2012 through 2014, as fee revenue is eliminated in consolidation.
The Partnership benefits in a number of ways from this segment. First, we benefit through the opportunity to co-invest in each of these funds, such that we are also able to diversify our market exposure across more tree farms than we could by investing only for the Partnership. We also benefit from the economies of scale generated through managing these additional acres of timberland, which accrue to both the Partnership and Fund timberlands. The contribution margin from the fees charged to the funds lowers the management costs on the Partnership’s timberlands. Lastly, we are able to retain additional expertise that neither the Partnership nor the Funds’ timberlands could maintain on a stand-alone basis.
We earn annual asset management fees for managing this capital once timberland properties are acquired. We also earn annual timberland management fees on acres owned by the Funds and log marketing fees based on harvest volume from Fund tree farms. At the end of a Fund term, if a Fund achieves threshold return levels, we earn a carried interest incentive fee.
10
Accounting rules require that all fees generated from managing the Funds and corresponding operating expenses for the Fee Timber segment are eliminated as a result of consolidation of the Funds into the Partnership’s financial statements. The elimination of these fees and corresponding operating expenses results in a decrease in the otherwise reported cost per acre of managing Fund tree farms under our Fee Timber segment as well as eliminating the revenue generated from managing the Funds in the Timberland Management segment. An effect of these eliminations is to make the Fee Timber results look stronger and the Timberland Management results look correspondingly weaker.
Marketing. When raising capital for a new Fund, we market these opportunities to accredited investors who have an interest in investing alongside a manager with a specific regional specialization and expertise in the timberland asset class. Our Funds fill a unique niche among timberland investment management organizations due to our regional specialization, degree of co-investment, smaller fund sizes, and the targeting of relatively small transactions. Additional marketing and business development efforts include regular contact with forest products industry representatives, non-industry owners, and others who provide key financial services to the timberland sector. Our acquisition and disposition activities keep management informed of changes in timberland ownership that can represent opportunities for us to market our services.
Customers. The Funds are the primary customers and users of Timberland Management services.
Competition. We compete against both larger and comparably sized companies providing similar timberland investment management services. There are over 20 established timberland investment management organizations competing against us in this business. The companies in this group have access to established sources of capital and, in some cases, increased economies of scale that can put us at a disadvantage. Our value proposition to investors is centered on the differentiation we provide relative to other managers, as described above, as well as our long track record of success in the Pacific Northwest.
Real Estate
Background. The Partnership’s real estate activities are closely associated with the management of its timberlands. Management continually evaluates timberlands in terms of the best economic use, whether this means continuing to grow and harvest timber, seeking a rezone of the property for sale or development, or working with conservation organizations and the public on a sale. After timberland has been logged, management has a choice between four primary alternatives for the underlying land: reforest and continue to use as timberland, sell as undeveloped property, undertake some level of development to prepare the land for sale as improved property, or hold as property slated for later development or sale. Generally speaking, the Real Estate segment’s activities consist of investing in and later reselling improved properties, and holding properties for later development and sale. As a result, revenue from this segment tends to fluctuate substantially, and is characterized by relatively long periods in which revenue is relatively low, while expenses incurred to increase the value of the Partnership’s development properties may be higher. During periods of diminished demand, entitlement related costs and infrastructure investment are managed so as to minimize negative cash flows, but segment expenses do not trend directly with segment revenues. When improved properties are sold, income is recognized in the form of sale price net of acquisition and development costs. The Partnership has an 2,600-acre portfolio of properties for which management believes there to be a higher and better use than timberland.
Operations. Real Estate operations focus on maximizing the value of this 2,600-acre portfolio mentioned above. For Real Estate projects, management secures entitlements and/or infrastructure necessary to make development possible and then sells the entitled property to a party who will construct improvements. In addition, this segment’s results reflect management’s successful efforts to negotiate conservation easements (CE) that typically encumber Fee Timber properties and preclude future development on that land so encumbered. The third and final area of operations in this segment includes leasing residential and commercial properties in Port Gamble, Washington, and leasing out a portion of a commercial office building in Poulsbo, Washington. The Real Estate segment represented 25%, 21% and 16% of consolidated revenue in 2014, 2013 and 2012 respectively.
11
Management recognizes the significant value represented by the Partnership’s Real Estate holdings and is focused on adding to that value. The means and methods of adding value to this portfolio vary considerably depending on the specific location and zoning of each parcel. Our properties range from land that has commercial activity zoning where unit values are valued on a per-square-foot basis to large lots of recently harvested timberland where value is measured in per-acre terms. In general, value-adding activities that allow for the highest-and-best-use of the properties include: working with communities and elected officials to develop grass roots support for entitlement efforts, securing favorable comprehensive plan designation and zoning, acquiring easements, and obtaining plat approvals.
Development Properties – Planned Communities
Planned communities in Gig Harbor, Port Gamble, Kingston, Bremerton, Hansville and Port Ludlow, Washington make up approximately half of the acres in our development property portfolio. Due to each property’s size, development complexity, and regulatory environment, the projects are long-term in nature and require extensive time and capital investments to maximize returns.
Gig Harbor. Gig Harbor, a suburb of Tacoma, Washington, is the site of Harbor Hill, a mixed-use development project that includes 42 acres of commercial/retail sites, 50 acres of business park lots, and 200 acres of land with residential zoning. At December 31, 2014, 18.5 acres of commercial/retail, 11.5 acres of business park and 144 acres of residential lots remained to be sold. A 20-year development agreement was approved in late 2010. Key provisions of the development agreement and plat approval include: (a) extending the project approval from 7 to 20 years; (b) reserving sufficient domestic water supply, sanitary sewer, and traffic trip capacity on behalf of the project’s 824 residential units; and (c) waiver of park impact fees in exchange for a 7-acre parcel of land for City park purposes. All components of this project have transportation, water and sewer capacities reserved for full build-out. We received preliminary plat approval in early 2011 for the then 200-acre residential portion of this project that included 554 single-family and 270 multi-family units. At December 31, 2014, 421 single-family and 98 multi-family units remained to be sold.
Port Gamble. Port Gamble fits within both the development and commercial properties aspects of our Real Estate operations. Port Gamble is located northwest of Kingston on the Kitsap Peninsula. Founded in 1853 by the company that became Pope & Talbot, Inc. (“P&T”), Port Gamble served as a millsite, logging port and company town for nearly 150 years and several of its buildings still stand. The 130-acre town and millsite were transferred from P&T to Pope Resources at the time of our formation in 1985. The operation and management of the town of Port Gamble is discussed under “Commercial Properties” below.
With respect to our development plans for the site, Port Gamble has been designated a “Rural Historic Town” under Washington’s Growth Management Act since 1999. This designation allows for substantial new commercial, industrial, and residential development using historic land use patterns and densities while maintaining the town’s unique architectural character. Our plans are focused on bringing back the New England-style homes that have slowly disappeared since Port Gamble’s heyday in the 1920s. In 2012, we substantially completed a plat application to Kitsap County that, if approved as proposed, will allow for between 200 and 240 additional residential units and 200,000 to 260,000 square feet of additional commercial building space. We submitted this master plan for the 114-acre townsite and adjoining 205-acre agrarian district in January 2013, kicking off what has proven to be a multi-year period of environmental impact review and public comment. The proposal calls for development of homes, an inn, a dock, waterfront trails, and an agricultural area with greenhouses, orchard and winery. Walking trails along the shoreline, through the adjoining forestlands and along pastoral farmland would contribute to the lifestyle of residents and should enhance Port Gamble as a unique tourist attraction. During the first half of 2015, our efforts are focused on constructing a new membrane bioreactor wastewater treatment plant with a large onsite sewer system which will be turned over to Kitsap County’s Public Utility District at completion. Once operational, the existing treatment plant will no longer discharge wastewater to the Hood Canal through the currently permitted outfall pipe. Official de-commissioning of the outfall will commence after the new plant is operational. A State-provided appropriation grant of $2 million is available to partially fund the project, provided it is completed by June 30, 2015. The total project cost is expected to be approximately $3.5 million.
12
Kingston. The Partnership owns a 364-acre property in Kingston that is named “Arborwood” with plans for the development of 663 single-family lots and 88 multi-family units. Final approval of a preliminary plat and a 15-year development agreement was completed in February 2010. Further development will not proceed until the local market demonstrates an increased appetite for residential lots.
Bremerton. The West Hills area of Bremerton, Washington is the site of a 46-acre industrial park which was being developed in two phases totaling 24 lots. Construction on the 9 lots that make up Phase I was completed in 2007. One lot has been sold from Phase I and the industrial market remains weak at this time. In 2013, management obtained a comprehensive plan designation change from industrial to residential for the 36-acre Phase II portion of this property. In 2014, Phase II was rezoned to single-family residential and we plan to submit a preliminary plat for approximately 150 lots in 2015.
Hansville. The Partnership owns a 149-acre residential development project in Hansville called “Chatham”, with 19 parcels ranging from 3 to 10 acres in size. Construction was completed in late 2007 and the lots are currently being marketed for sale. To date, one lot has sold from this project.
Port Ludlow. Port Ludlow represents a 256-acre property located just outside the Master Planned Resort boundary of Port Ludlow, Washington. We currently expect preliminary plat approval in 2015 that, if obtained, will allow for up to 54 lots ranging from 1 to 1.5 acres each, with the balance of the property designated as open space. Development beyond the point of plat approval will not commence until demand for rural residential lots improves.
Development Properties – Other
Rural Residential. We have a number of properties where rural residential development represents a higher and better use compared to continuing to manage them as timberland. These properties are typically non-contiguous smaller lots ranging in size between 5 and 40 acres with zoning ranging from one dwelling unit per 5 acres to one per 80 acres. Development and disposition strategies vary depending on the property’s unique characteristics. Development efforts and costs expended to ready these properties for sale include work to obtain development entitlements that will increase the property’s value as residential property as well as making improvements to existing logging roads, constructing new roads, extending dry utilities, and sometimes establishing gated entrances. As is the case with much of the Real Estate portfolio, investments in the rural residential program have been restricted to costs necessary to achieve entitlements, while deferring construction costs until such time when market conditions for the sale of rural land improve.
North Kitsap County. Since 2011, the Partnership has been formally engaged with a coalition of approximately 30 entities to conserve up to 6,500 acres of the Partnership’s land in north Kitsap County. This effort, known as the Kitsap Forest & Bay Project, realized two closings in 2014. The first occurred in February and was the sale of approximately 535 acres and 1.5 miles of waterfront in Port Gamble Bay. In December, the Partnership closed on the sale of an additional 366 acres which lie adjacent to both an existing county park and the Arborwood project.
13
Skamania County. The Partnership has been engaged with the Columbia Land Trust (CLT) in a multi-phase conservation project that includes both fee and conservation easement sales. In tandem with this project the Partnership has been working with Skamania County to rezone the majority of our holdings in the county. In the second half of 2014 the county approved a rezone of approximately 14,000 acres. The effect of the rezone was to allow for the development of 20-acre lots. In December, the Partnership closed its third conservation sale within this project. Included in the sale were 2,877 acres of conservation easement (having the effect of eliminating development rights while allowing for ongoing timberland management) which sold for $743,000. An additional 210 acres were sold in fee along Pine Creek for $357,000. The funding for this conservation sale was primarily through the Washington Wildlife and Recreation Program (WWRP). CLT has applied for additional conservation easement grants for the final 7,899 acres of this project through the Forest Legacy Program. If awarded, the Forest Legacy grant will be funded for a 2016 closing.
Commercial Properties
Poulsbo. In May 2011, we purchased a 30,000-square-foot commercial office building in Poulsbo, on a 2-acre parcel of land. At the time, the building was fully leased to Union Bank on a five-year, triple-net lease with a lease expiration of October 2015. In November 2012, we moved our headquarters to the new building, sharing the space with the aforementioned tenant. Union Bank announced recently it will be closing most of their Kitsap County branches by the end of February 2015 and, as such, will be vacating our building. We are actively seeking replacement tenants and evaluating how much expansion space we may need for our future use.
Port Gamble. As described above under “Development Properties”, the Partnership owns and operates the town of Port Gamble where 25 residential buildings and approximately 46,000 square feet of commercial building space are currently rented to third parties. In addition, the Partnership operates a wedding and events business, with another 8,000 square feet in its venues, that leverages the charm of the townsite to attract clientele. These commercial activities serve as placeholders to help offset the costs of maintaining the town until the master plan process (also described above) progresses.
Environmental Remediation. As noted above, P&T and its corporate predecessors operated a sawmill at Port Gamble from 1853 to 1995. P&T continued to operate various portions of the site under leases from the Partnership until 2002, when it finally concluded its operations at Port Gamble. During that time, P&T also conducted logging and shipping operations in the tidal and subtidal waters of Port Gamble Bay under a lease from the Washington State Department of Natural Resources (DNR) that lasted from 1974 to 2004. Both the upland and submerged portions of the site are believed to have become contaminated with various hydrocarbons, heavy metals and other contaminants during P&T’s operations there.
Following the mill shutdown, the Washington State Department of Ecology (DOE) began to examine the environmental conditions at Port Gamble. Under Washington law, both Pope Resources and P&T were considered by DOE to be “potentially liable persons” (PLPs), the Partnership because of its current ownership of the site, and P&T because of its historic ownership and operation of the site. DNR is also considered a PLP because of its ownership and leasing of the submerged beds in Port Gamble Bay to P&T. We also contend that DNR is liable for a significant portion of cleanup costs by virtue of its having permitting P&T to operate the tidal and submerged portions of the site, and by failing to properly enforce the then-existing environmental laws in a manner that the Partnership believes would have substantially mitigated the contamination that occurred during P&T’s operations at the site.
14
P&T and Pope Resources entered into a settlement agreement in 2002 that allocated responsibility for environmental contamination at the townsite, millsite, a solid waste landfill, and adjacent waters, with P&T assuming a substantial portion of the liability for cleanup costs owing to the length of its ownership and to the operations it conducted there. At that time, the parties estimated the aggregate cleanup costs allocable to both parties to be between $10 and $13 million. In the settlement agreement, P&T assumed all responsibility for remediation of toxins in Port Gamble Bay. Those processes were expected to amount to approximately 90% of the overall project costs.
In 2005, both Pope Resources and P&T received Environmental Excellence Awards from DOE for their work in remediating the contamination that had existed at the Port Gamble townsite and landfill. DOE also issued letters to both parties in 2006 indicating that the agency expected to take no further action regarding conditions at those portions of the site. Pope Resources continued the process of cleaning up the remaining contamination at the millsite, although by late 2005 that portion of the site, too, had been largely cleaned and the remaining aspects of that project consisted of test well monitoring and modest additional remediation. The Port Gamble Bay area and related tidelands, for which P&T was responsible under the parties’ settlement agreement, had not yet been remediated, but P&T filed for bankruptcy protection in 2007 and was eventually liquidated in bankruptcy, leaving the Partnership and DNR as the only remaining PLPs. Because the environmental liabilities are joint and several, the result of P&T’s bankruptcy was to leave substantial portions of the liability with the Partnership, as one of the two remaining solvent PLPs. At that time, the Partnership increased its reserve for remediation liabilities by $1.9 million to reflect the resulting increase in risk.
In connection with this change in circumstances, the Partnership also adopted a more sophisticated statistical risk assessment model that we have referred to as the “Monte Carlo simulation” model. This model is intended to measure a combination of the estimated likelihood of various possible outcomes and the estimated costs associated with those outcomes. The Partnership has continued to use that model through the present day, and has adjusted its reserves from time to time by applying that model to ongoing developments.
Beginning in approximately 2010, DOE began to revisit its previously announced expectations regarding the level of cleanup that would be required for the Port Gamble Bay portion of the project. In accordance with Washington Administrative Regulations, DOE invited the participation of interested citizens and groups, one of the most prominent of which has been the S’Klallam Tribe. Also participating have been numerous environmental groups and concerned citizens. In response to input from these groups, DOE established remediation levels that were far greater than either DOE or the Partnership had contemplated previously. This culminated in significant modifications to the draft Port Gamble Baywide and Millsite Remedial Investigation and Feasibility Study issued by DOE in May 2012 and we recorded a $12.5 million increase in our accrual for the environmental remediation liability in the second quarter of 2012.
In December 2013, the Partnership and DOE entered into a consent decree that included a cleanup action plan (CAP) requiring the removal of docks and pilings, excavation and backfilling of intertidal areas, subtidal dredging and monitoring, and certain other specific remediation steps. Throughout 2014, we evaluated the requirements of the CAP and conducted additional sampling and investigation in order to develop the design of the remediation project. In November 2014, we submitted a draft engineering design report, or EDR, to DOE, followed by supplemental material in December, which established our proposed means for complying with the CAP. The EDR has not been approved or finalized, and the specific methodologies and cleanup level requirements remain subject to negotiation with DOE. However, during the fourth quarter of 2014, we had completed sufficient analysis to reach a conclusion that the existing reserve for environmental liabilities was insufficient. Accordingly, we accrued an additional $10.0 million in December 2014. Additional information regarding this accrual, the aggregate environmental remediation liability, the changes in expected cleanup levels that necessitated the increase in the liability, and the methodology used to monitor the adequacy of the existing accrual, is set forth in Part II, Item 7: “Management’s Discussion and Analysis of Financial Condition and Results of Operations – Overview,” “—Real Estate,” and “—Critical Accounting Policies and Estimates”.
15
Marketing. Marketing efforts for Development Properties in 2014 and 2013 were focused primarily on our Harbor Hill development and conservation land sales. Marketing efforts for Development Properties in 2012 were centered on residential, commercial, and industrial lands for sale through traditional brokerage and real estate listing services. Efforts were also expended in the last several years to sell North Kitsap lands for conservation.
Customers. Management typically markets properties from the Real Estate portfolio to private individuals, residential contractors, and developers of commercial property. Customers for rental space in the Port Gamble townsite consist of both residential and commercial tenants.
Competition. Development and Commercial Properties compete with local and regional peers that offer land for sale or property for lease.
Transportation. Land values for the Real Estate portfolio are influenced by transportation options between the west side of Puget Sound where our properties are located and the Seattle-Tacoma metropolitan corridor. Transportation options between these areas separated by bodies of water include the Tacoma Narrows Bridge or one of several car/passenger ferries. Ferry transportation within the market area currently utilizes vessels that carry both automobiles and passengers from each of the communities of Kingston, Bremerton, and Bainbridge Island, respectively, to and from Edmonds and Seattle.
Employees
As of December 31, 2014, the Partnership employed 54 full-time, salaried employees and 6 part-time and seasonal personnel, who are distributed among the segments as follows:
|
Segment
|
Full-Time
|
Part-Time/
Seasonal
|
Total
|
|||||||||
|
Fee Timber
|
23 | - | 23 | |||||||||
|
Timberland Management
|
4 | - | 4 | |||||||||
|
Real Estate
|
17 | 5 | 22 | |||||||||
|
General & Administrative
|
10 | 1 | 11 | |||||||||
|
Totals
|
54 | 6 | 60 | |||||||||
None of our employees are subject to a collective bargaining agreement and the Partnership has no knowledge that any steps toward unionization are in progress. Management considers the Partnership’s relations with its employees to be good.
Government Regulation
The timberland and real estate assets we own and manage are subject to federal, state, and local environmental laws and regulations, including extensive permitting or notification processes. Changes in these laws and regulations can affect regional or local harvest levels and market values of timber-based raw materials, and the ability to develop real estate. These include federal, state, and local pollution controls, solid and hazardous waste management, disposal and remediation laws, and regulations in each segment and all geographic regions in which we have operations.
Forest Management Practices. Federal laws and regulations that have the potential to impact forest practices include, for example, the Endangered Species Act (ESA) and the Clean Water Act (CWA). State laws and regulations such as the Washington, Oregon, and California Forest Practice Acts also directly regulate forest management operations. Collectively, these laws and regulations increasingly affect present or future harvest and forest management activities.
16
Each state in which we own or manage timberlands has developed “best management practices” to reduce the effects of forest practices on water quality and plant and animal habitats. Additional, more stringent regulations may be adopted in order to achieve the following: enhance water quality standards under the federal Clean Water Act, protect fish and wildlife habitat, or advance other public policy objectives.
The following are examples of potential changes to the regulatory climate that could affect forest practices in Washington, Oregon, and California:
Listing of plants and animals under state and federal Endangered Species Acts.
A number of fish and wildlife species that inhabit geographic areas near or within our timberlands have been listed as threatened or endangered under the federal Endangered Species Act (ESA) or similar state laws. Federal ESA listings include the Northern Spotted Owl, marbled murrelet, numerous salmon species, bull trout, and steelhead trout in the Pacific Northwest. Listings of additional species or populations, such as the pacific fisher, may result from pending or future citizen petitions or be initiated by federal or state agencies. Federal and state requirements to protect habitat for threatened and endangered species have resulted in restrictions on timber harvest on some timberlands, including some of our timberlands. Additional listings of fish and wildlife species as endangered, threatened, or sensitive under the ESA and similar state laws as well as regulatory actions taken by federal or state agencies to protect habitat for these species may, in the future, result in the following: an increase in operating costs; additional restrictions on timber harvests and a resulting reduction in available acres; impacts to forest management practices or real estate development activities; and potential impact on timber supply and prices.
Compliance for state and federal endangered species is achieved through a combination of adherence to state regulations and our best management practices to preserve endangered species and their habitat.
In June 2006, the U.S. Fish & Wildlife Service (USFWS) and NOAA Fisheries signed a 50-year Forest Practices Habitat Conservation Plan (HCP) covering forestry activities in Washington State. The HCP is supported by the State’s forest practice regulatory structure established by the Forests and Fish Law. Together, they provide landowners assurance that forestry activities comply with both the federal ESA and the Clean Water Act (CWA) to protect Washington's native fish and aquatic species and assure clean water compliance.
Washington State’s forest practice rules are monitored for their effectiveness at meeting resource objectives and are designed to change, if needed, based on research. If USFWS were to assert that there is scientific evidence that the rules need to be adjusted, new or modified regulations could result in increased costs, additional capital expenditures, and reduced operating flexibility.
In 2009, the California Board of Forestry adopted the Anadromous Salmonid Protection Rules that were intended to protect, maintain, and improve riparian habitats for state and federally listed anadromous salmonid species. These rules are permanent regulations and replace the interim Threatened or Impaired Watershed Rules which were originally adopted in July 2000 and readopted six times.
Changes in state water quality regulations such as water quality standards, total maximum daily loads, new permitting requirements, and herbicide use.
A 2011 lawsuit in Oregon let to a ruling by the 9th Circuit Court of Appeals that water channeling structures such as culverts on logging roads are, in fact, point sources of pollution, with the potential impact of requiring the Environmental Protection Agency (EPA) to issue discharge permits under the National Pollutant Discharge Elimination System (NPDES), numbering millions of such permits across the nation. On December 12, 2011 the U.S. Supreme Court issued an order calling for the views of the U.S. Solicitor General on certiorari petitions filed by the state of Oregon and by the Oregon Forest Industry Council. The petitions asked the Supreme Court to review and reverse the 9th Circuit’s decision that storm water runoff from forest roads is a “point source” pollutant requiring a federal pollution discharge permit. On March 20, 2013, the U.S. Supreme Court ruled that an EPA rule exempts stormwater discharges on logging roads from requiring NPDES permits. In late 2012, just as the U.S. Supreme Court was to begin deliberations on whether to hear the appeal, EPA issued new stormwater rules that excluded logging road discharges from discharges associated with industrial activity, thus those activities would not require a NPDES permit. A lawsuit was filed in January 2013 by the plaintiff in the original lawsuit, the Northwest Environmental Defense Center (NEDC), challenging the new EPA rule. In light of the favorable ruling in Decker v. NEDC, we believe it is unlikely that NEDC’s new challenge to EPA’s 2012 amendment to the stormwater rules would result in additional permitting requirements. In February 2014, Congress included language in the Farm Bill which will prevent NPDES permitting of forest roads and silvicultural activities, prevent citizen enforcement suits for other regulatory measures related to forest roads, and remove additional legal ambiguity regarding runoff on forest roads.
17
On December 18, 2014 Natural Resources Defense Council and the Environmental Defense Center filed a petition for mandamus in the U.S. Court of Appeals for the Ninth Circuit to order EPA to decide if it will regulate forest roads under its Phase II stormwater authority and if so, to propose a new rule to regulate forest roads outside of the NPDES permit process.
The EPA also requires states to develop total maximum daily load (“TMDL”) allocations for pollutants in water bodies that have been determined to be “water quality impaired”. The TMDL requirements set limits on pollutants that may be discharged to a body of water or set additional requirements, such as best management practices for nonpoint sources, including timberland operations, to reduce the amounts of pollutants in designated bodies of water. These limits require tree farms to better minimize siltation of streams caused by roads, harvest operations and other management activities. TMDL targets will be established for specific water bodies in the states where we operate and when set, the rules will ordinarily be implemented so as to achieve water quality standards within 10 years, when practicable.
The Forest Practices HCP in Washington State also promotes compliance with the Clean Water Act. Changes to water quality regulations on forestland must be promulgated through the adaptive management program, and as such must be based on scientific information. Additionally, TMDLs for forested watersheds are given a low priority for development based on the existing regulatory structure. TMDL implementation plans in mixed use watersheds reference the existing regulatory structure for implementation plan recommendations on forestlands.
The Washington State Fish and Wildlife Commission is in the process of updating regulations that set standards for watercourse crossing construction. These regulations may, in turn, require changes to the Forest Practice Rules. Similarly, the Oregon Board of Forestry is considering regulatory actions, including changes to buffer requirements, in order to reduce impacts on streams and fish. California recently increased its regulation of silviculture to reduce impacts on streams, and regional water boards in that state also have the ability to restrict forest practice permits as a result of wastewater discharge. As these rules grow more restrictive, we may face increasing costs associated with our silviculture, may find some areas of our tree farms inaccessible (either physically or because of economic inefficiency), and may face reductions in the portion of our timberlands that can be harvested because of setback requirements.
Further, the Federal Insecticide, Fungicide, and Rodenticide Act (FIFRA) and similar state laws, are increasingly restricting the use of herbicides in a manner that may reduce our timber production. Herbicides are used to promote reforestation and to optimize the growth of regenerated stands of trees. These federal and state laws and regulations may reduce the efficiency with which we can produce timber, and they may ultimately reduce the volume of timber that is available for harvest. Further, a reduction in insecticides or herbicides may make our tree farms more vulnerable to disease or infestations.
State Harvest Permit and Notifications Requirements.
Washington, Oregon, and California all have a permitting or notification system as part of their forest practice rules. Changes in these processes can cause additional administrative expenses and/or delay project implementation.
18
California has as many as three separate permits that are required for conducting timber harvests including the Timber Harvest Plan (THP) administered by Cal Fire, Lake and Streambed Alteration Permit administered by the California Department of Fish and Wildlife for crossing watercourses, and various waivers of Reports of Waste Discharge administered by Regional Water Quality Control Boards. THPs may have multiple operations spanning several years. Review of such plans is more comprehensive, involving archaeological, botanical, biological and other disciplines as well as a public comment period. Only a Registered Professional Forester can sign a THP, a status that requires multidisciplinary training and testing. Once approved, a THP has a seven-year life.
Washington has a Forest Practice Application, a permit administered by the Department of Natural Resources. Forest practices that cross watercourses are also subject to regulations administered by the Department of Fish and Wildlife and until the end of 2013, subject to a permit called a Hydraulic Project Approval (HPA). As a result of legislation in 2012, these regulations have been integrated into the Forest Practice Rules, negating the need for a HPA.
Oregon does not have a permit system, but does require landowners to provide a Forest Practice Notification to the Department of Forestry. For certain activities, the Department does require a written plan describing specifically how certain elements of the regulations are to be met.
All three states where we operate periodically update their regulations and permitting processes. The regulatory comment process can cause us to incur expenses, and new permitting regulations commonly require us to increase the level of research and expertise necessary to meet applicable requirements. Substantive changes in these regulations may increase our harvest costs, may decrease the volume of our timber that is available for harvest, and may otherwise reduce our revenues or increase our costs of operations.
Climate Change Regulation
California has implemented a cap and trade program that limits the amount of greenhouse gasses emitted by certain stationary sources and will phase in transportation. This may indirectly impact forest landowners through indirect costs of energy to our manufacturing customers and logging contractors. The Washington State Legislature will be considering a similar regulation in 2015 which has the potential to impact customers, in particular pulp and paper manufactures, as well as logging contractors.
The regulatory and non-regulatory forest management programs described above have increased operating costs and resulted in changes in the value of the Combined timberlands. Management does not expect to be disproportionately affected by these programs in comparison with typical timberland owners. Likewise, management does not expect that these programs will significantly disrupt its planned operations over large areas or for extended periods.
Real Estate Development. Many of the federal laws (ESA and CWA) that impact forest management can in a more limited circumstance also apply to real estate development. Additionally, there are also state and local land use regulations that have additional permitting requirements and that limit development opportunities. For example, in Washington development rights are affected by the Growth Management Act, which requires counties to submit comprehensive plans that identify the future direction of growth and stipulate where population densities are to be concentrated. The purposes of the GMA include: (1) direction of population growth to population centers (Urban Growth Areas), (2) reduction of “suburban sprawl”, and (3) protection of historical sites. We work with local governments within the framework of the GMA to develop our real estate holdings to their highest and best use. Oregon also has growth management provisions in its land use laws which served as a model for Washington’s growth management provisions. Oregon's land use laws are generally more stringent outside of urban areas, especially in commercial forest lands where residential conversions are often outright disallowed without statutory action by the State legislature. These regulations can impact the permitted density of a given area, which may affect the number of lots, dwellings, or commercial buildings that can be constructed in a given location. Any or all of which may affect our real estate revenues and the value of our real estate holdings.
19
We are subject to statutory and regulatory restrictions that currently limit, and may increasingly limit, our ability to generate income. Our ability to grow and harvest timber can be significantly impacted by legislation, regulations or court rulings that restrict or stop forest practices. For example, events that focus media attention upon natural disasters and damage to timberlands have at various times brought increasing public attention to forestry practices, often resulting in increasingly stringent laws and regulations that increase the size of wetlands buffers, limit silviculture activities, restrict harvests because of animal habitats, or requiring various actions to stabilize slopes. Additional regulations, whether or not adopted in response to such events, may make it more difficult or expensive for us to harvest timber and may reduce the amount of harvestable timber on our properties. These and other restrictions on logging, planting, road building, fertilizing, managing competing vegetation, and other activities can significantly increase the cost or reduce available inventory thereby reducing income. Further, while we manage our timberlands in accordance with the Sustainable Forestry Initiative and we follow forest management and risk mitigation procedures that we believe to be sound, and although all of our forestry operations comply with applicable forestry practices regulations, we cannot be certain we will not be the subject of claims based on allegations that we acted improperly in managing our property. These claims may take the form of individual or class action litigation, regulatory or enforcement proceedings, or both. Any such claims could result in substantial defense costs and divert management’s attention from the ongoing operation of our business, and if any such claims were successful, may result in substantial damage awards, fines or civil penalties. Any such additional restrictions likely would have a similar effect on our Timberland Management operations, particularly in the case of the Funds.
Our real estate holdings are illiquid, and changes in economic and regulatory factors may affect the value of our properties or the timing of the proceeds, if any, that we expect to receive on the sale of such properties. The value of our real estate investments, and our income from Real Estate operations, is sensitive to changes in the economic and regulatory environment, as well as various land-use regulations and development risks, including the ability to obtain the necessary permits and land entitlements that would allow us to maximize the revenue from our real estate investments. Our real estate investments are long-term in nature, which raises the risk that unforeseen changes in the economy or laws surrounding development activities may have an adverse effect on our investments. These investments often are highly illiquid and thus may not generate cash flow if and when needed to support our other operations. Further, we occasionally announce contracts relating to the sale of our real estate holdings, but those agreements may contain contingencies and conditions that may delay or prevent the consummation of transactions even after we have agreed to sale terms.
We are sensitive to demand and price issues relating to our sales of logs in both domestic and foreign markets. We generate Fee Timber revenue primarily by selling softwood logs to domestic mills and to third-party intermediaries who resell them to the export market. The domestic market for logs in our operating area depends heavily on U.S. housing starts. Recently, the U.S. housing market has started to improve but, to the extent the recovery in the housing market should stall, such a turn of events could have a negative impact on our operating results. The export markets for Pacific Northwest logs are significantly affected by fluctuations in United States, Japanese and, increasingly, Chinese and Korean economies, as well as by the foreign currency exchange rate between these Asian currencies and the U.S. dollar, as well as ocean transportation costs.
We have certain environmental remediation liabilities associated with our Port Gamble and former Port Ludlow resort properties, and those liabilities may increase. We currently own certain real estate at Port Gamble on the Kitsap Peninsula and, until mid-2001, owned real estate within the resort community of Port Ludlow in Jefferson County in western Washington. Sediments adjacent to these properties were alleged to have been impacted by operations occurring prior to our acquisition of the properties, which occurred at the time of our spinoff from Pope & Talbot, Inc. in 1985. The Partnership itself has never operated any of the contaminated sites. However, as current owner of Port Gamble and based on conditions of our sale of the Port Ludlow assets, we have environmental liability for these properties under Washington State’s Model Toxics Control Act (MTCA). Under the MTCA, we are one of two “potentially liable parties,” or PLPs, for the conditions at the Port Gamble site, substantially all of which are in the tidal and submerged portions of Port Gamble Bay. The MTCA provides that each PLP is jointly and severally liable with all other PLPs for the entire cost of remediating contaminated properties. The Partnership had previously designed and had begun to implement a remediation program that management believed was sufficient to comply with applicable laws and regulations. However, recent actions by the Washington Department of Ecology (DOE) have imposed substantially higher cleanup standards than had previously been expected, thus increasing the level of activity and cost that will be required to achieve the required cleanup levels. In December 2013 the Partnership entered into a consent decree with DOE, which included a cleanup action plan, or CAP, that established general obligations for remediating the remaining conditions at Port Gamble. The final CAP, however, affords discretion to DOE to assess the site and to order additional actions.
20
Management continues to monitor the Port Gamble and Port Ludlow cleanup processes closely and increased the recorded liability by $10.0 million in the fourth quarter of 2014. The $21.7 million remediation accrual as of December 31, 2014 represents our current estimate of the remaining cleanup cost and most likely outcome to various contingencies within both locations. These estimates are predicated upon a variety of factors, including the proportion of costs that would be allocated to us in comparison to those allocable to the Washington Department of Natural Resources (DNR), which is the other known PLP for the Port Gamble site. However, the actual amount of the ultimate cleanup costs, the cost of any litigation if we cannot reach a settlement with DNR, and the outcome of any such litigation, is uncertain. These liabilities are based upon a number of estimates and judgments that are subject to change as the project progresses. Any litigation ensuing from this matter may result in adverse financial impacts and may distract management and other key personnel from day to day operations. Changes in circumstances may result in the need for additional adjustments to the existing liability, any of which would result in a charge to earnings in the period those changes occur. These factors, alone or in combination with other challenges, may have a material adverse effect upon our assets, income and operations.
Our operation of our timberland private equity funds exposes us to management risk and may carry other risks. Our Timberland Management segment is involved in managing our timber private equity funds. Further, substantially all of our recent acquisitions of timberlands for our Fee Timber segment have been on behalf of these funds, and our results of operations from our Fee Timber segment are increasingly dependent upon the success of our Fund Tree Farms. If we cannot continue to raise investment capital to permit the Funds to acquire additional timberlands, then the growth of our Fee Timber operations will be limited by our own ability to reinvest our capital and to raise additional capital through debt or equity financing. A reduction in our ability to expand our timberland holdings would likely reduce our Fee Timber income and may also reduce our flexibility as to harvest timing. Additionally, we may face claims from one or more investors in the Funds that we have failed to properly manage the Funds or that we have misled investors about the merits, risks, or other aspects of an investment in the Funds. While we are aware of no basis for any such claims, any resulting claim would be a distraction to our management and may damage the Partnership’s reputation. Further, such outcomes could make it more difficult to raise additional capital for existing or future private equity funds, which would limit our ability to grow our Fee Timber or our Timberland Management revenues.
We rely on contract loggers and truckers who are in short supply and seeking consistent work at increasing rates. We rely on contract loggers and truckers for the production and transportation, respectively, of our products to customers. During the economic downturn of 2008 and 2009 most industrial forestry firms deferred harvest, which resulted in a shortfall in demand for the contract logging and trucking work force. Many private logging and trucking companies did not survive the protracted economic downturn. As the economy has improved and companies return to harvesting, a shortage of logging contractors and truckers has developed. The remaining contractors who survived did so by reducing their workforce or, in the case of log truckers, converting their trucks to configurations suitable for highway freight hauling. This decline in the pool of available contractors has resulted in a steady increase in harvest and haul costs and market forces that are stressing continuity of work when soliciting contractor bids for a job. The commitment to more continuous work could preclude our ability to time markets, affecting total returns.
21
We benefit from certain tax treatment accorded to master limited partnerships, and if that status changes the holders of our units may realize less advantageous tax consequences. The Partnership is a Master Limited Partnership and is therefore not generally subject to U.S. federal income taxes. If a change in tax law (or interpretation of current tax law) caused the Partnership to become subject to income taxes, operating results would be adversely affected. We also have a handful of taxable subsidiaries. The estimation of income tax expense and preparation of income tax returns requires complex calculations and judgments. We believe the estimates and calculations used in this process are proper and reasonable and more likely than not would be sustained under examination by federal or state tax authorities, however if a federal or state taxing authority disagreed with the positions we have taken, a material change in provision for income taxes, net income, or cash flows could result.
We and our customers are dependent upon active credit markets to fund operations. We sell logs from our Fee Timber segment to mills and log brokers that in most circumstances rely upon an active credit market to fund their operations. Our Real Estate sales are also often dependent upon credit markets in order to fund acquisitions. To the extent borrowing restrictions impinge on customers’ access to debt, we expect those customers to respond by reducing their expenditures, and those reductions may have the effect of directly reducing our revenues and of indirectly reducing the demand for our products. Any such outcomes could materially and adversely impact our results of operations, cash flows, and financial condition.
We are controlled by our managing general partner. As a master limited partnership, substantially all of our day-to-day affairs are controlled by our managing general partner, Pope MGP, Inc. The board of directors of Pope MGP, Inc. serves as our board of directors, and by virtue of a stockholder agreement, each of the two individual shareholders of Pope MGP, Inc. have the ability to designate one of our directors and jointly appoint two others, with the fifth board position filled by our chief executive officer, who serves as a director by virtue of his executive position. Unitholders may remove the managing general partner only in limited circumstances, including, among other things, a vote by the holders of a two-thirds majority of the “qualified units,” which means the units that have been owned by their respective holders for at least five years prior to such vote. By virtue of the terms of our agreement of limited partnership, as amended, or “partnership agreement”, our managing general partner directly, and the general partner shareholders indirectly, have the ability to do the following: prevent or impede transactions that would result in a change of control of the Partnership; to prevent or, upon the approval of limited partners holding a majority of the units, to cause, the sale of the assets of the Partnership; and to cause the Partnership to take or refrain from taking certain other actions that one might otherwise perceive to be in the Partnership’s best interest. Under our partnership agreement, we are required to pay to Pope MGP, Inc. an annual management fee of $150,000, and to reimburse Pope MGP, Inc. for certain expenses incurred in managing our business.
We may incur losses as a result of natural disasters that may occur, or that may be alleged to have occurred, on our properties. Forests are subject to a number of natural hazards, including damage by fire, storms, insects and disease, volcanic activity, flooding and landslides. Changes in climate conditions may intensify these hazards. Severe weather conditions and other natural disasters can also reduce the productivity of timberlands and disrupt the harvesting and delivery of forest products. While damage from most natural causes is typically localized and would normally affect only a small portion of our timberlands at any one time, these hazards are unpredictable and losses might not be so limited. Consistent with the practices of other large timber companies, we do not maintain insurance against loss of standing timber on our timberlands due to natural disasters.
We compete with a number of larger competitors that may be better able than we to absorb price fluctuations, may be able to expend greater resources on production, may have greater access to capital, and may operate more efficiently than we can. We compete against much larger companies in each of our business segments. We compete with these companies for management and line personnel, as well as for purchases of relatively scarce capital assets such as land and standing timber and for sales of our products. These larger competitors may have access to larger amounts of capital and significantly greater economies of scale, and they may be better able to absorb the risks of our line of business. Moreover, the timber industry has experienced significant consolidation in recent years and, as that consolidation occurs, our relative market share decreases and the relative financial capacity of our competitors increases. While management believes the Partnership is at a competitive advantage over some of these companies because of our lack of vertical integration into forest products manufacturing, our advantageous tax structure, and management’s attempts to diversify our asset base, we cannot assure readers that competition will not have a material and adverse effect on our results of operations or our financial condition.
22
Consolidation of sawmills in our geographic operating area may reduce competition among our customers, which could adversely affect our log prices. In the past we have experienced, and may continue to experience, consolidation of sawmills and other wood products manufacturing facilities in the Pacific Northwest. Because a portion of our cost of sales in our Fee Timber segment, which encompasses the Combined tree farms, consists of transportation costs for delivery of logs to domestic sawmills, it becomes increasingly expensive to transport logs over longer distances for sales in domestic markets. As a result, a reduction in the number of sawmills, or in the number of sawmill operators, may reduce competition for our logs, increase transportation costs, or both. These consolidations thus may have a material adverse impact upon our Fee Timber revenue or income and, as that segment has traditionally represented our largest business unit, upon our results of operation and financial condition as a whole. Any such material adverse impact on timber revenue and income as a result of regional mill consolidations will also indirectly affect our Timberland Management segment in the context of raising capital for investment in Pacific Northwest-based timber funds.
None
The following table reconciles acreage owned as of December 31, 2014 to acreage owned as of December 31, 2013. As noted previously, we own 20% of Funds I and II and 5% of Fund III. This table includes the entire 80,000 acres of timberland owned by the Funds and also presents the acreage on a Look-through basis. Properties are typically transferred from Fee Timber to the Real Estate segment at the point in time when the Real Estate segment takes over responsibility for managing the properties with the goal of maximizing the properties’ value upon disposition.
|
Timberland Acres (in thousands) by Tree Farm
|
||||||||||||||||||||
|
Description
|
2013
|
Acquisitions
|
Sales
|
Transfer
|
2014
|
|||||||||||||||
|
Hood Canal tree farm (1)
|
69.2 | 0.1 | (0.5 | ) | - | 68.8 | ||||||||||||||
|
Columbia tree farm (1)
|
41.3 | 0.6 | - | 41.9 | ||||||||||||||||
|
Subtotal Partnership Timberland
|
110.5 | 0.7 | (0.5 | ) | - | 110.7 | ||||||||||||||
|
Fund I tree farms
|
23.9 | - | (23.9 | ) | - | - | ||||||||||||||
|
Fund II tree farms (2)
|
37.2 | - | - | - | 37.2 | |||||||||||||||
|
Fund III tree farms (2)
|
29.6 | 13.0 | - | - | 42.6 | |||||||||||||||
|
Subtotal Funds' Timberland
|
90.7 | 13.0 | (23.9 | ) | - | 79.8 | ||||||||||||||
|
Total Fee Timber acres
|
201.2 | 13.7 | (24.4 | ) | - | 190.5 | ||||||||||||||
|
Partnership share of Funds
|
13.7 | 0.7 | (4.8 | ) | - | 9.6 | ||||||||||||||
|
Total Real Estate acres (see detail below)
|
3.0 | - | (0.4 | ) | - | 2.6 | ||||||||||||||
|
Combined Look-through total acres
|
127.1 | 1.4 | (5.7 | ) | - | 122.9 | ||||||||||||||
|
(1) A subset of this property is used as collateral for the Partnership's long-term debt, excluding debt of the Funds.
|
|
(2) A subset of these properties is used as collateral for the Funds' long-term debt.
|
23
|
Real Estate Acres Detail
|
||||||||||||||||
|
Project Location
|
2013
|
Acquisitions
|
Sales
|
Transfer
|
2014
|
|||||||||||
|
Bremerton
|
46 | 46 | ||||||||||||||
|
Gig Harbor
|
212 | (38 | ) | 174 | ||||||||||||
|
Hansville
|
149 | 149 | ||||||||||||||
|
Kingston - Arborwood
|
364 | 364 | ||||||||||||||
|
Kingston - 5-acre zoning
|
366 | (366 | ) | - | ||||||||||||
|
Port Gamble LAMIRD townsite (a)
|
114 | 114 | ||||||||||||||
|
Port Gamble Agrarian District (b )
|
205 | 205 | ||||||||||||||
|
Port Ludlow
|
256 | 256 | ||||||||||||||
|
Poulsbo
|
2 | 2 | ||||||||||||||
|
Other Rural Residential
|
1,253 | (4 | ) | 1,249 | ||||||||||||
|
Total
|
2,967 |
-
|
(408 | ) |
-
|
2,559 | ||||||||||
The following table provides dwelling unit (DU) per acre zoning for the Partnership’s owned timberland and development properties as of December 31, 2014 and land sold during 2014. The table does not include sales of development rights or small timberland sales from tree farms properties:
|
Current Real Estate Land Inventory by Zoning Category
|
2014 Sales from RE Portfolio
|
|||||||||||||||
|
Zoning Designation
|
Acres
|
Acres
|
$/Acre
|
Total Sales
|
||||||||||||
|
Urban zoning - residential
|
544 | 38 | $ | 24,211 | $ | 13,171 | ||||||||||
|
Historic Rural Town
|
114 | |||||||||||||||
|
Commercial/retail
|
21 | |||||||||||||||
|
Business park/industrial
|
22 | |||||||||||||||
|
1 DU per 5 acres
|
375 | 366 | 5,473 | 2,003 | ||||||||||||
|
1 DU per 10 acres
|
153 | |||||||||||||||
|
1 DU per 20 acres
|
789 | |||||||||||||||
|
1 DU per 40 acres
|
38 | 4 | 13,397 | 53 | ||||||||||||
|
1 DU per 80 acres
|
298 | |||||||||||||||
|
Agrarian District
|
205 | |||||||||||||||
|
Total
|
2,559 | $ | 15,227 | |||||||||||||
The Partnership may from time to time be a defendant in lawsuits arising in the ordinary course of business. Management believes that loss to the Partnership, if any, will not have a material adverse effect on the Partnership’s consolidated financial condition or results of operations.
Not applicable.
24
PART II
Market Information
The Partnership’s equity securities are listed on NASDAQ and traded under the ticker symbol “POPE”. The following table sets forth the 2012 to 2014 quarterly ranges of low and high prices, respectively, for the Partnership’s units together with per unit distribution amounts by the period in which they were paid:
|
High
|
Low
|
Closing
|
Distributions
|
|||||||||||||
|
Year Ended December 31, 2012
|
||||||||||||||||
|
First Quarter
|
$ | 45.78 | $ | 41.19 | $ | 43.70 | $ | 0.35 | ||||||||
|
Second Quarter
|
60.39 | 42.50 | 55.07 | 0.45 | ||||||||||||
|
Third Quarter
|
57.13 | 50.71 | 52.15 | 0.45 | ||||||||||||
|
Fourth Quarter
|
56.49 | 51.25 | 55.68 | 0.45 | ||||||||||||
|
Year Ended December 31, 2013
|
||||||||||||||||
|
First Quarter
|
$ | 66.49 | $ | 56.15 | $ | 61.50 | $ | 0.45 | ||||||||
|
Second Quarter
|
74.99 | 59.97 | 70.00 | 0.45 | ||||||||||||
|
Third Quarter
|
73.07 | 60.07 | 67.69 | 0.55 | ||||||||||||
|
Fourth Quarter
|
69.65 | 63.01 | 67.00 | 0.55 | ||||||||||||
|
Year Ended December 31, 2014
|
||||||||||||||||
|
First Quarter
|
$ | 70.50 | $ | 64.17 | $ | 66.99 | $ | 0.55 | ||||||||
|
Second Quarter
|
70.26 | 63.94 | 67.00 | 0.65 | ||||||||||||
|
Third Quarter
|
71.00 | 65.85 | 66.35 | 0.65 | ||||||||||||
|
Fourth Quarter
|
68.25 | 62.35 | 63.63 | 0.65 | ||||||||||||
Unitholders
As of January 31, 2015, there were 4,335,573 outstanding units, representing 229 holders of record. Units outstanding include 39,797 that are currently restricted from trading and that were granted to 18 holders of record who are either management employees or members of the managing general partner’s board of directors. The trading restriction for these units is lifted as the units vest. These restricted units vest over a four-year vesting schedule, either ratably over four years for management or 50% on the third anniversary of the grant date and the remaining 50% upon reaching the fourth anniversary for non-management Board members.
Distributions
All cash distributions are at the discretion of the Partnership’s managing general partner, Pope MGP, Inc. (the “Managing General Partner”). During 2014, the Partnership made one quarterly distribution of 55 cents per unit and three of 65 cents per unit that totaled $11.0 million in the aggregate. In 2013, we made two distributions of 45 cents per unit and two of 55 cents per unit, totaling $8.9 million in the aggregate.
Confidence in our ability to generate cash flow in 2014 and continued improvement in all of our markets served to inform a $0.10, or 18% increase in the quarterly distribution rate in the second quarter of 2014. This increase was in addition to a $0.10, or 22%, increase in the quarterly distribution rate in the third quarter of 2013. The Managing General Partner, in its discretion, determines the amount of the quarterly distribution and regularly evaluates distribution levels. As such, the quarterly determination of distribution amounts, if any, will reflect the expectations of management and the Managing General Partner for the Partnership’s liquidity needs.
25
Equity Compensation Plan Information
The Partnership maintains the Pope Resources 2005 Unit Incentive Plan, which authorizes the granting of nonqualified equity compensation in order to provide incentives to align the interests of management with those of unitholders. Pursuant to the plan, the Partnership issues restricted unit grants that vest over four years. As of December 31, 2014 there were 41,427 unvested and outstanding restricted units of which 12,930 units are scheduled to vest during 2015, and 921,289 limited partnership units remained issuable under the plan. Additional information regarding equity compensation arrangements is set forth in Note 6 to Consolidated Financial Statements and Item 11 - Executive Compensation. Such information is incorporated herein by reference.
Performance Graph
The following graph shows a five-year comparison of cumulative total unitholder returns for the Partnership, the Standard and Poor's 500 Index, the Standard and Poor's Smallcap 600 Index, the Standard and Poor’s Forest Products Index, the Wilshire 4500, and the Wilshire 5000 for the five years ended December 31, 2014. The total unitholder return assumes $100 invested at the beginning of the period in the Partnership’s units, the Standard and Poor's 500 Index, the Standard and Poor's Smallcap 600 Index, the Standard and Poor’s Forest Products Index, the Wilshire 4500, the Wilshire 5000, and the Long-Term Incentive Plan Peer Group. The graph assumes distributions are reinvested.
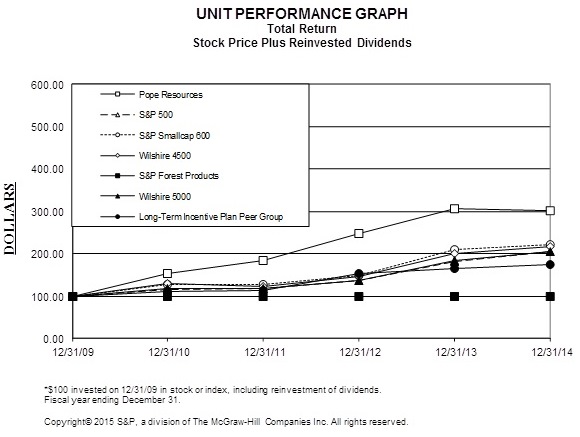
26
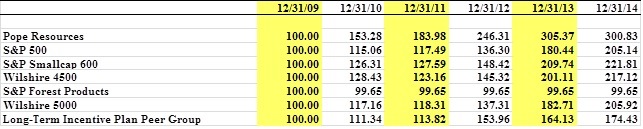
Issuance of Unregistered Securities
The Partnership did not conduct any unregistered offering of its securities in 2012, 2013, or 2014.
Repurchase of Equity Securities
On August 25, 2014 the Partnership repurchased 108,276 units at $68.00 per unit from a single third-party unitholder.
Actual Results. The financial information set forth below for each of the indicated years is derived from the Partnership’s audited consolidated financial statements. This information should be read in conjunction with the audited consolidated financial statements and related notes included with this report.
|
(In thousands, except per unit data)
|
Year Ended December 31,
|
|||||||||||||||||||
|
Statement of operations data
|
2014
|
2013
|
2012
|
2011
|
2010
|
|||||||||||||||
|
Revenue:
|
||||||||||||||||||||
|
Fee Timber
|
$ | 65,204 | $ | 56,035 | $ | 45,539 | $ | 52,729 | $ | 27,674 | ||||||||||
|
Timberland Management
|
- | - | 7 | - | 31 | |||||||||||||||
|
Real Estate
|
22,266 | 14,657 | 8,497 | 4,545 | 3,487 | |||||||||||||||
|
Total revenue
|
87,470 | 70,692 | 54,043 | 57,274 | 31,192 | |||||||||||||||
|
Operating income/(loss):
|
||||||||||||||||||||
|
Fee Timber
|
44,289 | 16,168 | 11,853 | 16,899 | 9,703 | |||||||||||||||
|
Timberland Management
|
(2,329 | ) | (1,950 | ) | (1,568 | ) | (1,515 | ) | (1,250 | ) | ||||||||||
|
Real Estate (1)
|
(2,720 | ) | 3,276 | (11,099 | ) | (349 | ) | (829 | ) | |||||||||||
|
General and Administrative
|
(3,781 | ) | (4,562 | ) | (4,170 | ) | (4,188 | ) | (4,711 | ) | ||||||||||
|
Total operating income (loss)
|
35,459 | 12,932 | (4,984 | ) | 10,847 | 2,913 | ||||||||||||||
|
Net income (loss) attributable to unitholders
|
$ | 12,415 | $ | 13,135 | $ | (4,709 | ) | $ | 8,754 | $ | 2,038 | |||||||||
|
Earnings (loss) per unit – diluted
|
$ | 2.82 | $ | 2.96 | $ | (1.11 | ) | $ | 1.94 | $ | 0.43 | |||||||||
|
Distributions per unit
|
$ | 2.50 | $ | 2.00 | $ | 1.70 | $ | 1.20 | $ | 0.70 | ||||||||||
|
Balance sheet data
|
||||||||||||||||||||
|
Total assets
|
$ | 345,077 | $ | 310,908 | $ | 267,499 | $ | 230,408 | $ | 235,837 | ||||||||||
|
Long-term debt, net of current portion
|
84,872 | 75,581 | 43,710 | 45,793 | 50,468 | |||||||||||||||
|
Partners’ capital
|
64,216 | 69,445 | 64,223 | 75,759 | 70,990 | |||||||||||||||
(1) Real Estate operating results in 2014, 2013, 2012, 2011 and 2010 included $10.0 , $0, $12.5 million, $977,000 and $875,000 respectively, of environmental remediation charges.
Management uses adjusted cash available for distributions, a non-GAAP measure, as a meaningful indicator of liquidity for purposes of calibrating our distribution payout rate to unitholders and, as such, has provided this information in addition to the generally accepted accounting principles-based presentation of cash provided by operating activities. Management recognizes that there are varying methods of calculating cash flow and has provided the information below to give transparency to this particular metric’s calculation.
27
|
(In thousands)
|
Year Ended December 31,
|
|||||||||||||||||||
|
Adjusted cash available for distribution:
|
2014
|
2013
|
2012
|
2011
|
2010
|
|||||||||||||||
|
Cash provided by operations
|
$ | 30,795 | $ | 17,949 | $ | 16,209 | $ | 21,660 | $ | 8,950 | ||||||||||
|
Less: Maintenance capital expenditures (1)
|
(1,249 | ) | (1,352 | ) | (1,284 | ) | (1,353 | ) | (858 | ) | ||||||||||
|
Less: Required debt service
|
(107 | ) | (98 | ) | (3 | ) | (6 | ) | (1,015 | ) | ||||||||||
|
Less: Noncontrolling portion of Funds cash from operations (2)
|
(8,759 | ) | (5,656 | ) | (3,270 | ) | (7,405 | ) | (733 | ) | ||||||||||
|
Plus: Financed debt extinguishment costs (3)
|
- | - | - | - | 1,250 | |||||||||||||||
|
Adjusted cash available for distribution (ACAD)
|
$ | 20,680 | $ | 10,843 | $ | 11,652 | $ | 12,896 | $ | 7,594 | ||||||||||
|
Other data
|
||||||||||||||||||||
|
Acres owned/managed (thousands)
|
193 | 204 | 196 | 178 | 175 | |||||||||||||||
|
Fee timber harvested (MMBF) (4)
|
97 | 90 | 84 | 90 | 53 | |||||||||||||||
|
(1)
|
Capital expenditures from the cash flow statement less costs incurred to purchase and make leasehold improvements to the new corporate building less non-controlling interest share of Fund capital expenditures.
|
|
(2)
|
Share of Funds’ operating income (loss), interest, tax, amortization, depreciation, and depletion expense, cost of land sold, change in working capital accounts, and cash from operations that are attributable to noncontrolling interests. That share is 80% in the case of Funds I and II and 95% in the case of Fund III.
|
|
(3)
|
Make-whole payments owed to prior lender that were added to total amount borrowed from new lender.
|
|
(4)
|
Includes timber deed sales of 4.0 MMBF, 2.0 MMBF and 4.4 MMBF in 2014, 2013 and 2012, respectively.
|
The following table presents Fee Timber revenue, operating income, and harvest volume on a Look-through basis for each year in the three-year period ended December 31, 2014. This depiction reflects an adjustment to these GAAP financial items to reflect our proportionate ownership of each of the Funds, which for GAAP purposes are consolidated into our financial statements.
|
Revenue
|
|
|||||||||||||||||||||||||||
|
(in millions) Year ended
|
Log Sale
|
Other
Revenue
|
Total Fee
Timber
|
Gain on
Sale
of Tree
Farms
|
Operating
Income
|
Harvest
Volume
(MMBF)
|
Timber
Deed Sale |
|||||||||||||||||||||
|
Partnership
|
$ | 30.9 | $ | 2.9 | $ | 33.8 | $ | - | $ | 14.4 | 47.1 | - | ||||||||||||||||
|
Share of Funds
|
4.6 | 0.2 | 4.8 | 4.8 | 1.0 | 7.2 | 0.2 | |||||||||||||||||||||
|
Look-through 2014
|
$ | 35.5 | $ | 3.1 | $ | 38.6 | $ | 4.8 | $ | 15.4 | 54.3 | 0.2 | ||||||||||||||||
|
Partnership
|
$ | 30.7 | $ | 1.5 | $ | 32.2 | $ | - | $ | 14.1 | 48.5 | - | ||||||||||||||||
|
Share of Funds
|
4.6 | 0.1 | 4.7 | - | 0.5 | 7.8 | 0.1 | |||||||||||||||||||||
|
Look-through 2013
|
$ | 35.3 | $ | 1.6 | $ | 36.9 | $ | - | $ | 14.6 | 56.3 | 0.1 | ||||||||||||||||
|
Partnership
|
$ | 26.3 | $ | 2.5 | $ | 28.8 | $ | - | $ | 11.6 | 47.6 | 4.4 | ||||||||||||||||
|
Share of Funds
|
3.3 | - | 3.3 | - | - | 6.4 | - | |||||||||||||||||||||
|
Look-through 2012
|
$ | 29.6 | $ | 2.5 | $ | 32.1 | $ | - | $ | 11.6 | 54.0 | 4.4 | ||||||||||||||||
28
The following table presents log volume sold by species on a Look-through basis for each year in the three-year period ended December 31, 2014 as follows:
|
Volume (in MMBF)
|
|
|||||||||||||||||||||||
|
Sawlogs
|
2014
|
% Total
|
2013
|
% Total
|
2012
|
% Total
|
||||||||||||||||||
|
Douglas-fir
|
32.8 | 61 | % | 36.6 | 65 | % | 38.8 | 72 | % | |||||||||||||||
|
Whitewood
|
9.2 | 17 | % | 8.0 | 14 | % | 6.2 | 11 | % | |||||||||||||||
|
Pine
|
0.2 | 0 | % | - | - | - | - | |||||||||||||||||
|
Cedar
|
1.7 | 3 | % | 1.4 | 2 | % | 0.6 | 1 | % | |||||||||||||||
|
Hardwoods
|
1.7 | 3 | % | 1.7 | 3 | % | 1.4 | 3 | % | |||||||||||||||
|
Pulpwood
|
||||||||||||||||||||||||
|
All Species
|
8.7 | 16 | % | 8.6 | 15 | % | 7.0 | 13 | % | |||||||||||||||
|
Total
|
54.3 | 100 | % | 56.3 | 100 | % | 54.0 | 100 | % | |||||||||||||||
|
Average Price/MMBF
|
$ | 653 | $ | 627 | $ | 548 | ||||||||||||||||||
The following table presents log price realized by species on a Look-through basis for each year in the three-year periods ended December 31, 2014 as follows:
|
Fiscal Year
|
|||||||||||||||||||||||||||||
|
∆ from 2013 to 2014
|
|
∆ from 2012 to 2013
|
|
||||||||||||||||||||||||||
|
2014
|
$/MBF
|
%
|
2013
|
$/MBF
|
%
|
2012
|
|||||||||||||||||||||||
|
Sawlogs
|
Douglas-fir
|
$ | 719 | $ | 24 | 3 | % | $ | 695 | $ | 108 | 18 | % | $ | 587 | ||||||||||||||
|
Whitewood
|
624 | 8 | 1 | % | 616 | 118 | 24 | % | 498 | ||||||||||||||||||||
|
Pine
|
543 | n/a | - | 0 | - | ||||||||||||||||||||||||
|
Cedar
|
1,369 | 207 | 18 | % | 1,162 | 145 | 14 | % | 1,017 | ||||||||||||||||||||
|
Hardwood
|
621 | 68 | 12 | % | 553 | (35 | ) | -6 | % | 588 | |||||||||||||||||||
|
Pulpwood
|
All Species
|
303 | 31 | 11 | % | 272 | (58 | ) | -18 | % | 330 | ||||||||||||||||||
|
Overall
|
653 | 26 | 4 | % | 627 | 79 | 14 | % | 548 | ||||||||||||||||||||
The percentage of annual harvest volume by quarter on a Look-through basis for each year in the three-year period ended December 31, 2014 was as follows:
|
Year ended
|
Q1
|
Q2
|
Q3
|
Q4
|
|
2014
|
32%
|
27%
|
20%
|
22%
|
|
2013
|
34%
|
28%
|
16%
|
22%
|
|
2012
|
23%
|
39%
|
21%
|
17%
|
29
Fee Timber cost of sales on a Look-through basis for each year in the three-year period ended December 31, 2014 is as follows, with the first table expressing these costs in total dollars and the second table expressing those costs that are driven by volume on a per MBF basis:
|
(in thousands)
|
Harvest,
Haul and
Tax
|
Depletion
|
Other
|
Total Fee
Timber
Cost of
Sales
|
Harvest
Volume
(MMBF)
|
Timber
Deed Sale
Volume
(MMBF)
|
||||||||||||||||||
|
Partnership tree farms
|
$ | 10,992 | $ | 2,244 | $ | 1,161 | $ | 14,397 | 47.1 | - | ||||||||||||||
|
Share of Funds
|
1,918 | 1,347 | 30 | 3,295 | 7.0 | 0.2 | ||||||||||||||||||
|
Look-through 2014
|
$ | 12,910 | $ | 3,591 | $ | 1,191 | $ | 17,692 | 54.1 | 0.2 | ||||||||||||||
|
Partnership tree farms
|
$ | 10,678 | $ | 2,704 | $ | 172 | $ | 13,554 | 48.5 | - | ||||||||||||||
|
Share of Funds
|
2,093 | 1,542 | 50 | 3,685 | 7.7 | 0.1 | ||||||||||||||||||
|
Look-through 2013
|
12,771 | $ | 4,246 | $ | 222 | 17,239 | 56.2 | 0.1 | ||||||||||||||||
|
Partnership tree farms
|
$ | 9,910 | $ | 3,083 | $ | 122 | $ | 13,115 | 47.6 | 4.4 | ||||||||||||||
|
Share of Funds
|
1,509 | 1,387 | - | 2,896 | 6.4 | - | ||||||||||||||||||
|
Look-through 2012
|
$ | 11,419 | $ | 4,470 | $ | 122 | $ | 16,011 | 54.0 | 4.4 | ||||||||||||||
|
(Amounts per MBF)
|
Harvest,
Haul and
Tax *
|
Depletion *
|
||||||||||||||||||||||
|
Partnership tree farms
|
$ | 233 | $ | 48 | ||||||||||||||||||||
|
Share of Funds
|
274 | 187 | ||||||||||||||||||||||
|
Look-through 2014
|
$ | 239 | $ | 66 | ||||||||||||||||||||
|
Partnership tree farms
|
$ | 220 | $ | 56 | ||||||||||||||||||||
|
Share of Funds
|
272 | 198 | ||||||||||||||||||||||
|
Look-through 2013
|
$ | 227 | $ | 75 | ||||||||||||||||||||
|
Partnership tree farms
|
$ | 208 | $ | 59 | ||||||||||||||||||||
|
Share of Funds
|
236 | 217 | ||||||||||||||||||||||
|
Look-through 2012
|
$ | 211 | $ | 77 | ||||||||||||||||||||
* Timber deed sale volumes are excluded in the per MBF computation for harvest, haul and tax costs but included in the per MBF computation for depletion.
30
FINANCIAL CONDITION AND RESULTS OF OPERATIONS
This report contains a number of projections and statements about our expected financial condition, operating results, and business plans and objectives. These statements reflect management’s estimates based upon our current goals, in light of management’s knowledge of existing circumstances and expectations about future developments. Statements about expectations and future performance are “forward looking statements” within the meaning of applicable securities laws, which describe our goals, objectives and anticipated performance. These statements can be identified by words such as “anticipate,” “believe,” “expect,” “intend” and similar expressions. These statements are inherently uncertain, and some or all of these statements may not come to pass. Accordingly, you should not interpret these statements as promises that we will perform at a given level or that we will take any or all of the actions we currently expect to take. Our future actions, as well as our actual performance, will vary from our current expectations, and under various circumstances these variations may be material and adverse. Some of the factors that may cause our actual operating results and financial condition to fall short of our expectations are set forth in the part of this report entitled “Risk Factors” in Item 1A above. Some of the issues that may have an adverse and material impact on our business, operating results and financial condition include economic conditions that affect consumer demand for our products and the prices we receive for them both domestically and overseas, particularly in certain parts of Asia; government regulation that affects our ability to access our timberlands and harvest logs from those lands; factors that affect the timing and amounts realized from the sales, if any, of our real estate holdings; the implications of significant indirect sales to overseas customers, including regulatory and tax matters; the effect of financial market conditions on our investment portfolio and related liquidity; environmental and land use regulations that limit our ability to harvest timber and develop property; access to debt financing by our customers as well as ourselves; the impacts of climate change and natural disasters on our timberlands and on surrounding areas; and the potential impacts of fluctuations in foreign currency rates as they affect demand for our products. From time to time we identify other risks and uncertainties in our other filings with the Securities and Exchange Commission. The forward-looking statements in this report reflect our estimates and expectations as of the date of the report, and unless required by law, we do not undertake to update these statements as our business operations and environment change.
This discussion should be read in conjunction with the Partnership’s audited consolidated financial statements included with this report.
EXECUTIVE OVERVIEW
Pope Resources, A Delaware Limited Partnership (“we” or the “Partnership”), is engaged in three primary businesses. The first, and by far most significant segment in terms of owned assets and operations, is the Fee Timber segment. This segment includes timberlands owned directly by the Partnership and operations of the three private equity funds (“Funds”). When we refer to the timberland owned by the Partnership, we describe it as the Partnership’s tree farms. We refer to timberland owned by the Funds as the Funds’ tree farms. When referring collectively to the Partnership’s and Funds’ timberland we will refer to them as the Combined tree farms. Operations in this segment consist of growing timber to be harvested as logs for sale to export brokers and domestic manufacturers. The second most significant business in terms of total assets owned is the development and sale of real estate. Real Estate activities primarily take the form of securing permits, entitlements, and, in some cases, installing infrastructure for raw land development and then realizing that land’s value by selling larger parcels to buyers who will take the land further up the value chain, either to home buyers or to developers and lessors of commercial property. Since these land projects span multiple years, the Real Estate segment may incur losses for multiple years while a project is developed, and will not recognize operating income until that project is sold. In addition, within this segment we sometimes negotiate and sell development rights in the form of conservation easements (CE’s) on Fee Timber properties which preclude future development. Our third business, which we refer to as Timberland Management is engaged in organizing and managing private equity timber funds using capital invested by third parties and the Partnership.
31
Our current strategy for adding timberland acreage is centered on our private equity timber fund business model. Our 20% co-investment in Fund II and our 5% co-investment in Fund III, which collectively totaled $23 million as of December 31, 2014, afford us a share of the Funds’ operating cash flows while also allowing us to earn asset management and timberland management fees, as well as potential future incentive fees, based upon the overall success of each fund. Management also believes that this strategy allows us to maintain more sophisticated expertise in timberland acquisition, valuation, and management more cost-effectively than could be maintained for the Partnership’s timberlands alone. We believe our co-investment strategy also enhances our credibility with existing and prospective investors by demonstrating that we have both an operational and a financial commitment to the Funds’ success.
Land held for development in western Washington by our Real Estate segment represents property that has been deemed suitable for residential and commercial building sites. Land held for sale represents those properties in the development portfolio that we expect to sell in the next year. During 2014 we have closed on the sale of a number of properties and although we expect to close on several more during 2015, the timing and success of those transactions cannot be assured. The challenge for our Real Estate segment centers around how and when to “harvest” a parcel of land and optimize value realization by selling the property, balancing the long-term risks and costs of carrying and developing a property against the potential for income and positive cash flows upon sale.
Currency exchange rates and ocean freight rates influence the competitiveness of our logs in Asian export markets as well as the competitiveness of our domestic sawmill customers with lumber exports to Asia relative to lumber exported from Canada or Australia. We sell our export logs to domestic intermediaries who then export the logs. Exchange rates impact the ability of these intermediaries to compete in Asian markets with logs that originate from Canada, Russia, or the Southern Hemisphere. In the second half of 2014, the U.S. dollar strengthened against most major currencies, making U.S. sawlogs less competitive in export markets.
Our consolidated revenue in 2014, 2013, and 2012, on a percentage basis by segment, was as follows:
|
Segment
|
2014
|
2013
|
2012
|
2012
|
2011
|
|
Fee Timber
|
75%
|
79%
|
84%
|
84%
|
92%
|
|
Timberland Management
|
-%
|
-%
|
-%
|
-%
|
-%
|
|
Real Estate
|
25%
|
21%
|
16%
|
16%
|
8%
|
Additional segment financial information is presented in Note 10 to the Partnership’s Consolidated Financial Statements included with this report.
Highlights for the quarter and year ended December 31, 2014
|
●
|
Harvest volume was 18 million board feet (MMBF) in both Q4 2014 and Q4 2013. Harvest volume for the full year 2014 was 93 MMBF compared to 87 MMBF for 2013, a 7% increase. These harvest volume figures do not include timber deed sales of 2 MMBF sold by ORM Timber Fund III (Fund III) in Q4 2014 and less than 1 MMBF in Q4 2013. The annual harvest volume figures do not include timber deed sales of 4 MMBF and 2 MMBF sold by Fund III in 2014 and 2013, respectively. The harvest volume and log price realization metrics cited below also exclude these timber deed sales.
|
|
●
|
Average realized log price per thousand board feet (MBF) was $636 in Q4 2014 compared to $634 per MBF in Q4 2013. For the full year 2014, the average realized log price was $641 per MBF compared to $614 per MBF for 2013, a 4% increase.
|
|
●
|
Fund properties contributed 40% of Q4 2014 harvest volume, compared to 38% in Q4 2013. For the full year 2014, Fund properties contributed 50% of harvest volume, compared to 44% for 2013.
|
|
●
|
As a percentage of total harvest, volume sold to export markets in Q4 2014 decreased to 22% from 45% in Q4 2013, with a correspondingly larger increase in the mix of volume sold to domestic markets to 64% in Q4 2014 from 34% in Q4 2013. For the full year 2014, the relative percentages of volume sold to export and domestic markets were 33% and 52%, respectively, compared to 36% and 46%, respectively, in 2013. Hardwood and pulpwood log sales make up the balance of total harvest volume.
|
32
|
●
|
The percentage of total harvest comprised of Douglas-fir sawlogs dropped to 50% in Q4 2014 from 58% in Q4 2013, with a corresponding increase in the whitewood sawlog component to 27% in Q4 2014 from 19% in Q4 2013. For the full year 2014, the relative mix of Douglas-fir and whitewood sawlogs was 48% and 31%, respectively, compared to 60% and 20%, respectively, for 2013. This full-year shift in species mix is consistent with the aforementioned higher weighting of total harvest volume coming from Fund properties in 2014 versus 2013.
|
|
●
|
Fund I sold its two tree farms during 2014 for an aggregate price of $70.5 million, recognizing a combined gain on the sales of $23.8 million, with $4.8 million attributable to Pope Resources’ unitholders by virtue of the Partnership’s 20% coinvestment interest in the Fund.
|
|
●
|
During October 2014 Fund III closed on a purchase of nearly 13,000 acres of timberland in northwest Oregon for $72.0 million. The purchase was financed with a combination of Fund III committed capital, of which the Partnership contributed $2.9 million, and a $14.4 million timberland mortgage collateralized by the Fund III tree farms.
|
|
●
|
During 2014, the Partnership closed on timberland purchases of $1.8 million, adding 699 acres to its timberland portfolio.
|
|
●
|
During Q4 2014 we closed on a $2.0 million sale of 366 acres in north Kitsap County. In addition, during Q4 2014 the Partnership closed on a $1.1 million conservation sale, extinguishing the development rights on 2,878 acres and selling outright 210 acres in Skamania County, Washington.
|
|
●
|
Recorded a $10.0 million increase to our environmental remediation liability for Port Gamble Bay in the fourth quarter of 2014.
|
Outlook
We expect total annual log harvest and timber deed sale volume of approximately 100 MMBF for 2015, though changing log markets could alter this projection as the year unfolds.
Several land sales from our Real Estate segment are currently in the pipeline to close, with anticipated timing in the first half of 2015.
33
RESULTS OF OPERATIONS
The following table reconciles net income (loss) attributable to Pope Resources’ unitholders for the years ended December 31, 2014 to 2013 and 2013 to 2012. In addition to the table’s numeric analysis, the explanatory text that follows describes many of these changes by business segment.
|
YEAR TO YEAR COMPARISONS
|
||||||||
|
(in thousands)
|
||||||||
|
2014 vs. 2013
|
2013 vs. 2012
|
|||||||
|
Total
|
Total
|
|||||||
|
Net income (loss) attributable to Pope Resources' unitholders:
|
||||||||
|
2014
|
$ | 12,415 | ||||||
|
2013
|
13,135 | $ | 13,135 | |||||
|
2012
|
(4,709 | ) | ||||||
|
Variance
|
$ | (720 | ) | $ | 17,844 | |||
|
Detail of earnings variance:
|
||||||||
|
Fee Timber
|
||||||||
|
Log volumes (A)
|
$ | 3,697 | $ | 3,957 | ||||
|
Log price realizations (B)
|
2,520 | 6,723 | ||||||
|
Gain on sale of timberland
|
23,750 | - | ||||||
|
Timber deed sales
|
1,070 | (538 | ) | |||||
|
Production costs
|
(3,021 | ) | (3,996 | ) | ||||
|
Depletion
|
(1,439 | ) | (734 | ) | ||||
|
Other Fee Timber
|
1,543 | (1,096 | ) | |||||
|
Real Estate
|
(379 | ) | (382 | ) | ||||
|
Land sales
|
2,334 | 3,690 | ||||||
|
Conservation easement sales
|
743 | (985 | ) | |||||
|
Timber depletion on HBU sale
|
415 | (529 | ) | |||||
|
Other Real Estate
|
511 | (300 | ) | |||||
|
Environmental remediation accrual
|
(10,000 | ) | 12,500 | |||||
|
General and administrative costs
|
783 | (394 | ) | |||||
|
Net interest expense
|
(1,076 | ) | (68 | ) | ||||
|
Taxes
|
(1,291 | ) | 659 | |||||
|
Noncontrolling interest
|
(20,880 | ) | (663 | ) | ||||
|
Total variances
|
$ | (720 | ) | $ | 17,844 | |||
Fee Timber
Our Fee Timber revenue is driven primarily by the volume of timber harvested and the average log price realized on the sale of that harvested timber. Our harvested volume is typically sold to domestic mills or export brokers as manufactured logs. We also occasionally sell rights to harvest timber (timber deed sale). The metrics used to calculate volumes sold and average price realized during the reporting periods exclude the timber deed sales, except where stated otherwise. Harvest volumes are generally expressed in million board feet (MMBF) increments while harvest revenue and related costs are generally expressed in terms of revenue or cost per thousand board feet (MBF). Fee Timber revenue is also derived from commercial thinning operations, ground leases for cellular communication towers, and royalties from gravel mines and quarries, all of which, along with timber deed sales, are included in Other Revenue below. Fee Timber cost of sales, which consist predominantly of harvest, haul and depletion costs, vary directly and roughly proportionately with harvest volume and the resulting revenues. Revenue and cost data related to harvest activities on timberland owned by Funds are consolidated into this discussion of operations.
34
Revenue and operating income for the Fee Timber segment for each year in the three-year period ended December 31, 2014, are as follows:
|
(in millions)
Year ended
|
Log Sale
Revenue
|
Other
Revenue
|
Total Fee
Timber
Revenue
|
Gain on
Sale of
Tree
Farms
|
Operating
Income
|
Harvest
Volume
(MMBF)
|
Timber
Deed Sale
Volume
(MMBF)
|
|||||||||||||||||||||
|
Partnership
|
$ | 30.9 | $ | 2.9 | $ | 33.8 | $ | - | $ | 14.4 | 47.1 | - | ||||||||||||||||
|
Funds
|
28.9 | 2.5 | 31.4 | 23.8 | 29.9 | 46.2 | 4.0 | |||||||||||||||||||||
|
Total 2014
|
$ | 59.8 | $ | 5.4 | $ | 65.2 | $ | 23.8 | $ | 44.3 | 93.3 | 4.0 | ||||||||||||||||
|
Partnership
|
$ | 30.7 | $ | 1.5 | $ | 32.2 | $ | - | $ | 14.1 | 48.5 | - | ||||||||||||||||
|
Funds
|
22.9 | 0.9 | 23.8 | - | 2.1 | 38.8 | 2.0 | |||||||||||||||||||||
|
Total 2013
|
$ | 53.6 | $ | 2.4 | $ | 56.0 | $ | - | $ | 16.2 | 87.3 | 2.0 | ||||||||||||||||
|
Partnership
|
$ | 26.3 | $ | 2.5 | $ | 28.8 | $ | - | $ | 11.6 | 47.6 | 4.4 | ||||||||||||||||
|
Funds
|
16.6 | 0.1 | 16.7 | - | 0.2 | 32.3 | - | |||||||||||||||||||||
|
Total 2012
|
$ | 42.9 | $ | 2.6 | $ | 45.5 | $ | - | $ | 11.8 | 79.9 | 4.4 | ||||||||||||||||
Operating Income
Fiscal Year 2014 compared to 2013. Operating income increased by $28.1 million, or 173% in 2014 primarily as a result of: the $23.8 million gain on the sales of Fund I’s two tree farms; a 9% increase in harvest volume, including timber deed sales; a 4% increase in average realized log prices; and a $3.0 million increase in Other Revenue. This was offset partially by a 14% increase in cost of sales and a $333,000 increase in operating expenses.
Fiscal Year 2013 compared to 2012. Operating income increased by $4.4 million, or 37%, in 2013 primarily as a result of: a 6% increase in harvest volume, including timber deed sales; a 14% increase in average realized log prices. This was partially offset by a 17% increase in cost of sales and a $1.5 million increase in operating expenses.
Revenue
Fiscal Year 2014 compared to 2013. Fee Timber revenue increased by $9.2 million, or 16%, in 2014. The increase is attributable to increased log sale revenue due to stronger export and domestic log markets in 2014 relative to 2013 leading to a 6.0 MMBF, or 7%, increase in harvest volume, combined with a $27/MBF, or 4%, increase in realized log price. In addition, Other Revenue increased by $3.0 million in 2014 compared to 2013 due primarily to a combined $2.7 million increase in commercial thinning activity and timber deed sales.
Fiscal Year 2013 compared to 2012. Fee Timber revenue increased by $10.5 million, or 23%, during 2013. The increase is attributable to increased log sale revenue due to stronger export and domestic log markets in 2013 relative to 2012 leading to a 7.4 MMBF, or 9%, increase in harvest volume, combined with a $77/MBF, or 14%, increase in realized log price. Other Revenue decreased by $203,000 in 2013 compared to 2012 due primarily to a combined $107,000 decrease in timber deed sales and commercial thinning activity.
35
Log Volume
We may adjust harvest volume from our plan based on the prevailing price of timber and strength of market demand. Harvest volume is also subject to seasonality and weather conditions which may affect access to higher elevation stands. Log volume sold for each year in the three-year period ended December 31, 2014 were as follows, exclusive of the aforementioned timber deed sales:
|
Volume (in MMBF)
|
|
||||||||||||||||||||
|
Sawlogs
|
2014
|
% Total
|
2013
|
% Total
|
2012
|
% Total
|
|||||||||||||||
|
Douglas-fir
|
45.0 | 48 | % | 52.5 | 60 | % | 51.1 | 64 | % | ||||||||||||
|
Whitewood
|
28.6 | 31 | % | 17.4 | 20 | % | 15.4 | 19 | % | ||||||||||||
|
Pine
|
3.2 | 3 | % | - | - | - | - | ||||||||||||||
|
Cedar
|
2.2 | 2 | % | 1.7 | 2 | % | 0.8 | 1 | % | ||||||||||||
|
Hardwoods
|
2.4 | 3 | % | 3.1 | 4 | % | 2.3 | 3 | % | ||||||||||||
|
Pulpwood
|
|||||||||||||||||||||
|
All Species
|
11.9 | 13 | % | 12.6 | 14 | % | 10.2 | 13 | % | ||||||||||||
|
Total
|
93.3 | 100 | % | 87.3 | 100 | % | 79.9 | 100 | % | ||||||||||||
|
Average Price/MMBF
|
$ | 641 | $ | 614 | $ | 537 | |||||||||||||||
Fiscal Year 2014 compared to 2013. Harvest volume increased 6.0 MMBF, or 7%, in 2014. The increase in harvest volume is attributable to stronger demand in both the domestic and export markets, particularly in the first half of the year, as well as the commencement of delivered log sales during 2014 for Fund III. Douglas-fir harvest volume, as a percentage of overall harvest, decreased from 60% in 2013 to 48% in 2014. Conversely, the component of whitewood and pine harvest volume increased from 20% in 2013 to 34% in 2014. This shift in mix from Douglas-fir to whitewood and pine is attributable to the increase in the share of harvest volume coming from Fund properties, 44% in 2013 compared to 50% in 2014. The Funds’ properties have a heavier component of whitewood than the Partnership properties.
Fiscal Year 2013 compared to 2012. Harvest volume increased 7.4 MMBF, or 9%, in 2013. The increase in volume is in response to a stronger domestic market that was manufacturing lumber for the improving U.S. housing market, as well as improved demand and pricing for logs from Asian export markets. We took advantage of these stronger markets by recapturing volume that was deferred in the 2008-2010 period when log markets were significantly weaker. The shift in mix from Douglas-fir in 2012 to whitewood and other species in 2013 is attributable to the decline in relative harvest volume from the Partnership’s timberland which was 60% of total harvest in 2012 compared to 56% in 2013 and commensurate increase in relative harvest volume from the Funds’ timberland which was 40% in 2012 compared to 44% in 2013.
Log Prices
For each year in the three-year period ended December 31, 2014, the table below shows the average realized log price by species, as well as the dollar and percentage change in price from 2013 to 2014 and 2012 to 2013.
|
Fiscal Year
|
|||||||||||||||||||||||||||||
|
∆ from 2013 to 2014
|
|
∆ from 2012 to 2013
|
|
||||||||||||||||||||||||||
|
2014
|
$/MBF
|
%
|
2013
|
$/MBF
|
%
|
2012
|
|||||||||||||||||||||||
|
Sawlogs
|
Douglas-fir
|
$ | 717 | $ | 33 | 5 | % | $ | 684 | $ | 102 | 18 | % | $ | 582 | ||||||||||||||
|
Whitewood
|
637 | 19 | 3 | % | 618 | 118 | 24 | % | 500 | ||||||||||||||||||||
|
Pine
|
516 | n/a | n/a | - | - | - | - | ||||||||||||||||||||||
|
Cedar
|
1,260 | 95 | 8 | % | 1,165 | 145 | 14 | % | 1,020 | ||||||||||||||||||||
|
Hardwood
|
610 | 69 | 13 | % | 541 | (40 | ) | -7 | % | 581 | |||||||||||||||||||
|
Pulpwood
|
All Species
|
292 | 27 | 10 | % | 265 | (53 | ) | -17 | % | 318 | ||||||||||||||||||
|
Overall
|
641 | 27 | 4 | % | 614 | 77 | 14 | % | 537 | ||||||||||||||||||||
36
Overall realized log prices increased $27/MBF, or 4%, in 2014. The overall average was heavily influenced by strong Douglas-fir and whitewood log prices early in the year when we conducted a larger portion of our harvest operations due to stronger demand in both the export and domestic markets. The significant price increases in cedar, hardwood, and pulpwood had a limited effect on our overall average log price due to those species low share of our production mix.
Our average overall delivered log price increased $77/MBF, or 14%, in 2013 compared to 2012. Demand was stronger from both the domestic and export markets in 2013 compared to 2012, while a decrease in the price for pulpwood logs served to offset a portion of the increases realized on Douglas-fir and whitewood sawlogs.
Douglas-fir: Douglas-fir is noted for its structural characteristics that make it generally preferable to other softwoods for manufacturing construction grade lumber and plywood. During 2012, the export market softened while at the same time the domestic housing market began to pick up. These two factors served to close the differential between export and domestic prices during 2012. Late in 2012, log inventories were drawn down in China as demand increased, causing the export and domestic markets to compete for the same logs. The trends of increased demand from both the domestic and export markets continued into 2013, combining to cause the realized price to increase $102/MBF, or 18%, in 2013 compared to 2012. These trends continued to prevail into the first half of 2014 before swollen inventories at Chinese ports reduced demand and prices later in the year. The end result was an increase of $33/MBF, or 5%, in 2014 compared to 2013.
Whitewood: “Whitewood” is a term used to describe several softwood species, but for us primarily refers to western hemlock. Though generally considered to be of a lower quality than Douglas-fir, these logs are also used for manufacturing construction grade lumber. Historically, there has been a modest export market for whitewood logs, with most of this volume going to Korea until the beginning of this decade when the China log export market demonstrated an appetite for softwood logs with little apparent preference as to species. As with the discussion of Douglas-fir markets above, whitewood markets experienced similar characteristics from 2012 to 2014, though with an increased emphasis on changes in export demand. As a result, whitewood prices increased $118/MBF, or 24%, from 2012 to 2013 and increased $19/MBF, or 3%, from 2013 to 2014.
Other species: In addition to the major species of Douglas-fir and whitewoods discussed above, our timberlands contain a small proportion of cedar, hardwood and pine, as well as smaller logs of all species that are sold as pulpwood. Cedar, hardwood, and pine are used to manufacture wood products that are used for outdoor applications such as fencing, siding, and decking (in the case of cedar), indoor functions such as furniture and cabinet construction (in the case of hardwood), and plywood (in the case of pine). Pulpwood is used by pulp and paper manufacturers to produce wood chips. Pulpwood logs compete directly with wood chips that are a byproduct of construction grade lumber manufacturing. The price movements in the markets served by these minor species can be significant, but due to their collective 20% contribution to our overall harvest volume they have a muted impact on our overall average realized log price.
Customers
Annual harvest volume and average price paid for each year in the three-year period ended December 31, 2014 was as follows:
|
2014
|
2013
|
2012
|
|||||||||||||||||||||||||
|
Destination
|
Volume
|
%
|
Price
|
Volume
|
%
|
Price
|
Volume
|
%
|
Price
|
||||||||||||||||||
|
Export brokers
|
30.4 | 32 | % | $ | 735 | 31.2 | 36 | % | $ | 707 | 20.2 | 25 | % | $ | 591 | ||||||||||||
|
Domestic mills
|
51.0 | 55 | % | 667 | 43.5 | 50 | % | 650 | 49.5 | 62 | % | 560 | |||||||||||||||
|
Pulpwood
|
11.9 | 13 | % | 292 | 12.6 | 14 | % | 265 | 10.2 | 13 | % | 318 | |||||||||||||||
|
Total
|
93.3 | 100 | % | $ | 641 | 87.3 | 100 | % | $ | 614 | 79.9 | 100 | % | $ | 537 | ||||||||||||
|
Timber deed sale
|
4.0 | $ | 392 | 2.0 | $ | 247 | 4.4 | $ | 231 | ||||||||||||||||||
|
Total
|
97.3 | 89.3 | 84.3 | ||||||||||||||||||||||||
Fiscal Year 2014 compared to 2013. Volume sold to export brokers as a percentage of total harvest declined from 36% in 2013 to 32% in 2014, with a commensurate increase in volume sold into the domestic market from 50% in 2013 to 55% in 2014, reflecting the gradual recovery in the domestic market along with the softening of the export market later in 2014.
37
Fiscal Year 2013 compared to 2012. Volume sold to export brokers as a percentage of total harvest increased from 25% in 2012 to 36% in 2013. Conversely, volume sold to domestic mills declined from 62% in 2012 to 50% in 2013. This shift in mix is attributable to a stronger export market in 2013 versus 2012, and reduced impact in the domestic market from a niche opportunity that existed in 2012 wherein we sold high quality logs to a domestic customer cutting lumber for Japan.
Cost of Sales
Cost of sales for the Fee Timber segment consists of harvest, haul, and harvest excise tax costs along with depletion expense. These costs all vary directly with harvest volume. Harvest costs will vary by terrain, with steeper slopes requiring more expensive cable systems and a high labor component, while more moderate slopes can be harvested utilizing mechanized equipment resulting in lower relative costs. Haul costs will also vary directly in proportion to the distance traveled from the logging site to the log-buying customer, and will reflect the impact of fuel cost variability. Taken together, harvest and haul costs represent by far the most significant direct costs incurred to convert standing timber into manufactured logs and deliver those logs to the point of sale. Harvest excise tax costs vary by state, and our typical volume-weighted average ranges from $10-14/MBF.
Depletion expense represents the cost of acquiring and growing the harvested timber. Because of the relatively recent acquisition dates of the Funds’ tree farms, the depletion rates associated with harvests from those properties are considerably higher than for harvests from the Partnership’s tree farms. Partnership depletion consists primarily of historical timber cost that has been owned by the Partnership for many decades, as well as the Columbia tree farm property that was acquired in 2001.
Other cost of sales expense represents the cost and harvest tax associated with commercial thinning activity and harvest taxes, if any, on timber deed sales.
Fee Timber cost of sales for each year in the three-year period ended December 31, 2014 is as follows, with the first table expressing these costs in total dollars and the second table expressing those costs that are driven by volume on a per MBF basis:
|
(in thousands)
|
Harvest,
Haul and
Tax
|
Depletion
|
Other
|
Total Fee
Timber Cost of
Sales
|
Harvest
Volume
(MMBF)
|
Timber
Deed Sale
Volume
(MMBF)
|
||||||||||||||||||
|
Partnership tree farms
|
$ | 10,992 | $ | 2,244 | $ | 1,161 | $ | 14,397 | 47.1 | - | ||||||||||||||
|
Funds' tree farms
|
11,839 | 9,948 | 602 | 22,389 | 46.2 | 4.0 | ||||||||||||||||||
|
Total 2014
|
$ | 22,831 | $ | 12,192 | $ | 1,763 | $ | 36,786 | 93.3 | 4.0 | ||||||||||||||
|
Partnership tree farms
|
$ | 10,678 | $ | 2,704 | $ | 172 | $ | 13,554 | 48.5 | - | ||||||||||||||
|
Funds' tree farms
|
10,471 | 8,049 | 252 | 18,772 | 39.0 | 2.0 | ||||||||||||||||||
|
Total 2013
|
$ | 21,149 | $ | 10,753 | $ | 424 | $ | 32,326 | 87.5 | 2.0 | ||||||||||||||
|
Partnership tree farms
|
$ | 9,910 | $ | 3,083 | $ | 122 | $ | 13,115 | 47.6 | 4.4 | ||||||||||||||
|
Funds' tree farms
|
7,546 | 6,935 | - | 14,481 | 32.3 | - | ||||||||||||||||||
|
Total 2012
|
$ | 17,456 | $ | 10,018 | $ | 122 | $ | 27,596 | 79.9 | 4.4 | ||||||||||||||
38
|
(Amounts per MBF)
|
Harvest,
Haul and
Tax *
|
Depletion *
|
||||||||||||||||||||||
|
Partnership tree farms
|
$ | 233 | $ | 48 | ||||||||||||||||||||
|
Funds' tree farms
|
256 | 198 | ||||||||||||||||||||||
|
Total 2014
|
$ | 245 | $ | 125 | ||||||||||||||||||||
|
Partnership tree farms
|
$ | 220 | $ | 56 | ||||||||||||||||||||
|
Funds' tree farms
|
268 | 196 | ||||||||||||||||||||||
|
Total 2013
|
$ | 242 | $ | 120 | ||||||||||||||||||||
|
Partnership tree farms
|
$ | 208 | $ | 59 | ||||||||||||||||||||
|
Funds' tree farms
|
234 | 215 | ||||||||||||||||||||||
|
Total 2012
|
$ | 218 | $ | 119 | ||||||||||||||||||||
* Timber deed sale volumes are excluded in the per MBF computation for harvest, haul and tax costs but included in the per MBF computation for depletion.
Fiscal Year 2014 compared to 2013. Cost of sales increased $4.5 million, or 14%, in 2014 primarily due to a 9% increase in harvest volume – including timber deed sales – from 2013 to 2014. In addition, the depletion rate increased $4/MBF, or 4%, due to an increase in the share of harvest volume – including timber deed sales – coming from Fund properties from 46% in 2013 to 52% in 2014. An increase in commercial thinning activity in 2014 drove the increase in the Other cost of sales.
Fiscal Year 2013 compared to 2012. Cost of sales increased $4.7 million, or 17%, in 2013 partly due to a $25/MBF, or 11%, increase in harvest, haul, and tax rates due to more expensive logging systems and hauling costs. In addition, there was a 6% increase in harvest volume – including timber deed sales – from 2012 to 2013.
Operating Expenses
Fee Timber operating expenses include the cost of both maintaining existing roads and building temporary roads for harvesting, silviculture costs, and other management expenses.
Fiscal Year 2014 compared to 2013. Fee Timber operating expenses increased $333,000, or 4%, from $7.5 million in 2013 to $7.9 million in 2014. The largest portion of the increase is attributable to a rise in silviculture expenditures on both the Partnership’s and the Funds’ tree farms.
Fiscal Year 2013 compared to 2012. Fee Timber operating expenses increased $1.5 million, or 24%, from $6.1 million in 2012 to $7.5 million in 2013. The largest portion of the increase is attributable to a rise in road building and maintenance costs to prepare for future harvest activity, particularly on recently acquired Fund tree farms.
39
Timberland Management
Fund Distributions and Fees Paid
The Partnership received combined distributions from Funds I, II, and III of $13.3 million, $4.0 million, and $958,000 in 2014, 2013, and 2012, respectively. Fund distributions are paid from available Fund cash, generated primarily from the harvest and sale of timber after paying all Fund expenses and management fees. In addition, distributions received by the Partnership during 2014 included $11.9 million from Fund I generated from the sale of its two tree farms in the second half of the year. Also, distributions received by the Partnership during 2013 included a special distribution of $2.7 million during Q3 2013 by Fund II that was financed by a $14 million timberland mortgage.
The Partnership earned investment and timberland management fees from the Funds which totaled $3.3 million, $2.8 million, and $2.2 million in 2014, 2013, and 2012, respectively. These fees are eliminated in the Partnership’s consolidated financial statements.
See Accounting Matters ~ Critical Accounting Policies and Estimates ~ Timber Fund Management Fees for more information on accounting for management fees paid by third-party investors.
Revenue and Operating Loss
The fees earned from managing the Funds include a fixed component related to invested capital and acres under management, and a variable component related to harvest volume from the Funds’ tree farms. As all fee revenue is eliminated in consolidation, operating losses consist of operating expenses incurred by the Timberland Management segment.
Revenue and operating loss for the Timberland Management segment for each year in the three-year period ended December 31, 2014, were as follows:
|
Year ended December 31,
|
||||||||||||
|
(in millions, except acre and volume data)
|
2014
|
2013
|
2012
|
|||||||||
|
Revenue - internal
|
$ | 3.3 | $ | 2.8 | $ | 2.2 | ||||||
|
Intersegment eliminations
|
(3.3 | ) | (2.8 | ) | (2.2 | ) | ||||||
|
Revenue - external
|
$ | 0.0 | $ | 0.0 | $ | 0.0 | ||||||
|
Operating income - internal
|
$ | 0.4 | $ | 0.3 | $ | 0.1 | ||||||
|
Intersegment eliminations
|
(2.7 | ) | (2.3 | ) | (1.7 | ) | ||||||
|
Operating loss - external
|
$ | (2.3 | ) | $ | (2.0 | ) | $ | (1.6 | ) | |||
|
Fund harvest voume (in MMBF) *
|
46.2 | 41.0 | 38.8 | |||||||||
|
Acres under management
|
80,000 | 91,000 | 80,000 | |||||||||
|
Invested capital
|
$ | 253 | $ | 239 | $ | 195 | ||||||
|
Acres under management
|
80,000 | 91,000 | 80,000 | |||||||||
|
Harvest volume - Funds (MMBF) *
|
50.2 | 40.7 | 32.3 | |||||||||
|
* Volume includes 4.0 and 2.0 MMBF from timber deed sales in 2014 and 2013, respectively.
|
||||||||||||
Fiscal Year 2014 compared to 2013. Timberland Management generated management fee revenue of $3.3 million and $2.8 million from managing the Funds in 2014 and 2013, respectively. The increase in fees is due to the Q4 2013 acquisition by Fund III of 11,000 acres in southwest Washington, which increased our invested capital and acres under management through the first three quarters of 2014 and our harvest volume during the full year. The net effect of the Fund I sale of 24,000 acres at the end of Q3 2014 and during Q4 2014, combined with the Fund III purchase of 13,000 acres during Q4 2014, served to increase our invested capital at the end of 2014 but reduce our acres under management.
40
Operating expenses incurred by the Timberland Management segment totaled $2.3 million and $2.0 million in 2014 and 2013, respectively. The increase in operating expenses is attributable to growth in the Funds’ acres under management (prior to the Fund I sales at the end of Q3 2014 and during Q4 2014) and increased costs associated with placing Fund III’s remaining capital.
Fiscal Year 2013 compared to 2012. Timberland Management generated management fee revenue of $2.8 million and $2.2 million from managing the Funds in 2013 and 2012, respectively. The increase in invested capital and acres managed associated with the acquisition by Fund III in December 2012, as well as the increase in harvest volume, resulted in the increase in fees earned in 2013 versus 2012.
Operating expenses incurred by the Timberland Management segment totaled $2.0 million and $1.6 million in 2013 and 2012, respectively. The increase in operating expenses is due primarily to increased expenses incurred in connection with evaluating potential acquisition targets offset partially by reduced travel and other expenses associated with raising capital for Fund III, which was completed in July 2012.
Real Estate
Revenue and Operating Income
The Real Estate segment’s activities consist of investing in and later reselling improved properties, holding properties for later development and sale, and managing commercial properties. Revenue is generated primarily from the sale of land within its 2,600-acre portfolio, sales of development rights, known as conservation easements (CE’s), sales of tracts from the Partnership’s timberland portfolio, and residential and commercial rents from our Port Gamble and Poulsbo properties. The Partnership’s Real Estate holdings are located primarily in the Washington counties of Pierce, Kitsap, and Jefferson with sales of land for this segment typically falling into one of the three general types:
|
●
|
Commercial, business park, and residential plat land sales represent land sold after development rights have been obtained and generally are sold with prescribed infrastructure improvements.
|
|
●
|
Rural residential lot sales that generally require some capital improvements such as zoning, road building, or utility access improvements prior to completing the sale.
|
|
●
|
The sale of unimproved land, which generally consists of larger acreage sales rather than single lot sales, and is normally completed with very little capital investment prior to sale and may or may not have a conservation flavor.
|
As indicated above, conservation sales take two primary forms for us, either an outright sale of land to a conservation entity or a conservation easement sale that extinguishes future development rights on a parcel of timberland but we retain the ability to conduct forestry operations.
Real Estate operations also include development, commercial real estate, and environmental remediation activities in connection with our ownership the Port Gamble, Washington townsite and former millsite as discussed in greater detail in “Business – Real Estate – Port Gamble,” and “– Environmental Remediation.”
Results from Real Estate operations are expected to vary significantly from year to year as we make multi-year investments in entitlements and infrastructure prior to selling entitled or developed land. Further, Real Estate results will vary as a result of adjustments to our environmental remediation liability related to Port Gamble. These adjustments are reflected in our Real Estate segment within operating expenses. Real Estate segment revenue and gross margin for each year in the three-year period ended December 31, 2014 consisted of the following components:
41
|
(in thousands except acres)
|
Per acre/lot **
|
||||||||||||||||||||||
|
Description
|
Revenue
|
Gross
margin
|
Gross
margin %
|
|
Sold |
Revenue
|
Gross
margin
|
||||||||||||||||
|
Conservation land sales
|
$ | 6,960 | $ | 5,781 |
Acres:
|
1,111 | $ | 6,265 | $ | 5,203 | |||||||||||||
|
Development rights (CE)
|
743 | 743 |
Acres:
|
2,878 | 258 | 258 | |||||||||||||||||
|
Gig Harbor Residential
|
13,171 | 4,295 |
Lots:
|
133 | 99,030 | 32,293 | |||||||||||||||||
|
Unimproved land
|
52 | 50 |
Acres:
|
4 | 13,000 | 12,500 | |||||||||||||||||
|
Total land
|
20,926 | 10,869 | 52 | % | |||||||||||||||||||
|
Rentals and other
|
1,340 | 93 | |||||||||||||||||||||
|
2014 Total
|
$ | 22,266 | $ | 10,962 | 49 | % | |||||||||||||||||
|
Conservation land sales
|
$ | 7,259 | $ | 5,426 |
Acres:
|
2,678 | $ | 2,711 | $ | 2,026 | |||||||||||||
|
Gig Harbor Residential
|
1,628 | 702 | * |
Acres:
|
12 | 135,667 | 58,500 | ||||||||||||||||
|
Gig Harbor Business Park
|
4,400 | 1,132 |
Acres:
|
14 | 314,286 | 80,857 | |||||||||||||||||
|
Unimproved land
|
126 | 102 |
Acres:
|
21 | 6,000 | 4,857 | |||||||||||||||||
|
Total land
|
13,413 | 7,362 | 55 | % | |||||||||||||||||||
|
Rentals and other
|
1,244 | (5 | ) | ||||||||||||||||||||
|
2013 Total
|
$ | 14,657 | $ | 7,357 | 50 | % | |||||||||||||||||
|
Description
|
Revenue
|
Gross Margin
|
|||||||||||||||||||||
|
Land underlying corporate office
|
$ | 2,900 | $ | 2,726 |
Acres:
|
2 | $ | 1,450,000 | $ | 1,363,000 | |||||||||||||
|
Development rights (CE)
|
1,235 | 985 |
Acres:
|
1,852 | 667 | 532 | |||||||||||||||||
|
Gig Harbor Residential
|
1,553 | 524 | * |
Acres:
|
12 | 129,380 | 43,667 | ||||||||||||||||
|
Unimproved land
|
1,511 | 966 |
Acres:
|
444 | 3,403 | 2,175 | |||||||||||||||||
|
Total land
|
7,199 | 5,201 | 72 | % | |||||||||||||||||||
|
Rentals and other
|
1,298 | 61 | |||||||||||||||||||||
|
2012 Total
|
$ | 8,497 | $ | 5,262 | 62 | % | |||||||||||||||||
* Revenue recognized on percentage of completion basis on sale of multi-family parcel.
** Lots represent residential single family lots.
Revenue
Land transactions. In 2014, we closed on three conservation land sales, one in the first quarter for $4.6 million covering 535 acres and two in the fourth quarter for $2.4 million covering 576 acres. Part of one of the fourth quarter sales included a 2,878-acre conservation easement sale for $743,000. Over the course of 2014, we sold 133 residential lots from our Harbor Hill development for $13.2 million.
In 2013, we closed on a 2,330-acre conservation land sale for $5.7 million during Q2 and, in December 2013, closed on a 348-acre conservation land sale for $1.6 million and a 14-acre sale from the Harbor Hill development in Gig Harbor for $4.4 million. Results for 2013 also include $1.6 million of revenue recognized on a percentage-of-completion basis for the 11.5 acre multi-family parcel sale in December 2012 from the Harbor Hill development. We had post-closing obligations in the form of road and infrastructure construction that precluded us from recognizing as revenue the entire sales price in 2012. As such, we accounted for the sale on a percentage-of-completion basis as we satisfied the post-closing obligations.
During 2012, we closed on the sale of the two acres underlying our Poulsbo headquarters building and a conservation easement sale on 1,852-acres of our Columbia tree farm for $1.2 million. We also recognized $1.6 million on a percentage-of-completion basis on the multi-family parcel from our Harbor Hill project described above and four rural land sales totaling $1.5 million for 444 acres.
42
Rentals and other. Rental and other activities in our Real Estate segment are much less volatile from year-to-year than land sales. The increase from 2013 to 2014 is due primarily to higher occupancy rates in our commercial and residential properties. The decrease from 2012 to 2013 was due to a reduction in square footage under lease to third parties. This resulted from the purchase of our new corporate office building in the second quarter of 2011, which was fully leased to third parties in 2012, whereas only 60% of the building was leased to third parties following our move to this building in the fourth quarter of 2012.
Cost of Sales
Real Estate cost of sales for each of the three years ended December 31, 2014, 2013, and 2012 was $11.3 million, $7.3 million, and $3.2 million, respectively, with these amounts comprised of land basis, legal, other closing costs, and costs incurred in the generation of rental revenue. CE sales, unlike fee simple sales which include land basis in cost of sales, typically have little or no cost basis as part of the transaction. The increases in cost of sales from year-to-year are due primarily to the increase in sales revenue.
Operating Expenses
Excluding environmental remediation charges, described below, Real Estate operating expenses for each of the three years ended December 31, 2014, 2013, and 2012 were $3.7 million, $4.1 million, and $3.9 million, respectively. Operating expenses increased by $220,000 from 2012 to 2013 due primarily to continuing costs associated with the master plan submission for Port Gamble’s town and mill site, as well as increases in costs related to long-term planning and development for other properties where entitlements have not yet been obtained, offset partially by lower depreciation expense. The master plan submission was largely completed in 2013 and, as a result, operating expenses decreased from 2013 to 2014.
Environmental Remediation
We recorded environmental remediation charges of $10.0 million and $12.5 million in 2014 and 2012, respectively, in connection with the Port Gamble Bay sediment clean-up project. The environmental remediation liability represents estimated payments to be made to monitor and remedy certain areas in and around the townsite/millsite of Port Gamble, and at Port Ludlow, Washington. Our environmental liabilities are most significant at Port Gamble, and the history of that site is summarized at “Business – Real Estate – Environmental Remediation.” As noted in that summary, we finalized a consent decree (CD) and cleanup action plan (CAP) in December 2013, and pursuant to the CD and CAP, we submitted a draft engineering design report (EDR) to the Washington State Department of Ecology (DOE) in November 2014, followed by supplemental material in December. These documents include our proposed design of the Port Gamble Bay sediment clean-up project. Our proposed engineering design was based on the remedy described in the CAP, supplemented by additional data collected during the summer and fall of 2014 as part of the design effort. Following the submittal of the draft EDR, we received feedback from DOE and have been engaged in ongoing discussions with the agency surrounding the detailed design of the sediment remediation project.
Although the project design is still not complete, these recent discussions with the DOE make clear that the cost of the Port Gamble Bay sediment clean-up project will be significantly greater than we had anticipated previously. Based on these discussions and the related changes in expectations, we have updated the cost inputs to the Monte Carlo simulation model that we have used to estimate the liability and, in doing so, we have arrived at a new mean value for a multi-variable set of clean-up design scenarios. Our current estimate of the Partnership’s share of the Port Gamble clean-up, based on the updated model’s mean value output, is $21.6 million. This outcome resulted in our recording a $10.0 million charge to increase the recorded liability in the fourth quarter of 2014. The recorded liability is an estimate of the Partnership’s share of the total liability. As such, it is net of the estimated amount that the Washington State Department of Natural Resources (DNR), as the other “potentially liable party”, or PLP, will contribute as its share of the project cost. The specific allocation of costs between the Partnership and DNR has not yet been finalized.
While the CD and CAP documents represent significant milestones in defining clean-up efforts, they are not prescriptive in detail and DOE retains broad discretion through the design phase to expand the scope of remediation. This expansion of scope has indeed occurred with the Port Gamble Bay project. In addition, certain lower-cost options to achieve the desired remediation results in the Bay that we had believed were available in prior quarters’ evaluations of our liability no longer appear feasible in light of DOE’s response to the draft EDR. Since the design phase is not complete and discussions with DOE will be ongoing on this subject into spring, we expect to update our estimates periodically as the project design is refined. The variability of our estimates should narrow as we transition from the design phase to obtaining contractor bids for the construction phase of the remediation project. The following paragraphs discuss the key areas where project costs are expected to increase from our previous estimates and this is reflected in our updated liability estimate.
43
Demolition: Demolition costs, consisting principally of the removal of creosote-treated pilings, will require more effort than estimated previously as DOE is pressing for a removal protocol that goes beyond standards established and used by DNR on other pile removal projects conducted in Washington State.
Dredging and disposal: Dredging and disposal costs have increased due to changes in the regulatory landscape and the expected volume of dredge material. Late in 2014, federal and state regulatory agencies, including the U.S. Environmental Protection Agency, U.S. Army Corps of Engineers, DOE, and DNR, tightened the criteria under which dredge material qualifies for open-water disposal, which is by far the least costly disposal method. This change in regulations will result in a greater portion of dredge material being subject to much more expensive land disposal methods. These methods include, in order of increasing cost, disposal of dredge material on:
● the adjacent, former mill site itself,
● land that we own a short distance from the town of Port Gamble, or
● at a commercial landfill.
Additionally, DOE is requiring an increase in the dredging area and depth of dredging adjacent to the former mill site which will increase the dredge volume from the approximately 41,000 cubic yards included in the draft EDR to 64,000 cubic yards, an increase of over 50%. This is due in part to the results of sampling conducted over the course of 2014 that showed contamination in these areas, albeit at low levels, was more widespread than anticipated.
Sand cover: The 2014 sampling also resulted in a reduction in the extent of sand cover required in the central portion of Port Gamble Bay relative to the estimates in the 2013 CAP. However, the overall reduction in sand cover was not as much as we projected in prior estimates of our liability. As a result, the total sand cover needed for the Bay has increased from approximately 125,000 tons to 218,000 tons, an increase of nearly 75%.
Eelgrass mitigation: The sampling and investigation activity conducted over the course of 2014 revealed that eelgrass has spread recently into certain areas of the Bay adjacent to the former mill site. Eelgrass is a sensitive aquatic plant, and thus its spread indicates the health of the Bay is improving in these areas. Unfortunately, DOE will not allow us to continue to monitor the progress of this natural recovery. Rather, the agency is pressing us to remove the eelgrass, dredge these areas, and then replant the eelgrass which will increase the cost of the project.
As noted above, the project design is still not complete. The $21.6 million liability reflects our best estimate of our share of the total liability based on the most current information available to us at this time regarding the design alternatives for the various elements of the project. Once the project design is finalized, which we expect to occur by mid-2015, further adjustments to the liability will likely be necessary.
Construction work on the remediation is scheduled to begin in July 2015, provided the project design for the initial phases can be sufficiently defined by then and that we can obtain the necessary permits. Based on this timetable, we expect to spend approximately $3.7 million in 2015 and have reflected that amount as a current liability on our balance sheet. We expect the construction activity, which comprises the bulk of the cost, will require two to three years to complete, followed by several years of monitoring activity.
44
General & Administrative (G&A)
G&A expenses decreased from $4.6 million in 2013 to $3.8 million in 2014. This decrease is due primarily to the reversal of previously accrued incentive and unit compensation expense forfeited upon the departure of our former chief executive officer as well as having only one person serving in both the CEO and CFO roles for the remainder of the year.
G&A expenses increased to $4.6 million in 2013 from $4.2 million in 2012. This increase was due to the combination of higher equity compensation expense driven by a strong unit price in 2013 relative to 2012 and professional fees incurred for non-recurring projects.
Interest Income and Expense
|
(in thousands)
|
2014
|
2013
|
2012
|
|||||||||
|
Interest income
|
$ | 25 | $ | 21 | $ | 26 | ||||||
|
Interest expense
|
(3,540 | ) | (2,364 | ) | (2,077 | ) | ||||||
|
Capitalized interest expense
|
911 | 815 | 591 | |||||||||
|
Net interest expense
|
$ | (2,604 | ) | $ | (1,528 | ) | $ | (1,460 | ) | |||
The fluctuations in interest income correlate to fluctuations in our cash and investment balances from year-to-year.
The increases in interest expense are due to increasing debt balances for Fund II and Fund III as debt financing has been used to fund a distribution in 2013, in the case of Fund II, and to acquire timberland, in the case of Fund III. The Partnership’s and Fund III’s debt arrangements with Northwest Farm Credit Services (NWFCS) include an annual rebate of a portion of interest expense paid in the prior year (patronage). This NWFCS patronage program is a feature common to most of this lender’s customer loan agreements. The patronage program reduced interest expense by $395,000, $374,000 and $264,000 in 2014, 2013, and 2012, respectively.
The increases in capitalized interest from year-to-year are due to increases in interest capitalized to the Harbor Hill project as construction activity on this project has increased.
Income Taxes
We recorded income tax expense of $984,000 in 2014, a tax benefit of $307,000 in 2013, and income tax expense of $352,000 in 2012 based on taxable income or loss in corporate subsidiaries.
Pope Resources is a limited partnership and is, therefore, not subject to income tax. Instead, taxable income/loss flows through and is reported to unitholders each year on a Form K-1 for inclusion in each unitholder’s tax return. Pope Resources does, however, have corporate subsidiaries that are subject to income tax. The corporate tax-paying entities are utilized for our third-party service fee businesses.
Noncontrolling interests-ORM Timber Funds
Noncontrolling interests-ORM Timber Funds represented the portion of 2014, 2013, and 2012 net (income) losses of the Funds attributable to third-party owners of the Funds. The Funds’ timberlands carry a higher depletion cost than the Partnership’s timberland and as a result often generate losses during the early years of the Fund life. Included in these results are the management fees charged by ORM LLC to the Funds, interest and income taxes. The portion of the loss or (income) attributable to these third-party investors is added back or deducted to determine “Net and comprehensive (income) loss attributable to unitholders” as follows:
45
|
(in thousands)
|
||||||||||||||||
|
Noncontrolling interest-2014
|
Fund I
|
Fund II
|
Fund III
|
Total
|
||||||||||||
|
Management fees paid to ORM LLC
|
$ | (562 | ) | $ | (1,459 | ) | $ | (1,282 | ) | $ | (3,303 | ) | ||||
|
Forest operations
|
23,756 | 4,409 | 1,774 | 29,939 | ||||||||||||
|
Fund operating income -Internal
|
23,194 | 2,950 | 492 | 26,636 | ||||||||||||
|
Interest expense
|
(1 | ) | (1,071 | ) | (893 | ) | (1,965 | ) | ||||||||
|
Income tax (expense) benefit
|
12 | (164 | ) | (104 | ) | (256 | ) | |||||||||
|
Fund net income (loss)-Internal
|
23,205 | 1,715 | (505 | ) | 24,415 | |||||||||||
|
(Income) Loss attributed to noncontrolling interest
|
$ | (18,564 | ) | $ | (1,372 | ) | $ | 480 | $ | (19,456 | ) | |||||
|
Noncontrolling interest-2013
|
Fund I
|
Fund II
|
Fund III
|
Total
|
||||||||||||
|
Management fees paid to ORM LLC
|
$ | (801 | ) | $ | (1,427 | ) | $ | (572 | ) | $ | (2,800 | ) | ||||
|
Forest operations
|
181 | 2,238 | (283 | ) | 2,136 | |||||||||||
|
Fund operating income (loss)-Internal
|
(620 | ) | 811 | (855 | ) | (664 | ) | |||||||||
|
Interest expense
|
(1 | ) | (737 | ) | (62 | ) | (800 | ) | ||||||||
|
Income tax expense
|
(47 | ) | (97 | ) | - | (144 | ) | |||||||||
|
Fund net income (loss)-Internal
|
(668 | ) | (23 | ) | (917 | ) | (1,608 | ) | ||||||||
|
(Income) loss attributed to noncontrolling interest
|
$ | 534 | $ | 18 | $ | 871 | $ | 1,424 | ||||||||
|
Noncontrolling interest-2012
|
Fund I
|
Fund II
|
Fund III
|
Total
|
||||||||||||
|
Management fees paid to ORM LLC
|
$ | (804 | ) | $ | (1,321 | ) | $ | (86 | ) | $ | (2,211 | ) | ||||
|
Forest operations
|
(149 | ) | 454 | (60 | ) | 245 | ||||||||||
|
Fund operating income (loss)-Internal
|
(953 | ) | (867 | ) | (146 | ) | (1,966 | ) | ||||||||
|
Interest expense
|
(3 | ) | (535 | ) | - | (538 | ) | |||||||||
|
Income tax expense
|
(23 | ) | (55 | ) | - | (78 | ) | |||||||||
|
Fund net income (loss)-Internal
|
(979 | ) | (1,457 | ) | (146 | ) | (2,582 | ) | ||||||||
|
(income) loss attributed to noncontrolling interest
|
$ | 783 | $ | 1,165 | $ | 139 | $ | 2,087 | ||||||||
46
Liquidity and Capital Resources
We ordinarily finance our business activities using operating cash flows and, where appropriate in management’s assessment, commercial credit arrangements with banks or other financial institutions. We expect that funds generated internally from operations and externally through financing will provide the required resources for the Partnership’s future operations and capital expenditures for at least the next twelve months.
The Partnership’s debt consists of mortgage debt with fixed interest rates and an operating line of credit with Northwest Farm Credit Services (NWFCS). The mortgage debt includes $29.8 million in term loans with NWFCS structured in four tranches maturing from 2015 through 2025. In addition, our commercial office building in Poulsbo, Washington is collateral for a $2.8 million loan from NWFCS that matures in 2023. Our $20.0 million operating line of credit matures August 1, 2015 and we had no balance drawn as of December 31, 2014 or 2013. The line of credit carries a variable interest rate that is based on the one-month LIBOR rate plus applicable margins determined by certain financial covenants. We intend to renew the line of credit prior to its expiration.
These debt agreements contain covenants that are measured quarterly. Among the covenants measured is a requirement that the Partnership not exceed a maximum debt-to-total-capitalization ratio of 30%, with total capitalization calculated using fair market (vs. carrying) value of timberland, roads and timber. The Partnership is in compliance with these covenants as of December 31, 2014 and expects to remain in compliance for at least the next twelve months.
Mortgage debt within our private equity funds are collateralized by Fund properties only. Fund II has a timberland mortgage comprised of two fixed rate tranches totaling $25 million with MetLife Insurance Company. The tranches are non-amortizing and both mature in September 2020. The loans allow for, but do not require, annual principal payments of up to 10% of outstanding principal without incurring a make-whole premium. This mortgage is collateralized by a portion of Fund II’s timberland portfolio. Fund III has a timberland mortgage comprised of two fixed rate tranches totaling $32.4 million with NWFCS. The mortgage is collateralized by all of Fund III’s timberland, is non-amortizing with the $18 million tranche maturing in December 2023 and a $14.4 million tranche maturing in 2024.
47
The change in cash flows from 2014 to 2013 and 2013 to 2012, respectively, is broken down in the following table:
|
(in thousands)
|
2014
|
Change
|
2013
|
Change
|
2012
|
|||||||||||||||
|
Cash provided by operations
|
$ | 30,795 | $ | 12,846 | $ | 17,949 | $ | 1,740 | $ | 16,209 | ||||||||||
|
Investing activities
|
||||||||||||||||||||
|
Purchase of short-term investments
|
(4,000 | ) | (4,000 | ) | - | - | - | |||||||||||||
|
Maturity of short-term investments
|
3,000 | 3,000 | - | - | - | |||||||||||||||
|
Proceeds from sale of fixed assets
|
37 | 37 | - | (2,873 | ) | 2,873 | ||||||||||||||
|
Capital expenditures
|
(2,335 | ) | (105 | ) | (2,230 | ) | 75 | (2,305 | ) | |||||||||||
|
Proceeds from sale of timberland
|
68,876 | 68,876 | - | - | - | |||||||||||||||
|
Acquisition of timberland - Partnership
|
(1,826 | ) | (1,826 | ) | - | - | - | |||||||||||||
|
Acquisition of timberland - Funds
|
(72,025 | ) | (28,612 | ) | (43,413 | ) | 1,742 | (45,155 | ) | |||||||||||
|
Cash used in investing activities
|
(8,273 | ) | 37,370 | (45,643 | ) | (1,056 | ) | (44,587 | ) | |||||||||||
|
Financing activities
|
||||||||||||||||||||
|
Repayment of line of credit, net
|
- | - | - | 4,957 | (4,957 | ) | ||||||||||||||
|
Repayment of long term debt
|
(109 | ) | 16 | (125 | ) | (93 | ) | (32 | ) | |||||||||||
|
Proceeds from issuance of long-term debt
|
14,400 | (17,580 | ) | 31,980 | 28,980 | 3,000 | ||||||||||||||
|
Debt issuance costs
|
(22 | ) | 6 | (28 | ) | 18 | (46 | ) | ||||||||||||
|
Unit repurchases
|
(7,363 | ) | (7,363 | ) | - | - | - | |||||||||||||
|
Proceeds from option exercises, net
|
- | - | - | (12 | ) | 12 | ||||||||||||||
|
Payroll taxes paid on unit net settlements
|
(196 | ) | 45 | (241 | ) | 59 | (300 | ) | ||||||||||||
|
Excess tax benefit from equity-based compensation
|
85 | 85 | - | (220 | ) | 220 | ||||||||||||||
|
Cash distributions to unitholders
|
(11,037 | ) | (2,151 | ) | (8,886 | ) | (1,387 | ) | (7,499 | ) | ||||||||||
|
Cash distributions - ORM Timber Funds, net of
|
||||||||||||||||||||
|
distributions to Partnership
|
(56,057 | ) | (39,574 | ) | (16,483 | ) | (12,541 | ) | (3,942 | ) | ||||||||||
|
Capital call - ORM Timber Funds, net of
|
||||||||||||||||||||
|
Partnership contribution
|
54,720 | 30,062 | 24,658 | (18,288 | ) | 42,946 | ||||||||||||||
|
Preferred stock issuance (distribution), net
|
||||||||||||||||||||
|
ORM Timber Funds
|
125 | 125 | - | 16 | (16 | ) | ||||||||||||||
|
Cash provided by (used in) financing activities
|
(5,454 | ) | (36,329 | ) | 30,875 | 1,371 | 29,504 | |||||||||||||
|
Net increase in cash and cash equivalents
|
$ | 17,068 | $ | 13,887 | $ | 3,181 | $ | 2,055 | $ | 1,126 | ||||||||||
Operating cash activities. The increase in cash provided by operating activities of $12.8 million from 2013 to 2014 resulted primarily from the real estate sales described earlier, a 4% increase in log prices and a 7% increase in timber harvest volume.
The $1.7 million increase in cash provided by operating activities from 2012 to 2013 was due principally to a 9% increase in harvest volume coupled with a 14% increase in realized average log price. This was offset partially by an $8.6 million increase in capitalized development activities during 2013 in connection with the Harbor Hill development to prepare for sales closing in 2014 and beyond.
Investing cash activities. The $37.4 million decrease in cash used in investing activities from 2013 to 2014 was due to sales and acquisitions of tree farms by the Funds, along with a $1 million net investment in short-term investments.
Cash used in investing activities increased $1.1 million from 2012 to 2013 as the 2012 use of cash was reduced by proceeds from the sale of land underlying our corporate headquarters. This was offset partially by the Fund III timberland acquisition in December 2013 that was $1.7 million less than Fund III’s timberland acquisition in December 2012.
48
Financing activities. The $36.3 million change in cash from financing activities resulted from the $39.5 million increase in Fund distributions, driven largely by the sale of Fund I’s tree farms, a $30.1 million increase in capital calls for Fund III for a tree farm acquisition, and a decrease in Fund borrowings of $17.6 million. In 2013, Fund II borrowed $14.0 million to finance a distribution and Fund III borrowed $18 million for a tree farm acquisition whereas in 2014 the only new debt consisted of a $14.4 million borrowing by Fund III for a tree farm acquisition. In addition, we repurchased 108,276 units from a single third-party unitholder for $7.4 million in 2014 and increased our distribution rate to unitholders, resulting in a $2.2 million increase in distributions.
Cash provided by financing activities increased $1.4 million in 2013 from 2012 due primarily to the repayment of the $4.9 million balance outstanding on the line of credit in 2012 offset partially by the $3.0 million proceeds from the mortgage for our corporate headquarters. The $0.10 per unit increase in the quarterly distribution beginning the third quarter of 2013 from $0.45 to $0.55 per unit was offset by a decrease in distributions to Fund investors, net of amounts financed from long-term debt.
Expected Future Changes to Cash Flows
Operating activities. We expect total annual log harvest and stumpage sale volume of approximately 100 MMBF for 2015, though changing log markets could alter this projection as the year unfolds.
Based on budget plans, we currently expect our Gig Harbor project’s 2015 capital expenditures to total $7.8 million in 2015. The majority of these expenditures in 2015 are projected to be for site work, engineering, surveying and overall project management costs in connection with additional closings in Gig Harbor. We also expect to spend approximately $1.8 million on a new wastewater treatment plant for the town of Port Gamble and approximately $3.7 million on the Port Gamble Bay environmental remediation liability.
Investing activities. In addition to the expenditures for Gig Harbor and Port Gamble described above, management has budgeted $3.4 million of capital expenditures for 2015, excluding any potential timberland acquisitions. These investments are comprised primarily of long-term investments supporting our Fee Timber operations.
Financing activities. Management is currently projecting that cash on hand, availability of drawing on the operating line of credit, and cash generated from operating activities will be sufficient to bridge the front-loading of the capital needs for development properties and co-investments in future timber funds, as well as to repay the $5 million debt tranche that matures in July 2015.
Should a financing need arise, management is comfortable that there is room to take on additional debt. Portions of the Hood Canal and Columbia tree farms secure the Partnership’s current timberland mortgages, Fund II’s tree farms secure the MetLife timberland mortgage and Fund III’s tree farms secure Fund III’s NWFCS mortgage. To date, the Partnership’s strong financial position has enabled fairly easy access to credit at reasonable terms when needed and we expect to renew our $20.0 million revolving credit facility with NWFCS.
Seasonality
Fee Timber. The elevation and terrain characteristics of our timberlands are such that we can conduct harvest operations virtually year-round on a significant portion of our tree farms. Generally, we concentrate our harvests from these areas in those months when weather limits operations on other properties, thus taking advantage of reduced competition for log supply to our customers and improving prices realized.
49
The percentage of annual harvest volume by quarter for each year in the three-year period ended December 31, 2014 was as follows:
|
Year ended
|
Q1
|
Q2
|
Q3
|
Q4
|
|
2014
|
32%
|
28%
|
20%
|
20%
|
|
2013
|
30%
|
31%
|
18%
|
21%
|
|
2012
|
18%
|
38%
|
21%
|
23%
|
Timberland Management. Management revenue generated by this segment consists of asset and timberland management fees. These fees, which relate primarily to our activities on behalf of the Funds and are eliminated in consolidation, vary based upon the amount of capital managed, the number of acres managed, and the volume of timber harvested from properties owned by the Funds and are not expected to be significantly seasonal.
Real Estate. While Real Estate results are not expected to be seasonal, the nature of the activities in this segment will likely result in periodic large transactions that will have significant positive impacts on both revenue and operating income of the Partnership in periods in which these transactions close, and relatively limited revenue and income in other periods. While the variability of these results is not primarily a function of seasonal weather patterns, we do expect to see some seasonal fluctuations in this segment because of the general effects of weather on Pacific Northwest development activities.
Contractual Obligations, Commercial Commitments and Contingencies
Our commitments at December 31, 2014 consist of operating leases, and other obligations entered into in the normal course of business.
|
(in thousands)
|
Payments Due By Period /Commitment Expiration Date
|
|||||||||||||||||||
|
Obligation or Commitment
|
Total
|
Less than 1
year
|
1-3 years
|
4-5 years
|
After 5 years
|
|||||||||||||||
|
Total debt
|
$ | 89,981 | $ | 5,109 | $ | 5,232 | $ | 10,051 | $ | 69,589 | ||||||||||
|
Operating leases
|
300 | 138 | 143 | 19 | - | |||||||||||||||
|
Interest on debt
|
32,020 | 4,413 | 8,523 | 7,885 | 11,199 | |||||||||||||||
|
Environmental remediation
|
21,651 | 3,700 | 15,201 | 2,750 | - | |||||||||||||||
|
Other long-term obligations
|
165 | 25 | 50 | 50 | 40 | |||||||||||||||
|
Total contractual obligations or commitments
|
$ | 144,117 | $ | 13,385 | $ | 29,149 | $ | 20,755 | $ | 80,828 | ||||||||||
Environmental remediation represents our estimate of potential liability associated with environmental contamination at Port Gamble and Port Ludlow. Other long-term obligations consist of a $165,000 liability for a supplemental employment retirement plan.
The impact of inflation on our consolidated financial condition and consolidated results of operations for each of the periods presented was not material.
Off-Balance Sheet Arrangements
The Partnership is not a party to any material off-balance sheet arrangements other than the operating leases disclosed above and does not hold any variable interests in unconsolidated entities.
Capital Expenditures and Commitments
Projected capital expenditures in 2015 are $13.0 million, of which $7.8 million relates to the Gig Harbor site. These expenditures could be increased or decreased as a consequence of future economic conditions. Projected capital expenditures are subject to permitting timetables and progress towards closing on specific land sale transactions.
50
Government Regulation
Compliance with laws, regulations, and demands usually involves capital expenditures as well as operating costs. We cannot easily quantify future amounts of capital expenditures required to comply with laws, regulations, and demands, or the effects on operating costs, because in some instances compliance standards have not been developed or have not become final or definitive. Accordingly, at this time we have not included herein a quantification of future capital requirements to comply with any new regulations being developed by United States regulatory agencies.
Additionally, many federal and state environmental regulations, as well as local zoning and land use ordinances, place limits upon various aspects of our operations. These limits include restrictions on our harvest methods and volumes, remediation requirements that may increase our post-harvest reforestation costs, Endangered Species Act limitations on our ability to harvest in certain areas, zoning and development restrictions that impact our Real Estate segment, and a wide range of other existing and pending statutes and regulations. Various initiatives are presented from time to time that seek further restrictions on timber and real estate development businesses, and although management currently is not aware of any material noncompliance with applicable law, we cannot assure readers that we will ultimately be successful in complying with all such regulations or that additional regulations will not ultimately have a material adverse impact upon our business.
ACCOUNTING MATTERS
Accounting Standards Not Yet Implemented
On May 28, 2014, the FASB issued ASU No. 2014-09, Revenue from Contracts with Customers, which requires an entity to recognize the amount of revenue to which it expects to be entitled for the transfer of promised goods or services to customers. The ASU will replace most existing revenue recognition guidance in U.S. GAAP when it becomes effective on January 1, 2017. Early application is not permitted. The standard permits the use of either the retrospective or cumulative effect transition method. The Partnership is evaluating the effect that ASU 2014-09 will have on its consolidated financial statements and related disclosures. The Partnership has not yet selected a transition method nor has it determined the effect of the standard on its ongoing financial reporting.
Critical Accounting Policies and Estimates
Management believes its most critical accounting policies and estimates are as follows:
Purchased timberland cost allocation. When the Partnership acquires timberlands, a purchase price allocation is performed that allocates cost between the categories of merchantable timber, pre-merchantable timber, and land based upon the relative fair values pertaining to each of the categories. Land value may include uses other than timberland, including potential CE sales and development opportunities.
Depletion. Depletion represents the cost of timber harvested and the cost of the permanent road system that is charged to operations by applying a depletion rate to volume harvested during the period. The depletion rate is calculated on January 1st of each year by dividing the Partnership’s cost of merchantable timber and the cost of the permanent road system by the volume of merchantable timber. For purposes of the depletion calculation, merchantable timber is defined as timber that is equal to or greater than 35 years of age for all of our tree farms except California, for which merchantable timber is defined as timber with a diameter at breast height (DBH) of 16 inches or greater.
To calculate the depletion rate, the Partnership uses a combined pool when the characteristics of the acquired timber are not significantly different from the Partnership’s existing timberlands. Depletion rate calculations on Funds timberlands, which are recently acquired, are made on a tree farm specific basis.
51
Timber inventory volumes include only timber whose eventual harvest is not constrained by the applicable state and federal regulatory limits on timber harvests as applied to the Partnership’s properties. Timber inventory volume is accounted for by periodic statistical sampling of the harvestable timbered acres. Since timber stands can be very heterogeneous, the accuracy of the statistical sampling, known as a “timber cruise”, of a timber stand can vary. The inventory system is designed in such a way that the accuracy of the whole is very reliable while any subset, or individual timber stand, will have a wider range of accuracy. The Partnership’s standing timber inventory system utilizes annual statistical sampling of the timber (cruising) together with adjustments made for estimated annual growth and the depletion of areas harvested.
The standing inventory system is subject to two processes each year to monitor accuracy. The first is the annual cruise update process and the second is a comparison of the volume actually extracted by harvest to the inventory in the standing inventory system at the time of the harvest. Only productive acres with timber that is at least 20 years old are selected as subject to a cruise. The Partnership cruises 10-20% of its productive acres with 25-year-old or greater timber annually. Specific acres are first selected for cruising with a bias towards those acres that have gone the longest without a cruise and, second, with a bias towards those acres that have been growing the longest. As the cruise is being performed, only those trees with a breast height diameter (approximately 4.5 feet from the ground) of at least 6 inches are measured for inclusion in the inventory. The inventory to harvested volume comparison utilizes subsets of the total inventory which have been sampled sometime in the last ten years and grown annually using yield tables built on more statistical data; due to the nature of statistical sampling the results of the annual timber inventory to harvested volume comparison is meaningful only in the context of accumulated results over several years, and not in the context of a single harvest unit.
A hypothetical 5% change in estimated timber inventory volume would have changed 2014 depletion expense by $593,000.
Environmental remediation. The Partnership has an accrual for estimated environmental remediation costs of $21.7 million and $13.2 million as of December 31, 2014 and 2013, respectively. The environmental remediation liability represents estimated payments to be made to monitor and remedy certain areas in and around the townsite/millsite of Port Gamble ($21.6 million), and at Port Ludlow, Washington ($86,000). Additional information about the Port Gamble site is presented in “Business – Real Estate – Environmental Remediation” above. Additional information about the liability is presented in “Management’s Discussion and Analysis – Real Estate.”
We evaluate our environmental remediation liabilities using a combination of methods, but most significantly using a “Monte Carlo” statistical simulation model for the Port Gamble project. This model takes into account the estimated likelihood of a range of potential outcomes, coupled with the estimated cost associated with those outcomes. The model then produces a range of possible outcomes corresponding to a two standard deviation range from the mean. In the case of Port Gamble, the simulation model suggests a mean value of $21.6 million, which we believe to be the best estimate of the most likely outcome. This estimated liability, derived by the simulation model, triangulates with a forecast of costs using our best estimate of the most likely design scenarios for the various elements of the project. The recorded liability is an estimate of the Partnership’s share of the total liability. As such, it is net of the estimated amount that DNR, as the other PLP, will contribute as its share of the project cost. The specific allocation of costs between the Partnership and DNR has not yet been finalized.
The project design is still not complete. The $21.6 million liability reflects our best estimate of our share of the total liability based on the most current information available to us at this time regarding the design alternatives for the various elements of the project. Once the project design is finalized, which we expect to occur by mid-2015, further adjustments to the liability will likely be necessary.
Property development costs. The Partnership is developing six master planned communities in Gig Harbor, Kingston, Port Gamble, Bremerton, Hansville and Port Ludlow. Costs of development, including interest, are capitalized for these projects and allocated to individual lots based upon their relative preconstruction fair value. This allocation of basis supports, in turn, the computation of those amounts reported as a current vs. long-term asset based on management’s expectation of when the sales will occur (“Land Held for Sale” and “Land Held for Development”, respectively). As lot sales occur, the allocation of these costs becomes part of cost of sales attributed to individual lot sales.
52
Costs associated with land including acquisition, project design, architectural costs, road construction, capitalized interest and utility installation are accounted for as operating activities on our statement of cash flows.
Percentage of Completion Revenue Recognition. The partnership accounts for revenue recognized from development sales consistent with the accounting standards relating to the sales of real estate. When a real estate transaction is closed with obligations to complete infrastructure or other construction, revenue is recognized on a percentage of completion method by calculating a ratio of costs incurred to total costs expected. Revenue is deferred proportionately based on the remaining costs to complete the project.
Impairment of Long-Lived Assets. When facts and circumstances indicate the carrying value of properties may be impaired, an evaluation of recoverability is performed by comparing the carrying value of the property to the projected future undiscounted cash flows. Upon indication that the carrying value of such assets may not be recoverable, the Partnership would recognize an impairment loss, for the difference between the carrying value and the fair value, and charge this amount against current operations. The land basis associated with most of our development properties is well below current market value; therefore, an asset impairment charge on one of our development projects is not likely. The long-term holding period of timberland properties, particularly those that have been transferred to our real estate development portfolio, makes an asset impairment unlikely as the expected undiscounted cash flows from a timberland property would need to decrease very significantly to not exceed its carrying value.
Consolidation of ORM Timber Fund I, LP (Fund I), ORM Timber Fund II, Inc. (Fund II), and ORM Timber Fund III (REIT) Inc. (Fund III). Olympic Resource Management LLC (ORMLLC), a subsidiary of the Partnership, owns 1% of each of the funds and is the general partner of Fund I and manager of Funds II and III. The Partnership are owns 19% of Funds I and II and 4% of Fund III. Third-party investors do not have the right to dissolve these Funds or otherwise remove the general partner/manager without cause or a super-majority vote of the third-party investors, nor do they have substantive participating rights in major decisions of the Funds. Based upon this governance structure, ORMLLC has presumptive control of the Funds and, as a result, under accounting rules the Funds must be consolidated into the Partnership’s financial statements.
Timber Fund Management Fees. The Partnership’s wholly owned subsidiary, ORMLLC, earns management fees related to managing the Funds. As a result, the Partnership’s consolidated financial statements, excluding the Funds, include 100% of these management fees as revenue. The stand-alone financial statements for the Funds include 100% of these management fees as expenses. The dollar amounts are the same, allowing for elimination of these two amounts in consolidation, and initially, no income impact in consolidation. However, Funds I and II are owned 80% third-party investors, while Fund III is owned 95% by third-party investors, and, as a result, 80% and 95% of these management fees are paid by these third-party investors, respectively. The management fees paid by third-party investors flows to the Partnership’s Statement of Operations as a component of the caption” “Net (income) loss attributable to noncontrolling interest-ORM Timber Funds,” effectively bringing management fees paid by third-party investors back into consolidated income of the Partnership as detailed on page 46.
Total management fees of $3.3 million, $2.8 million and $2.2 million were generated in 2014, 2013 and 2012, respectively. To summarize the aforementioned consolidation process, these management fees were eliminated from revenue in the Partnership’s Timberland Management segment and from operating expenses in the Partnership’s Fee Timber segment. The management fees paid by third-party investors in the funds were added back to consolidated income in the Statement of Operations as a component of the caption “Net loss attributable to noncontrolling interests-ORM Timber Funds.”
Incentive Compensation. The Human Resources Committee adopted a new incentive compensation program in 2010. The program has two components – the Performance Restricted Unit (“PRU”) plan and the Long-Term Incentive Plan (“LTIP”). Both components have a long-term emphasis, with the PRU plan focused on annual decision making, and the LTIP focused on 3-year performance of the Partnership’s publicly traded units relative to a group of peer companies. Compensation expense relating to the PRU will be recognized over the four-year future service period beginning with the date of grant. Approximately $867,000 of equity compensation expense related to the PRU component of this program was recognized in 2014. As of December 31, 2014, we had accrued $1.0 million, with $287,000 of that total attributable to the cash component of the PRU element and the balance of $751,000 attributable to the LTIP that is paid in cash.
53
Interest Rate Risk
At December 31, 2014, the Partnership had $90.0 million of fixed-rate debt outstanding with a fair value of approximately $96.0 million based on the current interest rates for similar financial instruments. A change in the interest rate on fixed-rate debt will affect the fair value of the debt, whereas a change in the interest rate on variable-rate debt will affect interest expense and cash flows. A hypothetical 1% change in prevailing interest rates would change the fair value of the Partnership’s fixed-rate long-term debt obligations by $3.2 million.
54
POPE RESOURCES
A DELAWARE LIMITED PARTNERSHIP
YEARS ENDED DECEMBER 31, 2014, 2013, AND 2012
55
POPE RESOURCES, A DELAWARE LIMITED PARTNERSHIP
YEARS ENDED DECEMBER 31, 2014, 2013, AND 2012
CONTENTS
|
Page
|
|
|
Reports of independent registered public accounting firm
|
57
|
|
Financial statements:
|
|
|
Consolidated balance sheets
|
59
|
|
Consolidated statements of comprehensive income (loss)
|
60
|
|
Consolidated statements of partners' capital
|
61
|
|
Consolidated statements of cash flows
|
62
|
|
Notes to consolidated financial statements
|
64
|
56
Report of Independent Registered Public Accounting Firm
The Board of Directors and Unitholders
Pope Resources, A Delaware Limited Partnership:
We have audited the accompanying consolidated balance sheets of Pope Resources, A Delaware Limited Partnership, and subsidiaries (collectively, the Partnership) as of December 31, 2014 and 2013, and the related statements of comprehensive income (loss), partners’ capital, and cash flows for each of the years in the three-year period ended December 31, 2014. These consolidated financial statements are the responsibility of the Partnership’s management. Our responsibility is to express an opinion on these consolidated financial statements based on our audits.
We conducted our audits in accordance with the standards of the Public Company Accounting Oversight Board (United States). Those standards require that we plan and perform the audit to obtain reasonable assurance about whether the financial statements are free of material misstatement. An audit includes examining, on a test basis, evidence supporting the amounts and disclosures in the financial statements. An audit also includes assessing the accounting principles used and significant estimates made by management, as well as evaluating the overall financial statement presentation. We believe that our audits provide a reasonable basis for our opinion.
In our opinion, the consolidated financial statements referred to above present fairly, in all material respects, the financial position of Pope Resources, A Delaware Limited Partnership, and subsidiaries as of December 31, 2014 and 2013, and the results of their operations and their cash flows for each of the years in the three-year period ended December 31, 2014, in conformity with U.S. generally accepted accounting principles.
We also have audited, in accordance with the standards of the Public Company Accounting Oversight Board (United States), the Partnership’s internal control over financial reporting as of December 31, 2014, based on criteria established in Internal Control – Integrated Framework (1992) issued by the Committee of Sponsoring Organizations of the Treadway Commission (COSO), and our report dated March 5, 2015 expressed an unqualified opinion on the effectiveness of the Partnership’s internal control over financial reporting.
/s/ KPMG LLP
Seattle, Washington
March 5, 2015
57
Report of Independent Registered Public Accounting Firm
The Board of Directors and Unitholders
Pope Resources, A Delaware Limited Partnership:
We have audited Pope Resources, A Delaware Limited Partnership (the Partnership), internal control over financial reporting as of December 31, 2014, based on criteria established in Internal Control – Integrated Framework (1992) issued by the Committee of Sponsoring Organizations of the Treadway Commission (COSO). The Partnership’s management is responsible for maintaining effective internal control over financial reporting and for its assessment of the effectiveness of internal control over financial reporting, included in the accompanying “Management’s Report on Internal Control Over Financial Reporting”. Our responsibility is to express an opinion on the Partnership’s internal control over financial reporting based on our audit.
We conducted our audit in accordance with the standards of the Public Company Accounting Oversight Board (United States). Those standards require that we plan and perform the audit to obtain reasonable assurance about whether effective internal control over financial reporting was maintained in all material respects. Our audit included obtaining an understanding of internal control over financial reporting, assessing the risk that a material weakness exists, and testing and evaluating the design and operating effectiveness of internal control based on the assessed risk. Our audit also included performing such other procedures as we considered necessary in the circumstances. We believe that our audit provides a reasonable basis for our opinion.
A company’s internal control over financial reporting is a process designed to provide reasonable assurance regarding the reliability of financial reporting and the preparation of financial statements for external purposes in accordance with generally accepted accounting principles. A company’s internal control over financial reporting includes those policies and procedures that (1) pertain to the maintenance of records that, in reasonable detail, accurately and fairly reflect the transactions and dispositions of the assets of the company; (2) provide reasonable assurance that transactions are recorded as necessary to permit preparation of financial statements in accordance with generally accepted accounting principles, and that receipts and expenditures of the company are being made only in accordance with authorizations of management and directors of the company; and (3) provide reasonable assurance regarding prevention or timely detection of unauthorized acquisition, use, or disposition of the company’s assets that could have a material effect on the financial statements.
Because of its inherent limitations, internal control over financial reporting may not prevent or detect misstatements. Also, projections of any evaluation of effectiveness to future periods are subject to the risk that controls may become inadequate because of changes in conditions, or that the degree of compliance with the policies or procedures may deteriorate.
In our opinion, Pope Resources, A Delaware Limited Partnership, maintained, in all material respects, effective internal control over financial reporting as of December 31, 2014, based on criteria established in Internal Control – Integrated Framework (1992) issued by the Committee of Sponsoring Organizations of the Treadway Commission (COSO).
We also have audited, in accordance with the standards of the Public Company Accounting Oversight Board (United States), the consolidated balance sheets of Pope Resources, A Delaware Limited Partnership, and subsidiaries as of December 31, 2014 and 2013, and the related consolidated statements of comprehensive income (loss), partners’ capital, and cash flows for each of the years in the three-year period ended December 31, 2014, and our report dated March 5, 2015, expressed an unqualified opinion on those consolidated financial statements.
/s/ KPMG LLP
Seattle, Washington
March 5, 2015
58
POPE RESOURCES, A DELAWARE LIMITED PARTNERSHIP
CONSOLIDATED BALANCE SHEETS
DECEMBER 31, 2014 AND 2013
(IN THOUSANDS)
|
ASSETS
|
2014
|
2013
|
||||||
|
Current assets
|
||||||||
|
Partnership cash and cash equivalents
|
$ | 14,505 | $ | 5,704 | ||||
|
ORM Timber Funds cash and cash equivalents
|
9,523 | 1,256 | ||||||
|
Cash and cash equivalents
|
24,028 | 6,960 | ||||||
|
Short-term investments
|
1,000 | - | ||||||
|
Accounts receivable, net
|
2,419 | 1,501 | ||||||
|
Land held for sale
|
7,160 | 10,258 | ||||||
|
Current portion of contracts receivable
|
9 | 98 | ||||||
|
Prepaid expenses and other
|
2,864 | 1,562 | ||||||
|
Total current assets
|
37,480 | 20,379 | ||||||
|
Properties and equipment, at cost
|
||||||||
|
Timber and roads, net of accumulated depletion
|
||||||||
|
(2014 - $93,359; 2013 - $92,971)
|
227,144 | 211,946 | ||||||
|
Timberland
|
47,933 | 44,946 | ||||||
|
Land held for development
|
26,040 | 27,040 | ||||||
|
Buildings and equipment, net of accumulated
|
||||||||
|
depreciation (2014 - $6,849; 2013 - $6,437)
|
6,039 | 6,205 | ||||||
|
Total properties and equipment, at cost
|
307,156 | 290,137 | ||||||
|
Other assets
|
||||||||
|
Contracts receivable, net of current portion
|
119 | 128 | ||||||
|
Other
|
322 | 264 | ||||||
|
Total other assets
|
441 | 392 | ||||||
|
Total assets
|
$ | 345,077 | $ | 310,908 | ||||
|
LIABILITIES, PARTNERS' CAPITAL AND NONCONTROLLING INTERESTS
|
||||||||
|
Current liabilities
|
||||||||
|
Accounts payable
|
$ | 1,293 | $ | 2,196 | ||||
|
Accrued liabilities
|
3,196 | 4,109 | ||||||
|
Current portion of long-term debt
|
5,109 | 109 | ||||||
|
Deferred revenue
|
668 | 599 | ||||||
|
Current portion of environmental remediation liability
|
3,700 | 700 | ||||||
|
Other current liabilities
|
248 | 266 | ||||||
|
Total current liabilities
|
14,214 | 7,979 | ||||||
|
Long-term debt, net of current portion
|
84,872 | 75,581 | ||||||
|
Environmental remediation and other long-term liabilities
|
18,362 | 12,734 | ||||||
|
Commitments and contingencies
|
||||||||
|
Partners' capital
|
||||||||
|
General partners' capital (units issued and outstanding 2014 - 60; 2013 - 60)
|
1,003 | 974 | ||||||
|
Limited partners' capital (units issued and outstanding 2014 - 4,224; 2013 - 4,312)
|
63,213 | 68,471 | ||||||
|
Noncontrolling interests
|
163,413 | 145,169 | ||||||
|
Total partners' capital and noncontrolling interests
|
227,629 | 214,614 | ||||||
|
Total liabilities, partners' capital, and noncontrolling interests
|
$ | 345,077 | $ | 310,908 | ||||
See accompanying notes to consolidated financial statements.
59
POPE RESOURCES, A DELAWARE LIMITED PARTNERSHIP
CONSOLIDATED STATEMENTS OF COMPREHENSIVE INCOME (LOSS)
YEARS ENDED DECEMBER 31, 2014, 2013, AND 2012
(IN THOUSANDS, EXCEPT PER UNIT INFORMATION)
|
2014
|
2013
|
2012
|
||||||||||
|
Revenue
|
||||||||||||
|
Fee Timber
|
$ | 65,204 | $ | 56,035 | $ | 45,539 | ||||||
|
Timberland Management
|
- | - | 7 | |||||||||
|
Real Estate
|
22,266 | 14,657 | 8,497 | |||||||||
|
Total revenue
|
87,470 | 70,692 | 54,043 | |||||||||
|
Costs and expenses
|
||||||||||||
|
Cost of sales
|
||||||||||||
|
Fee Timber
|
(36,786 | ) | (32,326 | ) | (27,596 | ) | ||||||
|
Real Estate
|
(11,304 | ) | (7,300 | ) | (3,235 | ) | ||||||
|
Total cost of sales
|
(48,090 | ) | (39,626 | ) | (30,831 | ) | ||||||
|
Operating expenses
|
||||||||||||
|
Fee Timber
|
(7,879 | ) | (7,541 | ) | (6,090 | ) | ||||||
|
Timberland Management
|
(2,329 | ) | (1,950 | ) | (1,575 | ) | ||||||
|
Real Estate
|
(3,682 | ) | (4,081 | ) | (3,861 | ) | ||||||
|
Environmental remediation (Real Estate)
|
(10,000 | ) | - | (12,500 | ) | |||||||
|
General & Administrative
|
(3,781 | ) | (4,562 | ) | (4,170 | ) | ||||||
|
Total operating expenses
|
(27,671 | ) | (18,134 | ) | (28,196 | ) | ||||||
|
Gain on sale of tree farms (Fee Timber)
|
23,750 | - | - | |||||||||
|
Operating income (loss)
|
||||||||||||
|
Fee Timber
|
44,289 | 16,168 | 11,853 | |||||||||
|
Timberland Management
|
(2,329 | ) | (1,950 | ) | (1,568 | ) | ||||||
|
Real Estate
|
(2,720 | ) | 3,276 | (11,099 | ) | |||||||
|
General & Administrative
|
(3,781 | ) | (4,562 | ) | (4,170 | ) | ||||||
|
Total operating income (loss)
|
35,459 | 12,932 | (4,984 | ) | ||||||||
|
Other income (expense)
|
||||||||||||
|
Interest expense
|
(3,539 | ) | (2,364 | ) | (2,077 | ) | ||||||
|
Interest capitalized to development projects
|
910 | 815 | 591 | |||||||||
|
Interest income
|
25 | 21 | 26 | |||||||||
|
Total other expense
|
(2,604 | ) | (1,528 | ) | (1,460 | ) | ||||||
|
Income (loss) before income taxes
|
32,855 | 11,404 | (6,444 | ) | ||||||||
|
Income tax benefit (expense)
|
(984 | ) | 307 | (352 | ) | |||||||
|
Net income (loss)
|
31,871 | 11,711 | (6,796 | ) | ||||||||
|
Net (income) loss attributable to noncontrolling interests-ORM Timber Funds
|
(19,456 | ) | 1,424 | 2,087 | ||||||||
|
Net and comprehensive income (loss) attributable to unitholders
|
$ | 12,415 | $ | 13,135 | $ | (4,709 | ) | |||||
|
Allocable to general partners
|
$ | 171 | $ | 180 | $ | (65 | ) | |||||
|
Allocable to limited partners
|
12,244 | 12,955 | (4,644 | ) | ||||||||
|
Net and comprehensive income (loss) attributable to unitholders
|
$ | 12,415 | $ | 13,135 | $ | (4,709 | ) | |||||
|
Basic and diluted earnings (loss) per unit attributable to unitholders
|
$ | 2.82 | $ | 2.96 | $ | (1.11 | ) | |||||
|
Distributions per unit
|
$ | 2.50 | $ | 2.00 | $ | 1.70 | ||||||
See accompanying notes to consolidated financial statements.
60
POPE RESOURCES, A DELAWARE LIMITED PARTNERSHIP
CONSOLIDATED STATEMENTS OF PARTNERS’ CAPITAL
YEARS ENDED DECEMBER 31, 2014, 2013, AND 2012
(IN THOUSANDS)
|
Attributable to Pope Resources
|
Noncontrolling
|
|||||||||||||||
|
General
|
Limited
|
Interests
|
Total
|
|||||||||||||
|
December 31, 2011
|
$ | 1,063 | $ | 74,696 | $ | 101,399 | $ | 177,158 | ||||||||
|
Net loss
|
(65 | ) | (4,644 | ) | (2,087 | ) | (6,796 | ) | ||||||||
|
Cash distributions
|
(105 | ) | (7,394 | ) | (3,958 | ) | (11,457 | ) | ||||||||
|
Proceeds from option exercises
|
0 | 12 | - | 12 | ||||||||||||
|
Preferred stock issuance
|
- | - | 118 | 118 | ||||||||||||
|
Capital call
|
- | - | 42,946 | 42,946 | ||||||||||||
|
Excess tax benefit from equity-based compensation
|
3 | 217 | - | 220 | ||||||||||||
|
Equity-based compensation
|
10 | 730 | - | 740 | ||||||||||||
|
Indirect repurchase of units for minimum tax withholding
|
(4 | ) | (296 | ) | - | (300 | ) | |||||||||
|
December 31, 2012
|
902 | 63,321 | 138,418 | 202,641 | ||||||||||||
|
Net income (loss)
|
180 | 12,955 | (1,424 | ) | 11,711 | |||||||||||
|
Cash distributions
|
(122 | ) | (8,764 | ) | (16,483 | ) | (25,369 | ) | ||||||||
|
Capital call
|
- | - | 24,658 | 24,658 | ||||||||||||
|
Equity-based compensation
|
17 | 1,197 | - | 1,214 | ||||||||||||
|
Indirect repurchase of units for minimum tax withholding
|
(3 | ) | (238 | ) | - | (241 | ) | |||||||||
|
December 31, 2013
|
974 | 68,471 | 145,169 | 214,614 | ||||||||||||
|
Net income
|
171 | 12,244 | 19,456 | 31,871 | ||||||||||||
|
Cash distributions
|
(152 | ) | (10,885 | ) | (56,057 | ) | (67,094 | ) | ||||||||
|
Capital call
|
- | - | 54,720 | 54,720 | ||||||||||||
|
Preferred stock issuance
|
- | - | 125 | 125 | ||||||||||||
|
Equity-based compensation
|
12 | 855 | - | 867 | ||||||||||||
|
Unit repurchase
|
- | (7,363 | ) | - | (7,363 | ) | ||||||||||
|
Excess tax benefit from equity-based compensation
|
1 | 84 | - | 85 | ||||||||||||
|
Indirect repurchase of units for minimum tax withholding
|
(3 | ) | (193 | ) | - | (196 | ) | |||||||||
|
December 31, 2014
|
$ | 1,003 | $ | 63,213 | $ | 163,413 | $ | 227,629 | ||||||||
See accompanying notes to consolidated financial statements.
61
POPE RESOURCES, A DELAWARE LIMITED PARTNERSHIP
CONSOLIDATED STATEMENTS OF CASH FLOWS
YEARS ENDED DECEMBER 31, 2014, 2013, AND 2012
(IN THOUSANDS)
|
2014
|
2013
|
2012
|
||||||||||
|
Cash flows from operating activities:
|
||||||||||||
|
Cash received from customers
|
$ | 86,765 | $ | 69,009 | $ | 56,517 | ||||||
|
Cash paid to suppliers and employees
|
(48,344 | ) | (39,062 | ) | (36,364 | ) | ||||||
|
Interest received
|
25 | 22 | 26 | |||||||||
|
Interest paid, net of amounts capitalized
|
(2,523 | ) | (1,376 | ) | (1,490 | ) | ||||||
|
Capitalized development activities
|
(4,967 | ) | (10,801 | ) | (2,152 | ) | ||||||
|
Income taxes received (paid)
|
(161 | ) | 157 | (328 | ) | |||||||
|
Net cash provided by operating activities
|
30,795 | 17,949 | 16,209 | |||||||||
|
Cash flows from investing activities:
|
||||||||||||
|
Purchase of short-term investments
|
(4,000 | ) | - | - | ||||||||
|
Maturity of short-term investments
|
3,000 | - | - | |||||||||
|
Capital expenditures
|
(2,335 | ) | (2,230 | ) | (2,305 | ) | ||||||
|
Proceeds from sale of fixed assets
|
37 | - | 2,873 | |||||||||
|
Proceeds from sale of timberland
|
68,876 | - | - | |||||||||
|
Acquisition of timberland - Partnership
|
(1,826 | ) | - | - | ||||||||
|
Acquisition of timberland - Funds
|
(72,025 | ) | (43,413 | ) | (45,155 | ) | ||||||
|
Net cash used in investing activities
|
(8,273 | ) | (45,643 | ) | (44,587 | ) | ||||||
|
Cash flows from financing activities:
|
||||||||||||
|
Repayment of line of credit, net
|
- | - | (4,957 | ) | ||||||||
|
Repayment of long-term debt
|
(109 | ) | (125 | ) | (32 | ) | ||||||
|
Proceeds from issuance of long-term debt
|
14,400 | 31,980 | 3,000 | |||||||||
|
Debt issuance costs
|
(22 | ) | (28 | ) | (46 | ) | ||||||
|
Unit repurchases
|
(7,363 | ) | - | - | ||||||||
|
Proceeds from option exercises
|
- | - | 12 | |||||||||
|
Payroll taxes paid on unit net settlements
|
(196 | ) | (241 | ) | (300 | ) | ||||||
|
Excess tax benefit from equity-based compensation
|
85 | - | 220 | |||||||||
|
Cash distributions to unitholders
|
(11,037 | ) | (8,886 | ) | (7,515 | ) | ||||||
|
Cash distributions- ORM Timber Funds, net of distributions to Partnership
|
(56,057 | ) | (16,483 | ) | (3,942 | ) | ||||||
|
Capital call - ORM Timber Funds, net of Partnership contribution
|
54,720 | 24,658 | 42,946 | |||||||||
|
Preferred stock issuance (distribution) - ORM Timber Funds
|
125 | - | 118 | |||||||||
|
Net cash provided by (used in) financing activities
|
(5,454 | ) | 30,875 | 29,504 | ||||||||
|
Net increase in cash and cash equivalents
|
17,068 | 3,181 | 1,126 | |||||||||
|
Cash and cash equivalents:
|
||||||||||||
|
Beginning of year
|
6,960 | 3,779 | 2,653 | |||||||||
|
End of year
|
$ | 24,028 | $ | 6,960 | $ | 3,779 | ||||||
See accompanying notes to consolidated financial statements.
62
POPE RESOURCES, A DELAWARE LIMITED PARTNERSHIP
SCHEDULE TO CONSOLIDATED STATEMENTS OF CASH FLOWS
YEARS ENDED DECEMBER 31, 2014, 2013, AND 2012
(IN THOUSANDS)
|
Reconciliation of net income (loss) to net cash
|
2014 | 2013 | 2012 | |||||||||
|
provided by operating activities:
|
||||||||||||
|
Net income (loss)
|
$ | 31,871 | $ | 11,711 | $ | (6,796 | ) | |||||
|
Depletion
|
12,192 | 11,204 | 10,019 | |||||||||
|
Capitalized development activities
|
(4,967 | ) | (10,801 | ) | (2,152 | ) | ||||||
|
Equity-based compensation
|
867 | 1,214 | 740 | |||||||||
|
Excess tax benefit from equity-based compensation
|
(85 | ) | - | (220 | ) | |||||||
|
Depreciation and amortization
|
727 | 704 | 1,232 | |||||||||
|
Gain on sale of tree farms
|
(23,750 | ) | - | - | ||||||||
|
Gain (loss) on sale of property and equipment
|
(23 | ) | 47 | (2,753 | ) | |||||||
|
Deferred taxes, net
|
643 | (260 | ) | 97 | ||||||||
|
Cost of land sold
|
9,160 | 5,004 | 1,492 | |||||||||
|
Increase (decrease) in cash from changes in
|
||||||||||||
|
operating accounts:
|
||||||||||||
|
Accounts receivable
|
(918 | ) | (293 | ) | 668 | |||||||
|
Contracts receivable
|
97 | 76 | 188 | |||||||||
|
Prepaid expenses and other current assets
|
(1,693 | ) | (276 | ) | (84 | ) | ||||||
|
Accounts payable and accrued liabilities
|
(1,710 | ) | 1,763 | 410 | ||||||||
|
Deferred revenue
|
116 | (1,466 | ) | 1,618 | ||||||||
|
Other current liabilities
|
(17 | ) | 23 | 15 | ||||||||
|
Environmental remediation
|
8,410 | (701 | ) | 11,739 | ||||||||
|
Other noncurrent assets and liabilities
|
(125 | ) | - | (4 | ) | |||||||
|
Net cash provided by operating activities
|
$ | 30,795 | $ | 17,949 | $ | 16,209 |
See accompanying notes to consolidated financial statements.
63
NOTES TO CONSOLIDATED FINANCIAL STATEMENTS
|
1.
|
SUMMARY OF SIGNIFICANT ACCOUNTING POLICIES
|
Nature of operations
Pope Resources, A Delaware Limited Partnership (the “Partnership”) is a publicly traded limited partnership engaged primarily in managing timber resources on its own properties as well as those owned by others. Pope Resources’ active subsidiaries include the following: ORM, Inc., which is responsible for managing Pope Resources’ timber properties; Olympic Resource Management LLC (ORMLLC), which provides timberland management activities and is responsible for developing the timber fund business; Olympic Property Group I LLC, which manages the Port Gamble townsite and millsite together with land that is held as development property; and OPG Properties LLC, which owns land that is held as development property. These consolidated financial statements also include ORM Timber Fund I, LP (Fund I), ORM Timber Fund II, Inc. (Fund II), and ORM Timber Fund III, Inc. (Fund III, and collectively with Fund I and Fund II, the Funds). ORMLLC owns 1% of the Funds and is the general partner of Fund I and the manager of Funds II and III. Pope Resources owns 19% of Funds I and II and 4% of Fund III. The purpose of all three Funds is to invest in timberlands. See Note 2 for additional information.
The Partnership operates in three business segments: Fee Timber, Timberland Management, and Real Estate. Fee Timber represents the growing and harvesting of trees from properties owned by the Partnership and the Funds. Timberland Management represents management, acquisition, disposition, and consulting services provided to third-party owners of timberland and provides management services to the Funds. Real Estate consists of obtaining and entitling properties that have been identified as having value as developed residential or commercial property and operating the Partnership’s existing commercial property in Kitsap County, Washington.
Principles of consolidation
The consolidated financial statements include the accounts of the Partnership, its subsidiaries, and the Funds. Intercompany balances and transactions, including operations related to the Funds, have been eliminated in consolidation.
The Funds are consolidated into Pope Resources’ financial statements due to our control over the Funds (see Note 2).
New accounting standards
In April 2014, the FASB issued ASU 2014-08 Reporting Discontinued Operations and Disclosures of Disposals of Components of an Entity. The ASU is effective for annual and interim periods beginning in 2015, though early adoption is permitted. The Partnership adopted this standard in the second quarter of 2014. Under this new standard, Fund I’s sales of its tree farms, described in note 2, are not considered discontinued operations because the acquisition and sale of tree farms by the timber funds does not constitute a change in strategy. The Partnership continues to invest in and manage private equity timber funds.
On May 28, 2014, the FASB issued ASU No. 2014-09, Revenue from Contracts with Customers, which requires an entity to recognize the amount of revenue to which it expects to be entitled for the transfer of promised goods or services to customers. The ASU will replace most existing revenue recognition guidance in U.S. GAAP when it becomes effective on January 1, 2017. Early application is not permitted. The standard permits the use of either the retrospective or cumulative effect transition method. The Partnership is evaluating the effect that ASU 2014-09 will have on its consolidated financial statements and related disclosures. The Partnership has not yet selected a transition method nor has it determined the effect of the standard on its ongoing financial reporting.
64
General partner
The Partnership has two general partners: Pope MGP, Inc. and Pope EGP, Inc. In total, these two entities own 60,000 partnership units. The allocation of distributions, income and other capital related items between the general and limited partners is pro rata among all units outstanding. The managing general partner of the Partnership is Pope MGP, Inc.
Noncontrolling interests
Noncontrolling interests represents the portion of net income and losses of the Funds attributable to third-party owners of the Funds. In the case of Funds I and II, noncontrolling interests represent 80%, while noncontrolling interests represent 95% of Fund III ownership. To arrive at net income (loss) attributable to Partnership unitholders, the portion of the income attributable to these third-party investors is subtracted from Partnership income (loss) or, in the case of a loss attributable to third-party investors, added back to Partnership income (loss).
Significant estimates and concentrations in financial statements
The preparation of financial statements in conformity with accounting principles generally accepted in the United States of America requires management to make estimates and assumptions that affect the reported amounts of assets and liabilities and disclosure of contingent assets and liabilities at the date of the financial statements and the reported amounts of revenue and expense during the reporting period. Actual results could differ from those estimates.
Depletion
Timber costs are combined into depletion pools based on the common characteristics of the timber such as location and species mix. Each tree farm within the Funds is considered a separate depletion pool and timber harvested by the Funds is accounted for and depleted separately from the Partnership’s timberlands. The applicable depletion rate is derived by dividing the aggregate cost of merchantable stands of timber, together with capitalized road expenditures, by the estimated volume of merchantable timber available for harvest at the beginning of that year. For purposes of the depletion calculation, merchantable timber is defined as timber that is equal to or greater than 35 years of age for all of the tree farms except California, for which merchantable timber is defined as timber with a diameter at breast height (DBH) of 16 inches or greater. The depletion rate, so derived and expressed in per MBF terms, is then multiplied by the volume harvested in a given period to calculate depletion expense for that period as follows:
Depletion rate = Accumulated cost of timber and capitalized road expenditures
Estimated volume of merchantable timber
Purchased timberland cost allocation. When the Partnership or Funds acquire timberlands, a purchase price allocation is performed that allocates cost between the categories of merchantable timber, pre-merchantable timber, and land based upon the relative fair values pertaining to each of the categories. Land value may include uses other than timberland including potential conservation easement (CE) sales and development opportunities.
Cost of sales
Cost of sales consists of the Partnership’s cost basis in timber (depletion expense), real estate, and other inventory sold, and direct costs incurred to make those assets saleable. Those direct costs include the expenditures associated with the harvesting and transporting of timber and closing costs incurred in land and lot sale transactions. Cost of sales also consists of those costs directly attributable to the Partnership’s rental activities.
Cash and cash equivalents
Cash and cash equivalents include highly liquid investments with original maturities of three months or less at date of purchase.
65
Short-term investments
Short-term investments consist of certificates of deposit maturing 180 days from the date of purchase.
Concentration of credit risk
Financial instruments that potentially subject the Partnership to concentrations of credit risk consist principally of short-term investments and accounts and contracts receivable. The Partnership limits its credit exposure by considering the creditworthiness of potential customers and utilizing the underlying land sold as collateral on real estate contracts. The Partnership’s allowance for doubtful accounts on accounts receivable is $17,000 and $19,000 at December 31, 2014 and 2013, respectively.
Income taxes
The Partnership itself is not subject to income taxes, but its corporate subsidiaries are subject to income taxes which are accounted for under the asset and liability method. Deferred tax assets and liabilities are recognized for the future tax consequences attributable to differences between the financial statement carrying amounts of existing assets and liabilities and their respective tax basis. Operating loss and tax credit carryforwards, if any, are also factored into the calculation of deferred tax assets and liabilities. Deferred tax assets and liabilities are measured using enacted tax rates that are expected to apply to taxable income in the years in which those temporary differences are expected to be recovered or settled. The effect on deferred tax assets and liabilities of a change in tax rates is recognized in income in the period that includes the enactment date. The Partnership has concluded that it is more likely than not that its deferred tax assets will be realizable and thus no valuation allowance has been recorded as of December 31, 2014. This conclusion is based on anticipated future taxable income, the expected future reversals of existing taxable temporary differences, and tax planning strategies to generate taxable income, if needed. The Partnership will continue to reassess the need for a valuation allowance during each future reporting period. The Partnership is not aware of any tax exposure items as of December 31, 2014 and 2013 where the Partnership’s tax position is not more likely than not to be sustained if challenged by the taxing authorities.
Land held for sale and Land held for development
Land held for sale and land held for development are recorded at the lower of cost or net realizable value. Costs of development, including interest, are capitalized for these projects and allocated to individual lots based upon their relative preconstruction fair value. This allocation of basis supports, in turn, the computation of those amounts reported as a current vs. long-term asset based on management’s expectation of when the sales will occur (Land Held for Sale and Land Held for Development, respectively). As lot sales occur, the allocation of these costs becomes part of cost of sales attributed to individual lot sales. Costs associated with land including acquisition, project design, architectural costs, road construction, capitalized interest and utility installation are accounted for as operating activities on our statement of cash flows.
Those properties that are for sale, under contract, and for which the Partnership has an expectation they will be sold within 12 months are classified on our balance sheet as a current asset under “Land Held for Sale”. The $7.2 million currently in Land Held for Sale reflects our expectation of sales in 2015 of parcels comprising 41 acres from the Harbor Hill project in Gig Harbor. Land Held for Sale as of December 31, 2013 represented an expected 2014 sales of 61acres from the Harbor Hill project in Gig Harbor as well as 535 acres of timberland near Port Gamble for conservation purposes.
Land held for development on our balance sheet represents the Partnership’s cost basis in land that has been identified as having greater value as development property rather than as timberland. Land development costs, including interest, clearly associated with development or construction of fully entitled projects are capitalized, whereas costs associated with projects that are in the entitlement phase are expensed. Interest capitalization ceases once projects reach the point of substantial completion or construction activity has been delayed intentionally.
66
Timberland, timber and roads
Timberland, timber and roads are recorded at cost. The Partnership capitalizes the cost of building permanent roads on the tree farms and expenses temporary roads and road maintenance. Timberland is not subject to depletion.
Buildings and equipment
Buildings and equipment depreciation is provided using the straight-line method over the estimated useful lives of the assets, which range from 3 to 39 years.
Buildings and equipment are recorded at cost and consisted of the following as of December 31, 2014 and 2013 (in thousands):
|
Description
|
12/31/2014
|
12/31/2013
|
||||||
|
Buildings
|
$ | 9,078 | $ | 8,890 | ||||
|
Equipment
|
3,169 | 3,118 | ||||||
|
Furniture and fixtures
|
641 | 634 | ||||||
|
Total
|
$ | 12,888 | $ | 12,642 | ||||
|
Accumulated depreciation
|
(6,849 | ) | (6,437 | ) | ||||
|
Net buildings and equipment
|
$ | 6,039 | $ | 6,205 | ||||
Impairment of long-lived assets
When facts and circumstances indicate the carrying value of properties may be impaired, an evaluation of recoverability is performed by comparing the currently recorded carrying value of the property to the projected future undiscounted cash flows of the same property or, in the case of land held for sale, fair market value less costs to sell. If it is determined that the carrying value of such assets may not be fully recoverable, we would recognize an impairment loss, adjusting for the difference between the carrying value and the estimated fair market value, and would recognize an expense in this amount against current operations.
Deferred revenue
Deferred revenue represents the unearned portion of cash collected. Deferred revenue of $668,000 at December 31, 2014 reflects mostly advance deposits received on real estate sales contracts and the unearned portion of rental payments received on cell tower leases. The deferred revenue balance of $599,000 at December 31, 2013 represents primarily the unearned portion of rental payments received on cell tower leases.
Revenue recognition
Revenue on fee timber sales is recorded when title and risk of loss passes to the buyer, which typically occurs when delivered to the customer. Revenue on real estate sales is recorded on the date the sale closes, upon receipt of adequate down payment, and receipt of the buyer’s obligation to make sufficient continuing payments towards the purchase of the property and the Partnership has no continuing involvement with the real estate sold. When a real estate transaction is closed with obligations to complete infrastructure or other construction, revenue is recognized on a percentage of completion method by calculating a ratio of costs incurred to total costs expected. Revenue is deferred proportionately based on the remaining costs to satisfy the obligation. Timberland management fees and consulting service revenues are recognized as the related services are provided.
67
Land and development rights or conservation easement (CE) sales
The Partnership considers the sale of land and development rights, or conservation easements (CE’s), to be part of its normal operations and therefore recognizes revenue from such sales and cost of sales for the Partnership’s basis in the property sold. CE sales allow us to retain harvesting and other timberland management rights, but bar any future subdivision of or real estate development on the property. Cash generated from these sales is included in cash flows from operations on the Partnership’s statements of cash flows.
In 2014 and 2012 the Partnership generated $743,000, and $1.2 million, respectively, from conservation easement sales. There were no such sales in 2013.
Environmental remediation liabilities
Environmental remediation liabilities are evaluated using a combination of methods, but most significantly using a “Monte Carlo” statistical simulation model for the Port Gamble project. This model takes into account the estimated likelihood of a range of potential outcomes, coupled with the estimated cost associated with those outcomes. The model then produces a range of possible outcomes corresponding to a two standard deviation range from the mean. Management records a liability based on its best estimate of the most likely outcome within the range.
Equity-based compensation
The Partnership issues restricted units to certain employees, officers, and directors of the Partnership as part of their annual compensation. Restricted units are valued on the grant date at the market closing price of the partnership units on that date. The value of the restricted units is amortized to compensation expense on a straight-line basis during the vesting period which is generally four years. Grants to retirement-eligible individuals on the date of grant are expensed immediately.
Income (loss) per partnership unit
Basic and diluted net earnings (loss) per unit are calculated by dividing net income (loss) attributable to unitholders, adjusted for non-forfeitable distributions paid out to unvested restricted unitholders and Fund II and Fund III preferred shareholders, by the weighted average units outstanding during the period.
The table below displays how we arrived at basic and diluted earnings (loss) per unit:
|
Year Ended December 31,
|
||||||||||||
|
(in thousands)
|
2014
|
2013
|
2012
|
|||||||||
|
Net income (loss) attributable to Pope Resources’ unitholders
|
$ | 12,415 | $ | 13,135 | $ | (4,709 | ) | |||||
|
Net income attributable to unvested restricted unitholders
|
(112 | ) | (195 | ) | (88 | ) | ||||||
|
Dividends paid to Funds preferred shareholders
|
(31 | ) | (16 | ) | (16 | ) | ||||||
|
Net income (loss) attributable to unitholders
|
$ | 12,272 | $ | 12,924 | $ | (4,813 | ) | |||||
|
Basic and diluted weighted average units outstanding
|
4,353 | 4,369 | 4,351 | |||||||||
|
Basic and diluted net earnings (loss) per unit
|
$ | 2.82 | $ | 2.96 | $ | (1.11 | ) | |||||
68
Fund II and Fund III Preferred Shares
Fund II and Fund III issued 125 par $0.01 shares of its 12.5% Series A Cumulative Non-Voting Preferred Stock (Series A Preferred Stock) at $1,000 per share for total proceeds of $125,000 in March 2010 and January 2014 respectively. Each holder of the Series A Preferred Stock is entitled to a liquidation preference of $1,000 per share. Dividends on each share of Series A Preferred Stock will accrue on a daily basis at the rate of 12.5% per annum. Upon redemption, the Series A Preferred Shares will be settled in cash and are not convertible into any other class or series of shares or Partnership units. Redemption timing is controlled by the Funds. The maximum amount that each of the consolidated subsidiaries could be required to pay to redeem the instruments upon settlement is $125,000 plus accrued but unpaid dividends. The Series A Preferred Stock is recorded within noncontrolling interests on the consolidated balance sheets and are considered participating securities for purposes of calculating earnings (loss) per unit.
Fair Value Hierarchy
We use a fair value hierarchy in accounting for certain nonfinancial assets and liabilities including long-lived assets (asset groups) measured at fair value for an impairment assessment.
The fair value hierarchy is based on inputs to valuation techniques that are used to measure fair value that are either observable or unobservable. Observable inputs reflect assumptions market participants would use in pricing an asset or liability based on market data obtained from independent sources while unobservable inputs reflect a reporting entity’s pricing based upon its own market assumptions.
The fair value hierarchy consists of the following three levels:
|
|
●
|
Level 1-Inputs are quoted prices in active markets for identical assets or liabilities.
|
|
|
●
|
Level 2-Inputs are: (a) quoted prices for similar assets or liabilities in an active market, (b) quoted prices for identical or similar assets or liabilities in markets that are not active, or (c) inputs other than quoted prices that are observable and market-corroborated inputs, which are derived principally from or corroborated by observable market data.
|
|
|
●
|
Level 3-Inputs are derived from valuation techniques in which one or more significant inputs or value drivers are unobservable.
|
|
2.
|
ORM TIMBER FUND I, LP (FUND I), ORM TIMBER FUND II, INC. (FUND II), AND ORM TIMBER FUND III (REIT) INC. (FUND III) (COLLECTIVELY, “THE FUNDS”)
|
The Funds were formed by ORMLLC for the purpose of attracting capital to purchase timberlands. The objective of these Funds is to generate a return on investments through the acquisition, management, value enhancement and sale of timberland properties. Each Fund is organized to operate for a term of ten years from the end of the drawdown period, with Fund I scheduled to terminate in August 2017, Fund II terminating in March 2021, and Fund III terminating on the tenth anniversary of the completion of its drawdown period. Fund III’s drawdown period will end at the earlier of placement of all committed capital or July 31, 2015.
Pope Resources and ORMLLC together own 20% of Fund I and Fund II and own 5% of Fund III. All Funds are consolidated into the Partnership’s financial statements. The Funds’ statements of operations for the year ended December 31, 2014 reflects an operating income of $26.6 million, an operating loss of $664,000 for the year ended December 31, 2013 and an operating loss of $2.0 million for the year ended December 31, 2012. These operations include management fees paid to ORMLLC of approximately $3.3 million, $2.8 million and $2.2 million for 2014, 2013 and 2012 respectively, which are eliminated in consolidation.
During the fourth quarter of 2012, Fund III acquired 19,000 acres of northern California timberland for a purchase price of $45.1 million. The purchase price was allocated $7.5 million to land and $37.6 million to timber and roads. During the fourth quarter of 2013, Fund III acquired 11,000 acres of timberland in southwest Washington for $43.4 million. $18.0 million of the purchase price was financed by a loan from Northwest Farm Credit Services (NWFCS) with the remainder coming from contributed capital. The purchase price was allocated $4.3 million to land and $39.1 million to timber and roads. During the fourth quarter of 2014, Fund III acquired 13,000 acres of timberland in northwestern Oregon for $72.0 million. The purchase price was allocated $7.8 million to land and $64.2 million to timber and roads.
69
In September 2014, Fund I sold one of its two tree farms located in western Washington for $39.0 million and recognized a gain on the sale of $9.2 million. This tree farm’s carrying value consisted of $26.6 million for timber and roads and $2.4 million for the land.
In October 2014, Fund I sold its remaining tree farm, located in western Washington, for $31.5 million and recognized a gain on the sale of $14.6 million. The carrying value of this tree farm consisted of $13.6 million for timber and roads and $2.6 million for the land.
The Partnership’s share of the pretax profit or loss generated by Fund I was a profit of $4.7 million for 2014 and losses of $124,000 and $191,000 for 2013 and 2012, respectively. The aforementioned 2014 pretax profit amounts include the Partnership’s share of the gain on sale of the tree farms.
The Partnership’s consolidated financial statements include Fund I, Fund II, and Fund III assets and liabilities at December 31, 2014 and 2013, which were as follows:
|
(in thousands)
|
2014
|
2013
|
||||||
|
Cash
|
$ | 9,523 | $ | 1,256 | ||||
|
Other current assets
|
1,108 | 362 | ||||||
|
Total current assets
|
10,631 | 1,618 | ||||||
|
Properties and equipment (net of accumulated depletion
|
||||||||
|
and depreciation in 2014 and 2013 of $26,738 and $28,713)
|
230,123 | 211,871 | ||||||
|
Other long-term assets
|
156 | 125 | ||||||
|
Total assets
|
$ | 240,910 | $ | 213,614 | ||||
|
Current liabilities
|
$ | 1,891 | $ | 1,747 | ||||
|
Current portion of long-term debt
|
- | 3 | ||||||
|
Total current liabilities
|
1,891 | 1,750 | ||||||
|
Long-term debt
|
57,380 | 42,980 | ||||||
|
Funds' equity
|
181,639 | 168,884 | ||||||
|
Total liabilities and equity
|
$ | 240,910 | $ | 213,614 | ||||
The table above includes management fees payable to the Partnership of $613,000 and $557,000 as of December 31, 2014 and 2013, respectively. These amounts are eliminated in the Partnership’s Consolidated Balance Sheets.
70
|
3.
|
LONG-TERM DEBT
|
|
At December 31,
|
||||||||
|
(in thousands)
|
2014
|
2013
|
||||||
|
Pope Resources debt:
|
||||||||
|
Mortgage payable to NWFCS, collateralized by Poulsbo headquarters:
|
||||||||
|
Ten-year tranche, interest at 3.80% with monthly principal and interest
|
||||||||
|
payments (matures January 2023)
|
$ | 2,802 | $ | 2,908 | ||||
|
Mortgages payable to NWFCS, collateralized by timberlands, as follows:
|
||||||||
|
Five-year tranche, interest at 4.10% with monthly interest-only payments
|
||||||||
|
(matures July 2015)
|
4,999 | 4,999 | ||||||
|
Seven-year tranche, interest at 4.85% with monthly interest-only payments.
|
||||||||
|
(matures July 2017)
|
5,000 | 5,000 | ||||||
|
Ten-year tranche, interest at 6.40%, collateralized by timberlands
|
||||||||
|
with monthly interest-only payments (matures September 2019)
|
9,800 | 9,800 | ||||||
|
Fifteen-year tranche, interest at 6.05% with monthly interest-only payments.
|
||||||||
|
(matures July 2025)
|
10,000 | 10,000 | ||||||
|
Total Partnership debt
|
32,601 | 32,707 | ||||||
|
ORM Timber Funds debt:
|
||||||||
|
Fund I note payable to the City of Tacoma, repaid January 2014
|
- | 3 | ||||||
|
Mortgages payable to MetLife, collateralized by Fund II timberlands with quarterly
interest payments (matures September 2020), as follows:
|
||||||||
|
4.85% interest rate tranche
|
11,000 | 11,000 | ||||||
|
3.84% interest rate tranche
|
14,000 | 14,000 | ||||||
|
Fund III mortgage payable to NWFCS, collateralized by Fund III timberlands with quarterly interest payments, as follows:
|
||||||||
|
5.10% interest rate tranche (matures December 2023)
|
17,980 | 17,980 | ||||||
|
4.45% interest rate tranche (matures October 2024)
|
14,400 | - | ||||||
|
Total ORM Timber Funds debt
|
57,380 | 42,983 | ||||||
|
Consolidated subtotal
|
89,981 | 75,690 | ||||||
|
Less current portion
|
(5,109 | ) | (109 | ) | ||||
|
Consolidated long-term debt, less current portion
|
$ | 84,872 | $ | 75,581 | ||||
The Partnership’s debt agreements have covenants which are measured quarterly. Among the covenants measured is a requirement that the Partnership not exceed a maximum debt-to-total-capitalization ratio of 30%, with total capitalization calculated using fair market (vs. carrying) value of timberland, roads and timber. The Partnership is in compliance with this covenant as of December 31, 2014.
Fund II’s debt agreement contains a requirement to maintain a loan-to-value ratio of less than 40%, with the denominator defined as fair market value. Fund II is in compliance with this covenant as of December 31, 2014.
Fund III’s debt agreement contains a requirement to maintain a minimum debt coverage ratio and a loan-to-value ratio of less than 50%, with the denominator defined as fair market value. Fund III is in compliance with this covenant as of December 31, 2014.
71
At December 31, 2014, principal payments on long-term debt for the next five years and thereafter are due as follows (in thousands):
|
2015
|
5,109 | |||
|
2016
|
114 | |||
|
2017
|
5,118 | |||
|
2018
|
123 | |||
|
2019
|
9,928 | |||
|
Thereafter
|
69,589 | |||
|
Total
|
$ | 89,981 |
The Partnership’s revolving line of credit with NWFCS matures August 2015 and has a maximum borrowing limit of $20 million. This line of credit had nothing drawn as of December 31, 2014 or 2013. The interest rate under this credit facility uses LIBOR as a benchmark. The spread above the benchmark rate is variable depending on the Partnership’s trailing twelve-month interest coverage ratio but ranges from 175 to 275 basis points. As of December 31, 2014 the rate (benchmark plus the spread) was 1.92%. The debt arrangements between NWFCS and the Partnership and Fund III include an annual reimbursement of interest expense (patronage). Interest expense was reduced by $395,000, 249,000 and 214,000 in 2014, 2013 and 2012, respectively, which reflects estimated patronage to be refunded in in the following year with the related receivable reflected in Accounts Receivable.
Accrued interest relating to all debt instruments was $960,000 and $671,000 at December 31, 2014 and 2013, respectively, and is included in accrued liabilities.
|
4.
|
FAIR VALUE OF FINANCIAL INSTRUMENTS
|
The Partnership’s consolidated financial instruments include cash and cash equivalents and accounts receivable, for which the carrying amount of each represents fair value based on current market interest rates or their short-term nature. Carrying amounts of contracts receivable, although long-term, also approximate fair value given the current market interest rates. The fair value of the Partnership’s and Funds’ fixed-rate debt having a carrying value of $90.0 million and $75.7 million as of December 31, 2014 and 2013, respectively, has been estimated based on current interest rates for similar financial instruments, Level 2 inputs in the Fair Value Hierarchy, to be approximately $96.0 million and $77.5 million, respectively.
|
5.
|
INCOME TAXES
|
The Partnership itself is not subject to income taxes. Instead, partners are taxed on their share of the Partnership’s taxable income, whether or not cash distributions are paid. The Partnership’s corporate subsidiaries, however, are subject to income taxes. The following tables provide information on the impact of income taxes in taxable subsidiaries. Consolidated Partnership income (loss) is reconciled to income (loss) before income taxes in corporate subsidiaries for the years ended December 31 as follows:
|
(in thousands)
|
2014
|
2013
|
2012
|
|||||||||
|
Income (loss) before income taxes
|
$ | 32,855 | $ | 11,404 | $ | (6,444 | ) | |||||
|
Income (loss) in entities that pass-through pre-tax earnings to the partners
|
30,169 | 11,632 | (6,578 | ) | ||||||||
|
Income (loss) subject to income taxes
|
$ | 2,686 | $ | (228 | ) | $ | 134 | |||||
72
The provision for income taxes relating to corporate subsidiaries of the Partnership consist of the following income tax benefit (expense) for each of the years ended December 31:
|
(in thousands)
|
2014
|
2013
|
2012
|
|||||||||
|
Current
|
$ | (341 | ) | $ | 47 | $ | (255 | ) | ||||
|
Deferred
|
(643 | ) | 260 | (97 | ) | |||||||
|
Total
|
$ | (984 | ) | $ | 307 | $ | (352 | ) | ||||
Included in the deferred income tax expense for 2014 is $274,000 related to the utilization of net operating loss carryforwards. Included in the deferred tax benefit (expense) for 2013 and 2012 was a benefit of $444,000 and $167,000, respectively, related to net operating loss carryforwards. The Company also recorded excess tax benefits from equity-based compensation of $85,000 and $220,000 for the years ended December 31, 2014 and 2012, respectively. There were no such excess tax benefits for 2013.
A reconciliation between the federal statutory tax rate and the Partnership’s effective tax rate is as follows for each of the years ended December 31:
|
2014
|
2013
|
2012
|
||||||||||
|
Statutory tax on income
|
34 | % | 34 | % | 34 | % | ||||||
|
Income (loss) in entities that pass-through pre-tax earnings to the partners
|
31 | % | (36 | %) | (39 | %) | ||||||
|
Effective income tax rate
|
3 | % | (2 | %) | (5 | %) | ||||||
The net deferred income tax assets include the following components as of December 31:
|
(in thousands)
|
2014
|
2013
|
2012
|
|||||||||
|
Current (included in prepaid expenses and other)
|
$ | 602 | $ | 992 | $ | 590 | ||||||
|
Non-current (included in other assets (other long-term liabilities))
|
(244 | ) | 9 | (41 | ) | |||||||
|
Total
|
$ | 358 | $ | 1,001 | $ | 549 | ||||||
The deferred tax assets are comprised of the following:
|
(in thousands)
|
2014
|
2013
|
2012
|
|||||||||
|
Compensation-related accruals
|
$ | 17 | $ | 370 | $ | 353 | ||||||
|
Net operating loss carryforward
|
337 | 611 | 167 | |||||||||
|
Depreciation
|
(23 | ) | (8 | ) | 4 | |||||||
|
Other
|
27 | 28 | 25 | |||||||||
|
Total
|
$ | 358 | $ | 1,001 | $ | 549 | ||||||
The federal net operating loss carryforwards generated in 2012 and 2013 in the table above expire in 2032 and 2033, respectively.
|
6.
|
UNIT INCENTIVE PLAN
|
One of the two components of a management incentive compensation program adopted in 2010 (2010 Incentive Compensation Program) is the Performance Restricted Unit (PRU) plan which includes both an equity and cash component. Compensation expense relating to the PRUs will vest over a 4-year future service period. The first equity grants pursuant to this program were made in January 2011. On the date of grant, these restricted units are owned by the employee, officer, or director of the Partnership, subject to a trading restriction that is in effect during the vesting period. As of December 31, 2014, total compensation expense not yet recognized related to non-vested awards was $758,000 with a weighted average 17 months remaining to vest.
73
The second component of the incentive compensation program is the Long-Term Incentive Plan (LTIP) which is paid in cash. The LTIP awards contain a feature whereby the award amount is based upon the Partnership’s total shareholder return (TSR) as compared to TSR’s of a benchmark peer group of companies, measured over a rolling three-year performance period. The component based on relative TSR requires the company’s projected cash payout for yet-to-be-completed performance cycles to be re-measured quarterly based upon the Partnership’s relative TSR ranking, using a Monte Carlo simulation model.
Total equity compensation expense was $867,000, $1.2 million and $740,000 for 2014, 2013 and 2012, respectively. As of December 31, 2014, we recorded in accrued liabilities $1.0 million relating to the 2010 Incentive Compensation Program, with $287,000 of that total attributable to the cash component of the PRU and the balance of $751,000 attributable to the LTIP. This compares with December 31, 2013 when we recorded in accrued liabilities $2.0 million, with $197,000 related to the cash-payout component of the PRU and the balance of $1.8 million attributable to the LTIP.
The Partnership’s 2005 Unit Incentive Plan (the 2005 Plan) authorized the granting of nonqualified equity compensation to employees, officers, and directors of the Partnership and provides a one-way linkage to the 2010 Incentive Compensation Program because it (2005 Plan) established the formal framework by which unit grants, options, etc., can be issued. The 2010 Incentive Compensation Program does not affect the existence or availability of the 2005 Unit Incentive Plan or change its terms. Upon the vesting of restricted units, grantees have the choice of tendering back units to pay for their minimum tax withholdings. A total of 1,105,815 units have been authorized for issuance under the 2005 Plan of which there are 921,289 units authorized but unissued as of December 31, 2014.
The Human Resources Committee makes awards of restricted units to certain employees, plus the officers and directors of the Partnership and its subsidiaries. The restricted unit grants vest over four years and are compensatory in nature. Restricted unit awards entitle the recipient to full distribution rights during the vesting period, and thus are considered participating securities, but are restricted from disposition and may be forfeited until the units vest.
74
Restricted unit activity for the three years ended December 31, 2014 was as follows:
|
Weighted Avg
|
||||||||
|
Grant Date
|
||||||||
|
Units
|
Fair Value ($)
|
|||||||
|
Outstanding December 31, 2011
|
58,500 | 31.54 | ||||||
|
Grants
|
26,350 | 42.85 | ||||||
|
Vested, net of units tendered back
|
(26,676 | ) | 30.15 | |||||
|
Tendered back to pay tax withholding
|
(5,826 | ) | 28.60 | |||||
|
Outstanding December 31, 2012
|
52,348 | 38.09 | ||||||
|
Grants
|
36,200 | 60.00 | ||||||
|
Vested, net of units tendered back
|
(12,409 | ) | 31.95 | |||||
|
Forfeited
|
(1,350 | ) | 49.07 | |||||
|
Tendered back to pay tax withholding
|
(4,031 | ) | 34.98 | |||||
|
Outstanding December 31, 2013
|
70,758 | 50.34 | ||||||
|
Grants
|
12,966 | 65.50 | ||||||
|
Vested, net of units tendered back
|
(21,070 | ) | 46.04 | |||||
|
Forfeited
|
(18,261 | ) | 55.49 | |||||
|
Tendered back to pay tax withholding
|
(2,966 | ) | 47.30 | |||||
|
Outstanding December 31, 2014
|
41,427 | 55.23 | ||||||
|
7.
|
EMPLOYEE BENEFITS
|
As of December 31, 2014 all employees of the Partnership and its subsidiaries are eligible to receive benefits under a defined contribution plan. During the years 2012 through 2014 the Partnership matched 50% of employees’ contributions up to 8% of an individual’s compensation. The Partnership’s contributions to the plan amounted to $176,000, $147,000, and $141,000 for the years ended December 31, 2014, 2013, and 2012 respectively.
|
8.
|
COMMITMENTS AND CONTINGENCIES
|
Environmental remediation
The Partnership has an accrual for estimated environmental remediation costs of $21.7 million and $13.2 million as of December 31, 2014 and 2013, respectively. The environmental remediation liability represents management’s best estimate of payments to be made to monitor and remedy certain areas in and around the townsite/millsite of Port Gamble ($21.6 million), and at Port Ludlow, Washington ($86,000).
In 2012 the Partnership accrued an additional $12.5 million for the Port Gamble environmental liability. This accrual was the result of significant modifications to the draft Port Gamble Baywide and Millsite Remedial Investigation and Feasibility Study issued by the Washington State Department of Ecology (DOE) in May 2012. From mid-August 2012 through the balance of 2013, management was in regular dialogue with DOE on a Clean-up Action Plan (CAP), coincident with a consent decree (CD) that outlines clean-up actions and potential property sales of land around Gamble Bay by the Partnership. The CD and CAP were finalized and filed with Kitsap County Superior Court in December 2013. Pursuant to the CD and CAP, an engineering design report (EDR) was submitted to DOE in November 2014, followed by related supplemental material in December. DOE has provided initial feedback on the EDR and discussions between management and DOE to finalize the remediation project design are ongoing. These discussions and further sampling and investigation conducted in 2014 in the process of preparing the EDR have yielded new information that indicate certain areas of the project will be significantly more expensive than estimated when the CD and CAP were filed. The increase in costs is expected to come from four primary categories; pile removal and disposal, dredging and disposal, the application of sand cover, and eelgrass mitigation.
75
Although the project design is not yet complete, the new information is sufficient to update the estimated project cost. Accordingly, management updated its Monte Carlo statistical simulation model to incorporate the new information. The updated model suggests a potential aggregate range of clean-up costs from $19.0 million to $24.9 million, which corresponds to a two standard deviation range of possible outcomes from the mean of $21.6 million. The Partnership accrued an additional liability of $10.0 million in the fourth quarter of 2014 to increase the recorded liability to the $21.6 million mean, which management considers the best estimate of the most likely outcome.
In addition to finalizing the project design, it remains to be determined the degree to which the Department of Natural Resources (DNR), the other potentially liable party (PLP) in Port Gamble, is going to participate in funding the costs of clean-up. The recorded liability is an estimate of the Partnership’s share of the total liability. As such, it is net of the estimated amount that DNR, as the other PLP, will contribute as its share of the project cost.
The environmental remediation accrual also includes estimated costs related to a separate remediation effort within the resort community of Port Ludlow. In February 2014, DOE issued an opinion letter in which it concurred with the clean-up alternative proposed by the Partnership. At this point, costs for this project consist primarily of ongoing monitoring activity.
The environmental liability at December 31, 2014 is comprised of $3.7 million that the Partnership expects to expend in the next 12 months and $18.0 million thereafter and are included in other current liabilities and other long-term liabilities, respectively.
Changes in the environmental liability for the last three years are as follows:
|
Balances at
|
Additions
|
Expenditures
|
||||||||||||||
|
the Beginning
|
to
|
for
|
Balance at
|
|||||||||||||
|
(in thousands)
|
of the Period
|
Accrual
|
Remediation
|
Period-end
|
||||||||||||
|
Year ended December 31, 2012
|
$ | 2,203 | $ | 12,500 | $ | 761 | $ | 13,942 | ||||||||
|
Year ended December 31, 2013
|
13,942 | - | 701 | 13,241 | ||||||||||||
|
Year ended December 31, 2014
|
13,241 | 10,000 | 1,590 | 21,651 | ||||||||||||
Performance bonds
In the ordinary course of business, and as part of the entitlement and development process, the Partnership is required to provide performance bonds to ensure completion of certain public facilities. The Partnership had performance bonds of $6.9 million and $15.5 million outstanding at December 31, 2014 and 2013, respectively. The bonds relate primarily to development activity in connection with pending and completed sales from our Harbor Hill project in Gig Harbor.
Supplemental Employee Retirement Plan
The Partnership has a supplemental employee retirement plan for a retired employee. The plan provides for a retirement income of 70% of his base salary at retirement after taking into account both 401(k) and Social Security benefits with a fixed payment set at $25,013 annually. The recorded balance of the projected liability as of December 31, 2014 and 2013 was $165,000 and $192,000, respectively.
76
Contingencies
The Partnership may from time to time be a defendant in various lawsuits arising in the ordinary course of business. Management believes Partnership losses related to such lawsuits, if any, will not have a material adverse effect to the Partnership’s consolidated financial condition or results of operations or cash flows.
|
9.
|
RELATED PARTY TRANSACTIONS
|
Pope MGP, Inc. is the managing general partner of the Partnership and receives an annual management fee of $150,000.
|
10.
|
SEGMENT AND MAJOR CUSTOMER INFORMATION
|
The Partnership’s operations are classified into three segments: Fee Timber, Timberland Management, and Real Estate. The Fee Timber segment consists of the harvest and sale of timber from both the Partnership’s 111,000 acres of fee timberland in Washington and the Funds’ 80,000 acres in Washington, Oregon, and California.
The Timberland Management segment provides investment management, disposition, and technical forestry services in connection with 24,000 acres for Fund I, which were sold in 2014, 37,000 acres for Fund II, and 43,000 acres for Fund III.
The Real Estate segment’s operations consist of management of development properties and the rental of residential and commercial properties in Port Gamble and Poulsbo, Washington. Real Estate manages a portfolio of 2,500 acres of higher-and-better-use properties as of December 31, 2014. All of the Partnership’s real estate activities are presently in the state of Washington.
For the year ended December 31, 2014, the Partnership had no customers that represented over 10% of consolidated revenue. For the year ended December 31, 2013, the Partnership had one customer that represented 14% of consolidated revenue, or $9.9 million and another that represented $12% of consolidated revenue, or $8.6 million. For the year ended December 31, 2012, the Partnership had one customer that represented 20% of consolidated revenue, or $10.6 million.
Identifiable assets are those used exclusively in the operations of each reportable segment or those allocated when used jointly. The Partnership does not allocate cash, accounts receivable, certain prepaid expenses, or the cost basis of the Partnership’s administrative office for purposes of evaluating segment performance by the chief operating decision maker. Intersegment transactions are valued at prices that approximate the price that would be charged to a third-party customer.
77
Details of the Partnership’s operations by business segment for the years ended December 31 were as follows:
|
(in thousands)
|
Fee Timber
|
Timberland
|
Real
|
|||||||||||||||||||||||||
|
2014
|
Partnership
|
Funds
|
Combined
|
Management
|
Estate
|
Other
|
Consolidated
|
|||||||||||||||||||||
|
Revenue internal
|
$ | 34,459 | $ | 31,356 | $ | 65,815 | $ | 3,303 | $ | 22,385 | $ | - | $ | 91,503 | ||||||||||||||
|
Eliminations
|
(611 | ) | - | (611 | ) | (3,303 | ) | (119 | ) | - | (4,033 | ) | ||||||||||||||||
|
Revenue external
|
33,848 | 31,356 | 65,204 | - | 22,266 | - | 87,470 | |||||||||||||||||||||
|
Cost of sales
|
(14,397 | ) | (22,389 | ) | (36,786 | ) | - | (11,304 | ) | - | (48,090 | ) | ||||||||||||||||
|
Operating, general and
|
||||||||||||||||||||||||||||
|
administrative expenses internal
|
(5,101 | ) | (6,081 | ) | (11,182 | ) | (2,940 | ) | (13,682 | )* | (3,900 | ) | (31,704 | ) | ||||||||||||||
|
Eliminations
|
- | 3,303 | 3,303 | 611 | 119 | 4,033 | ||||||||||||||||||||||
|
Operating, general and
|
||||||||||||||||||||||||||||
|
administrative expenses external
|
(5,101 | ) | (2,778 | ) | (7,879 | ) | (2,329 | ) | (13,682 | )* | (3,781 | ) | (27,671 | ) | ||||||||||||||
|
Gain on sale of tree farms
|
- | 23,750 | 23,750 | - | - | - | 23,750 | |||||||||||||||||||||
|
Income (loss) from operations internal
|
14,961 | 26,636 | 41,597 | 363 | (2,601 | ) | (3,900 | ) | 35,459 | |||||||||||||||||||
|
Eliminations
|
(611 | ) | 3,303 | 2,692 | (2,692 | ) | (119 | ) | 119 | - | ||||||||||||||||||
|
Income (loss) from operations
|
||||||||||||||||||||||||||||
|
external
|
$ | 14,350 | $ | 29,939 | $ | 44,289 | $ | (2,329 | ) | $ | (2,720 | ) | $ | (3,781 | ) | $ | 35,459 | |||||||||||
|
2013
|
||||||||||||||||||||||||||||
|
Revenue internal
|
$ | 32,781 | $ | 23,854 | $ | 56,635 | $ | 2,807 | $ | 14,798 | $ | - | $ | 74,240 | ||||||||||||||
|
Eliminations
|
(600 | ) | - | (600 | ) | (2,807 | ) | (141 | ) | - | (3,548 | ) | ||||||||||||||||
|
Revenue external
|
32,181 | $ | 23,854 | 56,035 | - | 14,657 | - | 70,692 | ||||||||||||||||||||
|
Cost of sales
|
(13,554 | ) | (18,772 | ) | (32,326 | ) | - | (7,300 | ) | - | (39,626 | ) | ||||||||||||||||
|
Operating, general and
|
||||||||||||||||||||||||||||
|
administrative expenses internal
|
(4,620 | ) | (5,746 | ) | (10,366 | ) | (2,557 | ) | (4,081 | ) | (4,678 | ) | (21,682 | ) | ||||||||||||||
|
Eliminations
|
25 | 2,800 | 2,825 | 607 | 116 | 3,548 | ||||||||||||||||||||||
|
Operating, general and
|
||||||||||||||||||||||||||||
|
administrative expenses external
|
(4,595 | ) | (2,946 | ) | (7,541 | ) | (1,950 | ) | (4,081 | ) | (4,562 | ) | (18,134 | ) | ||||||||||||||
|
Income (loss) from operations
|
||||||||||||||||||||||||||||
|
internal
|
14,607 | (664 | ) | 13,943 | 250 | 3,417 | (4,678 | ) | 12,932 | |||||||||||||||||||
|
Eliminations
|
(575 | ) | 2,800 | 2,225 | (2,200 | ) | (141 | ) | 116 | - | ||||||||||||||||||
|
Income (loss) from operations
|
||||||||||||||||||||||||||||
|
external
|
$ | 14,032 | $ | 2,136 | $ | 16,168 | $ | (1,950 | ) | $ | 3,276 | $ | (4,562 | ) | $ | 12,932 | ||||||||||||
|
2012
|
||||||||||||||||||||||||||||
|
Revenue internal
|
$ | 29,353 | $ | 16,681 | $ | 46,034 | $ | 2,218 | $ | 8,574 | $ | - | $ | 56,826 | ||||||||||||||
|
Eliminations
|
(495 | ) | - | (495 | ) | (2,211 | ) | (77 | ) | - | (2,783 | ) | ||||||||||||||||
|
Revenue external
|
28,858 | $ | 16,681 | 45,539 | 7 | 8,497 | - | 54,043 | ||||||||||||||||||||
|
Cost of sales
|
(13,115 | ) | (14,481 | ) | (27,596 | ) | - | (3,235 | ) | - | (30,831 | ) | ||||||||||||||||
|
Operating, general and
|
||||||||||||||||||||||||||||
|
administrative expenses internal
|
(4,183 | ) | (4,166 | ) | (8,349 | ) | (2,070 | ) | (16,361 | )* | (4,199 | ) | (30,979 | ) | ||||||||||||||
|
Eliminations
|
48 | 2,211 | 2,259 | 495 | - | 29 | 2,783 | |||||||||||||||||||||
|
Operating, general and
|
||||||||||||||||||||||||||||
|
administrative expenses external
|
(4,135 | ) | (1,955 | ) | (6,090 | ) | (1,575 | ) | (16,361 | )* | (4,170 | ) | (28,196 | ) | ||||||||||||||
|
Income (loss) from operations
|
||||||||||||||||||||||||||||
|
internal
|
12,055 | (1,966 | ) | 10,089 | 148 | (11,022 | ) | (4,199 | ) | (4,984 | ) | |||||||||||||||||
|
Eliminations
|
(447 | ) | 2,211 | 1,764 | (1,716 | ) | (77 | ) | 29 | - | ||||||||||||||||||
|
Income (loss) from operations
|
||||||||||||||||||||||||||||
|
external
|
$ | 11,608 | $ | 245 | $ | 11,853 | $ | (1,568 | ) | $ | (11,099 | ) | $ | (4,170 | ) | $ | (4,984 | ) | ||||||||||
|
*Includes $10.0 million and $12.5 million of environmental remediation expense in 2014 and 2012, respectively.
|
||||||||||||||||||||||||||||
78
|
(in thousands)
|
2014
|
2013
|
2012
|
|||||||||
|
Depreciation, Amortization and Depletion
|
||||||||||||
|
Fee Timber-Partnership
|
$ | 2,570 | $ | 2,999 | $ | 3,348 | ||||||
|
Fee Timber-Funds
|
9,969 | 8,066 | 6,950 | |||||||||
|
Fee Timber-Combined
|
12,539 | 11,065 | 10,298 | |||||||||
|
Timberland Management
|
2 | 2 | 4 | |||||||||
|
Real Estate
|
394 | 733 | 854 | |||||||||
|
G&A
|
88 | 108 | 95 | |||||||||
|
Total
|
$ | 13,023 | $ | 11,908 | $ | 11,251 | ||||||
|
Assets
|
||||||||||||
|
Fee Timber-Partnership
|
$ | 46,453 | $ | 46,856 | $ | 53,090 | ||||||
|
Fee Timber-Funds
|
240,910 | 213,614 | 177,474 | |||||||||
|
Fee Timber-Combined
|
287,363 | 260,470 | 230,564 | |||||||||
|
Timberland Management
|
52 | 3 | 29 | |||||||||
|
Real Estate
|
37,687 | 37,712 | 32,909 | |||||||||
|
G&A
|
19,975 | 12,723 | 3,997 | |||||||||
|
Total
|
$ | 345,077 | $ | 310,908 | $ | 267,499 | ||||||
|
Capital and Land Expenditures
|
||||||||||||
|
Fee Timber-Partnership
|
$ | 2,536 | $ | 985 | $ | 927 | ||||||
|
Fee Timber-Funds
|
73,359 | 44,510 | 46,033 | |||||||||
|
Fee Timber-Combined
|
75,895 | 45,495 | 46,960 | |||||||||
|
Timberland Management
|
38 | 4 | 3 | |||||||||
|
Real Estate-development activities
|
4,967 | 10,801 | 2,478 | |||||||||
|
Real Estate-other
|
198 | 101 | 35 | |||||||||
|
G&A
|
55 | 43 | 136 | |||||||||
|
Total
|
$ | 81,153 | $ | 56,444 | $ | 49,612 | ||||||
|
Revenue by product/service
|
||||||||||||
|
Domestic forest products
|
$ | 42,896 | $ | 34,001 | $ | 33,577 | ||||||
|
Export forest products, indirect
|
22,308 | 22,034 | 11,962 | |||||||||
|
Conservation easements and sales
|
7,703 | 7,259 | 1,235 | |||||||||
|
Fees for service
|
37 | - | 7 | |||||||||
|
Homes, lots, and undeveloped acreage
|
14,526 | 7,398 | 7,262 | |||||||||
|
Total
|
$ | 87,470 | $ | 70,692 | $ | 54,043 | ||||||
79
|
11.
|
QUARTERLY FINANCIAL INFORMATION (UNAUDITED)
|
|
(in thousands except
per unit amounts)
|
Revenue
|
Income (loss)
from operations
|
Net income (loss)
attributable to
unitholders
|
Basic and diluted
earnings (loss) per
partnership unit
|
||||||||||||
|
2014
|
||||||||||||||||
|
First quarter
|
$ | 37,779 | $ | 14,248 | $ | 12,241 | $ | 2.75 | ||||||||
|
Second quarter
|
18,583 | 3,137 | 1,846 | 0.41 | ||||||||||||
|
Third quarter
|
13,755 | 9,191 | 1,500 | 0.34 | ||||||||||||
|
Fourth quarter
|
17,353 | 8,883 | (3,172 | ) | (0.75 | ) | ||||||||||
|
2013
|
||||||||||||||||
|
First quarter
|
$ | 16,718 | $ | 3,758 | $ | 3,484 | $ | 0.76 | ||||||||
|
Second quarter
|
23,197 | 6,859 | 6,128 | 1.34 | ||||||||||||
|
Third quarter
|
11,724 | (530 | ) | (75 | ) | (0.03 | ) | |||||||||
|
Fourth quarter
|
19,053 | 2,845 | 3,598 | 0.81 | ||||||||||||
Quarterly fluctuations in data result from the addition and/or deferral of harvest volumes as well as the timing of real estate sales and environmental remediation charges, as disclosed in our quarterly filings. Management considered the disclosure requirements of Item 302(a)(3) and does not note any extraordinary, unusual, or infrequently occurring items except for the $10 million environmental remediation charge recorded in the fourth quarter and the sales of Fund I’s two tree farms, one in the third quarter and one in the fourth quarter.
80
ON ACCOUNTING AND FINANCIAL DISCLOSURE
None
Conclusion Regarding the Effectiveness of Disclosure Controls and Procedures
The Partnership’s management maintains an adequate system of internal controls to promote the timely identification and reporting of material, relevant information. Those controls include requiring executive management and all managers in accounting roles to sign a Code of Ethics (See Exhibit 99.4 to this report). Additionally the Partnership’s senior management team meets regularly to discuss significant transactions and events affecting the Partnership’s operations. The Partnership’s executive officers lead these meetings and consider whether topics discussed represent information that should be disclosed under generally accepted accounting principles and the rules of the SEC. The Board of Directors of the Partnership’s managing general partner includes an Audit Committee that is comprised solely of independent directors who meet the financial literacy requirements imposed by the Securities Exchange Act and the NASDAQ Stock Market. At least one member of our Audit Committee is a “financial expert” within the meaning of applicable NASDAQ rules. The Audit Committee reviews quarterly earnings releases and all reports on Form 10-Q and Form 10-K prior to their filing. The Audit Committee is responsible for hiring and overseeing the Partnership’s external auditors and meets with those auditors at least four times each year.
The Partnership’s executive officers are responsible for establishing and maintaining disclosure controls and procedures. They have designed such controls to ensure that others make known to them all material information within the organization. Management regularly evaluates ways to improve internal controls. As of the end of the period covered by the annual report on Form 10-K our executive officers completed an evaluation of the disclosure controls and procedures and have determined them to be functioning effectively.
Management’s Report on Internal Control Over Financial Reporting
Our management is responsible for establishing and maintaining adequate internal control over financial reporting for the Partnership. Internal control over financial reporting, as such term is defined in Rules 13a-15(f) and 15d-15(f) under the Exchange Act, is a process designed by, or under the supervision of, the Partnership’s chief executive officer and chief financial officer and effected by the Partnership’s board of directors, management and other personnel, to provide reasonable assurance regarding the reliability of financial reporting and the preparation of financial statements for external purposes in accordance with generally accepted accounting principles. The Partnership’s management, with the participation of the Partnership’s chief executive and financial officer, has established and maintained policies and procedures designed to maintain the adequacy of the Partnership’s internal control over financial reporting, and includes those policies and procedures that:
|
1)
|
Pertain to the maintenance of records that, in reasonable detail, accurately and fairly reflect the transactions and dispositions of the assets of the Partnership;
|
|
2)
|
Provide reasonable assurance that transactions are recorded as necessary to permit preparation of financial statements in accordance with generally accepted accounting principles, and that receipts and expenditures of the Partnership are being made only in accordance with authorizations of management of the Partnership; and
|
|
3)
|
Provide reasonable assurance regarding prevention or timely detection of unauthorized acquisition, use, or disposition of the Partnership’s assets that could have a material effect on the financial statements.
|
81
Management has evaluated the effectiveness of the Partnership’s internal control over financial reporting as of December 31, 2014 based on the control criteria established in a report entitled Internal Control—Integrated Framework (1992), issued by the Committee of Sponsoring Organizations of the Treadway Commission. Based on our assessment and those criteria, the Partnership’s management has concluded that the Partnership’s internal control over financial reporting is effective as of December 31, 2014.
Because of its inherent limitations, internal control over financial reporting may not prevent or detect all errors or misstatements and all fraud. Therefore, even those systems determined to be effective can provide only reasonable, not absolute, assurance that the objectives of the policies and procedures are met. Also, projections of any evaluation of effectiveness to future periods are subject to the risk that controls may become inadequate because of changes in conditions, or that the degree of compliance with the policies or procedures may deteriorate.
The registered independent public accounting firm of KPMG LLP, auditors of the Partnership’s consolidated financial statements, has issued an attestation report on the Partnership’s internal control over financial reporting. This report appears on page 58 of this annual report on Form 10-K.
Changes in Internal Control over Financial Reporting
There were no changes in the Partnership’s internal control over financial reporting that occurred during the most recent fiscal quarter that have materially affected, or are reasonably likely to materially affect, the Partnership’s internal control over financial reporting.
None
82
PART III
General Partner
The Partnership has no directors. Instead, the Board of Directors of its managing general partner, Pope MGP, Inc. (the “Managing General Partner”), serves in that capacity. References to the “Board” or words of similar construction in this report are to the board of the Managing General Partner, acting in its management capacity with respect to the Partnership. The Managing General Partner’s address is the same as the address of the principal offices of the Partnership. Pope MGP, Inc. receives $150,000 per year for serving as Managing General Partner of the Partnership. There are no family relationships among any of the executive officers and directors of the Managing General Partner.
The following table identifies the executive officers and directors of the Managing General Partner as of February 28, 2015. Officers of the Managing General Partner hold identical offices with the Partnership.
| Name | Age | Position, Background, and Qualifications to Serve | |
|
Thomas M. Ringo
|
61
|
President and Chief Executive Officer, and Director, from June 2014 to present. Vice President and CFO from December 2000 to present. Senior Vice President Finance and Client Relations from June 1996 to December 2000. Vice President Finance from November 1991 to June 1996. Treasurer from March 1989 through October 1991 of Pope MGP, Inc. and the Partnership. Tax Manager of Westin Hotel Company, 1985 to March 1989. Tax Consultant for Price Waterhouse, 1981 to 1985.
|
|
|
John E. Conlin (2), (3), (4)
|
56 |
Director since December 2005. Co-President and COO, NWQ Investment Management Company LLC, 2006 to present. Member, Board of Advisors, Victory Park Capital, 2009 to present. Member, Corporate Advisory Board, University of Michigan, Ross School of Business, 2006 to present. Member, University of Rochester Endowment Committee, 2006 to present. Director, ACME Communications, 2005 to 2008. Director, Cannell Capital Management 2002 to 2006. CEO, Robertson Stephens, Inc, from 2001 to 2003; COO, Robertson Stephens, Inc, from 1999 to 2000. Held numerous positions with Credit Suisse from 1983 to 1999, the last of which was Managing Director. Mr. Conlin's background in corporate finance, capital-raising and financial analysis bring the Partnership a perspective that is unique among our directors. Moreover, Mr. Conlin offers an ability to assess capital needs, structures and returns relating to the performance and operation of the Partnership, the Funds, and our strategic goals and objectives.
|
|
|
Douglas E. Norberg (1), (3), (4), (5)
|
74 |
Director since August 1996. Vice Chairman, Wright Runstad & Company, 2000 to 2007; President, Wright Runstad & Company, 1975 until 2000. Wright Runstad & Company is in the business of real estate investing, development, and management. Mr. Norberg has extensive knowledge of real estate development, marketing and management, and consults regularly with management regarding the Partnership's real property portfolio. Mr. Norberg also brings years of experience evaluating strategic alternatives for various real property opportunities.
|
83
|
Maria M. Pope (1), (4)
|
50
|
Director since December 2012. Senior Vice President of Power Supply and Operations and Resource Strategy since March 2013 of Portland General Electric, an electric utility. Senior Vice President, Chief Financial Officer and Treasurer of Portland General Electric from 2009 through February 2013; Director, Portland General Electric from 2006 through 2008. Vice President and Chief Financial Officer, Mentor Graphics Corporation, a software company, from July 2007 to December 2008. Vice President and General Manager, Wood Products Division of Pope & Talbot, Inc., a pulp and wood products company, from December 2003 to April 2007; Vice President, Chief Financial Officer and Secretary of Pope & Talbot, Inc. from 1999 to 2003. Pope & Talbot, Inc. filed a voluntary petition under Chapter 11 of the federal bankruptcy laws on November 19, 2007. Ms. Pope previously worked for Levi Strauss & Co. and Morgan Stanley & Co., Inc. Ms. Pope has extensive board experience having served on several U.S. and Canadian corporate boards across a number of industries, including forest products. Ms. Pope is also a director of Umpqua Holdings Corporation. (NASDAQ: UMPQ). She chairs the compensation committee and was the lead director and prior chair of the governance and audit committees of Premera BlueCross, an insurance company, from 2001 to 2013. She served on the board of TimberWest Forest Corp., the largest private land owner in British Columbia, Canada, from 2006 to 2012, where she chaired the audit committee. In 2010, Oregon’s Governor appointed Ms. Pope to the Governing Board of Oregon Health Sciences University.
|
|
|
J. Thurston Roach (1), (3), (4)
|
73
|
Director since May 2003. Director, Deltic Timber Corporation, December 2000 to present. Director, CellFor Inc. from November 2002 to May 2009. Outside Director, NBBJ Design, LLP, from November 2007 to present. Director, The Liberty Corporation May 1994 to January 2006. President and CEO, HaloSource Corporation, October 2000 to November 2001; Director, HaloSource Corporation, October 2000 to February 2002. Senior Vice President and CFO, Owens Corning, January 1999 to April 2000; Senior Vice President and President of Owens Corning’s North American Building Materials Systems Business, February 1998 to December 1998. Vice Chairman, Simpson Investment Company, July 1997 to February 1998; President, Simpson Timber Company, January 1996 to June 1997; Senior Vice President and Chief Financial Officer and Secretary, Simpson Investment Company, August 1984 to December 1995. Mr. Roach's experience as a senior executive and director at other timber and resource companies offer the Partnership insight into the practical issues facing public companies, and his specific knowledge of the timber and timberland markets, both in the Pacific Northwest and elsewhere, allow him to provide extensive input on both strategic and tactical business decisions confronting the board. His specific experience as Audit Committee chair for another public company has been leveraged effectively into a similar role at the Partnership.
|
84
|
Kevin C. Bates
|
48
|
Vice President of Timberland Investments from June 2014 to present, Director of Timberland Investment Management from March 2007 to June 2014. Controller from February 2001 to March 2007, Accounting Manager from February 1998 to February 2001. Internal Audit for Fluke Corporation and Accounting Manager for WAVTrace from May 1997 to March 1998. Audit Manager for Deloitte & Touche, 1991 to 1997.
|
|
|
Jonathan P. Rose
|
52
|
Vice President - Real Estate and President of Olympic Property Group from June 2014 to present, Director of Real Estate and President of Olympic Property Group from March 2005 to June 2014. Vice President of Property Development from January 2000 to March 2005, Project Manager March 1996 to January 2000. Design Engineer for Apex Engineering from 1987 to 1996.
|
______________________________
| 1) |
Class A Director
|
|
| 2) |
Class B Director
|
|
| 3) | Member of the Audit Committee | |
| 4) | Member of the Human Resources Committee | |
| 5) | Designated financial expert for the Board of Directors Audit Committee |
Board of Directors of the Managing General Partner
Board Composition. The Managing General Partner’s Certificate of Incorporation provides that directors are divided into two classes, each class serving a period of two years. The Managing General Partner’s shareholders elect approximately one-half of the members of the Board of Directors annually. The terms of the Class A directors expire on December 31, 2016, and the terms of the Class B directors expire on December 31, 2015. The directors’ election to the Board of Directors is subject to a voting agreement between the Managing General Partner’s two shareholders, Ms. Maria M. Pope and Mrs. Emily T. Andrews. J. Thurston Roach serves as Mrs. Andrews’ appointee to the Board of Directors. The Board of Directors met 11 times in 2014 with six of the meetings in person to discuss Partnership matters. The composition of our Board of Directors is established by the Limited Partnership Agreement and accordingly, as permitted by NASDAQ Rules IM-5065-7 and 5615(a)(4), board nominations are not made or approved by a separate nominating committee or by a majority of the independent directors.
Past Directorships. During the period 2010 through 2015, Ms. Pope and Mr. Roach served on boards of other public companies as outlined in the following table.
|
Individual’s Name
|
Name of Public Company
|
Term of Directorship
|
|
Maria M. Pope
|
Umpqua Holdings Corporation (NASDAQ:UMPQ)
Sterling Financial Corporation (NASDAQ:STSA)
TimberWest Forest Corp. (TSX:TWF.UN)
|
2014 - present
2013 - 2014
2006 - 2012
|
|
J. Thurston Roach
|
Deltic Timber Company (NYSE:DEL)
|
2000 - present
|
85
Board Leadership Structure. The Board does not utilize a Chairman. The CEO generally calls meetings of the Board and sets schedules and agendas for such meetings. The CEO regularly communicates with all directors on key issues and concerns outside of Board meetings and endeavors to ensure that information provided to the Board is sufficiently timely and complete to facilitate Board member fulfillment of responsibilities. As the individual with primary responsibility for managing the Partnership’s day-to-day operations, the CEO is best positioned to chair regular Board meetings where key business and strategic issues are discussed. The Board utilizes Mr. Norberg as a “lead director” and Mr. Norberg’s chief responsibility in this regard is to chair executive sessions of the non-management directors which are conducted as a part of every Board meeting.
Board’s Role in the Risk Oversight Process. Given the size of the Board, management of the Partnership’s material risks is administered through the whole Board in concert with executive and senior operating personnel. Risk is an integral part of Board and committee deliberations throughout the year with regular discussion of risks related to the company’s business strategies at each meeting. Periodically, the Audit Committee and Board review Management’s assessment of the primary operational and regulatory risks facing the Partnership, their relative magnitude and management’s plan for mitigating these risks. The Audit Committee considers risk issues associated with the Partnership’s overall financial reporting and disclosure process and legal compliance. At each of its regularly scheduled meetings, the Audit Committee meets in executive session and meets with the independent auditor outside the presence of management.
Diversity Policy. As noted above, the Partnership's board is established pursuant to the Partnership Agreement and a shareholders' agreement among the shareholders of Pope MGP, Inc., the Partnership's managing general partner. The shareholders' agreement, in particular, establishes the rights of the managing general partner's shareholders to designate the Partnership's directors. Neither the Partnership Agreement nor the managing general partner's shareholders' agreement establishes a diversity policy, nor does any such policy otherwise exist. Accordingly, our ability to consider diversity as a criterion for inclusion in the Board of Directors is limited to the diversity of the directors’ business and financial experience.
Audit Committee. The Audit Committee of the Board of Directors is comprised of three outside directors who comply with the Exchange Act and NASDAQ’s qualification requirements for Audit Committee members. The Audit Committee met to discuss the Partnership seven times during 2014. The Audit Committee’s Chairman is J. Thurston Roach and its designated financial expert is Douglas E. Norberg. See report of the Audit Committee on financial statements below.
Human Resources Committee. The Human Resources Committee is responsible for (1) establishing compensation programs for executive officers and senior management of the Partnership designed to attract, motivate, and retain key executives responsible for the success of the Partnership as a whole; (2) administering and maintaining such programs in a manner that will benefit the long-term interests of the Partnership and its unitholders; and (3) determining the salary, bonus, unit option and other compensation of the Partnership's executive officers and senior management. The Human Resources Committee met three times during 2014. Mr. John E. Conlin served as Chairman of the Human Resources Committee in 2014. See report of the Human Resources Committee on executive compensation below.
Beneficial Ownership and Section 16(a) Reporting Compliance
The Partnership is a reporting company pursuant to Section 12 of the Exchange Act. Under Section 16(a) of the Exchange Act, and the rules promulgated hereunder, directors, officers, greater than 10% shareholders, and certain other key personnel (the “Reporting Persons”) are required to file with the Securities and Exchange Commission reports of ownership and reports of changes in ownership of Partnership units. Reporting Persons are required by SEC regulations to furnish us with copies of all Section 16(a) forms they file. Based solely on our review of such reports received or written or oral representations from the Reporting Persons, the Partnership believes that the Reporting Persons have complied with all Section 16(a) filing requirements applicable to them, except that two executive officers were each late in filing their Form 3.
86
Code of Ethics
The Partnership maintains a Code of Ethics that is applicable to all executive officers, directors, and certain other employees. A copy of the Code of Ethics is available on the Investor Relations section of the Partnership's website.
Overview
Objectives of our Executive Compensation Program
The objective of our executive compensation program is to reward performance and to attract, motivate, and retain those employees who embrace a culture of achievement with a long-term perspective. Our executive compensation plans consist of two general components: salary and a long-term incentive program (the “Incentive Program”), which is intended to reward selected management employees who provide services to the Partnership for performance that builds long-term unitholder value. The Incentive Program examines participants’ decision making each year, with an eye towards rewarding behavior that is linked to adding long-term value to unitholders. In addition, the Incentive Program addresses the Partnership’s relative total unitholder performance over a trailing three-year period so as to promote both a long-term focus and align management with unitholder returns over time. Payments are made under the Incentive Program during the first quarter of each year with respect to results of decision-making in the prior year and relative performance of our publicly traded units over the three-year period ending on December 31 of the prior year. As a result, information depicted in this report includes amounts paid in 2013, 2014, and 2015 with respect to performance from each of the following three-year periods, respectively: 2010-2012, 2011-2013, and 2012-2014.
The Role of the Human Resources Committee and Executive Officers in Compensation Decisions
The Board’s Human Resources Committee has responsibility for establishing our compensation objectives and approving all compensation for the CEO, his immediate subordinates, and the broader management team that participates in the Incentive Program. The committee’s primary focus is on designing a compensation system that adequately rewards and motivates employees, and then monitoring the execution of this system. In designing the Partnership’s compensation system, the committee focuses on maintaining fairness and balance between the interests of our employees and our unitholders. With that in mind, the committee intends that the Incentive Program be continuing and permanent for participants, but reserves the right to suspend and or terminate the Incentive Program at any time, as long as previously earned awards are not forfeited. In its role as administrator of the Incentive Program, the committee has the authority to determine all matters relating to awards to be granted thereunder, and has sole authority to interpret its provisions and any applicable rule or regulation. In making its decisions and administering the Incentive Program and our other compensation programs, the committee also monitors and evaluates periodically the impact of our compensation policies and objectives in light of the potential for such arrangements to promote excessive risk-taking by individual participants.
The Incentive Program has two components – the Performance Restricted Unit (“PRU”) plan and the Long-Term Incentive Plan (“LTIP”). Both components have a long-term emphasis, with the PRU plan focused on annual decision making, and the LTIP focused on three-year performance of the Partnership’s publicly traded units relative to a group of peer companies to be determined at the beginning of each plan cycle. The committee believes this focus is appropriate for the nature of the Partnership’s assets and for strengthening alignment with unitholders. Each of these two Incentive Program components is described in more detail below.
The committee has from time-to-time engaged compensation consultants to assist the committee in assessing the market for top executives. Historically, these consultants have provided a limited scope of services on behalf of the committee and their roles generally have been confined to specific peer analyses or assessments of specific compensation components within the Partnership’s then-existing compensation structures. These consultants generally have performed no other services for the Partnership or its subsidiaries or management, and in each case the committee has evaluated matters that the comittee determined to be relevant to the consultant’s independence. The Partnership’s HR Committee engaged Farient Advisors, a compensation consulting advisory firm, to advise the HR Committee on executive compensation matters in 2012, 2013, and 2014, for which Farient was paid a total of $83,000, $33,000, and $87,000, respectively.
87
Elements of Compensation
Our executive compensation program is designed to be consistent with the objectives and guidelines set forth above. A discussion of each of the key elements of the program follows below.
Base Salary. Base salary represents that portion of compensation that is designed to provide the executive with a stable and predictable cash payment at a level that is competitive with other similarly situated companies. In establishing base salary levels for executives and other members of the management team, the committee has used compensation consultant data, taking into account such factors as competitive industry salaries, general and regional economic conditions, and the size and geographic differences of “peer” companies against which the Partnership is compared. Using that data, the committee attempts to tailor our executives’ base compensation to each executive’s scope of responsibilities, individual performance, and contribution to our organization. If adjustments in base salary are made, they are usually effective March 1 of each year, unless circumstances warrant otherwise. The Partnership’s named executive officers received no additional increase in base salary for 2012 or 2013. In March 2014, Mr. Ringo received an increase in base salary of 2%. In December, Mr. Ringo received an additional increase in conjunction with his promotion, on a permanent basis, to President and Chief Executive Officer. In June 2014, the Partnership promoted two new named executive officers: Kevin C. Bates to the position of Vice President of Timberland Investments and Jonathan P. Rose to the position of Vice President – Real Estate. Messrs. Bates and Rose received increases in their base salary as a result of these promotions. Mr. Rose retains his title as President of the Partnership’s wholly-owned real estate subsidiary. Their salary amounts were determined by reviewing market data for similar positions and consulting with a compensation advisory firm.
Incentive Program. Our Incentive Program has been designed using a combination of the LTIP, which awards cash incentive payments based on relative total return to unitholders, together with the PRU plan, which uses a blend of cash and restricted limited partner units to reward annual decision making that is aligned with the Partnership’s strategies. By designing the Incentive Program to align with both long-term decision making and performance, the committee believes it has mitigated the risk to the Partnership that could be driven by excessive focus on short-term goals.
Long-Term Incentive Program (LTIP). The LTIP represents the Partnership’s cash bonus plan for the CEO and his direct management reports, and focuses on relative total unitholder return measured over a rolling three-year period ending on the last day of the fiscal year for which the award is to be computed. Specifically, at the beginning and end of each period, the Partnership measures the arithmetic average trading price of the Partnership’s limited partner units over the sixty trading day period preceding the first day and the last day of the three-year measurement period. The Partnership also takes into account all distributions to unitholders during that period, and compares the resulting total returns to those provided to security holders within a group of the Partnership’s peers as measured using the same methodology. The peer group definition has evolved over time and has been based upon the recommendation of the Partnership’s compensation consultant to include companies within the forest products industry, as well as those in real estate and those having a strong focus on land or natural resources. The following group of 23 companies was used to serve as peer benchmark for the 2010-12 performance cycle.
|
Forest Products
|
Real Estate
|
Agriculture
|
Metals & Mining
|
|
Deltic (DEL)
|
Amer. Realty Inv. (ARL)
|
Alico (ALCO)
|
China Direct (CDII)
|
|
Plum Creek (PCL)
|
Amer. Spectrum (AQQ)
|
Griffin Land (GRIF)
|
Jaguar Mining (JAG)
|
|
Potlatch (PCH)
|
AV Homes (AVHI)
|
Limoneira (LMNR)
|
Royal Gold (RGLD)
|
|
Rayonier (RYN)
|
EastGroup Properties (EGP)
|
||
|
St. Joe (JOE)
|
First Potomac (FPO)
|
||
|
Weyerhaeuser (WY)
|
InterGroup Corp. (INTG)
|
||
|
Maui Land & Pineapple (MLP)
|
|||
|
Monmouth RE Investment (MNR)
|
|||
|
NTS Realty (NLP)
|
|||
|
Tejon Ranch (TRC)
|
|||
|
Thomas Properties Group (TPGI)
|
88
Starting with the three-year LTIP cycle 2011-13, the group of benchmark peer companies has been reduced from 23 companies to 15. This change was made to de-emphasize real estate or land companies in relation to timber and to eliminate mining companies. The composition of the new peer list is as follows:
|
Forest Products
|
Real Estate
|
Agriculture
|
|
|
Deltic (DEL)
|
EastGroup Properties (EGP)
|
Alico (ALCO)
|
|
|
Plum Creek (PCL)
|
First Potomac (FPO)
|
Griffin Land (GRIF)
|
|
|
Potlatch (PCH)
|
Forestar Group Inc. (FOR)
|
Limoneira (LMNR)
|
|
|
Rayonier (RYN)
|
Monmouth RE Investment (MNR)
|
||
|
St. Joe (JOE)
|
Tejon Ranch (TRC)
|
||
|
Weyerhaeuser (WY)
|
Thomas Properties Group (TPGI)
|
For the LTIP cycle 2012-14 and subsequent ones, TPGI was dropped from the list of 15 peers and replaced by CatchMark Timber Trust (CTT). TPGI is no longer a separately traded public company after December 2013 and CTT became a publicly traded company and a pure-play timber REIT in December 2013.
Following the close of each rolling three-year LTIP performance period, the committee ranks the Partnership’s total unitholder return against those of the selected peer companies, and makes awards if the Partnership’s total return is equal to or greater than the twentieth (20th) percentile. The fiftieth (50th) percentile within that ranking represents the Partnership’s “target performance level,” which results in a payout of 100% of the target LTIP bonus. The maximum award, which results in awards of 200% of the target LTIP amount, occurs when the Partnership is at or above the eightieth (80th) percentile. Actual payouts are determined in proportionate fashion when the total returns fall between the 20th (zero bonus) and 80th percentile (200% of target bonus). The committee has the discretion to alter award levels upward or downward by 20% of the actual formula bonus.
Participants in the LTIP. Participation in the LTIP is comprised of the CEO and the managers who report directly to the CEO.
Performance Restricted Unit Plan (“PRU”). The PRU is the equity-based element of the Incentive Program, although awards can be made in cash, restricted units, or a combination of each. Awards from this component of the Incentive Program are based upon a target pool established at the beginning of each fiscal year and adjusted upward or downward as participants are added to or deleted from the Incentive Program. For 2014 the payout award pool consisted of 1,350 units for Mr. Ringo with respect to his CFO role in 2014 and 9,050 units for all other management participants collectively. Due to Mr. Ringo’s late-2014 appointment to the CEO role, no award for 2014 was attributed to the CEO position.
Determination of Performance Awards. PRU awards are determined for the various participants on the basis of the participant’s role in the Partnership’s management, and are measured on the basis of the quality of decision making against a broad spectrum of criteria, organized by business segment as follows:
Fee Timber. Fee Timber participants in the PRU are evaluated primarily on the basis of growth in sustainable harvest.
Timberland Management. Timberland Management participants are evaluated on the basis of investor capital commitments and internal rates of return for the Funds.
Real Estate. Because our real estate revenues vary tremendously with market conditions, and sale transactions are relatively infrequent, real estate participants are evaluated heavily on the estimated impact of entitlements and land improvements on the market value of our portfolio properties.
Corporate. Our corporate personnel are evaluated primarily on per unit growth in distributable income.
89
Most participants can expect to earn 100% of their target payout award for each year; however, the committee has the discretion to reduce the award levels in the event of poor performance or decision-making that exposes the Partnership to significant risk or loss, or to increase those awards up to an additional 100% of the targeted award levels for generating or implementing decisions, plans or programs that are of major positive influence on the Partnership.
Mechanics of the PRU. Immediately following the end of each fiscal year, the committee determines the size of the PRU pool based on their assessment of the quality of decision-making during the year. The committee also identifies any events or decisions that merit special recognition for particular individuals or groups and, if so, determines the amount of any special PRU awards that are to be allocated to those participants. The PRU pool is established on the basis of these determinations, and each participant is allocated a specified performance value, which is then converted to a number of restricted units or, in the case of PRU awards paid in cash, based on the arithmetic average of the closing prices of the Partnership’s limited partner units on Nasdaq on each of the sixty consecutive trading days ending on and including the last day of the relevant fiscal year. The committee also determines the appropriate allocations between restricted units and cash awards based upon a compensation consultant’s market study with some influence from our past practices of granting restricted units and cash bonuses. In general, the higher up in the management group, the greater the percentage of that individual’s PRU award received in the form of restricted units. The percentage of each participant’s PRU award paid in the form of restricted units was kept to simple options of 100%, 50%, or 0%. Restricted unit grants vest ratably, with 25% vesting on each of the first four anniversaries of the grant date, although the committee has the discretion to vary such awards.
Participants in the PRU. In addition to the named executive officers, current participants in the PRU include 11 additional management personnel either one or two levels organizationally below the Partnership’s CEO. As job duties change, the participants may be modified by the committee.
Clawbacks. The HR Committee acknowledges that the Partnership’s incentive compensation program will be subject to the clawback provisions of the Dodd-Frank Act. In the meantime, the HR Committee reserves the right and option to require the return of incentive compensation paid pursuant to the Incentive Program in any instances of fraudulent employee misconduct or a restatement of the Partnership’s financial reports affecting the calculation of the payout amounts. The Partnership will adhere to all applicable regulations of the SEC, NASDAQ, and other governmental authorities regarding obligations to require disgorgement of erroneous or excessive compensation.
Perquisites and Other Personal Benefits. We do not provide perquisites or other personal benefits to our executive officers or senior managers. We do not own or lease aircraft for our executives’ personal use. Our health care and medical insurance programs, as well as our defined contribution retirement plan (401(k)), are the same for all salaried employees, including officers. Further information regarding our defined contribution plan is set forth below in the paragraph entitled “Defined Contribution Retirement Savings Plan.”
Defined Benefit Pension Plans. None of our named executive officers participate in or have account balances in qualified or non-qualified defined benefit plans sponsored by us.
Defined Contribution Retirement Savings Plan. As of December 31, 2014 all our employees are eligible to participate in our defined contribution plan, which is a tax qualified plan pursuant to Section 401(k) of the Code. During each of the years 2012 through 2014 the Partnership matched 50% of the employees’ contributions up to 8% of compensation. Partnership contributions to the plan amounted to $186,000, $147,000, and $141,000 for each of the years ended December 31, 2014, 2013, and 2012, respectively. Employees become fully vested in the Partnership's contribution over a six-year period. The Partnership does not discriminate between executive and non-executive employees with respect to any aspect of this plan.
90
Agreements Between the Partnership and Executive Officers. Each employee is employed at the will of the Partnership and does not have a term of guaranteed employment. We do not have any employment agreements with any of our named executive officers. We do have in place, however, a change in control agreement with the CEO (see discussion below).
Severance and Other Termination Benefits
The committee recognizes the possibility that, as with all publicly traded entities, a change in control of Pope Resources or its Managing General Partner may occur and that the uncertainty created by this potential event could result in the loss or distraction of executives, with a resulting detriment to unitholders. To that end, Pope Resources has entered into a change in control agreement with Mr. Ringo that is intended to align executive and unitholder interests by enabling him to promote the Partnership’s interests in connection with strategic transactions that may be in the best interests of unitholders without undue concern for personal circumstances.
The Partnership’s severance program is based on a “double trigger” mechanism, which means that upon the involuntary termination of the executive’s employment (other than “for cause,” and including resignation for certain specified reasons) within eighteen months after a change in control event occurs, the following benefits would be provided:
|
●
|
cash payments equal to two times the executive’s base salary, plus the executive’s target bonus for the year in which the change in control occurred;
|
|
●
|
immediate vesting of all outstanding unit option awards consistent with the terms of the Pope Resources 2005 Equity Incentive Plan; and
|
|
●
|
continued coverage for the executive and dependents under Pope Resources’ health and welfare plan for up to 18 months after termination.
|
The following table summarizes the cash payments that would have been due to Mr. Ringo if a change in control event had occurred on December 31, 2014.
|
Two times base salary
|
$650,000
|
|
Target bonus
|
$162,500
|
|
Total cash payments
|
$812,500
|
No trusts are maintained to protect benefits payable to executives covered under these change in control agreements with any funding, as applicable, to come from the general assets of the Partnership.
91
Policy With Respect to $1 Million Deduction Limit
It is not anticipated that the limitations on deductibility, under Internal Revenue Code Section 162(m), of compensation to any one executive that exceeds $1,000,000 in a single year will apply to the Partnership or its subsidiaries in the foreseeable future because this provision applies only to corporations and not to partnerships. In the event that the Partnership were to determine that such limitations would apply in a given scenario, the committee will analyze the circumstances presented and act in a manner that, in its judgment, is in the best interests of the Partnership. This may or may not involve actions to preserve deductibility.
Summary Compensation Table
The following table sets forth information regarding compensation earned by our named executive officers for the years 2012 through 2014:
|
Name and
Principal Position
|
Year
|
Salary
($)
|
Unit Awards
($) (1)
|
Non-equity Incentive
Program
Compensation ($) (2)
|
All Other
Compensation
($) (3)
|
Total
($)
|
|
Thomas M. Ringo
President, CEO and CFO (4)
|
2014
|
135,755
|
-
|
-
|
15,693
|
151,448
|
|
Vice President and CFO
|
2014
|
89,850
|
83,903
|
180,000
|
8,207
|
361,960
|
|
2013
|
213,082
|
88,425
|
160,000
|
22,553
|
484,060
|
|
|
2012
|
213,082
|
162,000
|
160,000
|
18,955
|
554,037
|
|
|
David L. Nunes
President and CEO (4)
|
2014
|
184,241
|
-
|
-
|
24,800
|
209,041
|
|
2013
|
327,818
|
196,500
|
360,000
|
49,684
|
934,002
|
|
|
2012
|
327,818
|
720,001
|
360,000
|
30,054
|
1,437,873
|
|
|
Kevin C. Bates
Vice President of Timberland Investment (5)
|
2014
|
177,677
|
62,150
|
113,500
|
22,145
|
375,472
|
|
Jonathon P. Rose
Vice President - Real Estate
and President of Olympic
Property Group (5)
|
2014
|
194,997
|
62,150
|
113,500
|
20,635
|
391,282
|
|
(1)
|
Amounts represent the market value on the date of grant of restricted units received in January 2015, 2014 and 2013, respectively, as compensation under the PRU plan for 2014, 2013 and 2012 performance. Expense will be recognized, however, over the four-year vesting period for each of these grants with 25% vesting each year.
|
|
(2)
|
Represents awards earned for each of the years 2012 through 2014 under the LTIP but paid out in January 2013, 2014, and 2015, respectively, as discussed in the Compensation Discussion and Analysis beginning on page 87. Messrs. Ringo, Bates and Rose earned additional compensation of $24,000, $16,000 and $16,000, respectively, which will be paid in June 2015. These amounts were awarded to recognize the additional responsibilities assumed by these individuals following the departure of Mr. Nunes until the appointment of Mr. Ringo as the permanent CEO.
|
|
(3)
|
Amounts represent matching contributions to the Partnership’s 401(k) plan made by the Partnership on behalf of the executive, and distributions received by the executive on unvested restricted Partnership units (the value of the restricted units is described under footnote (1) above and not repeated here.)
|
|
(4)
|
Mr. Nunes served as CEO until May 31, 2014. Mr. Ringo was designated interim CEO effective June 1, 2014, and continued in his role as CFO. Mr. Ringo became the Partnership’s permanent CEO on December 1, 2014 and continues to serve as CFO pending the designation of his successor in that role.
|
|
(5)
|
Messrs. Bates and Rose became named executive officers in June 2014 upon their appointments as Vice Presidents of the Partnership.
|
92
Grants of Plan Based Awards Table
The following table supplements the Summary Compensation Table and lists both annual and long-term incentive awards made during 2014 to each named executive officer.
|
Estimated Future Payouts Under Non-Equity Incentive Program Awards (1)
|
Estimated Future Payouts Under Equity Incentive Program Awards
|
|||||||||||
|
Name
|
Type of
Award
|
Grant
Date (2)
|
Thresh
-old ($)
|
Target
($)
|
Maximum
($)
|
Thresh
-old ($)
|
Target ($)
|
Maximum
($)
|
All Other Unit Awards: Number of Shares of Unit or Units (#) (3)
|
All Other Options Awards: Number of Securities Underlying Options (#)
|
Closing Price on Grant Date ($/Sh)
|
Grant Date Fair Value of Stock and Option Awards ($)
|
|
Thomas M Ringo
President,
CEO
and CFO
|
LTIP
2014-16
|
None
|
-
|
80,000
|
160,000
|
|||||||
|
RU
|
1/7/14
|
1,350
|
65.5
|
88,425
|
||||||||
|
David L.
Nunes
President
and CEO
(4)
|
RU
|
1/7/14
|
3,000
|
65.5
|
196,500
|
|||||||
|
Kevin C.
Bates Vice President
|
LTIP
2014-16
|
None
|
-
|
50,000
|
100,000
|
|||||||
|
RU
|
1/7/14
|
1,000
|
65.5
|
65,500
|
||||||||
|
Jonathon P.
Rose Vice President
|
LTIP
2014-16
|
None
|
-
|
50,000
|
100,000
|
|||||||
|
RU
|
1/7/14
|
1,000
|
65.5
|
65,500
|
||||||||
|
(1)
|
Reflects potential awards under the LTIP. The LTIP was implemented in 2010 with an initial “cycle” corresponding to the performance period 2008 – 10, a second cycle for the performance period 2009 – 11, and so on up through the seventh cycle for the performance period 2014 – 16 which is the only cycle shown in the table above since its performance period initiated in calendar year 2014. Payouts for the 2010-12, 2011-13, and 2012-14 cycles are reflected in the Summary Compensation Table (see footnote (2) from that table.) A description of how the LTIP functions is described above beginning on page 88.
|
|
(2)
|
No grant date attaches to LTIP cycles.
|
|
(3)
|
Reflects the grant of time-based restricted units that will vest ratably over a four-year period on each of four anniversary-of-grant dates.
|
|
(4)
|
Mr. Nunes forfeited all 2014 awards upon his departure, in addition to then-unvested awards, representing a total of 16,500 units.
|
Unit Incentive Program
In 2005 the Board of Directors of Pope MGP, Inc. adopted the Pope Resources 2005 Unit Incentive Program (the “Plan”) and terminated future awards under the Partnership’s 1997 Unit Option Plan. The Plan is administered by the Human Resources Committee. The purpose of the change to the Plan was to allow the committee to award restricted units to employees and directors which the committee believes provides a better alignment of interest with current unitholders than the unit option grants under the 1997 plan.
Units Available for Issuance
There are 1,105,815 units authorized under the Plan. As of December 31, 2014 there were 921,289 authorized but not issued units in the Plan. Securities issued or issuable under the Plan have been registered on a Form S-8 registration statement.
93
Unit Options
There are currently no unexpired and unexercised options.
Vesting Schedule
Under the PRU plan, restricted units granted ordinarily vest ratably over four years, with 25% vested on each anniversary of the grant. The administrator may vary this schedule in its discretion.
Unit Appreciation Rights
In addition to Unit grants, the administrator of the Plan may grant unit appreciation rights. Unit appreciation rights represent a right to receive the appreciation in value, if any, of the Partnership’s units over the base value of the unit appreciation right. As of the date of this report no unit appreciation rights have been granted under the Plan.
Adjustments, Changes in Our Capital Structure
The number and kind of units available for grant under the, as well as the exercise price of outstanding options, will be subject to adjustment by the committee in the event of any merger or consolidation.
Administration
The committee has full discretionary authority to determine all matters relating to securities granted under the Plan.
Amendment and Termination
The board of directors has the exclusive authority to amend or terminate the Plan, except as would adversely affect participants’ rights to outstanding awards. As the plan administrator, the committee has the authority to interpret the plan and options granted under the Plan and to make all other determination necessary or advisable for plan administration. In addition, as administrator of the Plan the committee may modify or amend outstanding awards, except as would adversely affect participants’ rights to outstanding awards without their consent.
94
Outstanding Equity Awards At Fiscal Year-End; Option Exercise and Units Vested
The following table summarizes the outstanding equity award holdings held by our named executive officers as of December 31, 2014:
|
Option Awards
|
Unit Awards
|
||||||||
|
Name
|
Number
of
Securities
Underlying
Unexercised
Options
Exercisable
(#)
|
Number
of
Securities
Underlying
Unexercised
Options
Unexercisable
(#)
|
Equity
Incentive
Plan
Awards:
Number
of
Securities
Underlying
Unexercised
Unearned
Options
(#)
|
Option
Exercise
Price
($)
|
Option
Expiration
Date
|
Number of Units
That
Have Not Vested
(#)
|
Market
Value
of
Units
That
Have
Not
Vested
($)
|
Equity
Incentive
Plan
Awards:
Number
of
Unearned
Shares,
Units or
Other
Rights
That Have
Not
Vested
(#)
|
Equity
Incentive
Plan
Awards:
Market or
Payout
Value of
Unearned
Shares,
Units or
Other
Rights
That Have
Not
Vested
($)
|
|
Thomas M. Ringo
President and CEO
|
-
|
-
|
-
|
5,400
|
343,602
|
-
|
-
|
||
|
Kevin C. Bates
Vice President
|
-
|
-
|
-
|
5,500
|
349,965
|
-
|
-
|
||
|
Jonathon P. Rose
Vice President
|
-
|
-
|
-
|
4,900
|
311,787
|
-
|
-
|
||
The following table summarizes the number of units acquired and amounts realized by our named executive officers during the year ended December 31, 2014 on the exercise of unit options and vesting of restricted units.
|
Option Awards
|
Unit Awards
|
|||
|
Name
|
Number of Units Acquired on Exercise
|
Value Realized on Exercise
|
Number of Units Acquired on Vesting
|
Value Realized on Vesting
|
|
(#)
|
($)
|
(#) (1)
|
($)
|
|
|
Thomas M. Ringo
President, President, CEO and CFO
|
-
|
-
|
2,025
|
133,711
|
|
David L. Nunes
President and CEO
|
-
|
-
|
6,000
|
396,180
|
|
Kevin C. Bates
V.P. Timberland Investments
|
-
|
-
|
2,000
|
132,060
|
|
Jonathon P. Rose
V.P. Real Estate
|
-
|
-
|
1,800
|
118,854
|
|
(1)
|
Of the 2,025 units acquired upon vesting in 2014 by Mr. Ringo, he tendered back 541 of those units with an aggregate value of $35,722 to the Partnership in lieu of paying cash for payroll taxes due on the vesting. As such, Mr. Ringo retained a net position of 1,484 of these units. Of the 1,800 units acquired upon vesting in 2014 by Mr. Rose, he tendered back 483 units with an aggregate value of $31,892 to the Partnership in lieu of paying cash for payroll taxes due on the vesting. As such Mr. Rose retained a net position of 1,317 of these units.
|
95
Officer Unit Ownership Guidelines
We do not have a formal unit ownership guideline for named executive officers, but note that as of February 17, 2015 Messrs. Ringo, Bates and Rose owned units of Pope Resources that had the following values expressed as multiples of 2014 base salary. In addition, the table below outlines in a relative sense how the respective ownership positions of each named executive officer was obtained.
|
Thomas M.
|
Kevin C.
|
Jonathan P.
|
||||||
|
Ringo
|
Bates
|
Rose
|
||||||
|
A
|
Total # of units owned - excluding unvested restricted units
|
20,028
|
15,394
|
8,762
|
||||
|
B
|
Value of units owned - excluding unvested restricted units
|
$1,251,750
|
$962,125
|
$547,625
|
||||
|
C
|
Base salary
|
$325,000
|
$190,000
|
$200,000
|
||||
|
Value divided by salary - B/C
|
3.9
|
5.1
|
2.7
|
|||||
|
% of A acquired via:
|
||||||||
|
Open market purchase
|
7%
|
5%
|
0%
|
|||||
|
Exercise of options
|
44%
|
24%
|
39%
|
|||||
|
Vesting of restricted units
|
49%
|
71%
|
61%
|
|||||
|
D
|
Total # of unvested restricted units
|
4,387
|
4,250
|
3,850
|
||||
|
E
|
Value of unvested restricted units
|
$274,188
|
$265,625
|
$240,625
|
||||
|
Value divided by salary - E/C
|
0.8
|
1.4
|
1.2
|
|||||
|
F
|
Combined value of all owned units - B plus E
|
$1,525,938
|
$1,227,750
|
$788,250
|
||||
|
Value divided by salary - F/C
|
4.7
|
6.5
|
3.9
|
|||||
Director Compensation
The following table sets forth a summary of the compensation we paid to our non-employee directors in 2014:
|
Name
|
Fees
Earned
or Paid
in Cash
($)
|
Unit
Awards
($) (1)
|
Option
Awards
($) (2)
|
Non-Equity
Incentive Program
Compensation
($)
|
Change in
Pension
Value and
Non-qualified
Deferred
Compensation
Earnings
|
All Other
Compensation
($) (3)
|
Total
($)
|
|
John E. Conlin
|
35,000
|
49,125
|
-
|
-
|
-
|
12,075
|
96,200
|
|
Douglas E. Norberg
|
28,500
|
49,125
|
-
|
-
|
-
|
12,075
|
89,700
|
|
Maria M. Pope
|
26,000
|
49,125
|
-
|
-
|
-
|
5,625
|
80,750
|
|
J. Thurston Roach
|
39,000
|
49,125
|
-
|
-
|
-
|
12,075
|
100,200
|
|
(1)
|
Amounts represent the market value on the date of grant (January 7, 2014) of restricted units received during the year. These units are subject to a trading restriction until the units vest. These unit grants vest 50% on the third anniversary of the grant in January 2017 and the remaining 50% on the fourth anniversary of the grant date in January 2018. For each of Messrs. Conlin, Norberg, and Roach a total of 750 restricted units granted during fiscal year 2010 vested and became eligible for trading on May 25, 2014 and an additional 750 restricted units granted during fiscal year 2011 vested and became eligible for trading on April12, 2014.
|
|
(2)
|
No options were awarded in 2014.
|
|
(3)
|
Amounts represent distributions received on unvested restricted Partnership units.
|
Compensation of the outside directors of Pope MGP, Inc. consists of a monthly retainer of $1,500 plus a $1,000 per day fee for each board or committee meeting attended and $500 for participation in a board or committee meeting via telephone. The Chairman of the Audit Committee receives an additional annual retainer amount of $7,000 that is paid in a monthly pro rata fashion. The Chairman of the Human Resources Committee receives an additional annual retainer of $5,000, also paid pro rata on a monthly basis. Both the Chairman of the Audit and Human Resources Committees receive an additional $500 fee per committee meeting.
96
Report of the Human Resources Committee on Executive Compensation
The Human Resources Committee of the General Partner’s Board of Directors (the “Committee”) has reviewed and discussed the contents of this Compensation Discussion and Analysis, required by Item 402(b) of SEC Regulation S-K, with the Partnership’s management and, based on such review and discussions, recommended to the General Partner’s Board of Directors that it be included in this Form 10-K.
The Committee’s report is also intended to describe in general terms the process the committee undertakes and the matters it considers in determining the appropriate compensation for the Partnership's executive officers: Messrs. Ringo, Bates, Rose and Nunes.
Responsibilities and Composition of the Committee
The Committee is responsible for (1) establishing compensation programs for executive officers of the Partnership designed to attract, motivate, and retain key executives responsible for the success of the Partnership as a whole; (2) administering and maintaining such programs in a manner that will benefit the long-term interests of the Partnership and its unitholders; and (3) determining the salary and incentive compensation elements of the Partnership's executive officers’ remuneration.
The Committee is currently comprised of Douglas E. Norberg, Maria M. Pope, J. Thurston Roach, and John E. Conlin. Mr. Conlin served as Committee Chair during 2014. None of the members are officers or employees of the Partnership or the General Partner.
Conclusion
The Human Resources Committee believes that for 2014 the compensation terms for Mr. Ringo, Mr. Bates, Mr. Rose and Mr. Nunes, as well as for our other management personnel, were clearly related to the realization of the goals and strategies established by the Partnership. The discussion set forth in this section entitled “Compensation Discussion and Analysis” is hereby adopted as the Report of the Human Resources Committee for the year ended December 31, 2014.
John E. Conlin, Chairman
Douglas E. Norberg
Maria M. Pope
J. Thurston Roach
Audit Committee Report on Financial Statements
The Audit Committee of the General Partner’s Board of Directors has furnished the report set forth in the following section entitled “Responsibilities and Composition of the Audit Committee” on the Partnership’s year-end financial statements and audit for fiscal year 2014. The Audit Committee’s report is intended to identify the members of the Audit Committee and describe in general terms the responsibilities the Audit Committee assumes, the process it undertakes, and the matters it considers in reviewing the Partnership’s financial statements and monitoring the work of the Partnership’s external auditors.
Responsibilities and Composition of the Audit Committee
The Audit Committee is responsible for (1) hiring the Partnership’s independent registered public accounting firm and overseeing their performance of the audit functions assigned to them, (2) approving any non-audit services to be provided by the external auditors, and (3) approving all fees paid to the independent registered public accounting firm. Additionally, the Audit Committee reviews the Partnership’s quarterly and year-end financial statements with management and the independent registered public accounting firm. The Board of Directors has adopted an Audit Committee Charter included in Exhibit 3.12 to this Annual Report on form 10-K.
97
The Audit Committee is comprised of J. Thurston Roach, John E. Conlin, and Douglas E. Norberg. Mr. Roach serves as Audit Committee Chair. All members of the Audit Committee are independent as defined under NASDAQ Rule 5605(a)(2) and Exchange Act Section 10A(m)(3), and all are financially literate. Mr. Norberg is designated as a “financial expert” for purposes of NASDAQ Rule 5605(c)(2)(A).
During the year, the Audit Committee reviewed with the Partnership’s management and with its independent registered public accounting firm the scope and results of the Partnership’s internal and external audit activities and the effectiveness of the Partnership’s internal control over financial reporting. The Audit Committee also reviewed current and emerging accounting and reporting requirements and practices affecting the Partnership. The Audit Committee discussed certain matters with the Partnership’s independent registered public accounting firm and received certain disclosures from the independent registered public accounting firm regarding their independence. All fees paid during the year to the Partnership’s external auditor were reviewed and pre-approved by the Audit Committee. The Audit Committee has also made available to employees of the Partnership and its subsidiaries a confidential method of communicating financial or accounting concerns to the Audit Committee and periodically reminds the employees of the availability of this communication system to report those concerns.
Conclusion
Based on this review, the Audit Committee recommends to the Partnership’s Board of Directors that the Partnership’s audited financial statements be included in the Partnership’s report on Form 10-K.
J. Thurston Roach, Chairman
John E. Conlin
Douglas E. Norberg
98
Principal Unitholders
As of February 17, 2015, the following persons were known or believed by the Partnership (based solely on statements made in filings with the SEC or other information we believe to be reliable) to be the beneficial owners of more than 5% of the outstanding Partnership units:
|
Name and Address of
Beneficial Owner
|
Number Of Units (1)
|
Percent
of Class
|
|
James H. Dahl
501 Riverside, Suite 902
Jacksonville, FL 32202
Emily T. Andrews
601 Montgomery Street
Suite 2000
San Francisco, CA 94111
|
520,157 (2)
498,203 (3)
|
12.0
11.5
|
|
Pictet Asset Management SA
60 Route des Acacias
1211 Geneva 73
Switzerland
|
310,205 (4)
|
7.2
|
|
Peter T. Pope
133 SW 2nd Ave., Ste. 301
Portland, OR 97204
|
252,762 (5)
|
5.8
|
|
(1)
|
Each beneficial owner has sole voting and investment power unless otherwise indicated. Includes restricted units that are unvested since beneficial owner receives distributions on all such restricted units.
|
|
(2)
|
Mr. Dahl filed a Schedule 13G on February 3, 2014 that indicates he is the direct beneficial owner of 144,827 Partnership units, that he owns another 221,359 units through various trusts over which he retains sole voting and investment power, and that he owns another 153,971 units for which he shares voting and dispositive power.
|
|
(3)
|
Includes 1,090 units owned by her husband, Adolphus Andrews, Jr. as to which she disclaims beneficial ownership. Also includes a total of 60,000 units held by Pope MGP, Inc. and Pope EGP, Inc., as to which she shares voting and investment power.
|
|
(4)
|
Pictet Asset Management filed a Schedule 13G on February 13, 2015 that indicates it has shared voting and investment power over these units.
|
|
(5)
|
Includes (a) 239,317 units held by a limited liability company controlled by Mr. Pope; (b) 4,625 units held directly; and (c) 8,820 units held in trust for one of his children.
|
99
Management
As of February 17, 2015, the beneficial ownership of the Partnership units of (1) the named executives (2) the directors of the Partnership's general partners, (3) the general partners of the Partnership, and (4) the Partnership's officers, directors and general partners as a group, was as follows. **
|
Name
|
Position and Offices
|
Number of Units (1)
|
Percent of Class
|
|
Thomas M. Ringo
|
Vice President and CFO, Pope MGP, Inc. and the Partnership
|
024,415 (2)
|
*
|
|
John E. Conlin
|
Director, Pope MGP, Inc.
|
024,645 (3)
|
*
|
|
Douglas E. Norberg
|
Director, Pope MGP, Inc.
|
059,720 (3)
|
1.4
|
|
Maria M. Pope
Peter T. Pope
|
Director, Pope MGP, Inc.
Director, Pope MGP, Inc. and Pope EGP, Inc.; President, Pope EGP, Inc.
|
80,325 (4)
252,762 (5)
|
1.9
5.8
|
|
J. Thurston Roach
|
Director, Pope MGP, Inc.
|
008,250 (3)
|
*
|
|
Kevin C. Bates
|
Vice President of Timberland Investments
|
19,644
|
*
|
|
Jonathan P. Rose
|
Vice President – Real Estate and President of Olympic Property Group
|
12,642
|
*
|
|
Pope MGP, Inc.
|
Managing General Partner of the Partnership
|
6,000
|
*
|
|
Pope EGP, Inc.
|
Equity General Partner of the Partnership
|
54,000
|
1.2
|
|
All General partners, directors and officers of general partners, and officers of the Partnership as a group (8 individuals and 2 entities)
|
533,613 (6)
|
12.3
|
|
* Less than 1%
** The address of each of these parties is c/o Pope Resources, 19950 Seventh Avenue NE, Suite 200, Poulsbo, WA 98370.
|
(1)
|
Each beneficial owner has sole voting and investment power unless otherwise indicated. Includes restricted units that are unvested since beneficial owner receives distributions on all such restricted units.
|
|
(2)
|
Includes 4,387 unvested restricted units issued to Mr. Ringo.
|
|
(3)
|
Includes 4,500 unvested restricted units.
|
|
(4)
|
Includes 3,000 unvested restricted units and 1,125 units held jointly with Ms. Pope’s spouse for which she disclaims beneficial ownership. Also includes 640 units held in trust for Ms. Pope’s children for which she disclaims beneficial ownership and 60,000 units held by Pope MGP, Inc. and Pope EGP, Inc., as to which she shares investment and voting power.
|
|
(5)
|
Includes (a) 239,317 units held by a limited liability company controlled by Mr. Pope; (b) 4,625 units held directly; and (c) 8,820 units held in trust for one of his children.
|
|
(6)
|
For this computation, the 60,000 units held by Pope MGP, Inc. and Pope EGP, Inc. are excluded from units beneficially owned by Mr. Pope. Mr. Pope and Emily T. Andrews own all of the outstanding stock of Pope MGP, Inc. and Pope EGP, Inc. Includes 42,150 unvested restricted units.
|
100
Equity Compensation Plan Information
The following table presents certain information with respect to the Partnership’s equity compensation plans and awards thereunder on December 31, 2014.
|
|
Number of securities to be issued upon exercise of outstanding options, warrants and rights
|
Weighted-average exercise price of outstanding options, warrants and rights
|
Number of securities remaining available for future issuance under equity compensation plans (excluding securities reflected in column (a))
|
| Plan category | (a) | (b) | (c) |
|
Equity compensation
plans approved by
security holders
|
-
|
N/A
|
921,289
|
|
Equity compensation
plans not approved
by security holders
|
-
|
-
|
-
|
|
Total
|
-
|
N/A
|
921,289
|
The Partnership Agreement provides that it is a complete defense to any challenge to an agreement or transaction between the Partnership and a general partner, or related person, due to a conflict of interest if, after full disclosure of the material facts as to the agreement or transaction and the interest of the general partner or related person, (1) the transaction is authorized, approved or ratified by a majority of the disinterested directors of the General Partner, or (2) the transaction is authorized by partners of record holding more than 50% of the units held by all partners. All of the transactions below were approved, authorized, or ratified by one of these two means.
Allocation of Income. The 1997 amendment to Pope Resources’ Limited Partnership Agreement contained a provision that allowed for profit sharing of the IPMB income between the Partnership’s wholly-owned subsidiary, ORM, Inc. and Pope MGP, Inc., the managing general partner of the Partnership. No payments have been made pursuant to this agreement since 2007. In 2010, the managing general partner terminated its profit sharing opportunity under this program.
General Partner Fee. Pope MGP, Inc. receives an annual fee of $150,000, and reimbursement of administrative costs for its services as managing general partner of the Partnership, as stipulated in the Partnership Agreement.
ORM Timber Fund I, LP (“Fund I”). Pope Resources, A Delaware Limited Partnership owns 19% and Olympic Resource Management LLC owns 1% and is the general partner of Fund I. David L. Nunes, Thomas M. Ringo, Kevin C. Bates invested less than 1% of the capital in Fund I. The majority of this commitment was paid in the fourth quarter of 2006 when Fund I acquired timberland. Fund I sold its tree farms in 2014 and is expected to be liquidated by the end of 2015. Messrs. Nunes, Ringo and Bates are not direct investors in either Fund II or Fund III.
101
Director Independence
With the exception of Thomas M. Ringo, our Chief Executive Officer, and subject to the above discussions regarding the relationships between the Partnership and the Managing General Partner, all of the directors of the Managing General Partner are independent under applicable laws and regulations and the listing standards of NASDAQ.
The following table summarizes fees related to the Partnership’s principal accountants, KPMG LLP, during 2014 and 2013.
|
Description of services
|
2014
|
%
|
2013
|
%
|
||||||||||||
|
Audit (1)
|
$ | 404,900 | 88 | % | $ | 381,300 | 86 | % | ||||||||
|
Audit related (2)
|
57,350 | 12 | % | 60,000 | 14 | % | ||||||||||
|
Tax (3):
|
||||||||||||||||
|
General tax consultation
|
- | - | - | - | ||||||||||||
|
Total
|
$ | 462,250 | 100 | % | $ | 441,300 | 100 | % | ||||||||
|
(1) Fees represent the arranged fees for the years presented, including the annual audit of
|
||||||||||||||||
|
internal controls as mandated under Sarbanes-Oxley section 404, and out-of-pocket expenses
|
||||||||||||||||
|
reimbursed during the years presented.
|
||||||||||||||||
|
(2) Fees represent the arranged fees for the years presented in connection with the audits of Olympic
|
||||||||||||||||
|
Resource Management LLC (2013 only) , ORM Timber Fund I LP, ORM Timber Operating Company II, LLC,
|
||||||||||||||||
|
and ORM Timber Fund III Inc.
|
||||||||||||||||
|
(3) Fees paid for professional services in connection with tax consulting.
|
||||||||||||||||
Prior to hiring KPMG LLP to provide services to the Partnership, anticipated fees and a description of the services are presented to the Audit Committee. The Audit Committee then either agrees to hire KPMG LLP to provide the services or directs management to find a different service provider.
102
PART IV
| Financial Statements Page | Page |
| Reports of Independent Registered Public Accounting Firm | 57 |
| Consolidated Balance Sheets | 59 |
| Consolidated Statements of Comprehensive Income (loss) | 60 |
| Consolidated Statements of Partners’ Capital | 61 |
| Consolidated Statements of Cash Flows | 62 |
| Notes to Consolidated Financial Statements | 64 |
103
Exhibits.
|
No.
|
|
Document
|
|
|
|
|
|
3.1
|
|
Certificate of Limited Partnership. (1)
|
|
3.2
|
|
Limited Partnership Agreement, dated as of November 7, 1985. (1)
|
|
|
|
|
|
3.3
|
|
Amendment to Limited Partnership Agreement dated December 16, 1986. (2)
|
|
|
|
|
|
3.4
|
|
Amendment to Limited Partnership Agreement dated March 14, 1997. (4)
|
|
3.5
|
|
Certificate of Incorporation of Pope MGP, Inc. (1)
|
|
|
|
|
|
3.6
|
|
Amendment to Certificate of Incorporation of Pope MGP, Inc. (3)
|
|
|
|
|
|
3.7
|
|
Bylaws of Pope MGP, Inc. (1)
|
|
|
|
|
|
3.8
|
|
Certificate of Incorporation of Pope EGP, Inc. (1)
|
|
|
|
|
|
3.9
|
|
Amendment to Certificate of Incorporation of Pope EGP, Inc. (3)
|
|
|
|
|
|
3.10
|
|
Bylaws of Pope EGP, Inc. (1)
|
|
3.11
|
Amendment to Limited Partnership Agreement dated October 30, 2007. (9)
|
|
|
3.12
|
Audit Committee Charter. (7)
|
|
|
4.1
|
|
Specimen Depositary Receipt of Registrant. (1)
|
|
|
|
|
|
4.2
|
|
Limited Partnership Agreement dated as of November 7, 1985, as amended December 16, 1986 and March 14, 1997 (see Exhibits 3.2, 3.3 and 3.4).
|
|
4.3
|
1997 Unit Option Plan Summary (5) and Pope Resources 2005 Unit Incentive Plan. (8)
|
|
|
|
|
|
|
9.1
|
|
Shareholders Agreement entered into by and among Pope MGP, Inc., Pope EGP, Inc., Peter T. Pope, Emily T. Andrews, P&T, present and future directors of Pope MGP, Inc. and the Partnership, dated as of November 7, 1985 included as Appendix C to the P&T Notice and Proxy Statement filed with the Securities and Exchange Commission on November 12, 1985, a copy of which was filed as Exhibit 28.1 to the Partnership’s registration on Form 10 identified in footnote (1) below. (1)
|
|
|
|
|
|
10.1
|
|
Transfer and Indemnity Agreement between the Partnership and P&T dated as of December 5, 1985. (1)
|
|
|
|
|
|
10.2
|
|
Environmental Remediation Agreement. (6)
|
|
10.3
|
Form of Change of control agreement. (7)
|
|
|
10.4
|
First Amended and Restated Master Loan Agreement between Pope Resources and Northwest Farm Credit Services, FLCA dated June 10, 2010. (10)
|
|
|
10.5
|
Amendment No. 1 to First Amended and Restated Master Loan Agreement between Pope Resources and Northwest Farm Credit Services, FLCA dated August 6, 2010. (10)
|
|
|
10.6
|
First Amended and Restated Term Note from Pope Resources to Northwest Farm Credit Services, FLCA dated June 10, 2010. (10)
|
104
|
10.7
|
Term Note from Pope Resources to Northwest Farm Credit Services, FLCA dated June 10, 2010. (10)
|
|
|
10.8
|
First Amended and Restated Master Loan Agreement between Pope Resources and Northwest Farm Credit Services, PCA dated June 10, 2010. (10)
|
|
|
10.9
|
Amendment No. 1 to First Amended and Restated Master Loan Agreement between Pope Resources and Northwest Farm Credit Services, PCA dated August 6, 2010. (10)
|
|
|
10.10
|
Revolving Operating Note from Pope Resources to Northwest Farm Credit Services, PCA dated June 10, 2010. (10)
|
|
|
10.11
|
Amendment No. 1 to Revolving Operating Note from Pope Resources to Northwest Farm Credit Services, PCA dated June 15, 2010. (10)
|
|
|
10.12
|
Mortgage, Financing statement and Fixture Filing executed by Pope Resources in favor of Northwest Farm Credit Services, FLCA dated June 10, 2010. (10)
|
|
|
10.13
|
Mortgage, Financing statement and Fixture Filing executed by Pope Resources in favor of Northwest Farm Credit Services, PCA dated June 10, 2010. (10)
|
|
|
10.14
|
Loan Agreement between ORM Timber Operating Company II, LLC and Metropolitan Life Insurance Company dated September 1, 2010. (10)
|
|
|
10.15
|
First Amendment to Loan Agreement between ORM Timber Operating Company II, LLC and Metropolitan Life Insurance Company dated February 7, 2011. (10)
|
|
|
10.16
|
Promissory Note from ORM Timber Operating Company II, LLC to Metropolitan Life Insurance Company dated September 1, 2010. (10)
|
|
|
10.17
|
Guaranty by ORM Timber Fund II, Inc. in favor of Metropolitan Life Insurance Company dated September 1, 2010. (10)
|
|
|
10.18
|
Deed of Trust, Security Agreement, Assignment of Leases and Rents and Fixture Filing between ORM Timber Operating Company II, LLC and Metropolitan Life Insurance Company dated September 1, 2010. (10)
|
|
|
10.19
|
Trust Deed, Security Agreement, Assignment of Leases and Rents and Fixture Filing between
ORM Timber Operating Company II, LLC and Metropolitan Life Insurance Company dated September 1, 2010. (10)
|
|
|
10.20
|
Incentive Compensation Program Summary – revised February 2011. (10)
|
|
|
10.21
|
Revolving Operating Note from Pope Resources to Northwest Farm Credit Services, PCA dated May 30, 2012. (11)
|
|
|
10.22
|
Amendment No. 1 to Revolving Operating Note from Pope Resources to Northwest Farm Credit Services, PCA dated June 30, 2012. (12)
|
|
|
10.23
|
Amendment No. 2 to First Amended and Restated Master Loan Agreement between Pope Resources and Northwest Farm Credit Services, FLCA dated June 30, 2012. (12)
|
|
|
10.24
|
Amendment No. 2 to First Amended and Restated Master Loan Agreement between Pope Resources and Northwest Farm Credit Services, PCA dated November 10, 2012. (12)
|
105
|
10.25
|
Note and Loan Agreement between Pope Resources and Northwest Farm Credit Services, FLCA dated December 20, 2012. (12)
|
|
|
10.26
|
Second Amendment to Loan Agreement between ORM Timber Operating Company II, LLC and Metropolitan Life Insurance Company dated August 15, 2013. (13)
|
|
|
10.27
|
Promissory Note from ORM Timber Operating Company II, LLC to Metropolitan Life Insurance Company dated August 15, 2013. (13)
|
|
|
10.28
|
Amendment and Reaffirmation of Guaranty by ORM Timber Fund II, Inc. in favor of Metropolitan Life Insurance Company dated August 15, 2013. (13)
|
|
|
10.29
|
First Amendment to Deed of Trust, Security Agreement, Assignment of Leases and Rents and Fixture Filing between ORM Timber Operating Company II, LLC and Metropolitan Life Insurance Company dated August 15, 2013. (13)
|
|
|
10.30
|
First Amendment to Trust Deed, Security Agreement, Assignment of Leases and Rents and Fixture Filing between ORM Timber Operating Company II, LLC and Metropolitan Life Insurance Company dated August 15, 2013. (13)
|
|
|
10.31
|
Master Loan Agreement among ORM Timber Fund III (REIT) Inc. and Northwest Farm Credit Services, FLCA and Northwest Farm Credit Services, PCA dated December 2, 2013. (13)
|
|
|
10.32
|
Promissory Note from ORM Timber Fund III (REIT) Inc. to Northwest Farm Credit Services, FLCA dated December 2, 2013. (13)
|
|
|
10.33
|
Mortgage, Assignment of Rents, Security Agreement, Financing Statement and Fixture Filing between ORM Timber Fund III (REIT) Inc. and Northwest Farm Credit Services, FLCA dated December 2, 2013 (Grays Harbor County). (13)
|
|
|
10.34
|
Mortgage, Assignment of Rents, Security Agreement, Financing Statement and Fixture Filing between ORM Timber Fund III (REIT) Inc. and Northwest Farm Credit Services, FLCA dated December 2, 2013 (Pacific County). (13)
|
|
|
10.35
|
Mortgage, Assignment of Rents, Security Agreement, Financing Statement and Fixture Filing between ORM Timber Fund III (REIT) Inc. and Northwest Farm Credit Services, FLCA dated December 2, 2013 (Siskiyou County). (13)
|
|
|
10.36
|
Guaranty Agreement by ORM Timber Fund III LLC and ORM Timber Fund III (Foreign) LLC in favor of Northwest Farm Credit Services, FLCA dated December 2, 2013. (13)
|
|
|
10.37
|
Amendment No. 3 to Master Loan Agreement among ORM Timber Fund III (REIT) Inc. and Northwest Farm Credit Services, FLCA and Northwest Farm Credit Services, PCA dated October 14, 2014. (14)
|
|
|
10.38
|
Promissory Note from ORM Timber Fund III (REIT) Inc. to Northwest Farm Credit Services, FLCA dated October 14, 2014. (14)
|
|
|
10.39
|
Mortgage, Financing Statement and Fixture Filing between ORM Timber Fund III (REIT) Inc. and Northwest Farm Credit Services, PCA dated October 14, 2014. (14)
|
|
|
10.40
|
Mortgage, Financing Statement and Fixture Filing between ORM Timber Fund III (REIT) Inc. and Northwest Farm Credit Services, FLCA dated October 14, 2014. (14)
|
106
|
10.41
|
Guaranty Agreement by ORM Timber Fund III LLC and ORM Timber Fund III (Foreign) LLC in favor of Northwest Farm Credit Services, FLCA dated December 2, 2013. (14)
|
|
|
21.1
|
Significant Subsidiaries. (14)
|
|
|
23.1
|
Consent of Registered Independent Public Accounting Firm. (14)
|
|
|
31.1
|
Certificate of Chief Executive Officer. (14)
|
|
|
31.2
|
Certificate of Chief Financial Officer. (14)
|
|
|
32.1
|
Certification of Chief Executive Officer pursuant to 18 U.S.C. Section 1350, as adopted pursuant to Section 906 of the Sarbanes-Oxley Act of 2002. (14)
|
|
|
32.2
|
Certification of Chief Financial Officer pursuant to 18 U.S.C. Section 1350, as adopted pursuant to Section 906 of the Sarbanes-Oxley Act of 2002. (14)
|
|
|
101.INS
|
XBRL Instance Document
|
|
|
101.SCH
|
XBRL Taxonomy Extension Schema Document
|
|
|
101.CAL
|
XBRL Taxonomy Extension Calculation Linkbase Document
|
|
|
101.DEF
|
XBRL Taxonomy Extension Definition Linkbase Document
|
|
|
101.LAB
|
XBRL Taxonomy Extension Label Linkbase Document
|
|
|
101.PRE
|
XBRL Taxonomy Extension Presentation Linkbase Document
|
107
|
(1)
|
Incorporated by reference from the Partnership’s registration on Form 10 filed under File No. 1-9035 and declared effective on December 5, 1985.
|
|
(2)
|
Incorporated by reference from the Partnership’s annual report on Form 10-K for the fiscal year ended December 31, 1987.
|
|
(3)
|
Incorporated by reference from the Partnership’s annual report on Form 10-K for the fiscal year ended December 31, 1988.
|
|
(4)
|
Incorporated by reference from the Partnership’s Proxy Statement filed on February 14, 1997.
|
|
(5)
|
Incorporated by reference to the Company’s Form S-8 Registration Statement (SEC file number 333-46091) filed with the Commission on February 11, 1998.
|
|
(6)
|
Incorporated by reference to the Partnership’s annual report on Form 10-K for the fiscal year ended December 31, 2002.
|
|
(7)
|
Incorporated by reference to the Partnership’s annual report on Form 10-K for the fiscal year ended December 31, 2005.
|
|
(8)
|
Filed with Form S-8 on September 9, 2005.
|
|
(9)
|
Incorporated by reference to the Partnership’s annual report on Form 10-K for the fiscal year ended December 31, 2007.
|
|
(10)
|
Incorporated by reference to the Partnership’s annual report on Form 10-K for the fiscal year ended December 31, 2010.
|
|
(11)
|
Incorporated by reference to the quarterly Report on Form 10-Q filed by the Registrant August 9, 2012.
|
|
(12)
|
Incorporated by reference to the Partnership’s annual report on Form 10-K for the fiscal year ended December 31, 2012.
|
|
(13)
|
Incorporated by reference to the Partnership’s annual report on Form 10-K for the fiscal year ended December 31, 2013.
|
|
(14)
|
Filed with this annual report for the fiscal year ended December 31, 2014.
|
108
Pursuant to the requirements of Section 13 or 15(d) of the Securities Exchange Act of 1934, the Partnership has duly caused this report to be signed on its behalf by the undersigned, thereunto duly authorized.
| POPE RESOURCES, A Delaware | ||||
| Limited Partnership | ||||
| By POPE MGP, INC. | ||||
| Managing General Partner | ||||
| Date: March 5, 2015 | By /s/ Thomas M. Ringo | |||
| President, Chief Executive Officer and CFO | ||||
Pursuant to the requirements of the Securities Exchange Act of 1934, this report has been signed below by the following persons on behalf of the Partnership and in the capacities and on the date indicated.
|
Date: March 5, 2015
|
By /s/ Thomas M. Ringo
|
|
| Thomas M. Ringo, | ||
|
President, Chief Executive Officer and CFO
(principal executive and financial officer),
Partnership and Pope MGP, Inc.; Director, Pope
MGP, Inc.
|
||
|
Date: March 5, 2015
|
By /s/ Sean M. Tallarico
|
|
| Sean M. Tallarico | ||
|
Controller (principal accounting officer),
Partnership
|
||
| Date: March 5, 2015 |
By /s/ John E. Conlin
|
|
| John E. Conlin | ||
| Director, Pope MGP, Inc. | ||
|
Date: March 5, 2015
|
By /s/ Douglas E. Norberg
|
|
| Douglas E. Norberg | ||
| Director, Pope MGP, Inc. | ||
|
Date: March 5, 2015
|
By /s/ Maria M. Pope
|
|
| Maria M. Pope | ||
| Director, Pope MGP, Inc. | ||
|
Date: March 5, 2015
|
By /s/ J. Thurston Roach
|
|
| J. Thurston Roach | ||
| Director, Pope MGP, Inc. |
109