Attached files
| file | filename |
|---|---|
| 8-K - FORM 8-K - CVR ENERGY INC | y86676e8vk.htm |
Exhibit 99.1

| CVR Energy, Inc. - NYSE : CVI COMPETITIVELY POSITIONED |

| Forward-Looking Statements The following information contains forward-looking statements based on management's current expectations and beliefs, as well as a number of assumptions concerning future events. These statements are subject to risks, uncertainties, assumptions and other important factors. You are cautioned not to put undue reliance on such forward-looking statements because actual results may vary materially from those expressed or implied "as a result of various factors, including but not limited to those set forth under "Risk Factors" in our Annual Report on Form 10-K, Quarterly Reports on Form 10-Q and any other filings CVR Energy, Inc. makes with the Securities and Exchange Commission." CVR Energy, Inc. assumes no obligation to, and expressly disclaims any obligation to, update or revise any forward-looking statements, whether as a result of new information, future events or otherwise. 2 |
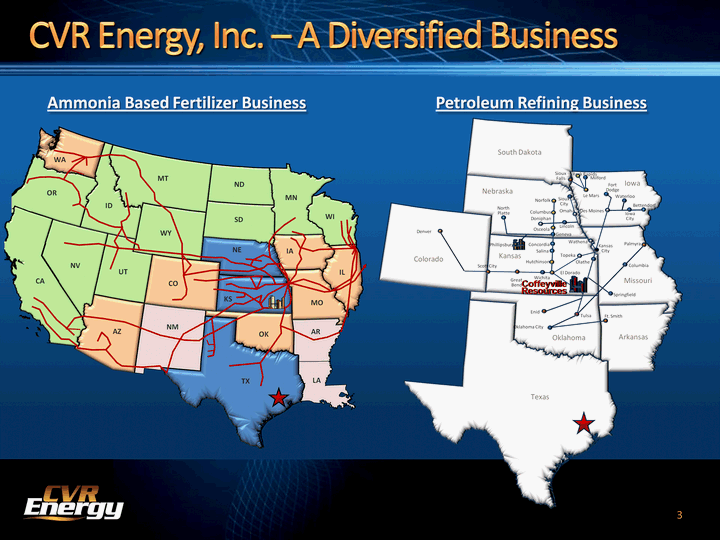
| CVR Energy, Inc. - A Diversified Business 3 WA OR CA NV AZ NM UT CO TX LA AR OK ID MT WY ND SD NE KS MN IA MO WI IL Phillipsburg Kansas City CoffeyvilleResources Springfield Ft. Smith Columbia Palmyra Bettendorf Iowa City Waterloo Des Moines Fort Dodge Milford Sioux Falls Sioux City Omaha Enid Oklahoma City Tulsa North Platte Doniphan Geneva Lincoln Wichita Scott City Great Bend Concordia Salina El Dorado Wathena Olathe Topeka Denver Colorado Arkansas Texas Missouri Iowa Kansas Nebraska Oklahoma Norfolk Columbus Hutchinson Le Mars Osceola Rock Rapids South Dakota Ammonia Based Fertilizer Business Petroleum Refining Business |
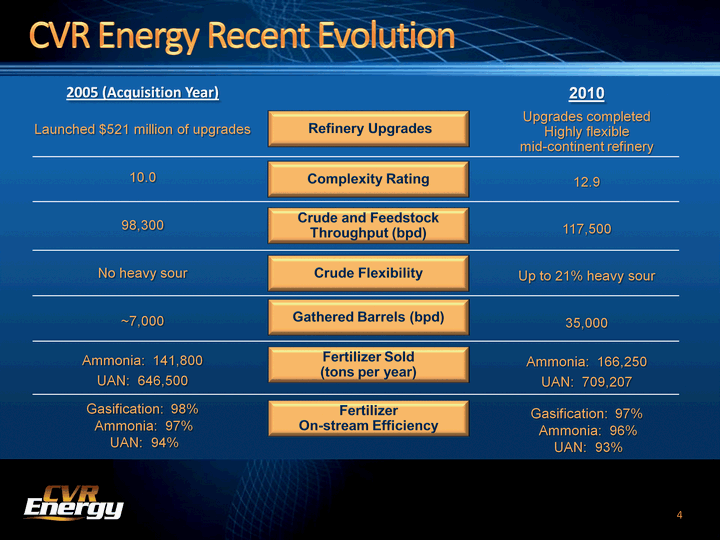
| CVR Energy Recent Evolution Crude and Feedstock Throughput (bpd) Crude Flexibility Complexity Rating Gathered Barrels (bpd) Refinery Upgrades Fertilizer Sold (tons per year) Fertilizer On-stream Efficiency 2005 (Acquisition Year) Launched $521 million of upgrades 10.0 98,300 No heavy sour ~7,000 Ammonia: 141,800 UAN: 646,500 Gasification: 98% Ammonia: 97% UAN: 94% 2010 Upgrades completed Highly flexible mid-continent refinery 12.9 117,500 Up to 21% heavy sour 35,000 Ammonia: 166,250 UAN: 709,207 Gasification: 97% Ammonia: 96% UAN: 93% 4 |

| Upgrading low-cost petroleum coke to high-value nitrogen fertilizers Nitrogen Fertilizer Segment 5 Geographic advantage - located in mid-continentHigh on-stream reliability - dual gasifiersSignificant feedstock cost advantage versus natural gas producers |
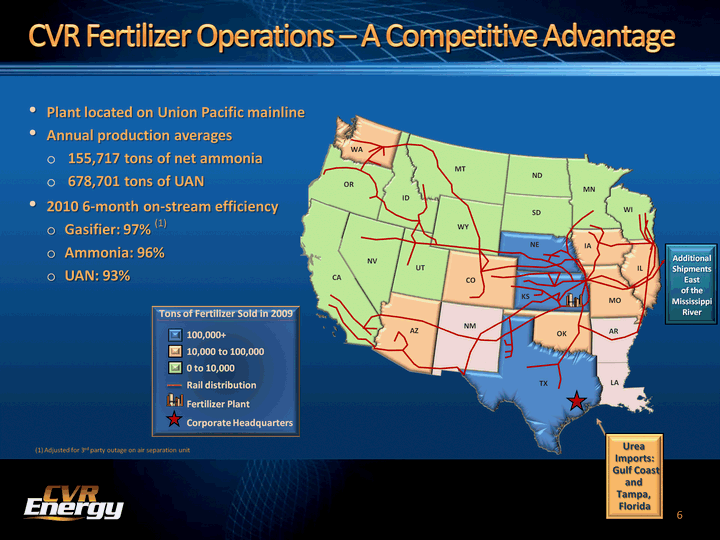
| Tons of Fertilizer Sold in 2009 CVR Fertilizer Operations - A Competitive Advantage Plant located on Union Pacific mainlineAnnual production averages 155,717 tons of net ammonia 678,701 tons of UAN2010 6-month on-stream efficiencyGasifier: 97% (1)Ammonia: 96%UAN: 93% Urea Imports: Gulf Coastand Tampa, Florida 100,000+10,000 to 100,0000 to 10,000Rail distributionFertilizer PlantCorporate Headquarters 6 Additional Shipments East of the Mississippi River WA OR CA NV AZ NM UT CO TX LA AR OK ID MT WY ND SD NE KS MN IA MO WI IL (1) Adjusted for 3rd party outage on air separation unit |
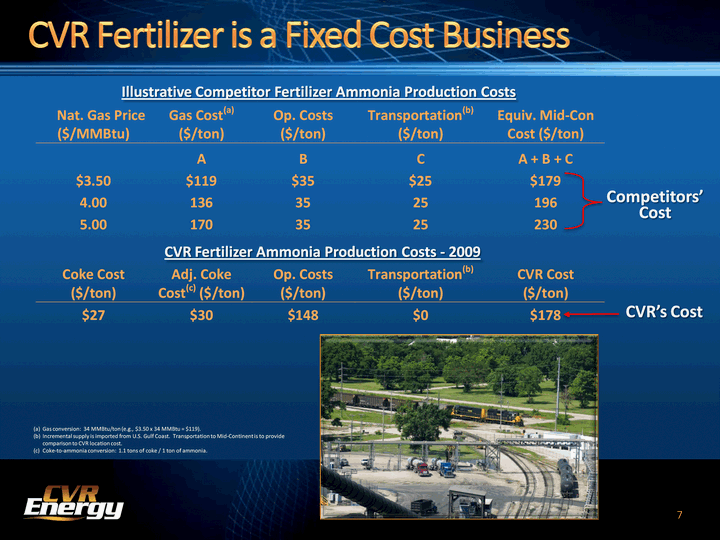
| Gas conversion: 34 MMBtu/ton (e.g., $3.50 x 34 MMBtu = $119).Incremental supply is imported from U.S. Gulf Coast. Transportation to Mid-Continent is to provide comparison to CVR location cost.Coke-to-ammonia conversion: 1.1 tons of coke / 1 ton of ammonia. CVR Fertilizer Ammonia Production Costs - 2009 Illustrative Competitor Fertilizer Ammonia Production Costs CVR's Cost Competitors' Cost CVR Fertilizer is a Fixed Cost Business 7 |

| Nitrogen Fertilizer Plant Overview and Process Third- Party Coke Suppliers CVR Energy's Oil Refinery Ammonia UAN Slag Gasifier (2-Units) Ammonia Synthesis Loop UAN Synthesis Loop Syngas (Hydrogen) Ammonia Coke Coke Hydrogen Hydrogen Oxygen Nitrogen Linde Air Separation Unit Coke gasification technology uses petroleum coke (carbon) 8 |

| Nitrogen Fertilizer Outlook U.S. Planting Projections (CHART) Source: USDA- NASS 9 |

| Nitrogen Fertilizer - An Import Market U. S. Nitrogen Fertilizer Imports Source: FERTECON (CHART) 10 Imports |

| Nitrogen Fertilizer - Production / Inventory (CHART) Source: USDA- NASS U.S. Corn Market Statistics 11 |

| 12 Complex full coking refiner with strategic complementary assets Petroleum Segment Benefit from PADD II Group 3 locationSignificant operational flexibilityFeedstock supported by owned crude gathering and pipeline systems |
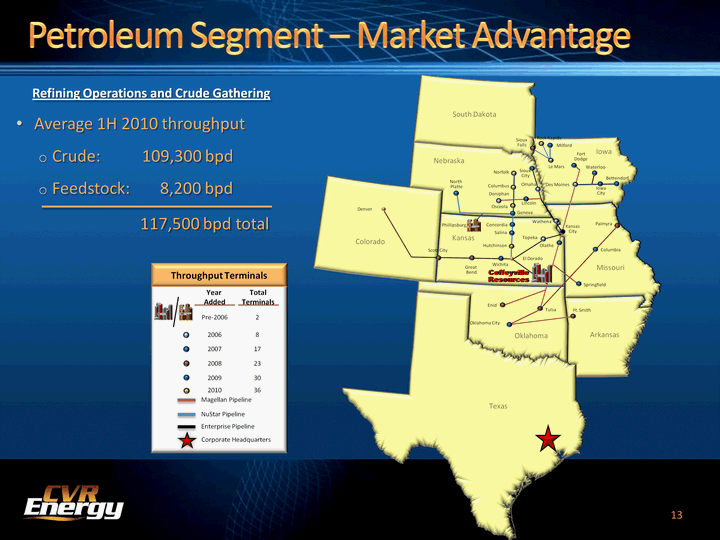
| Petroleum Segment - Market Advantage Refining Operations and Crude Gathering Average 1H 2010 throughput Crude: 109,300 bpdFeedstock: 8,200 bpd 13 Phillipsburg Kansas City CoffeyvilleResources Springfield Ft. Smith Columbia Palmyra Bettendorf Iowa City Waterloo Des Moines Fort Dodge Milford Sioux Falls Sioux City Omaha Enid Oklahoma City Tulsa North Platte Doniphan Geneva Lincoln Wichita Scott City Great Bend Concordia Salina El Dorado Wathena Olathe Topeka Denver Colorado Arkansas Texas Missouri Iowa Kansas Nebraska Oklahoma Norfolk Columbus Hutchinson Le Mars Osceola Rock Rapids South Dakota Throughput Terminals Corporate Headquarters Pre-200620062007200820092010 2817233036 TotalTerminals Magellan PipelineNuStar PipelineEnterprise Pipeline Year Added 117,500 bpd total |
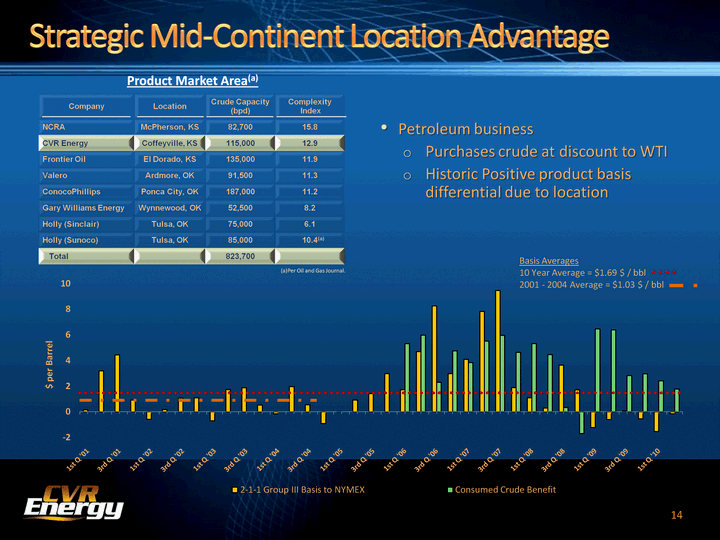
| Strategic Mid-Continent Location Advantage Product Market Area(a) Product Market Area(a) Petroleum businessPurchases crude at discount to WTI Historic Positive product basis differential due to location 14 Per Oil and Gas Journal. (CHART) Basis Averages10 Year Average = $1.69 $ / bbl 2001 - 2004 Average = $1.03 $ / bbl |
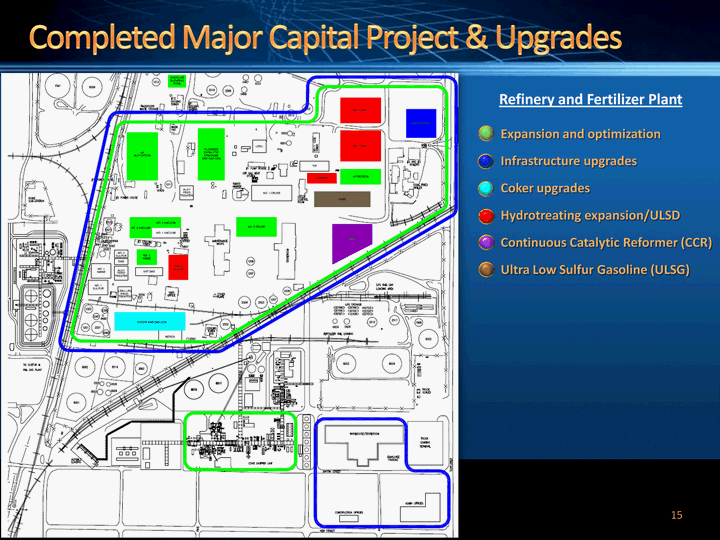
| Completed Major Capital Project & Upgrades Refinery and Fertilizer Plant Expansion and optimizationInfrastructure upgradesCoker upgradesHydrotreating expansion/ULSDContinuous Catalytic Reformer (CCR)Ultra Low Sulfur Gasoline (ULSG) 15 |

| Coffeyville Resources Refining & Marketing and Nitrogen FertilizerCoffeyville Resources Refined Fuel Products / Asphalt TerminalCoffeyville Resources Crude TransportationOffshore Deepwater CrudeForeign CrudeCoffeyville Resources Crude Oil PipelineThird-Party Crude Oil PipelineCVR Energy Headquarters Legend Canada Texas Louisiana Arkansas Oklahoma Missouri Iowa Nebraska South Dakota North Dakota Wyoming Montana Utah Minnesota Illinois Houston Freeport Shidler Kansas City Cushing Bartlesville Corsicana Nederland Sugar Land Houma Midland Broome Humboldt Columbia Des Moines Sioux Falls Sioux City Omaha Oklahoma City Tulsa Topeka Coffeyville Seaway Pipeline Sun Pipeline PlainsPipeline Wichita Falls Colorado Kansas Winfield Valley Center Wichita Plainville Phillipsburg Jayhawk Spearhead Pipeline Denver Salt Lake City Clearbrook Flanagan Enbridge Pipeline New Mexico Bakken Wisconsin Pipeline 16 Crude Storage Owned / Leased Total 3.9 MM bbls Crude Slate Flexibility DJBasin (CHART) |
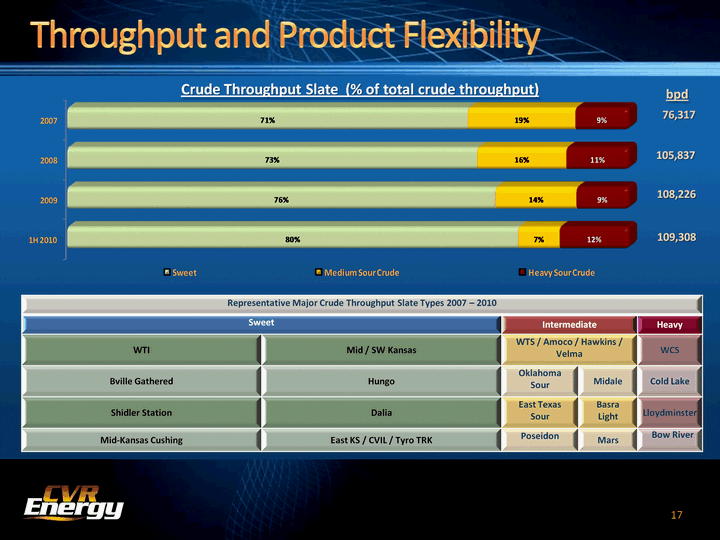
| Throughput and Product Flexibility Crude Throughput Slate (% of total crude throughput) 76,317 105,837 108,226 109,308 Representative Major Crude Throughput Slate Types 2007 - 2010 Representative Major Crude Throughput Slate Types 2007 - 2010 Representative Major Crude Throughput Slate Types 2007 - 2010 Representative Major Crude Throughput Slate Types 2007 - 2010 Representative Major Crude Throughput Slate Types 2007 - 2010 Sweet Sweet Intermediate Intermediate Heavy WTI Mid / SW Kansas WTS / Amoco / Hawkins / Velma WTS / Amoco / Hawkins / Velma WCS Bville Gathered Hungo Oklahoma Sour Midale Cold Lake Shidler Station Dalia East Texas Sour Basra Light Mid-Kansas Cushing East KS / CVIL / Tyro TRK Poseidon Mars 17 bpd Lloydminster Bow River |
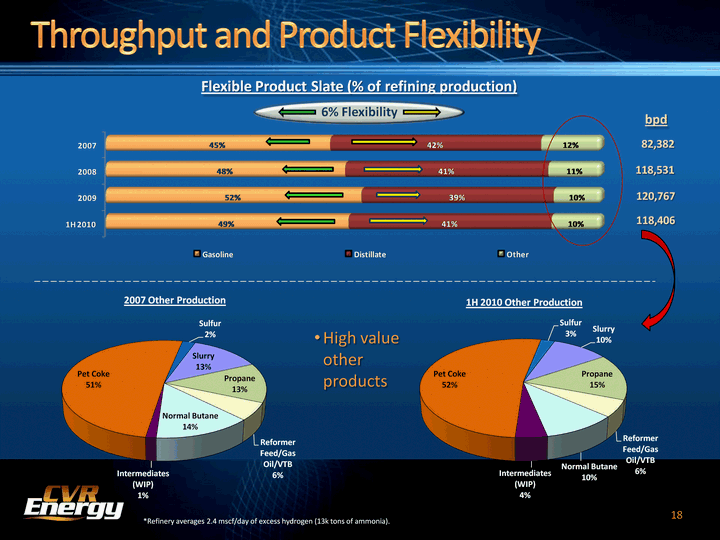
| Flexible Product Slate (% of refining production) 82,382 118,531 120,767 6% Flexibility 118,406 Throughput and Product Flexibility bpd 18 (CHART) (CHART) High value other products *Refinery averages 2.4 mscf/day of excess hydrogen (13k tons of ammonia). |

| Crude Gathering Provides Pricing Advantage Phillipsburg Valley CenterStation Winfield Plainville Hooser Station Broome Station Humboldt Coffeyville East Tank Farm CushingPlains/TEPPCO Bartlesville Shidler 55k 2,700k 660k 160k 75k 200k 10k 40k 20k 20k Jayhawk/Kaw Pipeline system 150 miles 67 miles 23 miles 100 miles Plains Pipeline 20 miles 19 miles 42 miles 1.6 miles 62.5 miles 18 miles ~35,000 bpd gathered Osage Station 19 |
| 20 Driving shareholder value through prudent management of our balance sheet and operational excellence Financial Segment |
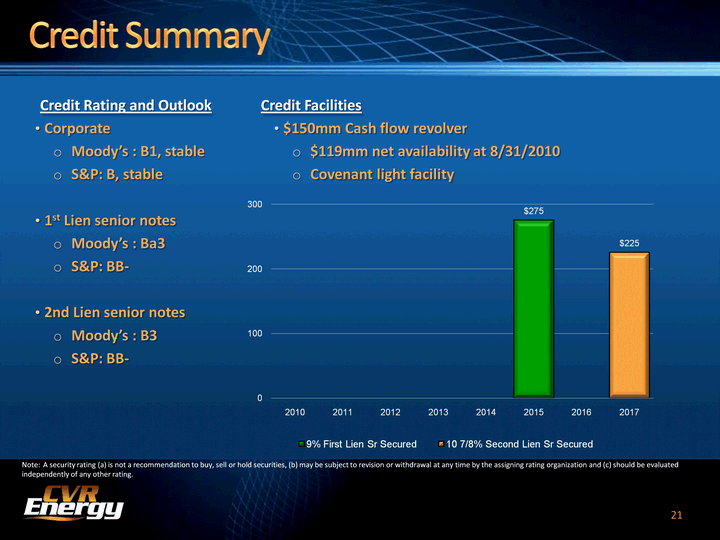
| Credit Summary Credit Rating and OutlookCorporateMoody's : B1, stableS&P: B, stable1st Lien senior notesMoody's : Ba3S&P: BB-2nd Lien senior notesMoody's : B3S&P: BB- Credit Facilities$150mm Cash flow revolver$119mm net availability at 8/31/2010Covenant light facility 21 (CHART) Note: A security rating (a) is not a recommendation to buy, sell or hold securities, (b) may be subject to revision or withdrawal at any time by the assigning rating organization and (c) should be evaluated independently of any other rating. |
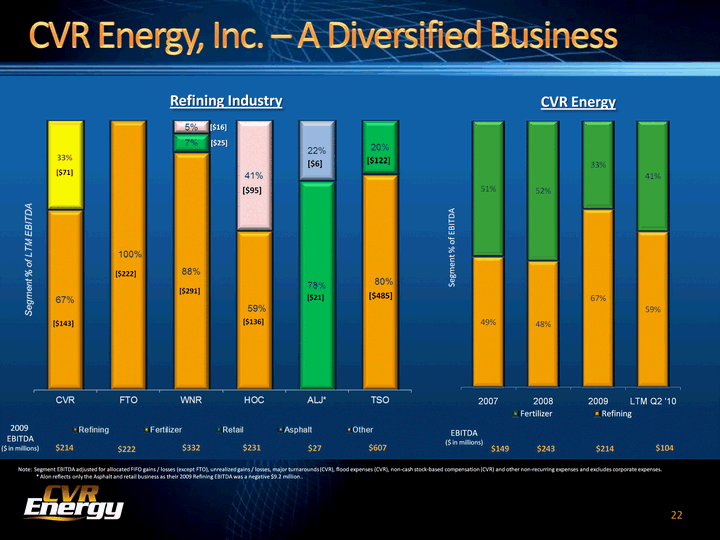
| (CHART) 2009 EBITDA($ in millions) $214 $222 $332 $231 $27 $607 Refining Industry EBITDA($ in millions) $149 $243 $214 $104 CVR Energy CVR Energy, Inc. - A Diversified Business 22 33%[$71] [$143] [$222] [$136] [$95] [$291] [$25] [$485] [$122] [$21] [$6] [$16] Note: Segment EBITDA adjusted for allocated FIFO gains / losses (except FTO), unrealized gains / losses, major turnarounds (CVR), flood expenses (CVR), non-cash stock-based compensation (CVR) and other non-recurring expenses and excludes corporate expenses. * Alon reflects only the Asphalt and retail business as their 2009 Refining EBITDA was a negative $9.2 million.. (CHART) |
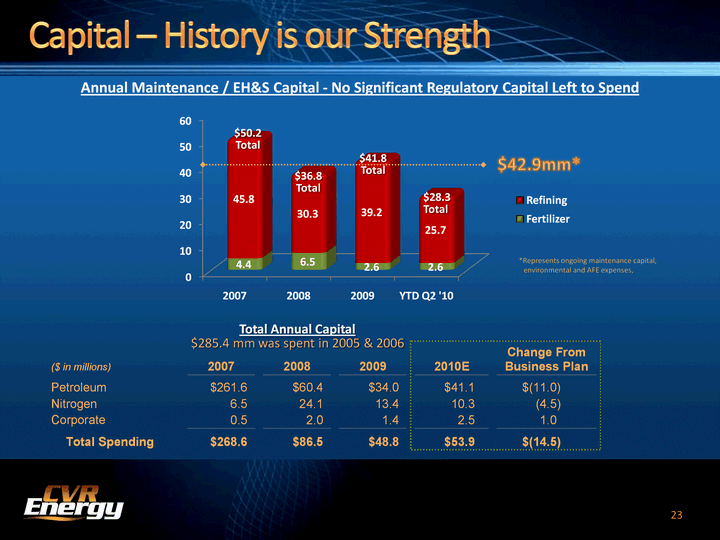
| Capital - History is our Strength 23 Total Annual Capital$285.4 mm was spent in 2005 & 2006 *Represents ongoing maintenance capital, environmental and AFE expenses, Annual Maintenance / EH&S Capital - No Significant Regulatory Capital Left to Spend (CHART) $42.9mm* $41.8Total $50.2Total $36.8Total $28.3Total |
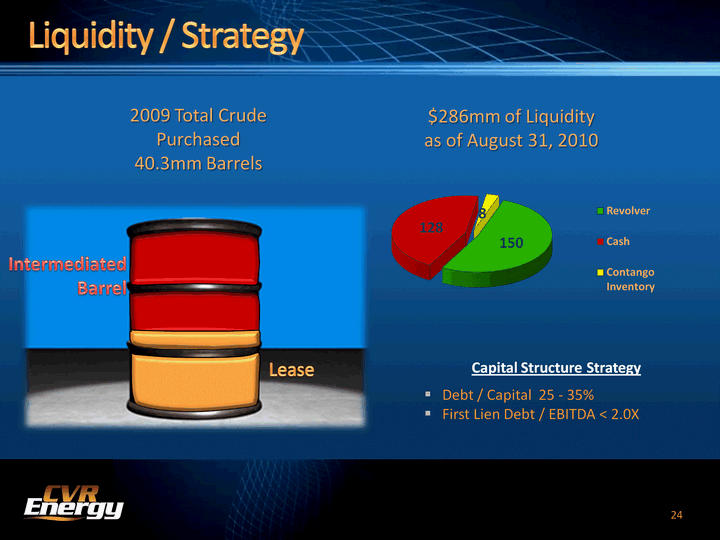
| Liquidity / Strategy IntermediatedBarrel Lease 2009 Total Crude Purchased40.3mm Barrels Capital Structure StrategyDebt / Capital 25 - 35%First Lien Debt / EBITDA < 2.0X $286mm of Liquidityas of August 31, 2010 24 (CHART) |
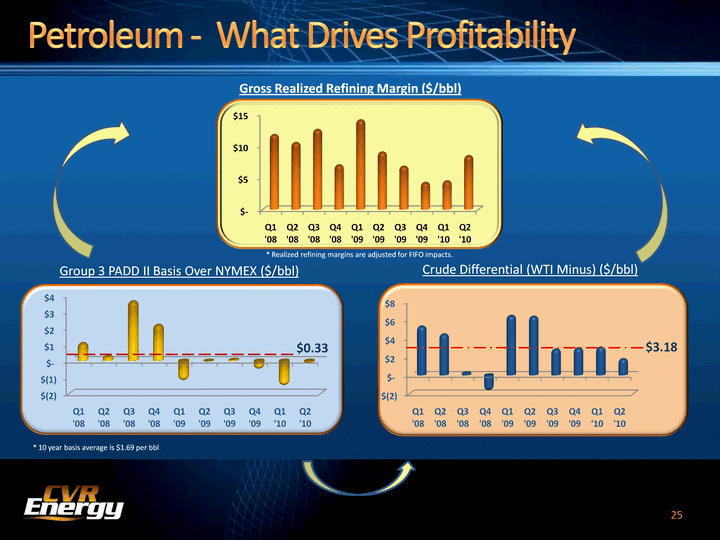
| Petroleum - What Drives Profitability 25 Gross Realized Refining Margin ($/bbl) Group 3 PADD II Basis Over NYMEX ($/bbl) Crude Differential (WTI Minus) ($/bbl) (CHART) $0.33 (CHART) $3.18 * 10 year basis average is $1.69 per bbl (CHART) * Realized refining margins are adjusted for FIFO impacts. |
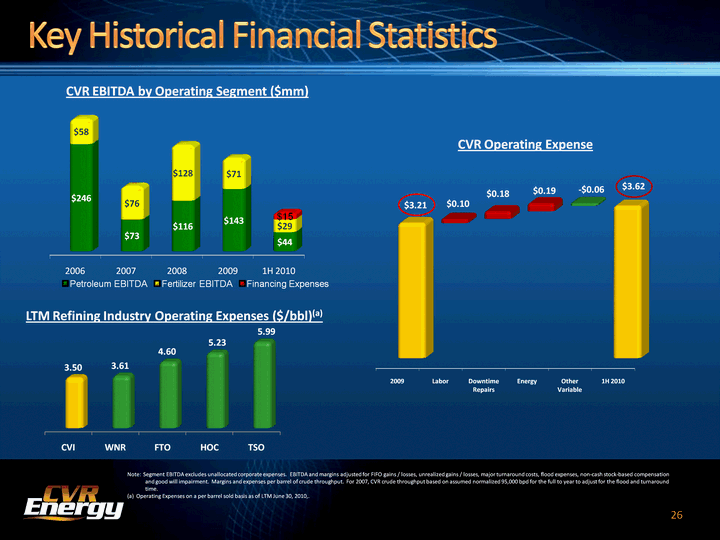
| CVR EBITDA by Operating Segment ($mm) LTM Refining Industry Operating Expenses ($/bbl)(a) CVR Operating Expense Note: Segment EBITDA excludes unallocated corporate expenses. EBITDA and margins adjusted for FIFO gains / losses, unrealized gains / losses, major turnaround costs, flood expenses, non-cash stock-based compensation and good will impairment. Margins and expenses per barrel of crude throughput. For 2007, CVR crude throughput based on assumed normalized 95,000 bpd for the full to year to adjust for the flood and turnaround time.(a) Operating Expenses on a per barrel sold basis as of LTM June 30, 2010,. 26 Key Historical Financial Statistics (CHART) (CHART) (CHART) |
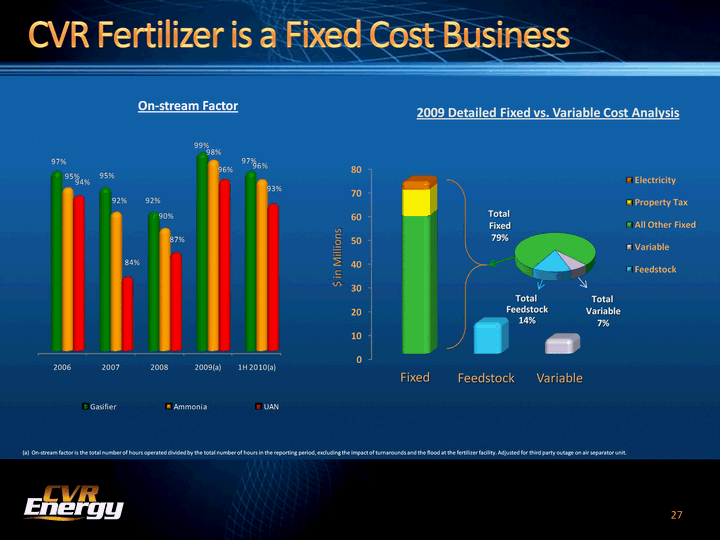
| Total Fixed79% Total Variable7% 2009 Detailed Fixed vs. Variable Cost Analysis CVR Fertilizer is a Fixed Cost Business 27 On-stream factor is the total number of hours operated divided by the total number of hours in the reporting period, excluding the impact of turnarounds and the flood at the fertilizer facility. Adjusted for third party outage on air separator unit. On-stream Factor $ in Millions (CHART) Fixed Feedstock Variable (CHART) Total Feedstock14% |
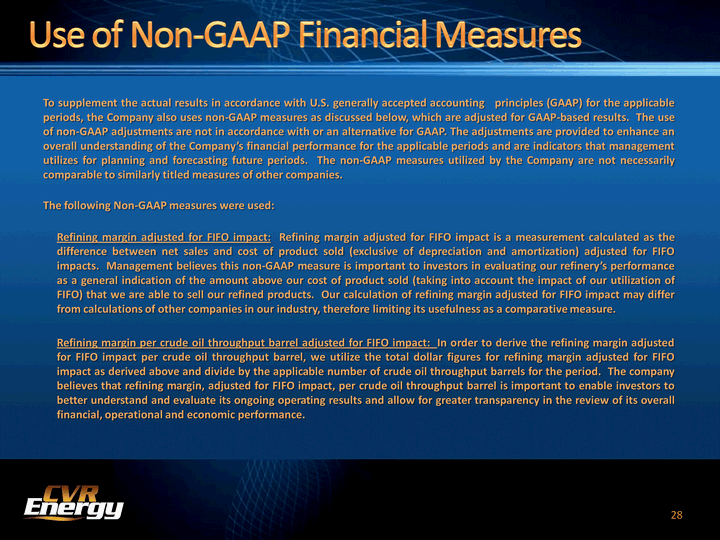
| 28 To supplement the actual results in accordance with U.S. generally accepted accounting principles (GAAP) for the applicable periods, the Company also uses non-GAAP measures as discussed below, which are adjusted for GAAP-based results. The use of non-GAAP adjustments are not in accordance with or an alternative for GAAP. The adjustments are provided to enhance an overall understanding of the Company's financial performance for the applicable periods and are indicators that management utilizes for planning and forecasting future periods. The non-GAAP measures utilized by the Company are not necessarily comparable to similarly titled measures of other companies.The following Non-GAAP measures were used: Refining margin adjusted for FIFO impact: Refining margin adjusted for FIFO impact is a measurement calculated as the difference between net sales and cost of product sold (exclusive of depreciation and amortization) adjusted for FIFO impacts. Management believes this non-GAAP measure is important to investors in evaluating our refinery's performance as a general indication of the amount above our cost of product sold (taking into account the impact of our utilization of FIFO) that we are able to sell our refined products. Our calculation of refining margin adjusted for FIFO impact may differ from calculations of other companies in our industry, therefore limiting its usefulness as a comparative measure.Refining margin per crude oil throughput barrel adjusted for FIFO impact: In order to derive the refining margin adjusted for FIFO impact per crude oil throughput barrel, we utilize the total dollar figures for refining margin adjusted for FIFO impact as derived above and divide by the applicable number of crude oil throughput barrels for the period. The company believes that refining margin, adjusted for FIFO impact, per crude oil throughput barrel is important to enable investors to better understand and evaluate its ongoing operating results and allow for greater transparency in the review of its overall financial, operational and economic performance. Use of Non-GAAP Financial Measures |

| 29 First-in, first-out (FIFO): The Company's basis for determining inventory value on a GAAP basis. Changes in crude oil prices can cause fluctuations in the inventory valuation of our crude oil, work in process and finished goods, thereby resulting in favorable FIFO impacts when crude oil prices increase and unfavorable FIFO impacts when crude oil prices decrease. The FIFO impact is calculated based upon inventory values at the beginning of the accounting period and at the end of the accounting period. In order to derive the FIFO impact per crude oil throughput barrel, we utilize the total FIFO dollar impact and divide by the applicable number of crude oil throughput barrels for the period. EBITDA: EBITDA represents net income before the effect of interest expense, income tax expense (benefit), depreciation and amortization. EFITDA is not a calculation based on GAAP; however, the amounts included in EBITDA are derived from amounts included in the consolidated statement of operations of the Company. EBITDA by operating segment results from operating income by segment adjusted for items that the company believes are needed in order to evaluate results in a more comparative analysis from period to period. These items include depreciation, major scheduled turnaround expenses, net flood expenses, the Company's impact of the accounting for inventory under FIFO, net realized gains / losses on derivative activities, non-cash stock-based compensation, and other non- recurring items and other income (expense). EBITDA, as adjusted, by operating segment is not a recognized term under GAAP and should not be substituted for operating income as a measure of performance but should be utilized as a supplemental measure of financial performance in evaluating our business. Management believes that EBITDA, as adjusted, by operating segment provides relevant and useful information that enables investors to better understand and evaluate our ongoing operating results and allow for greater transparency in the review of our overall financial, operational, and economic performance. |

| 30 Use of Non-GAAP Financial Measures Below is a reconciliation of Refining Margin to Refining Margin Adjusted for the impact of First-In, First-Out (FIFO) accounting |
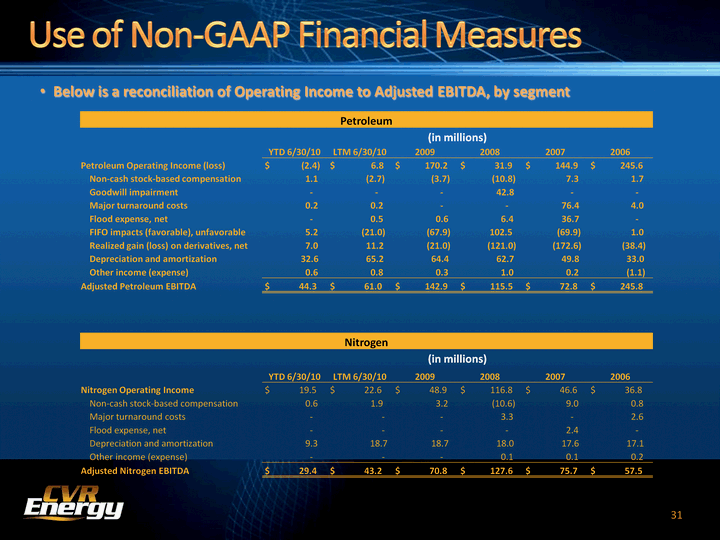
| 31 Use of Non-GAAP Financial Measures Below is a reconciliation of Operating Income to Adjusted EBITDA, by segment Petroleum Petroleum Petroleum Petroleum Petroleum Petroleum Petroleum (in millions) (in millions) (in millions) (in millions) (in millions) (in millions) YTD 6/30/10 LTM 6/30/10 2009 2008 2007 2006 Petroleum Operating Income (loss) $ (2.4) $ 6.8 $ 170.2 $ 31.9 $ 144.9 $ 245.6 Non-cash stock-based compensation 1.1 (2.7) (3.7) (10.8) 7.3 1.7 Goodwill impairment - - - 42.8 - - Major turnaround costs 0.2 0.2 - - 76.4 4.0 Flood expense, net - 0.5 0.6 6.4 36.7 - FIFO impacts (favorable), unfavorable 5.2 (21.0) (67.9) 102.5 (69.9) 1.0 Realized (gain) loss on derivatives, net 7.0 11.2 (21.0) (121.0) (172.6) (38.4) Depreciation and amortization 32.6 65.2 64.4 62.7 49.8 33.0 Other income (expense) 0.6 0.8 0.3 1.0 0.2 (1.1) Adjusted Petroleum EBITDA $ 44.3 $ 61.0 $ 142.9 $ 115.5 $ 72.8 $ 245.8 Nitrogen Nitrogen Nitrogen Nitrogen Nitrogen Nitrogen Nitrogen (in millions) (in millions) (in millions) (in millions) (in millions) (in millions) YTD 6/30/10 LTM 6/30/10 2009 2008 2007 2006 Nitrogen Operating Income $ 19.5 $ 22.6 $ 48.9 $ 116.8 $ 46.6 $ 36.8 Non-cash stock-based compensation 0.6 1.9 3.2 (10.6) 9.0 0.8 Major turnaround costs - - - 3.3 - 2.6 Flood expense, net - - - - 2.4 - Depreciation and amortization 9.3 18.7 18.7 18.0 17.6 17.1 Other income (expense) - - - 0.1 0.1 0.2 Adjusted Nitrogen EBITDA $ 29.4 $ 43.2 $ 70.8 $ 127.6 $ 75.7 $ 57.5 |
