Attached files
| file | filename |
|---|---|
| 8-K - CHINA JO-JO DRUGSTORES, INC. 8-K - CHINA JO-JO DRUGSTORES, INC. | a6425710.htm |
Exhibit 99.1
China Jo-Jo Drugstores, Inc. September 13, 2010
Statements in this presentation may be "forward-looking statements" within the meaning of federal securities laws. The matters discussed herein that are forward-looking statements are based on current management expectations that involve risks and uncertainties that may result in such expectations not being realized. Forward-looking statements involve risks and uncertainties that may cause actual results, performance or financial condition to be materially different from the expectations of future results, performance or financial condition expressed or implied in any forward-looking statements. Such risks include, but are not limited to, competition in the retail drugstore industry, outpatient medical services industry, changes to management or key personnel, risks associated with conducting business in China, the Company’s ability to expand into markets outside of Hangzhou into other parts of Zhejiang province, and other risks detailed in the Company’s filings with the Securities and Exchange Commission. Actual outcomes and results may differ materially from what is expressed or forecasted in such forward-looking statements due to numerous potential risks and uncertainties. Forward-looking statements made during this presentation speak only as of the date on which they are made, and we do not undertake any obligation to update any forward-looking statement to reflect events or circumstances after the date of this presentation. Because forward-looking statements are subject to risks and uncertainties, we caution you not to place undue reliance on any forward-looking statements. All written or oral forward-looking statements by the Company or persons acting on its behalf are qualified by these cautionary statements. Safe Harbor Statement 1
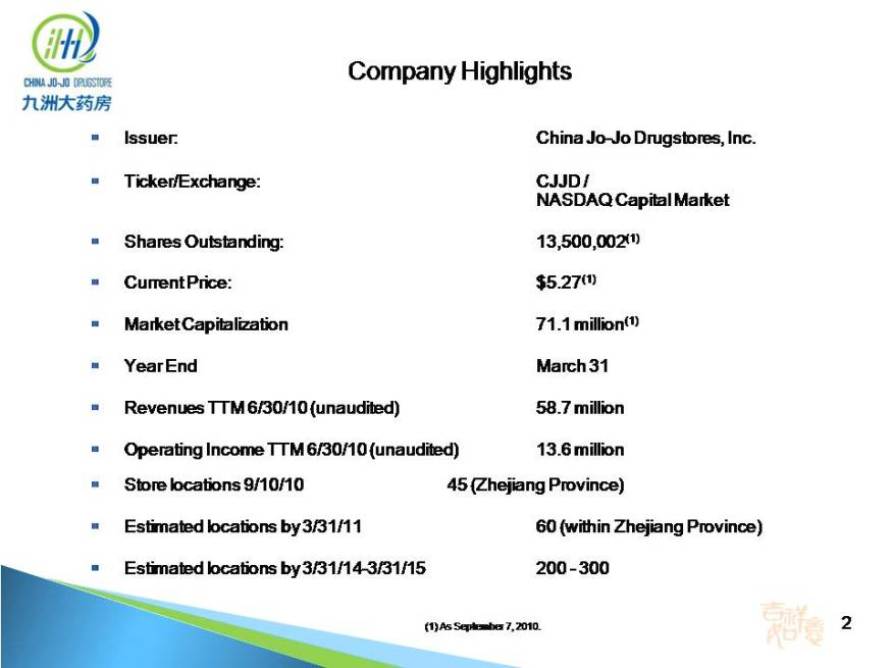
Issuer: China Jo-Jo Drugstores, Inc. Ticker/Exchange: CJJD / NASDAQ Capital Market Shares Outstanding: 13,500,002(1) Current Price: $5.27(1) Market Capitalization 71.1 million(1) Year End March 31 Revenues TTM 6/30/10 (unaudited) 58.7 million Operating Income TTM 6/30/10 (unaudited) 13.6 million Store locations 9/10/10 45 (Zhejiang Province) Estimated locations by 3/31/11 60 (within Zhejiang Province) Estimated locations by 3/31/14-3/31/15 200 – 300 Company Highlights 2 (1) As September 7, 2010.
3 Company Overview
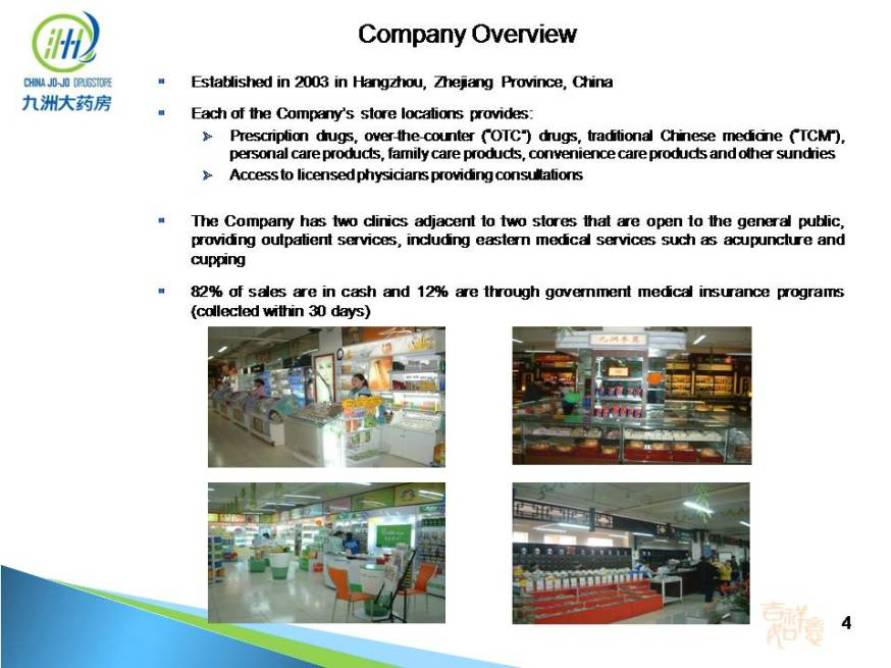
Established in 2003 in Hangzhou, Zhejiang Province, China Each of the Company’s store locations provides: Prescription drugs, over-the-counter (“OTC”) drugs, traditional Chinese medicine (“TCM”), personal care products, family care products, convenience care products and other sundries Access to licensed physicians providing consultations The Company has two clinics adjacent to two stores that are open to the general public, providing outpatient services, including eastern medical services such as acupuncture and cupping 82% of sales are in cash and 12% are through government medical insurance programs (collected within 30 days) Company Overview 4
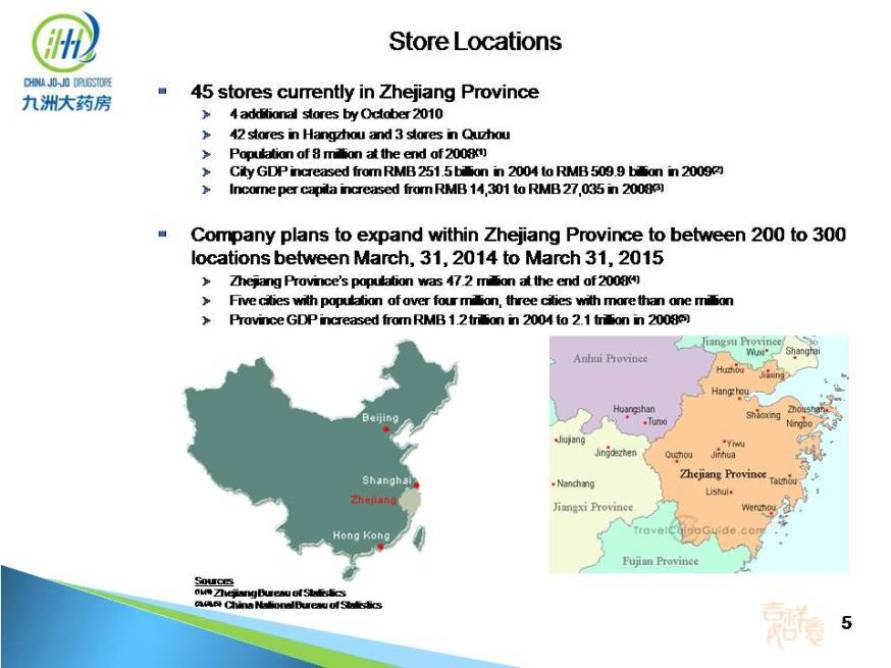
45 stores currently in Zhejiang Province 4 additional stores by October 2010 42 stores in Hangzhou and 3 stores in Quzhou Population of 8 million at the end of 2008(1) City GDP increased from RMB 251.5 billion in 2004 to RMB 509.9 billion in 2009(2) Income per capita increased from RMB 14,301 to RMB 27,035 in 2008(3) Company plans to expand within Zhejiang Province to between 200 to 300 locations between March, 31, 2014 to March 31, 2015 Zhejiang Province’s population was 47.2 million at the end of 2008(4) Five cities with population of over four million, three cities with more than one million Province GDP increased from RMB 1.2 trillion in 2004 to 2.1 trillion in 2008(5) Store Locations 5 Sources (1),(4) Zhejiang Bureau of Statistics (2),(3),(5) China National Bureau of Statistics 5
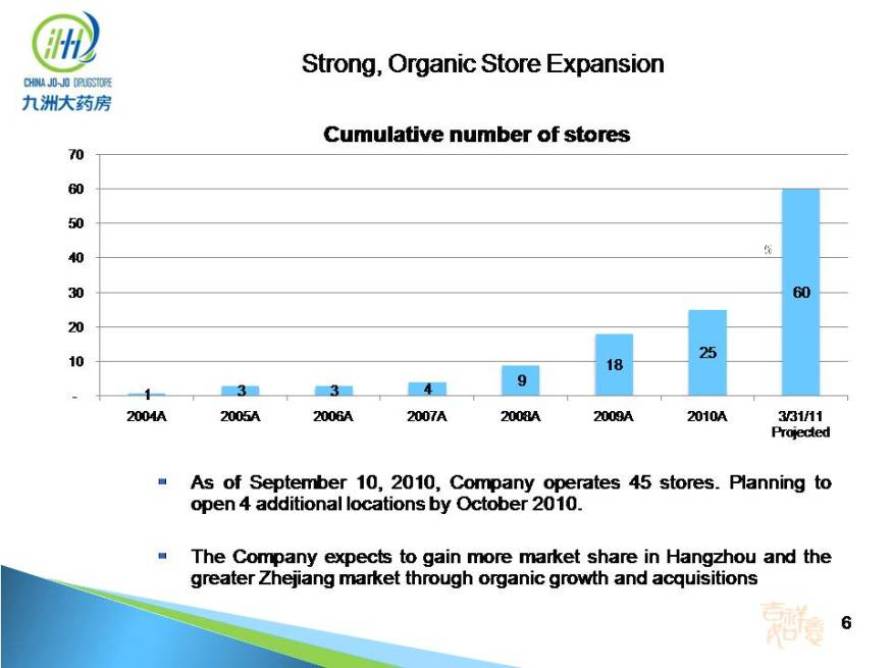
Strong, Organic Store Expansion 6 As of September 10, 2010, Company operates 45 stores. Planning to open 4 additional locations by October 2010. The Company expects to gain more market share in Hangzhou and the greater Zhejiang market through organic growth and acquisitions 10 20 30 40 50 60 70 2004A 2005A 2006A 2007A 2008A 2009A 2010A 3/31/11 Projected Cumulative number of stores 1 3 3 4 9 18 25 60
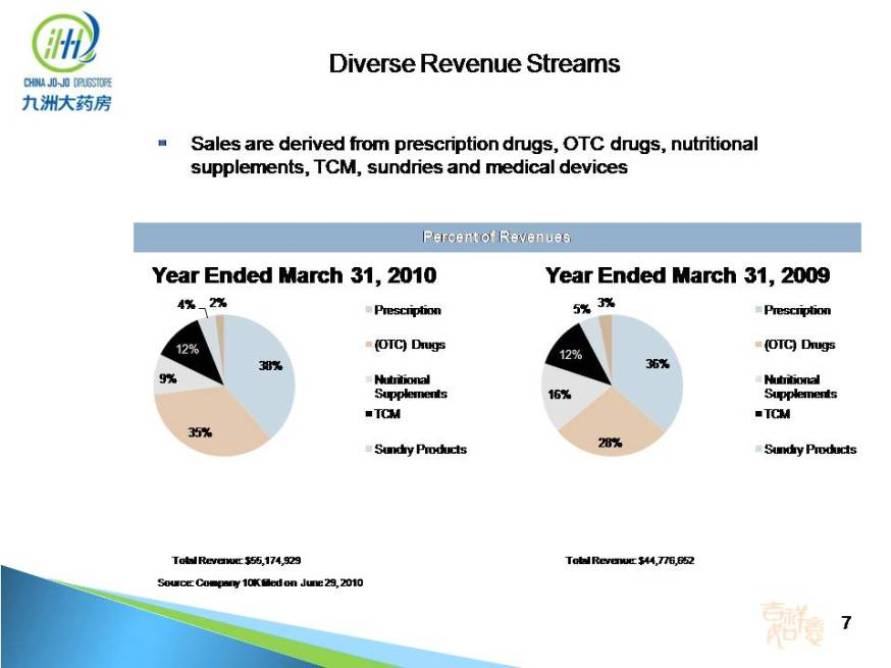
Sales are derived from prescription drugs, OTC drugs, nutritional supplements, TCM, sundries and medical devices Diverse Revenue Streams 7 Percent of Revenues Total Revenue: $55,174,929 Total Revenue: $44,776,652 Source: Company 10K filed on June 29, 2010 Year Ended March 31, 2010 Year Ended March 31, 2009 35% 38% 2% 4% 12% 9% Prescription (OTC) Drugs Nutritional Supplements TCM Sundry Products 28% 36% 3% 5% 12% 16%
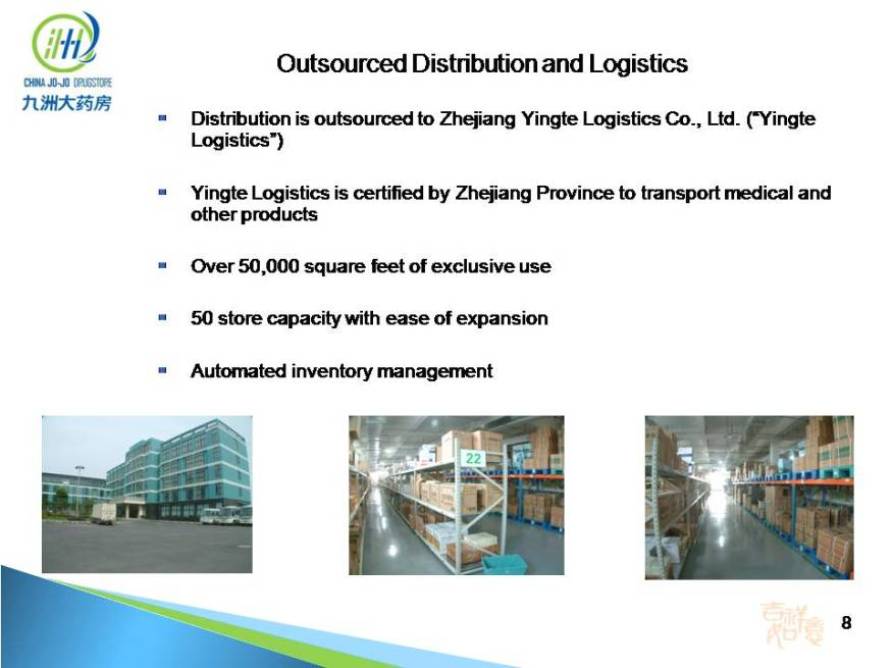
8 Distribution is outsourced to Zhejiang Yingte Logistics Co., Ltd. (“Yingte Logistics”) Yingte Logistics is certified by Zhejiang Province to transport medical and other products Over 50,000 square feet of exclusive use 50 store capacity with ease of expansion Automated inventory management Outsourced Distribution and Logistics
In April 2010, Company was issued first license to operate an online drugstore in Zhejiang Province Early stage Branding / Marketing opportunity Future revenue stream www.jiuzhou-drugstore.com/about.aspx (internet drugstore) Online Drugstore 9
Hangzhou is home to approximately 1,000 drugstores, the majority of which are independently operated A handful of retail chains exist, including: China Nepstar Chain Drugstore (NYSE: NPD): • Nationwide drugstore chain with 195+branches in Hangzhou • Store size: 60 – 150 square meters • Roll up model • Sells private-label and branded products Lao Bai Xing Grand Pharmacy: • Nationwide chain with 8 branches located within Hangzhou and approximately 30 in Zhejiang Province • Sells private-label and branded products TianTianHao Grand Pharmacy: • Approximately 30 stores in Hangzhou • Sells generic brands The fragmented market provides ample acquisition and growth opportunities Competitive Landscape in Hangzhou 10
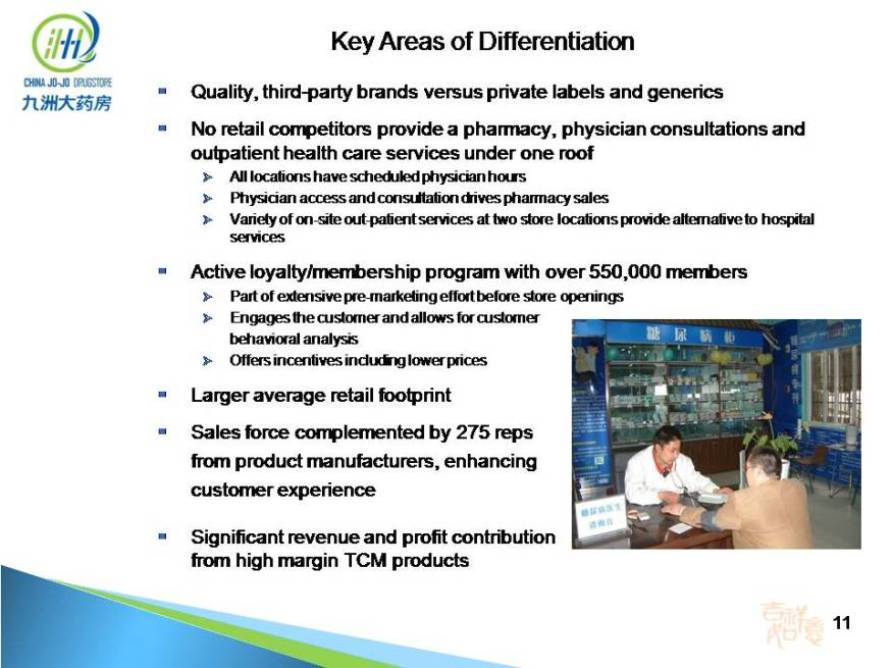
Quality, third-party brands versus private labels and generics No retail competitors provide a pharmacy, physician consultations and outpatient health care services under one roof All locations have scheduled physician hours Physician access and consultation drives pharmacy sales Variety of on-site out-patient services at two store locations provide alternative to hospital services Active loyalty/membership program with over 550,000 members Part of extensive pre-marketing effort before store openings Engages the customer and allows for customer behavioral analysis Offers incentives including lower prices Larger average retail footprint Sales force complemented by 275 reps from product manufacturers, enhancing customer experience Significant revenue and profit contribution from high margin TCM products Key Areas of Differentiation 11
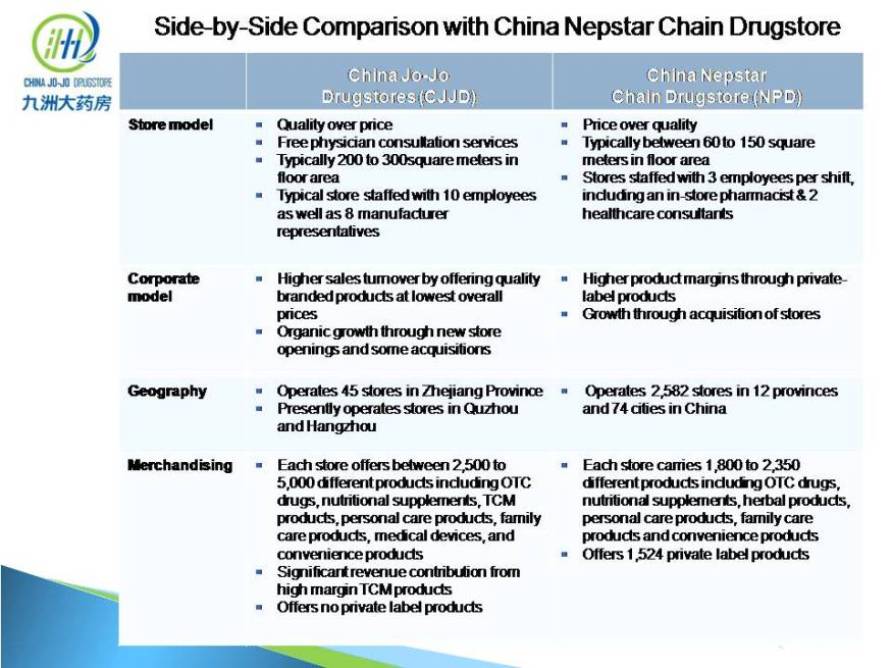
Side-by-Side Comparison with China Nepstar Chain Drugstore 12 Comparison with China Nepstar Chain Drugstore Store model Quality over price Free physician consultation services Typically 200 to 300 square meters in floor area Price over quality Typically between 60 to 150 square meters in floor area Stores staffed with 3 employees per shift, including an in-store pharmacist & 2 healthcare consultants Typical store staffed with 10 employees as well as 8 manufacturer representatives Corporate Higher sales turnover by offering quality Higher product margins through private model branded products at lowest overall prices Organic growth through new store openings and some acquisitions label products Growth through acquisition of stores Geography Operates 45 stores in Zhejiang Province Presently operates stores in Quzhou and Hangzhou Operates 2,582 stores in 12 provinces and 74 cities in China Merchandising Each store offers between 2,500 to Each store carries 1,800 to 2,350 5,000 different products including OTC drugs, nutritional supplements, TCM products, personal care products, family care products, medical devices, and convenience products Significant revenue different products including OTC drugs, nutritional supplements, herbal products, personal care products, family care products and convenience products Offers 1,524 private label products 12 contribution from high margin TCM products Offers no private label products China Jo-Jo Drugstores (CJJD) China Nepstar Chain Drugstore (NPD)
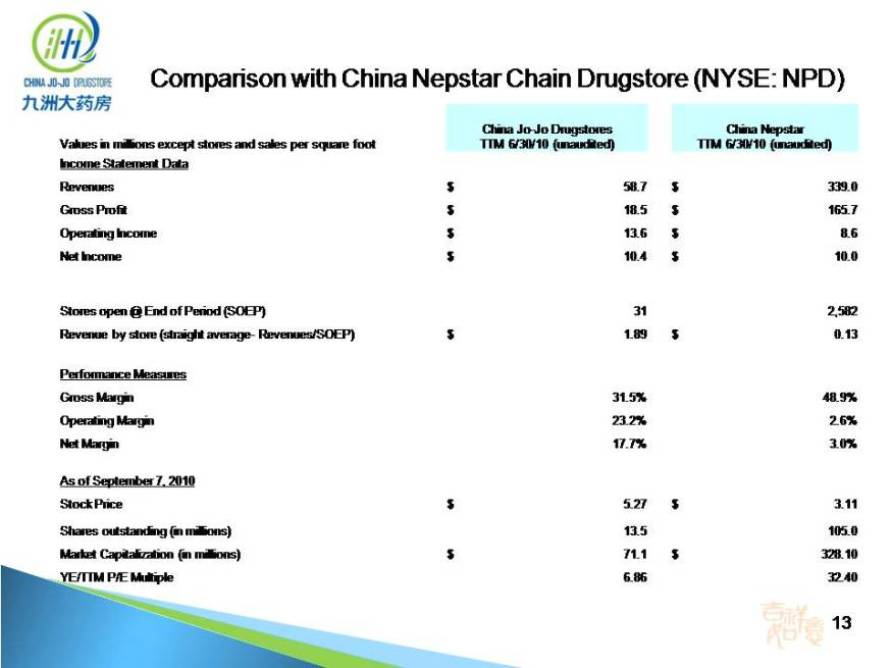
Comparison with China Nepstar Chain Drugstore (NYSE: NPD) 13 China Jo-Jo Drugstores TTM 6/30/10 (unaudited) China Nepstar Values in millions except stores and sales per square foot TTM 6/30/10 (unaudited) Income Statement Data Revenues $ 58.7 $ 339.0 Gross Profit $ 18.5 $ 165.7 Operating Income $ 13.6 $ 8.6 Net Income $ 10.4 $ 10.0 Stores open @ End of Period (SOEP) 31 2,582 Revenue by store (straight average- Revenues/SOEP) $ 1.89 $ 0.13 Performance Measures Gross Margin 31.5% 48.9% Operating Margin 23.2% 2.6% Net Margin 17.7% 3.0% As of September 7, 2010 Stock Price $ 5.27 $ 3.11 Shares outstanding (in millions) 13.5 105.0 Market Capitalization (in millions) $ 71.1 $ 328.10 YE/TTM P/E Multiple 6.86 32.40
14 Financial Overview
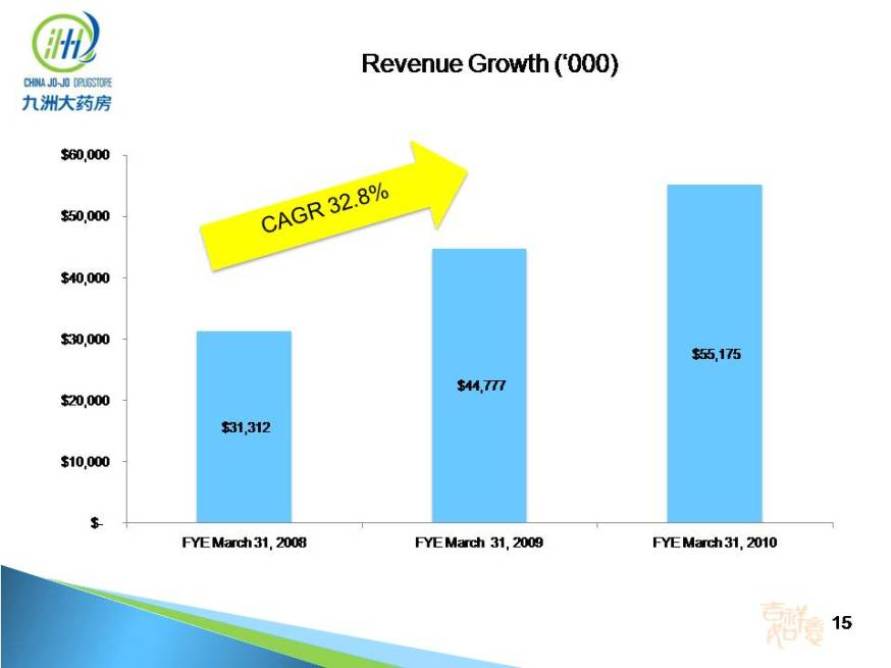
Revenue Growth (‘000) 15 Revenue Growth (‘000) $60,000 $40,000 $50,000 $44 777 $55,175 $30,000 $31,312 $10,000 $20,000 $- FYE March 31, 2008 FYE March 31, 2009 FYE March 31, 2010 CAGR 32.8%
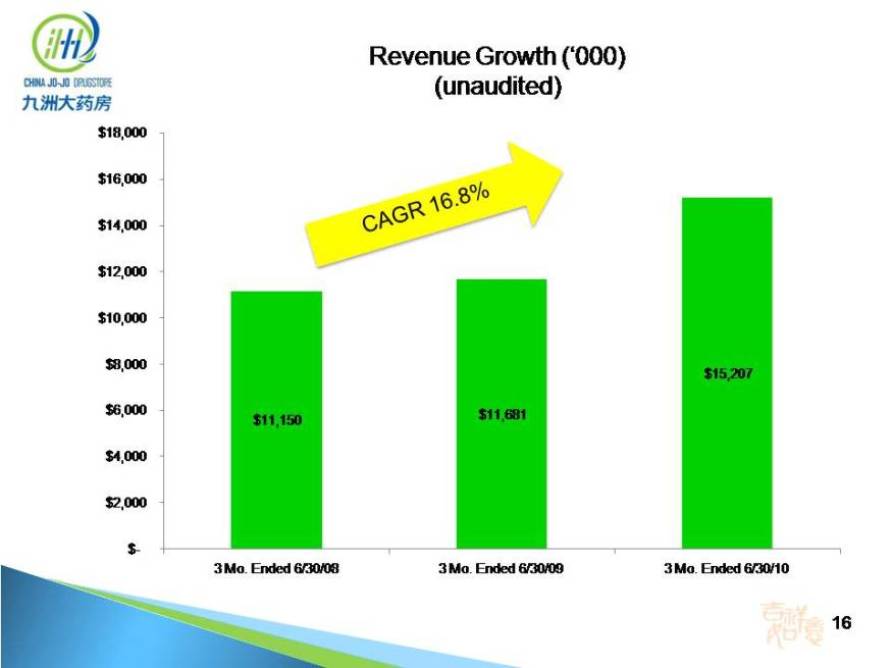
Revenue Growth (‘000) (unaudited) 16 Revenue Growth (‘000) (unaudited) $16,000 $18,000 $12,000 $14,000 $15,207 $8,000 $10,000 $11,150 $11,681 $4,000 $6,000 $-$2,000 3 Mo. Ended 6/30/08 3 Mo. Ended 6/30/09 3 Mo. Ended 6/30/10 CAGR 16.8%
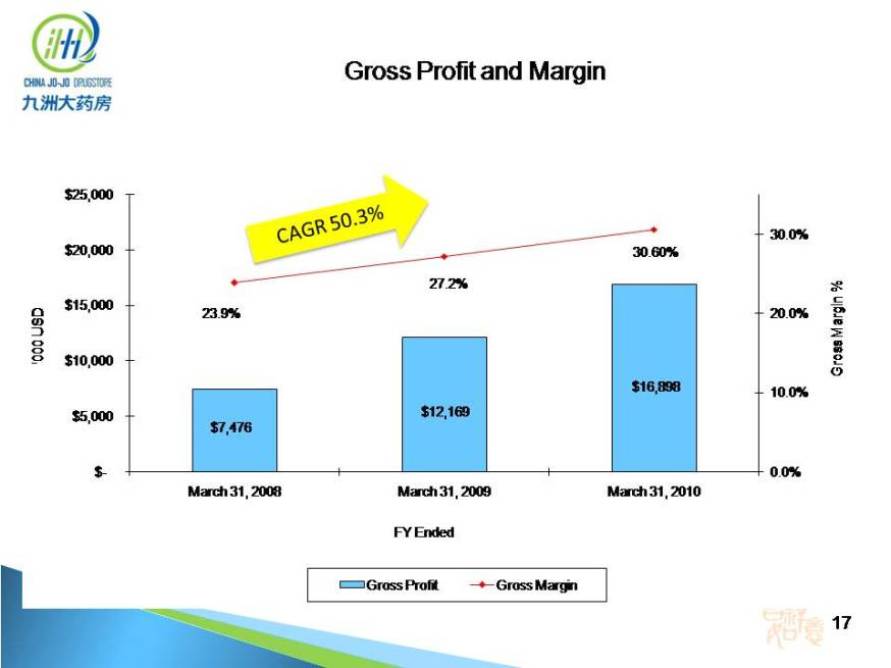
Gross Profit and Margin 17 $25 000 27.2% 30.60% 30.0% $20,000 % $16,898 23.9% 27.2% 20.0% $10,000 $15,000 Gross Margin '000 USD $7,476 $12,169 0.0% 10.0% $- $5,000 $ March 31, 2008 March 31, 2009 March 31, 2010 FY Ended ‘000 USD Gross Profit Gross Margin CAGR 50.3%
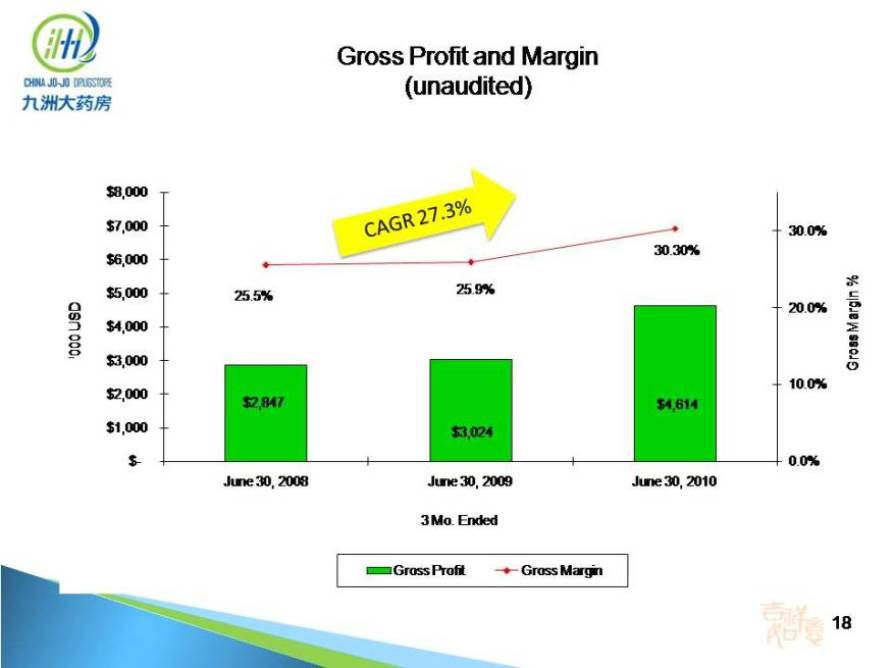
Gross Profit and Margin (unaudited) 18 $8,000 25.9% 30.30% 30.0% $6,000 $7,000 % 25.5% 25.9% 10 0% 20.0% $3,000 $4,000 $5,000 Gross Margin '000 USD $2,847 $3,024 $4,614 0.0% 10.0% $- $1,000 $2,000 June 30, 2008 June 30, 2009 June 30, 2010 3 Mo. Ended Gross Profit Gross Margin CAGR 27.3%

Operating Income and Margin 19 $20,000 25.0% 21.2% 23.10% 20.0% 25.0% $15,000 % 18.4% 10.0% 15.0% $10,000 Operating Margin '000 USD $5,753 $9,497 $12,758 0.0% 5.0% $- $5,000 March 31, 2008 March 31, 2009 March 31, 2010 FY Ended Operating Income Operating Margin CAGR 48.9%
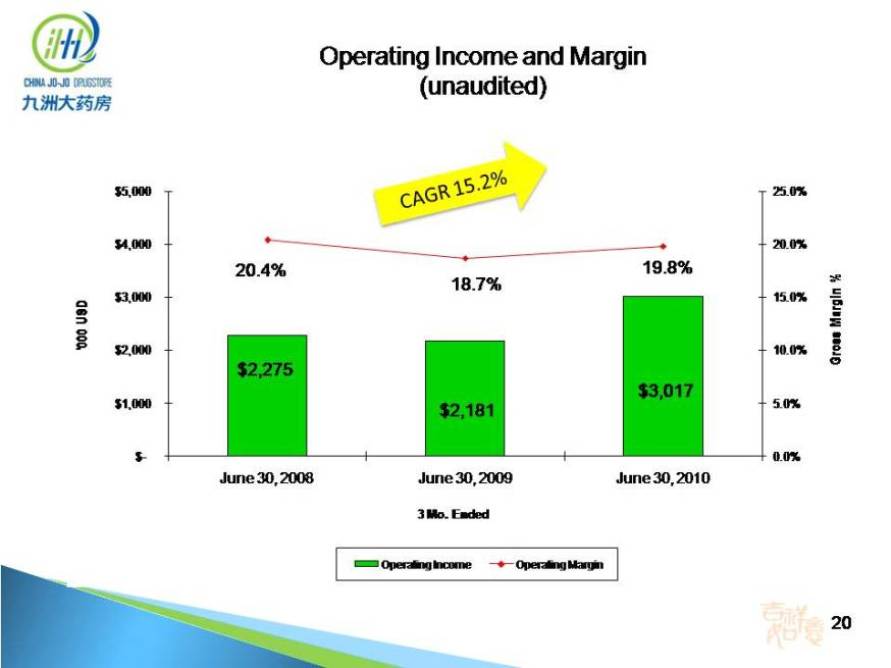
Operating Income and Margin (unaudited) 20 Operating Income and Margin (unaudited) $5,000 20.4% 18.7%19.8% 20.0% 25.0% $4,000 % $2,275 10.0% 15.0% $2,000 $3,000 Gross Margin '000 USD$2,181 $3,017 0.0% 5.0% $- $1,000 June 30, 2008 June 30, 2009 June 30, 2010 3 Mo. Ended CAGR 15.2% Operating Income Operating Margin
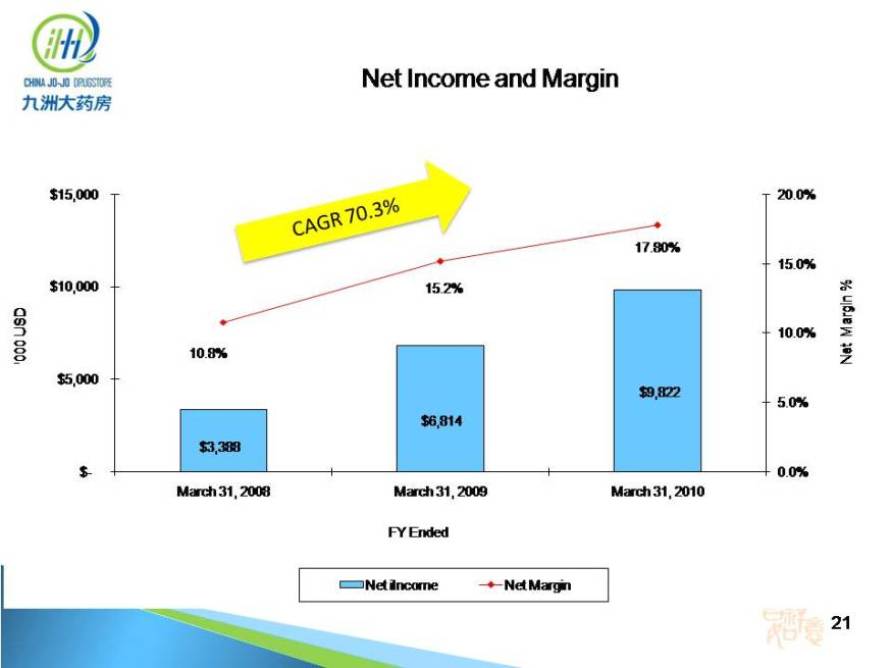
Net Income and Margin 21 $15,000 20.0%15.2% 17.80% 15.0% 20.0% $10 000 % 10.8% 15.2% 10.0% $5,000 $10,000 Net Margin '000 USD $3,388 $6,814 $9,822 0.0% 5.0% $- $5,000 $ March 31, 2008 March 31, 2009 March 31, 2010 FY Ended CAGR 70.3% Net Income Net Margin
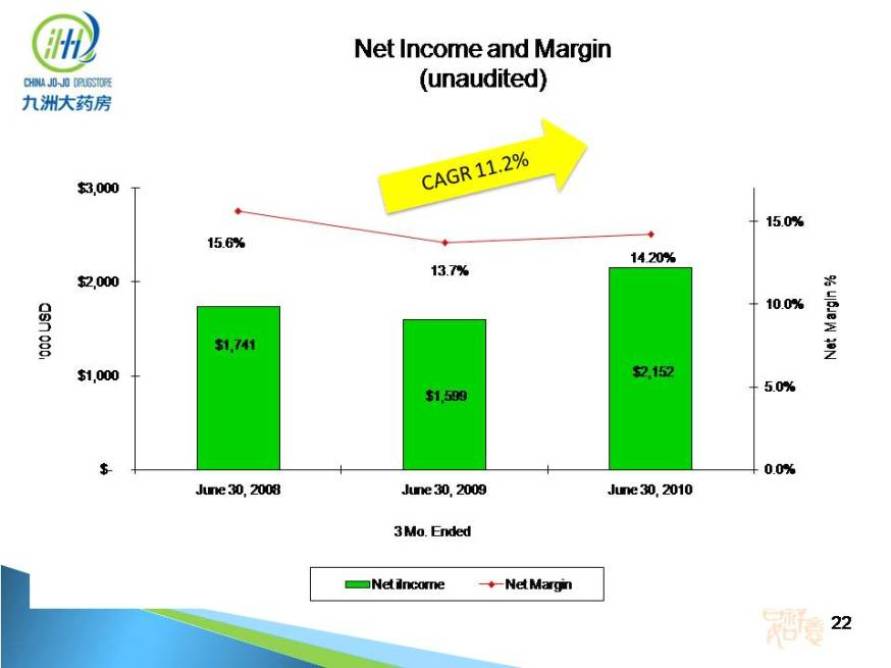
Net Income and Margin (unaudited) 22 $3,000 15.6% 13.7% 14.20% 15.0% $2,000 $3,000 % $1,741 $2,152 10.0% $ 1,000 Net Margin '000 USD $1,599 0.0% 5.0% $- June 30, 2008 June 30, 2009 June 30, 2010 3 Mo. Ended Net Income Net Margin CAGR 11.2%
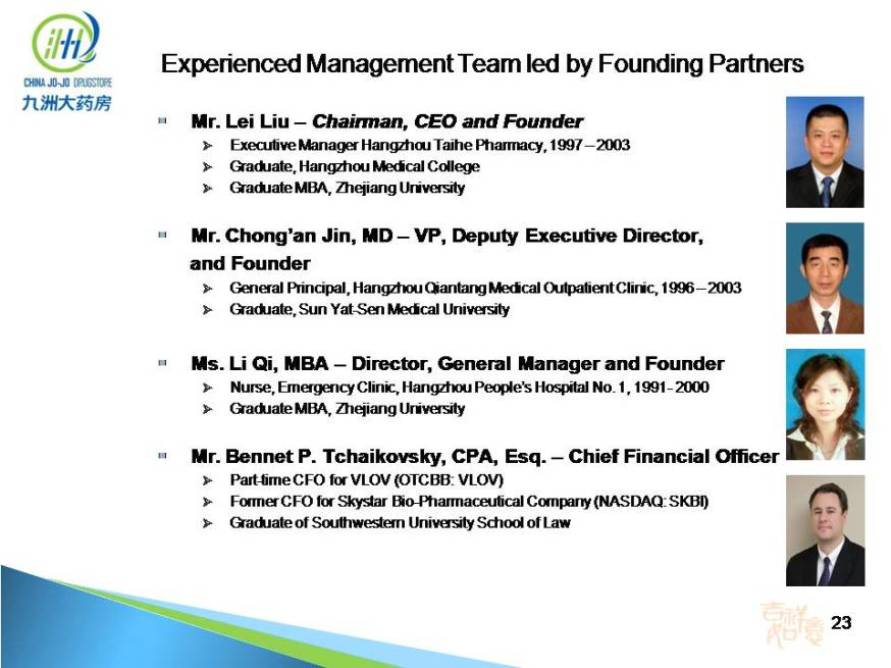
Mr. Lei Liu – Chairman, CEO and Founder Executive Manager Hangzhou Taihe Pharmacy, 1997 – 2003 Graduate, Hangzhou Medical College Graduate MBA, Zhejiang University Mr. Chong’an Jin, MD – VP, Deputy Executive Director, and Founder General Principal, Hangzhou Qiantang Medical Outpatient Clinic, 1996 – 2003 Graduate, Sun Yat-Sen Medical University Ms. Li Qi, MBA – Director, General Manager and Founder Nurse, Emergency Clinic, Hangzhou People’s Hospital No. 1, 1991- 2000 Graduate MBA, Zhejiang University Mr. Bennet P. Tchaikovsky, CPA, Esq. – Chief Financial Officer Part-time CFO for VLOV (OTCBB: VLOV) Former CFO for Skystar Bio-Pharmaceutical Company (NASDAQ: SKBI) Graduate of Southwestern University School of Law Experienced Management Team led by Founding Partners 23
24 Growth Opportunities
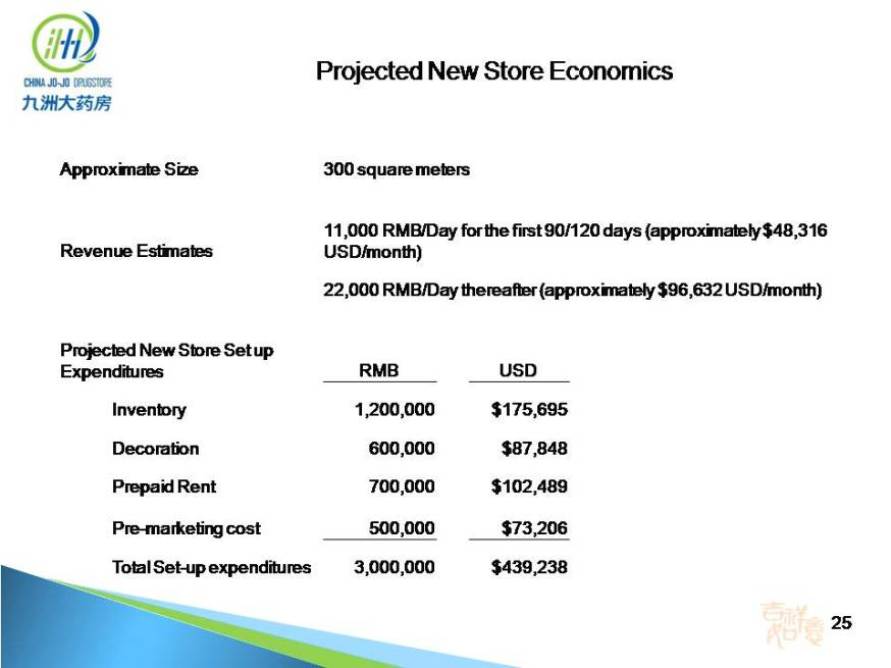
Projected New Store Economics 25 Approximate Size 300 square meters Revenue Estimates 11,000 RMB/Day for the first 90/120 days (approximately $48,316 USD/month) 22,000 RMB/Day thereafter (approximately $96,632 USD/month) Projected New Store Set up Expenditures RMB USD Inventory 1,200,000 $175,695 Decoration 600,000 $87,848 Prepaid Rent 700,000 $102,489 Pre-marketing cost 500,000 $73,206 Total Set-up expenditures 3,000,000 $439,238
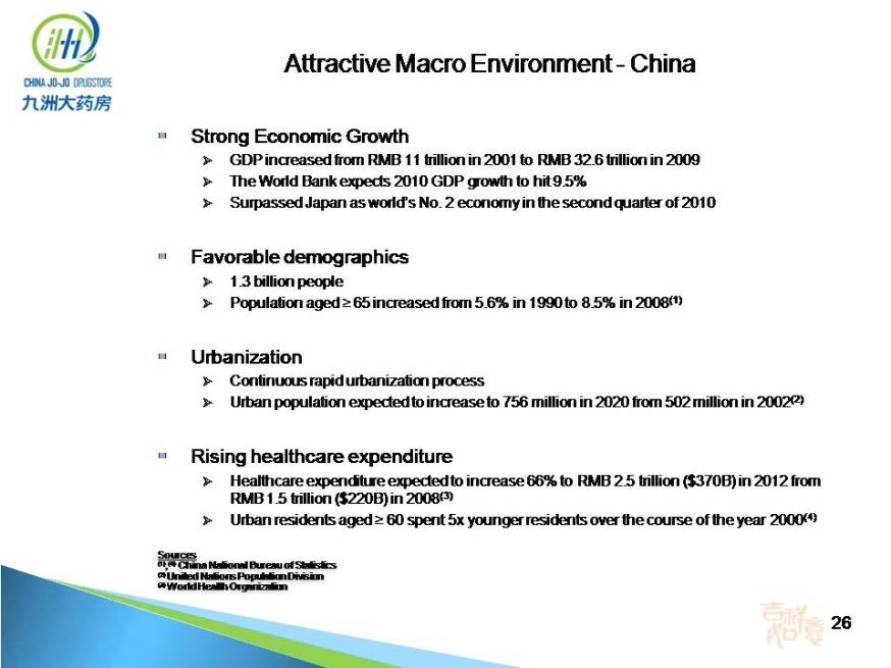
Strong Economic Growth GDP increased from RMB 11 trillion in 2001 to RMB 32.6 trillion in 2009 The World Bank expects 2010 GDP growth to hit 9.5% Surpassed Japan as world’s No. 2 economy in the second quarter of 2010 Favorable demographics 1.3 billion people Population aged = 65 increased from 5.6% in 1990 to 8.5% in 2008(1) Urbanization Continuous rapid urbanization process Urban population expected to increase to 756 million in 2020 from 502 million in 2002(2) Rising healthcare expenditure Healthcare expenditure expected to increase 66% to RMB 2.5 trillion ($370B) in 2012 from RMB 1.5 trillion ($220B) in 2008(3) Urban residents aged = 60 spent 5x younger residents over the course of the year 2000(4) Attractive Macro Environment – China 26 Sources (1),(4) China National Bureau of Statistics (2) United Nations Population Division (3) World Health Organization 26
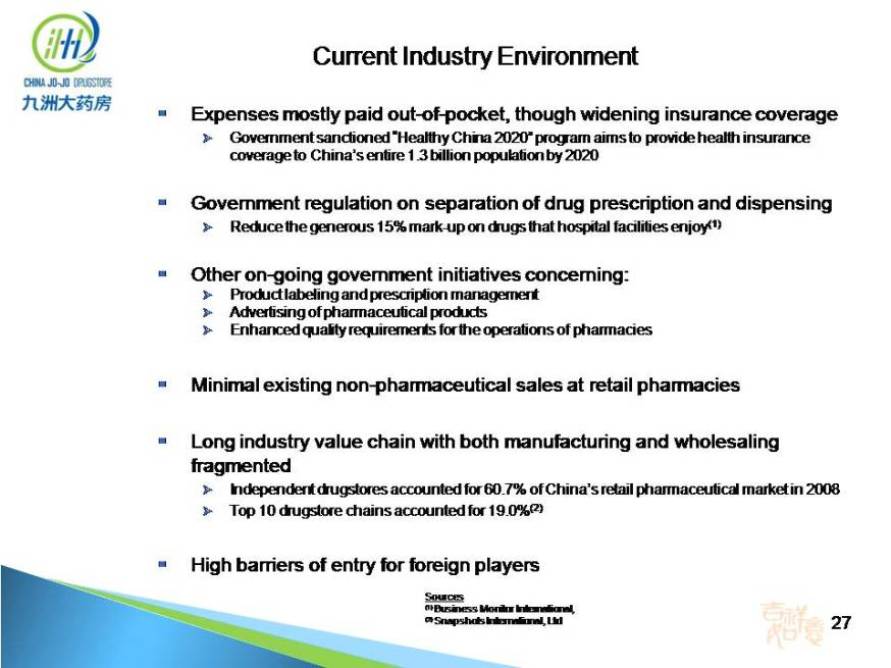
Expenses mostly paid out-of-pocket, though widening insurance coverage Government sanctioned “Healthy China 2020” program aims to provide health insurance coverage to China’s entire 1.3 billion population by 2020 Government regulation on separation of drug prescription and dispensing Reduce the generous 15% mark-up on drugs that hospital facilities enjoy(1) Other on-going government initiatives concerning: Product labeling and prescription management Advertising of pharmaceutical products Enhanced quality requirements for the operations of pharmacies Minimal existing non-pharmaceutical sales at retail pharmacies Long industry value chain with both manufacturing and wholesaling fragmented Independent drugstores accounted for 60.7% of China’s retail pharmaceutical market in 2008 Top 10 drugstore chains accounted for 19.0%(2) High barriers of entry for foreign players Current Industry Environment 27 Sources (1) Business Monitor International, (2) Snapshots International, Ltd
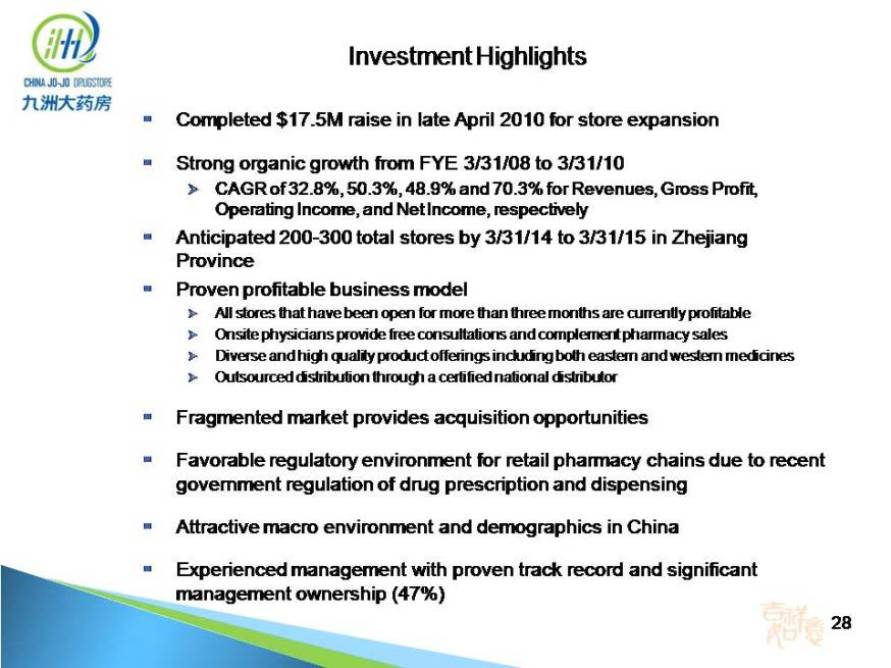
Completed $17.5M raise in late April 2010 for store expansion Strong organic growth from FYE 3/31/08 to 3/31/10 CAGR of 32.8%, 50.3%, 48.9% and 70.3% for Revenues, Gross Profit, Operating Income, and Net Income, respectively Anticipated 200-300 total stores by 3/31/14 to 3/31/15 in Zhejiang Province Proven profitable business model All stores that have been open for more than three months are currently profitable Onsite physicians provide free consultations and complement pharmacy sales Diverse and high quality product offerings including both eastern and western medicines Outsourced distribution through a certified national distributor Fragmented market provides acquisition opportunities Favorable regulatory environment for retail pharmacy chains due to recent government regulation of drug prescription and dispensing Attractive macro environment and demographics in China Experienced management with proven track record and significant management ownership (47%) Investment Highlights 28
China Jo-Jo Drugstores, Inc. Mr. Bennet Tchaikovsky , CFO Phone: 310-622-4515 bennet@jojodrugstores.com Website:www.chinajojodrugstores.com Contact Information 29 Outside Counsel Richardson & Patel, LLP 10900 Wilshire Boulevard Suite 500 Los Angeles, California 90024-6525 Telephone: 310-208-1182 Facsimile: 310-208-1154 Investor Relations: Capital Group Communications, Inc. Mr. Devin Bosch, President +415-332-7200 Mr. Kevin Fickle +925-330-8315 Auditors Frazer Frost, LLP 135 South State College Blvd., Suite 300 Brea, California 92821 714.990.1040 Fax: 714.671.1041