Attached files
| file | filename |
|---|---|
| EX-23.1 - CONSENT OF GRANT THORNTON - Animal Health International, Inc. | gtconsent.htm |
| EX-23.2 - CONSENT OF KPMG - Animal Health International, Inc. | kpmgconsent.htm |
| EX-21.1 - LIST OF SUBSIDIARIES - Animal Health International, Inc. | subsidiaries.htm |
| EX-31.1 - CERTIFICATION OF CEO - Animal Health International, Inc. | certificationceo10k.htm |
| EX-31.2 - CERTIFICATION OF CFO - Animal Health International, Inc. | certificationcfo10k.htm |
| EX-32.1 - SECTION CERTIFICATION - Animal Health International, Inc. | sectioncertification.htm |
UNITED STATES
SECURITIES AND EXCHANGE COMMISSION
Washington, D.C. 20549
FORM 10-K
|
x
|
ANNUAL REPORT PURSUANT TO SECTION 13 OR 15(d) OF THE SECURITIES EXCHANGE ACT OF 1934
|
For the fiscal year ended June 30, 2010
|
¨
|
TRANSITION REPORT PURSUANT TO SECTION 13 OR 15(d) OF THE SECURITIES EXCHANGE ACT OF 1934
|
Commission File Number 1-33273
(Exact name of Registrant as specified in its charter)
|
Delaware
|
71-0982698
|
|
|
(State or other jurisdiction of
incorporation or organization)
|
(I.R.S. Employer
Identification Number)
|
|
|
7 Village Circle, Suite 200
Westlake, Texas
|
76262
|
|
|
(Address of principal executive offices)
|
(Zip Code)
|
|
Registrant’s telephone number, including area code: (817) 859-3000
SECURITIES REGISTERED PURSUANT TO SECTION 12(B) OF THE ACT:
|
Title of each class
|
Name of Each Exchange on Which Registered
|
|
|
Common Stock, $0.01 par value
|
The NASDAQ Stock Market, LLC
|
SECURITIES REGISTERED PURSUANT TO SECTION 12(G) OF THE ACT: NONE
Indicate by check mark if the registrant is a well-known seasoned issuer, as defined in Rule 405 of the Securities Act. Yes o No x
Indicate by check mark if the registrant is not required to file reports pursuant to Section 13 or Section 15(d) of the Act. Yes o No x
Indicate by check mark whether the registrant: (1) has filed all reports required to be filed by Section 13 or 15(d) of the Securities Exchange Act of 1934 during the preceding 12 months (or for such shorter period that the registrant was required to file such reports), and (2) has been subject to such filing requirements for the past 90 days. Yes x No o
Indicate by checkmark whether the registrant has submitted electronically and posted on its corporate Web site, if any, every Interactive Data File required to be submitted and posted pursuant to Rule 405 of Regulation S-T (§232.405 of this chapter) during the preceding 12 months (or for such shorter period that the registrant was required to submit and post such files). Yes o No o
Indicate by check mark if disclosure of delinquent filers pursuant to Item 405 of Regulation S-K is not contained herein, and will not be contained, to the best of registrant’s knowledge, in definitive proxy or information statements incorporated by reference in Part III of this Form 10-K or any amendment to this Form 10-K. x
Indicate by check mark whether the registrant is a large accelerated filer, an accelerated filer, a non-accelerated filer, or a smaller reporting company. See the definitions of "large accelerated filer," "accelerated filer," and "smaller reporting company" in Rule 12b-2 of the Exchange Act. (Check one)
|
Large Accelerated Filer o
|
Accelerated Filer o
|
Non-Accelerated Filer o
|
Smaller Reporting Company x
|
|
(Do not check if a smaller reporting company)
|
Indicate by check mark whether the registrant is a shell company (as defined in Rule 12b-2 of the Exchange Act). Yes o No x
The aggregate market value of the common stock held by non-affiliates of the registrant as of December 31, 2009 was approximately $24.9 million (based on the closing price for the registrant’s common stock on the NASDAQ Global Market of $2.40 per share). At August 31, 2010, 24,329,670 shares of the registrant’s common stock were outstanding.
Documents Incorporated by Reference
The Registrant intends to file a proxy statement pursuant to Regulation 14A within 120 days of the end of the fiscal year ended June 30, 2010. Portions of such proxy statement are incorporated by reference into Part III of this Annual Report on Form 10-K.
ANIMAL HEALTH INTERNATIONAL, INC.
FORM 10-K
FOR THE YEAR ENDED JUNE 30, 2010
Cautionary Statement for Purposes of "Safe Harbor Provisions" of the Private Securities Litigation Reform Act of 1995
Certain statements in this Annual Report on Form 10-K are “forward-looking statements” within the meaning of Section 27A of the Securities Act of 1933, as amended (the “Securities Act”), and Section 21E of the Securities Exchange Act of 1934, as amended (the “Exchange Act”). These statements involve a number of risks, uncertainties and other factors that could cause our actual results, performance or achievements to be materially different from any future results, performance or achievements expressed or implied by these forward-looking statements. Factors which could materially affect such forward-looking statements can be found in the section entitled “Risk Factors” in Part 1, Item 1A. in this Annual Report on Form 10-K. Investors are urged to consider these factors carefully in evaluating the forward-looking statements and are cautioned not to place undue reliance on such forward-looking statements. The forward-looking statements made herein are only made as of the date hereof and we will undertake no obligation to publicly update such forward-looking statements to reflect subsequent events or circumstances.
References in this Annual Report on Form 10-K to “AHI,” the “Company,” “we,” “us” or “our” are to Animal Health International, Inc., a Delaware corporation, and its subsidiaries.
General
We are a leading distributor of animal health products in the United States and Canada. We sell more than 40,000 products sourced from over 1,500 manufacturers to over 71,000 customers, as well as provide consultative services to our customers in the highly fragmented animal health products industry. Products we distribute include pharmaceuticals, vaccines, parasiticides, diagnostics, capital equipment, sanitizers, devices, supplies, pet foods, and dairy lagoon treatment systems. Our principal customers are veterinarians, production animal operators and animal health product retailers. We believe our customers purchase from us due to our longstanding relationships with them, knowledge of their businesses, service and ability to assist them in their operations. We have a 318 person sales force, including 222 field sales representatives. We also offer our customers a variety of value-added services, including on-site inventory management, dairy technical services, electronic commerce platform, proprietary production animal health management software solutions, production animal heath operations equipment, health management capital equipment, equipment procurement consultation, merchandising, special order fulfillment, educational seminars. We process daily shipments from our central replenishment and distribution facility located in Memphis, Tennessee and 58 distribution locations strategically located in the United States, Canada and Taiwan. Our corporate headquarters is located in the Dallas/Fort Worth metropolitan area.
Our business commenced operations in 1954 as part of a family-owned drug store business, which following a series of business combinations, was incorporated as Walco International, Inc. in 1972. We were organized as a Delaware corporation in 2005. In September 2006, we changed our name to Animal Health International, Inc. We completed our initial public offering on January 30, 2007.
Industry
According to Sundale Research, an independent market research company, animal health product sales in the United States for 2009 totaled approximately $6.7 billion, an increase from approximately $4.7 billion in 2003, representing a compounded annual growth rate of approximately 6.0%. The animal health products market is divided into two sub-markets: production animals and companion animals. The production animal market primarily consists of beef and dairy cattle, poultry and swine, while the companion animal market primarily consists of horses, dogs and cats. Sundale Research estimates that in 2009 the market for production animal health products was approximately $3.0 billion and the market for companion animal health products was approximately $3.7 billion.
We believe the production animal health product market has been adversely impacted over the last few years by high animal feed costs combined with low animal protein prices. This unfavorable combination of high input costs and low protein prices have caused production animal producers to defer or eliminate spending on preventative treatments as well as to delay shipping animals to optimize weight gain. We believe the companion animal health products market has slowed due to decreased consumer spending caused by the general economy.
Distributors are critical to the animal health products supply chain, by providing manufacturers with cost-effective access to geographically diverse customers. Distributors also provide customers with access to a broad selection of products through a single channel, thereby helping them efficiently manage inventory levels.
1
Strategy
Our mission is to become the leading worldwide provider of animal health products and services in the production animal and companion animal health products markets. Our strategy to achieve this mission is outlined below.
Continue to grow our business organically. We intend to increase our share of animal health product purchases by optimizing our sales efforts and expanding our consultative services. We will continue to sell additional products needed by our customers, optimize distribution locations to better serve our customer base, increase our focus on corporate accounts, and recruit and train sales representatives to successfully penetrate new territories.
Expand sales of proprietary products. We believe the quality of our proprietary branded products in conjunction with our competitive pricing strategy has generated a loyal customer base that is confident in our branded products. We also believe we can partner with domestic and international manufacturers to continue to grow our proprietary branded products business by marketing new specialty niche products. We selectively target product areas to expand our proprietary branded products portfolio while maintaining our strategic manufacturer relationships. A significant number of products will be coming off patent in the next several years, providing us with a pipeline of proprietary branded product opportunities.
Continue to improve operational efficiencies. We have made significant investments in our distribution infrastructure and information technology platform over the past several years. In order to continue our profitability and maintain a competitive position in the marketplace, we will continue to focus on improving our operations and distribution processes.
Make selective acquisitions. The global market for animal health products distribution is highly fragmented with many national, regional and local distributors. We actively screen, target, contact and evaluate potential acquisitions. Our acquisition strategy is to target complementary businesses in the animal health product market that provide, among other things, access to additional product lines, sales representatives, customer opportunities, manufacturer relationships, sales territories and value-added services both in the United States and internationally. We believe our experienced and disciplined management team, together with our organizational platform built on scalable information management systems and processes, make us well positioned to participate in the consolidation of the industry.
Products
We offer a broad selection of over 40,000 animal health products, including an extensive offering of proprietary branded products, which we source from over 1,500 manufacturers. We also offer our customers additional products through special orders. Our products are comprised of four major categories: pharmaceuticals, biologicals, pet foods and nutritional products, and other products. For our fiscal year ended June 30, 2010, our product revenues were comprised of approximately 54% pharmaceutical products, 16% biologicals, 10% pet foods and nutritional products, and 20% of other products.
Pharmaceuticals. Pharmaceuticals include dosage form medicines employed in disease prevention and treatment programs. Pharmaceuticals such as antibiotics, anthelmintics, insecticides and implants include both over-the-counter products, which can be sold directly to end-users, and ethical products, which are sold to, or through, veterinarians.
|
•
|
Antibiotics are administered for the treatment and prevention of diseases such as chronic respiratory disease and for growth promotion. Antibiotics include products such as tetracyclines, penicillins, erythromycins, cephalosporins and fluroquinolones. Antibiotics are available in injectable, bolus (i.e., pill), additive and drench (i.e., liquid) forms.
|
|
•
|
Anthelmintics are deworming agents administered on a routine basis to animals for the prevention and treatment of internal parasites and worms in production animals. Worms include gastrointestinal roundworms, stomach worms, intestinal worms and lungworms. Anthelmintics are available in injectable, bolus, drench, additive, pour-on and paste forms.
|
|
•
|
Insecticides are used to control insect populations on animals and their premises, and are administered on a routine, preventative basis. Insecticides can be used to control flies, lice, ticks, mites and fleas, and are available in dust, liquid, spray and ear tag forms. Endectocides are active against both internal and external parasites and hence are both an anthelmintic and an insecticide.
|
|
•
|
Implants are used for the promotion of growth in animals, to increase weight gain and improve yield in cattle.
|
2
Biologicals. Biologicals, including bacterial and viral vaccines and antitoxins, stimulate immunity to disease in both production and companion animals. Bacterial vaccines are bacterial products that are used on a routine basis to prevent diseases such as black leg, leptospirosis, red water and shipping fever. Viral vaccines are used for the control of respiratory and gastrointestinal diseases. Antitoxins provide short-term protection for certain soil borne and certain other infections such as tetanus.
Pet foods, and nutritional products, including medicated feed additives. We offer several premium pet foods and nutritional products, such as dietary supplements, probiotics (i.e. beneficial bacteria-based treatments), vitamins and treats, to veterinarians and retail stores. Medicated additives include highly regulated products such as antibiotics and anti-bacterials, and are used at low levels to promote growth and improve efficiency in production animals and, at high levels, for therapeutic treatment.
Other products, including diagnostics, capital equipment, medical devices and supplies, chemicals, calf feeding bottles, and dairy lagoon treatment systems. We offer a wide range of diagnostics, capital equipment and medical devices and supplies, including disposable kits, replacement strips and reagents. These products are used for testing all animal species’ body fluids and tissue for disease and/or conditions or in residue testing of animal products. While heartworm diagnostics are at the core of this market, other products also include a full range of blood tests for disorders such as ehrlichia, feline leukemia, parvovirus, feline infectious peritonitis and feline immunodeficiency virus. Medical supplies are used in cleaning and sanitizing equipment and facilities, as well as diagnostic and suture components, and grooming products such as brushes and shampoos. Chemicals include sanitizers, cleaning agents, disinfectants, insecticides and rodenticides, and are typically used by production animal producers.
Proprietary branded products. In addition to the four major categories of products discussed above, we selectively target new product areas to expand our proprietary branded products portfolio, while maintaining our strategic manufacturer relationships. We market these products, such as vaccines, antibiotics, nutritionals and general pharmaceuticals, under the RXV Products, AGRIpharm, First Companion, Mineral Max and Ivermax brands. We believe that the quality of our proprietary branded products in conjunction with our competitive pricing strategy has generated a loyal customer base that is confident in our brands. In addition, we believe we can partner with domestic and international manufacturers to continue to grow our proprietary branded products business by (1) marketing new specialty niche products and (2) developing proprietary branded products for products coming off patent. Proprietary branded product manufacturing is done both by third-party contract manufacturers as well as branded product companies that have excess capacity. We believe that we are well-positioned to capitalize on the trend towards increased private brands given our strong relationships with manufacturers and strong market position in the distribution of animal health products.
Consultative services
In addition to providing a broad selection of animal health products, we offer a comprehensive set of consultative services, software and equipment that differentiates us from our competition and further solidifies what we believe is our leading market position. We do not generate revenue from consultative services, but do generate revenue from certain software and equipment. These services, software and equipment include:
Electronic commerce platform. Our user-friendly e-commerce application allows customers to review product descriptions, access customer-specific product pricing, view current vendor promotions, download detailed product usage history and place orders.
Dairy technicians. Our dedicated technicians assist customers with the cleaning, maintenance and replacement of dairy equipment and also provide various disinfectant supplies used by customers to maintain sanitary facilities. Additionally, our technicians interface with dairy cooperatives and help manage accounting and payment processes.
Herd health management. We work with production animal veterinarians to design specific animal health packages with vaccination and treatment protocols. We assist customers in the implementation and administration of these packages and help veterinarians in disease identification and vaccine management.
Environmental services. Our technicians analyze and treat dairy lagoons on behalf of customers to reduce solid animal waste, promote better water quality, reduce odors and maintain regulatory compliance.
Logistics services. We provide contract logistics, warehousing and delivery services to both manufacturers and customers. We also provide customers with microbacterial monitoring, cleaning and disinfecting and litter management services.
Inventory management services. We provide on-site inventory management services to our customers to minimize outdated products, improve efficiency, and track product usage.
3
Educational seminars. We routinely organize and participate with our vendors in seminars for our production animal and companion animal customers covering a wide array of topics.
Newsletters and publications. We publish weekly newsletters customized by market. Our publications include: Heads Up (targeted to the beef market), Dairy Health Update (targeted to the dairy market) and DVM Resources Industry Update (targeted towards veterinarians). These newsletters include information regarding recent product introductions, health articles, advice columns and conferences and seminars.
Health and operations management software. We offer user-friendly beef cattle computer management systems. Our proprietary health management software allows producers to accurately document the health history and treatment costs for each animal. Our accounting software package enables producers to organize financial data for their operations including information on employees, taxes, commodity costs and transaction records.
Microingredient machines. We install microingredient machines that (1) precisely measure expensive feed additive ingredients used to complete balanced feeding rations for cattle and (2) store and administer pharmaceuticals. These machines are sold with discounts to customers purchasing large orders of feed additives.
Special order fulfillment. We procure and ship approximately 1,100 unique products that we do not normally stock in our warehouses.
Merchandising services. Our field sales representatives visit large dealers and retail stores and provide shelf management and organization, product information and monitoring services on a monthly basis.
Customers
We have a diverse customer base with over 71,000 accounts consisting of veterinarians, production animal operators and animal health product retailers. We believe our good reputation for customer service, product selection and high quality products has enabled us to establish and maintain this customer base. In fiscal 2010, no customer represented more than 1.0% of net sales and our 10 largest accounts only comprised approximately 6% of net sales. We have over 35,000 accounts served directly by our sales force and approximately 36,000 additional accounts that are served by Internet and catalog sales. Our customers range in size from single-practitioner veterinarians to large, corporate cattle feeding operations. Due to longstanding relationships between our sales force and our customers, 70% of our top 500 customers that placed orders with us in 2002 still order from us today.
Beef customers. Our beef customers are divided into three primary sub-groups: cow/calf, stocker and feedlots. Cattle require animal health products during each stage to optimize weight gain, shorten production cycles, prevent disease and maintain overall health. Additionally, as transportation is physically taxing on cattle, animal health products are administered each time cattle are transported between stages. We have historically targeted stocker and feedlot customers, most of whom have over 500 and 2,000 cattle, respectively. We sell directly to cow/calf customers with over 200 cattle. We also employ a direct marketing strategy to address smaller cow/calf customers, who are highly fragmented and purchase in smaller volumes. These customers are also serviced via our sales to production animal veterinarians, dealers and retail stores. Our e-commerce initiative reaches small cow/calf producers which have herd sizes of 50-200 cattle. The key products sold to these customers include endectocides, antibiotics, growth promoting implants, vaccines, identification tags and nutritionals.
|
•
|
Cow/Calf. According to the United States Department of Agriculture (USDA), this sub-group is extremely fragmented with over 757,000 cattle operations. However, approximately 642,000 operations have 49 or fewer cattle. Calves remain in the cow/calf stage from birth until reaching approximately 400 lbs (roughly six to eight months) at which point they are sold to buying agents and delivered to stocker locations. Per-cattle animal health product spending is approximately $17 during the cow/calf stage.
|
|
|
•
|
Stocker. This market consists of operations holding large tracts of land predominantly in the central and western U.S. regions where cattle are moved to graze for roughly three to five months prior to being sold to feedlots. During their stay, cattle increase in weight from 400 lbs to 600 lbs. Per-cattle spending is approximately $12 during the stocker stage.
|
|
|
•
|
Feedlots. Feedlots are typically located in the central and western U.S. regions and hold several thousand to 100,000 cattle in open pens. There are approximately 2,100 feedlots in the United States with capacity greater than 1,000 cattle. Cattle undergo their final growth stage prior to processing and increase in weight from 600 lbs to 1,200 lbs. Length of stay approximates 90 to 120 days and per-cattle spending during this stage is approximately $20. Feedlot animal health product requirements mainly consist of de-wormers, growth implants, preventive animal health products (substantially the same products required by cow/calf and stocker customers), acute/chronic disease treatments and medicated additives for growth promotion.
|
4
Dairy customers. We believe we are a leader in the dairy market. We target dairy farms with a minimum size of 500 cattle, with our average dairy customer having 1,500 cattle. The dairy market is undergoing significant consolidation resulting in a shift towards larger operations. According to USDA estimates, dairies with 500 or more cattle account for 58% of the U.S. milk producing cow population, an increase from 24% in 1997. Given our strong relationships with larger dairies and our national footprint, we are seeking to continue to gain share as dairy consolidation continues. The key products sold to these customers include endectocides, antibiotics, reproductive products, vaccines, lagoon treatment systems, identification tags, nutritionals and sanitation products.
Poultry and swine customers. We sell animal health products to major poultry and swine integrators. Our field sales representatives typically visit customer locations at least once every four weeks and facilitate product delivery on a weekly basis. We sell to local production supervisors, centralized purchasing managers and production animal veterinarians who provide herd management consulting services to the major integrators. We believe we will increase our market share with major integrators as we further develop customized national account management programs. The key products sold to these customers include antibiotics, vaccines, nutritionals, sanitation products and bio-security products.
Companion animal customers. Our companion animal health products sales are made through the veterinarian and over-the-counter channels, with the majority of sales made to rural, mixed-practice veterinarians. Over the past four years, we have begun to penetrate the urban and suburban veterinarian markets, visiting veterinarians in these areas on a bi-weekly basis. We intend to leverage our centralized procurement and inventory management model to develop a leading cost-to-serve position in the companion animal health products market. By providing competitive pricing and superior service, we seek to build on our strong position in the companion animal health products distribution market. The key products sold to these customers include flea and tick controls and preventative products, antibiotics, vaccines, arthritis treatments and pharmaceuticals. By leveraging our service platform, we intend to capture market share within the fragmented companion animal veterinarian customer base of approximately 47,000 veterinarians as of December 31, 2009, according to the American Veterinary Medical Association.
Dealer retail. The dealer retail division distributes animal health products to tack, feed and animal health retailers that generally exist in rural areas with high animal populations. These retailers then resell these animal health products to individual animal owners and sub-scale production animal operators.
Manufacturers
We distribute more than 40,000 products sourced from over 1,500 manufacturers. We currently do not manufacture any of our products and are dependent on manufacturers for our supply of products. We believe we have access to leading brand name products in the product categories we sell. The manufacturers we purchase from include many large multi-national and domestic manufacturers of animal health products. While our manufacturers often have relationships with multiple distributors, our 10 largest manufacturers have been working with us for an average of over 20 years.
We believe effective purchasing is a key to maintaining our position as a leading provider of animal health care products. We regularly assess our purchasing needs and our manufacturers’ product offerings to obtain products at favorable prices. In addition, our ability to source products globally provides us with a greater selection of products that can be purchased at favorable prices. Smaller distributors often do not have the ability to access these overseas manufacturers. While we purchase products from many manufacturers and there are generally multiple manufacturers for most animal health product categories, we do have a concentration of aggregate purchases with certain manufacturers. For our fiscal year ended June 30, 2010, our top manufacturer, Pfizer, Inc. (Pfizer), supplied products that accounted for approximately 20% of our net sales. The next largest manufacturer, Intervet/Schering Plough, accounted for approximately 10% of our net sales. No other manufacturer accounted for more than 10% of our net sales during this period. Our 10 largest manufacturers accounted for approximately 61% of our net sales for our fiscal year ended June 30, 2010.
We also provide key manufacturers with critical data on a daily basis. Traditionally, manufacturers tended to have difficulty tracking products after they had been shipped to distributors. Therefore, it was cumbersome for manufacturers to accurately assess customer demand and pricing thresholds. Using our information technology systems, we send daily updates to key manufacturers regarding product shipments, extensively detailing both end locations as well as product pricing. Understanding this information allows us to partner with manufacturers to develop customized supplier management programs that aid our manufacturers in assessing market trends and conditions to effectively place various products.
We work closely with our manufacturers to help them carry their sales and marketing messages to our customers. We believe our ability to take these messages and effectively deliver them to our customers distinguishes us from our competitors. In 2009, we developed and implemented a remote learning portal to allow manufacturers to provide on-demand multimedia training on key products to our geographically diverse sales force. In addition, we provide smaller manufacturers with critical sales and marketing support. Our team of marketing and graphic design professionals assists smaller manufacturers in developing and producing promotional materials for their animal health products.
5
On October 15, 2009, Pfizer completed its acquisition of Wyeth, which includes Fort Dodge as a subsidiary. In connection with this acquisition, Pfizer divested certain animal health products to Boehringer Ingelheim and Bimeda. Fort Dodge supplied products that accounted for approximately 7.5% of our revenues for fiscal year 2009. Of this amount, based on information received from Pfizer, Boehringer Ingelheim and Bimeda, we estimate that approximately 50% of such revenues were attributable to products now owned by Pfizer, 40% of such revenues were attributable to products now owned by Boehringer Ingelheim, and 10% of such revenues were attributable to products now owned by Bimeda.
Our livestock products agreement with Pfizer provides that we supply selected customers in the cattle and swine fields with Pfizer products. In return, we are entitled to certain service fees and rebates. Pfizer is required to indemnify us against any third-party claims for personal injury or property damage arising out of the distribution or sale of Pfizer products, except in certain circumstances, and any claims alleging that the Pfizer products are defective, except in certain limited situations. Pfizer also reserves the right to sell directly to our customers or any other party. The livestock products agreement has a one-year term that expires on December 31, 2010, and may be terminated by either party with or without cause upon 30 days prior written notice. In addition, either party may terminate the agreement immediately upon written notice in the event of material breach by the other party.
There are two major types of transactions associated with the flow of products from our manufacturers, through us, to our customers. Traditional “buy/sell” transactions, which accounted for approximately 98% of our business in fiscal 2010, involve the direct purchase of products by us from manufacturers, which we manage and store in our warehouses. A customer then places an order with us, and the order is then picked, packed, shipped and invoiced by us to our customer, followed by payment from our customer to us. On a limited basis, we also sell products to our customers under agency agreements with some of our manufacturers. Under this model, when we receive orders for products from the customer, we transmit the order to the manufacturer who then picks, packs and ships the products. In some cases our vendor invoices and collects payment from our customer, while in other cases we invoice and collect payment from our customer. We receive a commission payment for soliciting the order and for providing additional services, and our expenses associated with agency agreements are lower than in traditional "buy/sell" transactions.
We typically do not have long-term written agreements with our manufacturers. The written agreements that we have with our manufacturers generally provide for annual renewals, 30 to 90 day termination provisions and free on board destination shipping.
We collaboratively establish annual sales growth goals with a number of our manufacturers. Attainment of these goals may affect annual rebates with several of these manufacturers. Since many of our manufacturer rebates are based on a calendar year, prior to 2008, the quarter ended December 31 was our most significant quarter for recognition of rebates. Since that time, sales growth goals have shifted from annual to quarterly or trimester goals. While we anticipate that this trend with respect to manufacturers' rebate programs will continue, we do not expect as strong an impact during the quarter ended December 31, 2010, as compared to calendar years prior to 2008. Manufacturer rebates are collaboratively established with many manufacturers and include inventory purchase rebates and sales-related rebates. Rebates range from one-time purchase opportunities to sales-related programs that last a month, a quarter, a trimester or the entire calendar year. The programs can be related to a specific product or product line, or related to the type of customer or specific species of animal.
Product returns from our customers and to our manufacturers occur in the ordinary course of business. We extend our customers the same return of goods policies as are extended to us by our manufacturers. We do not believe that our operations will be adversely impacted due to the return of products.
Sales and marketing
Sales. Our sales and marketing strategies are designed to establish and maintain strong customer relationships through personal visits by field sales representatives, frequent telesales contact, emphasizing our broad product lines, electronic ordering capabilities, high levels of customer support and service and other value-added services. Our sales force is a key component of our value-added approach.
Our sales organization consists of two group presidents responsible for certain geographies covering production animal (i.e., beef, dairy, poultry, and swine) and dealer customers, one group president responsible for veterinary customers, regional sales managers, division/location managers and sales force employees. Our 59 distribution locations are organized along geography and customer channels, each under the direction of a group president. We have an experienced and loyal sales force comprised of 318 employees (34 managers, 222 field sales representatives and 62 inside sales representatives). Each of our distribution locations employs one to 25 field sales representatives who service customers in their surrounding geographical areas on a weekly basis. Many members of our sales force have spent their entire careers in the animal health industry, providing an extensive knowledge base that distinguishes us from our competitors. Our sales force is specialized by customer market, and members of our sales force have been with us for an average of eleven years. Over the past decade, our annual field sales representative turnover has been approximately 11%.
6
We are focused on providing high-quality training for our sales force. Training entails program selling, territory management, pricing management and sales technique workshops. Additionally, our field sales representatives meet annually as a group at our national sales meeting where fiscal year results are reviewed, outlooks for the various markets and product categories are presented and best practices shared. Bi-annual and quarterly sales meetings are also held for markets (i.e., beef, dairy, poultry and swine) and individual locations, respectively.
We use various tools to evaluate and improve our performance. For example, we provide our sales force with real-time pricing and margin analytics to systematically characterize the relative attractiveness of products, customers, geographies and individual transactions. These analytics, which categorize our diverse customer base into 27 unique customer classes, allow our sales force to process and implement pricing decisions in a systematic manner. In addition, our field sales representatives receive customized monthly Territory Performance Reports, which track detailed product sales, gross margins, budget variances and other marketing statistics. We provide software applications and performance tracking tools to our sales force, such as Sales Pro, which is a proprietary, automated software package that allows our sales force to analyze product and pricing trends. We share sales information throughout the organization in the form of a scoreboard, which breaks down sales and gross profit by market, region and location. We also publish monthly reports ranking various metrics and compiling best practices. Several “clubs” such as the Presidents Club are used to distinguish field sales representatives that achieve specific sales targets and maintain high organizational standards.
Marketing.We market to customers by distributing weekly newsletters customized by market. These newsletters include information regarding recent product introductions, health articles, advice columns and conferences and seminars. We also offer various customer loyalty programs, including our Value In Purchasing program, to reward our customers for repeat business with qualifying purchases earning points redeemable through our program catalog. Additional marketing tools that we utilize include specific product and vendor programs, flyers, order stuffers and other promotional materials. We also participate in national and regional trade shows to extend our customer reach and enhance customer interaction.
We have a dedicated marketing organization which we believe distinguishes us from our competitors. We maintain a marketing department consisting of 20 employees, including 17 marketing professionals who cover every major animal health customer group (beef, dairy, dealer, poultry, swine, and veterinarian). These marketing professionals develop customized marketing programs to increase product sales and usage, manage loyalty programs, monitor supplier management programs, support manufacturers’ new product launches, and develop new products and value added services. Our team of graphic artists produces detailed product technical sheets, catalogs and promotional literature. Our dedicated proprietary brand manager devises marketing plans for our growing line of proprietary branded products. Finally, an e-commerce manager oversees the development of Internet product ordering platforms and tracking features.
E-Commerce. We have a user-friendly e-commerce application that allows customers, via market specific Internet sites (including www.animalhealthpros.com; www.dvmresources.com; and www.americanlivestock.com) to review product descriptions, access customer-specific product pricing, view current vendor promotions, download detailed product usage history and place orders.
Information with respect to revenue may be found in the consolidated financial statements in Part IV, Item 15 of this Annual Report on Form 10-K and in the section entitled “Management’s Discussion and Analysis of Financial Condition and Results of Operations” in Part II, Item 7 of this Annual Report on Form 10-K.
Distribution model
We use strategically located distribution centers throughout the United States and Canada. Approximately 32% of the dollar volume of our customer purchases flows through our replenishment and distribution facility located in Memphis, Tennessee. From the Memphis facility, we then deliver products on a weekly basis to our 58 other distribution locations.
We have a dedicated team of inventory management professionals who ensure that the inventory levels in our warehouses are appropriate to satisfy customer demand for prompt delivery and fulfillment of customer orders. The majority of our orders are delivered within one business day. We currently ship the majority of our orders by our own delivery trucks, with the balance of our orders being shipped by United Parcel Service, Inc., and other national and regional carriers.
Our procurement and inventory management model provides us with several competitive advantages. We are able to effectively purchase large quantities of products, allowing all divisions, independent of size, to receive the lowest possible price. Furthermore, by having an organized purchasing strategy, versus the non-coordinated regional strategy employed by many competitors, we manage inventory more effectively and reduce working capital investment. We believe our procurement disciplines provide us with a gross margin advantage relative to several of our competitors.
7
Information technology
We use a J.D. Edwards ERP information technology system. We have invested significant management resources in customizing the system for use across all of our divisions and have trained employees to utilize its functionality. Internally, we use the system for inventory management and product tracking. Purchasing managers can query the database to develop detailed product ordering and shipping histories, track ordering status and monitor product requests from field sales representatives. Managers and field sales representatives have access to real-time product data such as inventory quantities (both at our central replenishment and distribution facility and at individual distribution locations), upcoming shipments and timing of deliveries. The system tracks inventory turnover at specific distribution locations allowing us to better manage the appropriate inventory level for each product at every distribution location. This enables us to move inventory from one distribution center to another as needed.
We believe our Internet platform is well-positioned to benefit from increased electronic ordering by our customer base. Our Internet ordering system is a user-friendly application that enables customers to review product descriptions, access customer-specific product pricing, view current vendor promotions, download detailed product usage history and place orders. While most customers choose to receive products on a weekly basis, we offer customized inventory programs that allow customers to easily maintain inventories for certain products. We ensure availability and immediate delivery of these products. Because of its accessibility and ease of use, we anticipate that veterinarians will increasingly use this electronic platform for direct product ordering, which we believe would increase the productivity of our sales force.
International
In October 2007, we acquired all of the outstanding stock of Kane Veterinary Supplies, Ltd. (Kane), a companion and production animal health and pet food distributor headquartered in Edmonton, Canada. Kane is a leading distributor of animal health products in Canada. This acquisition enabled us to expand our market presence to companion animal and pet food retailers in Canada. For the year ended June 30, 2010, our Canadian operations generated 10.2% of our revenue.
Competition
The distribution and manufacture of animal health products is highly competitive. We compete directly with national and regional, broad-line animal health products distributors, certain vendors, as well as companies that specialize in distributing primarily ethical drug products to veterinarians. We compete based on customer relationships, service and delivery, product selection, market and product knowledge, price and e-commerce capabilities. Some of our competitors, particularly those in the companion animal products market with bigger market share, have greater financial and other resources than we do. Most of our products are available from several sources, including other distributors and manufacturers, and our customers tend to have relationships with several distributors. In addition, our competitors could obtain exclusive rights to distribute certain products, eliminating our ability to distribute those products. Consolidation in the animal health products industry could result in existing competitors increasing their market share, which could give them greater pricing power, decrease our revenues and profitability, and increase the competition for customers. See “Risk factors—Risks related to our business—Consolidation in the animal health products industry may decrease our net sales and profitability.”
Our primary competitors, excluding manufacturers, include the following and other national, regional, local and specialty distributors: Butler Schein Animal Health Supply, LLC, IVESCO, LLC (Iowa Veterinary Supply), Lextron, Inc., MWI Veterinary Supply, Inc., Professional Veterinary Products, Ltd., and Webster Veterinary Supply, a division of Patterson Companies, Inc.
The role of the animal health product distributor has changed dramatically during the last decade. Successful distributors are increasingly providing value-added services in addition to the products they traditionally provided. We believe that to remain competitive we must continue to add value to the distribution channel, while removing unnecessary costs associated with product movement.
Distribution of animal health products is often characterized as “ethical” and “over-the-counter,” commonly referred to as OTC, channels of product movement. Ethical distribution is defined as those sales of goods to licensed veterinarians for use in their professional practice. Many of these products are prescription and must be sold or prescribed by a licensed professional. OTC distribution is the movement of non-prescription goods to the animal owner and the end-user. Many of these products are also purchased by the licensed veterinarian for professional use or for resale to their client. There are numerous ethical and OTC distribution companies operating throughout the United States and competition in the animal health products industry is intense. See “Risk factors—Risks related to our business—Our market is highly competitive.” Failure to compete successfully could have a material adverse effect on our business, financial condition and results of operations.
8
Intellectual Property
Our success depends in part on our ability to protect our intellectual property rights and our proprietary software, production animal equipment, and other technologies. We rely on our trademarks, trade names and brand names to distinguish our proprietary branded products and services from the products and services of our competitors. As of June 30, 2010, we have registered 95 trademarks and applied to register six additional trademarks. As of June 30, 2010, we have registered six service marks and applied to register three additional service marks. As of June 30, 2010, we owned one U.S. patent that expires in approximately three years, and we have applied for five additional patents, three with the U.S. Patent and Trademark Office and two with the Canadian Intellectual Property Office. We also rely on unpatented proprietary technology. To protect our trade secrets and other proprietary information, we require employees, consultants, advisors and collaborators to enter into confidentiality agreements.
There are always risks that third parties may claim we are infringing upon their intellectual property rights and we could be prevented from selling our products, or suffer significant litigation or licensing expenses as a result of these claims. See “Risk factors—Risks related to our business—If third parties claim that we infringe upon their intellectual property rights, our operating profits could be adversely affected.” In addition, third parties may infringe upon or design around our intellectual property rights, and we may expend significant resources enforcing our rights or suffer competitive injury with adverse effects on our business and results of operations. See “Risk factors—Risks related to our business—Our intellectual property rights may be inadequate to protect our business.”
Insurance and risk management
We purchase insurance to cover standard risks in our industry, including policies to cover general products liability, workers compensation, auto liability and other casualty and property risks. However, we do not carry business interruption insurance due to the geographic diversity of our facilities and redundancy in our information systems. Therefore, we will not be compensated for certain losses that may occur as a result of a major disruption to our facilities. Our insurance rates are dependent upon our safety record as well as trends in the insurance industry. We utilize a paid loss self-insurance plan for health, general liability and workers’ compensation coverage. Predetermined loss limits have been arranged with insurance companies to limit our per occurrence and annual aggregate cash outlay. Accrued expenses and other liabilities include the estimated incurred but unreported costs to settle unpaid claims and estimated future claims.
We face an inherent risk of exposure to product liability claims in the event that, among other things, the use of products sold by us result in injury, such as the death of animals treated with our products. With respect to product liability coverage, we carry insurance coverage typical of our industry and product lines. Our coverage involves self-insured retentions with primary and excess liability coverage above the retention amount. For our non-proprietary products, we have the ability to refer claims to most of our manufacturers and their insurers to pay the costs associated with any claims arising from such manufacturer’s products. In most cases, our insurance covers such claims that are not adequately covered by a manufacturer’s insurance and provides for excess secondary coverage above the limits provided by our manufacturers.
We self-insure auto physical damage exposure risk and certain property and casualty risks due to our analysis of the risks, the frequency and severity of a loss and the cost of insurance for the risks. We believe the amount of self-insurance is not significant and will not have an adverse impact on our performance. In addition, we may from time to time self-insure liability with respect to specific ingredients in products that we may sell.
Government regulation
Our manufacturers of pharmaceuticals, vaccines, parasiticides, insecticides and pesticides and certain controlled substances are typically regulated by federal agencies, such as Food and Drug Administration (FDA), United States Department of Agriculture (USDA), Environmental Protection Agency (EPA) and Drug Enforcement Agency (DEA), as well as most similar state agencies. Therefore, we are subject, either directly or indirectly, to regulation by the same agencies. Most states and the DEA require us to be registered or otherwise keep a current permit or license to handle controlled substances. Manufacturers of vaccines are required by the FDA to comply with various storage and shipping criteria and requirements for vaccines. To the extent we distribute such products, we must comply with the same requirements, including, without limitation, the storage and shipping requirements for vaccines. In addition, we are subject to regulations by the Department of Transportation relating to the transportation of our products.
9
State boards of pharmacy require us to be licensed in their respective states for the sale and distribution of pharmaceutical products and medical devices within their jurisdictions. As a distributor of prescription pharmaceutical products, we are subject to the regulatory requirements of the FDA and regulatory requirements promulgated under the Prescription Drug Marketing Act (PDMA). The PDMA and FDA provide governance and authority to the states to provide minimum standards, terms and conditions for the licensing by state licensing authorities of persons who “engage” in wholesale distribution (as defined by each state regulatory agency) in interstate commerce of prescription drugs. With this authority, states require site-specific registrations for the parties that engage in the selling and/or physical distribution of pharmaceutical products within and into their state in the form of out-of-state registrations. Selling and/or distribution without the appropriate registrations may be subject to fines, penalties, misdemeanor or felony convictions, and/or seizure of the products involved.
Some states (as well as certain cities and counties) require us to collect sales taxes/use taxes on certain types of animal health products. We are also subject to laws governing our relationship with employees, including minimum wage requirements, overtime, working conditions and citizenship requirements. In addition, we are subject to additional regulations regarding our hiring practices because several federal, state and local governmental agencies are our customers.
We have implemented internal procedures to help ensure we are in compliance with all statutes and regulations applicable to animal healthcare distribution, as well as other general health and safety laws and regulations, and to help ensure we possess all necessary permits and licenses required for the conduct of our business. See “Risk factors—Risks related to our business—If we fail to comply with or become subject to more onerous government regulations, our business could be adversely affected.”
Environmental
We are subject to environmental, health and safety laws and regulations concerning, among other things, air and wastewater discharges, the generation, handling, storage, transportation and disposal of pesticides, hazardous waste and toxic substances. Pursuant to some of these laws and regulations, we are required to obtain permits from governmental authorities for certain operations. We cannot assure you that we have been or will be at all times in complete compliance with such laws, regulations and permits. If we violate or fail to comply with these laws, regulations or permits, we could be fined or otherwise sanctioned by regulators.
We could also be responsible for costs incurred relating to contamination at our third party waste disposal sites or relating to damages incurred as a result of human exposure to such substances or other environmental damage caused by our operations or our disposal of waste. In addition, our past and present ownership or operation of real property that is contaminated with hazardous or toxic substances could also result in an obligation to perform or pay for a clean-up or other damages, regardless of whether we knew of or were responsible for such contamination. While we have incurred in the past, and expect to incur in the future, capital and other expenditures related to environmental compliance and remediation matters, we do not anticipate that such expenditures will have a material adverse effect on our capital expenditures, earnings or competitive position in the future. See “Risk factors—Risks related to our business—We are subject to significant environmental regulation and environmental compliance expenditures and liabilities.”
Employees
As of June 30, 2010, we had 939 employees across the United States, Canada, and Taiwan. None of our employees is a party to a collective bargaining agreement, and we consider our relations with our employees to be good.
Seasonality of operating results
Historically, our quarterly sales and operating results have varied significantly, and will likely continue to do so in the future. Seasonality has been caused by product usage, climate changes, promotions, rebates and announced price increases. Historically, our sales have been higher during the spring and fall months, as the transportation of production animals during these months results in increased product usage. The transportation of production animals occurs during various times in the animal’s life cycle. The cycle begins with the cow-calf stage where the calf is born and raised to six to eight months of age. At that point, the calf moves to pasture for three to five months. The last movement occurs when the animal is placed in the feedyard. Movement and climate changes cause stress upon the animal, which increases the risk of disease. Thus, prior to each of these moves, the animal typically is treated for disease prevention. These buying patterns can also be affected by manufacturers’ and distributors’ marketing programs launched during the summer months, particularly in June, which can cause customers to purchase production animal health products in advance of actual usage. This kind of early purchasing may reduce the sales in the months these purchases would have typically been made. In the companion animal health products market, sales of flea, tick and heartworm products drive sales during the spring and summer months. See “Risk factors—Our quarterly operating results may fluctuate due to factors outside of management’s control.” Additionally, since many of our manufacturer rebates prior to 2008 were based on a calendar year, the quarter ended December 31 was our most significant quarter for recognition of rebates. Since that time, sales growth goals have shifted from annual to quarterly or trimester goals. While we anticipate that this trend with respect to manufacturers' rebate programs will continue, we do not expect as strong an impact during the quarter ended December 31, 2010, as compared to calendar years prior to 2008.
10
Financial Information about Geographic Areas
The Company operates in a single business segment that includes the distribution of products and delivery of consultative services within the animal health industry. The following table presents the Company’s net sales and long-lived assets in different geographic locations:
|
Year Ended June 30,
|
||||||||||||
|
2010
|
2009
|
2008 (1)
|
||||||||||
|
Net sales:
|
||||||||||||
|
United States
|
$ | 600,289 | $ | 609,661 | $ | 669,311 | ||||||
|
Canada
|
68,069 | 56,546 | 46,473 | |||||||||
|
Other foreign countries
|
562 | 741 | 758 | |||||||||
|
Total
|
$ | 668,920 | $ | 666,948 | $ | 716,542 | ||||||
|
Long-lived assets:
|
||||||||||||
|
United States
|
$ | 128,274 | $ | 134,480 | $ | 164,593 | ||||||
|
Canada
|
11,818 | 10,476 | 8,741 | |||||||||
|
Other foreign countries
|
—
|
—
|
3 | |||||||||
|
Total
|
$ | 140,092 | $ | 144,956 | $ | 173,337 | ||||||
Net sales are attributable to geographic areas based upon location of customer. Neither the Company nor any individual country depends upon any single customer for more than 10% of its sales. Long-lived assets are based upon physical location.
|
(1)
|
The Canada data for 2008 includes information from the date of acquisition of Kane in October 2007 (see note 4 to the consolidated financial statements).
|
Website
We maintain a website on the World Wide Web at www.ahii.com. We make available, free of charge through our website, our Annual Report on Form 10-K, Quarterly Reports on Form 10-Q, Current Reports on Form 8-K, including exhibits thereto, and any amendments to those reports filed or furnished pursuant to Section 13(a) or 15(d) of the Exchange Act, as soon as reasonably practicable after the reports are electronically filed with or furnished to the Securities and Exchange Commission (SEC). Our reports that are filed with, or furnished to, the SEC are also available at the SEC’s website at www.sec.gov. You may also obtain copies of any of our reports filed with, or furnished to, the SEC, free of charge, at the SEC’s public reference room at 100 F Street, N.E., Washington, DC 20549.
11
Our operations and financial results are subject to various risks and uncertainties that could materially adversely affect our business, financial condition, results of operations and the trading price of our common stock.
Risks Relating to Our Business
Our inability to maintain relationships with manufacturers could have a material adverse effect on our business, financial condition and results of operations.
We distribute more than 40,000 products sourced from more than 1,500 manufacturers. We currently do not manufacture any of our products and are dependent on manufacturers for our supply of products. Our top 10 manufacturer-supplied products accounted for approximately 61% of our purchases in fiscal 2010, and one manufacturer, Pfizer, Inc., or Pfizer, accounted for approximately 23% of our purchases.
Our ability to sustain our gross margins has been, and will continue to be, dependent in part upon our ability to obtain favorable terms and access to new and existing products from our manufacturers. These terms may be subject to changes from time to time by manufacturers. Any such changes could adversely affect our net sales and operating results. We do not typically have long-term written agreements with our manufacturers. Most of our agreements with manufacturers are for one-year periods, and in many cases, we do not have any contract with our manufacturers. Upon expiration, we may not be able to renew our existing agreements on favorable terms, or at all. If we lose the right to distribute products under such agreements, we may lose access to certain products and thus lose a competitive advantage. Potential competitors could sell products from manufacturers that we fail to continue with and erode our market share. The loss of one or more of our large manufacturers, a material reduction in their supply of products to us or material changes in the payment or pricing terms we obtain from them could have a material adverse effect on our business, financial condition and results of operations.
Some of our manufacturers compete with us by selling directly to veterinarians and animal owners and other manufacturers may also decide to compete with us in the future by pursuing or increasing their efforts in direct marketing and sales of their products. These manufacturers could sell their products at lower prices and maintain a higher gross margin on their product sales than we can. In this event, veterinarians or animal owners have and may increasingly elect to purchase animal health products directly from these manufacturers. Increased competition from any manufacturer of animal health products could significantly reduce our market share and adversely impact our financial results.
In addition, we may not be able to establish or maintain relationships with key manufacturers in the animal health products industry if we have established relationships with competitors of these key manufacturers. Our inability to establish or maintain such relationships could have a material adverse effect on our net sales or gross profit.
An adverse change in manufacturer rebates or our inability to meet applicable rebate targets has decreased our margins in the past and could continue to materially and negatively affect our business.
The terms under which we purchase products from many manufacturers of animal health products entitle us to receive a rebate based on the attainment of various goals, including certain growth goals and sales targets. Rebates have a material impact on our profitability. We cannot assure you as to the amount of rebates that we will receive in any given year. Factors outside of our control, such as customer preferences or manufacturer supply issues, can have a material impact on our ability to achieve the growth goals established by our manufacturers, which may reduce the amount of rebates we receive. Manufacturers may fail to pay rebates earned, or adversely change the terms of some or all of these rebate programs. For example, during fiscal 2009, one of our key manufacturers eliminated a portion of its rebate program previously offered to its distributors. If this elimination becomes a permanent change in such manufacturer's rebate program, or other manufacturers initiate changes to their existing rebate programs, this may have a material adverse effect on our gross profit and operating results in any given quarter or year. Further manufacturers may reduce or eliminate the amount of rebates offered under their programs, increase the growth goals or other conditions we must meet to earn rebates to levels that we are unable to achieve, or fail to pay amounts earned under their programs. The occurrence of any of these events could have an adverse impact on our profitability.
12
The outbreak of an infectious disease within an animal population could have a significant adverse effect on our business and results of operations.
An outbreak of disease affecting animals, such as foot-and-mouth disease, Newcastle disease, avian flu and bovine spongiform encephalopathy, commonly referred to as “mad cow disease,” could result in the widespread destruction of potentially affected animals to limit any such highly contagious diseases. Such destruction could result in a reduction in demand for animal health products, such as our pharmaceuticals, biologicals, and medicated additives, which represent a significant portion of our fiscal 2010 net sales. In addition, outbreaks of or concerns about these or other diseases could create unfavorable publicity that may have a material adverse effect on consumer demand for meat, dairy and poultry products, and, as a result, on our customers’ demand for the products we distribute. The outbreak of a disease among the companion animal population could cause a reduction in the demand for companion animals, which, in turn, could adversely affect our business.
We may not be able to raise needed capital on favorable terms or at all.
We expect that our existing sources of cash, together with any funds generated from operations, will be sufficient to meet our anticipated capital needs through May 2011. At that time, we will require additional capital to refinance or retire our Revolver and Term Note. Financing may not be available when needed and, if such financing is available, it may not be available on terms favorable to us. Our failure to raise capital when needed could have an adverse effect on our business, financial condition and results of operations.
The loss of products or delays in product availability from one or more manufacturers could substantially harm our business.
We generally purchase products from our manufacturers through purchase orders rather than through long-term supply agreements. There can be no assurance, however, that our manufacturers will be able to meet their obligations under these purchase orders or that we will be able to compel them to do so. We face the following risks by relying on manufacturers:
|
•
|
Some of our manufacturers are subject to ongoing periodic unannounced inspection by regulatory authorities, including the FDA, the USDA, the EPA, the DEA and other federal and state agencies for compliance with strictly enforced regulations. We do not have control over our manufacturers’ compliance with these regulations and standards. Violations by our manufacturers could potentially lead to interruptions in our supply that could lead to lost sales to competitive products that are more readily available.
|
||
|
•
|
If a purchase order cannot be filled or a certain product line is discontinued or recalled, then we would not be able to continue to offer our customers the same breadth of products. Our sales and operating results would likely suffer unless we were able to find an alternate supply of a similar product.
|
||
|
•
|
Agreements may commit us to certain minimum purchase levels or other spending obligations. It is possible we will not be able to meet such obligations, which would create an increased drain on our financial resources and liquidity.
|
||
|
•
|
If market demand for our products increases suddenly, our current manufacturers might not be able to fulfill our commercial needs, which may result in substantial delays in meeting market demand. If we generate more demand for a product than one of our manufacturers is capable of handling, we could experience large backorders and potentially lost sales to competitive products that are more readily available.
|
||
|
•
|
We may not be able to control or adequately monitor the quality of products we receive from our manufacturers. Poor quality products could damage our reputation with our customers or subject us to potential legal liability to such customers.
|
Potential problems with manufacturers such as those discussed above, could substantially decrease sales of our products, lead to higher costs and damage our reputation with our customers.
13
Our quarterly operating results may fluctuate due to factors outside of management’s control.
Our quarterly operating results may significantly fluctuate, and you should not rely on them as an indication of our future results. Our future net sales and results of operations may fluctuate significantly due to a combination of factors, many of which are outside of management’s control. The most important of these factors include:
| • | changes in or availability of manufacturer contracts; | ||
|
•
|
manufacturer rebates based upon attaining certain growth goals;
|
||
|
•
|
the ability to borrow on our revolving credit facility, extend the terms of our revolving credit facility or obtain alternative financing on favorable terms or at all;
|
||
|
•
|
the impact of vendor consolidation on our business;
|
||
|
•
|
changes in the way manufacturers introduce or deliver products to market;
|
||
|
•
|
fluctuations in commodity prices;
|
||
|
|
•
|
seasonality;
|
|
|
•
|
changes in customer demands;
|
||
|
•
|
the impact of general economic trends on our business;
|
||
|
•
|
the recall of a significant product by one of our manufacturers;
|
||
|
|
•
|
changes in climate (e.g., droughts) or other adverse natural conditions;
|
|
|
•
|
the impact of tightening credit standards and/or access to credit on behalf of our customers and suppliers; and
|
||
|
•
|
competition.
|
For example, since many of our manufacturer rebates prior to 2008 were based on a calendar year, the quarter ended December 31 was our most significant quarter for recognition of rebates. Since that time, sales growth goals have shifted from annual to quarterly or trimester goals. While we anticipate that this trend with respect to manufacturers' rebate programs will continue, we do not expect as strong an impact during the quarter ended December 31, 2010, as compared to calendar years prior to 2008.
We may be unable to reduce operating expenses quickly enough to offset any unexpected shortfall in net sales. If we have a shortfall in net sales without a corresponding reduction to our expenses, operating results may suffer. Our operating results for any particular quarter may not be indicative of future operating results. You should not rely on quarter-to-quarter comparisons of results of operations as an indication of our future performance.
Loss of key personnel could adversely affect our operations.
We are currently dependent to a significant degree upon the ability and experience of our senior executives, including President and Chief Executive Officer James Robison. We currently have employment agreements with these executives that contain non-competition restrictions following termination of employment. The loss of any of our senior executives could adversely affect our ability to conduct our operations or to achieve growth through acquisitions.
In addition, we are dependent upon our group presidents and our sales representatives to market and sell our products and provide our services. These individuals develop relationships with our customers that could be damaged if these employees are not retained. We face intense current competition for the hiring and retention of these representatives, and many professionals in the field that may otherwise be attractive candidates for us to hire may be bound by non-competition agreements with our competitors. We expect such competition to increase in the event that general economic conditions continue or worsen. Any failure on our part to hire, train and retain a sufficient number of qualified sales representatives would damage our business. We generally enter into agreements that contain confidentiality and non-solicitation provisions with our employees. We actively pursue former employees who breach their obligations to us, as well as competitors which interfere with our agreements with our employees.
14
Our market is highly competitive. Failure to compete successfully could have a material adverse effect on our business, financial condition and results of operations.
The sale and distribution of animal health products is highly competitive, continually evolving and subject to technological change. We compete directly with both geographically diverse and regional, broad-line animal health products distributors, as well as companies that specialize in distributing primarily ethical drug products to veterinarians and over-the-counter drugs directly to animal owners and other end-users. Additionally, certain manufacturers currently compete through the direct marketing of products, and other manufacturers may decide to do so in the future. We compete with numerous manufacturers and distributors based on customer relationships, service and delivery, product selection, price and e-commerce capabilities. Some of our competitors may have greater financial and other resources than we do. Many of our competitors have comparable product lines or distribution strategies that directly compete with ours. Our competitors could obtain exclusive rights to distribute certain products, eliminating our ability to distribute those products. Most of our products are available from several sources, including other distributors and manufacturers, and our customers typically have relationships with several distributors and manufacturers. Because we generally do not have long-term contracts with our customers, our customers could buy products from our competitors. If we do not compete successfully against these organizations, it could have a material adverse effect on our business, financial condition and results of operations. Our primary competitors, excluding manufacturers, include the following and other national, regional, local and specialty distributors: Butler Schein Animal Health Supply, LLC , IVESCO, LLC (Iowa Veterinary Supply) , Lextron, Inc., MWI Veterinary Supply, Inc., Professional Veterinary Products, Ltd. and Webster Veterinary Supply, a division of Patterson Companies, Inc.
The general economic downturn may adversely affect our business.
A deepening or protraction of the general economic downturn could further increase volatility in feed and animal protein commodity prices, reduce or eliminate sources of credit available to our customers, as well as reduce consumer discretionary spending on animal health products. Such volatility and/or tightening of credit could further deteriorate the financial condition of our customers, and may ultimately lead our customers to reduce their working capital. As a result, we may experience reduced demand for our products and services, and may be unable to collect amounts owed, each of which could materially impact our results of operations and financial condition. While we believe this is not a permanent trend in the market and demand will return as commodity prices normalize, a further decline in animal protein commodity prices combined with a further increase in feed commodity prices could significantly impact the financial viability of our production animal customers and could limit our ability to maintain market share and profitability.
Consolidation among animal health product vendors may decrease our sales and profitability.
Consolidation among animal health products vendors could result in our vendors increasing their market share, which could give them greater pricing power and make it easier for such vendors to sell their products directly to animal health customers, both of which would decrease our net sales and profitability and increase the competition for our customers. Finally, if our current vendors consolidate, their management teams are more likely to change, which could result in adverse changes in distribution practices.
On October 15, 2009, Pfizer completed its acquisition of Wyeth, which includes Fort Dodge as a subsidiary. In connection with this acquisition, Pfizer divested certain animal health products to Boehringer Ingelheim and Bimeda. Fort Dodge supplied products that accounted for approximately 7.5% of our revenues for fiscal year 2009. Of this amount, based on information received from Pfizer, Boehringer Ingelheim and Bimeda, we estimate that approximately 50% of such revenues were attributable to products now owned by Pfizer, 40% of such revenues were attributable to products now owned by Boehringer Ingelheim, and 10% of such revenues were attributable to products now owned by Bimeda.
On March 9, 2009, Merck announced that it had entered into an agreement to acquire all of the outstanding stock of Schering-Plough. Merial Limited, a joint venture between Merck & Co., Inc. and Sanofi Aventis S.A., and Intervet-Schering, a subsidiary of Schering-Plough, are also two of our largest vendors. On November 3, 2009, Merck and Schering-Plough completed their merger under which Merck acquired all of the outstanding stock of Schering-Plough. Merial was a joint venture between Merck and Sanofi-Aventis, and Sanofi-Aventis acquired Merck's interest in Merial shortly before Merck and Schering-Plough completed their merger. On March 9, 2010, Sanofi-Aventis announced that it exercised an option to combine the Intervet/Schering-Plough Animal Health business with Merial to form an animal health joint venture that would be equally owned by the new Merck and Sanofi-Aventis. The Merial and Intervet/Schering-Plough joint venture is subject to the execution of final agreements, approval by the relevant competition authorities, and is expected to close in the first calendar quarter of 2011. Intervet/Schering-Plough is our second largest vendor as measured by our revenues in fiscal year 2010.
15
The surviving companies from these transactions will have high market shares with respect to certain animal health products, and they could use their increased leverage in the channel to negotiate terms with distributors that are materially worse to the distributor than the terms that we have been able to negotiate with Pfizer, Fort Dodge, Boehringer Ingelheim, Merial and Intervet-Schering individually while they were competing with each other. There also remains uncertainty related to any changes to the terms that may be included in the vendor contracts we negotiate for the upcoming year as a result of these transactions. There is also a possibility of product disruption as these companies integrate their operations which could adversely impact our financial results. Further consolidation among animal health products vendors could result in our vendors further increasing their market share, which could give vendors greater pricing power and make it easier for such vendors to sell their products directly to animal health customers, both of which could decrease our net sales and profitability.
Consolidation among our customers may decrease our net sales and profitability.
We believe consolidation of the highly fragmented customer base in the animal health products market is accelerating due to the volatility in feed and animal protein commodity prices and more limited sources of credit available to our customers. For example, according to the USDA, the number of cow/calf operations in the United States decreased by approximately 213,000 operations, or 12% per year from 2007 to 2009. As individual customers grow in size through consolidation, the loss of any one of them would have an increasingly adverse effect on our net sales and profitability. Furthermore, as our current customers consolidate, their management teams are more likely to change, which could result in changes in purchase practices and potentially result in the loss of such customers’ business.
Unprecedented volatility in the animal health products market may impact our profitability.
Our profitability depends on, among other things, our ability to implement and/or maintain each of the following:
|
•
|
sales and marketing programs;
|
|||||
|
•
|
customer service levels;
|
|||||
|
•
|
current and new product and service lines;
|
|||||
|
•
|
manufacturer relationships;
|
|||||
|
•
|
technological support which equals or exceeds our competitors;
|
|||||
|
•
|
recruitment and training of new personnel; and
|
|||||
|
•
|
operational and financial control systems.
|
|||||
Our ability to successfully offer products and services and implement our business plan requires an effective planning and management process. We expect that we will need to continue to improve our financial and managerial controls, reporting systems and procedures and to expand the training of our employees. While we believe our current systems have sufficient capacity to meet our projected needs, we may need to increase the capacity of our current systems to meet additional or unforeseen demand. If we are not able to manage our growth, our customer service quality could deteriorate, which could result in decreased sales or profitability. Further, the cost of our operations may not decline as rapidly as a decline in net sales, which could negatively impact our profitability.
We are subject to currency exchange rate risks.
We conduct operations in Canada and Taiwan involving transactions denominated in foreign currencies. Since our financial statements are denominated in U.S. dollars, changes in currency exchange rates between the U.S. dollar and other currencies will have an impact on our income. We cannot assure that currency exchange rate fluctuations will not adversely affect our results of operations and financial condition.
16
Our substantial indebtedness could adversely affect our financial condition and ability to fulfill our debt obligations and otherwise adversely impact our business and growth prospects.
As of June 30, 2010, we had outstanding indebtedness under our credit agreements of $129.3 million. Our substantial indebtedness could have important consequences to you. For example, it could:
|
•
|
make it more difficult for us to satisfy our obligations with respect to our revolving credit facility, term loan indebtedness and other current and future indebtedness;
|
|
•
|
increase our vulnerability to adverse economic and industry conditions;
|
|
•
|
require us to dedicate a substantial portion of our cash flow from operations to the payment of our indebtedness, thereby reducing the availability of cash to fund working capital and capital expenditures and for other general corporate purposes;
|
|
•
|
restrict us from making strategic acquisitions and exploiting business opportunities;
|
|
•
|
place us at a disadvantage compared to our competitors that have less debt; and
|
|
•
|
limit our flexibility in planning for, or reacting to, changes in our business and the industry in which we operate.
|
Furthermore, substantially all of our indebtedness bears interest at floating rates. If these rates were to increase significantly, our ability to borrow additional funds may be reduced and the risks related to our substantial indebtedness would intensify.
Our ability to make payments on and refinance our indebtedness, and to fund our operations, working capital and capital expenditures, depends on our ability to generate cash in the future. We cannot assure you that our business will generate sufficient cash flow or that future borrowings will be available to us in an amount sufficient to enable us to pay amounts due on our indebtedness or to fund our other liquidity needs. If we do not generate sufficient cash flow, and additional borrowings or refinancings or proceeds of asset sales are not available to us, we may not have sufficient cash to enable us to meet all of our obligations.
In addition, the agreements governing our indebtedness include certain covenants that, among other things, restrict our ability to incur additional indebtedness, make certain payments, sell assets, enter into certain transactions with affiliates and create liens. Moreover, certain of these agreements require us to maintain specified financial ratios. These and other covenants in our current and future agreements may restrict our ability to fully pursue our business strategies and adversely affect our growth prospects. Our ability to comply with such covenants may be affected by changes in our operating and financial performance, changes in general business and economic conditions, adverse regulatory developments or other events beyond our control. The breach of any of these covenants could result in a default under our indebtedness, which could cause those and other obligations to become due and payable.
Changes in consumer preferences could adversely affect our business.
The demand for production animal health products is heavily dependent upon consumer demand for beef, dairy, poultry and swine. The food industry in general is subject to changing consumer trends, demands and preferences. Trends within the food industry change often and our failure to anticipate, identify or react to changes in these trends could lead to, among other things, reduced demand and price reductions for our animal health products, and could have a material adverse effect on our business. Moreover, even if we do anticipate and identify these trends, we may be unable to react effectively. For example, changes in consumer diets may negatively affect consumer demand for beef, dairy, poultry and/or swine, and therefore reduce the demand for our production animal health products. During previous downturns in these markets, we experienced prolonged declines in sales and profitability.
17
We could face considerable business and financial risk in implementing our acquisition strategy.
As part of our growth strategy, from time to time we consider acquiring complementary businesses. We regularly engage in discussions with respect to possible acquisitions. We cannot assure you that we will be successful in consummating future acquisitions on favorable terms or at all. Future acquisitions could result in potentially dilutive issuances of equity securities, the incurrence of debt and contingent liabilities and an increase in amortization expenses related to intangible assets, which could have a material adverse effect upon our business.
Acquisitions involve a number of risks relating to our ability to integrate an acquired business into our existing operations. The process of integrating the operations of an acquired business, particularly its personnel, could cause interruptions to our business. Some of the risks we face include:
|
•
|
the need to spend substantial operational, financial and management resources in integrating new businesses, technologies and products, and difficulties management may encounter in integrating the operations, personnel or systems of acquired businesses;
|
|
|
•
|
retention of key personnel, customers and manufacturers of the acquired business;
|
|
|
•
|
the occurrence of a material adverse effect on our existing business relationships with customers or manufacturers, or both, resulting from future acquisitions or business combinations could lead to a termination of or otherwise affect our relationships with such customers or manufacturers;
|
|
|
•
|
impairments of goodwill and other intangible assets; and
|
|
|
•
|
contingent and latent risks associated with the past operations of, and other unanticipated costs and problems arising in, an acquired business.
|
The risks associated with acquisitions could have a material adverse effect upon our business.
If we fail to comply with or become subject to more onerous government regulations, our business could be adversely affected.
The animal health products industry is subject to changing political and regulatory influences. Both state and federal government agencies regulate the distribution of certain animal health products and we are subject to regulation, either directly or indirectly, by the FDA, USDA, EPA, DEA, the Department of Transportation and state boards of pharmacy as well as comparable state and foreign agencies. The regulatory stance these agencies take could change. In addition, our manufacturers are subject to regulation by the FDA, the USDA, the EPA, the DEA, and other federal and state agencies, and material changes to the applicable regulations could affect our manufacturers’ ability to manufacture certain products, which could adversely impact our product supply. In addition, some of our customers may rely, in part, on farm and agricultural subsidy programs. Changes in the regulatory positions that impact the availability of funding for such programs could have an adverse impact on our customers’ financial positions, which could lead to decreased sales of our products to them.
We strive to maintain compliance with these laws and regulations. If we are unable to maintain or achieve compliance with these laws and regulations, we could be subject to substantial fines or other restrictions on our ability to provide competitive distribution services, which could have an adverse impact on our financial condition.
We cannot assure you that existing laws and regulations will not be revised or that new, more restrictive laws will not be adopted or become applicable to us or the products we distribute. We cannot assure you that the manufacturers of products may become subject to more stringent laws will not try to recover any or all increased costs of compliance from us by increasing the prices at which we purchase products from them, or we will be able to recover any such increased prices from our customers. We also cannot assure you our business and financial condition will not be materially and adversely affected by future changes in applicable laws and regulations.
18
We may be subject to product liability and other claims in the ordinary course of business.
We distribute products that are manufactured exclusively by third parties. As a result, we have no control over the manufacturing process and face the risk of product liability and other claims in the ordinary course of business. We maintain insurance policies, and in many cases we have indemnification rights against such claims from the manufacturers of the products we distribute. However, our ability to recover under insurance or indemnification arrangements is subject to the terms of such arrangements and the financial viability of the insurers and manufacturers. We cannot assure you our insurance coverage or the manufacturers’ indemnity will be available or sufficient in any future cases brought against us.
Operational problems at our replenishment and distribution facility in Memphis, TN or any of our distribution locations could have a material adverse effect on our business, financial condition and results of operations.
Approximately 32% of the dollar volume of our product sales flow through our replenishment and distribution facility located in Memphis, Tennessee. Unforeseen or recurring operational problems at this facility or any of our other distribution facilities could impair or disrupt our ability to deliver our products to our customers in a timely manner, and could have a material adverse effect upon our customer relationships, business, financial condition and results of operations. Although we do carry property insurance, which may protect us in the event of certain inventory losses, we do not carry business interruption insurance. Therefore, we will not be compensated for certain losses that may occur as a result of a major disruption to our facilities. Disruptions at any of our facilities could be caused by:
|
•
|
maintenance outages;
|
||
|
•
|
prolonged power failures or reductions;
|
||
|
•
|
disruptions in the transportation infrastructure, including railroad tracks, bridges, tunnels or roads;
|
||
|
•
|
fires, floods, earthquakes or other catastrophic disasters;
|
||
|
•
|
labor difficulties; or
|
||
|
•
|
other operational problems.
|
If third parties claim that we infringe upon their intellectual property rights, our financial results could be adversely affected.
We face the risk of claims that we have infringed third parties’ intellectual property rights, including trademarks, trade names, and patents. Third parties may claim that our proprietary branded products infringe their trademarks and/or trade names; that our consultative services infringe a patented machine, process, or business method; and/or that our products infringe such third parties’ patented animal health products. We have been the recipient of such claims in the past. We have not conducted an independent review of trademarks or patents issued to third parties. The large number of trademarks and patents, the rapid rate of new trademark and patent issuances, the complexities of the technology involved in patents and uncertainty of litigation increase the risk of business assets and management’s attention being diverted to intellectual property litigation.
|
•
|
be expensive and time consuming to defend;
|
||
|
•
|
cause us to cease making, licensing or using products or services that incorporate the challenged intellectual property;
|
||
|
•
|
require us to redesign, reengineer, or rebrand our products or packaging, if feasible;
|
||
|
•
|
divert management’s attention and resources; or
|
||
|
•
|
require us to enter into royalty or licensing agreements in order to obtain the right to use a third party’s intellectual property.
|
Any royalty or licensing agreements, if required, may not be available to us on acceptable terms or at all. A successful claim of infringement against us could result in our being required to pay significant damages, enter into costly license or royalty agreements, or stop the sale of certain products, any of which could have a negative impact on our financial results and harm our future prospects.
Our intellectual property rights may be inadequate to protect our business.
We attempt to protect our intellectual property rights through a combination of patent, trademark, copyright and trade secret laws, as well as licensing agreements and third-party nondisclosure and assignment agreements. Our failure to obtain or maintain adequate protection of our intellectual property rights for any reason could have a material adverse effect on our business.
19
We rely on our trademarks, trade names, service marks, and brand names to distinguish our proprietary branded products and services from the products and services of our competitors, and have registered or applied to register many of these trademarks and servicemarks. We cannot assure you that our trademark and servicemark applications will be approved. Third parties may also oppose our trademark and servicemark applications, or otherwise challenge our use of the trademarks and servicemarks. In the event that our marks are successfully challenged, we could be forced to rebrand our proprietary branded products and services, which could result in loss of brand recognition, and could require us to devote resources to advertise and market new brands. Further, we cannot assure you that competitors will not infringe upon our marks, or that we will have adequate resources to enforce our marks.
The pursuit and assertion of patent rights involve complex legal and factual determinations and, therefore, are characterized by some uncertainty. In addition, the laws governing patentability and the scope of patent coverage continue to evolve. As a result, we cannot assure you patents will be issued from any of our patent applications. The scope of any of our patents, if issued, may not be sufficiently broad to offer meaningful protection. In addition, our patents, if they are issued, may be successfully challenged, invalidated, circumvented or rendered unenforceable so that our patent rights might not create an effective competitive barrier for certain of our niche products. Further, we cannot assure you that competitors will not infringe upon our patent, or that we will have adequate resources to enforce our patent.
We also rely on unpatented proprietary technology. It is possible that others will independently develop the same or similar technology or otherwise obtain access to our unpatented technology. To protect our trade secrets and other proprietary information, we require employees, consultants, advisors and collaborators to enter into confidentiality agreements. We cannot assure you that these agreements will provide meaningful protection for our trade secrets, know-how or other proprietary information in the event of any unauthorized use, misappropriation or disclosure of such trade secrets, know-how or other proprietary information. Our inability to maintain the proprietary nature of our technologies for any reason could have a material adverse effect on our business.
If our proprietary branded products infringe on the intellectual property rights of others, we may be required to indemnify our customers for any damages they suffer.
Third parties may assert infringement claims against our customers. These claims may require us to initiate or defend protracted and costly litigation on behalf of our customers, regardless of the merits of these claims. If any of these claims succeed, we may be forced to pay damages on behalf of our customers or may be required to obtain licenses for the products they use. If we cannot obtain all necessary licenses on commercially reasonable terms, our customers may be forced to stop using our products.
We are subject to significant environmental regulation and environmental compliance expenditures and liabilities.
We are subject to environmental, health and safety laws and regulations concerning, among other things, air and wastewater discharges, the generation, handling, storage, transportation and disposal of pesticides, hazardous waste and toxic substances. Pursuant to some of these laws and regulations, we are required to obtain permits from governmental authorities for certain operations. We incur costs to comply with such laws, regulations and permits, and we cannot assure you that we have been or will be at all times in complete compliance with such laws, regulations and permits. If we violate or fail to comply with these laws, regulations or permits, we could be fined or otherwise sanctioned by regulators. We could also be responsible for costs incurred relating to contamination at our third party waste disposal sites or relating to damages incurred as a result of human exposure to such substances or other environmental damage caused by our operations or our disposal of waste. In addition, our past and present ownership or operation of real property that is contaminated with hazardous or toxic substances could also result in an obligation to perform or pay for a clean-up or other damages, regardless of whether we knew of or were responsible for such contamination.
Environmental, health and safety laws and regulations are complex, change frequently and have tended to become more stringent over time. We cannot assure you that our costs and liabilities relating to these current and future laws will not adversely affect our business or profitability.
Performance problems with our information systems could damage our business.
We currently process all customer transactions and data at our facilities located in Westlake, Texas. Although we have safeguards for emergencies, including, without limitation, back-up systems, the occurrence of a major catastrophic event or other system failure at any of our distribution facilities could interrupt data processing or result in the loss of stored data. This may result in the loss of customers or a reduction in demand for our services. Only some of our systems are fully redundant and we do not carry business interruption insurance. If a disruption occurs, our profitability and results of operations could suffer. Our information systems are dependent on third party software, global communications providers, telephone systems and other aspects of technology and Internet infrastructure that are susceptible to failure. While we have implemented security measures and some redundant systems, our customer satisfaction and our business could be harmed if we or our manufacturers experience any system delays, failures, loss of data, outages, computer viruses, break-ins or similar disruptions.
20
We recorded a charge to earnings as a result of impairment in our goodwill during fiscal 2009, and we may be required to record an additional charge to earnings if our goodwill or other intangible assets become impaired in the future.
As of June 30, 2010, our balance sheet included goodwill and other intangible assets totaling $122.4 million. As of June 30, 2009, we performed our annual impairment test of goodwill and other intangible assets. As a result of this testing, we concluded the carrying amount of goodwill exceeded its fair value, and we recorded a non-cash impairment charge of $35.0 million. The carrying values of all other intangible assets were not impaired. As of June 30, 2010, we performed our annual impairment test of goodwill and other intangible assets and determined that no impairment occurred during fiscal 2010. A future significant decline in our fair value could cause additional impairment of goodwill and other intangible assets. If impairment of our goodwill or other intangible assets is determined, we will be required to record an additional charge to earnings in the period of such determination.
Risks related to the common stock and our capital structure
There is a limited history of a trading market for our common stock, and the market price of our common stock may be highly volatile or may decline regardless of our operating performance. As a result, our stockholders could lose a significant part of their investment.
There has been a public market for our common stock only since the completion of our initial public offering in January 2007. The trading market in our common stock has been and may continue to be volatile.
Broad market and industry conditions and trends may cause fluctuations in the market price of our common stock, regardless of our actual operating performance. An active trading market for shares of our common stock may not be sustained on a consistent basis. The public trading price for our common stock will be affected by a number of factors, including:
|
•
|
depth and liquidity of the market for our common stock;
|
|
•
|
investor perception of our business;
|
|
•
|
profit margins in the animal health products industry generally;
|
|
•
|
reported progress of our business, relative to investor expectations;
|
|
•
|
changes in earnings estimates, investors’ perceptions, recommendations by securities analysts or our failure to achieve analysts’ earning estimates;
|
|
•
|
quarterly variations in our or our competitors’ results of operations;
|
|
•
|
general market conditions and other factors unrelated to our operating performance or the operating performance of our competitors;
|
|
•
|
future sales of our common stock;
|
|
•
|
announcements by us, or our competitors, of acquisitions, significant contracts, or commercial relationships;
|
|
•
|
commencement of, or involvement in, litigation;
|
|
•
|
any major change in our board of directors or management;
|
|
•
|
changes in governmental regulations or in the status of our regulatory approvals;
|
|
•
|
a lack of, limited, or negative industry or security analyst coverage; and
|
|
•
|
the other factors described elsewhere in these “Risk Factors.”
|
21
As a result of these factors, our stockholders may not be able to resell their shares at, or above, their purchase price. In addition, the stock market in general, and the NASDAQ Global Market in particular, have experienced substantial price and volume fluctuations that have often been unrelated or disproportionate to the operating performance of particular companies affected. These broad market and industry factors may materially harm the market price of our common stock, regardless of our operating performance. In the past, following periods of volatility in the market price of certain companies’ securities, securities class-action litigation has been instituted against these companies. Such litigation, if instituted against us, could adversely affect our business and results of operations.
Future sales of our shares could adversely affect the market price of our common stock.
We have been a public company only since January 2007. For the quarterly period ended June 30, 2010, the average daily trading volume of our common stock on the NASDAQ Global Select Market was less than 34,000 shares. Any future sale by us or our current stockholders of our common stock in the public market, or the perception that sales could occur, could adversely affect the prevailing market price for our common stock.
Substantially all of the holders of our common stock who acquired their shares prior to our initial public offering have rights, subject to some limited conditions, to demand that we file a registration statement on their behalf to register their shares or that we include their shares in a registration statement that we file on our behalf or on behalf of other stockholders. If such demand rights are exercised pursuant to the terms and conditions of the registration rights agreement and we are required to file an additional registration statement, we will incur significant expenses in connection with the filing of such registration statement. Additionally, the filing of an additional registration statement at the request of the stockholders may divert the attention of our senior management from our business operations.
Our directors and certain significant stockholders exercise significant control over us.
Our directors and significant stockholders, including investment funds affiliated with Charlesbank Capital Partners LLC, or Charlesbank, Heartland Advisors, Inc., and investment funds associated with Waddell & Reed, Inc., collectively control approximately 59% of our outstanding common stock. As a result, these stockholders are able to influence all matters requiring stockholder approval in ways that may not align with your interest as a stockholder, including the election of directors and approval of significant corporate transactions. This concentration of ownership may have the effect of delaying or preventing a change in control of us even if beneficial to you as a stockholder and might affect the market price of our common stock.
We may require additional capital in the future, which may not be available to us. Issuances of our equity securities to provide this capital may dilute your ownership in us.
We may need to raise additional funds through public or private debt or equity financings in order to:
|
•
|
take advantage of expansion opportunities;
|
||
|
•
|
acquire complementary businesses or technologies;
|
||
|
•
|
develop new services and products;
|
||
|
•
|
pay down or retire debt obligations; or
|
||
|
•
|
respond to competitive pressures.
|
Any additional capital raised through the issuance of our equity securities may dilute your percentage ownership interest in us. Furthermore, any additional financing we may need may not be available on terms favorable to us or at all. The unavailability of needed financing could adversely affect our ability to execute our growth strategy.
We do not currently intend to pay dividends on our common stock, and therefore you will likely not receive any return on your investment without selling your shares.
We currently intend to retain any future earnings for funding the growth of our business and repayment of existing indebtedness, and therefore, we do not currently anticipate declaring or paying cash dividends on our common stock. In addition, our credit agreements restrict us from paying such dividends.
22
Provisions in our certificate of incorporation and by-laws may deter third parties from acquiring us.
Our certificate of incorporation and by-laws contain provisions that may make the acquisition of us more difficult without the approval of our board of directors, including the following:
|
•
|
our board of directors is divided into three classes serving staggered three-year terms;
|
|
•
|
only our board of directors may call special meetings of our stockholders;
|
|
•
|
our stockholders may take action only at a meeting of our stockholders and not by written consent;
|
|
•
|
we have authorized undesignated preferred stock, the terms of which may be established and shares of which may be issued without stockholder approval;
|
|
•
|
stockholder approval of amendments of our certificate of incorporation or by-laws require a vote of 75% of our outstanding shares;
|
|
•
|
vacancies on the board of directors may be filled only by the directors;
|
|
•
|
our directors may be removed only for cause by the affirmative vote of the holders of 75% of the votes that all stockholders would be entitled to cast in the election of directors; and
|
|
•
|
we require advance notice for stockholder proposals.
|
These anti-takeover defenses could discourage, delay or prevent a transaction involving a change in control of us. These provisions could also discourage proxy contests and make it more difficult for you and other stockholders to elect directors of your choosing and cause us to take other corporate actions that you desire.
Section 203 of the Delaware General Corporation Law may delay, defer or prevent a change in control that our stockholders might consider to be in their best interests.
We are subject to Section 203 of the Delaware General Corporation Law which, subject to certain exceptions, prohibits “business combinations” between a Delaware corporation and an “interested stockholder,” which is generally defined as a stockholder who becomes a beneficial owner of 15% or more of a Delaware corporation’s voting stock, for a three-year period following the date that such stockholder became an interested stockholder absent prior approval of our board of directors. Section 203 could have the effect of delaying, deferring or preventing a change in control that our stockholders might consider to be in their best interests.
Not Applicable.
Our subsidiaries conduct operations out of 56 locations throughout the United States, two locations in Canada, and one location in Taiwan. Properties include distribution locations, retail locations, regional replenishment and distribution centers and our corporate headquarters. Our distribution locations range in size from 1,000 to 69,000 square feet. Our central replenishment and distribution facility located in Memphis, Tennessee, is comprised of two buildings totaling 112,000 square feet under leases that expire in January 2012 and June 2014, respectively. Our replenishment and distribution facility located in Visalia, California is comprised of one building totaling approximately 68,000 square feet under a lease that expires in December 2016. Our corporate headquarters are located in the Dallas/Fort Worth metropolitan area, where we lease approximately 42,000 square feet of commercial space under a lease that expires in August 2013. We own 23 locations, with the remainder leased under varying lease terms, ranging in maturities from one to ten years. Our facilities are in acceptable operating condition and generally adequate for current needs. We do not anticipate significant difficulty in obtaining lease renewals or alternate space as needed, although obtaining renewals or alternate space on acceptable terms cannot be assured.
We are involved in litigation from time to time in the ordinary course of our business. We are not currently involved in any outstanding litigation that we believe, individually or in the aggregate, will have a material adverse effect on our business, results of operations or financial condition.
23
|
Market for Registrant’s Common Equity, Related Stockholder Matters and Issuer Purchases of Equity Securities.
|
Performance Graph
The following graph compares the cumulative 41-month total return provided to stockholders on our common stock relative to the cumulative total returns of the Dow Jones US Index, and a customized peer group of four companies that includes: MWI Veterinary Supply, Owens & Minor, Patterson Companies and Henry Schein. An investment of $100 (with reinvestment of all dividends) is assumed to have been made in our common stock, in the peer group, and the index on January 31, 2007, and its relative performance is tracked through June 30, 2010.
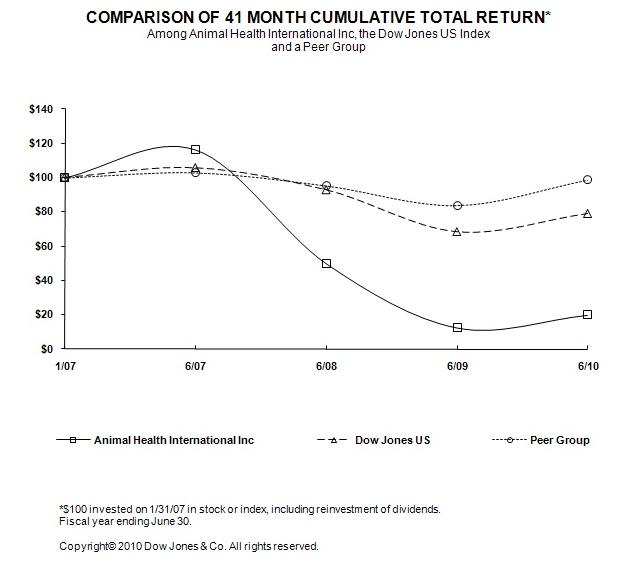
|
1/07
|
6/07
|
6/08
|
6/09
|
6/10
|
||
|
Animal Health International Inc
|
100.00
|
116.39
|
50.04
|
12.45
|
19.84
|
|
|
Dow Jones US
|
100.00
|
105.62
|
92.75
|
68.25
|
78.90
|
|
|
Peer Group
|
100.00
|
103.01
|
95.37
|
83.81
|
98.77
|
The stock price performance included in this graph is not necessarily indicative of future stock price performance.
24
Market Information
As of June 30, 2010, there were 103 holders of record of our common stock. We completed our initial public offering in January 2007, and prior to that time there was no public market for our common stock. Our common stock is listed and traded on the NASDAQ Global Select Market under the symbol AHII.
The following table sets forth the range of high and low sales prices of our common stock as reported by the NASDAQ Global Select Market, for the period from July 1, 2008 to August 31, 2010. The quotations represent interdealer quotations, without adjustments for retail mark ups, mark downs, or commissions, and may not necessarily represent actual transactions.
|
High
|
Low
|
|||||||
|
FISCAL 2009
|
||||||||
|
First Quarter
|
$
|
8.75
|
$
|
4.72
|
||||
|
Second Quarter
|
$
|
8.55
|
$
|
1.17
|
||||
|
Third Quarter
|
$
|
2.38
|
$
|
0.74
|
||||
|
Fourth Quarter
|
$
|
2.10
|
$
|
1.20
|
||||
|
FISCAL 2010
|
||||||||
|
First Quarter
|
$
|
2.26
|
$
|
1.19
|
||||
|
Second Quarter
|
$
|
2.90
|
$
|
2.05
|
||||
|
Third Quarter
|
$
|
2.43
|
$
|
1.70
|
||||
|
Fourth Quarter
|
$
|
2.77
|
$
|
1.88
|
||||
|
FISCAL 2011
|
||||||||
|
First Quarter (through August 31, 2010)
|
$
|
2.52
|
$
|
1.97
|
||||
Market Capitalization
As a result of the economic downturn, the price of our stock declined dramatically during fiscal 2009. This decline decreased our market capitalization and was a key factor that caused us to record a $35.0 million goodwill impairment charge as of June 30, 2009. During fiscal 2010, the price of our stock improved and correspondingly increased our market capitalization. As a result, no additional goodwill impairment was recorded as of June 30, 2010. We will continue to monitor our market capitalization and any other changes to our operations and operating business environment that could potentially cause additional impairment of our goodwill and other intangible assets.
Dividends
Our board of directors has discretion in determining whether to declare or pay dividends, which will depend upon our financial condition, results of operations, capital requirements and such other factors as the board of directors deems relevant. We currently anticipate that we will retain future earnings for the development, operation and expansion of our business. Moreover, our credit agreements impose restrictions on our ability to declare and pay dividends. We do not currently anticipate that we will declare any dividends on our common stock in the future. See “Risk factors—Risks related to the common stock, the offering and our capital structure—We do not currently intend to pay dividends on our common stock, and therefore you will likely not receive any return on your investment without selling your shares.”
Securities Authorized For Issuance Under Equity Compensation Plans
The following table sets forth information regarding securities authorized for issuance under our equity compensation plans as of June 30, 2010.
|
Number of securities to be issued upon exercise of outstanding options, warrants and rights
|
Weighted average exercise price of outstanding options,
warrants and rights(1)
|
Number of securities remaining available for
future issuance under equity compensation plans (excluding securities reflected in column (a))
|
|||||
|
(a)
|
(b)
|
(c)
|
|||||
|
Equity compensation plans approved
by security holders(2)
|
2,539,770
|
$
|
4.28
|
1,060,230
|
(3) | ||
|
Equity compensation plans not
approved by security holders(4)
|
—
|
—
|
—
|
||||
|
Total
|
2,539,770
|
$
|
4.28
|
1,060,230
|
|||
| (1) |
The weighted-average exercise price set forth in this column is calculated excluding outstanding deferred stock unit (“DSU”) and restricted stock unit (“RSU”) awards, since recipients are not required to pay an exercise price to receive the shares subject to these awards.
|
|
| (2) | Includes option, DSU, and RSU awards outstanding under our amended and restated 2007 Stock Option and Incentive Plan. | |
| (3) | Includes shares remaining available for future issuance under our amended and restated 2007 Stock Option and Incentive Plan. | |
| (4) | There are no equity compensation plans in place not approved by shareholders. |
Recent Sales of Unregistered Securities
We did not sell any unregistered securities during the fiscal year ended June 30, 2010.
Use of Proceeds from Registered Securities
None.
Purchases of Equity Securities by the Issuer and Affiliated Purchasers
None.
The following selected consolidated financial data should be read in conjunction with, and is qualified by reference to, our consolidated financial statements and notes to those consolidated financial statements, and “Management’s Discussion and Analysis of Financial Condition and Results of Operations,” included elsewhere in this annual report. The consolidated statement of operations data for the years ended June 30, 2010, 2009 and 2008, and the consolidated balance sheet data as of June 30, 2010 and 2009, are derived from our audited consolidated financial statements, which are included elsewhere in this annual report. The consolidated statement of operations data for the years ended June 30, 2007 and 2006, and the consolidated balance sheet data as of June 30, 2008, 2007 and 2006, are derived from our audited consolidated financial statements, which are not included in this annual report. Our historical results are not necessarily indicative of results to be expected for any future period.
26
Consolidated statement of operations data:
| (in thousands, except per share data and number of representatives) |
Year ended June 30,
|
|||||||||||||||||||
|
2010
|
As Revised
2009
|
2008
|
2007
|
2006
|
||||||||||||||||
|
Net sales
|
$
|
668,920
|
$
|
666,948
|
$
|
716,542
|
$
|
629,534
|
$
|
571,192
|
||||||||||
|
Direct cost of products sold
|
557,615
|
552,994
|
579,485
|
507,997
|
459,173
|
|||||||||||||||
|
Gross profit
|
111,305
|
113,954
|
137,057
|
121,537
|
112,019
|
|||||||||||||||
|
Selling, general, and
|
||||||||||||||||||||
|
administrative expenses(1)
|
90,969
|
100,454
|
101,886
|
88,123
|
81,428
|
|||||||||||||||
|
Depreciation and amortization(2)
|
8,362
|
8,223
|
7,349
|
6,504
|
6,414
|
|||||||||||||||
|
Goodwill impairment(3)
|
—
|
34,966
|
—
|
—
|
—
|
|||||||||||||||
|
Operating income (loss)
|
11,974
|
(29,689
|
) |
27,822
|
26,910
|
|
24,177
|
|||||||||||||
|
Other income (expense)
|
||||||||||||||||||||
|
Interest expense
|
(10,629
|
)
|
(8,761
|
)
|
(10,277
|
)
|
(18,307
|
)
|
(13,726
|
)
|
||||||||||
|
Other income
|
693
|
786
|
964
|
582
|
478
|
|||||||||||||||
|
Income (loss) before income taxes
|
2,038
|
(37,664
|
) |
18,509
|
9,185
|
|
10,929
|
|||||||||||||
|
Income tax benefit (expense)
|
(785
|
)
|
734
|
|
(7,408
|
)
|
(3,957
|
) |
(3,542
|
)
|
||||||||||
|
Net income (loss)
|
$
|
1,253
|
$
|
(36,930
|
) |
$
|
11,101
|
$
|
5,228
|
|
$
|
7,387
|
||||||||
|
Per share data:
|
||||||||||||||||||||
|
Earnings (loss) per common share
|
||||||||||||||||||||
|
Basic
|
$
|
0.05
|
$
|
(1.52
|
)
|
$
|
0.46
|
$
|
(13.01
|
)
|
$
|
0.43
|
||||||||
|
Dilutive
|
$
|
0.05
|
$
|
(1.52
|
)
|
$
|
0.46
|
$
|
(13.01
|
)
|
$
|
0.43
|
||||||||
|
Shares used in computing earnings per share:
|
||||||||||||||||||||
|
Basic
|
24,691
|
24,330
|
24,330
|
11,329
|
2,084
|
|||||||||||||||
|
Diluted
|
24,847
|
24,330
|
24,330
|
11,329
|
2,084
|
|||||||||||||||
|
Consolidated balance sheet data:
|
||||||||||||||||||||
|
Total assets
|
324,931
|
318,265
|
365,299
|
330,034
|
294,337
|
|||||||||||||||
|
Total current and long-term debt
|
129,339
|
127,092
|
138,421
|
118,886
|
137,634
|
|||||||||||||||
|
Total stockholders' equity (deficit)
|
66,464
|
|
60,579
|
96,224
|
86,115
|
(3,179
|
) | |||||||||||||
|
Cash dividend declared per common share
|
$
|
—
|
$
|
—
|
$
|
—
|
$
|
0.52
|
$
|
—
|
||||||||||
|
Other data:
|
||||||||||||||||||||
|
Adjusted EBITDA(4)
|
$
|
21,869
|
$
|
17,497
|
$
|
37,514
|
$
|
34,226
|
$
|
31,069
|
||||||||||
|
Field sales representatives(5)
|
222
|
221
|
242
|
238
|
218
|
|||||||||||||||
27
|
(1)
|
Selling, general, and administrative expenses include (a) salary, wages, commissions, and related benefits of $51,322, $55,204, $55,022, $47,619, and $43,958 for the years ended June 30, 2010, 2009, 2008, 2007, and 2006, respectively; (b) management and advisory service fees and reimbursement of out-of-pocket expenses paid to Charlesbank of $146 and $664 for the years ended June 30, 2007 and 2006, respectively.
|
|||
|
(2)
|
Depreciation expense consists of depreciation of property, plant and equipment and other assets and was $3,880, $3,617, $3,178, $3,129, and $3,039 for the years ended June 30, 2010, 2009, 2008, 2007, and 2006, respectively.
|
|||
|
(3)
|
Based upon the results of its annual impairment test performed as of June 30, 2009, the Company concluded the carrying value of goodwill exceeded its fair value and initially recorded a $25.2 million impairment charge as of June 30, 2009. In addition, during the quarter ended June 30, 2010, the Company identified an error in accounts payable. The impact of the correction of this error resulted in an additional charge of $9.8 million to goodwill impairment that was recorded as a revision to the June 30, 2009 results (see note 3 to the consolidated financial statements). The revised goodwill impairment charge for 2009 totaled $35.0 million.
|
|||
|
(4)
|
Adjusted EBITDA represents income before interest expense, income tax expense, depreciation and amortization, goodwill impairment, stock-based compensation, and acquisition costs. We present adjusted EBITDA as a supplemental performance measure because we believe it facilitates operating performance comparisons from period to period and company to company by backing out potential differences caused by variations in capital structures (affecting interest expense), tax positions (such as the impact on periods or companies of changes in effective tax rates or net operating losses), the age and book depreciation of fixed assets (affecting relative depreciation expense), the impact of purchase accounting and the impact of non-recurring acquisition costs. Because adjusted EBITDA facilitates internal comparisons of our historical financial position and operating performance on a more consistent basis, we also use adjusted EBITDA in measuring our performance relative to that of our competitors and in evaluating acquisition opportunities. Adjusted EBITDA is not a measurement of our financial performance under generally accepted accounting principles in the United States (GAAP), and should not be considered as an alternative to net income, operating income or any other performance measures derived in accordance with GAAP or as an alternative to cash flow from operating activities as a measure of our profitability or liquidity. We understand that although adjusted EBITDA is frequently used by securities analysts, lenders and others in their evaluation of companies, our calculation of adjusted EBITDA may not be comparable to other similarly titled measures of other companies. Adjusted EBITDA has limitations as an analytical tool, and you should not consider it in isolation, or as a substitute for analysis of our results as reported under GAAP. Some of these limitations are:
|
|||
|
•
|
adjusted EBITDA does not reflect our cash expenditures, or future requirements, for capital expenditures or contractual commitments;
|
||
|
•
|
adjusted EBITDA does not reflect changes in, or cash requirements for, our working capital needs;
|
||
|
•
|
adjusted EBITDA does not reflect the significant interest expense, or the cash requirements necessary to service interest or principal payments, on our debts;
|
||
|
•
|
although depreciation and amortization are non-cash charges, the assets being depreciated and amortized will often have to be replaced in the future, and adjusted EBITDA does not reflect any cash requirements for such replacements; and
|
||
|
•
|
other companies in our industry may calculate adjusted EBITDA differently than we do, limiting its usefulness as a comparative measure.
|
The following table reconciles adjusted EBITDA to net income (loss) as determined in accordance with GAAP for the periods indicated:
|
Year ended June 30,
|
||||||||||||||||||||
|
(in thousands)
|
2010
|
As Revised
2009
|
2008
|
2007
|
2006
|
|||||||||||||||
|
Net income (loss)
|
$ | 1,253 | $ | (36,930 | ) | $ | 11,101 | $ | 5,228 | $ | 7,387 | |||||||||
|
Interest expense
|
10,629 | 8,761 | 10,277 | 18,307 | 13,726 | |||||||||||||||
|
Income tax expense (benefit)
|
785 | (734 | ) | 7,408 | 3,957 | 3,542 | ||||||||||||||
|
Depreciation and amortization
|
8,362 | 8,223 | 7,349 | 6,504 | 6,414 | |||||||||||||||
|
Goodwill impairment
|
— | 34,966 | — | — | — | |||||||||||||||
|
Stock-based compensation
|
673 | 3,208 | 1,342 | 224 | — | |||||||||||||||
|
Acquisition costs
|
167 | 3 | 37 | 6 | — | |||||||||||||||
|
Adjusted EBITDA
|
$ | 21,869 | $ | 17,497 | $ | 37,514 | $ | 34,226 | $ | 31,069 | ||||||||||
| (5) |
Number of sales representatives is measured at the end of the period. Field sales representatives typically service our customers in their surrounding geographical area on a weekly basis.
|
|||
28
The following discussion should be read in conjunction with our consolidated financial statements and notes to those consolidated financial statements, included elsewhere in this Annual Report on Form 10-K. In addition to historical information, this discussion contains forward-looking statements that involve risks, uncertainties and assumptions that could cause actual results to differ materially from our expectations. Factors that could cause such differences include those described in “Risk factors” and elsewhere in this Annual Report on Form 10-K.
Overview
We are a leading distributor of animal health products in the United States and Canada. We sell more than 40,000 products sourced from over 1,500 manufacturers to over 71,000 customers, as well as provide consultative services to our customers in the highly fragmented animal health products industry. Products we distribute include pharmaceuticals, vaccines, parasiticides, diagnostics, capital equipment, sanitizers, devices, supplies, pet foods and dairy lagoon treatment systems. Our principal customers are veterinarians, production animal operators and animal health product retailers. We believe our customers purchase from us due to our longstanding relationships with them, knowledge of their businesses, service and ability to assist them in their operations. We have a 318 person sales force, including 222 field sales representatives. We also offer our customers a variety of value-added services, including on-site inventory management, dairy technical services, electronic commerce platform, proprietary production animal health management software solutions, production animal heath operations equipment, health management capital equipment, equipment procurement consultation, merchandising, special order fulfillment, and educational seminars. We process daily shipments from our central replenishment and distribution facility located in Memphis, Tennessee and 58 other distribution locations strategically located in the United States, Canada and Taiwan. Our corporate headquarters is located in the Dallas/Fort Worth metropolitan area.
Key factors and trends that have affected and we believe will continue to affect our operating results include:
|
•
|
Overall growth in the dairy industry. According to the USDA, over the last several years the demand for dairy products has increased. As a result, the demand for animal health products in the dairy market has increased. We have capitalized on this increase in demand with increased sales of our dairy related animal health products. We anticipate that this growth in the dairy market will continue in the future and that we will be able to fulfill the corresponding demand and consequently increase our sales of such animal health products. Notwithstanding the overall historical trend, recently, the significant supply of dairy products, high feed costs and soft consumer demand due to the general economic downturn have decreased the profitability of our dairy customers. Our dairy customer's declining profitability has caused them to limit their spending on dairy related production animal health products. Milk production forecasted by the USDA for 2010 improved slightly from the prior forecast reflecting a slower decline in cow numbers and stronger than expected growth in milk per cow. Milk production anticipated by the USDA for 2011 is unchanged. However, milk-based product exports exceeded general expectations in early 2010, and the USDA expects exports for 2011 to increase on both a fat and skim solids basis. The USDA also believes that imports will remain weak into 2011 due to relatively low US prices and tight world supplies.
|
|||
|
|
•
|
Consolidation by our customers in the dairy industry. The dairy market is undergoing significant consolidation resulting in a shift towards larger operations. According to the USDA, dairies with 500 or more cattle currently account for 58% of the milk producing cow population in the United States, as compared to 24% in 1997. Over the last several years, our long-standing relationships with larger dairies and our national footprint have allowed us to gain market share in the dairy-related production animal health products market. We anticipate that this trend of dairy consolidation will continue and we will seek to continue to gain market share.
|
||
|
•
|
Increased focus on companion animal customers. According to Sundale Research, over the last several years the market for companion animal health products has increased to approximately $3.7 billion in 2009. We believe this growth has been and will continue to be driven by the following trends:
|
|
-
|
widespread ownership of companion animals;
|
|
-
|
increased importance of companion animals in households;
|
|
-
|
growing awareness of companion animal health and wellness;
|
|
-
|
technology migration from the human life science product sector into the practice of veterinary medicine;
|
||
|
-
|
increased marketing programs sponsored by large pharmaceutical and companion animal nutrition companies; and
|
||
|
-
|
prolonged companion animal life spans creating demand for geriatric companion animal care products.
|
29
|
Over the past four years, we have begun to penetrate the urban and suburban veterinarian markets. We believe by leveraging our centralized procurement and inventory management model we are well positioned to develop a leading cost-to-serve position in the companion animal health products market and to continue to capture market share, resulting in increased sales and profitability. While we believe we are a leader in the companion animal health product market, the market is highly fragmented with numerous national, regional and local distributors, and a few of our competitors with bigger market share have greater financial and other resources than we do.
|
|||
|
•
|
Changes in consumer preferences. The demand for production animal health products is heavily dependent upon consumer demand for beef, dairy, poultry and swine. The food industry in general is subject to changing consumer trends, demands and preferences. For example, changes in consumer diets may negatively affect consumer demand for beef, dairy, poultry or swine, and therefore reduce the demand for our production animal health products. During the previous downturns in these markets, we experienced declines in sales.
|
We generate revenue from our customers in three ways. Approximately 98% of our revenue is generated through “buy/sell” transactions. The remainder comes from consignment and agency transactions. In “buy/sell” transactions, we take title to inventory from our manufacturers. We sell products to customers and invoice them. “Buy/sell” transactions are advantageous to us over other sales methods because we take title to the inventory and are able to promote these products on behalf of manufacturers and effectively manage the pricing and distribution of these products. For our consignment sales, we do not take title to the products, but we do stock and ship products to, and invoice customers. For our agency sales, we transmit orders from our customers to our manufacturers. The manufacturer ships the product directly to our customers and compensates us with a commission payment for handling the order from our customer and providing customer service. Manufacturers may occasionally switch between “buy/sell” and agency methods for particular products. Currently and for the past three fiscal years, only one product with material sales has required treatment as a consignment sale.
Contracts with manufacturers are generally negotiated annually on a calendar year basis. Sales growth goals are negotiated and used to determine rebate achievement. Manufacturer rebates are classified in our accompanying consolidated statements of operations as a reduction of direct cost of products sold. Manufacturer rebates that are based on quarterly, trimester or annual goals have sales performance tracked continually versus the goal, and rebate income is recorded when minimum hurdles are achieved.
Results of Operations
The following table summarizes historical results of operations for the year ended June 30, 2010, 2009, and 2008, on an actual basis and as a percentage of net sales.
Our gross profit may not be comparable to those of other entities, since some entities include all of the costs related to their distribution network in cost of goods sold, and others, like us, report non-direct costs in selling, general, and administrative expenses, and salaries, wages, commissions, and related benefits.
30
Summary consolidated results of operations table
|
Year ended June 30,
|
||||||||||||
|
(dollars in thousands)
|
2010
|
As Revised
2009
|
2008
|
|||||||||
|
Net sales
|
$
|
668,920
|
$
|
666,948
|
$
|
716,542
|
||||||
|
Direct cost of products sold
|
557,615
|
552,994
|
579,485
|
|||||||||
|
Gross profit
|
111,305
|
113,954
|
|
137,057
|
||||||||
|
Selling, general, and administrative expenses (includes salary, wages,
commission, and related benefits)
|
90,969
|
100,454
|
|
101,886
|
||||||||
|
Depreciation and amortization
|
8,362
|
8,223
|
|
7,349
|
||||||||
|
Goodwill impairment
|
—
|
34,966
|
—
|
|||||||||
|
Operating income (loss)
|
11,974
|
(29,689
|
)
|
|
27,822
|
|||||||
|
Other income (expense):
|
||||||||||||
|
Interest expense
|
(10,629
|
)
|
(8,761
|
)
|
|
(10,277 |
)
|
|||||
|
Other income
|
693
|
786
|
|
964
|
||||||||
|
Income (loss) before income taxes
|
2,038
|
(37,664
|
)
|
|
18,509 | |||||||
|
Income tax benefit (expense)
|
(785
|
)
|
734
|
|
(7,408
|
)
|
||||||
|
Net income (loss)
|
$
|
1,253
|
$
|
(36,930
|
)
|
$
|
11,101
|
|||||
|
Net sales
|
100.0
|
%
|
100.0
|
%
|
100.0
|
%
|
||||||
|
Direct cost of products sold
|
83.4
|
%
|
82.9
|
%
|
80.9
|
%
|
||||||
|
Gross profit
|
16.6
|
%
|
17.1
|
%
|
|
19.1
|
%
|
|||||
|
Selling, general, and administrative expenses (includes salary, wages,
commission, and related benefits)
|
13.6
|
%
|
15.1
|
%
|
14.2
|
%
|
||||||
|
Depreciation and amortization
|
1.2
|
%
|
1.2
|
%
|
|
1.0
|
%
|
|||||
|
Goodwill impairment
|
—
|
5.2
|
%
|
—
|
||||||||
|
Operating income (loss)
|
1.8
|
%
|
-4.4
|
%
|
3.9
|
%
|
||||||
|
Other income (expense):
|
||||||||||||
|
Interest expense
|
-1.6
|
%
|
-1.3
|
%
|
|
-1.4
|
%
|
|||||
|
Other income
|
0.1
|
%
|
0.1
|
%
|
|
0.1
|
%
|
|||||
|
Income (loss) before income taxes
|
0.3
|
%
|
-5.6
|
%
|
|
2.6
|
%
|
|||||
|
Income tax benefit (expense)
|
-0.1
|
%
|
0.1
|
%
|
|
-1.0
|
%
|
|||||
|
Net income (loss)
|
0.2
|
%
|
-5.5
|
%
|
|
1.6
|
%
|
|||||
31
Fiscal 2010 compared to fiscal 2009
Net sales. Net sales increased $2.0 million, or 0.3%, to $668.9 million for the year ended June 30, 2010, from $666.9 million for the year ended June 30, 2009. The increase in net sales was primarily attributable to increased sales to existing customers during the second half of the year and the addition of new customers, partially offset in the first half of the year by lower spending by production animal customers whose profits have been constrained by fluctuating commodity prices and the general economic slowdown. Our number of field sales representatives increased slightly to 222 as of June 30, 2010, from 221 as of June 30, 2009.
Gross profit. Gross profit decreased $2.7 million, or 2.3%, to $111.3 million for the year ended June 30, 2010, from $114.0 million for the year ended June 30, 2009. Gross profit as a percentage of sales was 16.6% for the year ended June 30, 2010, compared to 17.1% for the year ended June 30, 2009. The decrease in gross profit resulted from the decline in sales in the first half of the year combined with lower gross profit margins driven by declines in manufacturer rebates.
Selling, general, and administrative expenses. Selling, general, and administrative expenses, excluding depreciation and amortization, decreased $9.5 million, or 9.4%, to $91.0 million for the year ended June 30, 2010, from $100.5 million for the year ended June 30, 2009. The decrease was primarily the result of a decrease in variable selling and distribution expenses driven by lower sales volume in the first half of the year combined with cost reduction efforts and specific costs that impacted the year ended June 30, 2009. The prior year costs included the $2.7 million bad debt provision resulting from a dispute with a manufacturer regarding a rebate receivable and the $1.8 million charge for accelerated stock option expenses resulting from the May 2009 voluntary forfeiture of 1.0 million options by senior management, all partially offset by the $0.4 settlement and related legal costs. These factors drove a decrease in selling, general and administrative expenses as a percentage of sales from 15.1% for the year ended June 30, 2009, to 13.6% for the year ended June 30, 2010. Without the $2.7 million bad debt provision and the $1.8 million of accelerated stock option expenses, selling, general and administrative expenses as a percentage of sales would have totaled 14.4% for the year ended June 30, 2009. Additionally, without the $0.4 settlement and related legal costs, selling, general and administrative expenses as a percentage of sales would have totaled 13.5% for the year ended June 30, 2010.
Depreciation and amortization. Depreciation and amortization increased from $8.2 million for the year ended June 30, 2009, to $8.4 million for the year ended June 30, 2010. The increase results primarily from depreciation related to $2.4 million of current year capital expenditures.
Other expenses. Other expenses increased $1.9 million, or 24.6%, to $9.9 million for the year ended June 30, 2010, from $8.0 million for the year ended June 30, 2009. The increase in other expenses was due primarily to an increase in interest expense of $1.8 million to $10.6 million in the year ended June 30, 2010, as compared to $8.8 million in the year ended June 30, 2009. This increase was due to higher levels of debt than in the prior year as a result of an increased investment in working capital than in the prior year.
Income tax expense. Income tax expense increased $1.5 million to a tax expense of $0.8 million for the year ended June 30, 2010, from a $0.7 million tax benefit for the year ended June 30, 2009. Excluding permanent differences resulting from goodwill impairment, stock-based compensation and other non-deductible items, the effective tax rate was 33.1% and 37.9% and for the years ended June 30, 2010 and 2009, respectively. The difference in the adjusted effective tax rate was due primarily to an increased proportion of pre-tax income from Canada that is taxed at a lower rate than domestic pre-tax income.
Fiscal 2009 compared to fiscal 2008
Net sales. Net sales decreased $49.6 million, or 6.9%, to $666.9 million for the year ended June 30, 2009, from $716.5 million for the year ended June 30, 2008. The decrease in net sales was attributable primarily to lower spending by production animal customers whose profits have been constrained by fluctuating commodity prices and the general economic slowdown, and was partially offset by $12.2 million of incremental sales from the acquisition of Kane Veterinary Supplies, Ltd. (Kane) in the second quarter of fiscal 2008. Our number of field sales representatives decreased to 221 as of June 30, 2009, from 242 as of June 30, 2008, primarily as a result of consolidation of underperforming sales territories.
Gross profit. Gross profit decreased $23.1 million, or 16.9%, to $114.0 million for the year ended June 30, 2009, from $137.1 million for the year ended June 30, 2008. Gross profit as a percentage of sales was 17.1% for the year ended June 30, 2009, compared to 19.1% for the year ended June 30, 2008. The decrease in gross profit resulted from the decline in sales combined with lower gross profit margins driven by declines in manufacturer rebates.
32
Selling, general, and administrative expenses. Selling, general, and administrative expenses, excluding depreciation and amortization, decreased $1.4 million, or 1.4%, to $100.5 million for the year ended June 30, 2009, from $101.9 million for the year ended June 30, 2008. The decrease was primarily the result of a decrease in variable selling and distribution expenses driven by lower sales volume combined with cost reduction efforts, partially offset by the $2.7 million bad debt provision resulting from a dispute with a manufacturer regarding a rebate receivable and $1.8 million of accelerated stock option expenses resulting from the May 2009 voluntary forfeiture of 1.0 million options by senior management. The $2.7 million bad debt provision, $1.8 million of accelerated stock option expenses, and the fixed nature of certain expenses such as salaries, rent, and computer related costs drove an increase in selling, general and administrative expenses as a percentage of sales from 14.2% for the year ended June 30, 2008, to 15.1% for the year ended June 30, 2009. Without the $2.7 million bad debt provision and the $1.8 million of accelerated stock option expenses, selling, general and administrative expenses as a percentage of sales would have totaled 14.4% for the year ended June 30, 2009.
Depreciation and amortization. Depreciation and amortization increased from $7.3 million for the year ended June 30, 2008, to $8.2 million for the year ended June 30, 2009. The increase results primarily from increased amortization of intangible assets driven by purchase price allocations for the acquisition of Kane.
Goodwill impairment. In the year ended June 30, 2009, the Company's stock price and market capitalization declined significantly, and the Company experienced no growth and anticipated slower growth rates in the future. These factors are significant to the annual impairment test, and as a result, the Company recorded an impairment charge of $35.0 million as of June 30, 2009, to reduce the carrying value of goodwill.
Other expenses. Other expenses decreased $1.3 million, or 14.4%, to $8.0 million for the year ended June 30, 2009, from $9.3 million for the year ended June 30, 2008. The decrease in other expenses was due to a decrease in interest expense of $1.5 million to $8.8 million in the year ended June 30, 2009, as compared to $10.3 million in the year ended June 30, 2008. This decrease was due to lower average interest rates and less debt outstanding than in the prior year.
Income tax expense. Income tax expense decreased $8.1 million to a tax benefit of $0.7 million for the year ended June 30, 2009, from a $7.4 million tax expense for the year ended June 30, 2008. Excluding permanent differences resulting from goodwill impairment, stock-based compensation and other non-deductible items, the effective tax rate was 37.7% and 37.9% for the years ended June 30, 2008 and 2009, respectively.
Seasonality of operating results
Historically, our quarterly sales and operating results have varied significantly, and will likely continue to do so in the future. Seasonality has been caused by product usage, climate changes, promotions, rebates and announced price increases. Historically, our sales have been higher during the spring and fall months, as the transportation of production animals during these months results in increased product usage. The transportation of production animals occurs during various times in the animal’s life cycle. The cycle begins with the cow-calf stage where the calf is born and raised to six to eight months of age. At that point the calf moves to pasture for three to five months. The last movement occurs when the animal is placed in the feedyard. Movement and climate changes cause stress upon the animal, which increases the risk of disease. Thus, prior to each of these moves, the animal typically is treated for disease prevention. These buying patterns can also be affected by manufacturers’ and distributors’ marketing programs launched during the summer months, particularly in June, which can cause customers to purchase production animal health products in advance of actual usage. This kind of early purchasing may reduce the sales in the months these purchases typically would have been made. In the companion animal health products market, sales of flea, tick and heartworm products drive sales during the spring and summer months. See “Risk factors—Our quarterly operating results may fluctuate due to factors outside of management’s control.” Additionally, since many of our manufacturer rebates prior to 2008 were based on a calendar year, the quarter ended December 31 was our most significant quarter for recognition of rebates. Since that time, sales growth goals have shifted from annual to quarterly or trimester goals. While we anticipate that this trend with respect to manufacturers' rebate programs will continue, we do not expect as strong an impact during the quarter ended December 31, 2010, as compared to calendar years prior to 2008.
For the reasons and factors discussed above, our quarterly operating results may fluctuate significantly. Accordingly, results for any one quarter are not necessarily indicative of results to be expected for any other quarter or for any year, and our sales for any particular future period may decrease.
33
Consolidated statements of operations for the quarter (unaudited)
|
June 30,
|
March 31,
|
December 31,
|
September 30,
|
As Revised
June 30,
|
March 31,
|
December 31,
|
September 30,
|
|||||||||||||||||||||||||
|
(in thousands)
|
2010
|
2010
|
2009
|
2009
|
2009
|
2009
|
2008
|
2008
|
||||||||||||||||||||||||
|
Net sales
|
$
|
171,978
|
$
|
165,126
|
$
|
170,487
|
$
|
161,329
|
$
|
162,517
|
$
|
150,931
|
$
|
184,477
|
$
|
169,023
|
||||||||||||||||
|
Direct cost of products sold
|
143,388
|
137,773
|
141,071
|
135,383
|
136,460
|
125,602
|
152,209
|
138,723
|
||||||||||||||||||||||||
|
Gross profit
|
28,590
|
27,353
|
29,416
|
25,946
|
26,057
|
25,329
|
32,268
|
30,300
|
||||||||||||||||||||||||
|
Selling, general, and
|
||||||||||||||||||||||||||||||||
|
administrative expenses(1)
|
22,053
|
22,588
|
23,540
|
22,788
|
28,212
|
22,227
|
24,397
|
25,618
|
||||||||||||||||||||||||
|
Depreciation and
|
|
|
|
|
|
|
|
|
||||||||||||||||||||||||
|
amortization
|
2,357 | 2,005 | 2,022 | 1,978 | 2,054 | 2,039 | 2,054 | 2,076 | ||||||||||||||||||||||||
|
Goodwill impairment
|
—
|
—
|
—
|
—
|
34,966
|
—
|
—
|
—
|
||||||||||||||||||||||||
|
Operating income (loss)
|
4,180
|
2,760
|
3,854
|
|
1,180
|
(39,175
|
) |
1,063
|
5,817
|
2,606
|
||||||||||||||||||||||
|
Other income (expense):
|
||||||||||||||||||||||||||||||||
|
Other income
|
260
|
133
|
166
|
134
|
162
|
206
|
189
|
229
|
||||||||||||||||||||||||
|
Interest expense
|
(3,336
|
)
|
(2,714
|
)
|
(2,068
|
)
|
(2,511
|
)
|
(2,261
|
)
|
(1,877
|
)
|
(2,289
|
)
|
(2,334
|
)
|
||||||||||||||||
|
Income (loss) before
|
|
|
|
|
|
|
|
|
|
|
|
|||||||||||||||||||||
|
income taxes
|
1,104 | 179 | 1,952 | (1,197 | ) | (41,274 | ) | (608 | ) | 3,717 | 501 | |||||||||||||||||||||
|
Income tax benefit (expense)
|
(442
|
)
|
(59
|
)
|
(734
|
)
|
450
|
2,115
|
284
|
(1,448
|
)
|
(217
|
)
|
|||||||||||||||||||
|
Net income (loss)
|
$
|
662
|
$
|
120
|
|
$
|
1,218
|
|
$
|
(747
|
)
|
$
|
(39,159
|
) |
$
|
(324
|
) |
$
|
2,269
|
$
|
284
|
|||||||||||
|
(1)
|
Includes salaries, wages, commissions, and related benefits.
|
Liquidity and capital resources
The Company’s primary sources of liquidity are cash flows generated from operations and borrowings under the Company’s revolving credit facility. Funds are expended to provide working capital that enables the Company to maintain adequate inventory levels to promptly fulfill customer needs and expand operations. The Company expects its capital resources to be sufficient to meet anticipated cash needs for at least the next twelve months, and it expects cash flows from operations to be sufficient to reduce outstanding borrowings under the Company’s revolving credit agreement. While the Company’s revolving credit facility is scheduled to mature during the fourth quarter of fiscal 2011, the Company is in negotiations with multiple lenders and expects to finalize an agreement prior to the maturity of the revolving credit facility.
Operating activities. For the year ended June 30, 2010, net cash provided by operating activities was $6.5 million, and was primarily attributable to $1.3 million of net income, $13.0 million of non-cash costs, and a $0.4 million change in deferred income taxes, all partially offset by an increase in working capital of $8.1 million. The non-cash costs included $8.4 million of depreciation and amortization, $1.0 million of debt issue cost amortization, $3.0 million of amortization of loss on settlement of interest rate swap agreements, $0.3 million of bad debt expense, and $0.7 of stock compensation expense. The change in working capital included an increase in accounts receivable of $4.3 million, an increase in inventories of $9.5 million, and a decrease in accrued liabilities and other of $5.5 million, all partially offset by a decrease in income tax receivables of $1.0 million and an increase in accounts payable of $10.4 million. The increase in accounts receivable resulted from strong sales at the close of the year that converted to cash early in the first quarter of fiscal 2011. The increase in inventories was due to a rise in inventory purchases near the close of the year in anticipation of higher sales volume in the summer months. The increase in inventories drove the increase in accounts payable. While accounts receivable and inventory levels as a percentage of sales were higher at June 30, 2010 than historical norms, the Company expects to manage these balances back to historical norms. The decrease in accrued liabilities and other resulted primarily from payments of liabilities related to accrued non-recurring settlement and legal costs. The decrease in income tax receivables was due to the receipt of a $1.8 million tax refund during the fourth quarter of fiscal 2010.
34
For the year ended June 30, 2009, net cash provided by operating activities was $21.8 million, and was primarily attributable to a decrease in working capital of $11.9 million and $50.1 million of net non-cash costs, partially offset by 36.9 million of net losses and a change in deferred income taxes of $3.2 million. The change in working capital included a decrease in accounts receivable of $6.0 million and a decrease in inventories of $8.4 million, partially offset by a decrease in accounts payable of $2.9 million. The decrease in accounts receivable resulted from a decline in sales from the prior year. The decrease in inventories resulted from the decline in sales that caused a reduction in purchasing and drove the corresponding decrease in accounts payable. The non-cash costs included $35.0 million of goodwill impairment, $8.2 million of depreciation and amortization, $0.7 million of debt issue cost amortization, $3.2 million of bad debt expense, and $3.2 million of stock-based compensation. The bad debt expense included a $2.7 million provision resulting from a dispute with a manufacturer regarding a rebate receivable. Stock-based compensation included the impact of $1.8 million of accelerated expense as a result of the voluntary forfeiture of 1.0 million options by senior management in May 2009.
For the year ended June 30, 2008, net cash provided by operating activities was $6.0 million, and was primarily attributable to $11.1 million in net income, $9.9 million of net non-cash costs, and a change in deferred income taxes of $1.2 million, all partially offset by an increase in working capital of $16.4 million. The non-cash costs included $7.3 million of depreciation and amortization, $0.8 million of debt issue cost amortization, $0.7 million of bad debt expense, and $1.3 million of stock-based compensation. The debt issue cost amortization includes the write-off of $0.3 of debt issue costs resulting from the August 2007 refinancing of the term loan debt. The change in working capital included a decrease in accounts payable of $7.3 million and a decrease in accrued liabilities of $9.9 million. The decrease in accounts payable resulted primarily from a shift in purchasing to vendors with shorter payment terms. The decrease in accrued liabilities resulted primarily from payments of income tax accruals, liabilities related to acquisitions, and accrued non-recurring legal expenses related to the July 2007 settlement of a dispute with a vendor.
Investing activities. For the year ended June 30, 2010, net cash used for investing activities was $3.9 million, and was primarily attributable to $1.9 million in cash payments to certain selling stockholders of Kane for the achievement of certain purchase agreement performance targets and $2.4 million of property, plant, and equipment purchases.
For the year ended June 30, 2009, net cash used for investing activities was $4.2 million, and was primarily attributable to $2.9 million of purchases of property, plant and equipment, and $2.9 million of purchase price adjustments primarily related to the acquisition of Kane in the second quarter of fiscal 2008, partially offset by $0.7 million of collections on notes receivable and $0.5 million of proceeds from the sale of property, plant, and equipment.
For the year ended June 30, 2008, net cash used for investing activities was $27.5 million, and was primarily attributable to $23.0 million, net of cash acquired, for the acquisition of Kane, $4.1 million of purchases of property, plant and equipment, and $2.2 million of purchase price adjustments related to acquisitions completed in the prior year, all partially offset by $1.7 of proceeds from the sale of property, plant, and equipment.
Financing activities. For the year ended June 30, 2010, net cash used for financing activities was $3.0 million, and was primarily attributable to an unfavorable change in overdraft balances of $5.8 million, principal payments on term note debt totaling $3.1 million, and the settlement of liabilities related to terminated interest rate swap agreements totaling $3.3 million, partially offset by net borrowings on the revolving credit facility totaling $9.3 million.
For the year ended June 30, 2009, net cash used for financing activities was $17.2 million, and was primarily attributable to net repayments on the revolving credit facility totaling $15.2 million, principal payments on other debt totaling $1.3 million, and the payment of $1.1 million of debt issue costs related to the May 2009 amendment to the revolving credit facility.
For the year ended June 30, 2008, net cash provided by financing activities was $16.0 million, and was primarily attributable to net borrowings from the revolving credit facility totaling $20.9 million partially offset by an unfavorable change in overdraft balances of $2.9 million and principal payments on other debt totaling $1.4 million. Also during the year ended June 30, 2008, the $44.5 million balance of the $45.0 million first lien term loan was paid in full with the proceeds from the new $44.5 million first lien term loan.
35
Capital resources. The Company has a $44.5 million first lien term loan (Term Note), which matures on May 31, 2011 and bears interest at an annual rate equal to LIBOR plus 2.0%, paid quarterly. The Company plans to continue to take advantage of this favorable rate and not extend, replace, or retire this debt until it is closer to maturity. The Company is in negotiations with multiple lenders and expects to finalize an agreement prior to the maturity of the revolving credit facility. Borrowings are collateralized by a first priority interest in and lien on all of the Company’s assets.
The Company’s revolving credit facility (the Revolver) is a $130.0 million facility, which matures on the earlier of June 30, 2012, or 60 days prior to the final extended maturity date of the Term Note. The outstanding borrowings under the amended facility bore interest through July 20, 2009, at LIBOR plus 3.50% for U.S. borrowings and CDOR Rate plus 1% for Canadian borrowings, and thereafter at rates based upon the Company’s Leverage Ratio as defined in the amended Revolver with LIBOR-based rates ranging from LIBOR and CDOR Rate plus 3.00% to LIBOR and CDOR Rate plus 3.75%, and with Prime-based rates ranging from U.S. Prime and Canadian Prime Rate plus 0.50% to U.S. Prime and Canadian Prime Rate plus 1.25%. Borrowings remain collateralized by a first priority interest in and lien on all of the Company’s assets. At June 30, 2010, the Company’s availability under the Revolver totaled $34.0 million.
As of June 30, 2010, the interest rates for the Revolver ranged from 4.10% to 4.50%, and the interest rate for the Term Note was 2.38%. Additionally, the Company is required to pay a commitment fee on the daily unused amount of the Revolver at a per annum rate of 0.50%. Debt issue costs related to the Term Note and the Revolver have been capitalized and are being amortized over the remaining term of the underlying debt utilizing the straight-line method, which approximates the effective interest method. The credit agreements contain certain covenants that, among other things, restrict our ability to incur additional indebtedness, make certain payments, sell assets, enter into certain transactions with affiliates and create liens. Moreover, certain of these agreements require us to maintain specified financial ratios. The most restrictive covenant relates to the creation or assumption of additional indebtedness. The Company was in compliance with all financial covenants at June 30, 2010.
The Company has utilized cash flow hedge accounting and used derivative financial instruments to effectively convert a portion of its variable-rate debt to fixed-rate debt. In order to reduce cash interest expense over the last three quarters of fiscal 2010, the Company elected to terminate both of its interest rate swap agreements as of September 30, 2009 and paid the respective liabilities in October 2009. Based upon interest rates, in order to reduce cash interest expense over the remainder of 2010, the Company elected to terminate both of its interest rate swap agreements as of September 30, 2009.
The Company entered into a $43.0 million notional value swap transaction with a financial institution effective April 18, 2007. The Company received a floating rate based on LIBOR and paid a fixed rate of 4.95%. The swap agreement had an original termination date of June 28, 2010. On September 30, 2009, the Company terminated the swap agreement, and the fair value of this swap was a net liability of $1.5 million on that date. The Company entered into a $52.0 million notional value swap transaction with a financial institution effective April 18, 2007. The Company received a floating rate based on LIBOR and paid a fixed rate of 4.95%. The swap agreement had an original termination date of May 7, 2010. On September 30, 2009, the Company terminated the swap agreement, and the fair value of this swap was a net liability of $1.8 million on that date.
Swap agreement fair values were recorded on the consolidated balance sheet as a component of current portion of long-term debt. The fair values of the interest rate swap agreements were estimated based on current settlement prices and quoted market prices of comparable contracts. The Company calculated no ineffectiveness on both interest rate swap agreements at their termination on September 30, 2009. At June 30, 2010, all unrealized losses previously recorded on the consolidated balance sheet as accumulated other comprehensive income (loss) had been amortized to interest expense over the remaining terms of the original swap agreements.
The net receipts or payments from the interest rate swap agreements were recorded in interest expense. During the years ended June 30, 2010 and 2009, changes in the fair value of interest rate swap agreements totaled $3.9 million and $(1.0) million, respectively. The Company reclassified $2.4 million and $2.7 million during the years ended June 30, 2010 and 2009, respectively, from accumulated other comprehensive income (loss) to interest expense.
Off-Balance Sheet Arrangements
As of June 30, 2010, we did not have any off-balance sheet arrangements other than the operating lease commitments in the contractual obligations table below.
36
Contractual obligations
Our contractual obligations as of June 30, 2010 mature as follows:
|
Payments Due by Period
|
||||||||||||||||||||
|
(in thousands)
|
Total
|
1 Year or
Less
|
More than
1 Year-3 Years
|
More than
3 Year-5 Years
|
More than
5 Years
|
|||||||||||||||
|
Revolver
|
$
|
88,512
|
$
|
88,512
|
$
|
—
|
$
|
—
|
$
|
—
|
||||||||||
|
Operating lease commitments
|
20,744
|
5,059
|
8,611
|
4,477
|
2,597
|
|||||||||||||||
|
Long-term debt (including current portion)
|
40,827
|
40,827
|
—
|
—
|
—
|
|||||||||||||||
|
Interest on long-term debt and line-of-credit(1)
|
3,630
|
3,630
|
—
|
—
|
—
|
|||||||||||||||
|
Total contractual obligations(2)
|
$
|
153,713
|
$
|
138,028
|
$
|
8,611
|
$
|
4,477
|
$
|
2,597
|
||||||||||
|
(1)
|
Future interest payments are calculated based on the assumption that all debt is outstanding until maturity. For debt instruments with variable interest rates, interest has been calculated for all future periods using the rates in effect as of June 30, 2010.
|
|
(2)
|
The Company is subject to purchase obligations under certain of its purchase contracts, but management does not believe that they are material.
|
Inflation
Most of our operating expenses are inflation-sensitive, with inflation generally producing increased costs of operations. During the past three years, the most significant effects of inflation have been on freight and fuel costs and costs of products. Historically, we have been proactive in addressing inflation in attempts to limit its effects through the enactment of cost control initiatives.
Critical accounting policies
The SEC has issued disclosure guidance for “critical accounting policies.” The SEC defines “critical accounting policies” as those that require application of management’s most difficult, subjective or complex judgments, often as a result of the need to make estimates about the effect of matters that are inherently uncertain and may change in subsequent periods.
Our significant accounting policies are described in note 2 to our consolidated financial statements. Not all of these significant accounting policies require management to make difficult, subjective or complex judgments or estimates. However, our management is required to make certain estimates and assumptions during the preparation of our consolidated financial statements in accordance with accounting principles generally accepted in the United States. These estimates and assumptions impact the reported amount of assets and liabilities and disclosures of contingent assets and liabilities as of the date of the consolidated financial statements. Estimates and assumptions are reviewed periodically and the effects of revisions are reflected in the period they are determined to be necessary. Actual results could differ from those estimates. The following are descriptions of our critical accounting policies that are impacted by such judgments, assumptions and estimates:
Revenue recognition. Revenue is recognized when title passes according to shipping terms. Provision for sales returns is recorded at the time of sale for estimated products returned by customers. Provision for sales discounts is recorded at the time of sale. Revenues are presented net of sales taxes collected from retail customers and remitted to government taxing authorities.
Manufacturer rebates. Inventory rebates are recognized when estimable and probable and include inventory purchase rebates and sales-related rebates. Inventory purchase rebates received are capitalized into inventory while sales-related rebates are recorded as a reduction of cost of products sold. Historically, actual results have not significantly deviated from those determined using the estimates described above. We expect that our future estimates will continue to be reasonable as our rebates are based upon specific vendor program goals and are recorded each month based principally upon achievement of sales performance measures. The Company records an allowance for doubtful accounts to allow for any amounts which may be unrecoverable. This allowance is adjusted as necessary to reserve for specific rebates that are deemed to be uncollectible.
Goodwill and other intangibles. Intangibles assets include nonamortizing goodwill and trademarks and trade names and amortizing customer relationships and noncompete agreements, which are being amortized over their estimated useful lives of twelve and eight years, respectively. The Company evaluates goodwill and other intangible assets on an annual basis and between annual tests whenever events or circumstances indicate that the carrying value of the goodwill or other intangible asset may exceed its fair value. A significant amount of judgment is involved in determining if an indicator of impairment has occurred. Such indicators may include, among others: a significant decline in the Company’s expected future cash flows; a sustained, significant decline in the Company’s stock price and market capitalization; a significant adverse change in legal factors or in the business climate; unanticipated competition; and slower growth rates. Any adverse change in these factors could have a significant impact on the recoverability of the Company’s goodwill and other intangible assets and could have a material impact on the Company’s consolidated financial statements.
37
At June 30, 2009, the Company performed its annual impairment test. The Company’s stock price and market capitalization was low, and the Company experienced no growth in that year and anticipated slower growth rates in the future. The fair value of the Company was estimated utilizing the income approach to derive an enterprise value of the Company. This income approach was validated by comparing the fair value to fair value estimates using a market approach. The market approach included the determination that the Company’s stock price at June 30, 2009, did not reflect a control premium that was considered in deriving the enterprise value. Based upon the results of this testing, the Company concluded that no impairment of customer relationships, noncompete agreements, or trademarks and trade names existed at June 30, 2009, however, the carrying value of goodwill exceeded its fair value, and the Company recorded a $35.0 million impairment charge as of June 30, 2009. At June 30, 2010, the Company performed its annual impairment test and determined that no impairment had occurred. The Company will continue to evaluate goodwill and other intangible assets for potential impairment based upon any changes to the Company’s operations or its operating business environment.
Exposure to Interest Rates
The Company is exposed to certain market risks arising from transactions that are entered into in the normal course of business. As part of our financial risk management program, we have used certain derivative financial instruments to manage these risks. The Company does not engage in financial transactions for speculative purposes and therefore holds no derivative instruments for trading purposes. The Company’s exposure to market risk for changes in interest rates relates to variable interest rates on borrowings under the Company’s credit agreements. At June 30, 2010, $129.3 million of the Company’s debt remained subject to market risk for changes in interest rates. If the weighted average interest rate on the Company’s remaining variable rate indebtedness rose 34 basis points (a 10.0% change from the calculated weighted average interest rate as of June 30, 2010), assuming no change in the Company’s outstanding balance under its Revolver and Term Note, the Company’s annualized income before taxes and cash flows from operating activities would decline by approximately $0.4 million. If the weighted average interest rate on the Company’s remaining variable rate indebtedness decreased 34 basis points (a 10.0% change from the calculated weighted average interest rate as of June 30, 2010), assuming no change in the Company’s outstanding balance under its Revolver and Term Note, the Company’s annualized income before taxes and cash flows from operating activities would increase by approximately $0.4 million.
Exposure to Exchange Rates
We have operations located in Canada and Taiwan. Due to the relative low volume of payments made by us through these subsidiaries, we do not believe that we have significant exposure to foreign currency exchange risks. We currently do not use derivative financial instruments to mitigate foreign currency exchange risks. We continue to review this issue and may consider hedging certain foreign exchange risks through the use of currency futures or options in future years.
The consolidated financial statements required to be filed are indexed on page F-1 and are incorporated herein.
None.
Evaluation of Disclosure Controls and Procedures
Under the supervision and with the participation of our management, including our Chief Executive Officer and Chief Financial Officer, we conducted an evaluation of the effectiveness, as of June 30, 2010, of our disclosure controls and procedures, as defined in Rules 13a-15(e) and 15d-15(e) under the Securities Exchange Act of 1934, as amended, or the Exchange Act. The purpose of this evaluation was to determine whether as of the evaluation date our disclosure controls and procedures were effective to provide reasonable assurance that the information we are required to disclose in our filings with the Securities and Exchange Commission, or SEC, under the Exchange Act (i) is recorded, processed, summarized and reported within the time periods specified in the SEC’s rules and forms and (ii) is accumulated and communicated to our management, including our Chief Executive Officer and Chief Financial Officer, as appropriate to allow timely decisions regarding required disclosure. Based on their evaluation, our management has concluded, as discussed below, that a material weakness existed in our internal control over financial reporting as of June 30, 2010, and as a result, our disclosure controls and procedures were not effective. Notwithstanding the material weakness that existed as of June 30, 2010, our Chief Executive Officer and Chief Financial Officer have concluded that the financial statements included in this Annual Report on Form 10-K present fairly, in all material aspects, the financial position, results of operations and cash flows of the Company in conformity with accounting principles generally accepted in the United States of America (GAAP).
38
Management’s Annual Report on Internal Control Over Financial Reporting
Our management is responsible for establishing and maintaining adequate internal control over financial reporting as such term is defined in Exchange Act Rule 13a-15(f). Our internal control system was designed to provide reasonable assurance to our management regarding the reliability of financial reporting and the preparation of the Company’s financial statements for external purposes in accordance with GAAP. Under the supervision and with the participation of our management, including our Chief Executive Officer and Chief Financial Officer, we conducted an evaluation of the effectiveness of our internal control over financial reporting as of June 30, 2010. In conducting the evaluation, our management used the criteria set forth by the Committee of Sponsoring Organizations of the Treadway Commission, or COSO, in Internal Control-Integrated Framework (the COSO criteria). Based on our evaluation under the COSO criteria, our management concluded that the Company did not maintain effective internal control over financial reporting as of June 30, 2010. Management identified the following material weakness in internal control over financial reporting.
Management did not maintain effective internal controls relating to the monthly end closing process and the quarter end closing and financial reporting process in adequately addressing reconciling items identified on accounts payable reconciliations. The material weakness over accounts payable reconciliations was identified during the quarter ended June 30, 2010 through an error in the Company’s accounts payable balance that related to its legacy accounting system balances from fiscal 1997 and prior periods. The error was corrected, and the Company is strengthening existing control over accounts payable reconciliations during the quarter ending September 30, 2010, by (i) requiring an additional level of approval of the reconciliations and (ii) requiring that all reconciling items be addressed and cleared within 90 days. With the implementation of these corrective actions, the Company anticipates that this material weakness will be remediated during the quarter ending September 30, 2010, and that the remediation will be tested during the closing procedures for such quarter.
This Annual Report on Form 10-K does not include an attestation report of the Company’s registered public accounting firm regarding internal control over financial reporting. Management’s report was not subject to attestation by the Company’s registered public accounting firm pursuant to the rules of the Securities and Exchange Commission that permit the Company to provide only management’s report in this Annual Report on Form 10-K.
Changes in Internal Controls over Financial Reporting
There were no changes in our internal control over financial reporting (as defined in Rule 13a-15(f) under the Exchange Act) during the quarter ended June 30, 2010 that have materially affected, or are reasonably likely to materially affect, our internal control over financial reporting.
Inherent Limitation on the Effectiveness of Internal Controls
The effectiveness of any system of internal control over financial reporting, including ours, is subject to inherent limitations, including the exercise of judgment in designing, implementing, operating, and evaluating the controls and procedures, and the inability to completely eliminate misconduct. Accordingly, any system of internal control over financial reporting, including ours, no matter how well designed and operated, can only provide reasonable, not absolute assurances. In addition, projections of any evaluation of effectiveness to future periods are subject to the risk that controls may become inadequate because of changes in conditions, or that the degree of compliance with the policies or procedures may deteriorate. We intend to continue to monitor and upgrade our internal controls as necessary or appropriate for our business, but cannot assure you that such improvements will be sufficient to provide us with effective internal control over financial reporting.
None.
Certain information required by this Item 10 relating to our directors and executive officers is incorporated by reference herein from our proxy statement in connection with our 2010 annual meeting of stockholders, which proxy statement will be filed with the SEC not later than 120 days after the close of our fiscal year ended June 30, 2010.
Audit Committee Financial Expert
Our board of directors has determined that each of Messrs. Corcoran, Pinkerton, and Steinhart qualifies as an “audit committee financial expert” as defined in Item 407(d)(5)(ii) of Regulation S-K, and are “independent” as defined in Rule 10A-3 under the Exchange Act.
39
Code of Ethics
We have adopted a "code of ethics," as defined by regulations promulgated under the Securities Act of 1933, as amended, and the Exchange Act, that applies to all of our directors and employees worldwide, including our principal executive officer, principal financial officer, principal accounting officer or controller, or persons performing similar functions. A current copy of the Code of Business Conduct and Ethics is available at the Corporate Governance section of our website at www.ahii.com. A copy of the Code of Business Conduct and Ethics may also be obtained, free of charge, upon a request directed to: Animal Health International, Inc., 7 Village Circle, Suite 200, Westlake, Texas 76262, Attention: General Counsel. We intend to disclose any amendment to or waiver of a provision of the Code of Business Conduct and Ethics that applies to our principal executive officer, principal financial officer, principal accounting officer or controller, or persons performing similar functions, by posting such information on our website available at www.ahii.com.
For more corporate governance information, you are invited to access the Corporate Governance section of our website available at www.ahii.com.
The information required by this Item 11 relating to remuneration of directors and executive officers and other transactions involving management is incorporated by reference herein from our proxy statement in connection with our 2010 annual meeting of stockholders, which proxy statement will be filed with the SEC not later than 120 days after the close of our fiscal year ended June 30, 2010.
|
Security Ownership of Certain Beneficial Owners and Management and Related Stockholder Matters.
|
The information required by this Item 12 relating to security ownership of certain beneficial owners and management is incorporated by reference herein from our proxy statement in connection with our 2010 annual meeting of stockholders, which proxy statement will be filed with the SEC not later than 120 days after the close of our fiscal year ended June 30, 2010. For information on securities authorized for issuance under equity compensation plans, see the section entitled “Market for Registrant’s Common Equity and Related Stockholders Matters” in Part II, Item 5 in this Annual Report on Form 10-K.
The information required by this Item 13 relating to certain relationships and related transactions is incorporated by reference herein from our proxy statement in connection with our 2010 annual meeting of stockholders, which proxy statement will be filed with the SEC not later than 120 days after the close of our fiscal year ended June 30, 2010.
The information required by this Item 14 regarding principal accounting fees and services is set forth under “Matters Concerning Our Independent Registered Public Accounting Firm” in our proxy statement in connection with our 2010 annual meeting of stockholders, which proxy statement will be filed with the SEC not later than 120 days after the close of our fiscal year ended June 30, 2010.
|
(1)
|
Financial Statements: Reference is made to the Index to Financial Statements in the section entitled “Financial Statements and Supplementary Data” in Part II, Item 8 of this Annual Report on Form 10-K.
|
|
(2)
|
Financial Statement Schedules: These Schedules have been omitted because they are not required or because the required information is given in the consolidated financial statements or notes thereto.
|
|
(3)
|
Exhibits: Exhibits are as set forth in the section entitled “Exhibit Index” which follows the section entitled “Signatures” in this Annual Report on Form 10-K. Exhibits which are incorporated herein by reference can be inspected and copied at the public reference rooms maintained by the SEC in Washington, D.C., New York, New York, and Chicago, Illinois. Please call the SEC at 1-800-SEC-0330 for further information on the public reference rooms. SEC filings are also available to the public from commercial document retrieval services and at the website maintained by the SEC at http://www.sec.gov.
|
40
Pursuant to the requirements of Section 13 or 15(d) of the Securities Exchange Act of 1934, the registrant has duly caused this report to be signed on its behalf by the undersigned, thereunto duly authorized.
|
|
ANIMAL HEALTH INTERNATIONAL, INC.
|
|
|
Date: September 10, 2010
|
|
/s/ WILLIAM F. LACEY
|
|
|
William F. Lacey
|
|
|
|
Senior Vice President and Chief Financial Officer
(Principal Financial and Accounting Officer)
|
|
POWER OF ATTORNEY
KNOWN ALL MEN BY THESE PRESENTS that each individual whose signature appears below constitutes and appoints each of James C. Robison and William F. Lacey such person’s true and lawful attorney-in-fact and agent with full power of substitution and resubstitution, for such person and in such person’s name, place and stead, in any and all capacities, to sign any and all amendments to this Annual Report on Form 10-K, and to file the same, with all exhibits thereto, and all documents in connection therewith, with the Securities and Exchange Commission, granting unto each said attorney-in-fact and agent full power and authority to do and perform each and every act and thing requisite and necessary to be done in and about the premises, as fully to all intents and purposes as such person might or could do in person, hereby ratifying and confirming all that any said attorney-in-fact and agent, or any substitute or substitutes of any of them, may lawfully do or cause to be done by virtue hereof.
Pursuant to the requirements of the Securities and Exchange Act of 1934, as amended, this report has been signed below by the following persons on behalf of the registrant and in the capacities and on the dates indicated.
|
Signature
|
|
Title
|
Date
|
|
|
/s/ JAMES C. ROBISON
James C. Robison
|
|
Chief Executive Officer, President and Chairman
(Principal Executive Officer)
|
September 10, 2010
|
|
|
/s/ WILLIAM F. LACEY
William F. Lacey
|
|
Sr. Vice President and Chief Financial Officer
(Principal Financial and Accounting Officer)
|
September 10, 2010
|
|
|
/s/ MICHAEL EISENSON
Michael Eisenson
|
|
Director
|
September 10, 2010
|
|
|
/s/ MARK ROSEN
Mark Rosen
|
|
Director
|
September 10, 2010
|
|
|
/s/ BRANDON WHITE
Brandon White
|
|
Director
|
September 10, 2010
|
|
|
/s/ RONALD STEINHART
Ronald Steinhart
|
|
Director
|
September 10, 2010
|
|
|
/s/ DAVID BIEGLER
David Biegler
|
|
Director
|
September 10, 2010
|
|
|
/s/ JERRY PINKERTON
Jerry Pinkerton
|
|
Director
|
September 10, 2010
|
|
|
/s/ E. THOMAS CORCORAN
E. Thomas Corcoran
|
|
Director
|
September 10, 2010
|
|
Animal Health International, Inc. and Subsidiaries
F-1
Board of Directors and Shareholders
Animal Health International, Inc.
We have audited the accompanying consolidated balance sheets of Animal Health International, Inc. and subsidiaries as of June 30, 2009 and 2010, and the related consolidated statements of operations, stockholders’ equity and comprehensive income (loss), and cash flows for the years then ended. These financial statements are the responsibility of the Company’s management. Our responsibility is to express an opinion on these financial statements based on our audits.
We conducted our audits in accordance with the standards of the Public Company Accounting Oversight Board (United States). Those standards require that we plan and perform the audit to obtain reasonable assurance about whether the financial statements are free of material misstatement. The Company is not required to have, nor were we engaged to perform an audit of its internal control over financial reporting. Our audit included consideration of internal control over financial reporting as a basis for designing audit procedures that are appropriate in the circumstances, but not for the purpose of expressing an opinion on the effectiveness of the Company’s internal control over financial reporting. Accordingly, we express no such opinion. An audit also includes examining, on a test basis, evidence supporting the amounts and disclosures in the financial statements, assessing the accounting principles used and significant estimates made by management, as well as evaluating the overall financial statement presentation. We believe that our audits provide a reasonable basis for our opinion.
In our opinion, the consolidated financial statements referred to above present fairly, in all material respects, the financial position of Animal Health International, Inc. and subsidiaries as of June 30, 2009 and 2010, and the results of their operations and their cash flows for the years then ended in conformity with accounting principles generally accepted in the United States of America.
/s/ GRANT THORNTON LLP
Dallas, Texas
September 10, 2010
F-2
REPORT OF INDEPENDENT REGISTERED PUBLIC ACCOUNTING FIRM
The Board of Directors
Animal Health International, Inc.:
We have audited the accompanying consolidated statements of operations, stockholders’ equity and comprehensive income (loss), and cash flows of Animal Health International, Inc. and subsidiaries (the Company) for the year ended June 30, 2008. These consolidated financial statements are the responsibility of the Company’s management. Our responsibility is to express an opinion on these consolidated financial statements based on our audit.
We conducted our audit in accordance with the standards of the Public Company Accounting Oversight Board (United States). Those standards require that we plan and perform the audit to obtain reasonable assurance about whether the financial statements are free of material misstatement. An audit includes examining, on a test basis, evidence supporting the amounts and disclosures in the financial statements. An audit also includes assessing the accounting principles used and significant estimates made by management, as well as evaluating the overall financial statement presentation. We believe that our audit provides a reasonable basis for our opinion.
In our opinion, the consolidated financial statements referred to above present fairly, in all material respects, the results of operations and cash flows of Animal Health International, Inc. and subsidiaries for the year ended June 30, 2008, in conformity with U.S. generally accepted accounting principles.
|
/s/ KPMG LLP
|
Dallas, Texas
September 9, 2008
F-3
ANIMAL HEALTH INTERNATIONAL, INC. AND SUBSIDIARIES
June 30, 2010 and 2009
(In thousands, excluding share information)
|
June 30,
2010
|
As Revised
June 30,
2009
|
|||||||
|
Assets
|
||||||||
|
Current assets:
|
||||||||
|
Cash and cash equivalents
|
$ | 2,243 | $ | 2,749 | ||||
|
Accounts receivable, net
|
77,954 | 74,441 | ||||||
|
Current portion of notes receivable
|
189 | 126 | ||||||
|
Income tax receivable
|
656 | 1,001 | ||||||
|
Merchandise inventories, net
|
99,545 | 89,315 | ||||||
|
Deferred income taxes
|
1,852 | 3,358 | ||||||
|
Prepaid expenses
|
2,400 | 2,319 | ||||||
|
Total current assets
|
184,839 | 173,309 | ||||||
|
Noncurrent assets:
|
||||||||
|
Notes receivable, net of current portion
|
77 | 280 | ||||||
|
Property, plant, and equipment, net
|
14,657 | 16,043 | ||||||
|
Goodwill
|
62,245 | 60,334 | ||||||
|
Customer relationships, net
|
24,616 | 28,022 | ||||||
|
Noncompete agreements, net
|
2,360 | 3,436 | ||||||
|
Trademarks and trade names
|
33,170 | 33,170 | ||||||
|
Debt issue costs and other assets, net
|
2,967 | 3,671 | ||||||
|
Total assets
|
$ | 324,931 | $ | 318,265 | ||||
|
Liabilities and Stockholders’ Equity
|
||||||||
|
Current liabilities:
|
||||||||
|
Accounts payable
|
$ | 94,705 | $ | 93,369 | ||||
|
Accrued liabilities
|
9,891 | 13,055 | ||||||
|
Current portion of long-term debt
|
129,339 | 7,179 | ||||||
|
Total current liabilities
|
233,935 | 113,603 | ||||||
|
Noncurrent liabilities:
|
||||||||
|
Long-term debt, net of current portion
|
— | 119,913 | ||||||
|
Deferred lease incentives
|
1,092 | 1,101 | ||||||
|
Deferred income taxes
|
23,440 | 23,069 | ||||||
|
Total liabilities
|
258,467 | 257,686 | ||||||
|
Commitments and contingencies (note 15)
|
||||||||
|
Stockholders’ equity:
|
||||||||
|
Preferred stock, par value $0.01 per share. Authorized 10,000,000 shares,
|
||||||||
|
issued and outstanding 0 shares
|
— | — | ||||||
|
Common stock, par value $0.01 per share. Authorized 90,000,000 shares,
|
||||||||
|
issued and outstanding 24,329,670 shares
|
243 | 243 | ||||||
|
Additional paid-in capital
|
133,585 | 132,912 | ||||||
|
Accumulated deficit
|
(67,402 | ) | (68,655 | ) | ||||
|
Accumulated other comprehensive income (loss)
|
38 | (3,921 | ) | |||||
|
Total stockholders' equity
|
66,464 | 60,579 | ||||||
|
Total liabilities and stockholders’ equity
|
$ | 324,931 | $ | 318,265 | ||||
See accompanying Notes to Consolidated Financial Statements.
F-4
Years ended June 30, 2010, 2009, and 2008
(In thousands, except per share data)
|
Year ended June 30,
|
||||||||||||
| 2010 |
As Revised
2009
|
2008
|
||||||||||
|
Net sales
|
$ | 668,920 | $ | 666,948 | $ | 716,542 | ||||||
|
Costs and expenses:
|
||||||||||||
|
Direct cost of products sold (excludes depreciation and amortization)
|
557,615 | 552,994 | 579,485 | |||||||||
|
Salaries, wages, commissions, and related benefits
|
51,322 | 55,204 | 55,022 | |||||||||
|
Selling, general, and administrative
|
39,647 | 45,250 | 46,864 | |||||||||
|
Depreciation and amortization
|
8,362 | 8,223 | 7,349 | |||||||||
|
Goodwill impairment
|
— | 34,966 | — | |||||||||
|
Operating income (loss)
|
11,974 | (29,689 | ) | 27,822 | ||||||||
|
Other income (expense):
|
||||||||||||
|
Other income
|
693 | 786 | 964 | |||||||||
|
Interest expense
|
(10,629 | ) | (8,761 | ) | (10,277 | ) | ||||||
|
Income (loss) before income taxes
|
2,038 | (37,664 | ) | 18,509 | ||||||||
|
Income tax benefit (expense)
|
(785 | ) | 734 | (7,408 | ) | |||||||
|
Net income (loss)
|
$ | 1,253 | $ | (36,930 | ) | $ | 11,101 | |||||
|
Earnings (loss) per common share:
|
||||||||||||
|
Basic
|
$ | 0.05 | $ | (1.52 | ) | $ | 0.46 | |||||
|
Diluted
|
$ | 0.05 | $ | (1.52 | ) | $ | 0.46 | |||||
|
Shares used in computing earnings per share:
|
||||||||||||
|
Basic
|
24,691 | 24,330 | 24,330 | |||||||||
|
Diluted
|
24,847 | 24,330 | 24,330 | |||||||||
See accompanying Notes to Consolidated Financial Statements.
F-5
Years ended June 30, 2010, 2009, and 2008
(In thousands, excluding share information)
|
Common stock
|
Accumulated
|
|||||||||||||||||||||||
|
Additional
|
Accumulated
|
other
|
||||||||||||||||||||||
|
Number of
|
paid-in
|
earnings/
|
comprehensive
|
|||||||||||||||||||||
|
shares
|
Amount
|
capital
|
(deficit)
|
income (loss)
|
Total
|
|||||||||||||||||||
|
Balance, June 30, 2007
|
24,329,670
|
$
|
243
|
$
|
128,367
|
$
|
(42,826
|
)
|
$
|
331
|
$
|
86,115
|
||||||||||||
|
Costs directly associated
with initial public
offering
|
—
|
—
|
(5
|
)
|
—
|
—
|
(5
|
)
|
||||||||||||||||
|
Stock-based
compensation
|
—
|
—
|
1,342
|
—
|
—
|
1,342
|
||||||||||||||||||
|
Comprehensive income:
|
||||||||||||||||||||||||
|
Net income
|
—
|
—
|
—
|
11,101
|
—
|
11,101
|
||||||||||||||||||
|
Unrealized loss on
derivative
instruments, net of tax
|
—
|
—
|
—
|
—
|
(2,241
|
)
|
(2,241
|
)
|
||||||||||||||||
|
Foreign currency
translation adjustment
|
—
|
—
|
—
|
—
|
(88
|
)
|
(88
|
)
|
||||||||||||||||
|
Total comprehensive
income
|
8,772
|
|||||||||||||||||||||||
|
Balance, June 30, 2008
|
24,329,670
|
$
|
243
|
$
|
129,704
|
$
|
(31,725
|
)
|
$
|
(1,998
|
)
|
$
|
96,224
|
|||||||||||
|
Stock-based
compensation
|
—
|
—
|
1,405
|
—
|
—
|
1,405
|
||||||||||||||||||
|
Voluntary cancellation of
stock options
|
—
|
—
|
1,803
|
—
|
—
|
1,803
|
||||||||||||||||||
|
Comprehensive loss:
|
||||||||||||||||||||||||
|
Net loss (As revised)
|
—
|
—
|
—
|
(36,930
|
)
|
—
|
(36,930
|
)
|
||||||||||||||||
|
Unrealized loss on
derivative
instruments, net of tax
|
—
|
—
|
—
|
—
|
(646
|
)
|
(646
|
)
|
||||||||||||||||
|
Foreign currency
translation adjustment
|
—
|
—
|
—
|
—
|
(1,277
|
)
|
(1,277
|
)
|
||||||||||||||||
|
Total comprehensive loss
(As revised)
|
(38,853
|
)
|
||||||||||||||||||||||
|
Balance, June 30, 2009
(As revised)
|
24,329,670
|
$
|
243
|
$
|
132,912
|
$
|
(68,655
|
)
|
$
|
(3,921
|
)
|
$
|
60,579
|
|||||||||||
|
Stock-based
compensation
|
—
|
—
|
673
|
—
|
—
|
673
|
||||||||||||||||||
|
Comprehensive income:
|
||||||||||||||||||||||||
|
Net income
|
—
|
—
|
—
|
1,253
|
—
|
1,253
|
||||||||||||||||||
|
Settlement of
derivative
instruments, net of tax
|
—
|
—
|
—
|
—
|
2,352
|
2,352
|
||||||||||||||||||
|
Foreign currency
translation adjustment
|
—
|
—
|
—
|
—
|
1,607
|
1,607
|
||||||||||||||||||
|
Total comprehensive
income
|
5,212
|
|||||||||||||||||||||||
|
Balance, June 30, 2010
|
24,329,670
|
$
|
243
|
$
|
133,585
|
$
|
(67,402
|
)
|
$
|
38
|
$
|
66,464
|
||||||||||||
|
See accompanying Notes to Consolidated Financial Statements.
|
||||||||||||||||||||||||
F-6
Consolidated Statements of Cash Flows
Years ended June 30, 2010, 2009, and 2008
(In thousands)
|
Year ended June 30,
|
||||||||||||
|
2010
|
As Revised
2009
|
2008
|
||||||||||
|
Cash flows from operating activities:
|
||||||||||||
|
Net income (loss)
|
$ | 1,253 | $ | (36,930 | ) | $ | 11,101 | |||||
|
Adjustments to reconcile net income (loss) to net
|
||||||||||||
|
cash provided by operating activities:
|
||||||||||||
|
Depreciation and amortization
|
8,188 | 8,223 | 7,349 | |||||||||
|
Goodwill impairment
|
— | 34,966 | — | |||||||||
|
Amortization of debt issue costs
|
1,013 | 728 | 805 | |||||||||
|
Amortization of loss on settlement of interest rate swap agreements
|
2,975 | — | — | |||||||||
|
Bad debt expense
|
288 | 3,184 | 690 | |||||||||
|
Stock-based compensation
|
673 | 3,208 | 1,342 | |||||||||
|
Gain on sale of equipment and other assets
|
(161 | ) | (219 | ) | (292 | ) | ||||||
|
Deferred income taxes
|
361 | (3,228 | ) | 1,167 | ||||||||
|
Deferred lease incentives
|
— | — | 224 | |||||||||
|
Changes in assets and liabilities (net of effects of acquisitions):
|
||||||||||||
|
Accounts receivable
|
(4,316 | ) | 5,986 | (1,792 | ) | |||||||
|
Merchandise inventories
|
(9,474 | ) | 8,365 | 1,634 | ||||||||
|
Income taxes receivable/payable
|
969 | 368 | 12 | |||||||||
|
Prepaid expenses
|
(68 | ) | (679 | ) | 948 | |||||||
|
Accounts payable
|
10,369 | (2,931 | ) | (7,348 | ) | |||||||
|
Accrued liabilities and other
|
(5,588 | ) | 756 | (9,877 | ) | |||||||
|
Net cash provided by operating activities
|
6,482 | 21,797 | 5,963 | |||||||||
|
Cash flows from investing activities:
|
||||||||||||
|
Purchase of property, plant, and equipment
|
(2,426 | ) | (2,856 | ) | (4,074 | ) | ||||||
|
Disposition (purchase) of other assets
|
(489 | ) | 289 | (12 | ) | |||||||
|
Business acquisitions, net of cash acquired (includes $1,017 of
|
||||||||||||
|
direct acquisition costs)
|
— | — | (23,033 | ) | ||||||||
|
Purchase price adjustments
|
(1,911 | ) | (2,856 | ) | (2,246 | ) | ||||||
|
Proceeds from sale of property, plant, and equipment and other assets
|
295 | 509 | 1,674 | |||||||||
|
Net changes in notes receivable
|
585 | 700 | 144 | |||||||||
|
Net cash used for investing activities
|
(3,946 | ) | (4,214 | ) | (27,547 | ) | ||||||
|
Cash flows from financing activities:
|
||||||||||||
|
Repayment of long-term debt
|
(3,101 | ) | (1,270 | ) | (45,933 | ) | ||||||
|
Borrowings of long-term debt
|
— | — | 44,550 | |||||||||
|
Net borrowings (repayments) under revolving credit facilities
|
9,267 | (15,211 | ) | 20,902 | ||||||||
|
Debt issue costs
|
(65 | ) | (1,098 | ) | (487 | ) | ||||||
|
Settlement of interest rate swap agreements
|
(3,348 | ) | — | — | ||||||||
|
Change in overdraft balances
|
(5,801 | ) | 333 | (2,937 | ) | |||||||
|
Net proceeds from (costs for) the issuance of common stock
|
— | — | (5 | ) | ||||||||
|
Net cash provided by (used for) financing activities
|
(3,048 | ) | (17,246 | ) | 16,090 | |||||||
|
Effect of exchange rate changes in cash and cash equivalents
|
6 | (40 | ) | 195 | ||||||||
|
Net increase (decrease) in cash and cash equivalents
|
(506 | ) | 297 | (5,299 | ) | |||||||
|
Cash and cash equivalents, beginning of year
|
2,749 | 2,452 | 7,751 | |||||||||
|
Cash and cash equivalents, end of year
|
$ | 2,243 | $ | 2,749 | $ | 2,452 | ||||||
See accompanying Notes to Consolidated Financial Statements.
F-7
ANIMAL HEALTH INTERNATIONAL, INC. AND SUBSIDIARIES
(Dollars in thousands)
(1) Organization
Animal Health International, Inc., formerly known as Walco International Holdings, Inc., was incorporated in Delaware in May 2005. Through its wholly owned subsidiaries, Walco International, Inc. and Kane Veterinary Supplies, Ltd. (Kane) (note 4, collectively with Animal Health International, Inc., the Company), the Company’s primary business activity is the sale and distribution of animal health products, supplies, services and technology through operating divisions located throughout the United States, Canada and Taiwan.
(2) Summary of significant accounting policies
(a) Basis of presentation
The consolidated financial statements include the accounts of the Company and its wholly owned subsidiaries. All intercompany balances and transactions have been eliminated in consolidation.
The Company revised the consolidated financial statements as of and for the year ended June 30, 2009, in accordance with U.S. Securities and Exchange Commission (“SEC”) Staff Accounting Bulletin No. 108, “Considering the Effects of Prior Year Misstatements when Quantifying Misstatements in Current Year Financial Statements” (“SAB 108”) to include an adjustment related to accounts payable and the 2009 goodwill impairment charge (note 3).
(b) Revenue recognition
Revenues are recognized when the title passes according to shipping terms. Sales returns and allowances are immaterial. Most product returns from customers are returned to product manufacturers for full credit. Any losses incurred on sales returns are recognized in the period the products are returned. Provision for sales discounts is recorded at the time of sale. Revenues are presented net of sales taxes collected from retail customers and remitted to government taxing authorities.
(c) Direct cost of products sold
Direct cost of products sold includes the cost of inventories, net of purchase rebates, and inbound and outbound freight costs.
(d) Rebates
Inventory rebates are recognized when estimable and probable and include inventory purchase rebates and sales-related rebates. Inventory purchase rebates received are capitalized into inventory while sales-related rebates are recorded as a reduction of cost of sales.
(e) Shipping and handling
The Company invoices certain customers for shipping and handling. This revenue is included in net sales and was $1,037, $1,109, and $1,114 for the years ended June 30, 2010, 2009, and 2008, respectively. The costs associated with shipping and handling are reflected in direct cost of products sold in the consolidated statements of operations and were $11,756, $11,584, and $11,988 for the years ended June 30, 2010, 2009, and 2008, respectively.
(f) Rent expense
Minimum rental expenses are recognized on a straight-line basis over the term of the lease. The Company recognizes minimum rent starting when possession of the property is taken from the landlord. When a lease contains a predetermined fixed escalation of the minimum rent, the Company recognizes the related rent expense on a straight-line basis and records the difference between the recognized rental expense and the amounts payable under the lease as deferred lease incentives. Tenant allowances received are reflected in deferred lease incentives and amortized on a straight-line basis as a reduction to rent expense over the term of the lease.
F-8
(g) Income taxes
The Company accounts for income taxes using the asset and liability method. Under this method, deferred tax assets and liabilities are recognized for the estimated future tax consequences attributable to differences between the financial statement carrying amounts of existing assets and liabilities and their respective tax bases, and operating loss and tax credit carryforwards. Deferred tax assets and liabilities are measured pursuant to tax laws using rates the Company expects to apply to taxable income in the years in which the Company expects those temporary differences to be recovered or settled. The Company recognizes the effect of a change in income tax rates on deferred tax assets and liabilities in our consolidated statement of operations in the period that includes the enactment date. The Company records a valuation allowance to reduce the carrying amounts of deferred tax assets if it is more likely than not that such assets will not be realized.
The Company classifies interest and penalties attributable to income taxes as part of income tax expense. There were no accruals for interest and penalties as of June 30, 2010 and 2009.
(h) Cash and cash equivalents
All highly liquid investments with an original maturity of three months or less are considered to be cash equivalents. These amounts are stated at cost, which approximates fair value. The Company maintains its cash in bank deposit accounts, which at times may exceed federally insured limits. The Company has not experienced any losses in such accounts. Book overdrafts totaling $7,490 and $13,291 at June 30, 2010 and 2009, respectively, are classified as accounts payable in the consolidated balance sheets.
(i) Accounts receivable
Accounts receivable consist primarily of receivables from trade customers. The Company records an allowance for doubtful accounts to allow for any amounts which may be unrecoverable. This allowance is based upon an analysis of historical write-offs and is adjusted as necessary to reserve for specific accounts that are judged to be potentially uncollectible. Specific accounts determined to be uncollectible are written-off against the allowance.
(j) Merchandise inventories
Merchandise inventories are stated at the lower of average cost or market. Inventories include the cost of product, net of purchase rebates, and inbound freight, and primarily consist of finished goods stored in warehouses.
(k) Property, plant, and equipment
Property, plant, and equipment are recorded at cost. Depreciation is determined for financial reporting purposes primarily using the straight-line method over the estimated useful lives of the assets, which are as follows (in years):
|
Buildings and improvements
|
|
10-40
|
|
Leasehold improvements
|
|
Shorter of asset life or lease term
|
|
Equipment:
|
|
|
|
Warehouse
|
|
3-8
|
|
Automotive
|
|
3-8
|
|
Computer hardware and software
|
|
3-5
|
|
Office
|
|
3-8
|
Depreciation expense related to property, plant, and equipment was $3,652, $3,676, and $3,278 for the years ended June 30, 2010, 2009, and 2008 respectively. The Company periodically reviews long-lived assets for impairment when events or changes in circumstances indicate that the carrying amount of an asset may not be recoverable. If the sum of the undiscounted expected future cash flows from an asset is less than the carrying value of the asset, impairment must be recognized in the financial statements by writing down the asset to its fair value. At June 30, 2010 and 2009, no impairment had occurred.
F-9
(l) Goodwill and other intangible assets
Intangible assets include nonamortizing goodwill and trademarks and trade names and amortizing customer relationships and noncompete agreements, which are being amortized over their estimated useful lives of twelve and eight years, respectively. The Company evaluates goodwill and other intangible assets on an annual basis and between annual tests whenever events or circumstances indicate that the carrying value of the goodwill or other intangible asset may exceed its fair value. A significant amount of judgment is involved in determining if an indicator of impairment has occurred. Such indicators may include, among others: a significant decline in the Company’s expected future cash flows; a sustained, significant decline in the Company’s stock price and market capitalization; a significant adverse change in legal factors or in the business climate; unanticipated competition; and slower growth rates. Any adverse change in these factors could have a significant impact on the recoverability of the Company’s goodwill and other intangible assets and could have a material impact on the Company’s consolidated financial statements.
At June 30, 2009, the Company performed its annual impairment test. During fiscal 2009, the Company’s stock price and market capitalization remained low, and the Company experienced no growth during that year, and anticipated slower growth rates in the future. The fair value of the Company was estimated utilizing the income approach to derive an enterprise value of the Company. This income approach was validated by comparing the fair value to fair value estimates using a market approach. The market approach included the determination that the Company’s stock price at June 30, 2009, did not reflect a control premium that was considered in deriving the enterprise value. Based upon the results of this testing, the Company concluded that no impairment of customer relationships, noncompete agreements, or trademarks and trade names existed at June 30, 2009, however, the carrying value of goodwill exceeded its fair value, and the Company recorded a $34,966 impairment charge as of June 30, 2009. At June 30, 2008 and 2010, the Company performed its annual impairment test and determined that no impairment had occurred. The Company will continue to evaluate goodwill and other intangible assets for potential impairment based upon any changes to the Company’s operations or its operating business environment.
(m) Debt issue costs and other assets
Debt issue costs are capitalized and amortized to interest expense over the term of the underlying debt utilizing the straight-line method, which approximates the effective interest method. At June 30, 2010 and 2009, accumulated amortization of debt issue costs totaled $3,030 and $2,017, respectively. Other assets include equipment held for lease, which are amortized over their lease terms, and investments, which are recorded at fair value or utilizing the equity method.
(n) Stock-based compensation
In January 2007, the Company reserved 2,500,000 shares of its common stock for the issuance of awards under the 2007 Stock Option and Incentive Plan. In November 2009, the Company amended and restated the 2007 Stock Option and Incentive Plan, and reserved an additional 1,100,000 shares of its common stock for the issuance of awards.
Options granted under the 2007 Stock Option and Incentive Plan vest over a four-year period and carry a ten-year term. The options issued are incentive stock options, which are not performance-based and vest with continued employment. Unexercised options may be forfeited in the event of termination of employment. Options to purchase 355,725 shares have vested and have a weighted average exercise price of $7.05 and a weighted average remaining contract term of 7.6 years, but no options were exercised as of June 30, 2010. For 2010, 2009 and 2008, expense related to these options was $460, $3,208, and $1,342, respectively. In December 2009, the Company issued 838,875 restricted stock units to certain employees. These units vest over a four-year period, have an indefinite life, and convert to shares of common stock upon certain triggering events. The units carried a fair value of $2.15 upon their issuance, and the expense related to these units during the year ended June 30, 2010 was $213.
During May 2009, the Company's senior management voluntarily surrendered 1,018,500 options for no consideration. The voluntary surrender was not accompanied by a concurrent grant of a replacement award nor other valuable consideration. Accordingly, the unrecognized compensation expense related to these stock options of $1,803 was recognized as compensation expense in the fourth quarter of fiscal 2009. As of June 30, 2010, the Company has granted 360,720 deferred stock units to non-employee members of the Board of Directors. Because the holders of the deferred stock units have a contractual participation right to share in current earnings, the deferred stock units are in included in basic weighted average shares outstanding. After accounting for the 838,875 restricted stock units granted to employees, the 360,720 deferred stock units granted to non-employee members of the Board of Directors, and the 1,340,175 stock options issued to employees that have not been forfeited or surrendered, there were 1,060,230 shares of common stock reserved for future issuance at June 30, 2010.
The Company uses the Black-Scholes formula to estimate the value of stock options granted to employees and expects to continue to use this option valuation model. The Company includes a forfeiture estimate in the amount of compensation expense being recognized. The forfeiture estimate is based on historical employee turnover rates. The estimated fair value of the options is amortized to expense on a straight-line basis over the four-year vesting period.
F-10
The following weighted average assumptions were used for the option grants: risk-free interest rate of 4.75% on the initial 749,300 shares, 4.45% on the subsequent 9,500 shares, 3.25% on the 750,000 shares issued in November 2007, 0.32% on the 750,000 shares issued in November 2008, and 0.05% on the 411,125 shares issued in December 2009, dividend yield of 0% for all shares, annual volatility factor of the expected market price of the Company’s common stock of 31.0% for the initial 749,300 shares and subsequent 9,500 shares, 30.9% for the 750,000 shares issued in November 2007, 29.4% for the 750,000 shares issues in November 2008, and 34.0% for the 411,125 shares issued in December 2009, an estimated forfeiture rate of 8.4%, and an expected life of the options of 6.25 years. The risk-free interest rate was determined based on a yield curve of U.S. Treasury rates ranging from five to seven years. Expected volatility was established based on historical volatility of the stock prices of other companies in industries similar to the Company. Based on these assumptions, the 2007 options were valued at $4.49 per share for the initial 749,300 shares and $5.43 per share for the subsequent 9,500 shares, $4.28 per share for the 750,000 shares issued in 2008, $0.70 per share for the 750,000 shares issued in November 2008, and $0.88 per share for the 411,125 shares issued in December 2009. Total compensation expense for these options, deferred stock units and restricted stock units is $7,515 including the following amounts to be charged to compensation expense each year ended June 30 over each four-year vesting period: $801 in 2011, $612 in 2012, $473 in 2013, and $182 in 2014. The weighted average remaining contract term for the options was 8.4 and 9.0 years at June 30, 2010 and 2009, respectively.
|
Options
|
Weighted average
exercise prices
|
Weighted average fair
value at grant date
|
||||||||||
|
Balance at July 1, 2008
|
1,409,675
|
$
|
11.27
|
$
|
4.38
|
|||||||
|
Granted
|
750,000
|
2.37
|
0.70
|
|||||||||
|
Exercised
|
—
|
—
|
—
|
|||||||||
|
Forfeited
|
(1,145,500
|
)
|
10.96
|
4.11
|
||||||||
|
Balance at July 1, 2009
|
1,014,175
|
5.03
|
1.81
|
|||||||||
|
Granted
|
411,125
|
2.59
|
0.88
|
|||||||||
|
Exercised
|
—
|
—
|
—
|
|||||||||
|
Forfeited
|
(85,125
|
)
|
4.32
|
1.52
|
||||||||
|
Balance at June 30, 2010
|
1,340,175
|
$
|
4.28
|
$
|
1.52
|
|||||||
Intrinsic value for stock options is defined as the difference between the current market value and the exercise price. The exercise price of stock options outstanding and exercisable at June 30, 2009 exceeded the market value, and therefore, the aggregate intrinsic value for the stock options was $0. At June 30, 2010, the aggregate intrinsic value for the outstanding stock options was $66.
(o) Earnings per share
Earnings per share reflects application of the two class method. All classes of common stock participate pro rata in dividends. Therefore, the two class method of calculating earnings per share has been applied. Basic earnings per share is computed by dividing income (loss) available to common shareholders by the weighted average number of common shares outstanding for the reporting period, which includes deferred stock units. Diluted earnings per share reflects the potential dilution that could occur if securities or other contracts to issue common stock were exercised or converted into common stock. For the calculation of diluted earnings per share, the basic weighted average number of shares is increased by the dilutive effect of stock options determined using the treasury stock method. The components of basic and diluted earnings per share are as follows (in thousands, except per share amounts):
|
Year Ended June 30,
|
||||||||||||
|
2010
|
As Revised
2009
|
2008
|
||||||||||
|
Net income (loss) available to common shareholders
|
$ | 1,253 | $ | (36,930 | ) | $ | 11,101 | |||||
|
Basic weighted average shares outstanding
|
24,691 | 24,330 | 24,330 | |||||||||
|
Dilutive effect of stock options
|
156 | — | — | |||||||||
|
Diluted weighted average shares outstanding
|
24,847 | 24,330 | 24,330 | |||||||||
|
Basic earnings (loss) per share
|
$ | 0.05 | $ | (1.52 | ) | $ | 0.46 | |||||
|
Diluted earnings (loss) per share
|
$ | 0.05 | $ | (1.52 | ) | $ | 0.46 | |||||
F-11
All common stock equivalents were excluded from diluted earnings per share in the years ended June 30, 2009 and 2008, as the results were anti-dilutive.
(p) Foreign currency
The functional currency for the Company’s Canadian operations is the Canadian dollar, and the functional currency for the Company's Taiwan operations is the NEW Taiwan dollar. Assets and liabilities for these operations are translated at the exchange rate in effect at the balance sheet date, and income and expenses are translated at average exchange rates prevailing during the year. Foreign currency translation gains or losses are included within stockholders’ equity as part of accumulated other comprehensive income (loss). Foreign currency transaction gains or losses are recognized in interest expense. The Company recorded $428, $0, and $0 in interest expense for the years ended June 30, 2010, 2009, and 2008, respectively.
(q) Fair value of financial instruments
Cash, accounts and notes receivable, accounts payable and accrued liabilities are reflected in the financial statements at amounts which approximate fair value, primarily because of the short-term maturity of those instruments. The Company determined, based on adjustable interest rates applicable to its long-term debt, that the fair value approximates the carrying value of its obligations. The Company's interest rate swap agreements were accounted for at their fair values, which were estimated based on current settlement prices and quoted market prices of comparable contracts. At June 30, 2010, the Company had no interest rate swap agreements.
(r) Use of estimates
The preparation of financial statements in conformity with GAAP requires management to make estimates and assumptions that affect the reported amounts of assets and liabilities and disclosure of contingent assets and liabilities at the date of the financial statements and the reported amounts of revenues and expenses during the reporting period. Such estimates and assumptions are subject to inherent uncertainties, which may result in actual results differing significantly from reported amounts.
(s) Concentration of credit risk
The Company provides credit in the normal course of business to customers based on their creditworthiness and generally requires no collateral from such customers. The Company maintains allowances for potential credit losses.
(t) Effect of recently issued accounting pronouncements
A recent pronouncement by the Financial Accounting Standards Board (FASB) defines fair value, establishes a framework for measuring fair value in accordance with Generally Accepted Accounting Principles (GAAP), and expands disclosures about fair value measurements. The provisions of this pronouncement were adopted on a prospective basis for financial instruments in the first quarter of fiscal 2009 and had no impact upon the Company’s consolidated financial statements. Those provisions relate to financial assets and liabilities carried at fair value and fair value disclosures related to financial assets and liabilities. Fair value is defined as the price that would be received to sell an asset or paid to transfer a liability in an orderly transaction between market participants at the measurement date. The provisions of the pronouncement for nonfinancial assets and nonfinancial liabilities became effective for the Company in the first quarter of fiscal 2010 and had no impact upon the Company’s consolidated financial statements.
A recent FASB pronouncement establishes principles and requirements for how an acquirer in a business combination recognizes and measures in its financial statements the identifiable assets acquired, the liabilities assumed, and any controlling interest; recognizes and measures the goodwill acquired in the business combination or a gain from a bargain purchase; and determines what information to disclose to enable users of the financial statements to evaluate the nature and financial effects of the business combination. The pronouncement became effective for the Company in the first quarter of fiscal 2010. The impact that the pronouncement will have on future consolidated financial statements will vary with each future acquisition.
F-12
(3) Correction of error in 2009 consolidated financial statements
During the quarter ended June 30, 2010, the Company identified an error in accounts payable totaling $9,802. The error existed in June 2005 when the Company’s assets and liabilities were revalued as part of a business combination. The correction of the accounts payable balance at that date would have resulted in additional goodwill. During the quarter ended June 30, 2009, the Company performed its annual impairment test, concluded that the balance of goodwill was impaired, and recorded a $25,164 impairment charge. Had the accounts payable and resulting goodwill been correct in 2005, the goodwill impairment charge for the fourth quarter of 2009 would have been $34,966. This revised impairment charge would have resulted in an additional $9,802 net loss for the year ended June 30, 2009. The Company assessed the materiality of the effect of this misstatement on the year ended June 30, 2009, and the current year in accordance with SEC SAB No. 99, “Materiality” and SAB 108. Based on this assessment, the Company concluded that (i) based on qualitative factors, the error did not result in a material mistatement of any prior periods, as previously reported; and (ii) the adjustment to correct the error to prior periods would materially misstate the June 30, 2010 financial statements if recorded in 2010. As a result, the adjustment to revise the prior period error cannot be recorded in 2010. Therefore, in accordance with SAB 108, the Company revised its 2009 financial statements herein but will not amend its 2009 Annual Report on SEC Form 10-K because the correction was not material to 2009.
The following tables summarize the corrections to the Company’s consolidated financial statements for 2009 (in thousands, except per share amounts):
June 30, 2009
|
As Reported
|
Correction
|
As Revised
|
||||||||||
|
Accounts payable
|
$
|
83,567
|
$
|
9,802
|
$
|
93,369
|
||||||
|
Accumulated deficit
|
(58,853
|
)
|
(9,802
|
)
|
(68,655
|
)
|
||||||
|
Total stockholders’ equity
|
$
|
70,381
|
$
|
(9,802
|
)
|
$
|
60,579
|
|||||
Year Ended June 30, 2009
|
As Reported
|
Correction
|
As Revised
|
||||||||||
|
Goodwill impairment
|
$
|
25,164
|
$
|
9,802
|
$
|
34,966
|
||||||
|
Operating loss
|
(19,887
|
)
|
(9,802
|
)
|
(29,689
|
)
|
||||||
|
Loss before income taxes
|
(27,862
|
)
|
(9,802
|
)
|
(37,664
|
)
|
||||||
|
Net loss
|
$
|
(27,128
|
)
|
$
|
(9,802
|
)
|
$
|
(36,930
|
)
|
|||
|
Basic loss per common share
|
$
|
(1.12
|
)
|
$
|
(0.40
|
)
|
$
|
(1.52
|
)
|
|||
|
Diluted loss per common share
|
$
|
(1.12
|
)
|
$
|
(0.40
|
)
|
$
|
(1.52
|
)
|
|||
(4) Acquisitions
The Company acquired certain assets of Farm City Animal Supply, Inc. during the second fiscal quarter of 2007. Cash of $105 was paid during the quarter ended September 30, 2008, as an earn-out payment to certain selling stockholders of Farm City Animal Supply, Inc. During the quarter ended December 31, 2008, the Company received $74 in net cash proceeds as a final settlement on the acquisition. The earn-out payment and settlement proceeds comprise a net $31 in purchase price adjustments that were accounted for as goodwill.
In October 2007, the Company acquired all of the outstanding stock of Kane for $22,184 in cash (plus $1,017 in direct acquisition costs). In addition, the Company is obligated to make additional cash payments to certain selling stockholders if certain performance targets are met through October 2010. Substantially all of these contingent payments, if any, will be accounted for as goodwill when and if earned. Kane is based in Edmonton, Canada, and is a leading distributor of animal health products in both the production and companion animal markets. During the quarters ended December 31, 2009 and 2008, certain performance targets were met, and the Company paid $1,911 and $2,825, respectively, to certain selling stockholders. Both of these purchase price adjustments were accounted for as goodwill in the quarter earned.
The Company’s acquisitions serve to further the Company’s strategy to access additional product lines, sales representatives, customer opportunities, manufacturer relationships and sales territories. The results of operations for Kane were included in the Company’s consolidated results of operations beginning with the date of the acquisition.
F-13
(5) Accounts receivable, net
|
June 30,
2010
|
June 30,
2009
|
|||||||
|
Trade accounts receivable
|
$
|
71,725
|
$
|
68,494
|
||||
|
Vendor rebate receivables
|
6,305
|
8,239
|
||||||
|
Other receivables
|
507
|
1,116
|
||||||
|
78,537
|
77,849
|
|||||||
|
Less allowance for doubtful accounts
|
(583
|
)
|
|
(3,408
|
)
|
|||
|
|
||||||||
|
Accounts receivable, net
|
$
|
77,954
|
$
|
74,441
|
||||
Bad debt expense totaled $288, $3,184, and $690 for the years ended June 30, 2010, 2009, and 2008, respectively. At June 30, 2009, the Company recorded a bad debt provision of $2,708 as a result of a dispute with a manufacturer regarding a rebate receivable. This receivable was written-off as uncollectible during the quarter ended March 31, 2010. Bad debt write-offs, net of recoveries, totaled $3,113, $933, and $338 for the years ended June 30, 2010, 2009, and 2008, respectively.
Vendor rebates range from one-time purchase opportunities to sales-related programs that last a month, a quarter, a trimester, or the entire calendar year. The receivable for annual sales-related rebate programs are recognized as the established threshold is achieved.
(6) Notes receivable
|
June 30,
2010
|
June 30,
2009
|
|||||||
|
Miscellaneous notes receivable
|
266
|
406
|
||||||
|
Less current portion of notes receivable
|
(189
|
)
|
(126
|
)
|
||||
|
Notes receivable
|
$
|
77
|
$
|
280
|
||||
Notes receivable primarily include obligations due from customers.
|
June 30,
|
June 30,
|
|||||||
|
2010
|
2009
|
|||||||
|
Land
|
$ | 3,461 | $ | 3,461 | ||||
|
Buildings and improvements
|
4,434 | 4,378 | ||||||
|
Leasehold improvements
|
3,892 | 3,749 | ||||||
|
Construction in progress
|
135 | 26 | ||||||
|
Equipment:
|
||||||||
|
Warehouse
|
2,479 | 2,359 | ||||||
|
Automotive
|
6,800 | 6,730 | ||||||
|
Office/software
|
6,142 | 5,392 | ||||||
| 27,343 | 26,095 | |||||||
|
Less accumulated depreciation
|
(12,686 | ) | (10,052 | ) | ||||
|
Property, plant, and equipment, net
|
$ | 14,657 | $ | 16,043 | ||||
Expenditures for maintenance and repairs were $1,888, $1,940, and $2,154 for the years ended June 30, 2010, 2009 and 2008, respectively.
F-14
(8) Goodwill and other intangible assets
|
Gross carrying
amount
|
Accumulated
amortization
|
Net carrying
amount
|
||||||||||
|
June 30, 2010:
|
||||||||||||
|
Goodwill
|
$
|
62,245
|
$
|
—
|
$
|
62,245
|
||||||
|
Customer relationships
|
40,578
|
(15,962
|
)
|
24,616
|
||||||||
|
Noncompete agreements
|
6,245
|
(3,885
|
)
|
2,360
|
||||||||
|
Trademarks and trade names
|
33,170
|
—
|
33,170
|
|||||||||
|
$
|
142,238
|
$
|
(19,847
|
)
|
$
|
122,391
|
|
June 30, 2009:
|
||||||||||||
|
Goodwill
|
$
|
60,334
|
$
|
—
|
$
|
60,334
|
||||||
|
Customer relationships
|
40,578
|
(12,556
|
)
|
28,022
|
||||||||
|
Noncompete agreements
|
6,245
|
(2,809
|
)
|
3,436
|
||||||||
|
Trademarks and trade names
|
33,170
|
—
|
33,170
|
|||||||||
|
$
|
140,327
|
$
|
(15,365
|
)
|
$
|
124,962
|
||||||
|
June 30,
2010
|
As Revised
June 30,
2009
|
|||||||
|
July 1 opening balance
|
$
|
60,334
|
$
|
92,444
|
||||
|
Purchase price adjustments
|
1,911
|
2,856
|
||||||
|
Goodwill impairment
|
—
|
|
(34,966
|
) | ||||
|
June 30 ending balance
|
$
|
62,245
|
$
|
60,334
|
||||
Amortization expense related to intangible assets totaled $4,482, $4,606, and $4,171 for the years ended June 30, 2010, 2009, and 2008, respectively. Based on the current estimated useful lives assigned to intangibles assets, amortization expense for fiscal 2011, 2012, 2013, 2014, and 2015 is projected to total $4,482, $4,229, $3,867, $3,406, and $3,406, respectively.
(9) Long-term debt and other long-term liabilities
|
June 30,
2010
|
June 30,
2009
|
|||||||
|
Credit agreement—Revolving credit facility
|
$
|
88,512
|
$
|
79,245
|
||||
|
Credit agreement—Term Note
|
40,820
|
43,650
|
||||||
|
Liability for interest rate swap agreements
|
—
|
3,920
|
||||||
|
Other
|
7
|
277
|
||||||
|
129,339
|
127,092
|
|||||||
|
Less current portion
|
(129,339
|
)
|
(7,179
|
)
|
||||
|
$
|
—
|
$
|
119,913
|
|||||
F-15
Credit agreements and liquidity
The Company has a $44,550 first lien term loan (Term Note), which matures on May 31, 2011 and bears interest at an annual rate equal to LIBOR plus 2.0%, paid quarterly. The Company plans to continue to take advantage of this favorable rate and not extend, replace, or retire this debt until it is closer to maturity. The Company is in negotiations with multiple lenders and expects to finalize an agreement prior to the maturity of the revolving credit facility. Borrowings are collateralized by a first priority interest in and lien on all of the Company’s assets.
The Company’s revolving credit facility (the Revolver) is a $130,000 facility, which matures on the earlier of June 30, 2012, or 60 days prior to the final extended maturity date of the Term Note. The outstanding borrowings under the amended facility bore interest through July 20, 2009, at LIBOR plus 3.50% for U.S. borrowings and CDOR Rate plus 1% for Canadian borrowings, and thereafter at rates based upon the Company’s Leverage Ratio as defined in the amended Revolver with LIBOR-based rates ranging from LIBOR and CDOR Rate plus 3.00% to LIBOR and CDOR Rate plus 3.75%, and with Prime-based rates ranging from U.S. Prime and Canadian Prime Rate plus 0.50% to U.S. Prime and Canadian Prime Rate plus 1.25%. Borrowings remain collateralized by a first priority interest in and lien on all of the Company’s assets. At June 30, 2010, the Company’s availability under the Revolver totaled $34,006.
As of June 30, 2010, the interest rates for the Revolver ranged from 4.10% to 4.50%, and the interest rate for the Term Note was 2.38%. Additionally, the Company is required to pay a commitment fee on the daily unused amount of the Revolver at a per annum rate of 0.50%. Debt issue costs related to the Term Note and the Revolver have been capitalized and are being amortized over the remaining term of the underlying debt utilizing the straight-line method, which approximates the effective interest method. The credit agreements contain certain covenants that, among other things, restrict our ability to incur additional indebtedness, make certain payments, sell assets, enter into certain transactions with affiliates and create liens. Moreover, certain of these agreements require us to maintain specified financial ratios. The most restrictive covenant relates to the creation or assumption of additional indebtedness. The Company was in compliance with all financial covenants at June 30, 2010.
The Company has utilized cash flow hedge accounting and used derivative financial instruments to effectively convert a portion of its variable-rate debt to fixed-rate debt. In order to reduce cash interest expense over the last three quarters of fiscal 2010, the Company elected to terminate both of its interest rate swap agreements as of September 30, 2009 and paid the respective liabilities in October 2009. Based upon interest rates, in order to reduce cash interest expense over the remainder of 2010, the Company elected to terminate both of its interest rate swap agreements as of September 30, 2009.
The Company entered into a $43,000 notional value swap transaction with a financial institution effective April 18, 2007. The Company received a floating rate based on LIBOR and paid a fixed rate of 4.95%. The swap agreement had an original termination date of June 28, 2010. On September 30, 2009, the Company terminated the swap agreement, and the fair value of this swap was a net liability of $1,511 on that date. The Company entered into a $52,000 million notional value swap transaction with a financial institution effective April 18, 2007. The Company received a floating rate based on LIBOR and paid a fixed rate of 4.95%. The swap agreement had an original termination date of May 7, 2010. On September 30, 2009, the Company terminated the swap agreement, and the fair value of this swap was a net liability of $1,837 on that date.
Swap agreement fair values were recorded on the consolidated balance sheet as a component of current portion of long-term debt. The fair values of the interest rate swap agreements were estimated based on current settlement prices and quoted market prices of comparable contracts. The Company calculated no ineffectiveness on both interest rate swap agreements at their termination on September 30, 2009. At June 30, 2010, all unrealized losses previously recorded on the consolidated balance sheet as accumulated other comprehensive income (loss) had been amortized to interest expense over the remaining terms of the original swap agreements.
The net receipts or payments from the interest rate swap agreements were recorded in interest expense. During the years ended June 30, 2010 and 2009, changes in the fair value of interest rate swap agreements totaled $3,920 [$2,352 net of tax] and $(1,077) [$(646) net of tax], respectively. The Company reclassified $2,352 and $2,667during the years ended June 30, 2010 and 2009, respectively, from accumulated other comprehensive income (loss) to interest expense.
The credit agreements restrict the amount of payments that may be made by the subsidiaries of the Company to Animal Health International, Inc. These restrictions limit the total amount of such payments to the total of $55,000 as defined in the credit agreements. At June 30, 2010, $65,964 or 99.2% of total net assets were restricted. At June 30, 2009, $60,079 or 99.2% of total net assets were restricted.
F-16
Summary financial data for Animal Health International, Inc. on a stand-alone basis as of June 30 of each year is as follows:
|
Balance Sheet
|
2010
|
As Revised
2009
|
||||||
|
Assets:
|
||||||||
|
Investment in subsidiaries
|
$
|
66,464
|
$
|
60,579
|
||||
|
Total assets
|
$
|
66,464
|
$
|
60,579
|
||||
|
Stockholders' equity:
|
||||||||
|
Common stock
|
$
|
243
|
$
|
243
|
||||
|
Additional paid-in capital
|
133,585
|
132,912
|
||||||
|
Accumulated deficit
|
(67,402
|
) |
(68,655
|
)
|
||||
|
Accumulated other comprehensive loss
|
38
|
(3,921
|
) | |||||
|
Total stockholders' equity
|
$
|
66,464
|
$
|
60,579
|
||||
|
Statement of Operations
|
2010
|
As Revised
2009
|
||||||
|
Expenses of parent
|
$
|
(1,638
|
)
|
$
|
(1,790
|
)
|
||
|
Tax benefit of parent
|
655
|
716
|
||||||
|
Net loss of parent before equity in earnings (loss) of subsidiaries
|
(983
|
)
|
(1,074
|
)
|
||||
|
Equity in earnings (loss) of subsidiaries
|
2,236
|
|
(35,856
|
) | ||||
|
Net income (loss)
|
$
|
1,253
|
|
$
|
(36,930
|
) | ||
|
Statement of Cash Flows
|
2010
|
2009
|
||||||
|
Net loss of parent before equity in earnings (loss) of subsidiaries
|
$
|
(983
|
)
|
$
|
(1,074
|
)
|
||
|
Net cash used for operating activities
|
(983 |
)
|
(1,074
|
)
|
||||
|
Investment in subsidiaries
|
983
|
1,074
|
||||||
|
Net cash provided by investing activities
|
983
|
1,074
|
||||||
|
Dividends received
|
—
|
—
|
||||||
|
Dividends paid
|
—
|
—
|
||||||
|
Net proceeds from issuance of common stock
|
—
|
—
|
||||||
|
Net cash provided by financing activities
|
—
|
—
|
||||||
|
Net change in cash
|
$
|
—
|
$
|
—
|
||||
Principal payments for all outstanding borrowings on June 30, 2010 total $129,339 (including outstanding borrowings under the credit agreements) and are due during the year ending June 30, 2010.
For the years ended June 30, 2010, 2009, and 2008, the Company paid interest of $6,482, $7,890, and $9,821 respectively.
(10) Financial instruments
Fair value is measured using a framework that provides a fair value hierarchy that prioritizes inputs to valuation techniques based on observable and unobservable data and categorizes the inputs into three levels: Level 1 – Unadjusted quoted prices in active markets for identical assets or liabilities, Level 2 – Significant observable pricing inputs other than quoted prices included within Level 1 that are either directly or indirectly observable as of the reporting date (essentially, this represents inputs that are derived principally from or corroborated by observable market data), and Level 3 – Generally unobservable inputs, which are developed based on the best information available and may include the Company’s own internal data. Observable data should be used when available.
F-17
The following table presents the Company’s financial assets and liabilities measured as of June 30, 2010:
|
Fair Value
|
|||||||||||||
|
June 30,
2010
|
Level 1
|
Level 2
|
Level 3
|
||||||||||
|
Financial assets at cost :
|
|||||||||||||
|
Current portion of notes receivable
|
$
|
189
|
|||||||||||
|
Notes receivable, net of current portion
|
77
|
||||||||||||
|
Total
|
$
|
266
|
|||||||||||
|
Financial assets at fair value :
|
|||||||||||||
|
Cash and cash equivalents
|
$
|
2,243
|
$
|
2,243
|
$
|
—
|
$
|
—
|
|||||
|
Total
|
$
|
2,243
|
$
|
2,243
|
$
|
—
|
$
|
—
|
|||||
|
Financial liabilities carried at historical proceeds :
|
|||||||||||||
|
Current portion of long-term debt
|
$
|
129,339
|
|||||||||||
|
Long-term debt, net of current portion
|
—
|
||||||||||||
|
Total
|
$
|
129,339
|
|||||||||||
|
Fair Value
|
|||||||||||||
|
June 30,
2009
|
Level 1
|
Level 2
|
Level 3
|
||||||||||
|
Financial assets at cost:
|
|||||||||||||
|
Current portion of notes receivable
|
$
|
126
|
|||||||||||
|
Notes receivable, net of current portion
|
280
|
||||||||||||
|
Total
|
$
|
406
|
|||||||||||
|
Financial assets at fair value:
|
|||||||||||||
|
Cash and cash equivalents
|
$
|
2,749
|
$
|
2,749
|
$
|
—
|
$
|
—
|
|||||
|
Total
|
$
|
2,749
|
$
|
2,749
|
$
|
—
|
$
|
—
|
|||||
| Financial liabilities at fair value: | |||||||||||||
| Current portion of long-term debt (interest rate swaps) | |||||||||||||
| $43,000 notional interest rate swap | $ | 1,771 | — | $ | 1,771 | $ | — | ||||||
| $52,000 notional interest rate swap | 2,149 | — | 2,149 | — | |||||||||
| Total | $ | 3,920 | — | $ | 3,920 | $ | — | ||||||
|
Financial liabilities carried at historical proceeds :
|
|||||||||||||
|
Current portion of long-term debt
|
$
|
3,259
|
|||||||||||
|
Long-term debt, net of current portion
|
119,913
|
||||||||||||
|
Total
|
$
|
123,172
|
|||||||||||
(11) Preferred stock
As of June 30, 2010, the Company had one class of undesignated preferred stock authorized with no shares issued or outstanding. The Board of Directors of the Company may designate and issue preferred stock in one or more series. The Board of Directors can fix the rights, preferences and privileges of the shares of each series and any of its qualifications, limitations or restrictions.
In September 2006, the Company paid an aggregate dividend of $53,323 to the holders of shares of our previously outstanding redeemable preferred stock and an aggregate dividend of $1,177 to the holders of shares of our common stock. A portion of the dividend on the redeemable preferred stock reduced the aggregate liquidation amount that is due to holders of outstanding redeemable preferred stock upon the liquidation, dissolution, or winding up of the Company, or, at the election of at least a majority of the shares of redeemable preferred stock, upon the closing of an extraordinary transaction, as defined in the Company’s Certificate of Incorporation.
(12) Related-party transactions
The Company has property lease agreements with certain employees. The Company incurred related rent expense of $203, $329, and $396 during the years ended June 30, 2010, 2009, and 2008, respectively. The total future obligations outstanding at June 30, 2010, with respect to such leases are $0.
F-18
Effective October 1, 2007, the Company’s Senior Vice President and Chief Operating Officer (the COO) separated from employment with the Company. In connection with such separation, the Company and the COO entered into a Separation Agreement and Full and Final Release dated October 4, 2007, whereby the Company is obligated to pay the COO certain cash consideration, vest 50,000 of his stock options, allow him to retain the right to exercise stock options for ten years from the date of grant, pay certain of his COBRA premiums for health and welfare benefits, reimburse him for certain life and disability insurance coverage costs, and transfer title and ownership of certain assets and equipment to him. The Company’s obligations are subject to the COO’s compliance with certain post-employment restrictive covenants, which limit the COO’s ability to compete with the Company, solicit customers or employees of the Company, or divulge confidential information concerning the Company. These obligations totaled $710 and were charged to selling, general, and administrative costs in the second quarter of the year ended June 30, 2008.
(13) Employee benefit plans
The Company has a defined contribution 401(k) savings plan (the Plan) that covers eligible employees. Company contributions to this plan are made based on the Company’s attainment of certain earnings goals. The Company may also make discretionary contributions to the Plan. Total Company contributions to the Plan were $0 for the year ended June 30, 2010, $218 for the year ended June 30, 2009, and $381 for the year ended June 30, 2008.
(14) Income taxes
Income taxes have been provided as follows:
|
Year ended June 30,
|
||||||||||||
|
2010
|
2009
|
2008
|
||||||||||
|
Current income tax expense:
|
||||||||||||
|
Federal tax expense
|
$ | (1,044 | ) | $ | 1,280 | $ | 6,015 | |||||
|
State and other tax expense (benefit)
|
(59 | ) | 388 | 1,029 | ||||||||
|
Foreign tax expense
|
1,527 | 1,157 | 1,552 | |||||||||
|
Total current income tax expense
|
424 | 2,825 | 8,596 | |||||||||
|
Deferred income tax expense (benefit)
|
361 | (3,559 | ) | (1,188 | ) | |||||||
|
Total income tax expense (benefit)
|
$ | 785 | $ | (734 | ) | $ | 7,408 | |||||
Deferred taxes consist of the following:
|
June 30,
|
||||||||
|
2010
|
2009
|
|||||||
|
Deferred tax assets:
|
||||||||
|
Accounts receivable
|
$ | 185 | $ | 1,291 | ||||
|
Accrued liabilities
|
1,514 | 2,166 | ||||||
|
Merchandise inventories
|
876 | 613 | ||||||
|
Stock options and restricted stock
|
82 | 13 | ||||||
|
Interest rate swaps
|
— | 1,516 | ||||||
|
Deferred lease incentives
|
475 | 542 | ||||||
|
Total deferred tax assets
|
$ | 3,132 | $ | 6,141 | ||||
|
Deferred tax liabilities:
|
||||||||
|
Prepaid expenses
|
$ | (285 | ) | $ | (711 | ) | ||
|
Property, plant, and equipment
|
(1,172 | ) | (931 | ) | ||||
|
Intangible assets
|
(23,263 | ) | (24,210 | ) | ||||
|
Total deferred tax liabilities
|
$ | (24,720 | ) | $ | (25,852 | ) | ||
|
Net deferred tax liabilities
|
$ | (21,588 | ) | $ | (19,711 | ) | ||
|
Less current deferred income taxes
|
(1,852 | ) | (3,358 | ) | ||||
|
Non-current deferred income taxes
|
$ | (23,440 | ) | $ | (23,069 | ) | ||
Deferred tax assets are recognized for the estimated future tax effects of deductible temporary differences. As of June 30, 2010 and 2009, the Company has not recorded a valuation allowance as the Company believes it is more likely than not that the deferred tax assets will be realized.
F-19
A reconciliation of income taxes computed at statutory rates to the reported income tax expense from operations is as follows:
|
Year Ended June 30,
|
||||||||||||
|
2010
|
As Revised
2009
|
2008
|
||||||||||
|
Income tax expense (benefit) computed at federal statutory rate
|
$ | 714 | $ | (13,182 | ) | $ | 6,477 | |||||
|
State taxes, net of federal benefit
|
(19 | ) | 108 | 726 | ||||||||
|
Permanent difference from goodwill impairment
|
— | 11,019 | — | |||||||||
|
Foreign sales corporation benefit
|
(570 | ) | 181 | 181 | ||||||||
|
Other permanent differences
|
660 | 1,140 | 24 | |||||||||
|
Total income tax expense (benefit)
|
$ | 785 | $ | (734 | ) | $ | 7,408 | |||||
|
Effective income tax rate
|
38.5 | % | 19.5 | % | 40 | % | ||||||
|
Income taxes paid (refunded)
|
$ | (262 | ) | $ | 2,144 | $ | 7,942 | |||||
Other permanent differences include $631 for the voluntary forfeiture of 1,018,500 of stock options by senior management during May 2009.
As of June 30, 2010, the Company has state net operating loss carryforwards of $244 that expire at various dates between 2018 and 2030. As of June 30, 2010, the Company has not provided for U.S. or additional foreign withholding taxes on undistributed earnings of its Canadian subsidiaries of $5,724 because it is the present intention of management to reinvest the undistributed earnings indefinitely in Canadian operations. Generally, such earnings become subject to U.S. tax upon the remittance of dividends and under certain other circumstances. It is not practicable to estimate the amount of deferred tax liability on such undistributed earnings.
As of June 30, 2010 and 2009, there were no material unrecognized tax benefits. In addition, there were no accruals for the payment of interest and penalties related to income tax liabilities at June 30, 2010. The Company recognizes potential interest and penalties related to unrecognized tax benefits in income tax expense. As of June 30, 2010, the Company has open tax years for Federal purposes back to June 2006. For state purposes, the open tax years typically go back to June 2007, although some states remain open back to June 2006.
(15) Commitments and contingencies
The Company leases certain vehicles, computer equipment and facilities under noncancelable operating leases that expire in various years through 2018. Future minimum lease payments by year and in the aggregate, under noncancelable operating leases with initial or remaining terms of one year or more, consist of the following at June 30, 2010:
|
Operating leases
|
||||
|
Year ending June 30:
|
||||
|
2011
|
$
|
5,059
|
||
|
2012
|
4,520
|
|||
|
2013
|
4,091
|
|||
|
2014
|
2,747
|
|||
|
2015
|
1,730
|
|||
|
Thereafter
|
2,597
|
|||
|
Total minimum lease payments
|
$
|
20,744
|
||
Rental expense for the years ended June 30, 2010, 2009, and 2008 was $6,767, $6,982, and $6,494 respectively.
The Company is involved in various matters of litigation arising in the normal course of business. In addition, the Company has had an ongoing dispute with a competitor regarding a patent infringement matter. Prior to June 30, 2007, the Company established a $2,500 reserve for this dispute. Effective January 22, 2010, the Company entered into a Confidential Settlement Agreement and Release, and a Confidential Patent Settlement Agreement and Release, with this competitor and its affiliated parties, which agreements settled all claims, disputes and related matters with prejudice. As a result of such settlement and related legal costs, the Company recognized an additional liability of $350 and charged the amount against selling, general, and administrative costs in the second quarter of fiscal 2010. The parties agreed that the other terms included in these agreements are confidential.
Although the ultimate liability from existing or potential claims cannot be ascertained, management does not anticipate that any related outcomes would have a materially adverse effect on the Company’s financial position, operating results, or cash flows.
F-20
(15) Geographic locations
The Company operates in a single business segment that includes the distribution of products and delivery of consultative services within the animal health industry. The following table presents the Company’s net sales and long-lived assets in different geographic locations:
|
Year Ended June 30,
|
||||||||||||
|
2010
|
2009
|
2008 (1)
|
||||||||||
|
Net sales:
|
||||||||||||
|
United States
|
$ | 600,289 | $ | 609,661 | $ | 669,311 | ||||||
|
Canada
|
68,069 | 56,546 | 46,473 | |||||||||
|
Other foreign countries
|
562 | 741 | 758 | |||||||||
|
Total
|
$ | 668,920 | $ | 666,948 | $ | 716,542 | ||||||
|
Long-lived assets:
|
||||||||||||
|
United States
|
$ | 128,274 | $ | 134,480 | $ | 164,593 | ||||||
|
Canada
|
11,818 | 10,476 | 8,741 | |||||||||
|
Other foreign countries
|
— | — | 3 | |||||||||
|
Total
|
$ | 140,092 | $ | 144,956 | $ | 173,337 | ||||||
Net sales are attributable to geographic areas based upon location of customer. Neither the Company nor any individual country depends upon any single customer for more than 10% of its sales. Long-lived assets are based upon physical location.
|
(1)
|
The Canada data for 2008 includes information from the date of acquisition of Kane in October 2007 (note 4).
|
(16) Quarterly financial data (unaudited)
| (in thousands, except per share data) |
June 30,
|
March 31,
|
December 31,
|
September 30,
|
|||||||||||||||||||||
|
|
2010
|
2010
|
2009
|
2009
|
|||||||||||||||||||||
|
Net sales
|
$
|
171,978
|
$
|
165,126
|
$
|
170,487
|
$
|
161,329
|
|||||||||||||||||
|
Gross profit
|
28,590
|
27,353
|
29,416
|
25,946
|
|||||||||||||||||||||
|
Income (loss) before income taxes
|
1,104
|
179
|
1,952
|
(1,197
|
)
|
||||||||||||||||||||
|
Net income (loss)
|
$
|
662
|
$
|
120
|
$
|
1,218
|
$
|
(747
|
)
|
||||||||||||||||
|
Earnings (loss) per share:
|
|||||||||||||||||||||||||
|
Basic
|
$
|
0.03
|
$
|
0.00
|
$
|
0.05
|
$
|
(0.03
|
)
|
||||||||||||||||
|
Diluted
|
$
|
0.03
|
$
|
0.00
|
$
|
0.05
|
$
|
(0.03
|
)
|
||||||||||||||||
|
Weighted average shares outstanding:
|
|||||||||||||||||||||||||
|
Basic
|
24,691
|
24,691
|
24,691
|
24,691
|
|||||||||||||||||||||
|
Diluted
|
24,882
|
24,789
|
24,691
|
24,691
|
|||||||||||||||||||||
| As Reported | Correction (2) | As Revised | |||||||||||||||||||||||
|
June 30,
|
June 30, |
June 30,
|
March 31,
|
December 31,
|
September 30,
|
||||||||||||||||||||
| 2009 | 2009 |
2009
|
2009
|
2008
|
2008
|
||||||||||||||||||||
|
Net sales
|
$ | 162,517 | $ | — |
$
|
162,517
|
$
|
150,931
|
$
|
184,477
|
$
|
169,023
|
|||||||||||||
|
Gross profit
|
$ | 26,057 | — |
26,057
|
25,329
|
32,268
|
30,300
|
||||||||||||||||||
|
Income (loss) before income taxes
|
(31,472 | ) | (9,802 | ) |
(41,274
|
)
|
(608
|
)
|
3,717
|
501
|
|||||||||||||||
|
Net income (loss)
|
$ | (29,357 | ) | $ | (9,802 | ) |
$
|
(39,159
|
)
|
$
|
(324
|
)
|
$
|
2,269
|
$
|
284
|
|||||||||
|
Earnings (loss) per share:
|
|||||||||||||||||||||||||
|
Basic
|
$ | (1.21 | ) | $ | (0.40 | ) |
$
|
(1.61
|
)
|
$
|
(0.01
|
)
|
$
|
0.09
|
$
|
0.01
|
|||||||||
|
Diluted
|
$ | (1.21 | ) | $ | (0.40 | ) |
$
|
(1.61
|
)
|
$
|
(0.01
|
)
|
$
|
0.09
|
$
|
0.01
|
|||||||||
|
Weighted average shares outstanding:
|
|||||||||||||||||||||||||
|
Basic
|
24,330 | 24,330 |
24,330
|
24,330
|
24,330
|
24,330
|
|||||||||||||||||||
|
Diluted
|
24,330 | 24,300 |
24,330
|
24,330
|
24,330
|
24,330
|
|||||||||||||||||||
|
(2)
|
See note 3.
|
F-21
Exhibit Index
|
Number
|
Description
|
|
|
3.1(1)
|
Form of Fourth Amended and Restated Certificate of Incorporation of Animal Health International, Inc.
|
|
|
3.2(1)
|
Form of Amended and Restated By-laws of Animal Health International, Inc.
|
|
|
4.1(2)
|
Specimen Stock Certificate
|
|
|
10.1(3)
|
Livestock Products Agreement entered into on December 11, 2008 and effective as of January 1, 2009 by and between Pfizer Inc. and Walco International, Inc.
|
|
|
10.2(4)
|
Livestock Products Agreement entered into on March 9, 2010 and effective as of January 1, 2010 by and between Pfizer Inc. and Walco International, Inc.
|
|
|
10.3(1)
|
Amended and Restated Credit Agreement, dated September 2006, by and among Animal Health International, Inc., each of the credit parties party thereto, each of the financial institutions party thereto, JPMorgan Chase Bank, N.A., as administrative agent for the Lenders and General Electric Capital Corporation as documentation agent for the lenders
|
|
|
10.4(5)
|
Second Amended and Restated Credit Agreement, dated October 2007, by and among Walco International, Inc., each of the credit parties party thereto, each of the financial institutions party thereto, JPMorgan Chase Bank, N.A., as administrative agent for the Lenders and General Electric Capital Corporation as documentation agent for the lenders
|
|
|
10.5(6)
|
First Amendment to the Second Amended and Restated Credit Agreement, dated May 5, 2009, by and among Walco International, Inc., Kane Veterinary Supplies, Ltd., and each of the credit parties party thereto, each of the financial institutions party thereto, JPMorgan Chase Bank, N.A., as administrative agent for the U.S. lenders, JPMorgan Chase Bank, N.A. Toronto Branch, as administrative agent for the Canadian lenders, and U.S. Bank National Association as documentation agent for the lenders
|
|
|
10.6(1)
|
Term Loan Agreement, dated September 2006, by and among Animal Health International, Inc., each of the credit parties party thereto and Wilmington Trust, as administrative agent for the lenders
|
|
|
10.7(7)
|
Term Loan Agreement, dated August 10, 2007, by and among Animal Health International, Inc., each of the credit parties party thereto and Wells Fargo Bank, National Association, as administrative agent for the lenders
|
|
|
10.8(12)
|
Amended and Restated 2007 Stock Option and Incentive Plan
|
|
|
10.9(2)
|
Form of Incentive Stock Option Agreement under the 2007 Stock Option and Incentive Plan
|
|
|
10.10(2)
|
Form of Non-Qualified Stock Option Agreement under the 2007 Stock Option and Incentive Plan
|
|
|
10.11(2)
|
Form of Deferred Stock Unit Award under the 2007 Stock Option and Incentive Plan
|
|
|
10.12(11)
|
Amendment to Deferred Stock Unit Award Agreement under the 2007 Stock Option and Incentive Plan
|
|
|
10.13(2)
|
Form of Restricted Stock Award Agreement under the 2007 Stock Option and Incentive Plan
|
|
10.14(1)
|
Employment Agreement between Animal Health International, Inc. and James Robison, dated as of May 1, 1997
|
|
|
10.15(1)
|
Amendment No. 1 to Employment Agreement between Animal Health International, Inc. and James Robison, dated as of June 30, 2005
|
|
|
10.16(9)
|
Amendment No. 2 to Employment Agreement between Animal Health International, Inc. and James Robison, dated as of May 7, 2008
|
|
|
10.17(8)
|
Non-Compete Agreement between Walco International, Inc. and Kathy Hassenpflug dated as of March 10, 2000
|
|
| 10.18(8) | Non Competition Addendum between Walco International, Inc. and Kathy Hassenpflug dated as of September 30, 2005 |
|
10.19(11)
|
Amendment No. 2 to Agreement between Walco International, Inc. and Kathy Hassenpflug dated as of December 31, 2008
|
|
|
10.20(13)
|
Amendment No. 3 to Agreement between Walco International, Inc. and Kathy Hassenpflug dated as of September 3, 2009
|
|
|
10.21(1)
|
Employment Agreement between Animal Health International, Inc. and William Lacey, dated as of August 15, 2003
|
|
|
10.22(1)
|
Amendment No. 1 to Employment Agreement between Animal Health International, Inc. and William Lacey, dated as of June 30, 2005
|
|
|
10.23(11)
|
Amendment No. 2 to Employment Agreement between Walco International, Inc. and William Lacey dated as of December 31, 2008
|
|
|
10.24(13)
|
Amendment No. 3 to Employment Agreement between Walco International, Inc. and William Lacey dated as of September 3, 2009
|
|
|
10.25(1)
|
Employment Agreement between Animal Health International, Inc. and Damian Olthoff, dated as of April 1, 2006
|
|
|
10.26(11)
|
Amendment No. 1 to Employment Agreement between Walco International, Inc. and Damian Olthoff dated as of December 31, 2008
|
|
|
10.27(13)
|
Amendment No. 2 to Employment Agreement between Walco International, Inc. and Damian Olthoff dated as of September 3, 2009
|
|
|
10.28(1)
|
Form of Indemnification Agreement between Animal Health International, Inc. and each of its Directors and Executive Officers
|
|
|
10.29(13)
|
Form of Amendment to Indemnification Agreement between Animal Health International, Inc. and each of its Directors and Executive Officers
|
|
|
10.30(7)
|
Amended and Restated Plan for Compensation of Non-Employee Directors
|
|
|
10.31(2)
|
Non-Employee Directors' Deferred Compensation Program
|
|
21.1
|
List of Subsidiaries
|
|
|
23.1
|
Consent of Grant Thornton LLP
|
|
|
23.2
|
Consent of KPMG LLP
|
|
|
24.1
|
Powers of Attorney (included on signature page hereto)
|
|
|
31.1
|
Rule 13a-14(a)/15d-14(a) Certification, executed by James C. Robison, Chief Executive Officer, President and Director
|
|
|
31.2
|
Rule 13a-14(a)/15d-14(a) Certification, executed by William F. Lacey, Chief Financial Officer
|
|
|
32.1
|
Section 1350 Certifications, executed by James C. Robison, Chief Executive Officer, President and Director, and William F. Lacey, Chief Financial Officer
|
|
|
(1)
|
Incorporated by reference to Amendment No. 2 to our Registration Statement on Form S-1 (File No. 333-137656) filed on December 13, 2006
|
||||
|
(2)
|
Incorporated by reference to Amendment No. 4 to our Registration Statement on Form S-1 (File No. 333-137656) filed on January 16, 2007
|
||||
|
(3)
|
Incorporated by reference to our Current Report on Form 8-K filed on December 16, 2008
|
||||
|
(4)
|
Incorporated by reference to our Current Report on Form 8-K filed on March 22, 2010
|
||||
| (5) | Incorporated by reference to our Quarterly Report on Form 10-Q filed on February 7, 2008 | ||||
| (6) | Incorporated by reference to our Current Report on Form 8-K filed on December 16, 2008 | ||||
| (7) | Incorporated by reference to our Annual Report on Form 10-K filed on September 9, 2008 | ||||
| (8) | Incorporated by reference to our Quarterly Report on Form 10-Q filed on November 7, 2007 | ||||
| (9) | Incorporated by reference to our Quarterly Report on Form 10-Q filed on May 8, 2008 | ||||
| (10) | Incorporated by reference to our Current Report on Form 8-K filed on October 5, 2007 | ||||
| (11) | Incorporated by reference to our Current Report on Form 8-K filed on January 2, 2009 | ||||
| (12) | Incorporated by reference to our Current Report on Form 8-K filed on November 20, 2009 | ||||
| (13) | Incorporated by reference to our Annual Report on Form 10-K filed on September 3, 2009 | ||||