Attached files
| file | filename |
|---|---|
| 8-K/A - FORM 8-K/A - GRUBB & ELLIS CO | c05170e8vkza.htm |
Exhibit 99.1

| Second Quarter 2010 Earnings Conference Call August 10, 2010 |

| 1 This presentation contains forward-looking statements within the meaning of the Private Securities Litigation Reform Act of 1995. These statements include assumptions regarding expectations or estimates of future financial and operating results or events, industry and market trends and other market opportunities for Grubb & Ellis. The information in this presentation discusses the state of Grubb & Ellis' business as of the date of presentation. Grubb & Ellis does not assume any obligation to update or correct any information covered herein. There are a number of risks and uncertainties that could cause our actual results to differ materially from those described in the forward-looking statements. For additional information concerning risks that could cause such differences, please refer to our annual report on Form 10-K/A, quarterly reports on Form 10-Q and other filings with the Securities and Exchange Commission. We may make certain statements during the course of this presentation which include references to "non-GAAP financial measures," as defined by SEC regulations. As required by these regulations, we have provided reconciliations of these measures to what we believe are the most directly comparable GAAP measures, which are attached hereto within the appendix. Forward Looking Statements |
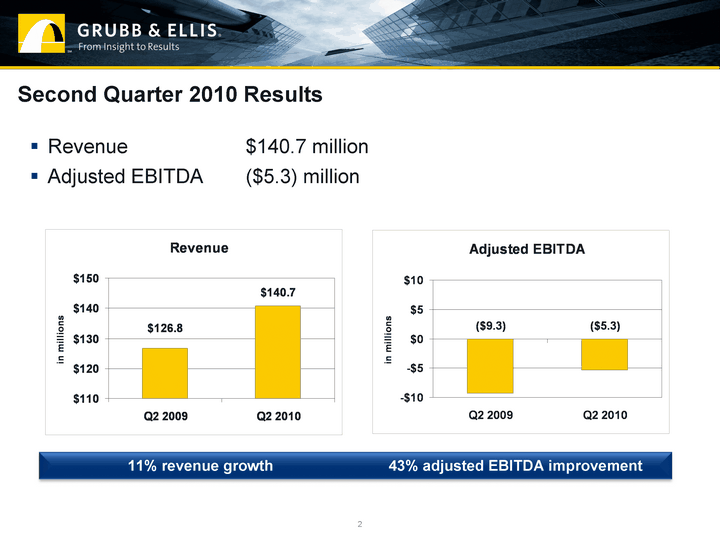
| 2 Second Quarter 2010 Results Revenue $140.7 million Adjusted EBITDA ($5.3) million 11% revenue growth 43% adjusted EBITDA improvement |
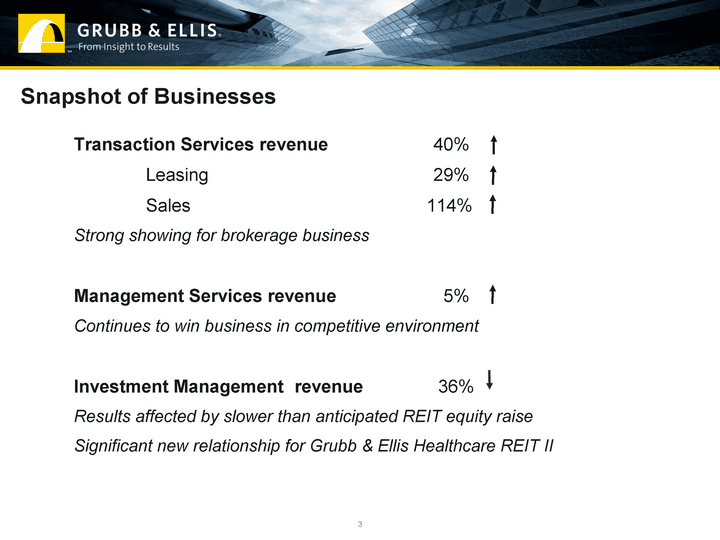
| 3 Snapshot of Businesses Transaction Services revenue 40% Leasing 29% Sales 114% Strong showing for brokerage business Management Services revenue 5% Continues to win business in competitive environment Investment Management revenue 36% Results affected by slower than anticipated REIT equity raise Significant new relationship for Grubb & Ellis Healthcare REIT II |

| SF under management: 240 MSF Renewals: 3 Expansions: 2 New relationships: 3 4 Assets under management: $5.5 billion Equity raise: $38.7 million Acquisitions: 8 YTD Key Metrics: Highlights Investment Management Leasing: up 29% Sales: up 114% Recruiting: 33 senior brokers New services: Mortgage brokerage Appraisal Management Services Transaction Services |
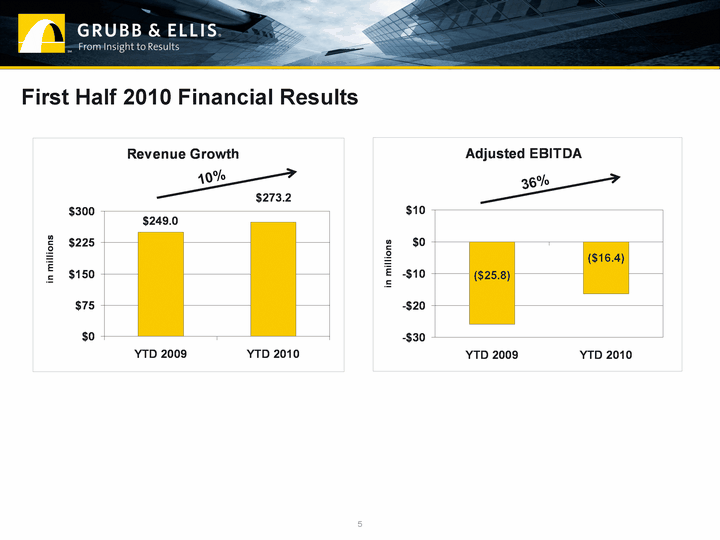
| 10% 5 First Half 2010 Financial Results 36% |

| 6 Revenue by Segment (in millions) Q2 2009 Q2 2010 YTD 2009 YTD 2010 Management Services $66.6 $69.9 $132.2 $142.3 Transaction Services 38.9 54.7 72.5 96.9 Investment Management 13.4 8.6 29.1 18.7 Rental Related 7.9 7.5 15.2 15.3 TOTAL $126.8 $140.7 $249.0 $273.2 Rental revenue includes $4.0 million and $3.8 million, respectively, of revenue related to assets held for investment for the quarter, and $7.9 million and $7.6 million, respectively, for the year. |
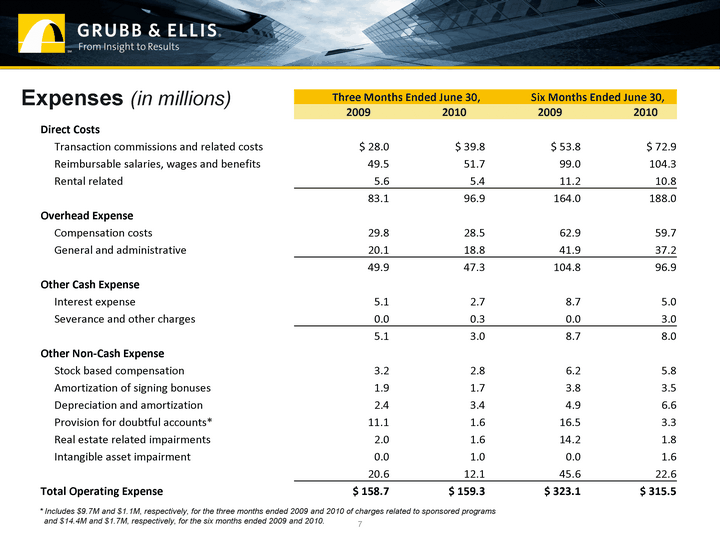
| 7 Expenses (in millions) Three Months Ended June 30, Three Months Ended June 30, Six Months Ended June 30, Six Months Ended June 30, 2009 2010 2009 2010 Direct Costs Transaction commissions and related costs $ 28.0 $ 39.8 $ 53.8 $ 72.9 Reimbursable salaries, wages and benefits 49.5 51.7 99.0 104.3 Rental related 5.6 5.4 11.2 10.8 83.1 96.9 164.0 188.0 Overhead Expense Compensation costs 29.8 28.5 62.9 59.7 General and administrative 20.1 18.8 41.9 37.2 49.9 47.3 104.8 96.9 Other Cash Expense Interest expense 5.1 2.7 8.7 5.0 Severance and other charges 0.0 0.3 0.0 3.0 5.1 3.0 8.7 8.0 Other Non-Cash Expense Stock based compensation 3.2 2.8 6.2 5.8 Amortization of signing bonuses 1.9 1.7 3.8 3.5 Depreciation and amortization 2.4 3.4 4.9 6.6 Provision for doubtful accounts* 11.1 1.6 16.5 3.3 Real estate related impairments 2.0 1.6 14.2 1.8 Intangible asset impairment 0.0 1.0 0.0 1.6 20.6 12.1 45.6 22.6 Total Operating Expense $ 158.7 $ 159.3 $ 323.1 $ 315.5 * Includes $9.7M and $1.1M, respectively, for the three months ended 2009 and 2010 of charges related to sponsored programs and $14.4M and $1.7M, respectively, for the six months ended 2009 and 2010. |
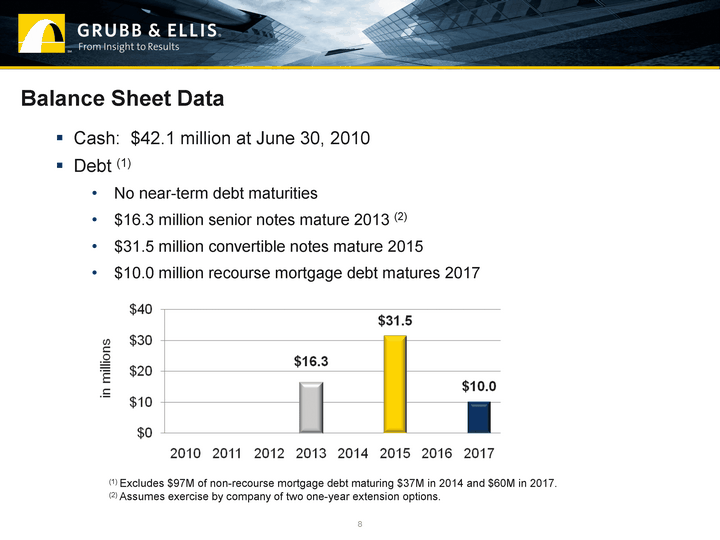
| 8 Balance Sheet Data Cash: $42.1 million at June 30, 2010 Debt (1) No near-term debt maturities $16.3 million senior notes mature 2013 (2) $31.5 million convertible notes mature 2015 $10.0 million recourse mortgage debt matures 2017 (1) Excludes $97M of non-recourse mortgage debt maturing $37M in 2014 and $60M in 2017. (2) Assumes exercise by company of two one-year extension options. |
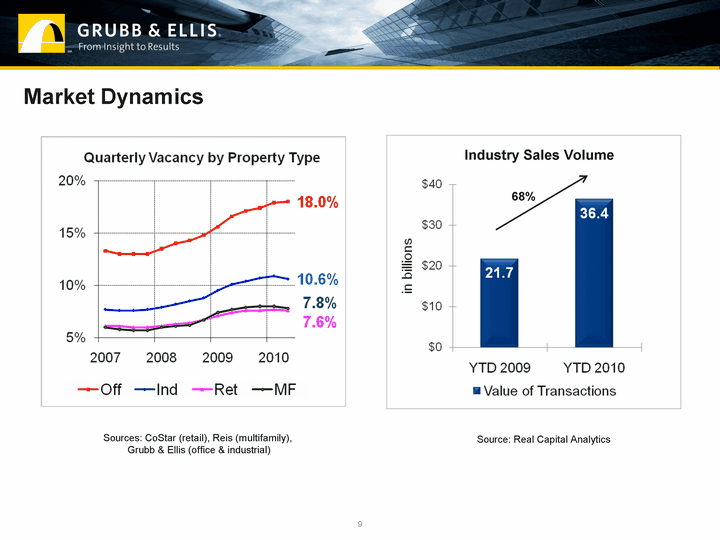
| 9 Market Dynamics Industry Sales Volume Source: Real Capital Analytics Sources: CoStar (retail), Reis (multifamily), Grubb & Ellis (office & industrial) 68% |
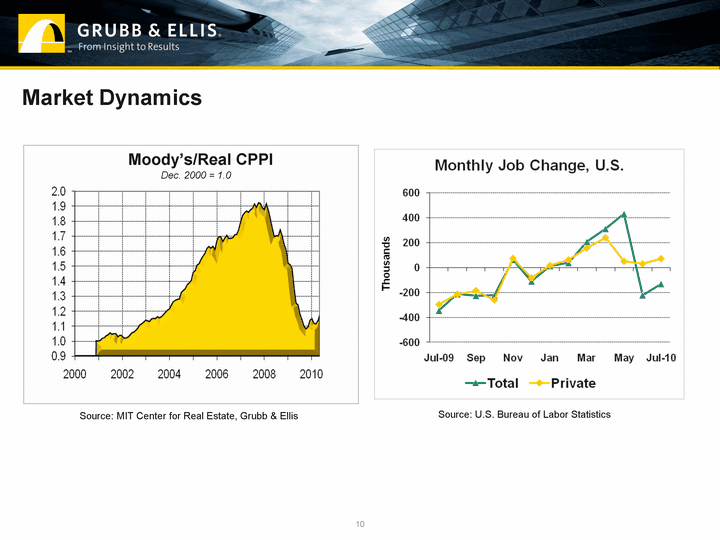
| 10 Market Dynamics Moody's/Real CPPI Dec. 2000 = 1.0 Source: MIT Center for Real Estate, Grubb & Ellis Source: U.S. Bureau of Labor Statistics |
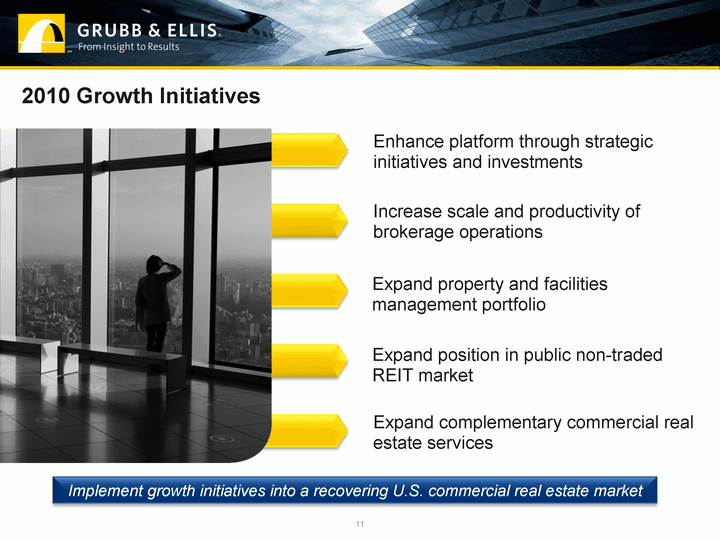
| 11 Expand property and facilities management portfolio Increase scale and productivity of brokerage operations Expand complementary commercial real estate services 2010 Growth Initiatives Expand position in public non-traded REIT market Enhance platform through strategic initiatives and investments Implement growth initiatives into a recovering U.S. commercial real estate market |
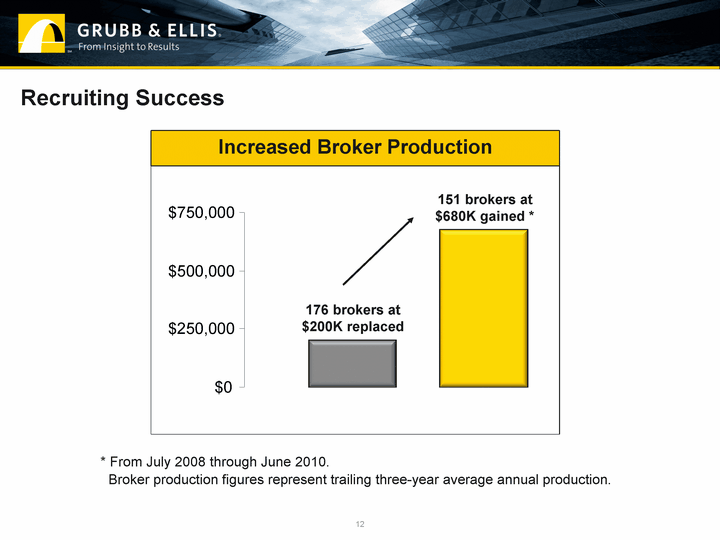
| 12 Recruiting Success Increased Broker Production * From July 2008 through June 2010. Broker production figures represent trailing three-year average annual production. 151 brokers at $680K gained * 176 brokers at $200K replaced $0 $250,000 $500,000 $750,000 |
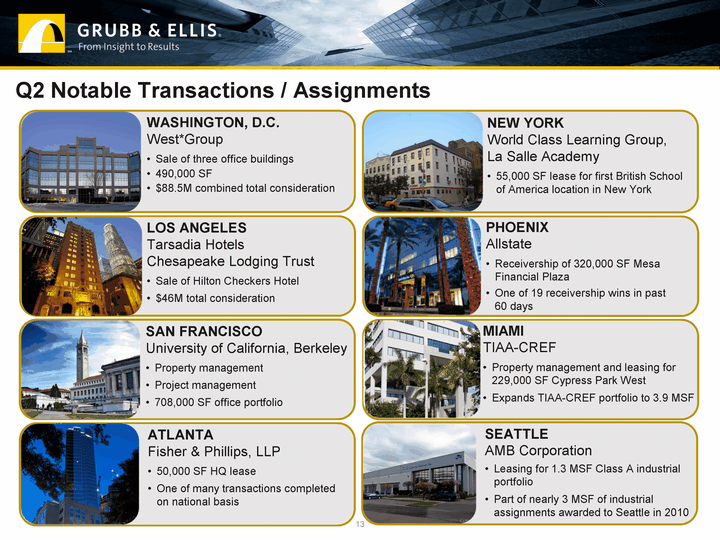
| 13 Q2 Notable Transactions / Assignments WASHINGTON, D.C. West*Group Sale of three office buildings 490,000 SF $88.5M combined total consideration LOS ANGELES Tarsadia Hotels Chesapeake Lodging Trust Sale of Hilton Checkers Hotel $46M total consideration SAN FRANCISCO University of California, Berkeley Property management Project management 708,000 SF office portfolio ATLANTA Fisher & Phillips, LLP 50,000 SF HQ lease One of many transactions completed on national basis SEATTLE AMB Corporation Leasing for 1.3 MSF Class A industrial portfolio Part of nearly 3 MSF of industrial assignments awarded to Seattle in 2010 MIAMI TIAA-CREF Property management and leasing for 229,000 SF Cypress Park West Expands TIAA-CREF portfolio to 3.9 MSF PHOENIX Allstate Receivership of 320,000 SF Mesa Financial Plaza One of 19 receivership wins in past 60 days NEW YORK World Class Learning Group, La Salle Academy 55,000 SF lease for first British School of America location in New York |
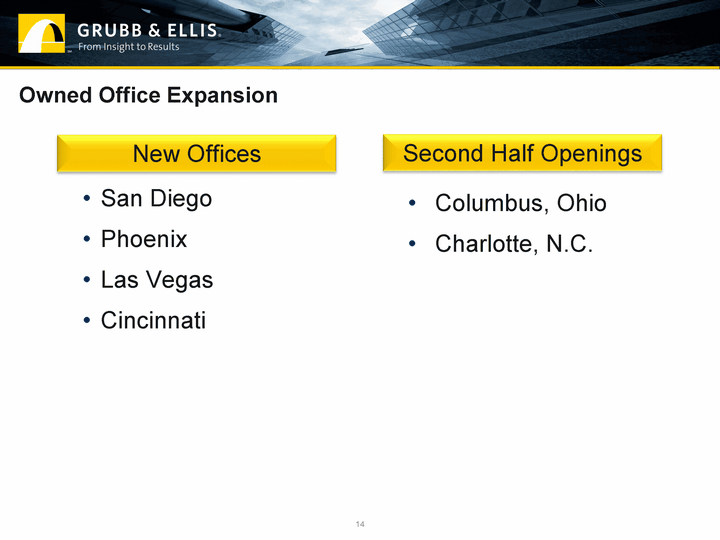
| 14 Owned Office Expansion San Diego Phoenix Las Vegas Cincinnati Columbus, Ohio Charlotte, N.C. New Offices Second Half Openings |

| 15 New Services Grubb & Ellis Landauer Appraisal & Valuation Led by industry veterans Doug Haney and Ed Alegre Regional leaders named in Texas and Los Angeles; identified in five other regions Operational by September 1 8-10 offices and 100 appraisers in place by year-end Debt & Equity Continue to lay groundwork through key hires Financial Services Asset Management Current receivership, project management, property management and transaction services assignments exceed $1.8 billion in asset value Awarded 19 new listing assignments in past 60 days |
| 16 Investment Management Progress Q2 equity raise increased 26% over Q1 LPL Financial agreement significantly increases number of financial advisors able to offer Grubb & Ellis Healthcare REIT II to their clients Expect equity raise to increase in second half of 2010 and 2011 Non-traded REIT industry total equity raise projected to grow 25% year-over-year |

| 17 Appendix |
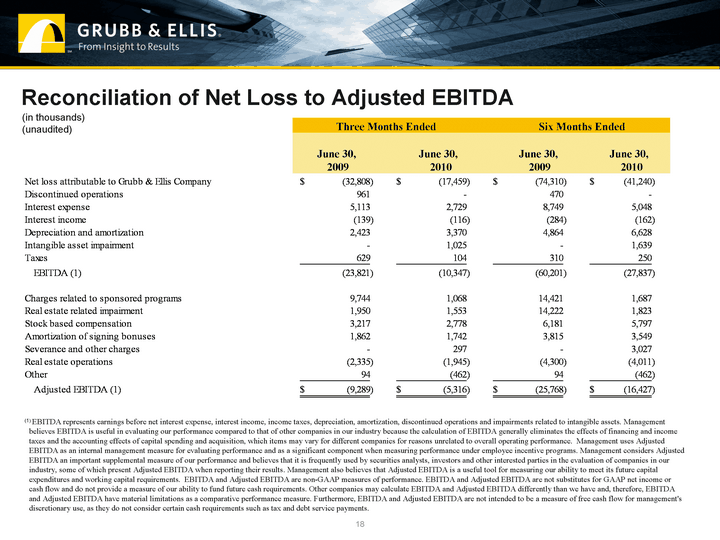
| 18 (1) EBITDA represents earnings before net interest expense, interest income, income taxes, depreciation, amortization, discontinued operations and impairments related to intangible assets. Management believes EBITDA is useful in evaluating our performance compared to that of other companies in our industry because the calculation of EBITDA generally eliminates the effects of financing and income taxes and the accounting effects of capital spending and acquisition, which items may vary for different companies for reasons unrelated to overall operating performance. Management uses Adjusted EBITDA as an internal management measure for evaluating performance and as a significant component when measuring performance under employee incentive programs. Management considers Adjusted EBITDA an important supplemental measure of our performance and believes that it is frequently used by securities analysts, investors and other interested parties in the evaluation of companies in our industry, some of which present Adjusted EBITDA when reporting their results. Management also believes that Adjusted EBITDA is a useful tool for measuring our ability to meet its future capital expenditures and working capital requirements. EBITDA and Adjusted EBITDA are non-GAAP measures of performance. EBITDA and Adjusted EBITDA are not substitutes for GAAP net income or cash flow and do not provide a measure of our ability to fund future cash requirements. Other companies may calculate EBITDA and Adjusted EBITDA differently than we have and, therefore, EBITDA and Adjusted EBITDA have material limitations as a comparative performance measure. Furthermore, EBITDA and Adjusted EBITDA are not intended to be a measure of free cash flow for management's discretionary use, as they do not consider certain cash requirements such as tax and debt service payments. Reconciliation of Net Loss to Adjusted EBITDA (in thousands) (unaudited) Three Months Ended Three Months Ended Three Months Ended Six Months Ended Six Months Ended Six Months Ended June 30, 2009 June 30, 2010 June 30, 2009 June 30, 2010 |

| 19 Investment Management Supplemental Data Three Months Ended Three Months Ended Three Months Ended Six Months Ended Six Months Ended Six Months Ended June 30, June 30, June 30, June 30, 2009 2010 2009 2010 Investment management revenue: Acquisition and loan fees (1) $ 815 $ 1,286 $ 3,033 $ 5,210 Property and asset management fees 8,516 5,761 16,977 10,419 Other 4,095 1,519 9,073 3,039 Total investment management revenue 13,426 8,566 29,083 18,668 Investment management data: Total properties acquired 2 5 5 8 Total aggregate purchase price 41,125 46,750 77,504 77,620 Total properties disposed 2 4 5 6 Total aggregate sales value at disposition 77,500 75,652 92,134 154,802 Total square feet under management 46,879 39,135 46,879 39,135 Assets under management (2) 6,851,884 5,546,551 6,851,884 5,546,551 Equity raise: Non-traded real estate investment trust (3) 208,686 38,693 406,521 68,605 Tenant-in-common 2,175 - 12,491 877 Other 42 - 2,002 - Total equity raise $ 210,903 $ 38,693 $ 421,014 $ 69,482 (1) Acquisition and loan fees for the three and six month periods ended June 30, 2010 includes acquisition fees with respect to properties purchased by Healthcare Trust of America (formerly known as Grubb & Ellis Healthcare REIT). (1) Acquisition and loan fees for the three and six month periods ended June 30, 2010 includes acquisition fees with respect to properties purchased by Healthcare Trust of America (formerly known as Grubb & Ellis Healthcare REIT). (1) Acquisition and loan fees for the three and six month periods ended June 30, 2010 includes acquisition fees with respect to properties purchased by Healthcare Trust of America (formerly known as Grubb & Ellis Healthcare REIT). (1) Acquisition and loan fees for the three and six month periods ended June 30, 2010 includes acquisition fees with respect to properties purchased by Healthcare Trust of America (formerly known as Grubb & Ellis Healthcare REIT). (1) Acquisition and loan fees for the three and six month periods ended June 30, 2010 includes acquisition fees with respect to properties purchased by Healthcare Trust of America (formerly known as Grubb & Ellis Healthcare REIT). (1) Acquisition and loan fees for the three and six month periods ended June 30, 2010 includes acquisition fees with respect to properties purchased by Healthcare Trust of America (formerly known as Grubb & Ellis Healthcare REIT). (1) Acquisition and loan fees for the three and six month periods ended June 30, 2010 includes acquisition fees with respect to properties purchased by Healthcare Trust of America (formerly known as Grubb & Ellis Healthcare REIT). (1) Acquisition and loan fees for the three and six month periods ended June 30, 2010 includes acquisition fees with respect to properties purchased by Healthcare Trust of America (formerly known as Grubb & Ellis Healthcare REIT). (2) The value of assets under management is based on the original acquisition price of such assets. The decrease reflects the separation of Healthcare Trust of America in September 2009. (2) The value of assets under management is based on the original acquisition price of such assets. The decrease reflects the separation of Healthcare Trust of America in September 2009. (2) The value of assets under management is based on the original acquisition price of such assets. The decrease reflects the separation of Healthcare Trust of America in September 2009. (2) The value of assets under management is based on the original acquisition price of such assets. The decrease reflects the separation of Healthcare Trust of America in September 2009. (2) The value of assets under management is based on the original acquisition price of such assets. The decrease reflects the separation of Healthcare Trust of America in September 2009. (2) The value of assets under management is based on the original acquisition price of such assets. The decrease reflects the separation of Healthcare Trust of America in September 2009. (2) The value of assets under management is based on the original acquisition price of such assets. The decrease reflects the separation of Healthcare Trust of America in September 2009. (2) The value of assets under management is based on the original acquisition price of such assets. The decrease reflects the separation of Healthcare Trust of America in September 2009. (3) Excludes capital raised through the dividend reinvestment program. (3) Excludes capital raised through the dividend reinvestment program. (3) Excludes capital raised through the dividend reinvestment program. (3) Excludes capital raised through the dividend reinvestment program. (in thousands except for properties acquired/disposed) (unaudited) |
