Attached files
| file | filename |
|---|---|
| 8-K - MID AMERICA APARTMENT COMMUNITIES INC. | v187567_8-k.htm |
NAREIT
Investor Forum June 2010 MAA Mid-America Apartment Communities
Successful
Public Company Platform MAA Sixteen Year Record of Success Top Tier Performance
for Shareholders Strong Operator; Sophisticated Platform S&P Small-Cap 600
Strong Corporate Governance Disciplined Capital Deployment Value Investor
Extensive Network & Deal Flow Proven Success with Joint Ventures Full Cycle
Performance Profile High Quality Multifamily Portfolio High Growth Sunbelt
Region Focus Young Portfolio Unique Two-Tier Market Strategy Strong Balance
Sheet Capacity to Pursue Opportunities Superior Ratios Dividend Payout Leverage
Fixed Charge 2
Focus on High
Growth Region MAA Pro-Business Environment Greater Access to Labor and Land
Strong Distribution And Logistics Structure Positive Demographic Flow Lower Cost
of Living Expanding Import/Export Activities Lower Taxes Higher Job Growth and
Household Formation Trends Port cities likely to benefit Household formation
trends in MAA markets exceed national outlook 3
Value
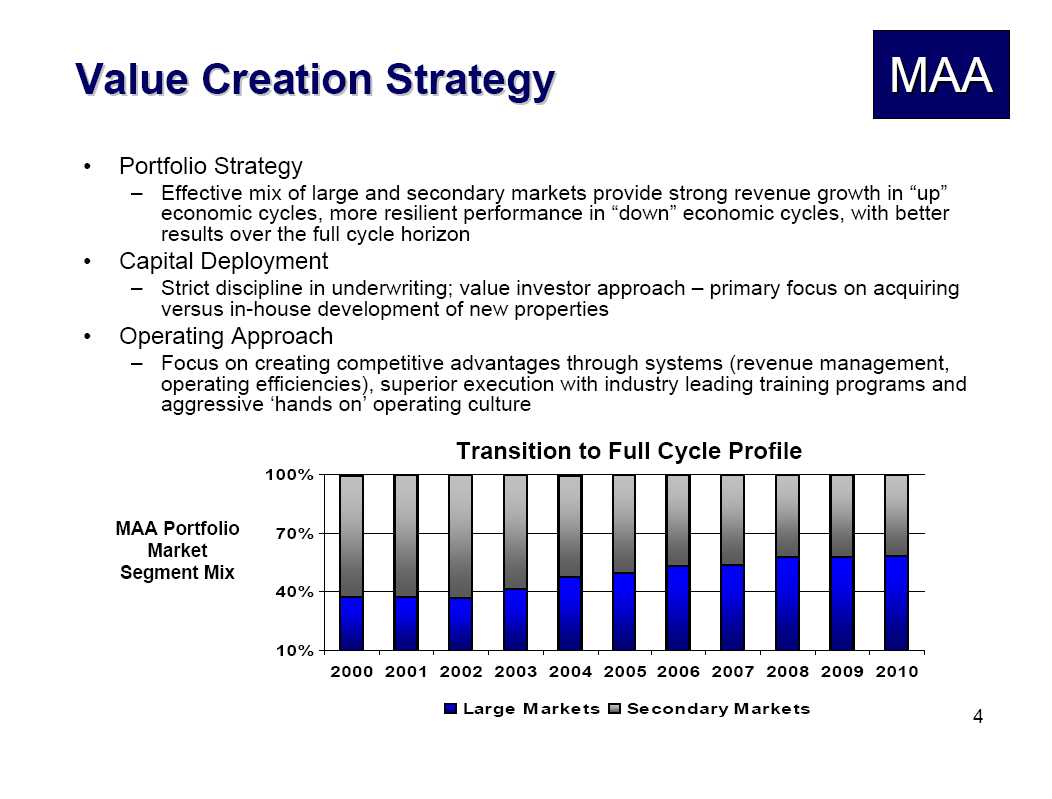
Creation Strategy MAA Portfolio Strategy Effective mix of large and secondary
markets provide strong revenue growth in up economic cycles, more resilient
performance in down economic cycles, with better results over the full cycle
horizon Capital Deployment Strict discipline in underwriting; value investor
approach primary focus on acquiring versus in-house development of new
properties Operating Approach Focus on creating competitive advantages through
systems (revenue management, operating efficiencies), superior execution with
industry leading training programs and aggressive hands on operating culture
Transition to Full Cycle Profile MAA Portfolio Market Segment Mix Large Markets
Secondary Markets 4
Strong
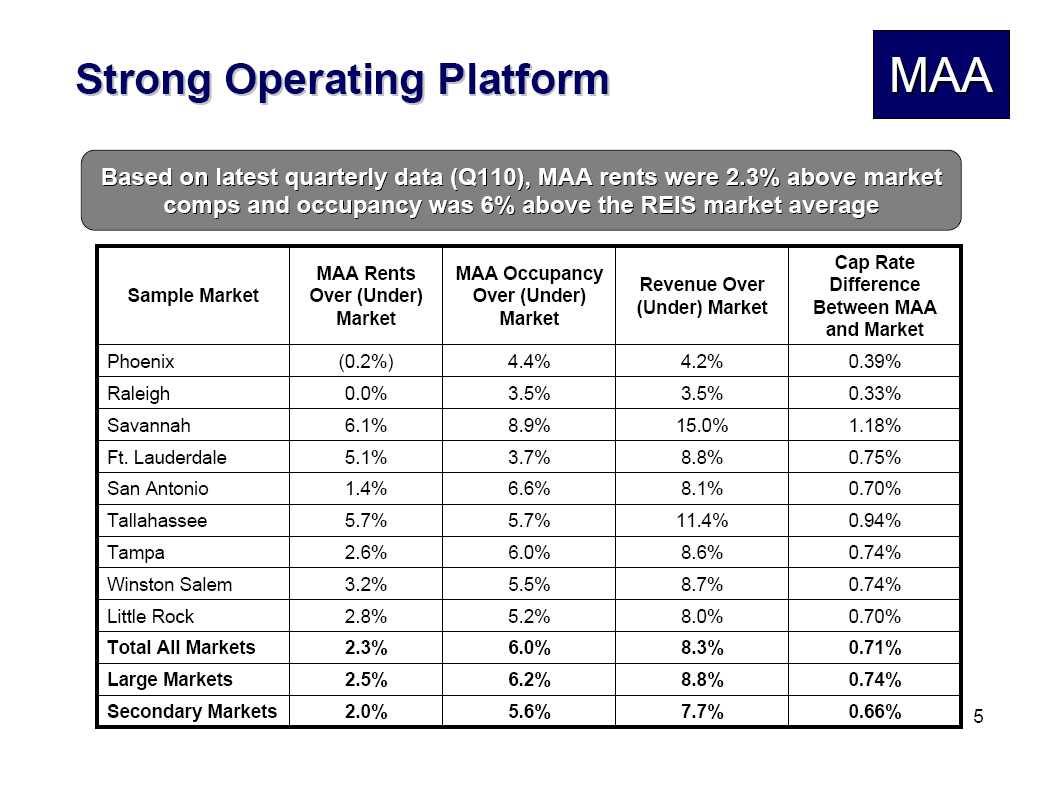
Operating Platform MMA Based on latest quarterly data (Q110), MAA rents were
2.3% above market comps and occupancy was 6% above the REIS market average
Sample Market MAA Rents Over (Under) Market MAA Occupancy Over (Under) Market
Revenue Over (Under) Market Cap Rate Difference Between MAA and Market Phoenix
(0.2%) 4.4% 4.2% 0.39% Raleigh 0.0% 3.5% 3.5% 0.33% Savannah 6.1% 8.9% 15.0%
1.18% Ft. Lauderdale 5.1% 3.7% 8.8% 0.75% San Antonio 1.4% 6.6% 8.1% 0.70%
Tallahassee 5.7% 5.7% 11.4% 0.94% Tampa 2.6% 6.0% 8.6% 0.74% Winston Salem 3.2%
5.5% 8.7% 0.74% Little Rock 2.8% 5.2% 8.0% 0.70% Total All Markets 2.3% 6.0%
8.3% 0.71% Large Markets 2.5% 6.2% 8.8% 0.74% Secondary Markets 2.0% 5.6% 7.7%
0.66% 5
Strong
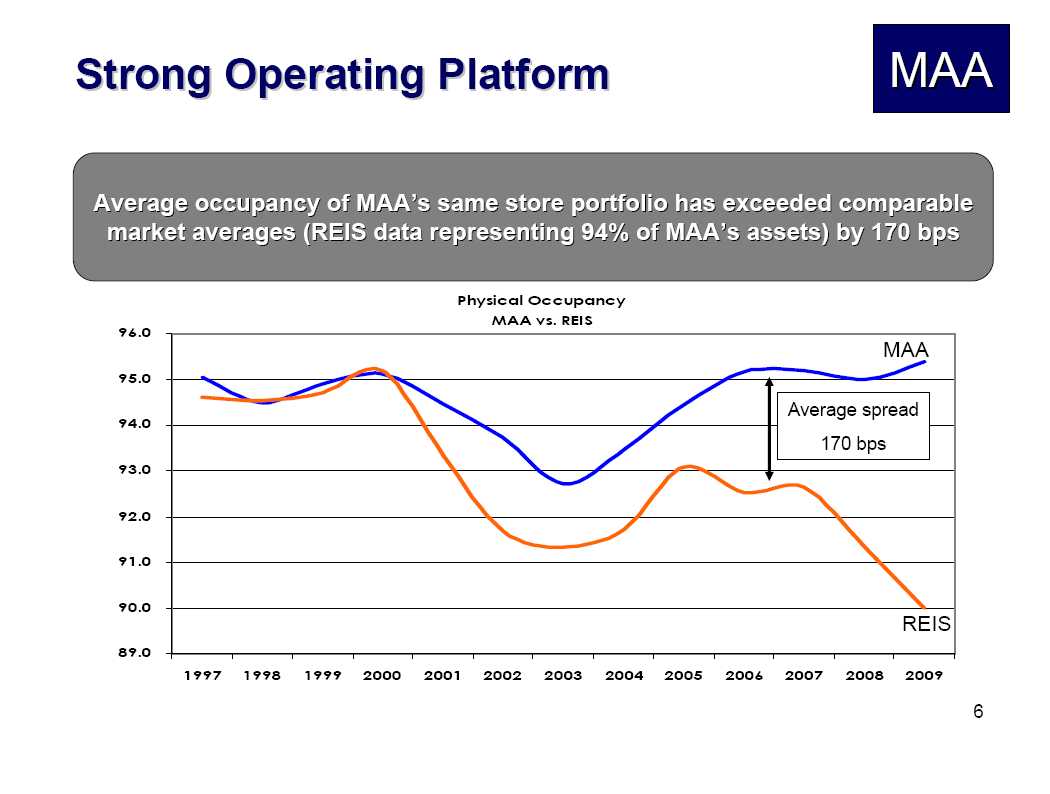
Operating Platform MAA Average occupancy of MAAs same store portfolio has
exceeded comparable market averages (REIS data representing 94% of MAAs assets)
by 170 bps Physical Occupancy MAA vs. REIS Average spread 170 bps 6
Out
Performing Sector Over Full Cycle MAA Better full cycle performance, with lower
volatility, drives stronger and more consistent long-term performance
Repositioned portfolio and strengthened platform = stronger up cycle performance
profile 2000-2010E NOI Std Dev MAA 1.0% 3.7% Sector 0.8% 5.3% Same Store NOI
Growth 2004-2010E NOIStd Dev MAA 2.0% 3.8% Sector 1.4% 4.9% Source: Green Street
May 10 Residential REIT Update Sector Average MAA 7
Recovery
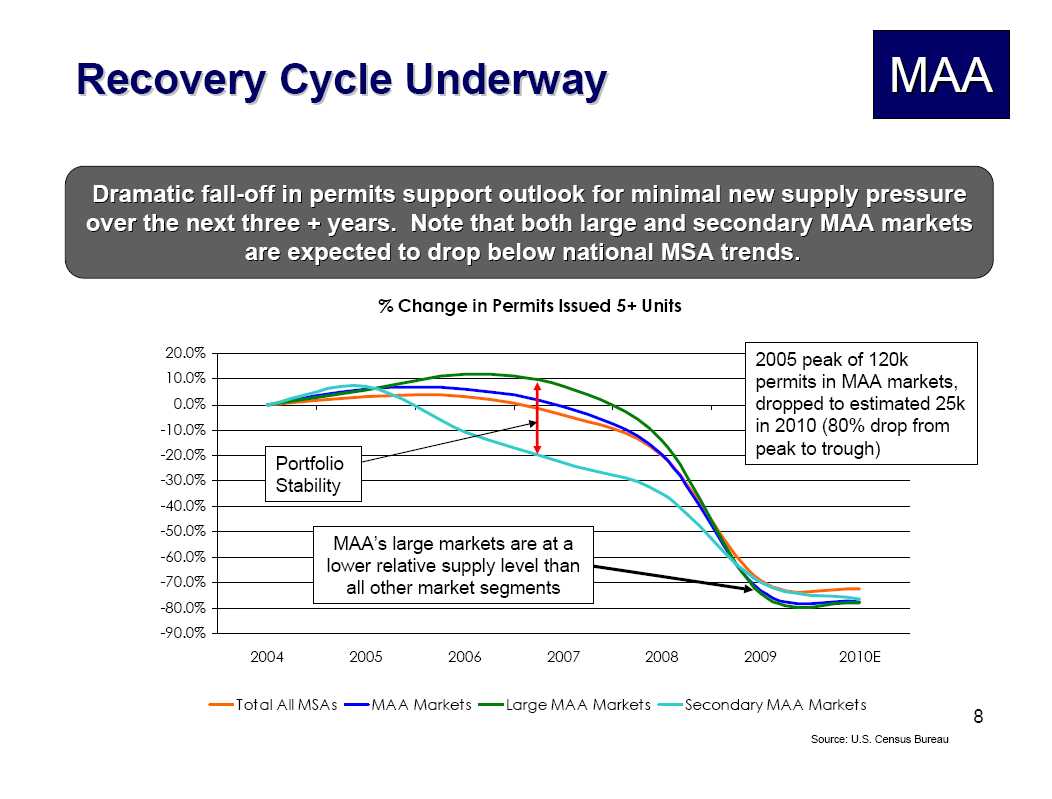
Cycle Underway MAA Dramatic fall-off in permits support outlook for minimal new
supply pressure over the next three + years. Note that both large and secondary
MAA markets are expected to drop below national MSA trends. % Change in Permits
Issued 5+ Units Totall All MSAs MAA Markets Large MAA Markets Secondary MAA
Markets Source: 2005 peak of 120k permits in MAA markets, dropped to estimated
25k in 2010 (80% drop from peak to trough) U.S. Census Bureau 8
Recovery
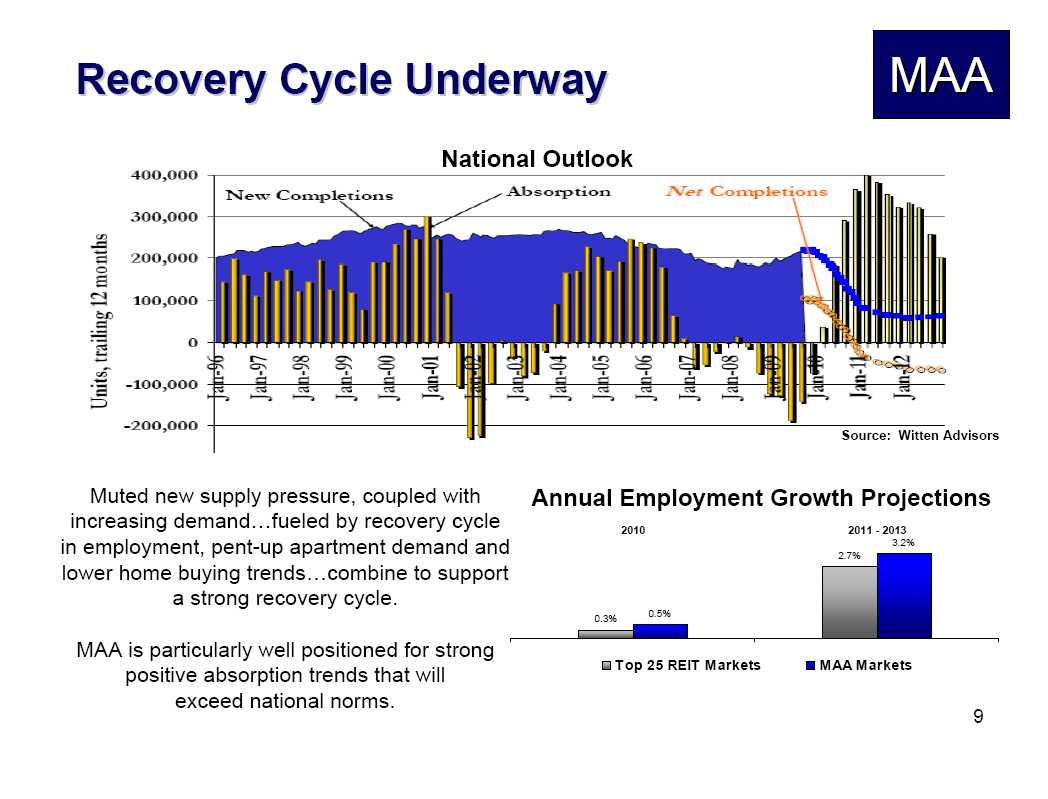
Cycle Underway MAA National Outlook Muted new supply pressure, coupled with
increasing demandfueled by recovery cycle in employment, pent-up apartment
demand and lower home buying trendscombine to support a strong recovery cycle.
MAA is particularly well positioned for strong positive absorption trends that
will exceed national norms. Annual Employment Growth Projections Top 25 Reit
Markets MAA Markets 9
New Value
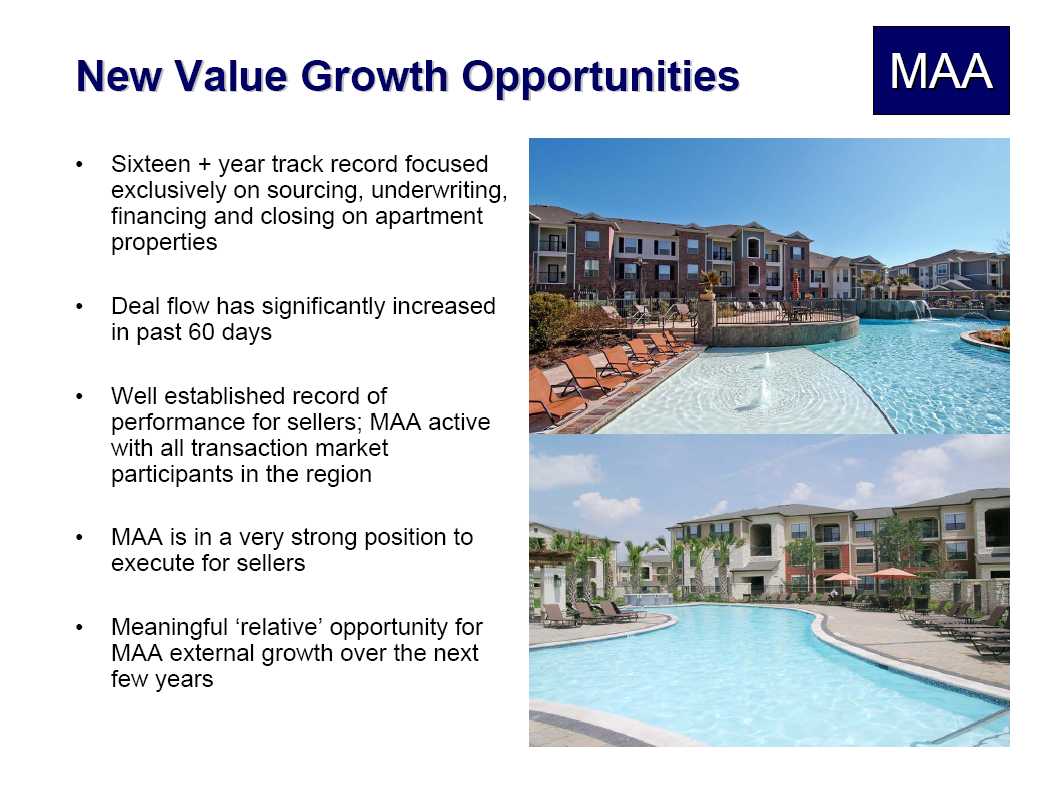
Growth Opportunities MAA Sixteen + year track record focused exclusively on
sourcing, underwriting, financing and closing on apartment properties Deal flow
has significantly increased in past 60 days Well established record of
performance for sellers; MAA active with all transaction market participants in
the region MAA is in a very strong position to execute for sellers Meaningful
relative opportunity for MAA external growth over the next few years 10
Platform
Value & Cap Rate Impact MAA Using the Q1 data discussed in slide 5, on a
typical acquisition MAA would generate additional NOI of $300-$400k per year
above market level performance At this average above market performance level,
income generated on MAA managed properties should imply a cap rate that is 71bps
lower than the market average (based on the NPV of MAA above market performance
at a 9% discount rate) Marginal NOI created by MAA, representing a cap rate
differential of 71bps Market NOI on a typical $25MM acquisition purchased at a
6% cap rate 11
Attractive
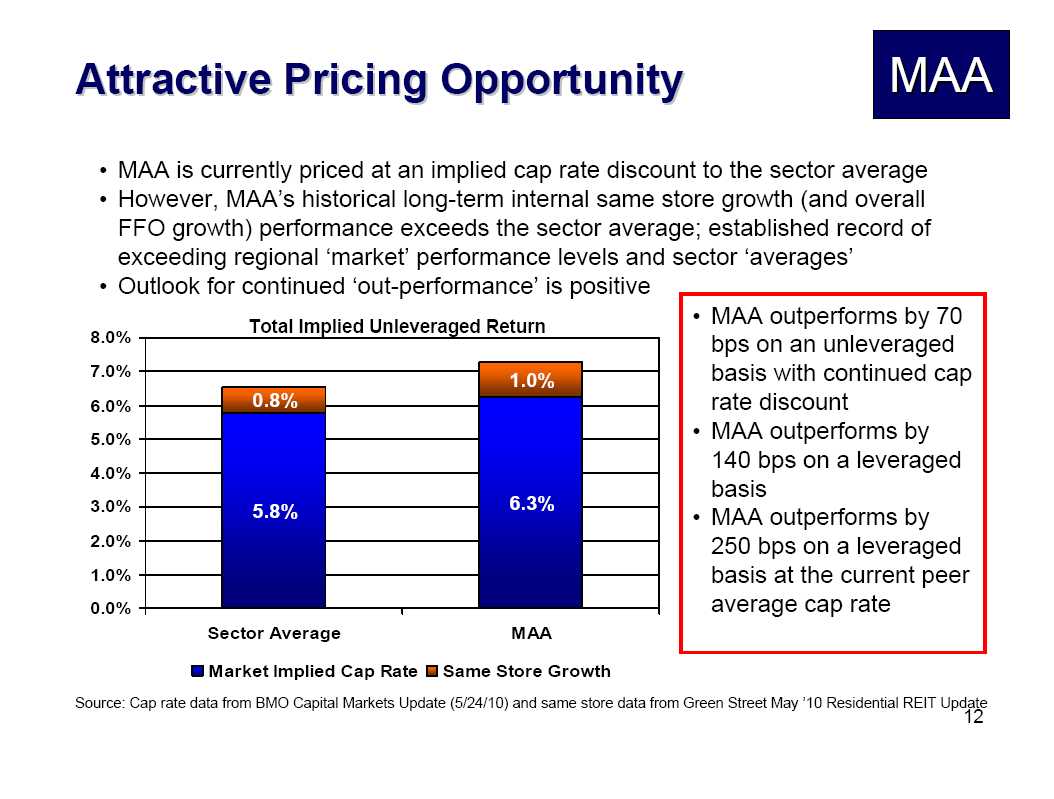
Pricing Opportunity MAA MAA is currently priced at an implied cap rate discount
to the sector average However, MAAs historical long-term internal same store
growth (and overall FFO growth) performance exceeds the sector average;
established record of exceeding regional market performance levels and sector
averages Outlook for continued out-performance is positive Total Implied
Unleveraged Return 0.8% 5.8% 1.0% 6.3% Sector Average MAA Market Implied Cap
Rate Same Store Growth MAA outperforms by 70 bps on an unleveraged basis with
continued cap rate discount MAA outperforms by 140 bps on a leveraged basis MAA
outperforms by 250 bps on a leveraged basis at the current peer average cap rate
Source: Cap rate data from BMO Capital Markets Update (5/24/10) and same store
data from Green Street May 10 Residential REIT Update 12
Cap Rate
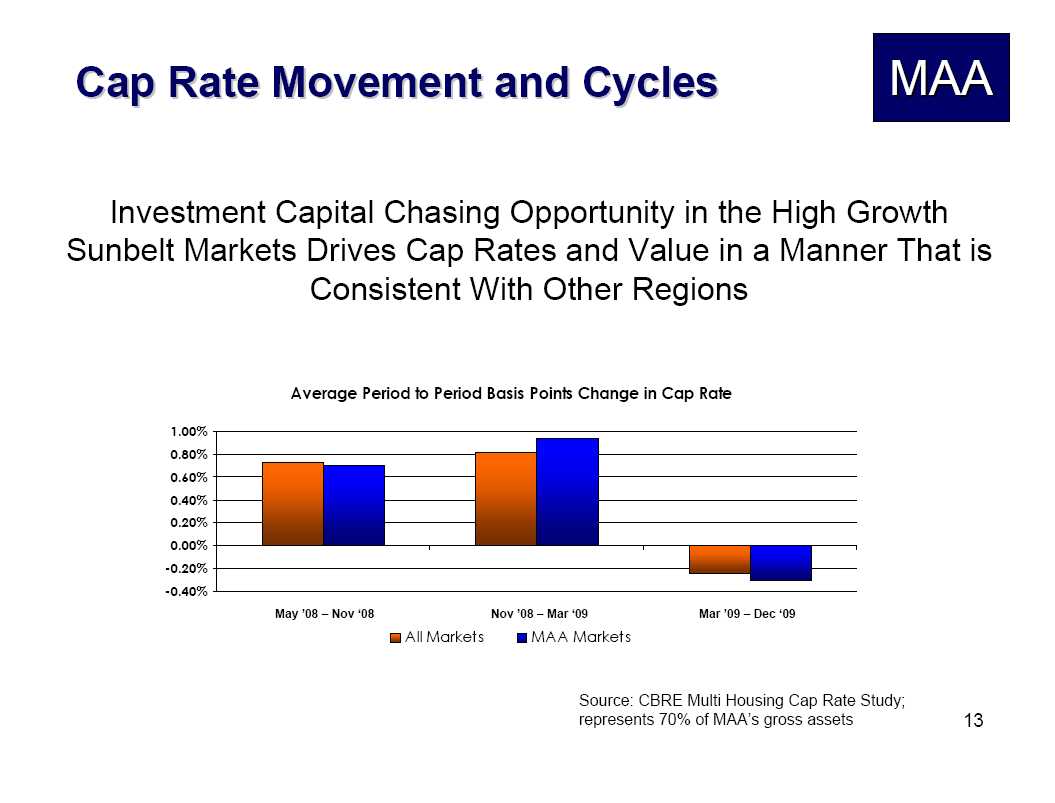
Movement and Cycles MAA Investment Capital Chasing Opportunity in the High
Growth Sunbelt Markets Drives Cap Rates and Value in a Manner That is Consistent
With Other Regions Average Period to Period Basis Points Change in Cap Rate All
Markets MAA Markets Source: CBRE Multi Housing Cap Rate Study; represents 70% of
MAAs gross assets 13
Attractive
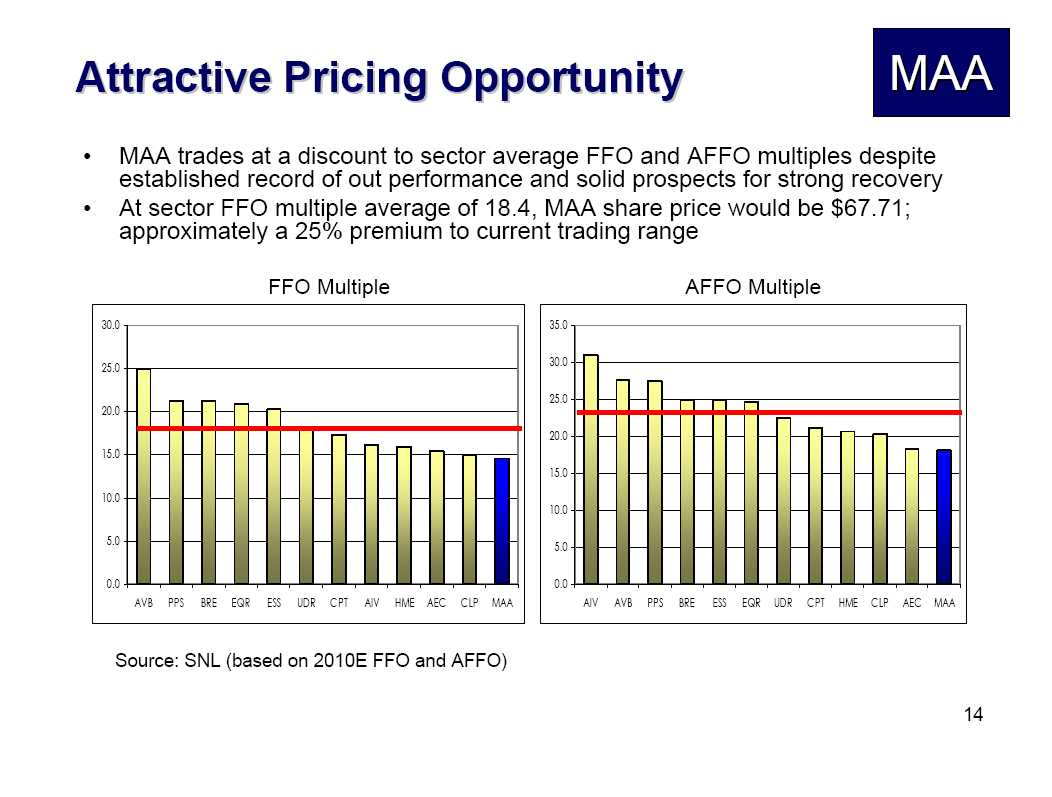
Pricing Opportunity MAA MAA trades at a discount to sector average FFO and AFFO
multiples despite established record of out performance and solid prospects for
strong recovery At sector FFO multiple average of 18.4, MAA share price would be
$67.71; approximately a 25% premium to current trading range FFO Multiple AFFO
Multiple Source: SNL (based on 2010E FFO and AFFO) Source: SNL (based on 2010E
FFO and AFFO) AVB PPS BRE EQR ESS UDR CPT AIV HME AEC CLP MAA AVB PPS BRE EQR
ESS UDR CPT AIV HME AEC CLP MAA 14
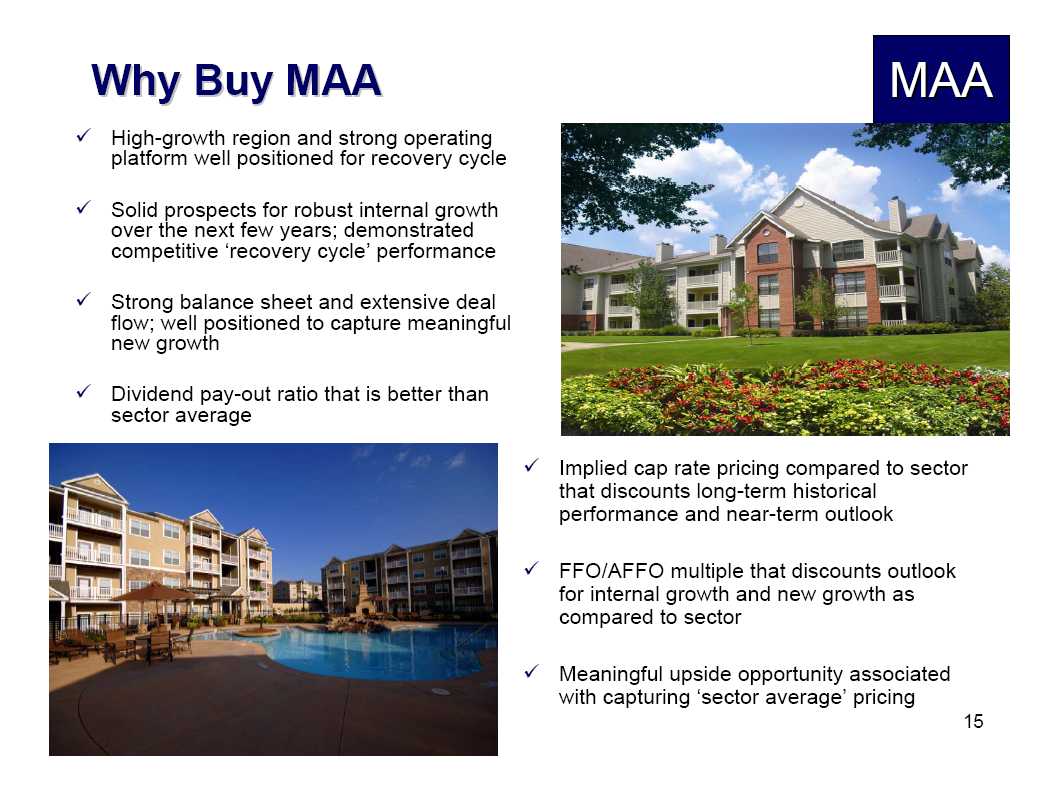
Why Buy MAA
MAA High-growth region and strong operating platform well positioned for
recovery cycle Solid prospects for robust internal growth over the next few
years; demonstrated competitive recovery cycle performance Strong balance sheet
and extensive deal flow; well positioned to capture meaningful new growth
Dividend pay-out ratio that is better than sector average Implied cap rate
pricing compared to sector that discounts long-term historical performance and
near-term outlook FFO/AFFO multiple that discounts outlook for internal growth
and new growth as compared to sector Meaningful upside opportunity associated
with capturing sector average pricing 15
End of
Presentation MAA Mid-America Apartment Communities

