Attached files
| file | filename |
|---|---|
| 8-K - FORM 8-K - Cheniere Energy Partners, L.P. | form_8-k.htm |

Proposed Sabine Pass LNG Facility Expansion -
Adding Liquefaction Capabilities
Adding Liquefaction Capabilities
June 4, 2010
Cheniere Energy Partners / Cheniere Energy, Inc.

Forward Looking Statements
1
This presentation contains certain statements that are, or may be deemed to be, “forward-looking statements” within the meaning of Section 27A of
the Securities Act and Section 21E of the Securities Exchange Act of 1933, as amended. All statements, other than statements of historical facts,
included herein are “forward-looking statements.” Included among “forward-looking statements” are, among other things:
the Securities Act and Section 21E of the Securities Exchange Act of 1933, as amended. All statements, other than statements of historical facts,
included herein are “forward-looking statements.” Included among “forward-looking statements” are, among other things:
§ statements that we expect to commence or complete construction of a liquefaction facility by certain dates, or at all;
§ statements that we expect to receive authorization from the Federal Energy Regulatory Commission, or FERC, or the Department of Energy, or
DOE to construct and operate a proposed liquefaction facility by a certain date, or at all;
DOE to construct and operate a proposed liquefaction facility by a certain date, or at all;
§ statements regarding future levels of domestic or foreign natural gas production and consumption, or the future level of LNG imports into North
America or exports from the U.S., or regarding projected future capacity of liquefaction or regasification facilities worldwide;
America or exports from the U.S., or regarding projected future capacity of liquefaction or regasification facilities worldwide;
§ statements regarding any financing transactions or arrangements, whether on the part of Cheniere or at the project level;
§ statements regarding any commercial arrangements marketed or potential arrangements to be performed in the future, including any cash
distributions and revenues anticipated to be received;
distributions and revenues anticipated to be received;
§ statements regarding the commercial terms and potential revenues from activities described in this presentation;
§ statements that our proposed liquefaction facility, when completed, will have certain characteristics, including a number of trains;
§ statements regarding our business strategy, our business plan or any other plans, forecasts, examples, models, forecasts or objectives: any or all of
which are subject to change;
which are subject to change;
§ statements regarding estimated corporate overhead expenses; and
§ any other statements that relate to non-historical information.
These forward-looking statements are often identified by the use of terms and phrases such as “achieve,” “anticipate,” “believe,” “estimate,” “example,”
“expect,” “forecast,” “opportunities,” “plan,” “potential,” “project,” “propose,” “subject to,” and similar terms and phrases. Although we believe that the
expectations reflected in these forward-looking statements are reasonable, they do involve assumptions, risks and uncertainties, and these
expectations may prove to be incorrect. You should not place undue reliance on these forward-looking statements, which speak only as of the date of
this presentation. Our actual results could differ materially from those anticipated in these forward-looking statements as a result of a variety of
factors, including those discussed in “Risk Factors” in the Cheniere Energy, Inc. and Cheniere Energy Partners, L.P. Annual Reports on Form 10-K for
the year ended December 31, 2009, which are incorporated by reference into this presentation. All forward-looking statements attributable to us or
persons acting on our behalf are expressly qualified in their entirety by these ”Risk Factors”. These forward-looking statements are made as of the
date of this presentation, and we undertake no obligation to publicly update or revise any forward-looking statements.

Sabine Pass to become bi-directional import/export facility
Expanding Operations - Adding Liquefaction
Compelling Proposition
Compelling Proposition
§ Market fundamentals create opportunity to expand into exports
§ Export services provide customers with an attractively priced
option to access U.S. natural gas supply
option to access U.S. natural gas supply
§ Sabine Pass facility location is strategically situated
– Many existing assets in place needed for an export terminal
reduces capital required, cost estimates comparable to liquefaction
expansion economics
reduces capital required, cost estimates comparable to liquefaction
expansion economics
– Abundance of supply and existing infrastructure in surrounding
regions, proximity to Henry Hub
regions, proximity to Henry Hub
§ Powerful tool for industry players to manage their portfolios
– Early indications of interest from both buyers and sellers of natural
gas and LNG
gas and LNG

Market Fundamentals Drive Liquefaction Project
§ The U.S. has become the largest producer of natural gas in the
world and production costs rank among the lowest
world and production costs rank among the lowest
– Productive capacity at $6.50/MMBtu could reach 95 Bcf/d by 2020
§ U.S. natural gas demand not likely to keep pace with incremental
supply as demand continues to lag market forecasts, threatening to
lead to price volatility
supply as demand continues to lag market forecasts, threatening to
lead to price volatility
§ Globally, a natural gas supply gap is projected to develop in 2014-15
– Key driver is decline of UK Continental Shelf production
– Exacerbates dependency of European consumers on imported gas
– Asian consumers highly dependent on imported LNG for gas supply
§ Simultaneously, global LNG and pipeline gas suppliers continue to
enforce oil-price indexation in new contracts
enforce oil-price indexation in new contracts
– Key markets in Asia and Europe import over 70 Bcf/d of natural gas
– Imports forecast to increase by 26 Bcf/d over the next ten years

Sources: EIA (US map graphic, pipelines and LNG terminals placed by Cheniere)
Advanced Resources Intl (Lower 48 Unconventional Recoverable Reserves), ARI shale estimates updated April 2010
Depicted Pipelines: Rockies Express, Texas Eastern, Trunkline, Transco, FGT, C/P/SESH/Gulf Crossing (as a single route)
Depicted LNG terminals: Freeport, Golden Pass, Sabine Pass, Cameron, Trunkline, Elba Island, Cove Point, Everett
366
Tcf
Tcf
1,167
Tcf
Tcf
US Proved
Reserves
Reserves
U.S. Unconventional Reserves
Basins Proximate to Premium Markets and Major Pipelines
Basins Proximate to Premium Markets and Major Pipelines
3
Project Estimates:
§ Initial Phase: 1 Bcf/d (two modular trains)
§ Second Phase: Additional 1 Bcf/d
§ Estimated capex similar to expansion
economics
economics
§ Commercial start date: 2015e
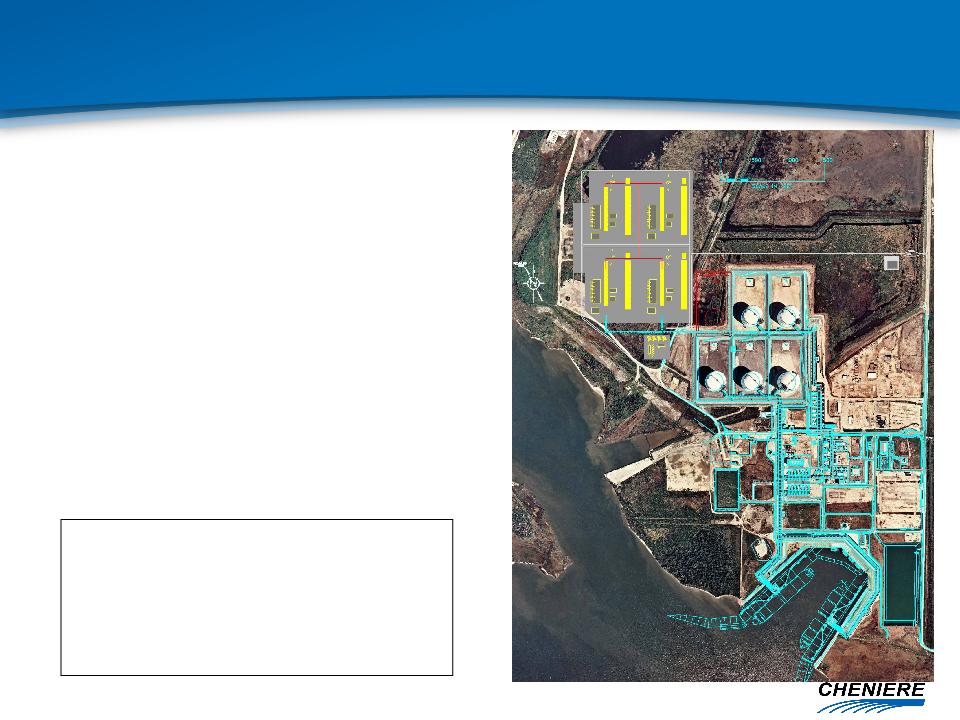
Sabine Pass LNG
Proposed Liquefaction Project - Overview
Proposed Liquefaction Project - Overview
§ Leveraging existing assets
– Large acreage position (853 acres)
• Can readily accommodate 4 liquefaction trains
(up to 2 Bcf/d capacity)
(up to 2 Bcf/d capacity)
– Existing infrastructure
• 2 docks, 4 dedicated tugs
• LNG storage tanks (5 x 160,000 cm)
• Power generation
• Pipeline connections (Creole Trail)
§ Gas sourced from pipeline grid - Henry
Hub indexed pricing
Hub indexed pricing
§ “Demand Pull” model
– Global supply gap
– Diversity of supply
– Flexible processing
– Henry Hub indexation
450
400
350
300
250
200
150
100
50
0
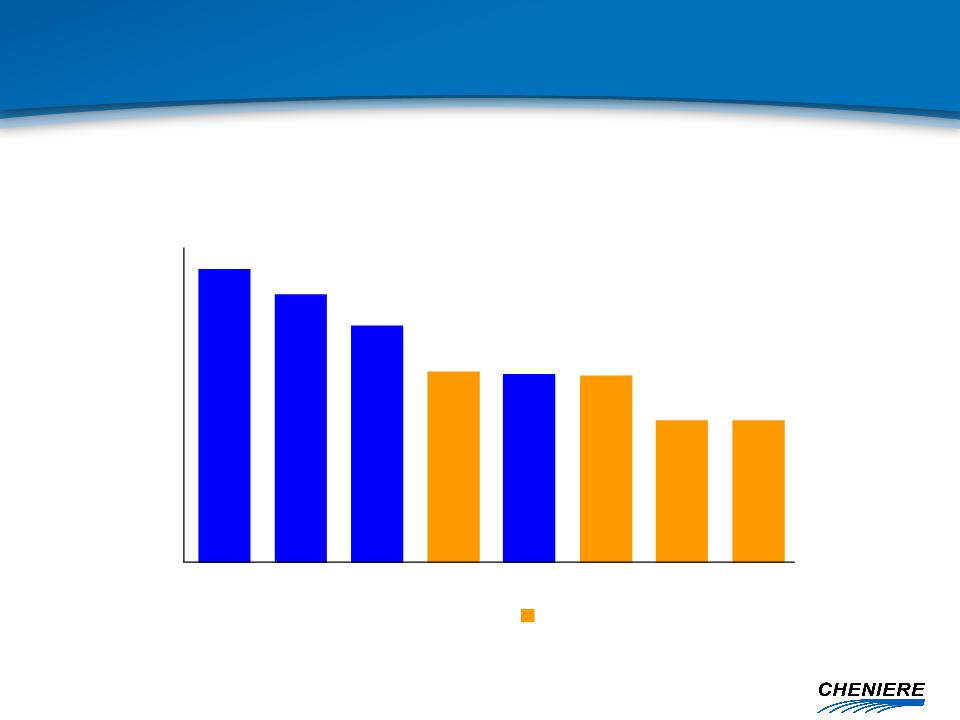
Cost
Qatargas Nigeria RasGas ELNGT1 Oman ALNGT1 ALNGT1-3 ELNGT1-2
ConocoPhillips-Bechtel - Global Liquefaction Collaboration
Source: ConocoPhillips-Bechtel
ConocoPhillips-Bechtel trains
$/Ton per Annum
Low Cost Liquefaction Facilities
Proven Technology
Proven Technology

Capacity fee includes regasification and liquefaction services -
provides customer option to import or export
Estimated cost to purchase U.S. supply:
Commercial Structure
Estimated Terms for LNG Sales Agreements
Estimated Terms for LNG Sales Agreements
Ê Capacity Fee: $1.40/MMBtu to $1.75/MMBtu
§ “Take or Pay”, permits lifting or unloading cargoes
§ Includes all facilities and Creole Trail Pipeline
Ê LNG Export Commodity Charge: $HH./MMBtu
§ Delivery Terms: FOB
§ Prevailing price for eastbound flow in local pipelines
§ Paid on a per-MMBtu basis, per cargo loaded
Ê Fuel Surcharge: 8%-12%
§ Projected based on forecast export activity
§ Trued up from period to period
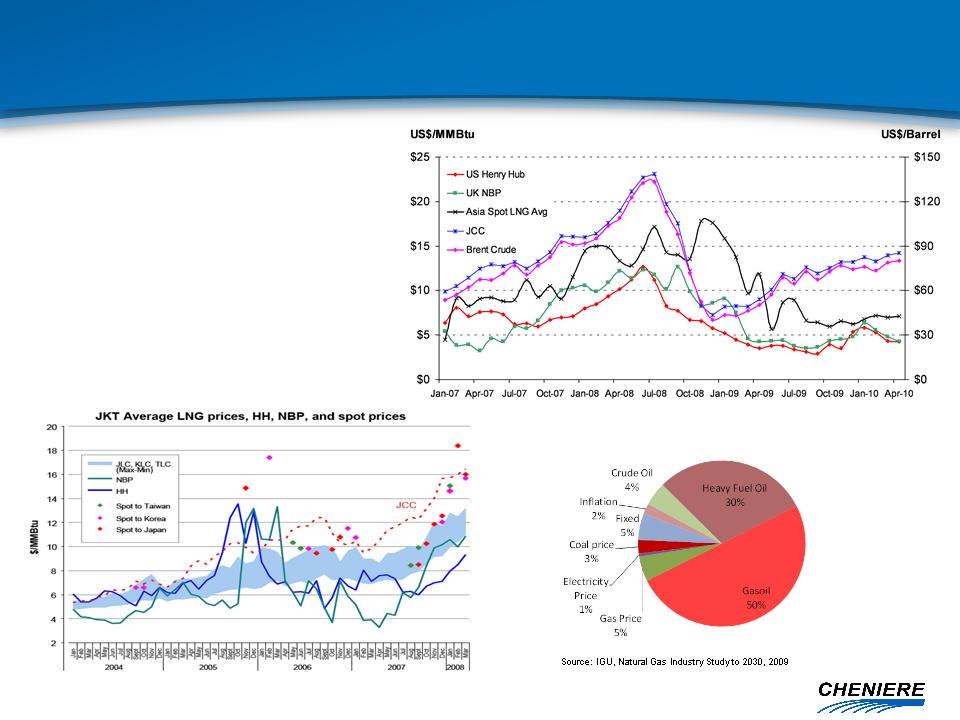
Western Europe Gas Price Indexation
§ Asian and European natural gas supplies
are predominantly priced against oil indices
are predominantly priced against oil indices
– Europe dominated by oil-indexed pricing with an
emerging but small portion tied to spot pricing
emerging but small portion tied to spot pricing
– With decreasing supplies, market prices
expected to align with oil prices, especially in
winter
expected to align with oil prices, especially in
winter
§ Abundant supply of LNG at Henry Hub-
based prices could create a market
advantage
based prices could create a market
advantage
Source: PIRA Energy Group, Petroleum Association of Japan
Source: PIRA Energy Group, Petroleum Association of Japan
LNG Supply
Oil Linkage Threatened with Large Oil-Gas Ratios
Oil Linkage Threatened with Large Oil-Gas Ratios
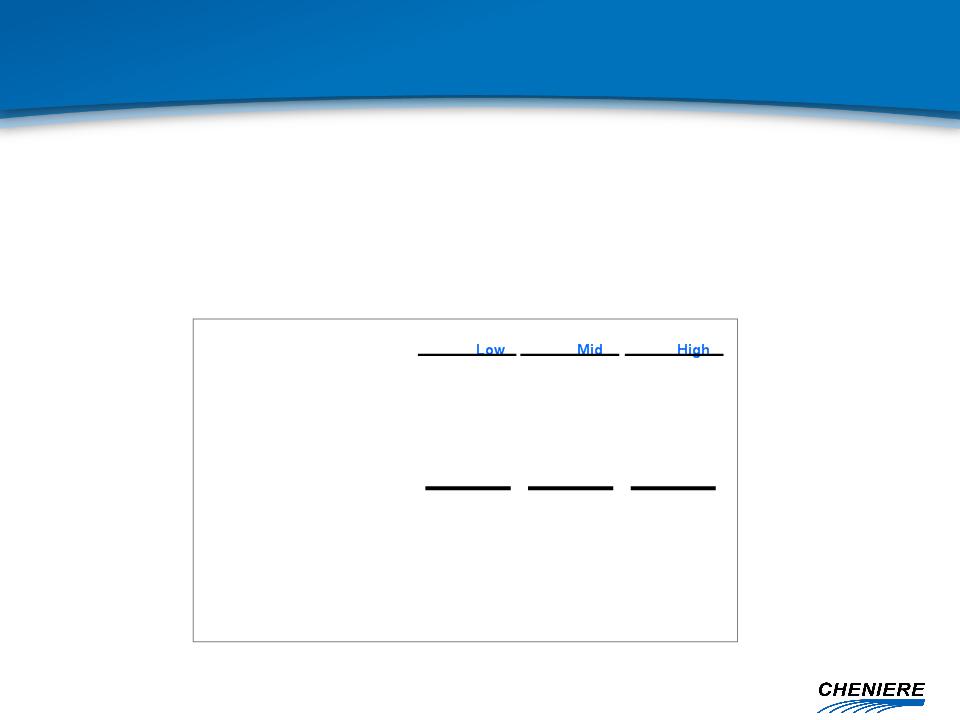
Source: Cheniere
Henry Hub Price
4.50
$
6.50
$
8.50
$
Terminal Fuel
0.45
0.65
0.85
Liquefaction Charge
1.50
1.50
1.50
Shipping Cost
1.00
1.00
1.00
Delivery Charges
2.95
$
3.15
$
3.35
$
DES Price (Europe)
7.45
$
9.65
$
11.85
$
Brent Crude @ 12.5%
59.60
$
77.20
$
94.80
$
$/MMBtu
Brent Crude @ 15%
49.67
64.33
79.00
$
$
$
Delivered Costs Compare Favorably
to European Price Estimates
to European Price Estimates
§ Assuming continued increase in U.S. natural gas production, unconventional
gas economics effectively cap Henry Hub at mid-range of $6.50/MMBtu
gas economics effectively cap Henry Hub at mid-range of $6.50/MMBtu
§ If oil remains above $65/Bbl, Sabine Pass LNG is cheaper than oil-indexed
pipeline gas in Europe on the margin, while forecast prices above $77/Bbl justify
it on an all-in basis
pipeline gas in Europe on the margin, while forecast prices above $77/Bbl justify
it on an all-in basis

Strong support from local and state agencies
Regulatory Process
§ Dual regulatory tracks with the DOE and FERC
– DOE regulates imports and exports of natural gas
– FERC coordinates federal and state review of proposals
to build LNG terminals
to build LNG terminals
§ Key regulatory and legislative issues
– NEPA empowers FERC as the lead Federal agency for
preparation of an Environmental Impact Statement
preparation of an Environmental Impact Statement
– Other Federal and State agency involvement on issues
§ Typical Approvals Timeline - ~18-21 months
– NEPA pre-filing to be initiated by the end of June 2010
Key Relationships
§ Preliminary favorable indications of market interest
– LNG and natural gas buyers
– LNG and natural gas sellers / producers
– Contractors

Public Unit holders
9.4% LP Interest
Cheniere Energy
Investments, LLC
Sabine Pass LNG-GP, Inc.
Sabine Pass LNG-LP, LLC
100% Ownership Interest
100% Ownership Interest
100% Ownership Interest
100% LP Interest
Non-Economic GP Interest
100% Ownership Interest
Cheniere LNG Holdings, LLC
$205 mm 2.25% Convertible Senior Unsecured Notes due 2012
$550 mm 7.25% Senior Secured Notes due 2013
$1,666 mm 7.50% Senior Secured Notes due 2016
88.6% LP Interest
100% of 2% GP Interest
100% of 2% GP Interest
NYSE Amex US: LNG
NYSE Amex US: CQP
3
$298 mm 9.75% Term Loan due 2012
$302 mm 12.0% Convertible Senior Secured Notes due 2018
Note: Balances as of March 31, 2010, term loan
balance is proforma the Freeport sale where
$102MM of proceeds paid down principal.
balance is proforma the Freeport sale where
$102MM of proceeds paid down principal.
Customer Annual TUA Pmt
Total $123MM
Chevron $128MM
CMI $252MM
Sabine Pass LNG, L.P.
Organizational Structure

Q & A