Attached files
| file | filename |
|---|---|
| 8-K - FORM 8-K - SUN HEALTHCARE GROUP INC | d8k.htm |
 1
Exhibit
99.1 |
 2
Statements made in this presentation that are not historical facts are "forward-looking"
statements (as defined in the Private Securities Litigation Reform Act of 1995) that involve
risks and uncertainties and are subject to change at any time. These forward-looking statements
may include, but are not limited to, statements containing words such as "anticipate,"
"believe," "plan," "estimate,” "expect,” "hope,” "intend,”
"may” and similar expressions. Forward-looking statements in this presentation also
include all statements regarding expected financial position, results of operations, cash
flows, liquidity, financing plans, business strategy, growth opportunities, plans and objectives of
management for future operations and the timing and impact of the proposed restructuring
transactions. Factors that could cause actual results to differ are identified in the
public filings made by the company with the Securities and Exchange Commission and include our
ability to consummate the proposed spin-off; our ability to consummate the equity and debt
financings necessary, in connection with the proposed spin-off, to repay Sun’s
existing indebtedness on terms acceptable to Sun or at all; changes in Medicare and Medicaid
reimbursements; our ability to maintain the occupancy rates and payor mix at our healthcare centers;
potential liability for losses not covered by, or in excess of, our insurance; the effects of
government regulations and investigations; the significant amount of our indebtedness,
covenants in our debt agreements that may restrict our activities and our ability to make acquisitions, incur more
indebtedness and refinance indebtedness on favorable terms; the impact of the current economic
downturn on our business and our ability to collect our receivables; increasing labor costs and
the shortage of qualified healthcare personnel; and our ability to receive increases in
reimbursement rates from government payors to cover increased costs. More information on factors that
could affect our business and financial results are included in our public filings made with
the Securities and Exchange Commission, including our Annual Report on Forms 10-K and
Quarterly Reports on Form 10-Q, copies of which are available on Sun’s web site, www.sunh.com.
The forward-looking statements involve known and unknown risks, uncertainties and other factors
that are, in some cases, beyond our control. We caution that any
forward-looking statements made by us are not guarantees of future performance. We disclaim any obligation
to update any such factors or to announce publicly the results of any revisions to any of the
forward-looking statements to reflect future events or developments.
References to “Sun” refer to Sun Healthcare Group, Inc. and its subsidiaries
|
 3
References are made in this presentation to EBITDA, EBITDA margin, EBITDAR, EBITDAR margin and FFO,
which are non-GAAP financial measures. These non-GAAP financial measures are
reconciled to the corresponding GAAP financial measures in the Appendices included at the end
of this presentation. EBITDA is defined as net income before loss (gain) on discontinued operations, interest expense (net
of interest income), income tax expense (benefit) and depreciation and amortization.
EBITDA margin is EBITDA as a percentage of revenue. EBITDAR is EBITDA before center rent
expense and EBITDAR margin is EBITDAR as a percentage of revenue. Sun believes that the presentation of
EBITDA, EBITDA margin and EBITDAR provides useful information regarding Sun’s operational
performance because they enhance the overall understanding of the financial performance and
prospects for the future of Sun’s core business activities, provides consistency in
Sun’s financial reporting and provides a basis for the comparison of results of core business
operations between current, past and future periods. These measures are also some of the
primary indicators Sun uses for planning and forecasting in future periods, including trending
and analyzing the core operating performance of its business from period to period without the effect of GAAP expenses,
revenues and gains that are unrelated to day-to-day performance.
FFO is defined in accordance with the definition used by the National Association of Real Estate
Investments Trusts and is defined as net income, excluding gains (or losses) from sales of
property, plus depreciation and amortization, and after adjustments for unconsolidated
partnerships and joint ventures. FFO is useful to investors in comparing operating and financial results between periods.
This is especially true because FFO excludes real estate depreciation and amortization, and real
estate values fluctuate based on market conditions rather than depreciate ratably on a
straight-line basis over time. In addition, a presentation of FFO also provides a
more meaningful measure of operating results of other real estate investment trusts.
|
 4
In connection with the restructuring transaction described in this presentation, SHG Services, Inc.
(“Operating Company”) has filed with the SEC a Registration Statement on Form S-1
and Sabra Health Care REIT, Inc. has filed with the SEC a Registration Statement on Form
S-4, each containing an identical proxy statement/prospectus. The definitive proxy statement/prospectus will be mailed to Sun
stockholders. In addition, Sun has filed a shelf registration statement on Form S-3
(including a prospectus) relating to shares of common stock of Sun with the SEC, and such
registration statement has been declared effective. This presentation does not constitute an offer to
sell or a solicitation of an offer to buy shares of Sun common stock, nor shall there be any offer,
solicitation or sale of these securities in any state or jurisdiction in which such an offer,
solicitation or sale would be unlawful. The offering of shares of Sun common stock may be
made only by means of a prospectus relating to the proposed offering. Before making any voting or investment decision, Sun stockholders and investors are urged to read
the proxy statement/prospectus, the prospectus in the registration statement on Form S-3,
and other documents filed with the SEC carefully and in their entirety when they become available
because they will contain important about the proposed In addition, investors and stockholders of Sun may obtain free copies of the documents filed with the
SEC by contacting Sun’s investor relations department at (505) 468-2341 (TDD users,
please call (505) 468-4458) or by sending a written request to Investor Relations, Sun
Healthcare Group, Inc. 101 Sun Avenue N.E., Albuquerque, N.M. 87109. Sun and its directors and executive officers and other members of its management and employees may be
deemed to be participants in the solicitation of proxies from the stockholders of Sun in
connection with the transactions described in this release. Information about the
directors and executive officers of Sun and their ownership of shares of Sun common stock are set forth in the Annual Report on
Form 10-K for the year ended December 31, 2009 filed with the SEC on March 5, 2010 and in the
definitive proxy statement relating to Sun’s 2010 Annual Meeting of Stockholders filed
with the SEC on April 30, 2010. These documents can be obtained free of charge from the
sources indicated above. Additional information regarding the interests of these participants will also be included in the definitive
proxy statement/prospectus when it becomes available.
transactions.
Stockholders
will
be
able
to
obtain
these
documents
free
of
charge
at
the
SEC’s
web
site
at
www.sec.gov.
|
 5
Recent Developments /
Restructuring Transactions |
 6
On 05/24/10 Sun Healthcare announced plans to separate into two separate
publicly traded companies
Will own Sun’s operating
subsidiaries
Will continue to service
all of its 205 centers
Will manage and grow
ancillary services
Will own Sun’s current real
estate portfolio
Will lease property to the
Operating Company
Will grow and diversify through
acquisitions and new tenant
relationships
Operations
Operating
Company
REIT
Spin Off
Surviving
Entity
Leases
Real Estate
Sun Healthcare Group
Sabra
Health Care REIT, Inc.
Sun Healthcare Group, Inc.
Unlocks Value of Sun’s Real Estate Assets
Creates Two Companies Well Positioned To Execute Growth Strategies
|
 7
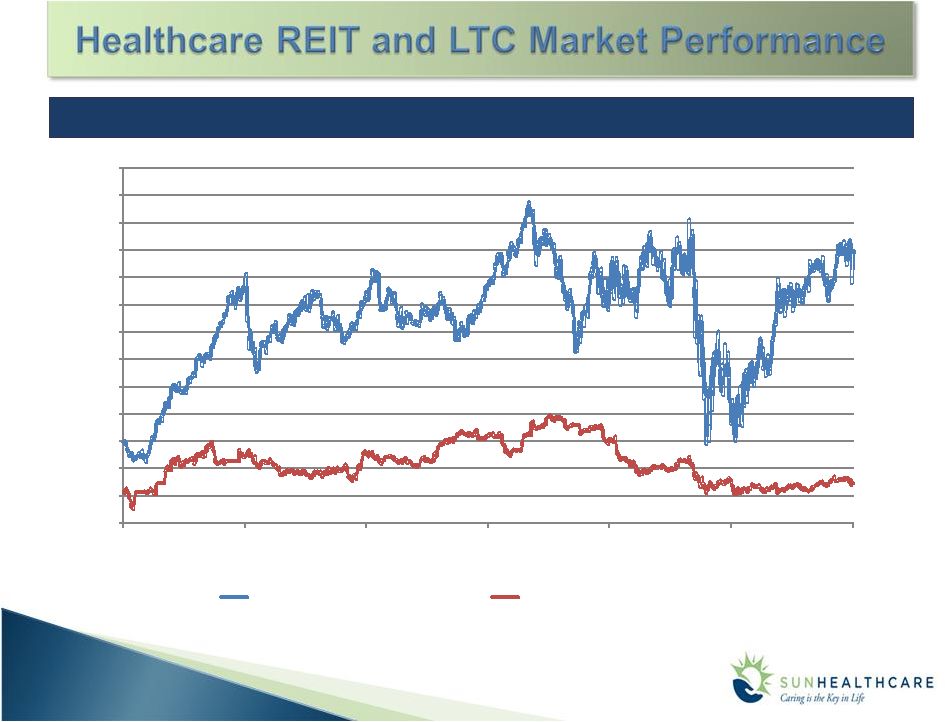
6.5x
15.0x
Source: CapitalIQ
as of 5/16/10
Long Term Care Index: EXE, SKH, ENSG, KND, SUNH, Manor Care, Genesis
HC REIT Index: VTR, NHP, HR, HCP, HCN, LTC, SNH, OHI
Forward
FFO
Multiple
and
Forward
EBITDAR
Multiple
–
2003-2010
YTD
5.0x
6.0x
7.0x
8.0x
9.0x
10.0x
11.0x
12.0x
13.0x
14.0x
15.0x
16.0x
17.0x
18.0x
Jan-03
Mar-04
Jun-05
Sep-06
Nov-07
Feb-09
May-10
HC REIT Index Forward FFO Multiple
LTC Index Forward EBITDAR Multiple |
 8
Operating Company
REIT
Attractive geographic diversity
with national footprint
Proven operating platform
focused on high acuity patients
Product diversification
Stable and reliable cash flows
Strong balance sheet
Considerable growth
opportunities in higher margin
hospice sector
Strong relationships with
various landlords
Strong and predictable long
term cash flow
Attractive dividend yield
Balance sheet with no near-term
maturities
Triple-net, master lease with
high quality operator
Attractive and diversified
geographic footprint
Positioned to build broad-based
healthcare real estate portfolio
New tenant relationships
Continued focused on core
care capabilities
Unlocks value of real estate
portfolio
Will Continue to Deliver
Expected to Deliver |
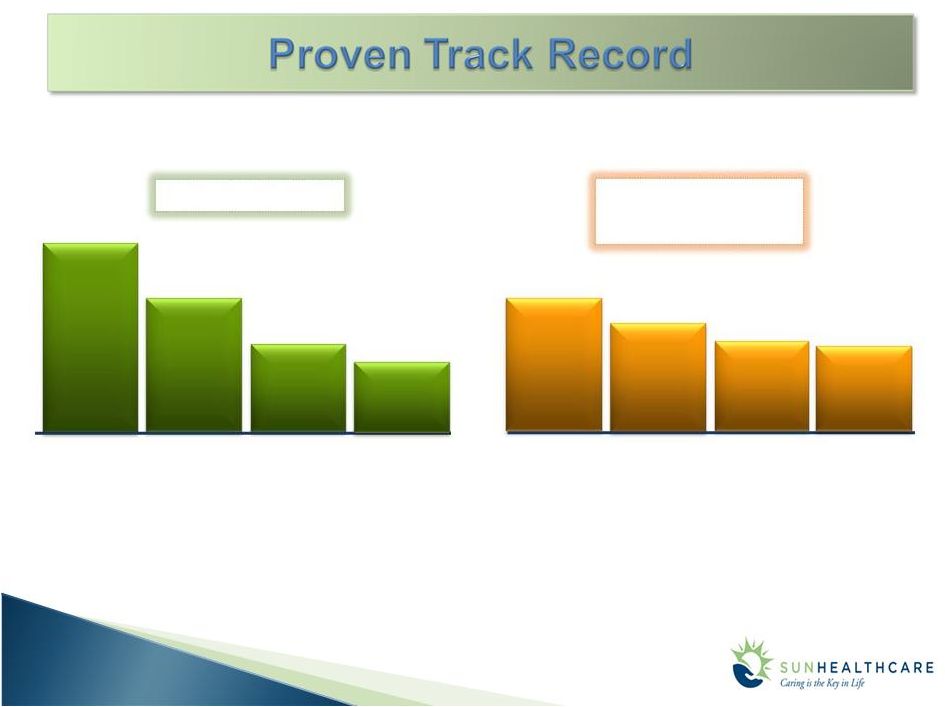
 9
Focused Organization Positioned for Optimal Operating Execution
High Quality Portfolio and Premium Assets
Geographically diversified with strong operating metrics
Proven track record of public company performance
Ability to manage higher acuity patients and drive better margins
Attractive Financial Position
Strong balance sheet and consistent cash flow
Provides flexibility to access the capital markets in the future
Significant Growth Opportunities within the Sector
Well
positioned
to
pursue
acquisition
opportunities
and
leverage
existing
infrastructure
in targeted growth segments
Experienced Management Team
Bill Mathies, CEO and Chairman Designate
No Changes in the rest of the management team |
 10
Establishes Industry Focused REIT Well Positioned to Build a Broad-based
Healthcare Real Estate Portfolio
Healthcare has proven to be a stable asset class vs. other property types
Healthcare
REITs
have
meaningfully
outperformed
the
overall
REIT
universe
and
broader market
Significant Growth Opportunities within the Sector
Large and growing opportunity in current and other healthcare real estate asset
classes Diversify asset base (e.g., ALFs, ILFs, Hospitals, MOBs)
Size provides opportunity to pursue attractive tuck-in acquisitions
Experienced Management Team
Rick Matros, CEO and Chairman Designate
Harold Andrews, CFO Designate
REIT Focused on Diverse Expansion in the Health Care Sector
|
 9,934 Licensed Beds in 21 States
9,586 Available Beds
93 Facilities
11
(82 Skilled, 9 AL/IL, 2 Mental Health) |
 12
May 24
July –
August
October –
November
December
Announce Transaction
Equity Offering (Proceeds Used to Reduce Debt)
Refinance Debt at New Sun and Sabra
Separation |
 13
New Sun Healthcare Group, Inc.
Sabra
Health Care REIT, Inc.
Management
Bill Mathies, CEO and Chairman
Designate
No other management changes
Bill Mathies
President of SunBridge
Healthcare
Corp. since 2002 and COO since
2006 of all operating companies
Executive Vice President of Beverly
Enterprises, Inc. (1995 to 2002) and
President of Inpatient Subsidiary
(1995-2000)
Management
Rick Matros, CEO and Chairman
Designate
Harold Andrews, CFO Designate
Rick Matros
CEO of health care companies for
over 20 years
Sun’s Chairman and CEO since 2001
Transaction Provides Continuity of Sun Healthcare Leadership
|
 14
Transaction Pro Forma
Transaction Pro Forma |
 15
New Sun Healthcare Group, Inc.
Sabra
Health Care REIT, Inc.
Pro Forma
(Dollars in millions)
(1)
Adjusted
for
one-time
expenses
related
to
net
restructuring
costs
and
net
loss
on
sale
of
assets.
(2) Calculated
in
accordance
with
NAREIT’s
definition
of
FFO
except
that
there
are
no
adjustments
for
gains
(or
losses)
from
sales
of
property
or adjustments for unconsolidated partnerships and joint ventures.
2009
Q1 ‘10
Revenue
1,881.8
473.3
EBITDAR
(1)
243.8
61.4
EBITDA
(1)
98.7
24.8
Net Income
36.7
8.8
2009
Q1‘10
Revenue
71.9
18.0
EBITDA
69.5
17.4
Net Income
25.5
6.4
FFO
46.4
11.6
$
$
$
$ |
 16
The
actual
amount
of
the
New
Sun
and/or
New
Sabra
indebtedness
may
be
less
than
the
amount shown above if cash collections from operation s between March 31, 2010 and
the date of the Separation are received in accordance with Sun's
projections. (1) |
 Q1
Financial Performance
17 |
 (dollars in thousands,
except per share data) 2010
2009
Revenue
$473,255
$468,129
Depreciation and amortization
12,446
10,723
Interest expense, net
11,977
12,726
EBITDAR
$ 60,770
$ 61,473
Margin –
EBITDAR
12.8%
13.1%
EBITDA
$ 42,218
$ 43,110
Margin –
EBITDA
8.9%
9.2%
Income from continuing operations
10,499
11,602
Diluted earnings per share -
normalized
$0.24
$0.26
1
st
Quarter Ended March 31
Actual Results
18
Sun 1
st
Quarter 2010 Results |
 19
Interest
Rate
9.1%
4.5%
6.5%
10.0%
6.4%
5.2%
($ in millions)
309.4
Term Loans
$ ---
Revolving Credit Facility –
$50 million
$ 679.6
200.0
479.6
0.7
169.5
$ 102.5
Total Debt
Subordinated Debt
Senior Secured Debt
Capital Leases
Mortgage
Debt
Debt:
Cash
Debt
Debt Table –
March 2010 |
 20
Q4 ‘07
Q4 ‘08
Q4 ‘09
$644
$606
$683
$587
Q1 ‘10
Q4 ‘09
Q4 ‘08
3.9x
3.4x
Q4 ‘07
4.9x
3.3x
Q1 ‘10
Net Debt
Leverage
Net Debt /EBITDA |
 Strong Free Cash Flow
($ in millions)
Cash flow from operations
$38.1
Capital expenditures
(17.1)
Free cash flow
$21.0
FYE 2010
$50 to $55
First Quarter
2010
21 |
 APPENDIX
22 |
 23
NON GAAP RECONCILIATION |
  As
Reported Reconciliation Section 24
(Dollars in millions)
For the Three
For the Three
Months Ended
Months Ended
March 31, 2010
March 31, 2009
Revenue
473.3
$
468.1
$
Income from continuing operations
10.5
11.6
Add:
Income tax expense
7.3
8.1
D&A
12.4
10.7
Interest
12.0
12.7
EBITDA
42.2
$
43.1
$
Margin - EBITDA
8.9%
9.2%
Center rent expense
18.6
18.4
EBITDAR
60.8
$
61.5
$
Margin - EBITDAR
12.8%
13.1%
Sun Healthcare Group, Inc. Reconciliation to
Reported EBITDA and EBITDAR |
  25
(Dollars in millions)
Proforma
Proforma
For the Twelve
For the Three
Months Ended
Months Ended
December 31, 2009
March 31, 2010
Revenue
1,881.8
$
473.3
$
Net income from continuing operations
36.7
8.8
Add:
Income tax expense
25.5
6.1
D&A
24.6
7.2
Interest
10.7
2.7
Restructuring costs and net loss on sale
of assets 1.3
-
EBITDA
98.7
$
24.8
$
Margin - EBITDA
5.2%
5.2%
Center rent expense
145.0
36.5
EBITDAR
243.8
$
61.4
$
Margin - EBITDAR
13.0%
13.0%
Sun Healthcare Group, Inc. Reconciliation
to Pro Forma
EBITDA and EBITDAR |
 Pro Forma Reconciliation Section
26
(Dollars in millions)
Proforma
Proforma
For the Twelve
For the Three
Months Ended
Months Ended
December 31, 2009
March 31, 2010
Revenue
71.9
$
18.0
$
Net income
25.5
6.4
Add: D&A
20.9
5.2
FFO
46.4
$
11.6
$
Add: Interest
23.1
5.8
EBITDA
69.5
$
17.4
$
Sabra Health Care REIT, Inc. Reconciliation to
Pro Forma FFO and EBITDA |
 Q1
Operating Metrics 27 |
 SunBridge
205 inpatient facilities
19,700 patients/residents
SunDance
460+ contracts/330 non-affiliated
Contract services, rehab agency,
management services
CareerStaff
More than 50% of business is in
hospital settings (also serves SNFs,
schools, prisons)
More than 50% of billings are for
therapist (also provide nursing
and
pharmacy services)
SolAmor
Targeted growth business
LTM revenues increased 93% in the
year-over-year LTM 3/31/10 period
3/31/10 LTM Net Revenue
Total: $ 1.9 billion
Medicaid
25.0%
35.0%
40.0%
Private Pay
and Other
Skilled Mix
CareerStaff
Inpatient
% of 3/31/10 LTM Net Revenue
By Business Unit
5.2%
89.1%
5.7%
SunDance
28 |
 Medicare
Implementation of Resource Utilization Group (RUG) system to RUG-IV
13 new RUG categories focused on medically complex
RUGS-IV and elimination of lookback
and concurrent effective
10/1/10
Medicaid
Guidance
assumes
flat
rates
–
2010
over
2009
States continue to have budgetary issues that may effect rates
29 |
 Enhance
our
clinical
product
and
service
delivery
Focus on specialty services –Solana/Rehab Recovery Suites
®
Expanding services for clinically complex patients
Continue to execute modernization of the centers
30
-
Pulmonary Disease Management
-
Neurological and Neurovascular Management
-
Cardiac Disease Management
-
Oncology Care Program
-
Pain Management
-
End of Life Program
-
Skin and Wound Management
-
Amputation Recovery Program
-
Infection Control
-
Bariatric Management
-
Diabetes Management
-
Orthopedic Recovery Program |
 31
Occupancy
(3) Quality mix includes all non-Medicaid inpatient
revenues
Inpatient Revenue Quality Mix
$173
$177
$373
$466
Inpatient Revenue Per Patient Day
$450
$364
$168
Medicaid
Private and Other
(Percentages represent change from prior period)
Q1 ‘09
Q1 ‘10
$186
Managed Care/Comm
Medicare Part A
3.0%
5.1%
<2.5%>
3.5%
Skilled Mix as a % of Revenue
(1) Occupancy excludes hospital
Q1 ‘09
88.8%
Q4 ‘09
87.8%
Q1 ‘10
87.5%
56.3%
Q1 ‘09
Q4 ‘09
54.2%
55.0%
Q1 ‘10
(2) SNF beds only
Managed
Care
33.9%
Q1 ‘09
40.6%
Medicare
6.7%
31.1%
Q4 ‘09
6.3%
37.4%
6.1%
38.6%
32.5%
Q1 ‘10
SunBridge
Performance Metrics |
 32
Product Differentiation
RRS and Solana
(Same Store Basis)
Q1 ‘09
Q1 ‘10
90.4%
87.7%
26.6%
25.4%
262.26
267.92
Q1 ‘09
Q1 ‘10
Q1 ‘09
Q1 ‘10
Occupancy
Rates
Q1 ‘09
Q1 ‘10
Q1 ‘09
Q1 ‘10
Q1 ‘09
Q1 ‘10
90.5%
89.0%
17.2%
15.8%
230.73
230.30
Occupancy
Skilled Mix
%
Rates
Q1 ‘09
Q1 ‘10
86.6
86.6%
19.6%
18.9%
229.94
233.87
Q1 ‘09
Q1 ‘10
Q1 ‘09
Q1 ‘10
Skilled Mix
%
Occupancy
Rates
86.6%
87.3%
15.9%
15.1%
210.60
214.36
Q1 ‘09
Q1 ‘10
Q1 ‘09
Q1 ‘10
Q1 ‘09
Q1 ‘10
Rates
Skilled Mix
%
Occupancy
(39)
(22)
(24)
(120)
Centers w/RRS Only
Centers w/Solana Only
Centers w/RRS and Solana
Centers w/o RRS or Solana
Skilled Mix
% |
 33
Revenue
($ in millions)
EBITDA Margin
SolAmor
Performance Metrics
ADC
Q1 ‘10
Q1 ‘09
$3.4
$4.0
$1.7
$0.7
$5.7
$1.3
$11.0
$5.8
Q1 ‘09
Q1 ‘10
283
321
122
405
45
85
450
811
Q1 ‘09
Q1 ‘10
19.7%
19.5%
17.7%
20.3%
14.9%
14.1%
19.4%
:Legacy
:Acquisition
:DeNovo
|
 34
Revenue / Contract
($ in thousands)
EBITDA Margin
Non-Affiliated Contracts
SunDance
Performance Metrics
Revenue
($ in millions)
Q1 ‘09
$43.7
Q4 ‘09
$46.3
$50.5
Q1 ‘10
Q1 ‘09
6.9%
Q4 ‘09
5.7%
8.0%
Q1 ‘10
$97.0
Q1 ‘09
Q4 ‘09
$99.8
Q1 ‘10
$107.9
337
337
Q1 ‘09
331
156
SNF
175
ALF/Other
Q4 ‘09
149
SNF
188
ALF/Other
188
ALF/Other
Q1 ‘10
149
SNF |
 Pharmacy
61.9%
25.9%
Allied
Nursing
Physician Services
EBITDA Margin
35
Q1 ‘09
$27.9
Q4 ‘09
$23.6
$23.5
Q1 ‘10
7.9%
Q1 ‘09
Q4 ‘09
10.1%
Q1 ‘10
7.1%
Pharmacy
57.9%
28.9%
Allied
Nursing
Physician Services
Revenue
($ in millions)
Q1 ’10 Revenue
By Type
Q1 ’09 Revenue
By Type
CareerStaff
Unlimited Performance Metrics |
 p. 2
Letter from Our CEO
p. 3
Our Public Commitments to Quality Improvement
p. 7
About Our Nursing Centers
p. 9
Our Approach to Quality and its Measurement
p. 10
Quality Information
p.
18
Enhancing
the
Quality
of
Our
Residents’
Lives
p. 20
About Our Employees
p. 22
Employee Spirit and Achievement
p. 24
Investing in Our Future
36
Published 1
st
annual report on quality
Quality First Pledge
Advancing Excellence Campaign
•
Key metrics ahead of national
peers
(Can
be
found
on
our
website
@
www.sunh.com)
36
Sun’s Commitment to Quality |