Attached files
| file | filename |
|---|---|
| EX-4.1 - SUN HEALTHCARE GROUP INC | ex41.htm |
| EX-31.2 - SUN HEALTHCARE GROUP INC | ex312.htm |
| EX-21.1 - SUN HEALTHCARE GROUP INC | ex211.htm |
| EX-31.1 - SUN HEALTHCARE GROUP INC | ex311.htm |
| EX-23.2 - SUN HEALTHCARE GROUP INC | ex232.htm |
| EX-23.1 - SUN HEALTHCARE GROUP INC | ex231.htm |
| EX-32.1 - SUN HEALTHCARE GROUP INC | ex321.htm |
| EX-4.2.3 - SUN HEALTHCARE GROUP INC | ex423.htm |
| EX-32.2 - SUN HEALTHCARE GROUP INC | ex322.htm |
| EX-10.16 - SUN HEALTHCARE GROUP INC | ex1016.htm |
| EX-10.18 - SUN HEALTHCARE GROUP INC | ex1018.htm |
| EX-10.12 - SUN HEALTHCARE GROUP INC | ex1012.htm |
UNITED
STATES
SECURITIES
AND EXCHANGE COMMISSION
Washington,
D.C. 20549
________________
FORM
10-K
(Mark
One)
|
x Annual
Report Pursuant to Section 13 or 15(d) of the Securities Exchange Act
of 1934
|
|
For
the fiscal year ended December 31, 2009
|
|
OR
|
|
o Transition
Report Pursuant to Section 13 or 15(d) of the Securities Exchange Act
of 1934
For
the transition period from _____ to _____
|
Commission
file number 1-12040
SUN HEALTHCARE
GROUP, INC.
(Exact
name of registrant as specified in its charter)
|
Delaware
(State
of Incorporation)
|
85-0410612
(I.R.S.
Employer Identification No).
|
18831
Von Karman, Suite 400
Irvine,
CA 92612
(949)
255-7100
(Address,
including zip code, and telephone number of principal executive
offices)
Securities
registered pursuant to Section 12(b) of the Act:
|
Title of Each Class
Common
Stock, par value $.01 per share
|
Name of Exchange on Which
Registered
The
NASDAQ Stock Market LLC (Nasdaq Global Select Market)
|
|
|
Securities
registered pursuant to Section 12(g) of the Act: None
|
Indicate
by check mark if the registrant is a well-known seasoned issuer, as defined in
Rule 405 of the Securities Act. oYes xNo
Indicate
by check mark if the registrant is not required to file reports pursuant to
Section 13 or Section 15(d) of the Act. oYes xNo
Indicate
by check mark whether the registrant (1) has filed all reports required to
be filed by Section 13 or 15(d) of the Securities Exchange Act of 1934
during the preceding 12 months (or for such shorter period that the
registrant was required to file such reports), and (2) has been subject to
such filing requirements for the past 90 days. xYes oNo
Indicate
by check mark whether the registrant has submitted electronically and posted to
its corporate Web site, if any, every Interactive Data File required to e
submitted and posted pursuant to Rule 405 of Regulation S-T during the preceding
12 months (or for such shorter period that the registrant was required to submit
and post such files).
xYes oNo
Indicate
by check mark if disclosure of delinquent filers pursuant to Item 405 of
Regulation S-K is not contained herein, and will not be contained, to the
best of the registrant's knowledge, in the definitive proxy or information
statements incorporated by reference in Part III of this Form 10-K or
any amendment to this Form 10-K. o
Indicate
by check mark whether the registrant is a large accelerated filer, an
accelerated filer, a non-accelerated filer, or a smaller reporting company. See
definition of “large accelerated filer,” “accelerated filer” and “smaller
reporting company” in Rule 12b-2 of the Exchange Act. (Check one):
Large
accelerated filero Accelerated
filerx Non-accelerated
filero Smaller
reporting companyo
Indicate
by check mark whether the registrant is a shell company (as defined in Rule
12b-2 of the Act).
oYes xNo
The
aggregate market value of the voting and non-voting common equity held by
non-affiliates computed by reference to the price at which the common equity was
last sold, as reported on the NASDAQ Global Select Market, as of the last
business day of the registrant's most recently completed second fiscal quarter
was $369.0 million.
On
March 2, 2010, Sun Healthcare Group, Inc. had 43,766,400 outstanding
shares of Common Stock.
Documents
Incorporated by Reference: Part III of this Form 10-K incorporates
information by reference from the Registrant’s definitive proxy statement for
the 2010 Annual Meeting to be filed prior to April 30, 2010.
INDEX
|
Page
|
||
|
PART
I
|
||
|
Item
1.
|
Business
|
1
|
|
Item
1A.
|
Risk
Factors
|
7
|
|
Item
1B.
|
Unresolved
Staff Comments
|
15
|
|
Item
2.
|
Properties
|
15
|
|
Item
3.
|
Legal
Proceedings
|
17
|
|
PART
II
|
||
|
Item
5.
|
Market
for Registrant's Common Equity, Related Stockholder Matters and
Issuer
|
|
|
Purchases
of Equity Securities
|
17
|
|
|
Item
6.
|
Selected
Financial Data
|
19
|
|
Item
7.
|
Management's
Discussion and Analysis of Financial Condition and Results
of
|
|
|
Operations
|
23
|
|
|
Item
7A.
|
Quantitative
and Qualitative Disclosures About Market Risk
|
51
|
|
Item
8.
|
Financial
Statements and Supplementary Data
|
51
|
|
Item
9.
|
Changes
in and Disagreements With Accountants on Accounting and
Financial
|
|
|
Disclosure
|
51
|
|
|
Item
9A.
|
Controls
and Procedures
|
52
|
|
Item
9B.
|
Other
Information
|
52
|
|
PART
III
|
||
|
Item
10.
|
Directors,
Executive Officers and Corporate Governance
|
53
|
|
Item
11.
|
Executive
Compensation
|
53
|
|
Item
12.
|
Security
Ownership of Certain Beneficial Owners and Management and
Related
|
|
|
Stockholder
Matters
|
53
|
|
|
Item
13.
|
Certain
Relationships and Related Transactions and Director
Independence
|
53
|
|
Item
14.
|
Principal
Accountant Fees and Services
|
53
|
|
PART
IV
|
||
|
Item
15.
|
Exhibits
and Financial Statement Schedules
|
54
|
|
Signatures
|
57
|
___________________
References
throughout this document to the Company, “we,” “our,” “ours” and “us” refer to
Sun Healthcare Group, Inc. and its direct and indirect consolidated subsidiaries
and not any other person.
Sun
Healthcare Group®, SunBridge®, SunDance®, CareerStaff Unlimited®, SolAmor®,
Rehab Recovery Suites® and related names are trademarks of Sun Healthcare
Group, Inc. and its subsidiaries.
__________________________________________
STATEMENT REGARDING
FORWARD-LOOKING STATEMENTS
Information
provided in this Annual Report on Form 10-K (“Annual Report”) contains
“forward-looking” information as that term is defined by the Private Securities
Litigation Reform Act of 1995 (the “Act”). Any statements that do not
relate to historical or current facts or matters are forward-looking
statements. Examples of forward-looking statements include all
statements regarding our expected future financial position, results of
operations, cash flows, liquidity, financing plans, business strategy, budgets,
the impact of reductions in reimbursements and other changes in government
reimbursement programs, the outcome and costs of litigation, projected expenses
and capital expenditures, growth opportunities, ability to refinance our
indebtedness on favorable terms, plans and objectives of management for future
operations and compliance with and changes in governmental
regulations. You can identify some of the forward-looking statements
by the use of forward-looking words such as “anticipate,” “believe,” “plan,”
“estimate,” “expect,” “intend,” “should,” “may” and other similar expressions
are forward-looking statements. The forward-looking statements are
qualified in their entirety by these cautionary statements, which are being made
pursuant to the provisions of the Act and with the intention of obtaining the
benefits of the “safe harbor” provisions of the Act. We caution
investors that any forward-looking statements made by us herein are not
guarantees of future performance and that investors should not place undue
reliance on any of such forward-looking statements, which speak only as of the
date of this report. Forward-looking statements involve known and
unknown risks and uncertainties that may cause our actual results in future
periods to differ materially from those projected or contemplated in the
forward-looking statements. You should carefully consider the
disclosures we make concerning risks and uncertainties that could cause actual
results to differ materially from those in the forward-looking statements,
including those described in this report under Part I, Item 1A – “Risk Factors”
and any of those made in our other reports filed with the Securities and
Exchange Commission. There may be additional risks of which we are
presently unaware or that we currently deem immaterial. We do not
intend, and undertake no obligation, to update our forward-looking statements to
reflect future events or circumstances.
SUN
HEALTHCARE GROUP, INC. AND SUBSIDIARIES
PART
I
Item
1. Business
Overview
Sun
Healthcare Group, Inc.’s (NASDAQ GS: SUNH) subsidiaries provide nursing,
rehabilitative and related specialty healthcare services principally to the
senior population in the United States. Our core business is providing inpatient
services, primarily through 183 skilled nursing centers, 14 assisted and
independent living centers and eight mental health centers. At December 31,
2009, our centers had 23,205 licensed beds located in 25 states, of which 22,423
were available for occupancy. Our subsidiaries also provide rehabilitation
therapy services to affiliated and non-affiliated centers and medical staffing
and other ancillary services primarily to non-affiliated centers and other third
parties. For the year ended December 31, 2009, our total net revenues from
continuing operations were $1.9 billion.
Business
Segments
Our
subsidiaries currently engage in the following three principal business
segments:
|
|
Ø
|
inpatient
services, primarily skilled nursing
centers;
|
|
|
Ø
|
rehabilitation
therapy services; and
|
|
|
Ø
|
medical
staffing services.
|
Inpatient
services. As of December 31, 2009, we operated 205
healthcare facilities (consisting of 183 skilled nursing centers, 14 assisted
and independent living centers and eight mental health centers) in 25 states
with 23,205 licensed beds through SunBridge Healthcare Corporation (“SunBridge”)
and other subsidiaries. Our skilled nursing centers provide services that
include daily nursing, therapeutic rehabilitation, social services,
housekeeping, nutrition and administrative services for individuals requiring
certain assistance for activities in daily living. Rehab Recovery Suites
(“RRS”), which specialize in Medicare and managed care patients, are located in
63 of our skilled nursing centers, and 47 of our skilled nursing centers contain
wings dedicated to the care of residents afflicted with Alzheimer’s disease. Our
assisted living centers provide services that include minimal nursing
assistance, housekeeping, nutrition, laundry and administrative services for
individuals requiring minimal assistance for activities in daily living. Our
independent living centers provide services that include security, housekeeping,
nutrition and limited laundry services for individuals requiring no assistance
for activities in daily living. Our mental health centers provide a range of
inpatient and outpatient behavioral health services for adults and children
through specialized treatment programs. We also provide hospice services,
including palliative care, social services, pain management and spiritual
counseling, through our subsidiary SolAmor Hospice Corporation (“SolAmor”), in
eight states for individuals facing end of life issues. We generated 89.1%,
88.6%, and 87.8% of our consolidated net revenues through inpatient services in
2009, 2008, and 2007, respectively.
Rehabilitation therapy
services. We provide rehabilitation therapy services through
SunDance Rehabilitation Corporation (“SunDance”). SunDance provides a broad
array of rehabilitation therapy services, including speech pathology, physical
therapy and occupational therapy. As of December 31, 2009, SunDance
provided rehabilitation therapy services to 464 centers in 36 states, 337 of
which were operated by nonaffiliated parties and 127 of which were operated by
affiliates. In most of our 78 healthcare centers for which SunDance does not
provide rehabilitation therapy services, those services are provided by staff
employed by the centers, although some centers engage third-party therapy
companies for such services. We generated 5.6%, 4.9%, and 5.3% of our
consolidated net revenues through rehabilitation therapy services in 2009, 2008,
and 2007, respectively.
1
SUN
HEALTHCARE GROUP, INC. AND SUBSIDIARIES
Medical staffing
services. We provide temporary medical staffing in 44 states
through CareerStaff Unlimited, Inc. (“CareerStaff”). For the year ended
December 31, 2009, CareerStaff derived 56.1% of its revenues from hospitals
and other providers, 24.7% from skilled nursing centers, 15.3%
from schools and 3.9% from prisons. CareerStaff provides (i) licensed
therapists skilled in the areas of physical, occupational and speech therapy,
(ii) nurses, (iii) pharmacists, pharmacist technicians and medical
imaging technicians, (iv) physicians and (v) related medical personnel. We
generated 5.3%, 6.5%, and 6.9% of our consolidated net revenues through medical
staffing services in 2009, 2008, and 2007, respectively.
See Note
14 – “Segment Information” to our consolidated financial statements included in
this Annual Report on Form 10-K for additional information regarding our
segments.
Competition
Our
businesses are competitive. The nature of competition within the inpatient
services industry varies by location. We compete with other healthcare centers
based on key factors such as the number of centers in the local market, the
types of services available, quality of care, reputation, age and appearance of
each center and the cost of care in each locality. Increased competition in the
future could limit our ability to attract and retain residents or to expand our
business.
We also
compete with other companies in providing rehabilitation therapy services,
medical staffing services and hospice services, and in employing and retaining
qualified nurses, therapists and other medical personnel. The primary
competitive factors for the ancillary services markets are quality of services,
charges for services and responsiveness to customer needs.
We
believe the following strengths will allow us to continue to improve our
operations and profitability:
National
footprint. The size of our operations has enabled
us to realize the benefits of economies of scale, purchasing power and increased
year over year operating efficiencies. Furthermore, our geographic diversity
helps to mitigate our risk associated with adverse state regulatory changes
related to Medicaid reimbursement in any one state.
Core inpatient
services business. Our inpatient business has
achieved consistent revenue and earnings growth by expanding our services and
increasing our focus on integrated skilled nursing care and rehabilitation
therapy services to attract high-acuity patients throughout all nursing and
rehabilitation centers and through targeting specific centers with Rehab
Recovery Suites that exclusively specialize in Medicare and managed care
patients. Our hospice business, which serves patients in certain of our nursing
centers, in-home settings and in non-affiliated centers, has become an important
contributor to the strength of our inpatient business.
Quality of
care. We have initiated programs to provide a high
quality of care to our patients. These programs have resulted in third-party
recognition for our quality of care and clinical services.
Ancillary
businesses support our inpatient services and provide
diversification. Our rehabilitation therapy
business complements our core inpatient services business and is particularly
attractive to high-acuity patients who require more intensive and medically
complex care. Our medical staffing business, which primarily services
non-affiliated providers, derives a majority of its revenues from its placement
of therapists. We also place physicians, nurses and pharmacists.
Infrastructure in
place to leverage growth. We
have an established corporate and regional infrastructure in place to leverage
our growth. For the year ended December 31, 2009, our corporate overhead as
a percentage of revenues was 3.3%, compared to 3.4% for the year ended December
31, 2008.
2
SUN
HEALTHCARE GROUP, INC. AND SUBSIDIARIES
Experienced
management team with a proven track record. We
have a strong and committed management team that has substantial industry
knowledge and a proven track-record of operations success in the long-term care
industry. Our chief executive officer, our chief financial officer and the chief
operating officer of our operating subsidiaries have over 80 years of cumulative
healthcare experience. Our management team has successfully acquired and
integrated numerous businesses, assets and properties, and we believe this
experience positions us well to continue to successfully implement our growth
and integration strategies.
Business
Strategy
We intend
to build on our competitive strengths to grow our business and strengthen our
position as a nationwide provider of senior healthcare services by achieving the
following objectives:
Continue our
inpatient growth. We intend to increase our
inpatient revenue and profitability by maintaining high occupancy rates and by
continuing to focus on attracting more high-acuity and Medicare patients. We are
currently implementing this strategy by focusing on our clinical and case
management and by developing Rehab Recovery Suites that exclusively specialize
in Medicare and managed care patients. In addition, we are developing
relationships with key referral sources and creating specialty Medicare/managed
care and Alzheimer’s units within our centers to meet unique clinical needs
within a community. We plan to take advantage of our marketing infrastructure
and brand image to attract new patients and to expand our referral and customer
bases.
Seek growth in
our hospice and ancillary businesses. We will
seek to grow our SolAmor hospice operations through acquisitions and internal
growth. We will continue to focus on our rehabilitation therapy business, a key
driver of our Medicare services and revenues, by improving our clinical product
offering, labor productivity and operating profitability and eliminating less
profitable third-party contracts. We believe that our hospice and ancillary
services provide us with diversified revenue sources, favorable payor mix and
growth opportunities.
Increase
operational efficiency and leverage our existing
platform. We will continue to focus on improving
operating efficiency without compromising our high quality of care. We plan to
reduce costs and enhance efficiency through various methods,
including:
|
|
Ø
|
reducing
labor and billing expenses through technological advances and operational
improvements that allow management to allocate employees more
efficiently;
|
|
|
Ø
|
reducing
overhead through process improvement initiatives and frequent
re-examination of costs;
|
|
|
Ø
|
continuing
to improve therapist productivity in our rehabilitation services
business;
|
|
|
Ø
|
controlling
litigation expense by focusing on risk
management;
|
|
|
Ø
|
improving
our balance sheet by reducing our indebtedness;
and
|
|
|
Ø
|
monitoring
and analyzing the operations and profitability of individual business
units.
|
Employees
and Labor Relations
As of
December 31, 2009, we and our subsidiaries had 30,029 full-time, part-time and
per diem employees. Of this total, there were 24,451 employees in our inpatient
services operations, 2,987 employees in our rehabilitation therapy services
operations, 1,850 employees in our medical staffing business, 436 employees in
our hospice operations and 305 employees at our corporate and regional
offices.
As of
December 31, 2009, SunBridge operated 35 centers with union employees.
Approximately 2,856 of our employees (9.5% of all of our employees) who worked
in healthcare centers in Alabama, California, Connecticut, Georgia,
Massachusetts, Maryland, Montana, New Jersey, Ohio, Rhode Island, Washington and
West Virginia were covered by collective bargaining contracts. Collective
bargaining agreements covering
3
SUN
HEALTHCARE GROUP, INC. AND SUBSIDIARIES
approximately
1,429 of these employees (4.8% of all our employees) either are currently in
renegotiations or will shortly be in renegotiations due to the expiration of the
collective bargaining agreements.
Federal
and State Regulatory Oversight
The
healthcare industry is extensively regulated. In the ordinary course of
business, our operations are continuously subject to federal, state and local
regulatory scrutiny, supervision and control. This often includes inquiries,
investigations, examinations, audits, site visits and surveys. As more fully
described below, various laws, including anti-kickback, anti-fraud and abuse
provisions codified under the Social Security Act, prohibit certain business
practices and relationships that might affect the provision and cost of
healthcare services reimbursable under Medicare and Medicaid. Sanctions for
violating these anti-kickback, anti-fraud and abuse provisions include criminal
penalties, civil sanctions, fines and possible exclusion from government
programs such as Medicare and Medicaid. If a center is decertified as a Medicare
or Medicaid provider by the Centers for Medicare and Medicaid Services (“CMS”)
or a state, the center will not thereafter be reimbursed for caring for
residents that are covered by Medicare and Medicaid, and the center would be
forced to care for such residents without being reimbursed or to transfer such
residents.
Our
skilled nursing centers and mental health centers are currently licensed under
applicable state law, and are certified or approved as providers under the
Medicare and Medicaid programs. State and local agencies survey all skilled
nursing centers on a regular basis to determine whether such centers are in
compliance with governmental operating and health standards and conditions for
participation in government sponsored third-party payor programs. From time to
time, we receive notice of noncompliance with various requirements for
Medicare/Medicaid participation or state licensure. We review such notices for
factual correctness, and based on such reviews, either take appropriate
corrective action or challenge the stated basis for the allegation of
noncompliance. Where corrective action is required, we work with the reviewing
agency to create mutually agreeable measures to be taken to bring the center or
service provider into compliance. Under certain circumstances, the federal and
state agencies have the authority to take adverse actions against a center or
service provider, including the imposition of a monitor, the imposition of
monetary penalties and the decertification of a center or provider from
participation in the Medicare and/or Medicaid programs or licensure revocation.
When appropriate, we vigorously contest such sanctions. Challenging and
appealing notices or allegations of noncompliance can require significant legal
expenses and management attention.
Various
states in which we operate centers have established minimum staffing
requirements or may establish minimum staffing requirements in the future. Our
ability to satisfy such staffing requirements depends upon our ability to
attract and retain qualified healthcare professionals, including nurses,
certified nurse’s assistants and other staff. Failure to comply with such
minimum staffing requirements may result in the imposition of fines or other
sanctions.
Most
states in which we operate have statutes which require that, prior to the
addition or construction of new nursing home beds, the addition of new services
or certain capital expenditures in excess of defined levels, we first must
obtain a certificate of need (“CON”), which certifies that the state has made a
determination that a need exists for such new or additional beds, new services
or capital expenditures. The certification process is intended to promote
quality healthcare at the lowest possible cost and to avoid the unnecessary
duplication of services, equipment and centers.
We are
subject to federal and state laws that govern financial and other arrangements
between healthcare providers. These laws often prohibit certain direct and
indirect payments or fee-splitting arrangements between healthcare providers
that are designed to induce the referral of patients to, or the recommendation
of, a particular provider for medical products and services. These laws include:
4
SUN
HEALTHCARE GROUP, INC. AND SUBSIDIARIES
|
–
|
the
“anti-kickback” provisions of the Medicare and Medicaid programs, which
prohibit, among other things, knowingly and willfully soliciting,
receiving, offering or paying any remuneration (including any kickback,
bribe or rebate) directly or indirectly in return for or to induce the
referral of an individual to a person for the furnishing or arranging for
the furnishing of any item or service for which payment may be made in
whole or in part under Medicare or Medicaid; and
|
|
–
|
the
“Stark laws” which prohibit, with limited exceptions, the referral of
patients by physicians for certain services, including physical therapy
and occupational therapy, to an entity in which the physician has a
financial interest.
|
False
claims are prohibited pursuant to criminal and civil statutes. These provisions
prohibit filing false claims or making false statements to receive payment or
certification under Medicare or Medicaid or failing to refund overpayments or
improper payments. Suits alleging false claims can be brought by individuals,
including employees and competitors. Newly adopted legislation has
expanded the scope of the federal False Claims Act and eased some requirements
for the filing of a lawsuit under the act. We believe that our
billing practices are compliant with the False Claims Act and similar state
laws. However, if our practices, policies and procedures are found
not to comply with the provisions of those laws, we could be subject to civil
sanctions.
Commencing
January 1, 2010, recovery audit contractors, or RACs, operating under the
Medicare Integrity Program, seek to identify alleged Medicare overpayments based
on the medical necessity of services provided in nursing
centers. Similar audits are conducted by various state agencies under
the Medicaid program.
As of
December 31, 2009, we have approximately $5.2 million of claims that
are under various stages of review or appeal with the Medicare Administration
Contractors/Fiscal Intermediaries. We cannot assure you that future
recoveries will not be material or that any appeal of a medical review or RAC
audit that we are pursuing will be successful.
We are
also subject to regulations under the privacy and security provisions of the
Health Insurance Portability and Accountability Act of 1996 (“HIPAA”). The
privacy rules provide for, among other things, (i) giving consumers the
right and control over the release of their medical information, (ii) the
establishment of boundaries for the use of medical information and
(iii) civil or criminal penalties for violation of an individual’s privacy
rights.
These
privacy regulations apply to “protected health information,” which is defined
generally as individually identifiable health information transmitted or
maintained in any form or medium, excluding certain education records and
student medical records. The privacy regulations limit a provider’s use and
disclosure of most paper, oral and electronic communications regarding a
patient’s past, present or future physical or mental health or condition, or
relating to the provision of healthcare to the patient or payment for that
healthcare.
The
security regulations require us to ensure the confidentiality, integrity, and
availability of all electronic protected health information that we create,
receive, maintain or transmit. We must protect against reasonably anticipated
threats or hazards to the security of such information and the unauthorized use
or disclosure of such information.
Compliance
Process
Our
compliance program, referred to as the “Compliance Process,” was initiated in
1996. It has evolved as the requirements of federal and private healthcare
programs have changed. There are seven principal elements to the
Compliance Process:
5
SUN
HEALTHCARE GROUP, INC. AND SUBSIDIARIES
Written Policies,
Procedures and Standards of Conduct. Our business
lines have extensive policies and procedures (“P&Ps”) modeled after
applicable laws, regulations, government manuals and industry practices and
customs. The P&Ps govern the clinical, reimbursement, and operational
aspects of each subsidiary. To emphasize adherence to our P&Ps, we publish
and distribute a Code of Conduct and an employee handbook.
Designated
Compliance Officer and Compliance Committee. We
have a Chief Compliance Officer whose responsibilities include, among other
things: (i) overseeing the Compliance Process; (ii) overseeing
compliance with judicial and regulatory requirements, and functioning as the
liaison with the state agencies and the federal government on matters related to
the Compliance Process and such requirements; (iii) reporting to our board
of directors, the Compliance Committee of our board of directors, and senior
corporate managers on the status of the Compliance Process; and
(iv) overseeing the coordination of a comprehensive training program which
focuses on the elements of the Compliance Process and employee background
screening process. Compliance matters are reported to the Compliance Committee
of our board of directors on a regular basis. The Compliance Committee is
comprised solely of independent directors.
Effective
Training and Education. Every
employee, director and officer is trained on the Compliance Process and Code of
Conduct. Training also occurs for appropriate employees in applicable provisions
of the Medicare and Medicaid laws, fraud and abuse prevention, clinical
standards, and practices, and claim submission and reimbursement
P&Ps.
Effective Lines
of Communication. Employees
are encouraged to report issues of concern without fear of retaliation using a
Four Step Reporting Process, which includes the toll-free “Sun Quality Line.”
The Four Step Reporting Process encourages employees to discuss clinical,
ethical or financial concerns with supervisors and local management since these
individuals will be most familiar with the laws, regulations, and policies that
impact their concerns. The Sun Quality Line is an always-available option that
may be used for anonymous reporting if the employee so chooses. Reported
concerns are internally reviewed and proper follow-up is conducted.
Internal
Monitoring and Auditing. Our
Compliance Process puts internal controls in place to meet the following
objectives: (i) accuracy of claims, reimbursement submissions, cost reports
and source documents; (ii) provision of patient care, services, and
supplies as required by applicable standards and laws; (iii) accuracy of
clinical assessment and treatment documentation; and (iv) implementation of
judicial and regulatory requirements (e.g., background checks, licensing and
training). Each business line monitors and audits compliance with P&Ps and
other standards to ensure that the objectives listed above are met. Data from
these internal monitoring and auditing systems are analyzed and acted upon
through a quality improvement process. We have designated the subsidiary
presidents and each member of the operations management team as Compliance
Liaisons. Each Compliance Liaison is responsible for making certain that all
requirements of the Compliance Process are completed at the operational level
for which the Compliance Liaison is responsible.
Enforcement of
Standards. Our
policies, the Code of Conduct and the employee handbook, as well as all
associated training materials, clearly indicate that employees who violate our
standards will be subjected to discipline. Sanctions range from oral warnings to
suspensions and/or to termination of employment. We have also adopted a
proactive approach to offset the need for punitive measures. First, we have
implemented employee background review practices that surpass industry
standards. Second, as noted above, we devote significant resources to employee
training. Finally, we have adopted a performance management program intended to
make certain that all employees are aware of what duties are expected of them
and understand that compliance with policies, procedures, standards and laws
related to job functions is required.
Responses to
Detected Offenses and Development of Corrective
Actions. Correction of detected misconduct or a
violation of our policies is the responsibility of every manager. As
appropriate, a manager is expected to
6
SUN
HEALTHCARE GROUP, INC. AND SUBSIDIARIES
develop
and implement corrective action plans and monitor whether such actions are
likely to keep a similar violation from occurring in the future.
Our
Compliance Process incorporates the terms of a revised Permanent Injunction and
Final Judgment entered on September 14, 2005 (“PIFJ”). The PIFJ, which
resulted from investigations by the Bureau of Medi-Cal Fraud and Elder Abuse of
the Office of the California Attorney General and applies to our California
centers, requires compliance with certain clinical practices that are
substantially consistent with existing law and our current practices, and
imposes staffing requirements and specific training obligations. All California
administrators are trained on the requirements of the PIFJ, as
required. The PIFJ also requires us to issue to the State of
California annual reports documenting our compliance efforts. A breach of the
PIFJ could subject us to substantial monetary penalties.
General
Information
Sun
Healthcare Group, Inc. was incorporated in Delaware in 1993. Our
principal executive offices are located at 18831 Von Karman, Suite 400, Irvine,
CA 92612, and our telephone number is (949) 255-7100. We maintain a
website at www.sunh.com. Through
the “For more information about Sun Healthcare Group, Inc.” and “SEC Filings”
links on our website, we make available free of charge, as soon as reasonably
practicable after such information has been filed or furnished to the Securities
and Exchange Commission, each of our filings with the SEC, including our annual
report on Form 10-K, quarterly reports on Form 10-Q, current reports on Form
8-K, and amendments to those reports filed or furnished pursuant to Section
13(a) or 15(d) of the Securities Exchange Act of 1934 (“Exchange
Act”).
Item
1A. Risk Factors
Our
business depends on reimbursement under federal and state programs, and
legislation or regulatory action may reduce or otherwise adversely affect the
amount of reimbursements.
Our
revenues are heavily dependent on payments administered under the Medicare and
Medicaid programs. The economic downturn has caused many states to institute
freezes on or reductions in Medicaid reimbursements to address state budget
concerns. Moreover, for the 2010 federal fiscal year, CMS effectively
reduced our Medicare reimbursement rates; for the 2011 federal fiscal year, CMS
is implementing changes to the Resource Utilization Group classification system,
which may impact our Medicare revenues adversely. In addition, the
skilled nursing center exception to the statutory cap on Medicare reimbursements
for therapy services expired on December 31, 2009. If the
skilled nursing center exception is not extended, reimbursement for therapy
services rendered to our residents and patients will be reduced. See
Item 7 – “Management’s Discussion and Analysis of Financial Condition and
Results of Operations – Revenues from Medicare, Medicaid and Other
Sources.”
In
addition to these reductions, there have been numerous initiatives on the
federal and state levels for comprehensive reforms affecting the payment for and
availability of healthcare services. Aspects of certain of these initiatives,
such as further reductions in funding of the Medicare and Medicaid programs,
additional changes in reimbursement regulations by CMS, enhanced pressure to
contain healthcare costs by Medicare, Medicaid and other payors, and additional
operational requirements, could adversely affect us.
In
addition to reducing our revenues, healthcare reform may increase our costs and
otherwise adversely affect our business.
Both the
U.S. House of Representatives and the U.S. Senate have each recently proposed
comprehensive reforms to the country’s healthcare system. There can
be no assurance as to the ultimate content, timing or
7
SUN
HEALTHCARE GROUP, INC. AND SUBSIDIARIES
effect of
any legislation that seeks to address healthcare reform, nor is it possible at
this time to estimate the impact of potential legislation on us. Any
significant healthcare reform legislation may have a material adverse effect on
our financial condition, results of operations and cash flows. In
addition, we incur considerable administrative costs in monitoring any changes
made within the Medicare and Medicaid programs (such as the pending change in
Resource Utilization Group categories), determining the appropriate actions to
be taken in response to those changes, and implementing the required actions to
meet the new requirements and minimize the repercussions of the changes to our
organization, reimbursement rates and costs. A major reform of the healthcare
delivery system could render determining and implementing appropriate actions
more complex and costly. See Item 7 – “Management’s Discussion and
Analysis of Financial Condition and Results of Operations—Revenues from
Medicare, Medicaid and Other Sources.”
Our
revenue and collections have been adversely affected by the economic downturn,
and there may be further adverse consequences of the downturn.
In
addition to state and federal budgetary actions that have impacted the amount of
reimbursements that we receive for services under state and federal programs,
the economic downturn has resulted in reduced demand for our staffing services
that we provide through or to other healthcare providers and has impacted our
ability to collect our receivables from nongovernmental sources. If
current economic conditions do not improve or worsen, this reduction in demand
and impact on our receivables collection could continue. Adverse
economic conditions could also result in continued reduced demand for our
therapy and staffing services to third party providers and increasing difficulty
in collecting our receivables.
Delays
in collecting or the inability to collect our accounts receivable could
adversely affect our cash flows and financial condition.
Prompt
billing and collection are important factors in our liquidity. Billing and
collection of our accounts receivable are subject to the complex regulations
that govern Medicare and Medicaid reimbursement and rules imposed by
nongovernment payors. Our inability to bill and collect on a timely
basis pursuant to these regulations and rules could subject us to payment delays
that could negatively impact our cash flows and ultimately our financial
condition. In addition, commercial payors and other customers, as
well as individual patients, may be unable to make payments to us for which they
are responsible. The recent economic downturn has resulted in a
decrease in our ability to collect accounts receivable from some of our
customers. A continuation or worsening of recent unfavorable economic
conditions may result in a decrease in our collections, then we will have to
make larger allowances for doubtful accounts or incur bad debt write-offs, both
of which would have an adverse impact on our financial condition, results of
operations and cash flows.
Our
business is subject to reviews, audits and investigations under federal and
state programs and by private payors, which could adversely impact our revenues
and results of operations.
We are
subject to review or audit by federal and state governmental agencies to verify
compliance with the requirements of the Medicare and Medicaid programs and other
federal and state programs. Audits under the Medicare and Medicaid
programs have intensified in recent years. See Item 7 – “Management’s
Discussion and Analysis of Financial Condition and Results of Operations –
Revenues from Medicare, Medicaid and Other Sources.” Private payors
also may have the right by contract to review or audit our
files. Such an investigation could result in our paying back amounts
that we have been paid pursuant to these programs; our paying fines or
penalties; the suspension of our ability to collect payment for new residents to
a skilled nursing center; exclusion of a skilled nursing center from
participation in one or more governmental programs; revocation of a license to
operate a skilled nursing center; or loss of a contract with a private
payor. Any of these events could adversely impact our revenues and
results of operations.
8
SUN
HEALTHCARE GROUP, INC. AND SUBSIDIARIES
Our
hospice business is subject to a cap on the amount paid by Medicare and other
Medicare payment limitations, which limitations could adversely affect our
hospice revenues and earnings.
Payments
made by Medicare for hospice services are subject to a cap amount on a per
hospice basis. Our ability to comply with this limitation depends on
a number of factors, including number of admissions, average length of stay,
acuity level of our patients and patients that transfer into and out of our
hospice programs. Our hospice revenue and profitability may be
materially reduced if we are unable to comply with this and other Medicare
payment limitations. See Item 7 – “Management’s Discussion and
Analysis of Financial Condition and Results of Operations – Revenues from
Medicare, Medicaid and Other Sources.”
Possible
changes in the case mix of residents and patients as well as payor mix and
payment methodologies may significantly affect our profitability.
The
sources and amount of our revenues are determined by a number of factors,
including the licensed bed capacity and occupancy rates of our healthcare
centers, the mix of residents and patients and the rates of reimbursement among
payors. Likewise, services provided by our ancillary businesses vary based upon
payor and payment methodologies. Changes in the case mix of the residents and
patients as well as payor mix among private pay, Medicare and Medicaid will
significantly affect our profitability. In particular, any significant decrease
in our population of high-acuity residents and patients or any significant
increase in our Medicaid population could have a material adverse effect on our
financial position, results of operations and cash flows, especially if states
operating Medicaid programs continue to limit, or more aggressively seek limits
on, reimbursement rates.
We
are subject to a number of lawsuits, which could adversely impact
us.
Skilled
nursing center operators, including our inpatient services subsidiaries, are
subject to lawsuits seeking to hold them liable for alleged negligent or other
wrongful conduct of employees that allegedly result in injury or death to
residents of the centers. We currently have numerous patient care lawsuits
pending against us, as well as other types of lawsuits. Adverse determinations
in legal proceedings or any governmental investigations that could lead to
lawsuits, whether currently asserted or arising in the future, and any adverse
publicity arising therefrom, could have a material adverse effect on our
business reputation, financial position, results of operations or cash
flows.
We
rely primarily on self-funded insurance programs for general and professional
liability and workers’ compensation claims against us.
We
self-insure for the majority of our insurable risks, including general and
professional liabilities, workers’ compensation liabilities and employee health
insurance liabilities, through the use of self-insurance or self-funded
insurance policies, which vary by the states in which we operate. We rely upon
self-funded insurance programs for general and professional liability claims up
to $5.0 million per claim, which amounts we are responsible for
funding. We maintain excess insurance policies for claims above this
amount. There is a risk that the amounts funded to our programs of
self-insurance and future cash flows may not be sufficient to respond to all
claims asserted under those programs.
At
December 31, 2009 and 2008, we had recorded reserves of $94.9 million and
$87.3 million, respectively, for general and professional liabilities, but we
had only pre-funded $3.4 million in each of those years for such
claims. At December 31, 2009 and 2008, we had recorded reserves of
$94.9 million and $87.3 million, respectively, for workers’ compensation
liabilities, and had only pre-funded $12.0 million and $22.1 million,
respectively, for such claims. We cannot assure you that a claim in
excess of our insurance coverage limits will not arise. A claim against us that
is not covered by, or is in excess of, the coverage limits provided by our
excess
9
SUN
HEALTHCARE GROUP, INC. AND SUBSIDIARIES
insurance
policies could have a material adverse effect upon us. Furthermore, we cannot
assure you that we will be able to obtain adequate additional liability
insurance in the future or that, if such insurance is available, it will be
available on acceptable terms.
Our
operations are extensively regulated and adverse determinations against us could
result in severe penalties, including loss of licensure and
decertification.
In the
ordinary course of business, we are continuously subject to a wide variety of
federal, state and local laws and regulations and to state and federal
regulatory scrutiny, supervision and control in various areas, including
referral of patients, false claims under Medicare and Medicaid, health and
safety laws, environmental laws and the protection of health information. Such
regulatory scrutiny often includes inquiries, civil and criminal investigations,
examinations, audits, site visits and surveys, some of which are non-routine.
See Item 1 – “Business—Federal and State Regulatory Oversight” and Item 3 —
“Legal Proceedings.” If we are found to have engaged in improper practices, we
could be subject to civil, administrative or criminal fines, penalties or
restitutionary relief or corporate settlement agreements with federal, state or
local authorities, and reimbursement authorities could also seek our suspension
or exclusion from participation in their program. The exclusion of centers from
participating in Medicare or Medicaid could have a material adverse effect on
our financial position, results of operations and cash flows. We
cannot predict the future course of any laws or regulations to which we are
subject, including Medicare and Medicaid statutes and regulations, the intensity
of federal and state enforcement actions or the extent and size of any potential
sanctions, fines or penalties. Changes in existing laws or
regulations, or the enactment of new laws or regulations, could result in
changes to our operations requiring significant capital expenditures or
additional operating expenses. Evolving interpretations of existing,
new or amended laws and regulations or heightened enforcement efforts could also
negatively impact our financial position, results of operations and cash
flows.
Our
business is dependent on referral sources, which have no obligation to refer
residents and patients to our skilled nursing centers.
We rely
on referrals from physicians, hospitals and other healthcare providers to
provide our skilled nursing centers with our patient
population. These referral sources are not obligated to refer
business to us and may refer business to other long term care
providers. If we fail to maintain our existing referral sources, fail
to develop new relationships, or fail to achieve or maintain a reputation for
providing high quality of care, our patient population, payor mix, revenue and
profitability could be adversely affected.
Providers of commercial insurance and
other nongovernmental payors are increasingly seeking to control costs, which
efforts could negatively impact our revenues.
Private
insurers are seeking to control healthcare costs through direct contracts with
healthcare providers, and reviews of the propriety of, and charges for, services
provided. These private payors are increasingly demanding discounted fee
structures. These cost control efforts could have a material adverse
effect on our financial position, results of operations and cash
flows.
We
continue to seek acquisitions and other strategic opportunities, which may
result in the use of a significant amount of management resources or significant
costs and we may not be able to fully realize the potential benefit of such
transactions.
We
continue to seek acquisitions and other strategic opportunities. Accordingly, we
are often engaged in evaluating potential transactions and other strategic
alternatives. In addition, from time to time, we engage in preliminary
discussions that may result in one or more transactions. Although there is
uncertainty that any of these discussions will result in definitive agreements
or the completion of any transaction, we may devote a significant amount of our
management resources to such a transaction, which could negatively impact
our
10
SUN
HEALTHCARE GROUP, INC. AND SUBSIDIARIES
operations. In
addition, we may incur significant costs in connection with seeking acquisitions
or other strategic opportunities regardless of whether the transaction is
completed and in combining our operations if such a transaction is
completed. In the event that we consummate an acquisition or
strategic alternative in the future, we can give no assurance that we would
fully realize the potential benefit of such a transaction.
We
face national, regional and local competition.
The
healthcare industry is highly competitive and subject to continual changes in
the method by which services are provided and the types of companies providing
services. Our nursing and rehabilitation centers compete primarily on a local
and regional basis with many long-term care providers, some of whom may own as
few as a single nursing center. Our ability to compete successfully varies from
location to location depending on a number of factors, including the number of
competing centers in the local market, the types of services available, quality
of care, reputation, age and appearance of each center and the cost of care in
each locality. Increased competition in the future could limit our ability to
attract and retain residents or to expand our business.
State
efforts to regulate the construction or expansion of healthcare providers could
impair our ability to expand our operations or make acquisitions.
Some
states require healthcare providers (including skilled nursing centers, hospices
and assisted living centers) to obtain prior approval, in the form of a CON, for
the purchase, construction or expansion of healthcare centers; capital
expenditures exceeding a prescribed amount; or changes in services or bed
capacity. To the extent that we are required to obtain a CON or other similar
approvals to expand our operations, either by acquiring centers or other
companies or expanding or providing new services or other changes, our expansion
could be adversely affected by our failure or inability to obtain the necessary
approvals, changes in the standards applicable to those approvals, and possible
delays and expenses associated with obtaining those approvals. We cannot make
any assurances that we will be able to obtain a CON or other similar approval
for any future projects requiring this approval.
We may be unable to reduce costs to
offset completely any decreases in our revenues.
Reduced
levels of occupancy in our healthcare centers and reductions in reimbursements
from Medicare and Medicaid would adversely impact our cash flow and revenues.
Fluctuation in our occupancy levels may become more common as we increase our
emphasis on patients with shorter stays but higher acuities. If we are unable to
put in place corresponding adjustments in costs in response to declines in
census or other revenue shortfalls, we would be unable to prevent future
decreases in earnings. Our centers are able to reduce some of their
costs as occupancy decreases, although the decrease in costs will in most cases
be less than the decrease in revenues. However, our centers are not
able to reduce their costs of providing care upon a decrease in reimbursement
revenues from federal and state programs.
We
continue to be affected by an industry-wide shortage of qualified center
care-provider personnel and increasing labor costs.
We, and
other providers in the long-term care industry, have had and continue to have
difficulties in retaining qualified personnel to staff our healthcare centers,
particularly nurses, and in such situations we may be required to use temporary
employment agencies to provide additional personnel. The labor costs are
generally higher for temporary employees than for full-time employees. In
addition, many states in which we operate have increased minimum staffing
standards. As minimum staffing standards are increased, we may be required to
retain additional staffing. In addition, in recent years we have experienced
increases in our labor costs primarily due to
11
SUN
HEALTHCARE GROUP, INC. AND SUBSIDIARIES
higher
wages and greater benefits required to attract and retain qualified personnel
and to increase staffing levels in our centers.
A similar
situation exists in the rehabilitation therapy industry. We, and other
providers, have had and continue to have difficulties in hiring a sufficient
number of rehabilitation therapists. Under these circumstances, we, and others
in this industry, have been required to offer higher compensation to attract and
retain these personnel, and we have been forced to rely on independent
contractors, at higher costs, to fulfill our contractual commitments with our
customers. Existing contractual commitments, regulatory limitations and the
market for these services have made it difficult for us to pass through these
increased costs to our customers.
If
we are unable to meet minimum staffing standards, we may be subject to fines or
other sanctions.
Increased
attention to the quality of care provided in skilled nursing facilities has
caused several states to mandate, and other states to consider mandating,
minimum staffing laws that require minimum nursing hours of direct care per
resident per day. These minimum staffing requirements further increase the gap
between demand for and supply of qualified professionals, and lead to higher
labor costs. Failure to comply with minimum staffing
requirements can result in fines and requirements that we provide a plan of
correction. See Item 1 – “Business – Federal and State Regulatory
Oversight.”
Our
ability to satisfy minimum staffing requirements depends upon our ability to
attract and retain qualified healthcare professionals, including nurses,
certified nurse’s assistants and other personnel. Attracting and retaining these
personnel is difficult, given existing shortages of these employees in the labor
markets in which we operate. Furthermore, if states do not appropriate
additional funds (through Medicaid program appropriations or otherwise)
sufficient to pay for any additional operating costs resulting from minimum
staffing requirements, our profitability may be materially adversely
affected.
If
we lose our key management personnel, we may not be able to successfully manage
our business and achieve our objectives.
Our
future success depends in large part upon the leadership and performance of our
executive management team, particularly Richard K. Matros, our chief executive
officer, William A. Mathies, the chief operating officer of our operating
subsidiaries, L. Bryan Shaul, our chief financial officer, and key employees at
the operating level. If we lose the services of one or more of our executive
officers or key employees, or if one or more of them decides to join a
competitor or otherwise compete directly or indirectly with us, we may not be
able to successfully manage our business or achieve our business objectives. If
we lose the services of any of our key employees at the operating or regional
level, we may not be able to replace them with similarly qualified personnel,
which could harm our business.
We
have incurred a significant amount of indebtedness in connection with
acquisition activities, which indebtedness could adversely affect our financial
condition.
As of
December 31, 2009, we had indebtedness of approximately $700.5 million, the
ability to borrow up to $50.0 million under our revolving credit facility and a
$70.0 million letter of credit facility pursuant to which $62.8 million of
letters of credit were outstanding. Our indebtedness could have
adverse consequences, such as requiring us to dedicate a substantial portion of
our cash flows from operations to payments on our debt, limiting our ability to
fund, and potentially increasing the cost of funding, working capital, capital
expenditures, acquisitions and other general corporate requirements and making
us more vulnerable to general adverse economic and industry
conditions. If we fail to comply with the payment requirements
or financial covenants contained in these agreements, we would be required to
seek waivers from our lenders. Seeking these waivers may be difficult
or expensive to obtain and, if we fail to obtain any necessary waivers, which
may be expensive
12
SUN
HEALTHCARE GROUP, INC. AND SUBSIDIARIES
to
obtain, the resulting default would allow the lenders to accelerate the maturity
of the indebtedness, which would have a material adverse affect on our financial
condition. See Item 7 – “Management’s Discussion and Analysis of Financial
Condition and Results of Operations—Loan Agreements.”
The
agreements that govern our indebtedness restrict our activities.
The
indenture governing our senior subordinated notes and the agreement governing
our senior secured credit facilities contain restrictions on our ability to,
among other things, make acquisitions and other investments, pay dividends, and
incur indebtedness and capital expenditures. These restrictions may
significantly adversely affect implementation of future business strategies, or
require us to approach our lenders for consent to allow us to implement such
strategies. Such a consent could be difficult or expensive to
obtain. Our failure to comply with such restrictions and other
covenants could adversely affect our financial condition and our ability to
borrow.
To
the extent that we require additional debt financing in the future, such
financing may have less favorable terms than our current debt
financing.
In the
ordinary course of business, mortgages on our centers may become due and payable
by their terms and we would seek to refinance such mortgages. There
can be no assurance that we will be able to obtain such refinancing on terms
comparable to our current financing, or at all. In addition, the terms of the indenture
governing our senior subordinated notes and our senior secured credit facilities
permit us to incur additional indebtedness, subject to certain
restrictions. Accordingly, we could incur additional indebtedness in
the future and there can be no assurance that we would be able to obtain
such financing on terms comparable to our current financing, or at
all.
We
do not expect to pay any dividends for the foreseeable future.
We are
currently prohibited by the terms of our senior credit facilities from paying
dividends to holders of our common stock, and do not anticipate that we will pay
any dividends to holders of our common stock in the foreseeable future.
Accordingly, investors must rely on sales of their common stock after price
appreciation, which may never occur, as the only way to realize any future gains
on their investment. Investors seeking cash dividends should not purchase our
common stock.
Delaware
law and provisions in our Restated Certificate of Incorporation and Amended and
Restated Bylaws may delay or prevent takeover attempts by third parties and
therefore inhibit our stockholders from realizing a premium on their
stock.
We are
subject to the anti-takeover provisions of Section 203 of the Delaware
General Corporation Law. This section prevents any stockholder who owns 15% or
more of our outstanding common stock from engaging in certain business
combinations with us for a period of three years following the time that the
stockholder acquired such stock ownership unless certain approvals were or are
obtained from our board of directors or the holders of 66 2/3%
of our outstanding common stock. Our Restated Certificate of Incorporation and
Amended and Restated Bylaws also contain several other provisions that may make
it more difficult for a third party to acquire control of us without the
approval of our board of directors. These provisions include, among other
things, (i) advance notice for raising business or making nominations at
meetings, (ii) an affirmative vote of the holders of 66 2/3%
of our outstanding common stock for stockholders to remove directors or amend
our Amended and Restated Bylaws or certain provisions of our Restated
Certificate of Incorporation, and (iii) the ability to issue “blank check”
preferred stock, which our board of directors, without stockholder approval, can
designate and issue with such dividend, liquidation, conversion, voting or other
rights, including the right to issue convertible securities with no limitations
on conversion. The issuance of blank check preferred stock may
13
SUN
HEALTHCARE GROUP, INC. AND SUBSIDIARIES
adversely
affect the voting and other rights of the holders of our common stock as our
board of directors may designate and issue preferred stock with terms that are
senior to our common stock.
Our board
of directors can use these and other provisions to discourage, delay or prevent
a change in the control of our company or a change in our management. Any delay
or prevention of a change of control transaction or a change in our board of
directors or management could deter potential acquirors or prevent the
completion of a transaction in which our stockholders could receive a
substantial premium over the then current market price for their shares. These
provisions could also limit the price that investors might be willing to pay for
shares of our common stock.
We
lease a significant amount of our centers.
We face
risks because of the number of centers that we lease. We currently
lease 112 of our 205 healthcare centers. Our high percentage of leased centers
limits our ability to exit markets. Each of our lease agreements provides that
the lessor may terminate the lease for a number of reasons, including our
default in any payment of rent or taxes or our breach of any covenant or
agreement in the lease. Termination of any of our leases could harm our results
of operations and, as with default under any of our indebtedness, could have a
material adverse impact on our liquidity. Although we believe that we will be
able to renew the existing leases that we wish to extend, there is no assurance
that we will succeed in obtaining extensions in the future at rental rates that
we believe to be reasonable, or at all. Moreover, if some centers should prove
to be unprofitable, we could remain obligated for lease payments even if we
decided to withdraw from those locations. We could incur special charges
relating to the closing of such centers including lease termination costs,
impairment charges and other special charges that would reduce our
profits.
Natural
disasters and other adverse events may harm our centers and
residents.
Our
centers and residents may suffer harm as a result of natural or other causes,
such as storms, earthquakes, floods, fires and other conditions. Such events can
disrupt our operations, negatively affect our revenues, and increase our costs
or result in a future impairment charge. For example, nine of our healthcare
centers are in Florida, which is prone to hurricanes, and 16 of our centers and
our executive offices are in California, which is prone to
earthquakes. In addition, as a result of June 2008 flooding in the
Midwest, one of our centers in Indiana was severely damaged and the operation
was permanently discontinued.
Our
ability to use our net operating losses (“NOLs”) and other tax attributes to
offset future taxable income could be limited by an ownership change and/or
decisions by California and other states to suspend the use of
NOLs.
We have
significant NOLs, tax credits and amortizable goodwill available to offset our
future U.S. federal and state taxable income. Our ability to utilize these NOLs
and other tax attributes may be subject to significant limitations under
Section 382 of the Internal Revenue Code (and applicable state law) if we
undergo an ownership change. An ownership change occurs for purposes of
Section 382 of the Internal Revenue Code if, among other things, 5%
stockholders (i.e., stockholders who own or have owned 5% or more of our stock
(with certain groups of less-than-5% stockholders treated as single stockholders
for this purpose)) increase their aggregate percentage ownership of our stock by
more than fifty percentage points above the lowest percentage of the stock owned
by these stockholders at any time during the relevant testing period. An
issuance of our common stock in connection with acquisitions or for any other
reason can contribute to or result in an ownership change under
Section 382. Stock ownership for purposes of Section 382 of
the Internal Revenue Code is determined under a complex set of attribution
rules, so that a person is treated as owning stock directly, indirectly (i.e.,
through certain entities) and constructively (through certain related persons
and certain unrelated persons acting as a group). In the event of an ownership
change, Section 382 imposes an annual limitation
14
SUN
HEALTHCARE GROUP, INC. AND SUBSIDIARIES
(based
upon our value at the time of the ownership change, as determined under
Section 382 of the Internal Revenue Code) on the amount of taxable income
and tax liabilities a corporation may offset with NOLs and other tax attributes,
such as tax credit carryforwards. Any unused annual limitation may be carried
over to later years until the applicable expiration date for the respective NOL
and tax credit carryforwards. As a result, our inability to utilize these NOLs
or credits as a result of any ownership changes, could adversely impact our
operating results and financial condition.
In
addition, California and certain states have suspended use of NOLs for certain
taxable years, and other states are considering similar measures. As a result,
we may incur higher state income tax expense in the future. Depending on our
future tax position, continued suspension of our ability to use NOLs in states
in which we are subject to income tax could have an adverse impact on our
operating results and financial condition.
Failure
to maintain effective internal control over our financial reporting could have
an adverse effect on our ability to report our financial results on a timely and
accurate basis.
We are
required to maintain internal control over financial reporting pursuant to Rule
13a-15 under the Exchange Act. See Item 9A – “Controls and
Procedures.” Failure to maintain such controls could result in
misstatements in our financial statements and potentially subject us to
sanctions or investigations by the Securities and Exchange Commission or other
regulatory authorities or could cause us to delay the filing of required reports
with the Securities and Exchange Commission and our reporting of financial
results. Any of these events could result in a decline in the price of our
common stock. Although we have taken steps to maintain our internal
control structure as required, we cannot assure you that
control deficiencies will not result in a misstatement in the
future.
Item
1B. Unresolved Staff Comments
None.
Item
2. Properties
Inpatient
Services
As of
December 31, 2009, our subsidiaries operated 205 nursing and rehabilitation
centers, assisted living centers and independent living centers. The 205 centers
are comprised of 112 properties that are leased and 93 properties that are
owned. We hold options to acquire, at fair value or at a set purchase price,
ownership of 21 of the centers that we currently lease, of which options on five
centers are exercisable or will become exercisable by December 31, 2011.
Administrative office space was leased for our inpatient segment in 18 locations
in 13 states, and for our hospice operations we leased office space for
administrative purposes in 22 locations in ten states. We generally
consider our properties to be in good operating condition and suitable for the
purposes for which they are being used. Our leased centers are subject to
long-term operating leases or subleases which require us, among other things, to
fund all applicable capital expenditures, taxes, insurance and maintenance
costs. The annual rent payable under most of the leases generally increases
based on a fixed percentage or increases in the U.S. Consumer Price Index. Many
of the leases contain renewal options to extend the term. Many of our owned
centers are subject to mortgages that may contain requirements that we spend a
certain amount to maintain the properties.
In
addition to the healthcare centers described above, we divested one healthcare
center in 2009. We continue to review our operations to identify centers and
operations that do not perform at an appropriate level.
15
SUN
HEALTHCARE GROUP, INC. AND SUBSIDIARIES
Our
aggregate occupancy percentage for all of our nursing and rehabilitation,
assisted living, independent living and mental health centers was 88.1% for the
year ended December 31, 2009. Our occupancy was 88.9% and 89.8% for the years
ended December 31, 2008 and 2007, respectively. The percentages were
computed by dividing the average daily number of beds occupied by the total
number of available beds for use during the periods indicated (beds of acquired
centers are included in the computation following the date of acquisition only).
However, we believe that occupancy percentages, either individually or in the
aggregate, should not be relied upon alone to determine the performance of a
center. Other factors that may impact the performance of a center include, among
other things, the sources of payment, terms of reimbursement and the acuity
level of the patients.
The
following table sets forth certain information concerning the 205 centers in our
continuing operations as of December 31, 2009, which consisted of 183
skilled nursing centers, 14 assisted living and independent living centers and
eight mental health centers.
|
Number
of Licensed Beds/Units(1)
|
||||||||||
|
Total
|
Assisted/
|
|||||||||
|
Number
of
|
Skilled
|
Independent
|
Mental
|
|||||||
|
State
|
Centers
|
Nursing
|
Living
|
Health
|
Total
|
|||||
|
Ohio
|
17
|
2,392
|
-
|
-
|
2,392
|
|||||
|
Massachusetts
|
18
|
1,803
|
57
|
-
|
1,860
|
|||||
|
Kentucky
|
20
|
1,622
|
211
|
-
|
1,833
|
|||||
|
New
Hampshire
|
15
|
1,131
|
474
|
-
|
1,605
|
|||||
|
Connecticut
|
10
|
1,327
|
72
|
-
|
1,399
|
|||||
|
California
|
15
|
858
|
-
|
473
|
1,331
|
|||||
|
Oklahoma
|
9
|
1,110
|
143
|
60
|
1,313
|
|||||
|
Colorado
|
9
|
1,203
|
97
|
-
|
1,300
|
|||||
|
Idaho
|
10
|
951
|
163
|
22
|
1,136
|
|||||
|
Florida
|
9
|
1,120
|
-
|
-
|
1,120
|
|||||
|
New
Mexico
|
12
|
890
|
176
|
-
|
1,066
|
|||||
|
Georgia
|
9
|
1,002
|
32
|
-
|
1,034
|
|||||
|
North
Carolina
|
8
|
930
|
44
|
-
|
974
|
|||||
|
Alabama
|
7
|
757
|
26
|
-
|
783
|
|||||
|
West
Virginia
|
7
|
739
|
-
|
-
|
739
|
|||||
|
Tennessee
|
8
|
693
|
22
|
-
|
715
|
|||||
|
Montana
|
5
|
538
|
112
|
-
|
650
|
|||||
|
Washington
|
6
|
513
|
36
|
-
|
549
|
|||||
|
Maryland
|
3
|
434
|
-
|
-
|
434
|
|||||
|
Rhode
Island
|
2
|
261
|
-
|
-
|
261
|
|||||
|
Indiana
|
2
|
208
|
-
|
-
|
208
|
|||||
|
New
Jersey
|
1
|
176
|
-
|
-
|
176
|
|||||
|
Arizona
|
1
|
161
|
-
|
-
|
161
|
|||||
|
Utah
|
1
|
120
|
-
|
-
|
120
|
|||||
|
Wyoming
|
1
|
46
|
-
|
-
|
46
|
|||||
|
Total
|
205
|
20,985
|
1,665
|
555
|
23,205
|
|||||
|
(1)
|
“Licensed
Beds” refers to the number of beds for which a license has been issued,
which may vary in some instances from licensed beds available
for use, which is used in the computation of occupancy. Available beds for
the 205 centers were 22,423.
|
16
SUN
HEALTHCARE GROUP, INC. AND SUBSIDIARIES
Rehabilitation
Therapy Services
As of
December 31, 2009, we leased offices and patient care delivery sites in 37
locations in 11 states to operate our rehabilitation therapy
businesses.
Medical
Staffing Services
As of
December 31, 2009, we leased offices in 43 locations in 17 states to operate our
medical staffing business.
Corporate
We lease
our executive offices in Irvine, California. We also own three corporate office
buildings and lease office space in a fourth building in Albuquerque, New
Mexico.
Item
3. Legal Proceedings
For a
description of our legal proceedings, see Note 13(a) – “Other Events –
Litigation” of our consolidated financial statements included in this Annual
Report on Form 10-K, which is incorporated by reference to this
item.
PART
II
Item
5. Market for Registrant's Common Equity, Related Stockholder Matters
and Issuer Purchases of Equity Securities
Our
common stock trades under the symbol “SUNH” on The NASDAQ Global Select Market.
The following table shows the high and low sale prices for the common stock as
reported by The NASDAQ Global Select Market for the periods
indicated.
|
High
|
Low
|
|||
|
2009
|
||||
|
Fourth
Quarter
|
$
|
9.88
|
$
|
8.23
|
|
Third
Quarter
|
$
|
10.00
|
$
|
7.80
|
|
Second
Quarter
|
$
|
10.75
|
$
|
7.39
|
|
First
Quarter
|
$
|
12.74
|
$
|
7.50
|
|
2008
|
||||
|
Fourth
Quarter
|
$
|
16.10
|
$
|
7.98
|
|
Third
Quarter
|
$
|
18.00
|
$
|
12.68
|
|
Second
Quarter
|
$
|
15.46
|
$
|
12.13
|
|
First
Quarter
|
$
|
18.78
|
$
|
11.72
|
There
were approximately 4,538 holders of record of our common stock as of March 2,
2010. We have not paid dividends on our common stock and do not anticipate
paying dividends in the foreseeable future. Our senior credit facilities
prohibit us from paying any dividends or making any distributions to our
stockholders. Any future determination to pay dividends will be at the
discretion of our board of directors and will be dependent upon our financial
condition, results of operations, capital requirements and other factors as our
board of directors deems relevant.
17
SUN
HEALTHCARE GROUP, INC. AND SUBSIDIARIES
STOCK
PRICE PERFORMANCE GRAPH
The
following graph and chart compare the cumulative total stockholder return for
the period from December 31, 2004 through December 31, 2009 assuming $100
was invested on December 31, 2004 in (i) our common stock, (ii) the
Standard & Poor’s 500 Stock Index (“S&P 500 Index”) and (iii) the
Hemscott Long-Term Care Index. Cumulative total stockholder return assumes the
reinvestment of all dividends. Stock price performances shown in the graph are
not necessarily indicative of future price performances.
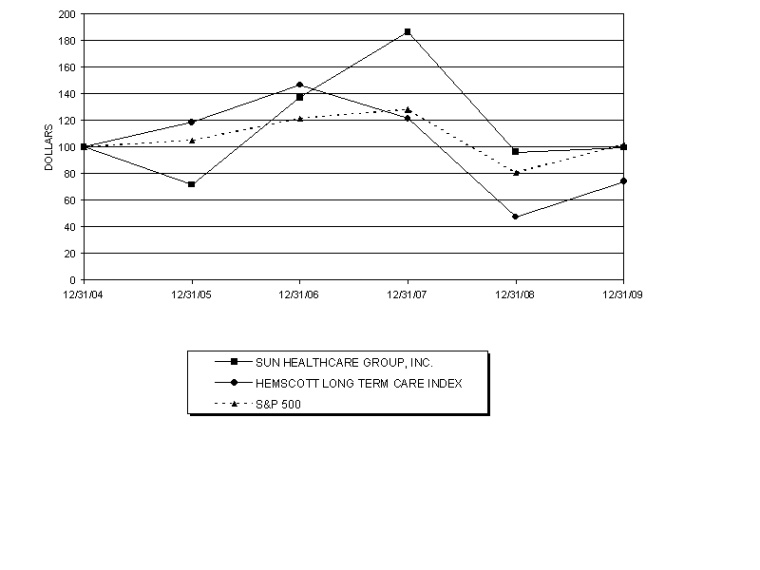
|
12/31/04
|
12/31/05
|
12/31/06
|
12/31/07
|
12/31/08
|
12/31/09
|
|
|
Sun
Healthcare Group, Inc.
|
$ 100.00
|
$ 71.76
|
$ 137.12
|
$ 186.41
|
$ 96.08
|
$ 99.55
|
|
Long-Term
Care Index
|
100.00
|
118.61
|
146.79
|
121.47
|
47.37
|
74.01
|
|
S&P
500 Index
|
100.00
|
104.91
|
121.48
|
128.16
|
80.74
|
102.11
|
The
above performance graph shall not be deemed to be soliciting material or to be
filed with the Securities and Exchange Commission under the Securities Act of
1933 or the Securities Exchange Act of 1934 or incorporated by reference in any
document so filed.
18
SUN
HEALTHCARE GROUP, INC. AND SUBSIDIARIES
Item
6. Selected Financial Data
The
following selected consolidated financial data for the periods indicated have
been derived from our consolidated financial statements. The
financial data set forth below should be read in connection with Item 7 –
“Management's Discussion and Analysis of Financial Condition and Results of
Operations” and with our consolidated financial statements and related notes
thereto (in thousands, except per share data and percentages):
|
At
or For the Year Ended December 31,
|
|||||||||||||||
|
2009
(1)
|
2008
(2)
|
2007
(3)
|
2006
(4)
|
2005
(5)
|
|||||||||||
|
Total
net revenues
|
$
|
1,881,799
|
$
|
1,823,503
|
$
|
1,557,756
|
$
|
982,658
|
$
|
716,048
|
|||||
|
Income
(loss) before income taxes
|
|||||||||||||||
|
and
discontinued operations
|
72,096
|
66,576
|
43,179
|
11,259
|
(3,290
|
)
|
|||||||||
|
Income
(loss) from continuing
|
|||||||||||||||
|
operations
|
42,480
|
113,924
|
54,093
|
11,473
|
(2,504
|
)
|
|||||||||
|
(Loss)
income from discontinued
|
|||||||||||||||
|
operations
|
(3,809
|
)
|
(4,637
|
)
|
3,417
|
15,645
|
27,265
|
||||||||
|
Net
income
|
$
|
38,671
|
$
|
109,287
|
$
|
57,510
|
$
|
27,118
|
$
|
24,761
|
|||||
|
Basic
earnings per common and common equivalent share:
|
|||||||||||||||
|
Income
(loss) from continuing
|
|||||||||||||||
|
operations
|
$
|
0.97
|
$
|
2.63
|
$
|
1.28
|
$
|
0.36
|
$
|
(0.16
|
)
|
||||
|
(Loss)
income from discontinued
|
|||||||||||||||
|
operations
|
(0.09
|
)
|
(0.11
|
)
|
0.08
|
0.50
|
1.71
|
||||||||
|
Net
income
|
$
|
0.88
|
$
|
2.52
|
$
|
1.36
|
$
|
0.86
|
$
|
1.55
|
|||||
|
Diluted
earnings per common and common equivalent share:
|
|||||||||||||||
|
Income
(loss) from continuing
|
|||||||||||||||
|
operations
|
$
|
0.97
|
$
|
2.59
|
$
|
1.25
|
$
|
0.36
|
$
|
(0.16
|
)
|
||||
|
(Loss)
income from discontinued
|
|||||||||||||||
|
operations
|
(0.09
|
)
|
(0.10
|
)
|
0.08
|
0.49
|
1.71
|
||||||||
|
Net
income
|
$
|
0.88
|
$
|
2.49
|
$
|
1.33
|
$
|
0.85
|
$
|
1.55
|
|||||
|
Weighted
average number of common and common equivalent shares:
|
|||||||||||||||
|
Basic
|
43,841
|
43,331
|
42,350
|
31,638
|
16,003
|
||||||||||
|
Diluted
|
43,963
|
43,963
|
43,390
|
31,788
|
16,003
|
||||||||||
|
Working
capital (deficit)
|
$
|
175,604
|
$
|
172,145
|
$
|
83,721
|
$
|
96,245
|
$
|
(62,786
|
)
|
||||
|
Total
assets
|
$
|
1,571,194
|
$
|
1,543,334
|
$
|
1,373,826
|
$
|
621,423
|
$
|
512,306
|
|||||
|
Long-term
debt and capital lease obligations, including current
portion
|
$
|
700,548
|
$
|
725,841
|
$
|
729,268
|
$
|
174,165
|
$
|
197,779
|
|||||
|
Stockholders'
equity (deficit)
|
$
|
449,064
|
$
|
403,709
|
$
|
246,256
|
$
|
144,133
|
$
|
(2,895
|
)
|
||||
|
Supplemental
Financial Information:
|
|||||||||||||||
|
EBITDA
(6)
|
$
|
166,886
|
$
|
161,533
|
$
|
118,744
|
$
|
44,013
|
$
|
16,721
|
|||||
|
EBITDA
margin (6)
|
8.9
|
%
|
8.9
|
%
|
7.6
|
%
|
4.5
|
%
|
2.3
|
%
|
|||||
|
Adjusted
EBITDA (6)
|
$
|
168,232
|
$
|
160,557
|
$
|
121,941
|
$
|
45,161
|
$
|
17,588
|
|||||
|
Adjusted
EBITDA margin (6)
|
8.9
|
%
|
8.8
|
%
|
7.8
|
%
|
4.6
|
%
|
2.5
|
%
|
|||||
|
Adjusted
EBITDAR (6)
|
$
|
241,381
|
$
|
234,158
|
$
|
192,353
|
$
|
96,575
|
$
|
51,353
|
|||||
|
Adjusted
EBITDAR margin (6)
|
12.8
|
%
|
12.8
|
%
|
12.3
|
%
|
9.8
|
%
|
7.2
|
%
|
|||||
19
SUN
HEALTHCARE GROUP, INC. AND SUBSIDIARIES
|
(1)
|
Results
for the year ended December 31, 2009 include an increase of $8.2 million
of self-insurance reserves for general and professional liability and
workers’ compensation related to prior years’ continuing operations, $1.3
million of restructuring costs and $0.5 million of transaction costs
related to a hospice acquisition.
|
|
(2)
|
Results
for the year ended December 31, 2008 include a full year of revenues and
expenses of Harborside Healthcare Corporation (“Harborside”), which was
acquired on April 1, 2007 (see Note 6 – “Acquisitions” in our consolidated
financial statements included in this Annual Report on Form 10-K), a
release of $70.5 million of deferred tax valuation allowance, an increase
of $0.9 million of self-insurance reserves for general and professional
liability and workers’ compensation related to prior years’ continuing
operations, and a gain of $0.9 million related to the sale of non-core
business assets.
|
|
(3)
|
Results
for the year ended December 31, 2007 include the revenues and expenses of
the Harborside centers since April 1, 2007 (see Note 6 – “Acquisitions” in
our consolidated financial statements included in this Annual Report on
Form 10-K), a release of $28.8 million of deferred tax valuation
allowance, a reduction of $8.6 million of self-insurance reserves for
general and professional liability and workers’ compensation related to
prior years’ continuing operations, and a charge of $3.2 million related
to the early extinguishment of debt.
|
|
(4)
|
Results
for the year ended December 31, 2006 include an $11.7 million release of
self-insurance reserves for general and professional liability and
workers’ compensation related to prior years’ continuing operations, a
$2.5 million non-cash charge to account for certain lease rate escalation
clauses (see Note 2 – “Summary of Significant Accounting Policies” in our
consolidated financial statements included in this Annual Report on Form
10-K), a net loss on sale of assets of $0.2 million and a $1.0 million
charge for the termination of a management contract associated with the
acquisition of hospice operations. Income from discontinued
operations of $14.7 million was primarily comprised of: (i) a $6.8 million
gain from the sale of our home health operations in the fourth quarter of
2006, (ii) a net $6.0 million reduction of reserves for self-insurance for
general and professional liability and workers’ compensation for prior
years on divested centers, (iii) a $4.2 million non-cash gain primarily
related to the sale in July 2003 of our pharmaceutical services
operations, and (iv) a $1.3 million gain on the sale of one of our
healthcare centers in fourth quarter of 2006, offset in part by (v) a $3.6
million non-cash charge for closed centers with a continuing rent
obligation, (vi) a net $2.0 million gain from divested operations from
inpatient services and home health services, (vii) a $0.2 million loss
related to the discontinued clinical laboratory and radiology operations,
and (viii) a $1.8 million net tax provision for discontinued
operations.
|
|
(5)
|
Results
for the year ended December 31, 2005 include revenues and expenses of
centers acquired in December 2005 for that month, a $6.8 million release
of self-insurance reserves for general and professional liability and
workers’ compensation related to prior years’ continuing operations, a
$1.1 million non-cash charge for acquisition costs, a net loss on sale of
assets of $0.4 million primarily due to a write-down of a property held
for sale, a net loss on extinguishment of debt of $0.4 million related to
mortgage restructurings. Income from discontinued operations
was $27.1 million due primarily to net reductions of $14.6 million in
self-insurance reserves for general and professional liability and
workers' compensation for prior years on divested centers and an $8.9
million gain from disposal of discontinued operations primarily due to
receipt in September 2005 of $7.7 million in cash proceeds from the 2003
sale of our pharmaceutical services operations, pursuant to the terms of
the sale agreement.
|
20
SUN
HEALTHCARE GROUP, INC. AND SUBSIDIARIES
|
(6)
|
We
define EBITDA as net income before loss (gain) on discontinued operations,
interest expense (net of interest income), income tax expense (benefit),
depreciation and amortization. EBITDA margin is EBITDA as a
percentage of revenue. Adjusted EBITDA is EBITDA adjusted for
the following:
·
gain (loss) on sale of asset, net
·
restructuring costs
·
loss on extinguishment of debt, net
·
loss on contract termination
·
loss on asset impairment
Adjusted
EBITDA margin is Adjusted EBITDA as a percentage of
revenue. Adjusted EBITDAR is Adjusted EBITDA before center rent
expense. Adjusted EBITDAR margin is Adjusted EBITDAR as a
percentage of revenue. We believe that the presentation of EBITDA,
Adjusted EBITDA and Adjusted EBITDAR provides useful information regarding
our operational performance because they enhance the overall understanding
of the financial performance and prospects for the future of our core
business activities.
Specifically,
we believe that a presentation of EBITDA, Adjusted EBITDA and Adjusted
EBITDAR provides consistency in our financial reporting and provides a
basis for the comparison of results of core business operations between
our current, past and future periods. EBITDA, Adjusted EBITDA
and Adjusted EBITDAR are three of the primary indicators we use for
planning and forecasting in future periods, including trending and
analyzing the core operating performance of our business from
period-to-period without the effect of U.S. generally accepted accounting
principles, or GAAP, expenses, revenues and gains that are unrelated to
the day-to-day performance of our business. We also use EBITDA, Adjusted
EBITDA and Adjusted EBITDAR to benchmark the performance of our business
against expected results, analyzing year-over-year trends as described
below and to compare our operating performance to that of our
competitors.
In
addition to other financial measures, including net segment income, we use
EBITDA, Adjusted EBITDA and Adjusted EBITDAR to assess the performance of
our core business operations, to prepare operating budgets and to measure
our performance against those budgets on a consolidated, segment and a
center-by-center level. EBITDA, Adjusted EBITDA and Adjusted
EBITDAR are useful in this regard because they do not include such costs
as interest expense (net of interest income), income taxes, depreciation
and amortization expense and special charges, which may vary from business
unit to business unit and period-to-period depending upon various factors,
including the method used to finance the business, the amount of debt that
we have determined to incur, whether a center is owned or leased, the date
of acquisition of a facility or business, the original purchase price of a
facility or business unit or the tax law of the state in which a business
unit operates. These types of charges are dependent on factors unrelated
to our underlying business. As a result, we believe that the use of
EBITDA, Adjusted EBITDA and Adjusted EBITDAR provides a meaningful and
consistent comparison of our underlying business between periods by
eliminating certain items required by GAAP which have little or no
significance in our day-to-day operations.
We
also make capital allocations to each of our centers based on expected
EBITDA returns and establish compensation programs and bonuses for our
center-level employees that are based upon the achievement of
pre-established EBITDA and Adjusted EBITDA targets.
Despite
the importance of these measures in analyzing our underlying business,
maintaining our financial requirements, designing incentive compensation
and for our goal setting both on an aggregate and facility level basis,
EBITDA, Adjusted EBITDA and Adjusted EBITDAR are non-GAAP financial
measures that have no standardized meaning defined by GAAP. As
the items excluded from EBITDA, Adjusted EBITDA and Adjusted EBITDAR are
|
21
SUN
HEALTHCARE GROUP, INC. AND SUBSIDIARIES
significant
components in understanding and assessing our financial performance, EBITDA,
Adjusted EBITDA and Adjusted EBITDAR should not be considered in isolation or as
alternatives to net income, cash flows generated by or used in operating,
investing or financing activities or other financial statement data presented in
the consolidated financial statements as indicators of financial performance or
liquidity. Therefore, our EBITDA, Adjusted EBITDA and Adjusted
EBITDAR measures have limitations as analytical tools, and they should not be
considered in isolation, or as a substitute for analysis of our results as
reported under GAAP. Some of these limitations are:
· they do not
reflect our cash expenditures, or future requirements for capital expenditures,
or contractual commitments;
· they do not
reflect changes in, or cash requirements for, our working capital
needs;
· they do not
reflect the interest expense, or the cash requirements necessary to service
interest or principal payments,
on our debt;
· they do not
reflect any income tax payments we may be required to make;
· although
depreciation and amortization are non-cash charges, the assets being depreciated
and amortized will often
have to be replaced in the future, and EBITDA, Adjusted EBITDA and
Adjusted EBITDAR do not reflect any cash
requirements for such replacements;
· they are not
adjusted for all non-cash income or expense items that are reflected in our
consolidated statements of cash
flows;
· they do not
reflect the impact on earnings of charges resulting from certain matters we
consider not to be indicative of
our ongoing operations; and
· other
companies in our industry may calculate these measures differently than we do,
which may limit their usefulness
as comparative measures.
We
compensate for these limitations by using EBITDA, Adjusted EBITDA and Adjusted
EBITDAR only to supplement net income on a basis prepared in conformance with
GAAP in order to provide a more complete understanding of the factors and trends
affecting our business. We strongly encourage investors to consider net income
determined under GAAP as compared to EBITDA, Adjusted EBITDA and Adjusted
EBITDAR, and to perform their own analysis, as appropriate.
22
SUN
HEALTHCARE GROUP, INC. AND SUBSIDIARIES
The
following table provides a reconciliation of our net income (loss), which is the
most directly comparable financial measure presented in accordance with GAAP for
the periods indicated, to EBITDA, Adjusted EBITDA and Adjusted EBITDAR (in
thousands):
|
For
the Years Ended December 31,
|
|||||||||||||||||||||
|
2009
|
2008
|
2007
|
2006
|
2005
|
|||||||||||||||||
|
Net
income
|
$ | 38,671 | $ | 109,287 | $ | 57,510 | $ | 27,118 | $ | 24,761 | |||||||||||
|
Plus:
|
|||||||||||||||||||||
|
Income
(loss) from discontinued operations
|
3,809 | 4,637 | (3,417 | ) | (15,646 | ) | (27,266 | ) | |||||||||||||
|
Interest
expense, net of interest income
|
49,327 | 54,603 | 44,347 | 18,179 | 11,775 | ||||||||||||||||
|
Income
tax expense (benefit)
|
29,616 | (47,348 | ) | (10,914 | ) | (214 | ) | (786 | ) | ||||||||||||
|
Depreciation
and amortization
|
45,463 | 40,354 | 31,218 | 14,576 | 8,237 | ||||||||||||||||
|
EBITDA
|
$ | 166,886 | $ | 161,533 | $ | 118,744 | $ | 44,013 | $ | 16,721 | |||||||||||
|
Plus:
|
|||||||||||||||||||||
|
Gain
(loss) on sale of assets, net
|
42 | (976 | ) | 24 | 173 | 384 | |||||||||||||||
|
Restructuring
costs
|
1,304 | - | - | - | 122 | ||||||||||||||||
|
Loss
on extinguishment of debt
|
- | - | 3,173 | - | - | ||||||||||||||||
|
Loss
on contract termination
|
- | - | - | 975 | - | ||||||||||||||||
|
Loss
on asset impairment
|
- | - | - | - | 361 | ||||||||||||||||
|
Adjusted
EBITDA
|
$ | 168,232 | $ | 160,557 | $ | 121,941 | $ | 45,161 | $ | 17,588 | |||||||||||
|
Plus:
|
|||||||||||||||||||||
|
Center
rent expense
|
73,149 | 73,601 | 70,412 | 51,414 | 33,765 | ||||||||||||||||
|
Adjusted
EBITDAR
|
$ | 241,381 | $ | 234,158 | $ | 192,353 | $ | 96,575 | $ | 51,353 | |||||||||||
Item 7. Management's Discussion and Analysis of Financial Condition and Results of Operations
The
following discussion should be read in conjunction with the consolidated
financial statements and accompanying notes, which appear elsewhere in this
Annual Report. This discussion contains forward-looking statements that involve
risks and uncertainties. Our actual results could differ materially from those
anticipated in these forward-looking statements as a result of various factors,
including those discussed below and elsewhere in this Annual Report. See Item 1A
– “Risk Factors.”
Overview
Our
subsidiaries provide long-term, subacute and related specialty healthcare
services primarily to the senior population in the United States. We were
engaged in the following three principal business segments during
2009:
|
Ø
|
inpatient
services, primarily skilled nursing
centers;
|
|
Ø
|
rehabilitation
therapy services; and
|
|
Ø
|
medical
staffing services.
|
Commencing
in 2005, we implemented a business strategy to leverage our existing platform,
and in December 2005, we acquired an operator of 56 skilled nursing
centers and independent and assisted living residences and a small hospice
operation. In 2006, we continued this strategy by purchasing a
hospice company now known as SolAmor. In April 2007, we acquired
Harborside, an operator of 73 skilled nursing centers, one assisted living
center and one independent living center with approximately 9,000 licensed beds
in ten states. Harborside’s results of operations
have been included in our consolidated financial statements since April 1,
2007.
23
SUN
HEALTHCARE GROUP, INC. AND SUBSIDIARIES
We
periodically review our operations and portfolio of facilities to determine if
any of these operations or assets no longer fit with our business
strategies. This review has resulted in dispositions of certain
assets and operations.
In 2006,
we sold a subsidiary that provided skilled home health care, non-skilled home
care and pharmacy services. During 2007, we sold our 75% interest in
a home health services subsidiary and we sold our remaining laboratory and
radiology business.
During
2008, we reclassified six skilled nursing centers into discontinued operations
because they were divested, sold or qualified as assets held for sale. In 2008,
we sold two hospitals that were classified as held for sale since 2007;
exercised an option to purchase a skilled nursing center that was classified as
held for sale since 2007 and simultaneously sold the asset; exercised options to
purchase two skilled nursing centers that were classified as held for sale and
sold those centers and a third center; transferred operations of two leased
skilled nursing centers, and sold a regional provider
of adolescent rehabilitation and special education services.
During
2009, we reclassified an assisted living facility into discontinued
operations. We elected not to renew the lease of the assisted living
facility and allowed operations to transfer to another operator. We
also closed a leased skilled nursing center and transferred the remaining
residents to other centers.
We have
updated our historical financial statements to reflect the reclassification of
one assisted living center to discontinued operations during the year ended
December 31, 2009. U.S. generally accepted accounting principles
(“GAAP”) require that these operations be reclassified as discontinued
operations on a retroactive basis. The financial information in this Annual
Report reflects that reclassification for all periods since January 1,
2005.
Revenues
from Medicare, Medicaid and Other Sources
We
receive revenues from Medicare, Medicaid, commercial insurance, self-pay
residents, other third party payors and healthcare centers that utilize our
specialty medical services. The sources and amounts of our inpatient services
revenues are determined by a number of factors, including the number of licensed
beds and occupancy rates of our centers, the acuity level of patients and the
rates of reimbursement among payors. Federal and state governments continue to
focus on methods to curb spending on health care programs such as Medicare and
Medicaid, and pressures on state budgets resulting from the recent adverse
economic conditions in the United States may intensify these efforts. This focus
has not been limited to skilled nursing centers, but includes specialty services
provided by us, such as skilled therapy services, to third parties. We cannot at
this time predict the extent to which proposals limiting federal or state
expenditures will be adopted or, if adopted and implemented, what effect, if
any, such proposals will have on us. Efforts to impose reduced coverage, greater
discounts and more stringent cost controls by government and other payors are
expected to continue.
In
addition, due to recent adverse economic conditions, we have experienced reduced
demand for the specialty services that we provide to third
parties. If economic conditions do not improve or worsen, we may
experience additional reductions in demand for the specialty services we
provide. We are unable at this time to predict the impact or extent
of such reduced demand.
24
SUN
HEALTHCARE GROUP, INC. AND SUBSIDIARIES
The
following table sets forth the total nonaffiliated revenues and percentage of
revenues by payor source for our continuing operations, on a consolidated and on
an inpatient operations only basis, for the periods indicated (data includes
revenues for acquired centers following the date of acquisition
only):
|
For
the Years Ended
|
||||||||||||||||||
|
Sources
of Revenues
|
December
31, 2009
|
December
31, 2008
|
December
31, 2007
|
|||||||||||||||
|
(dollars
in thousands)
|
||||||||||||||||||
|
Consolidated:
|
||||||||||||||||||
|
Medicaid
|
$
|
753,393
|
40.0
|
%
|
$
|
729,014
|
40.0
|
%
|
$
|
645,084
|
41.4
|
%
|
||||||
|
Medicare
|
555,593
|
29.5
|
522,555
|
28.7
|
418,665
|
26.9
|
||||||||||||
|
Private
pay and other
|
471,218
|
25.1
|
480,243
|
26.3
|
436,556
|
27.9
|
||||||||||||
|
Managed
care and
|
||||||||||||||||||
|
commercial
insurance
|
101,595
|
5.4
|
91,691
|
5.0
|
57,451
|
3.8
|
||||||||||||
|
Total
|
$
|
1,881,799
|
100.0
|
%
|
$
|
1,823,503
|
100.0
|
%
|
$
|
1,557,756
|
100.0
|
%
|
||||||
|
Inpatient
Only:
|
||||||||||||||||||
|
Medicaid
|
$
|
753,260
|
44.9
|
%
|
$
|
728,882
|
45.1
|
%
|
$
|
644,959
|
47.2
|
%
|
||||||
|
Medicare
|
539,339
|
32.2
|
510,013
|
31.6
|
410,365
|
30.0
|
||||||||||||
|
Private
pay and other
|
282,300
|
16.9
|
286,025
|
17.7
|
255,075
|
18.6
|
||||||||||||
|
Managed
care and
|
||||||||||||||||||
|
commercial
insurance
|
100,876
|
6.0
|
91,139
|
5.6
|
57,000
|
4.2
|
||||||||||||
|
Total
|
$
|
1,675,775
|
100.0
|
%
|
$
|
1,616,059
|
100.0
|
%
|
$
|
1,367,399
|
100.0
|
%
|
||||||
Medicare
Medicare
is available to nearly every United States citizen 65 years of age and
older. It is a broad program of health insurance designed to help the nation’s
elderly meet hospital, hospice, home health and other health care costs. Health
insurance coverage extends to certain persons under age 65 who qualify as
disabled or those having end-stage renal disease. Medicare is comprised of four
related health insurance programs. Medicare Part A provides for
inpatient services including hospital, skilled long-term care, hospice and home
healthcare. Medicare Part B provides for outpatient services
including physicians’ services, diagnostic service, durable medical
equipment, skilled therapy services and medical supplies. Medicare
Part C is a managed care option (“Medicare Advantage”) for beneficiaries who are
entitled to Part A and enrolled in Part B. Medicare Part D is a
benefit that provides prescription drug benefits for both Medicare and
Medicare/Medicaid dually eligible patients.
Medicare
reimburses our skilled nursing centers for Medicare Part A services under the
Prospective Payment System (“PPS”) as defined by the Balanced Budget Act of 1997
and subsequently refined in 1999, 2000 and 2005. PPS regulations
predetermine a payment amount per patient, per day, based on the 1995 costs of
treating patients indexed forward. The amount to be paid is determined by
classifying each patient into one of 53 Resource Utilization Group (“RUG”)
categories that are based upon each patient’s acuity level.
CMS has
announced that it expects to expand RUG categories to 66, effective October 1,
2010. At the same time it is implementing a new patient assessment
tool for the collection of clinical data to be used for classification into the
RUG categories. We are unable to estimate the effect that the new RUG
categories and the new assessment tool will have on our Medicare
revenues.
On July
31, 2008, the Centers for Medicare and Medicaid Services (“CMS”) issued
a final rule to implement a 3.4% market basket increase for the
2009 federal fiscal year, which commenced on October 1,
25
SUN
HEALTHCARE GROUP, INC. AND SUBSIDIARIES
2008. The
rule also contained an update of the wage indices. The net impact of
these changes was approximately a 3.3% increase in our reimbursement rates,
which resulted in increased revenues of approximately $3.8 million per
quarter.
On July
31, 2009, CMS issued its final rule for skilled nursing facilities for the 2010
federal fiscal year, which commenced on October 1, 2009. This rule
provides for a market basket increase of 2.2% in our reimbursement rates and a
3.3% reduction for a forecast error/parity adjustment. We estimate
that the net result of the two adjustments, based on our current acuity mix,
will be a decrease of 0.85% in our reimbursement rates, which we estimate will
decrease our net revenues by approximately $1.0 million per
quarter.
In
addition to the changes that affect the upcoming 2010 federal fiscal year, the
rule also contains provisions for the 2011 federal fiscal year, which commences
on October 1, 2010. We are not able to predict whether these changes
will occur but are able to confirm that CMS has determined that the changes will
be budget neutral.
The
following table sets forth the average amounts of inpatient Medicare Part A
revenues per patient, per day, recorded by our healthcare centers for the years
ended December 31 (data includes revenues for acquired centers following the
date of acquisition only):
|
2009
|
2008
|
2007
|
|||
|
$
|
455.00
|
$
|
424.19
|
$
|
391.50
|
Under
current law, there are limits on reimbursement provided under Medicare Part B
for therapy services. An automatic exception was in place for
patients residing in skilled nursing centers until December 31,
2009. Legislation is pending in Congress to extend the
exception. If the exception is not extended, revenues from therapy
services provided to our residents and residents of non-affiliated nursing
centers in which we provide therapy services will be adversely
affected.
We
receive Medicare reimbursements for hospice care at daily or hourly rates based
on the level of care furnished to the patient. Our ability to receive
Medicare reimbursement for our hospice services is subject to two
limitations:
|
|
·
|
If
inpatient days of care provided to all patients at a hospice exceed 20% of
the total days of hospice care provided by that hospice for an annual
period, then payment for days in excess of this limit are paid for at the
routine home care rate. None of our hospice programs exceeded
the payment limits on inpatient services for 2009 or
2008.
|
|
|
·
|
Overall
payments made by Medicare on a per hospice program basis are subject to a
cap amount at the end of an annual period. The cap amount is
calculated by multiplying the number of
first time Medicare hospice beneficiaries during the year by the Medicare
per beneficiary cap amount, resulting in that hospice’s aggregate cap,
which is the allowable amount of total Medicare payments that hospice can
receive for that cap year. If a hospice program exceeds its
aggregate cap, then the hospice must repay the excess. In 2009,
only one of our hospice programs exceeded the Medicare cap
limit. The amount in excess of the aggregate cap was
immaterial.
|
On July
31, 2009, CMS also issued its final rule for hospice services for the 2010
federal fiscal year. The rule includes a market basket increase of
2.1% and a 0.7% decrease resulting from a phase out of the wage index budget
neutrality factor. We estimate that the net impact on our hospice
service operations of these two adjustments will be an increase of 1.52% in our
reimbursement rates, which we estimate will result in increased revenues of
approximately $0.1 million per quarter.
26
SUN
HEALTHCARE GROUP, INC. AND SUBSIDIARIES
Medicaid
Medicaid
is a state-administered program financed by state funds and federal matching
funds. The program provides for medical assistance to the indigent and certain
other eligible persons. Although administered under broad federal regulations,
states are given flexibility to construct programs and payment methods. Each
state in which we operate nursing and rehabilitation centers has its own unique
Medicaid reimbursement system.
Medicaid
outlays are a significant component of state budgets, and there have been cost
containment pressures on Medicaid outlays for nursing homes. The
recent economic downturn has caused many states to institute freezes on or
reductions in Medicaid spending to address state budget concerns.
Twenty-one
of the states in which we operate impose a provider tax on nursing homes as a
method of increasing federal matching funds paid to those states for
Medicaid. Those states that have imposed the provider tax have used
some or all of the matching funds to fund Medicaid reimbursement to nursing
homes.
The
following table sets forth the average amounts of inpatient Medicaid revenues
per patient, per day (excluding any impact
of individually identifiable state-imposed provider taxes), recorded by our
healthcare centers for the years ended December 31 (data includes revenues for
acquired centers following the date of acquisition only):
|
2009
|
2008
|
2007
|
|||
|
$
|
171.55
|
$
|
166.62
|
$
|
159.36
|
For
comparison purposes, the following table sets forth the average amounts of
inpatient Medicaid revenues per patient, per day, (including the impact
from individually identifiable state-imposed provider taxes), recorded by our
healthcare centers for the years ended December 31 (data includes revenues for
acquired centers following the date of acquisition only):
|
2009
|
2008
|
2007
|
|||
|
$
|
159.51
|
$
|
157.08
|
$
|
149.95
|
Managed
Care and Insurance
During the year ended
December 31, 2009, we received 5.4% of our revenues from managed care and
insurance, of which the Medicare Advantage program is the primary
component. As discussed above, Medicare Advantage is the managed care
option for Medicare beneficiaries. Medicare Advantage is administered
by contracted third party payors. The managed care and insurance
payors are continuing their efforts to control healthcare costs through direct
contracts with healthcare providers and increased utilization
review. These payors are increasingly demanding discounted fee
structures and the assumption by healthcare providers of all or a portion of the
financial risk.
The
following table sets forth the average amounts of inpatient revenues per
patient, per day, recorded by our healthcare centers from these revenue sources
for the years ended December 31 (data includes revenues for acquired centers
following the date of acquisition only):
|
2009
|
2008
|
2007
|
|||
|
$
|
372.93
|
$
|
351.93
|
$
|
322.35
|
27
SUN
HEALTHCARE GROUP, INC. AND SUBSIDIARIES
Private
Payors, Veterans and Other
During
the year ended December 31, 2009, we received 25.1% of our revenues from private
payors, veterans’ coverage, healthcare centers that utilize our specialty
medical services, self-pay center residents and other third party payors. These
private and other payors are continuing their efforts to control healthcare
costs. Private payor rates are set at a price point that enables
continued competition; they are driven by the markets in which our healthcare
centers operate.
The
following table sets forth the average amounts of inpatient revenues per
patient, per day, recorded by our healthcare centers from these revenue sources
for the years ended December 31 (data includes revenues for acquired centers
following the date of acquisition only):
|
2009
|
2008
|
2007
|
|||
|
$
|
179.05
|
$
|
172.50
|
$
|
164.10
|
Other
Reimbursement Matters
Net
revenues realizable under third-party payor agreements are subject to change due
to examination and retroactive adjustment by payors during the settlement
process. Under cost-based reimbursement plans, payors may disallow, in whole or
in part, requests for reimbursement based on determinations that certain costs
are not reimbursable or reasonable or because additional supporting
documentation is necessary. We recognize revenues from third-party payors and
accrue estimated settlement amounts in the period in which the related services
are provided. We estimate these settlement balances by making determinations
based on our prior settlement experience and our understanding of the applicable
reimbursement rules and regulations.
28
SUN
HEALTHCARE GROUP, INC. AND SUBSIDIARIES
Results
of Operations
The
following table sets forth our historical consolidated income statements and
certain percentage relationships for the years ended December 31 (dollars in
thousands):
|
As
a Percentage of Net Revenues
|
|||||||||||||||
|
2009
|
2008
|
2007
|
2009
|
2008
|
2007
|
||||||||||
|
Total
net revenues
|
$
|
1,881,799
|
$
|
1,823,503
|
$
|
1,557,756
|
100.0
|
%
|
100.0
|
%
|
100.0
|
%
|
|||
|
Costs
and expenses:
|
|||||||||||||||
|
Operating
salaries and benefits
|
1,057,645
|
1,028,987
|
888,102
|
56.2
|
56.4
|
56.9
|
|||||||||
|
Self-insurance
for workers’ compensation
|
|||||||||||||||
|
and
general and professional liabilities
|
63,752
|
59,694
|
44,524
|
3.4
|
3.3
|
2.9
|
|||||||||
|
General
and administrative expenses
|
62,068
|
62,302
|
64,835
|
3.3
|
3.4
|
4.2
|
|||||||||
|
Other operating costs
(1)
|
435,756
|
424,255
|
358,960
|
23.2
|
23.3
|
23.1
|
|||||||||
|
Center
rent expense
|
73,149
|
73,601
|
70,412
|
3.9
|
4.0
|
4.5
|
|||||||||
|
Depreciation
and amortization
|
45,463
|
40,354
|
31,218
|
2.4
|
2.2
|
2.0
|
|||||||||
|
Provision
for losses on accounts receivable
|
21,197
|
14,107
|
8,982
|
1.1
|
0.8
|
0.6
|
|||||||||
|
Interest,
net
|
49,327
|
54,603
|
44,347
|
2.6
|
3.0
|
2.8
|
|||||||||
|
Other
expense (income)
|
1,346
|
(976
|
)
|
3,197
|
0.1
|
(0.1
|
)
|
0.2
|
|||||||
|
Income
before income taxes and
|
|||||||||||||||
|
discontinued
operations
|
72,096
|
66,576
|
43,179
|
3.8
|
3.7
|
2.8
|
|||||||||
|
Income
tax expense (benefit)
|
29,616
|
(47,348
|
)
|
(10,914
|
)
|
1.6
|
(2.6
|
)
|
(0.7
|
)
|
|||||
|
Income
from continuing operations
|
42,480
|
113,924
|
54,093
|
2.2
|
6.3
|
3.5
|
|||||||||
|
(Loss)
income from discontinued operations
|
(3,809
|
)
|
(4,637
|
)
|
3,417
|
(0.1
|
)
|
(0.3
|
)
|
0.2
|
|||||
|
Net
income
|
$
|
38,671
|
$
|
109,287
|
$
|
57,510
|
2.1
|
%
|
6.0
|
%
|
3.7
|
%
|
|||
|
Supplemental
Financial Information:
|
|||||||||||||||
|
EBITDA
(2)
|
$
|
166,886
|
$
|
161,533
|
$
|
118,744
|
8.9
|
%
|
8.9
|
%
|
7.6
|
%
|
|||
|
Adjusted
EBITDA (2)
|
$
|
168,232
|
$
|
160,557
|
$
|
121,941
|
8.9
|
%
|
8.8
|
%
|
7.8
|
%
|
|||
|
Adjusted
EBITDAR (2)
|
$
|
241,381
|
$
|
234,158
|
$
|
192,353
|
12.8
|
%
|
12.8
|
%
|
12.3
|
%
|
|||
(1)
Operating administrative expenses are included in “other operating costs”
above.
(2) We
define EBITDA as net income before loss (gain) on discontinued operations,
interest expense (net of interest income), income tax
expense (benefit), depreciation and amortization. Adjusted
EBITDA is EBITDA adjusted for gain (loss) on sale of assets, net, restructuring
costs, loss on extinguishment of debt, net, loss on contract termination and
loss on asset impairment. Adjusted EBITDAR is Adjusted EBITDA before center rent
expense. See footnote 6 to Item 6 – “Selected Financial Data” of this report for
an explanation of EBITDA, Adjusted EBITDA and Adjusted EBITDAR, including a
description of our uses of, and the limitations associated with, EBITDA,
Adjusted EBITDA and Adjusted EBITDAR, and a reconciliation of EBITDA, Adjusted
EBITDA and Adjusted EBITDAR to net income, the most directly comparable GAAP
financial measure.
29
SUN
HEALTHCARE GROUP, INC. AND SUBSIDIARIES
The
following discussion of the “Year Ended December 31, 2009 Compared to Year Ended
December 31, 2008” and “Year Ended December 31, 2008 Compared to Year Ended
December 31, 2007” is based on the financial information presented in Note 14 –
“Segment Information” of our consolidated financial statements included in this
Annual Report on Form 10-K.
Year
Ended December 31, 2009 Compared to Year Ended December 31, 2008
Total net
revenue increased $58.3 million, or 3.2%, to $1,881.8 million for the year ended
December 31, 2009 from $1,823.5 million for the year ended December 31,
2008. Of this increase in revenue $59.7 million was contributed by
our Inpatient Services segment and $15.7 million by our Rehabilitation Therapy
segment. These increases were offset by a $17.1 million decrease in
revenue from our Medical Staffing segment.
Operating
salaries and benefits expense increased $28.6 million, or 2.8%, to $1,057.6
million (56.2% of net revenues) for the year ended December 31, 2009 from
$1,029.0 million (56.4% of net revenues) for the year ended December 31,
2008. The increase is primarily the result of wage rate
increases.
Self
insurance for workers’ compensation and general and professional liability
insurance increased $4.1 million, or 6.9%, to $63.8 million (3.4% of net
revenues) for the year ended December 31, 2009 from $59.7 million (3.3% of net
revenues) for the year ended December 31, 2008. The increase was
attributable to a $6.1 million increase in general and professional liability
insurance costs driven by an increased claims costs related to prior years,
partially offset by a $1.7 million decrease in workers’ compensation costs
resulting from costs recorded in 2008 related to earlier years.
General
and administrative expenses decreased $0.2 million, or 0.3%, to $62.1 million
(3.3% of net revenues) for the year ended December 31, 2009 from $62.3 million
(3.4% of net revenues) for the year ended December 31, 2008. The decrease was due to
cost reductions in professional and consultant fees and benefits
expenses.
Other
operating costs increased $11.5 million, or 2.7%, to $435.8 million (23.2% of
net revenues) for the year ended December 31, 2009 from $424.3 million (23.3% of
net revenues) for the year ended December 31, 2008. The increase in
other operating costs was principally comprised of (1) cost increases relating
to pharmaceutical, therapy and other ancillary services, which in turn were
driven by increased patient needs, coupled with (2) increases in utilities and
provider and real estate taxes.
Center
rent expense decreased $0.5 million, or 1.0%, to $73.1 million (3.9% of net
revenues) for the year ended December 31, 2009 from $73.6 million (4.0% of net
revenues) for the year ended December 31, 2008. The decrease was due to
reduced rent for a previously leased center that was purchased in the first
quarter of 2009.
Depreciation
and amortization increased $5.1 million, or 12.6%, to $45.5 million (2.4% of net
revenues) for the year ended December 31, 2009 from $40.4 million (2.2% of net
revenues) for the year ended December 31, 2008. The increase was
primarily attributable to the purchase of previously leased centers and
additional capital expenditures incurred for center and information systems
improvements in 2009.
The
provision for losses on accounts receivable increased $7.1 million, or 50.4%, to
$21.2 million (1.1% of net revenues) for the year ended December 31, 2009 from
$14.1 million (0.8% of net revenues) for the year ended December 31, 2008. The
increase was principally driven by lower recoveries of inpatient services bad
debt and continued deterioration in the aging of uncollected accounts, which are
primarily private payor accounts.
30
SUN
HEALTHCARE GROUP, INC. AND SUBSIDIARIES
Net interest expense decreased $5.3 million, or 9.7%, to $49.3 million (2.6% of
net revenues) for the year ended December 31, 2009 from $54.6 million (3.0% of
net revenues) for the year ended December 31, 2008, principally due to lower interest rates
on variable rate indebtedness coupled with reduced debt
balances.
There is
a provision for income taxes of $29.6 million for the year ended December 31,
2009, compared to an income tax benefit of $47.3 million for the year ended
December 31, 2008. The 2008 benefit amount included a $70.5 million
benefit from the reversal of a portion of the valuation allowance on our net
deferred tax assets offset by a provision from operations and other adjustments
totaling $23.2 million. Our valuation allowance on our net deferred
tax assets decreased $6.7 million during the year ended December 31, 2009 due to
the write-off of deferred tax assets for certain state net operating loss
carryforwards that were fully reserved. No portion of the $6.7
million reduction in our valuation allowance in 2009 affected our provision for
income taxes.
Our
Adjusted EBITDA increased $7.6 million, or 4.7%, to $168.2 million (8.9% of net
revenues) for the year ended December 31, 2009 from $160.6 million (8.8% of net
revenues) for the year ended December 31, 2008. The increase was
primarily attributable to additional revenues of $58.3 million, offset by
additional expenses, primarily operating salaries and benefits ($28.6 million),
other operating costs ($11.5 million), provision for losses on accounts
receivable ($7.1 million) and self-insurance for workers’ compensation and
general and professional liability insurance ($4.1 million), all discussed
above. For an explanation of Adjusted EBITDA, including a description
of our uses of, and the limitations associated with, Adjusted EBITDA, and a
reconciliation of Adjusted EBITDA to net income, the most directly comparable
GAAP financial measure, see footnote 6 to Item 6 – “Selected Financial Data” of
this Annual Report on Form 10-K.
Segment
information
Our
reportable segments are strategic business units that provide different products
and services. They are managed separately because each business has different
marketing strategies due to differences in types of customers, distribution
channels and capital resource needs.
The
following table sets forth the amount and percentage of certain elements of
total net revenues for the years ended December 31 (dollars in
thousands):
|
2009
|
2008
|
2007
|
|||||||||||||
|
Inpatient
Services
|
$
|
1,675,775
|
89.1
|
%
|
$
|
1,616,059
|
88.6
|
%
|
$
|
1,367,398
|
87.8
|
%
|
|||
|
Rehabilitation
Therapy Services
|
179,532
|
9.5
|
150,475
|
8.3
|
127,056
|
8.2
|
|||||||||
|
Medical
Staffing Services
|
102,554
|
5.4
|
120,410
|
6.6
|
111,232
|
7.1
|
|||||||||
|
Corporate
|
34
|
0.0
|
37
|
0.0
|
77
|
0.0
|
|||||||||
|
Intersegment
eliminations
|
(76,096)
|
(4.0
|
)
|
(63,478
|
)
|
(3.5
|
)
|
(48,007
|
)
|
(3.1
|
)
|
||||
|
Total
net revenues
|
$
|
1,881,799
|
100.0
|
%
|
$
|
1,823,503
|
100.0
|
%
|
$
|
1,557,756
|
100.0
|
%
|
|||
Inpatient
services revenues for long-term care, subacute care and assisted living services
include revenues billed to patients or third party payors for therapy and
medical staffing services provided by our affiliated operations. The
following table sets forth a summary of the intersegment revenues for the years
ended December 31 (in thousands):
|
2009
|
2008
|
2007
|
|||||||
|
Rehabilitation
Therapy Services
|
$
|
74,166
|
$
|
60,856
|
$
|
44,857
|
|||
|
Medical
Staffing Services
|
1,930
|
2,622
|
3,150
|
||||||
|
Total
affiliated revenues
|
$
|
76,096
|
$
|
63,478
|
$
|
48,007
|
31
SUN
HEALTHCARE GROUP, INC. AND SUBSIDIARIES
We evaluate
the operational strengths and performance of each segment based on financial
measures, including net segment income. Net segment income is defined
as earnings before loss (gain) on sale of assets, net, restructuring costs,
income tax benefit and discontinued operations. Net segment income for the year
ended December 31, 2009 for (1) our inpatient services segment increased $1.8
million, or 1.2%, to $156.1 million, (2) our rehabilitation therapy services
segment increased $2.6 million, or 30.6%, to $11.1 million and (3) our medical
staffing services segment decreased $1.1 million, or 11.3%, to $8.6 million due
to the factors discussed below for each segment. We use the measure of net
segment income to help identify opportunities for improvement and assist in
allocating resources to each segment. The following table sets
forth the amount of net segment income for the years ended December 31 (in
thousands):
|
2009
|
2008
|
2007
|
|||||||
|
Inpatient
Services
|
$
|
156,088
|
$
|
154,281
|
$
|
132,435
|
|||
|
Rehabilitation
Therapy Services
|
11,112
|
8,462
|
7,753
|
||||||
|
Medical
Staffing Services
|
8,610
|
9,690
|
8,221
|
||||||
|
Net
segment income before Corporate
|
175,810
|
172,433
|
148,409
|
||||||
|
Corporate
|
(102,368
|
)
|
$
|
(106,833
|
)
|
(102,033
|
)
|
||
|
Net
segment income
|
$
|
73,442
|
65,600
|
$
|
46,376
|
Inpatient
Services. Net revenues increased $59.7 million, or 3.7%, to
$1,675.8 million for the year ended December 31, 2009 from $1,616.1 million for
the year ended December 31, 2008. The increase in net revenues was
primarily the result of:
|
-
|
an
increase of $35.7 million in Medicare revenues driven by increases in
Medicare Part A rates and Medicare Part B revenues, which drove $31.6
million and $4.1 million of the increase, respectively;
|
|
-
|
a
$9.4 million increase in managed and commercial insurance revenues driven
by a higher customer base and higher rates, which caused $4.1 million and
$5.3 million of the increase, respectively;
|
|
-
|
an
increase of $24.3 million in Medicaid revenues, driven by increases in
rates and customer base, which drove $21.2 million and $3.1 million of the
increase, respectively;
|
|
-
|
a
$8.9 million increase in revenues from private sources due to higher
rates;
|
|
-
|
an
increase of $15.2 million in hospice revenues due to an acquisition, which
contributed $4.4 million of the increase, and internal growth;
and
|
|
-
|
an
increase of $0.8 million in other revenue including veterans and other
various inpatient services;
|
|
offset
by
|
|
|
-
|
a
$20.3 million decrease in Medicare revenues due to a lower customer base;
and
|
|
-
|
a
$14.3 million decrease in private revenues also due to a lower customer
base.
|
Operating
salaries and benefits expenses, excluding workers' compensation insurance costs,
increased $17.2 million, or 2.1%, to $835.0 million for the year ended December
31, 2009 from $817.8 million for the year ended December 31,
2008. The increase was primarily due to:
|
-
|
increases
in compensation and related benefits and taxes of $25.1 million to remain
competitive in local markets;
|
32
SUN
HEALTHCARE GROUP, INC. AND SUBSIDIARIES
|
offset
by
|
|
|
-
|
a
decrease of $7.9 million in overtime
expenses.
|
Self-insurance
for workers’ compensation and general and professional liability insurance
increased $4.3 million, or 7.7%, to $59.8 million for the year ended December
31, 2009 as compared to $55.5 million for the year ended December 31,
2008. The increase was attributable to a $6.1 million increase in
general and professional liability insurance costs offset by a $1.8 million
decrease in workers’ compensation costs. The increase in general and
professional liability costs was a result of increased claims costs related to
prior years. The decrease in workers’ compensation costs resulted
from costs recorded in 2008 from changes in estimates related to earlier
years.
Other
operating costs increased $25.7 million, or 6.2%, to $437.6 million for the year
ended December 31, 2009, from $411.9 million for the year ended December
31, 2008. The increase was primarily due to:
|
-
|
a
$15.1 million increase in costs for therapy, pharmacy and medical
supplies attributable to higher acuity, which was driven in part by
the number of new Rehab Recovery Suites;
|
|
-
|
a
$12.0 million increase in taxes (primarily provider taxes and real estate
taxes);
|
|
-
|
a
$4.4 million increase in purchased services, of which a majority of the
increase was in operating service contracts and software
maintenance;
|
|
-
|
a
$1.0 million increase in legal fees; and
|
|
-
|
a
$0.5 million increase in acquisition transaction costs related to a
hospice acquisition;
|
|
offset
by
|
|
|
-
|
a
$2.5 million decrease in contract nursing labor due to lower volume and
improved labor management;
|
|
-
|
a
$1.2 million decrease in equipment rental;
|
|
-
|
a
$1.2 million increase in vendor discounts and rebates;
|
|
-
|
a
$1.2 million decrease in recruiting expenses;
|
|
-
|
a
$1.1 million decrease in civil monetary penalties; and
|
|
-
|
a
$0.1 million decrease in travel and vehicle
expenses.
|
General
and administrative expenses decreased $0.2 million, or 0.5%, to $41.2 million
for the year ended December 31, 2009 from $41.4 million for the year ended
December 31, 2008.
The
provision for losses on accounts receivable increased $7.4 million, or 55.6%, to
$20.7 million for the year ended December 31, 2009, from $13.3 million for the
year ended December 31, 2008. The increase is due to increased credit
risk associated with slower cash collections.
33
SUN
HEALTHCARE GROUP, INC. AND SUBSIDIARIES
Center rent expense for the year ended December 31, 2009 decreased $0.5 million,
or 0.7%, to $71.7 million, compared to $72.2 million for the year ended December
31, 2008. The decrease was attributable to the purchase of previously leased
centers.
Depreciation
and amortization increased $5.3 million, or 14.7%, to $41.3 million for the year
ended December 31, 2009, from $36.0 million for the year ended December 31,
2008. The increase was attributable to additional depreciation expense due to
the purchase of previously leased centers and for property and equipment
acquired during the period.
Net
interest expense for the year ended December 31, 2009 was $12.2 million as
compared to $13.6 million for the year ended December 31, 2008. The
decrease of $1.5 million was a result of lower borrowing costs and lower
aggregate borrowings.
Rehabilitation
Therapy Services. Total
revenues increased $29.0 million, or 19.3%, to $179.5 million for the year ended
December 31, 2009, from $150.5 million for the year ended December 31,
2008. Of the $29.0 million increase in total revenues, affiliated
revenues increased $13.3 million; nonaffiliated revenues increased $14.8 million
and other revenue increased $0.9 million. The addition of nine affiliated
contracts, coupled by a rate increase and service volume growth in our
affiliated book of business, drove the affiliated revenue increase. The increase
in nonaffiliated revenues was due primarily to new contracts (net positive
change in contract count), rate increases in existing business and growth in
dysphagia and management services business lines.
Operating
salaries and benefits expenses, excluding workers’ compensation insurance costs,
increased $25.5 million, or 20.4%, to $150.3 million for the year ended December
31, 2009 from $124.8 million for the year ended December 31, 2008. The increase
was primarily due to service volume growth and an average increase of 4.18% in
therapy wage rates. These increases were compounded by an increase in health
insurance costs of $1.5 million.
Other
operating costs, including contract labor expenses, increased $0.5 million, or
7.0%, to $7.6 million for the year ended December 31, 2009 from $7.1 million for
the year ended December 31, 2008. The increase was primarily due to increased
administrative expenses and other direct contract expenses resulting from the
increased business volume.
Provision
for losses on accounts receivable increased $0.3 million to an expense of $0.5
million for the year ended December 31, 2009 from an expense of $0.2 million for
the year ended December 31, 2008. The increase was due to the aging
of uncollected accounts and a higher reserve percentage for our oldest rehab
agency accounts.
Medical
Staffing Services. Total revenues from Medical Staffing
Services decreased $17.8 million, or 14.8%, to $102.6 million for the year ended
December 31, 2009 from $120.4 million for the year ended December 31,
2008. The decrease in revenues was primarily the result
of:
|
-
|
a
$11.2 million decrease in the nurse staffing business;
|
|
-
|
a
$5.4 million decrease in staffing other medical professionals due to a
decline in hours; and
|
|
-
|
a
$2.4 million decrease due to nursing offices permanently closed in
2008;
|
|
offset
by
|
|
|
-
|
an
increase in locum tenens (physician placement) business of $1.2
million.
|
34
SUN
HEALTHCARE GROUP, INC. AND SUBSIDIARIES
Operating salaries and benefits expenses, excluding workers’ compensation
insurance costs, decreased $14.0 million, or 16.2%, to $72.3 million for the
year ended December 31, 2009 from $86.3 million for the year ended December 31,
2008. The $14.0 million decrease was primarily driven by the decline in
revenue.
Other
operating costs decreased $1.9 million, or 10.8%, to $15.7 million for the year
ended December 31, 2009 from $17.6 million for the year ended December 31, 2008.
The decrease was primarily attributable to a decline in hours associated with
the decline in revenue.
Provision
for losses on accounts receivable decreased $0.5 million, or 83.3%, to $0.1
million for the year ended December 31, 2009 from $0.6 million for the year
ended December 31, 2008 due primarily to the recovery of large accounts that
were reserved in prior year and strong ongoing collections efforts.
Corporate. General
and administrative costs not directly attributed to operating segments decreased
$0.2 million, or 0.3%, to $62.1 million for the year ended
December 31, 2009 from $62.3 million for the year ended
December 31, 2008.
As we
continue to focus on reducing costs and maximizing occupancy, we have evaluated
and will continue to evaluate certain restructuring activities in our operations
and administrative functions. During the year ended December 31,
2009, we incurred $1.3 million of restructuring costs. The costs
consisted primarily of severance benefits resulting from reductions of
administrative staff.
Interest
expense
Net
interest expense not directly attributed to operating segments decreased $3.9
million, or 9.4%, to $37.1 million for the year ended December 31,
2009 from $41.0 million for the year ended December 31, 2008. The
decrease was principally due to lower interest rates
on variable rate indebtedness coupled with reduced debt
balances.
Year
Ended December 31, 2008 Compared to Year Ended December 31, 2007
Total net
revenue increased $265.7 million, or 17.1%, to $1,823.5 million for the year
ended December 31, 2008 from $1,557.8 million for the year ended December 31,
2007. The increase in revenue was principally the result of the
$248.6 million increase in revenue from our Inpatient Services segment, $183.9
million of which was incremental revenue related to the Harborside
acquisition. The remainder of the increase in revenue in 2008
resulted from (1) a $9.7 million increase in revenue from our Medical Staffing
segment, and (2) a $7.4 million increase in revenue from our Rehabilitation
Therapy segment.
Operating
salaries and benefits expense increased $140.9 million, or 15.9%, to $1,029.0
million (56.4% of net revenues) for the year ended December 31, 2008 from $888.1
million (56.9% of net revenues) for the year ended December 31,
2007. Approximately $102.5 million of the increase were incremental
costs from the Harborside acquisition. The remaining $38.4 million of the
increase principally resulted from wage rate increases.
Self
insurance for workers’ compensation and general and professional liability
insurance increased $15.2 million, or 34.2%, to $59.7 million (3.3% of net
revenues) for the year ended December 31, 2008 from $44.5 million (2.9% of net
revenues) for the year ended December 31, 2007. Incremental self
insurance costs related to acquisitions totaled $7.3
million. Additionally, self-insurance expense increased by $0.9
million due to increased claims and administrative costs.
35
SUN
HEALTHCARE GROUP, INC. AND SUBSIDIARIES
General
and administrative expenses decreased $2.5 million, or 3.9%, to $62.3 million
(3.4% of net revenues) for the year ended December 31, 2008 from $64.8
million (4.2% of net revenues) for the year ended December 31,
2007. Incremental cost savings resulting from the integration of the
Harborside acquisition contributed approximately $4.1 million of the decrease
primarily related to salaries, contract labor, insurance and other
administrative expenses. These cost savings were offset by an increase of $1.6
million in stock-based compensation expense.
Other
operating costs increased $65.3 million, or 18.2%, to $424.3 million (23.3% of
net revenues) for the year ended December 31, 2008 from $359.0 million (23.0% of
net revenues) for the year ended December 31, 2007. Incremental other operating
costs resulting from the Harborside acquisition totaled $41.2
million. The remaining $24.1 million of the increase in other
operating costs was principally comprised of (1) cost increases relating to
pharmaceutical, therapy and other ancillary services, which in turn were driven
by our increased revenue, coupled with (2) increases in utilities and provider
and real estate taxes.
Center
rent expense increased $3.2 million, or 4.5%, to $73.6 million (4.0% of net
revenues) for the year ended December 31, 2008 from $70.4 million (4.5% of net
revenues) for the year ended December 31, 2007. Incremental rent
expense, primarily resulting from the Harborside acquisition, contributed $1.4
million of the increase. The remaining increase of $1.9 million was due to
normally scheduled contingency-based rent increases.
Depreciation
and amortization increased $9.2 million, or 29.5%, to $40.4 million (2.2% of net
revenues) for the year ended December 31, 2008 from $31.2 million (2.0% of net
revenues) for the year ended December 31, 2007. The increase was
primarily attributable to $5.0 million of depreciation related to the Harborside
acquisition. The remaining increase of $4.2 million was due primarily to
additional capital expenditures incurred for center and information systems
improvements in 2008.
The
provision for losses on accounts receivable increased $5.1 million, or 56.7%, to
$14.1 million (0.8% of net revenues) for the year ended December 31, 2008 from
$9.0 million (0.6% of net revenues) for the year ended December 31, 2007. The
addition of Harborside contributed $1.1 million of the increase, with the
remaining increase principally driven by lower recoveries of inpatient services
bad debt than in 2007 and a deterioration in the aging of uncollected
accounts.
Interest
expense increased $10.3 million, or 23.3%, to $54.6 million (3.0% of net
revenues) for the year ended December 31, 2008 from $44.3 million (2.8% of net
revenues) for the year ended December 31, 2007, principally due to the
indebtedness we incurred and assumed in the Harborside acquisition.
The
benefit for income taxes increased to $47.3 million for the year ended December
31, 2008 from a benefit of $10.9 million for the year ended December 31,
2007. The $36.4 million increase includes an increased benefit of
$41.6 million from the reversal of a portion of the valuation allowance on our
net deferred tax assets, offset by an increased provision of $5.2 million
related to pre-tax income.
The $98.6
million net decrease in the valuation allowance includes a $13.9 million
increase related to additional deferred tax assets primarily from our
pre-emergence period, offset by a $112.5 million decrease due to sufficient
positive evidence regarding the generation of future taxable income to allow for
the recognition of deferred tax assets under GAAP.
We
believe that it is still necessary to have a valuation allowance on a portion of
our net deferred tax assets. However, if we determine that sufficient positive
evidence exists in future periods to enable us to reverse part or all of the
valuation allowance of $34.3 million that remains as of December 31, 2008, such
reversal would reduce the provision for income taxes.
36
SUN
HEALTHCARE GROUP, INC. AND SUBSIDIARIES
Our Adjusted
EBITDA increased $38.7 million, or 31.7%, to $160.6 million (8.8% of net
revenues) for the year ended December 31, 2008 from $121.9 million (7.8% of net
revenues) for the year ended December 31, 2007. The increase was
primarily attributable to additional revenues of $265.7 million, offset by
additional expenses primarily in operating salaries and benefits ($140.9
million), other operating costs ($65.3 million), provision for losses on
accounts receivable ($5.1 million) and self-insurance for workers’ compensation
and general and professional liability insurance ($15.2 million), all discussed
above. For an explanation of Adjusted EBITDA, including a description
of our uses of, and the limitations associated with, Adjusted EBITDA, and a
reconciliation of Adjusted EBITDA to net income, the most directly comparable
GAAP financial measure, see footnote 6 to Item 6 - “Selected Financial Data” of
this Annual Report on Form 10-K.
Segment
information
Net
segment income for the year ended December 31, 2008 for (1) our inpatient
services segment increased $21.9 million, or 16.5%, to $154.3 million, (2) our
rehabilitation therapy services segment increased $0.7 million, or 9.0%, to $8.5
million and (3) our medical staffing services segment increased $1.5 million, or
18.3%, to $9.7 million due to the factors discussed below for each segment. We
use the measure of net segment income to help identify opportunities for
improvement and assist in allocating resources to each segment.
Inpatient
Services. Net revenues increased $248.7 million, or 18.2%, to
$1,616.1 million for the year ended December 31, 2008 from $1,367.4 million for
the year ended December 31, 2007. The addition of Harborside contributed $166.8
million of the increase in net revenues. The remaining increase of
$81.9 million in net revenues on a same store basis was primarily the result
of:
|
-
|
an
increase of $38.7 million in Medicare revenues driven by increases in
Medicare Part A rates, our Medicare customer base and Medicare Part B
revenues, which drove $31.5 million, $5.1 million and $2.1 million of the
increase, respectively;
|
|
-
|
a
$25.2 million increase in managed and commercial insurance revenues driven
by a higher customer base and higher rates, which caused $18.2 million and
$7.0 million of the increase, respectively;
|
|
-
|
an
increase of $23.2 million in Medicaid revenues, primarily due to improved
rates;
|
|
-
|
a
$7.3 million increase in revenues from private sources due to higher
rates;
|
|
-
|
an
increase of $7.0 million in hospice revenues due to an acquisition and
internal growth; and
|
|
-
|
an
increase of $2.1 million in other revenue including veterans and other
various inpatient services;
|
|
offset
by
|
|
|
-
|
a
$17.9 million decrease in Medicaid revenues due to a lower customer base;
and
|
|
-
|
a
$3.7 million decrease in private revenues also due to a lower customer
base.
|
Operating
salaries and benefits expenses, excluding workers' compensation insurance costs,
increased $121.3 million, or 17.4%, to $817.8 million for the year ended
December 31, 2008 from $696.5 million for the year ended December 31, 2007.
Approximately $90.7 million of the increase was due to the addition of
Harborside. The remaining increase of $30.6 million on a same store
basis was primarily due to:
37
SUN
HEALTHCARE GROUP, INC. AND SUBSIDIARIES
|
-
|
increases
in compensation and related benefits and taxes of $32.9 million to remain
competitive in local markets;
|
|
offset
by
|
|
|
-
|
a
decrease of $2.1 million in overtime
expenses.
|
Self-insurance
for workers’ compensation and general and professional liability insurance
increased $14.9 million, or 36.7%, to $55.5 million for the year ended December
31, 2008 as compared to $40.6 million for the year ended December 31,
2007. The addition of Harborside contributed $4.7 million of the
increase. The remaining $10.2 million increase was attributable to a
$3.4 million increase in general and professional liability insurance costs and
a $6.8 million increase in workers’ compensation costs. Both of these
increases were related to a combination of higher claim costs in 2008 combined
with the impact of prior year insurance reserve releases recorded in 2007 which
did not repeat in 2008.
Other
operating costs increased $62.4 million, or 17.9%, to $411.9 million for the
year ended December 31, 2008, from $349.5 million for the year ended December
31, 2007. Excluding the impact of Harborside, which contributed $39.3
million of the increase, the remaining $23.1 million increase on a same store
basis was primarily due to:
|
-
|
a
$19.0 million increase in therapy, pharmacy, medical supplies and
equipment rental expense attributable to the increase in our skilled
patient mix as well an increase in the number of new Rehab Recovery Suites
coming on line;
|
|
-
|
a
$3.4 million increase in utility expense primarily due to higher
electricity, gas and oil and garbage collection costs;
|
|
-
|
a
$2.7 million increase in education and training expense related to new
clinical programs and processes;
|
|
-
|
a
$2.5 million increase in purchased services of which a majority of the
increase was in service contracts; and
|
|
-
|
a
$1.4 million decrease in vendor discounts and rebates;
|
|
offset
by
|
|
|
-
|
a
$3.4 million decrease in contract nursing labor; and
|
|
-
|
a
$2.5 million decrease in taxes (primarily provider taxes and real estate
taxes).
|
General
and administrative expenses increased $9.4 million, or 29.4%, to $41.4 million
for the year ended December 31, 2008 from $32.0 million for the year ended
December 31, 2007. The addition of the Harborside operations
contributed $3.2 million of the increase with the remaining $6.2 million
increase due to higher salaries and benefits, travel costs, utilities and office
leases.
The
provision for losses on accounts receivable increased $3.8 million, or 40.0%, to
$13.3 million for the year ended December 31, 2008, from $9.5 million for the
year ended December 31, 2007. The addition of Harborside contributed
$1.1 million of the increase. The remaining $2.7 million of the
increase is due to lower recoveries of bad debt. In 2007, we
recovered $2.3 million of bad debt related to centers acquired in
2005.
38
SUN
HEALTHCARE GROUP, INC. AND SUBSIDIARIES
Center rent
expense for the year ended December 31, 2008 increased $2.9 million, or 4.2%, to
$72.2 million, compared to $69.3 million for the year ended December 31, 2007.
The addition of Harborside accounted for $4.7 million of additional rent
expense, which was offset by a $1.8 million decrease in same store rent due to
conversions of leased centers to owned.
Depreciation
and amortization increased $10.0 million, or 38.5%, to $36.0 million for the
year ended December 31, 2008, from $26.0 million for the year ended December 31,
2007. The addition of the Harborside centers accounted for $4.5 million of the
increase. The remaining increase of $5.5 million was primarily due to
the purchase of previously leased centers and capital expenditures incurred for
center improvements in 2008.
Net
interest expense for the year ended December 31, 2008 was $13.7 million as
compared to $11.5 million for the year ended December 31, 2007. The
increase of $2.2 million was primarily due to debt incurred and assumed in the
Harborside acquisition and debt incurred to purchase leased
centers.
Rehabilitation
Therapy Services. Total
revenues increased $23.4 million, or 18.4%, to $150.5 million for the year ended
December 31, 2008, from $127.1 million for the year ended December 31,
2007. Of the $23.4 million increase in total revenues, affiliated
revenues increased $16.0 million; nonaffiliated revenues increased $7.0 million
and other revenue increased $0.4 million. The addition of 18 affiliated
contracts in Kentucky, gained by way of a 2007 acquisition, drove $8.9 million
of the affiliated revenue increase. The addition of 13 affiliated contracts in
Oklahoma, Idaho, and Montana, gained by way of a 2005 acquisition and
transitioned to SunDance operations in 2008, drove $4.4 million of the
affiliated revenue increase. Service volume growth
drove the remainder of the increase in affiliated
revenues. The increase in nonaffiliated revenues was due
primarily to new contracts (net positive change in contract count), rate
increases in existing business and growth of an emerging business
segment.
Operating
salaries and benefits expenses, excluding workers’ compensation insurance costs,
increased $18.6 million, or 17.5%, to $124.8 million for the year ended December
31, 2008 from $106.2 million for the year ended December 31, 2007. The increase
was primarily due to service volume growth discussed above and an average
increase of 4.4% in therapy wage rates. These increases were compounded by an
increase in health insurance costs of $1.3 million.
Self-insurance
for workers’ compensation and general and professional liability expenses
increased $0.3 million, or 16.7%, to $2.1 million for the year ended December
31, 2008, from $1.8 million for the year ended December 31, 2007. The increase
was due to an increase in workers’ compensation claims expense.
General
and administrative expenses increased $1.8 million, or 36.0%, to $6.8 million
for the year ended December 31, 2008 from $5.0 million for the year ended
December 31, 2007. The increase was the result of additional
personnel and contracted services necessary to support the overall increased
business volume.
Other
operating costs, including contract labor expenses, increased $0.8 million, or
12.7%, to $7.1 million for the year ended December 31, 2008 from $6.3 million
for the year ended December 31, 2007. The increase was primarily due to
increased contract labor and other direct contract expenses in relation to the
2007 and 2005 acquisitions discussed above.
Provision
for losses on accounts receivable increased $0.9 million to an expense of $0.2
million for the year ended December 31, 2008 from an adjustment of ($0.7)
million for the year ended December 31, 2007. The increase was due to
the aging of uncollected accounts.
Depreciation
expense remained flat at $0.5 million each for the years ended December 31, 2008
and 2007.
39
SUN
HEALTHCARE GROUP, INC. AND SUBSIDIARIES
Medical
Staffing Services. Total revenues from Medical Staffing
Services increased $9.2 million, or 8.3%, to $120.4 million for the year ended
December 31, 2008 from $111.2 million for the year ended December 31, 2007.
The increase in revenues was primarily the result of:
|
-
|
an
increase in Locum Tenens (physician placement) business of $4.3
million;
|
|
-
|
$3.8
million attributable to an increase of approximately 65,359 billable hours
(a 3.9% increase in billable hours);
|
|
-
|
$2.5
million resulting from the acquisition of a medical staffing company in
the Harborside acquisition in 2007; and
|
|
-
|
$0.9
million attributable to a bill rate increase of 1.0%;
|
|
offset
by
|
|
|
-
|
a
$2.3 million decrease due to nursing offices permanently closed in
2007.
|
Operating
salaries and benefits expenses, excluding workers’ compensation insurance costs,
increased $0.9 million, or 1.1%, to $86.3 million for the year ended December
31, 2008 from $85.4 million for the year ended December 31, 2007. The $0.9
million increase was primarily driven by acquisition mentioned
above.
Other
operating costs increased $6.4 million, or 57.1%, to $17.6 million for the year
ended December 31, 2008 from $11.2 million for the year ended December 31, 2007.
The increase was primarily attributable to a $3.1 million increase in physician
placement fees related to Locum Tenens, a $2.9 million in various administrative
expenses related to travel and meal stipends and a $0.4 million increase for
professional fees related to third party vendors.
Self-insurance
for workers’ compensation and general and professional liability expenses
decreased $0.2 million, or 11.8%, to $1.5 million for the year ended December
31, 2008 from $1.7 million for the year ended December 31, 2007 due to a
decrease in workers’ compensation claims expense.
Provision
for loss increased $0.5 million to $0.6 million for the year ended December 31,
2008 from $0.1 million for the year ended December 31, 2007 due to an increase
in non-payment and slow payments by customers.
Corporate. General
and administrative costs not directly attributed to operating segments decreased
$2.5 million, or 3.9%, to $62.3 million for the year ended
December 31, 2008 from $64.8 million for the year ended
December 31, 2007. The decrease was primarily due to declining consulting
fees, lobbying and political expenses and office lease expenses.
Interest
expense
Net
interest expense not directly attributed to operating segments increased $8.2
million, or 25.0%, to $41.0 million for the year ended December 31,
2008 from $32.8 million for the year ended December 31, 2007. The
increase was primarily due to debt incurred and assumed
in the Harborside acquisition.
40
SUN
HEALTHCARE GROUP, INC. AND SUBSIDIARIES
Liquidity
and Capital Resources
For the
year ended and as of December 31, 2009, our net income was
$38.7 million and our working capital was $175.6 million. As of
December 31, 2009, we had cash and cash equivalents of $104.5 million,
$50.0 million available on our revolving credit facility and $700.5 million
in borrowings. As of December 31, 2009, we were in compliance with
the covenants contained in the credit agreement governing the revolving credit
facility and our term loan indebtedness and the indenture governing our 9-1/8%
Senior Subordinated Notes due 2015.
Based on
current levels of operations, we believe that our operating cash flows (which
were $108.9 million for the year ended December 31, 2009), existing cash
reserves and availability for borrowing under our revolving credit facility will
provide sufficient funds for our operations, capital expenditures (both
discretionary and nondiscretionary) as discussed under “Capital Expenditures”,
scheduled debt service payments and our other commitments described in the table
under “Obligations and Commitments” at least through the next twelve months. We
believe our long term liquidity needs will be satisfied by these same sources,
as well as borrowings as required to refinance indebtedness. Although our credit
agreement, which is described under “Loan Agreements”, contains restrictions on
our ability to incur indebtedness, we currently believe that we will be able to
refinance existing indebtedness or incur additional indebtedness, if needed.
However, there can be no assurance that we will be able to refinance our
indebtedness, incur additional indebtedness or access additional sources of
capital, such as by issuing debt or equity securities, on terms that are
acceptable to us or at all.
We have
not drawn on our revolving credit facility since April 2007, and have since that
time relied on our cash flows to provide for operational needs and capital
expenditures. However, there can be no assurance that our operations will
continue to provide sufficient cash flow or that refinancing sources will be
available in the future, particularly given current economic conditions. We
anticipate that we will be able to utilize our revolving credit facility if
needed, as we expect to remain in compliance with the covenants contained in our
credit agreement for at least the next twelve months. However, recent issues
involving the stability of financial institutions generally have called into
question credit availability, and under the terms of our revolving credit
facility, if one lender defaults on a borrowing request, then the other lenders
are not required to fund that lender’s share. While we do not
anticipate that any of our lenders will be unable to lend under our revolving
credit facility if we determine to borrow funds, no assurance can be given that
one or more of our lenders will be able to fulfill their
commitments. We do not depend on cash flows from discontinued
operations or sales of assets to provide for future liquidity.
In April
2009, we purchased a leased center in Oklahoma that we operate but did not
own. The purchase price of $3.3 million was funded through available
cash. In October 2009, we acquired all the capital stock of a hospice
provider for approximately $16.1 million, which was funded with available
cash.
Cash
flows
During
the year ended December 31, 2009, net cash provided by operating activities
increased by $21.1 million as compared to last year. This increase
was the result of (i) our year-over-year decrease in net income of $70.6
million, (ii) our year-over-year increase in working capital changes of $5.5
million due to timing differences and (iii) a $86.2 million increase in non-cash
adjustments to net income, principally related to depreciation and amortization
expenses, the provision for losses on accounts receivable and recognition of
deferred taxes.
Net cash
used for investing activities of $70.3 million for the year ended December 31,
2009 is comprised of (i) $54.3 million used for capital expenditures, (ii) $3.3
million used to purchase previously leased real estate, (iii) $2.2 million in
proceeds from the sale of assets held for sale, and (iv) $14.9 million used for
acquisitions net of $0.6 million of cash acquired.
41
SUN
HEALTHCARE GROUP, INC. AND SUBSIDIARIES
Net cash
used for financing activities of $26.2 million for the year ended December 31,
2009 is comprised of (i) $20.8 million provided by long-term borrowings, (ii)
$46.2 million used to repay long-term debt and capital lease obligations, (iii)
$0.9 million used for distributions of to noncontrolling interest and (iv) $0.1
million in proceeds from the issuance of common stock.
During
the year ended December 31, 2008, net cash provided by operating activities
increased by $4.0 million as compared to the prior year. This
increase was the result of (i) our year-over-year increase in net income of
$51.8 million, (ii) our year-over-year decrease in working capital changes of
$32.4 million and (iii) a $15.4 million decrease in non-cash adjustments to net
income, principally related to depreciation and amortization expenses, the
provision for losses on accounts receivable, recognition of deferred taxes and a
non-recurring loss on the extinguishment of debt.
During
the year ended December 31, 2007, net cash provided by operating activities
increased by $74.0 million as compared to the prior year. This
increase was the result of (i) our year-over-year increase in net income of
$30.4 million, (ii) our year-over-year increase in working capital changes of
$39.9 million and (iii) a $3.7 million increase in non-cash adjustments to net
income, principally related to depreciation and amortization expenses, the
provision for losses on accounts receivable, recognition of deferred taxes and a
non-recurring loss on the extinguishment of debt.
Loan
Agreements
In April
2007 we issued $200.0 million aggregate principal amount of 9-1/8% Senior
Subordinated Notes due 2015 (the “Notes”), which mature on April 15,
2015. We are entitled to redeem some or all of the Notes at any time
on or after April 15, 2011 at certain pre-specified redemption
prices. In addition, prior to April 15, 2011, we may redeem some
or all of the Notes at a price equal to 100% of the principal amount thereof,
plus accrued and unpaid interest, if any, plus a “make whole”
premium. We are entitled to redeem up to 35% of the aggregate
principal amount of the Notes until April 15, 2010 with the net proceeds
from certain equity offerings at certain pre-specified redemption
prices. The Notes accrue interest at an annual rate of 9-1/8% and pay
interest semi-annually on April 15th and
October 15th of
each year through the April 15, 2015 maturity date. The Notes are
unconditionally guaranteed on a senior subordinated basis by certain of our
subsidiaries but are not secured by any of our assets or those of our
subsidiaries. (See Note 16 – “Summarized Consolidating Information”
in the notes to consolidated financial statements included in this Annual Report
on Form 10-K).
In April
2007, we entered into a $485.0 million senior secured credit facility with a
syndicate of financial institutions led by Credit Suisse as the administrative
agent and collateral agent (the “Credit Agreement”) in connection with our
acquisition of Harborside (see Note 6 – “Acquisitions” in the notes to
consolidated financial statements included in this Annual Report on Form
10-K). The Credit Agreement provides for $365.0 million in term loans
(of which $329.1 million was outstanding as of December 31, 2009), a $50.0
million revolving credit facility (undrawn at December 31, 2009) and a $70.0
million letter of credit facility ($62.8 million outstanding at December 31,
2009). The final maturity date of the term loans is April 19, 2014,
and the revolving credit facility and letter of credit facility terminate on
April 19, 2013. Availability of amounts under the revolving credit
facility is subject to compliance with financial covenants, including an
interest coverage test, a total leverage covenant and a senior leverage
covenant. We were in compliance with these covenants as of December 31,
2009. The Credit Agreement contains customary events of default, such
as our failure to make payment of amounts due, defaults under other agreements
evidencing indebtedness, certain bankruptcy events and a change of control (as
defined in the Credit Agreement). The Credit Agreement also contains customary
covenants restricting, among other things, incurrence of indebtedness, liens,
payment of dividends, repurchase of stock, acquisitions and dispositions,
mergers and investments. The Credit Agreement is collateralized by
our assets and the assets of most of our subsidiaries.
42
SUN
HEALTHCARE GROUP, INC. AND SUBSIDIARIES
Amounts
borrowed under the term loan facility are due in quarterly installments of 0.25%
of the aggregate principal amount of the term loans under the term loan
facility outstanding as of January 15, 2008, with the remaining principal
amount due on the maturity date of the term loans. Accrued interest
is payable at the end of an interest period, but no less frequently than every
three months. The loans under the Credit Agreement bear interest on
the outstanding unpaid principal amount at a rate equal to an applicable
percentage plus, at our option, either (a) an alternative base rate determined
by reference to the higher of (i) the prime rate announced by Credit Suisse and
(ii) the federal funds rate plus one-half of 1.0%, or (b) the London Interbank
Offered Rate (“LIBOR”), adjusted for statutory reserves. The applicable
percentage for term loans is 1.0% for alternative base rate loans and 2.0% for
LIBOR loans; and the applicable percentage for revolving loans is up to 1.0% for
alternative base rate revolving loans and up to 2.0% for LIBOR rate revolving
loans based on our total leverage ratio. Each year, commencing in 2009,
within 90 days of the prior fiscal year end, we are required to prepay a portion
of the term loans in an amount based on the prior year’s excess cash flows, if
any, as defined in the Credit Agreement. Pursuant to this
requirement, we paid $8.5 million during 2009 and we estimate that we will pay
$18.9 million pursuant to this requirement in 2010.
Acquisitions
Hospice
acquisitions
In
October 2009, we completed the purchase of a hospice company, which operates
four hospice programs in three states in the New England area, for $16.1
million. The purchase price included allocations of $6.3 million for
intangible assets, $11.3 million for goodwill, and $1.5 million for net working
capital and other assets.
In
September 2008, we completed the purchase of a hospice company, which operated a
hospice program in New Jersey, for $7.7 million. The purchase price
included allocations of $3.4 million for intangible assets, $3.7 million for
goodwill, and $0.6 million for net working capital
Harborside
In April
2007, we acquired Harborside, a privately-held healthcare company that operated
73 skilled nursing centers, one assisted living center and one independent
living center with approximately 9,000 licensed beds in ten states, by
purchasing all the outstanding Harborside stock for $349.4 million. In addition
to the purchase price paid for Harborside, the former shareholders of Harborside
are entitled to a distribution of cash in an amount equal to the future tax
benefits realized by us, if any, from the deductibility of specified employee
compensation and unamortized debt costs related to
Harborside. Harborside’s results of operations have been included in
the consolidated financial statements since April 1, 2007.
Assets
held for sale
We had no
assets held for sale as of December 31, 2009. During October 2009, we
transferred operations of an assisted living center in Utah to an outside
party. This center has been classified as a discontinued
operation.
As of
December 31, 2008, assets held for sale consisted of (i) a skilled nursing
center with a net carrying amount of $2.8 million, primarily consisting of
property and equipment, and (ii) an undeveloped parcel of land valued at $0.9
million, which was classified in our Corporate segment. See Note 14 -
“Segment Information” to our consolidated financial statements included in this
Annual Report on Form 10-K.
During
November 2008, we transferred operations of a leased skilled nursing center in
Utah to an outside party. This center has been classified as a
discontinued operation.
43
SUN
HEALTHCARE GROUP, INC. AND SUBSIDIARIES
During
September 2008, we reclassified the results of three skilled nursing centers
(two of which were leased)
to discontinued operations. We exercised options to purchase the two
centers and simultaneously sold them and the owned location for a net amount of
$1.1 million (subject to resolution of certain contingencies). We
received $0.9 million of cash proceeds in October 2008 and we received the
remaining $0.2 million of the sales price during the second quarter of
2009. We recorded a $0.9 million loss on disposal of these
centers.
In June
and July 2008, we transferred operations of leased skilled nursing centers in
Tennessee and Indiana to outside parties. The operations of both
centers have been classified as discontinued operations.
On June
30, 2008, we sold the operations of two hospitals for $10.1 million (subject to
a final working capital reconciliation), which was recorded in other current
assets as of June 30, 2008 and received $9.5 million in cash proceeds on July 1,
2008. The remaining $0.6 million of sales price was received during
2009 in conjunction with the final working capital adjustment. A $2.7
million loss on disposal of these operations was recognized in the three months
ended June 30, 2008. The lessor of the two hospitals did not fully
release us from our rent obligation subsequent to the
sale. Therefore, in accordance applicable accounting guidance, the
$2.7 million loss includes an accrued liability of $6.3 million for continuing
costs incurred without economic benefit as of the date of disposal of the
operations (i.e., the “cease-use” date).
As a
result of June 2008 flooding in the Midwest, an Indiana center was severely
damaged and the operation was permanently discontinued. The operating
results for the center have been reclassified to discontinued operations, and we
have recorded a $1.8 million fixed assets impairment charge for the twelve
months ended December 31, 2008, due to the damage to the building and
contents.
As of
December 31, 2007, assets held for sale consisted of (i) a skilled nursing
center with a net carrying amount of $0.5 million, primarily consisting of
property and equipment, (ii) two hospitals with a net carrying amount of $5.3
million, consisting of $8.5 million in assets, offset in part by $3.2 million in
liabilities, and (iii) an undeveloped parcel of land valued at $0.9 million,
which is classified in our Corporate segment in our consolidated financial
statements.
During
the year ended December 31, 2007, we sold our laboratory and radiology
operations for $3.2 million. We also sold a skilled nursing center for $4.9
million during the first quarter of 2007. In October 2007, we sold our 75%
interest in a home health services subsidiary for $1.6 million.
Capital
expenditures
We
incurred capital expenditures, related primarily to improvements in continuing
operations, of $54.3 million, $42.5 million, and $33.5 million for the years
ended December 31, 2009, 2008, and 2007, respectively, which included
capital expenditures for discontinued operations of $0.1 million, and $0.6
million for the years ended December 31, 2008 and 2007,
respectively. We did not incur any capital expenditures related to
discontinued operations in 2009. During the year ended December 31,
2009, we incurred $30.5 million of capital expenditures for ongoing normal
operational needs of our centers, plus we expended $17.8 million for major
renovations of our centers, including $9.7 million spent on construction of our
Rehab Recovery Suites. Our development and rollout of a new billing
platform and labor management system resulted in $3.1 million of expenditures
during 2009. We also incurred capital expenditures of $3.0 million in
our Corporate segment for information systems and other needs.
We had construction
commitments as of December 31, 2009 under various contracts of $1.9 million
related to improvements at centers. These commitments, and
other expenditures in response to emergency situations at our centers, the
amount of which we cannot predict, represent our non-discretionary capital
expenditures. The
44
SUN
HEALTHCARE GROUP, INC. AND SUBSIDIARIES
remaining
amount of our 2010 planned capital expenditures is discretionary. We expect to
incur approximately $50 million to $55 million in capital expenditures
during 2010, related primarily to improvements at existing centers and
information system upgrades.
Obligations
and Commitments
The
following table provides information about our contractual obligations and
commitments in future years as of December 31, 2009 (in thousands):
|
Payments
Due by Period
|
||||||||||||||
|
After
|
||||||||||||||
|
Total
|
2010
|
2011
|
2012
|
2013
|
2014
|
2014
|
||||||||
|
Contractual
Obligations:
|
||||||||||||||
|
Debt,
including interest
|
||||||||||||||
|
payments
(1)
|
$
|
969,133
|
$
|
90,988
|
$
|
83,278
|
$
|
46,422
|
$
|
47,438
|
$
|
365,911
|
$
|
335,096
|
|
Capital
leases (2)
|
995
|
409
|
334
|
193
|
52
|
7
|
-
|
|||||||
|
Construction
commitments
|
1,947
|
1,947
|
-
|
-
|
-
|
-
|
-
|
|||||||
|
Purchase
obligations (3)
|
178,200
|
82,200
|
24,000
|
24,000
|
24,000
|
24,000
|
-
|
|||||||
|
Operating
leases (4)
|
500,388
|
89,141
|
83,700
|
80,446
|
76,955
|
44,523
|
125,623
|
|||||||
|
Other
liabilities (5)
|
19,953
|
2,035
|
17,918
|
-
|
-
|
-
|
-
|
|||||||
|
Total
|
$
|
1,670,616
|
$
|
266,720
|
$
|
209,230
|
$
|
151,061
|
$
|
148,445
|
$
|
434,441
|
$
|
460,719
|
|
Amount
of Commitment Expiration Per Period
|
||||||||||||||
|
Total
|
||||||||||||||
|
Amounts
|
After
|
|||||||||||||
|
Committed
|
2010
|
2011
|
2012
|
2013
|
2014
|
2014
|
||||||||
|
Other
Commercial Commitments:
|
||||||||||||||
|
Letters
of credit (6)
|
$
|
62,849
|
$
|
62,849
|
$
|
-
|
$
|
-
|
$
|
-
|
$
|
-
|
$
|
-
|
|
Total
|
$
|
62,849
|
$
|
62,849
|
$
|
-
|
$
|
-
|
$
|
-
|
$
|
-
|
$
|
-
|
|
(1)
|
Debt
includes principal payments and interest payments through the maturity
dates. Total interest on debt, based on contractual rates, is $270.3
million, of which $2.1 million is attributable to variable interest rates
determined using the weighted average method.
|
|
(2)
|
Includes
interest of $0.3 million.
|
|
(3)
|
Represents
our estimated level of purchasing from our main suppliers assuming that we
continue to operate the same number of centers in future
periods.
|
|
(4)
|
Some
of our operating leases also have contingent rentals.
|
|
(5)
|
Represents
the liability associated with partnership options yet to be exercised of
$5.2 million, $14.1 million of liability due to the previous shareholders
of Harborside when certain tax benefits associated with that acquisition
are realized and $0.6 million for a liability assumed with a hospice
acquisition. Excludes liabilities for uncertain tax positions
that are included in other liabilities at December 31, 2009 for which we
are unable to make a reasonably reliable estimate as to when, if at all,
cash settlements with taxing authorities will occur.
|
|
(6)
|
Letters
of credit expire annually but may be reissued pursuant to a $70.0 million
letter of credit facility that terminates in April
2013.
|
45
SUN
HEALTHCARE GROUP, INC. AND SUBSIDIARIES
Critical
Accounting Estimates
Our
discussion and analysis of the financial condition and results of operations are
based upon the consolidated financial statements, which have been prepared in
accordance with accounting principles generally accepted in the United States.
The preparation of these financial statements requires the use of estimates and
judgments that affect the reported amounts and related disclosures of assets and
liabilities, the disclosure of contingent assets and liabilities at the date of
the financial statements and the reported amounts of revenues and expenses
during the reporting period. Actual results may differ materially from these
estimates. We believe the following are the most significant judgments and
estimates affecting the accounting policies we use in the preparation of the
consolidated financial statements.
Net revenues. Net
revenues consist of long-term and subacute care revenues, rehabilitation therapy
revenues, and medical staffing services revenues. Net revenues are recognized as
services are provided. Revenues are recorded net of provisions for discount
arrangements with commercial payors and contractual allowances with third-party
payors, primarily Medicare and Medicaid. Net revenues realizable under
third-party payor agreements are subject to change due to examination and
retroactive adjustment. Estimated third-party payor settlements are recorded in
the period the related services are rendered. The methods of making such
estimates are reviewed periodically, and differences between the net amounts
accrued and subsequent settlements or estimates of expected settlements are
reflected in current results of operations, when determined.
Accounts receivable and related
allowance. Our accounts receivable relate to services provided
by our various operating divisions to a variety of payors and customers. The
primary payors for services provided in healthcare centers that we operate are
the Medicare program and the various state Medicaid programs. The rehabilitation
therapy service operations provide services to patients in nonaffiliated
healthcare centers. The billings for those services are submitted to the
nonaffiliated centers. Many of the nonaffiliated healthcare centers receive a
large majority of their revenues from the Medicare program and the state
Medicaid programs.
Estimated
provisions for losses on accounts receivable are recorded each period as an
expense in the income statement. In evaluating the collectibility of
accounts receivable, we consider a number of factors, including the age of the
accounts, changes in collection patterns, the financial condition of our
customers, the composition of patient accounts by payor type, the status of
ongoing disputes with third-party payors and general industry
conditions. Any changes in these factors or in the actual collections
of accounts receivable in subsequent periods may require changes in the
estimated provision for loss. Changes in these estimates are charged or credited
to the results of operations in the period of change. In addition, a
retrospective collection analysis is performed within each operating company to
test the adequacy of the reserve on a semi-annual basis.
The
allowance for doubtful accounts related to centers that we have divested was
based on a percentage of outstanding accounts receivable at the time of
divestiture and was recorded in gain or loss on disposal of discontinued
operations, net. As collections are recognized, the allowance is adjusted as
appropriate. As of December 31, 2009, accounts receivable for divested
operations were significantly reserved.
Insurance. We
self-insure for certain insurable risks, including general and professional
liabilities, workers' compensation liabilities and employee health insurance
liabilities through the use of self-insurance or retrospective and self-funded
insurance policies and other hybrid policies, which vary by the states in which
we operate. There is a risk that amounts funded to our self-insurance programs
may not be sufficient to respond to all claims asserted under those
programs. Insurance reserves represent estimates of future claims
payments. This liability includes an estimate of the development of reported
losses and losses incurred but not reported. Provisions for changes in insurance
reserves are made in the period of the related coverage. An
independent actuarial analysis is prepared twice a year to assist management in
determining the adequacy of the self-insurance obligations booked as liabilities
in our financial statements. The methods of making such estimates and
establishing the resulting reserves
46
SUN
HEALTHCARE GROUP, INC. AND SUBSIDIARIES
are
reviewed periodically and are based on historical paid claims information and
nationwide nursing home trends. Any adjustments resulting there from are
reflected in current earnings. Claims are paid over varying periods, and future
payments may be different than the estimated reserves.
We
evaluate the adequacy of our self-insurance reserves on a quarterly basis and
perform detailed actuarial analyses semi-annually in the second and fourth
quarters. The analyses use generally accepted actuarial methods in evaluating
the workers’ compensation reserves and general and professional liability
reserves. For both the workers’ compensation reserves and the general
and professional liability reserves, those methods include reported and paid
loss development methods, expected loss method and the reported and paid
Bornhuetter-Ferguson methods. Reported loss methods focus on
development of case reserves for incurred losses through claims closure. Paid
loss methods focus on development of claims actually paid to date. Expected loss
methods are based upon an anticipated loss per unit of measure. The
Bornhuetter-Ferguson method is a combination of loss development methods and
expected loss methods.
The
foundation for most of these methods is our actual historical reported and/or
paid loss data, over which we have effective internal controls. We utilize
third-party administrators (“TPAs”) to process claims and to provide us with the
data utilized in our semi-annual actuarial analyses. The TPAs are under the
oversight of our in-house risk management and legal functions. These functions
ensure that the claims are properly administered so that the historical data is
reliable for estimation purposes. Case reserves, which are approved by our legal
and risk management departments, are determined based on our estimate of the
ultimate settlement of individual claims. In cases where our historical data are
not statistically credible, stable, or mature, we supplement our experience with
nursing home industry benchmark reporting and payment patterns.
The use
of multiple methods tends to eliminate any biases that one particular method
might have. Management’s judgment based upon each method’s inherent limitations
is applied when weighting the results of each method. The results of
each of the methods are estimates of ultimate losses which includes the case
reserves plus an estimate for future development of these reserves based on past
trends, and an estimate for losses incurred but not
reported. These results are compared by accident year and an
estimated unpaid loss and allocated loss adjustment expense are determined for
the open accident years based on judgment reflecting the range of estimates
produced by the methods.
During
2009, we determined that the previous estimates for workers’ compensation
reserves for accident years prior to 2009 were understated, based on currently
available information, by $2.0 million or approximately 2.9%. Of that
amount, $1.7 million related to continuing operations and $0.3 million related
to discontinued operations. While certain of the claims settled for
less than the case reserves, a number also settled for greater than the case
reserves. There were no large or unusual settlements during the
period. As of December 31, 2009, the discounting of the policy
periods resulted in a reduction to our reserves of $13.0 million.
We also
determined during 2009 that the previous estimates for general and professional
liabilities reserves for accident years prior to 2009 were understated, based on
currently available information, by $7.4 million or approximately
8.5%. Of that amount, $6.5 million related to continuing operations
and $0.9 million related to discontinued operations. Although there
were no large or unusual settlements or significant new claims during the
period, we have experienced in 2009 higher level of claims than we anticipated.
Professional liability claims have a reporting tail that exceeds one
year. A significant component of our reserves is estimates for
incidents that have been incurred but not reported. The increase in prior period
reserves is driven in part by an increase in our estimate of incurred but not
reported claims.
47
SUN
HEALTHCARE GROUP, INC. AND SUBSIDIARIES
Impairment
of assets.
Goodwill and Accounting for
Business Combinations
Goodwill
represents the excess of the purchase price over the fair value of the net
assets of acquired companies. Our goodwill included in our
consolidated balance sheets as of December 31, 2009 and 2008 was $338.3 and
$326.8 million, respectively. The increase in our goodwill during
2009 was primarily the result of a hospice acquisition in our Inpatient Services
segment.
Under
GAAP, goodwill and intangible assets with indefinite lives are not amortized;
however, they are subject to annual impairment tests. Intangible assets with
definite lives continue to be amortized over their estimated useful
lives.
The
purchase price of acquisitions is allocated to the assets acquired and
liabilities assumed based upon their respective fair values. We may
engage independent third-party valuation firms to assist us in determining the
fair values of assets acquired and liabilities assumed for significant
acquisitions. Such valuations require us to make significant
estimates and assumptions, including projections of future events and operating
performance.
We
perform our annual goodwill impairment analysis during the fourth quarter of
each year. A reporting unit is a business for which discrete
financial information is produced and reviewed by operating segment management
and provides services that are distinct from the other components of the
operating segment and are reviewed at the division level. For our
Rehabilitation Therapy Services and Medical Staffing Services segments, the
reporting unit for our annual goodwill impairment analysis was determined to be
at the segment level. For our Inpatient Services segment, the
reporting unit for our annual goodwill impairment analysis was determined to be
at one level below our segment level. Our goodwill balances by
reporting unit as of December 31, 2009 are (in thousands):
|
Inpatient
Services – Healthcare facilities reporting unit
|
$
|
314,729
|
|
Inpatient
Services – Hospice services reporting unit
|
18,959
|
|
|
Rehabilitation
Therapy Services segment
|
75
|
|
|
Medical
Staffing Services segment
|
4,533
|
|
|
Total
goodwill
|
$
|
338,296
|
We tested
impairment by comparing the net assets of each reporting unit to their
respective fair values. We determined the estimated fair value of each reporting
unit using a discounted cash flow analysis and other appropriate valuation
methodologies. The discounted cash flow model utilizes five years of projected
cash flows for each reporting unit. The projected financial results are created
from critical assumptions and estimates based upon management’s business plan
and historical trends while giving consideration to the global economic
environment. Determining fair value requires the exercise of significant
judgments about appropriate discount rates, business growth rates, the amount
and timing of expected future cash flows and market information relevant to our
overall company value. In addition, to validate the reasonableness of our
assumptions, we utilized our discounted cash flow model on a consolidated basis
and compared the estimated fair value to our market capitalization as of
December 31, 2009. Key assumptions in the discounted cash flow model are as
follows:
Business Growth Assumptions –
In determining our projected Inpatient Services revenue growth rates for our
discounted cash flow model, we focus on the two primary drivers: average daily
census (“ADC”) and reimbursement rates. Key revenue inputs include historical
ADC adjusted for known trends and current Medicare and Medicaid rates adjusted
for anticipated changes at next renewal cycle. ADC
48
SUN
HEALTHCARE GROUP, INC. AND SUBSIDIARIES
trends
have been reasonably constant within a narrow range and may be influenced over
the long run by a number of factors, including demographic changes in the
population we serve and our ability to deliver quality service in an attractive
environment. Generally long term care reimbursement rates are set annually
by the payor. To estimate these rates, we evaluate the current reimbursement
climate and adjust historical trends where appropriate. Significant adverse rate
changes in any one year would cause us to reevaluate our projected rates.
In recent years we have generated historical revenue growth of 3.2% to
6.2% annually. Expenses generally vary with ADC and have historically
grown by approximately 2.9% to 5.6% annually. Labor is the largest
component of our expenses. We consider labor market trends and staffing
needs for the projected ADC levels in determining labor growth rates to be used
in our projections. The projected growth rates used in our discounted cash flow
model took into account the potential adverse effects of the current economic
downturn on our projected revenue and expenses.
Terminal Value EBITDA Multiple
– Consistent with commonly accepted valuation techniques, a terminal
multiple for the final year’s projected results is applied to estimate our value
in the final year of the analysis. That multiple is applied to the final year’s
projected EBITDA from continuing operations.
Discount Rate – Market
conditions indicated that a discount rate of 17.5% was appropriate at December
31, 2009. This discount rate is consistent with our overall market
capitalization comparison. We consistently apply the same discount rate to the
evaluation of each reporting unit.
In the
event a unit's net assets exceed its fair value, an implied fair value of
goodwill must be determined by assigning the unit's fair value to each asset and
liability of the unit. The excess of the fair value of the reporting unit over
the amounts assigned to its assets and liabilities is the implied fair value of
goodwill. An impairment loss is measured by the difference between the goodwill
carrying value and the implied fair value. Based on the analysis
performed, we determined there was no goodwill impairment for the years ended
December 31, 2009, 2008 or 2007.
In order
to analyze the sensitivity our assumptions have on our overall impairment
assessment, we evaluated the impact that a hypothetical reduction in the fair
value of a reporting unit would have on our conclusions. Without
giving consideration to a control premium, we can incur up to a cumulative 5.0%
decrease in our net cash from revenues and expenses over the next five years,
which equates to approximately $110 million in less net cash than our
projections, and still avoid having a goodwill impairment charge in any
reporting unit.
Indefinite Lived
Intangibles
Our
indefinite lived intangibles primarily consist of values assigned to CONs
obtained through various acquisitions.
We
evaluate the recoverability of our indefinite lived intangibles, which are
principally CONs, by comparing the asset's respective carrying value to
estimates of fair value. We determine the estimated fair value of these
intangible assets through an estimate of incremental cash flows with the
intangible assets versus cash flows without the intangible assets in place. We
determined there was
no impairment charge to our indefinite lived intangibles for the years
ended December 31, 2009, 2008 or 2007.
Finite Lived
Intangibles
Our
finite lived intangibles include tradenames (principally recognized with the
Harborside and hospice acquisitions), favorable lease intangibles, deferred
financing costs, customer contracts and various licenses.
49
SUN
HEALTHCARE GROUP, INC. AND SUBSIDIARIES
We evaluate
the recoverability of our finite lived intangibles if an impairment indicator is
present. As there were no such indicators, we determined there was no
impairment of our finite lived intangibles for the years ended December 31,
2009, 2008 or 2007.
Long-Lived
Assets
GAAP
requires impairment losses to be recognized for long-lived assets used in
operations when indicators of impairment are present and the estimated
undiscounted cash flows are not sufficient to recover the assets' carrying
amounts at each center. The impairment loss is measured by comparing the
estimated fair value of the asset, usually based on discounted cash flows, to
its carrying amount. We assess the need for an impairment write-down
when such indicators of impairment are present. We determined there was no
impairment to our long-lived assets used in continuing operations for the
years ended December 31, 2009, 2008, and 2007.
Income
Taxes. Pursuant to GAAP, an asset or liability is recognized
for the deferred tax consequences of temporary differences between the tax bases
of assets and liabilities and their reported amounts in the financial
statements. These temporary differences would result in taxable or
deductible amounts in future years when the reported amounts of the assets are
recovered or liabilities are settled. Deferred tax assets are also
recognized for the future tax benefits from net operating loss, capital loss and
tax credit carryforwards. A valuation allowance is to be provided for
the net deferred tax assets if it is more likely than not that some portion or
all of the net deferred tax assets will not be realized.
In
evaluating the need to record or continue to reflect a valuation allowance, all
items of positive evidence (e.g., future sources of taxable income and tax
planning strategies) and negative evidence (e.g., history of taxable losses) are
considered. In determining future sources of taxable income, we use
management-approved budgets and projections of future operating results for an
appropriate number of future periods, taking into consideration our history of
operating results, taxable income and losses, etc. This future
taxable income is then used, along with all other items of positive and negative
evidence, to determine the amount of valuation allowance that is needed, and
whether any amount of such allowance should be reversed.
We are
subject to income taxes in the U.S. and numerous state and local
jurisdictions. Significant judgment is required in evaluating our
uncertain tax positions and determining our provision for income
taxes. Effective January 1, 2007, we adopted the GAAP guidance for
accounting for uncertainty in income tax positions, which contains a two-step
approach to recognizing and measuring uncertain tax positions. The
first step is to evaluate the tax position for recognition by determining if the
weight of available evidence indicates that it is more likely than not that the
position will be sustained on audit, including resolution of related appeals or
litigation processes, if any. The second step is to measure the tax
benefit as the largest amount that is more than 50% likely of being realized
upon settlement. We reserve for our uncertain tax positions, and we
adjust these reserves in light of changing facts and circumstances, such as the
closing of a tax audit or the expiration of the statute of
limitations.
Recent
Accounting Pronouncements
Discussion
of recent accounting pronouncements can be found in the “Recent Accounting
Pronouncements” portion of Note 2 – “Summary of Significant Accounting Policies”
to our consolidated financial statements included in this Annual Report on Form
10-K, which is incorporated by reference in response to this item.
50
SUN
HEALTHCARE GROUP, INC. AND SUBSIDIARIES
Impact
of Inflation
CMS
implemented market basket increases of 2.2%, 3.4%, and 3.3% to the Medicare
reimbursement rates for Federal fiscal years 2009, 2008, and 2007, respectively,
which increases were primarily intended to keep track with inflation. The final
rule for Federal fiscal year 2009 also had a 3.3% reduction for a forecast
error/parity adjustment. We estimate that the net result of the two
2009 adjustments, based on our current acuity mix, will be a decrease of 0.85%
in our reimbursement rates, which we estimate will decrease our net revenues by
approximately $1.0 million per quarter.
Off-Balance
Sheet Arrangements
None.
Item
7A. Quantitative and Qualitative Disclosures About Market
Risk
We are
exposed to market risk because we hold debt that is sensitive to changes in
interest rates. We manage our interest rate risk exposure by
maintaining a mix of fixed and variable rates for debt. We also
manage our interest expense by entering into interest rate swap
agreements. We entered into interest rate swap agreements in July
2008 and July 2007. The interest rate swap agreements effectively
modify our exposure to interest rate risk by converting a portion of our
floating rate interest payments over the life of the agreement without an
exchange of the underlying principal amount. The July 2008 agreement
is based on a notional amount of $50.0 million and has a term of two
years. Settlement occurs on a quarterly basis, which is based upon a
floating rate of LIBOR and an annual fixed rate of 3.65%. The July
2007 agreement is based on a notional amount of $100.0 million and has a term of
three years. Settlement occurs on a quarterly basis, which is based
upon a floating rate of LIBOR and an annual fixed rate of 5.388%.
|
Expected
Maturity Dates
|
Fair
Value
|
Fair
Value
|
|||||||||||||||||||||||||
|
December
31,
|
December
31,
|
||||||||||||||||||||||||||
|
2010
|
2011
|
2012
|
2013
|
2014
|
Thereafter
|
Total
|
2009
(1)
|
2008
(1)
|
|||||||||||||||||||
|
(Dollars
in thousands)
|
|||||||||||||||||||||||||||
|
Long-term
Debt:
|
|||||||||||||||||||||||||||
|
Fixed
rate debt(2)
|
$
|
34,652
|
$
|
15,537
|
$
|
4,727
|
$
|
6,045
|
$
|
166,688
|
$
|
268,117
|
$
|
495,766
|
$
|
375,801
|
$
|
442,992
|
|||||||||
|
Rate
|
9.8
|
%
|
7.8
|
%
|
7.3
|
%
|
6.8
|
%
|
6.8
|
%
|
8.4
|
%
|
|||||||||||||||
|
Variable
rate debt
|
$
|
11,764
|
$
|
26,465
|
$
|
1,902
|
$
|
1,902
|
$
|
162,072
|
$
|
-
|
$
|
204,105
|
$
|
198,969
|
$
|
202,442
|
|||||||||
|
Rate
|
2.6
|
%
|
3.2
|
%
|
2.5
|
%
|
2.5
|
%
|
2.5
|
%
|
-
|
%
|
|||||||||||||||
|
Interest
rate swap:
|
|||||||||||||||||||||||||||
|
Variable
to fixed
|
$
|
150,000
|
-
|
-
|
-
|
-
|
-
|
$
|
150,000
|
$
|
(5,048
|
)
|
$
|
(7,644
|
)
|
||||||||||||
|
Average
pay rate
|
4.8
|
%
|
-
|
-
|
-
|
-
|
-
|
||||||||||||||||||||
|
Average
receive rate
|
0.3
|
%
|
-
|
-
|
-
|
-
|
-
|
||||||||||||||||||||
|
(1)
|
The
fair value of fixed and variable rate debt was determined based on the
current rates offered for debt with similar risks and
maturities.
|
|
(2)
|
Excludes
fair value premiums of $0.7 million related to
acquisitions.
|
Item
8. Financial Statements and Supplementary Data
Information
with respect to Item 8 is contained in our consolidated financial statements and
financial statement schedules and is set forth herein beginning on Page F-1
which information is incorporated by reference into this Item 8.
Item
9. Changes in and Disagreements with Accountants on Accounting and
Financial Disclosure
Not
applicable.
51
SUN
HEALTHCARE GROUP, INC. AND SUBSIDIARIES
Item
9A. Controls and Procedures
Management's
Report on Disclosure Controls and Procedures
We
maintain disclosure controls and procedures defined in Rule 13a-15(e) under the
Exchange Act, as controls and other procedures that are designed to ensure that
information required to be disclosed by the issuer in the reports that it files
or submits under the Exchange Act is recorded, processed, summarized and
reported, within the time periods specified in the Securities and Exchange
Commission’s rules and forms. Disclosure controls and procedures include,
without limitation, controls and procedures designed to ensure that information
required to be disclosed in the reports that we file or submit under the
Exchange Act is accumulated and communicated to our management, including our
Chief Executive Officer (“CEO”), Rick Matros, and Chief Financial Officer
(“CFO”), Bryan Shaul, as appropriate to allow timely decisions regarding
required disclosure.
As of the
end of the period covered by this report, an evaluation was performed under the
supervision and with the participation of management, including the CEO and CFO,
of the effectiveness of the Company’s disclosure controls and
procedures. Based on that evaluation, our CEO and CFO concluded that
the Company’s disclosure controls and procedures were effective as of December
31, 2009.
Management's
Report on Internal Control over Financial Reporting
Management
is responsible for establishing and maintaining adequate internal control over
financial reporting (as defined in Rule 13a-15(f) under the Exchange
Act). Because of its inherent limitations, internal control over
financial reporting can provide only reasonable assurance with respect to
financial statement preparation and presentation. Therefore, even those systems
determined to be effective may not prevent or detect all misstatements. Also,
projections of any evaluation of effectiveness to future periods are subject to
the risk that controls may become inadequate because of changes in conditions,
or that the degree of compliance with the policies or procedures may
deteriorate.
Management
assessed the effectiveness of internal control over financial reporting as of
December 31, 2009, using the criteria set forth by the Committee of Sponsoring
Organizations of the Treadway Commission (“COSO”) in Internal Control – Integrated
Framework. Based on this assessment, our management concluded
that our internal control over financial reporting was effective as of December
31, 2009.
The
effectiveness of the Company’s internal control over financial reporting as of
December 31, 2009 has been audited by PricewaterhouseCoopers LLP (“PwC”), an
independent registered public accounting firm, as stated in their report which
appears herein.
Changes
to Internal Control over Financial Reporting
There
were no changes in the Company’s internal control over financial reporting
during the fourth quarter of 2009 that have materially affected, or are
reasonably likely to materially affect, the Company’s internal control over
financial reporting.
Item
9B. Other Information
Not
applicable.
52
SUN
HEALTHCARE GROUP, INC. AND SUBSIDIARIES
PART
III
Item
10. Directors, Executive Officers and Corporate
Governance
The
information required under Item 10 is incorporated herein by reference to our
definitive proxy statement, which we will file pursuant to Exchange Act
Regulation 14A prior to April 30, 2010.
Item
11. Executive Compensation
The
information required under Item 11 is incorporated herein by reference to our
definitive proxy statement, which we will file pursuant to Exchange Act
Regulation 14A prior to April 30, 2010.
Item
12. Security Ownership of Certain Beneficial Owners and Management
and Related Stockholder Matters
The
information required under Item 12 is incorporated herein by reference to our
definitive proxy statement, which we will file pursuant to Exchange Act
Regulation 14A prior to April 30, 2010.
Item
13. Certain Relationships and Related Transactions and Director
Independence
The
information required under Item 13 is incorporated herein by reference to our
definitive proxy statement, which we will file pursuant to Exchange Act
Regulation 14A prior to April 30, 2010.
Item
14. Principal Accountant Fees and Services
The
information required under Item 14 is incorporated herein by reference to our
definitive proxy statement, which we will file pursuant to Exchange Act
Regulation 14A prior to April 30, 2010.
53
SUN
HEALTHCARE GROUP, INC. AND SUBSIDIARIES
PART
IV
Item
15. Exhibits, Financial Statements and Schedules
|
(a)
|
(1)
|
The
following consolidated financial statements of Sun Healthcare Group, Inc.
and subsidiaries are filed as part of this report under Item 8 –
“Financial Statements and Supplementary Data”:
|
|
Report
of PricewaterhouseCoopers LLP, Independent Registered Public Accounting
Firm
|
||
|
Report
of Ernst & Young LLP, Independent Registered Public Accounting
Firm
|
||
|
Consolidated
Balance Sheets as of December 31, 2009 and 2008
|
||
|
Consolidated
Income Statements for the years ended December 31, 2009, 2008 and
2007
|
||
|
Consolidated
Statements of Stockholders’ Equity and Comprehensive Income for the years
ended December 31, 2009, 2008 and 2007
|
||
|
Consolidated
Statements of Cash Flows for the years ended December 31, 2009, 2008 and
2007
|
||
|
Notes
to Consolidated Financial Statements
|
||
|
(2)
|
Financial
schedules required to be filed by Item 8 of this form, and by Item
15(a)(2) below:
|
|
|
Schedule
II Valuation and Qualifying Accounts for the years ended December 31,
2009, 2008 and 2007
|
||
|
All
other financial schedules are not required under the related instructions
or are inapplicable and therefore have been omitted.
|
||
|
(3)
|
Exhibits
|
|
|
Exhibit
|
|
|
Number
|
Description
of Exhibits
|
|
2.1(1)
|
Agreement
and Plan of Merger dated October 19, 2006 by and among Sun Healthcare
Group, Inc., Horizon Merger, Inc. and Harborside Healthcare
Corporation
|
|
3.1(10)
|
Amended
and Restated Certificate of Incorporation of Sun Healthcare Group, Inc.,
as amended
|
|
3.2(3)
|
Amended
and Restated Bylaws of Sun Healthcare Group, Inc.
|
|
4.1*
|
Sample
Common Stock Certificate of Sun Healthcare Group, Inc.
|
|
4.2(4)
|
Indenture,
dated as of April 12, 2007, between Sun Healthcare Group, Inc., the
subsidiaries of Sun Healthcare Group, Inc., named therein and Wells Fargo
Bank, National Association, as Trustee
|
54
SUN HEALTHCARE GROUP, INC. AND
SUBSIDIARIES
|
4.2.1(5)
|
First
Supplemental Indenture, dated as of April 19, 2007, among Sun Healthcare
Group, Inc., Harborside Healthcare Corporation, certain subsidiaries of
Harborside Healthcare Corporation named therein and Wells Fargo Bank,
National Association, as Trustee
|
|
4.2.2(6)
|
Second
Supplemental Indenture, dated as of October 31, 2008, among Sun Healthcare
Group, Inc., Holisticare Hospice, LLC and Wells Fargo Bank, National
Association, as Trustee
|
|
4.2.3*
|
Third
Supplemental Indenture, dated as of October 26, 2009, among Sun Healthcare
Group, Inc., Allegiance Hospice Group, Inc., certain subsidiaries of
Allegiance Hospice Group, Inc. named therein and Wells Fargo Bank,
National Association, as Trustee
|
|
4.3(4)
|
Registration
Rights Agreement, dated April 12, 2007, among Sun Healthcare Group,
Inc., the subsidiaries of Sun Healthcare Group, Inc. named therein and the
Initial Purchasers of the Notes issued pursuant to the above described
Indenture.
|
|
4.3.1(5)
|
Joinder
to the Registration Rights Agreement, dated April 19, 2007, among
Harborside Healthcare Corporation, the subsidiaries of Harborside
Healthcare Corporation named therein and the Initial Purchasers of the
Notes issued pursuant to the above described Indenture.
|
|
4.5(4)
|
Escrow
Agreement, dated as of April 12, 2007, between Sun Healthcare Group, Inc.
and Wells Fargo Bank, National Association, as Escrow
Agent
|
|
4.6
|
The
Registrant has instruments that define the rights of holders of long-term
debt that are not being filed herewith, in reliance upon Item
601(b)(4)(iii) of Regulation S-K. The Registrant agrees to furnish to the
SEC, upon request, copies of these instruments
|
|
10.1(5)
|
Credit
Agreement, dated as of April 19, 2007, among Sun Healthcare Group, Inc.,
the Lenders named therein and Credit Suisse, as Administrative Agent and
Collateral Agent for the Lenders
|
|
10.2(7)+
|
Amended
and Restated 2002 Non-Employee Director Equity Incentive Plan of Sun
Healthcare Group, Inc.
|
|
10.3(6)+
|
Amended
and Restated 2004 Equity Incentive Plan of Sun Healthcare Group,
Inc.
|
|
10.3.1(6)+
|
Form
of Stock Option Agreement
|
|
10.3.2(6)+
|
Form
of Stock Unit Agreement for employees
|
|
10.3.3(6)+
|
Form
of Stock Unit Agreement for non-employee directors
|
|
10.4(6)+
|
Non-employee
Directors Stock-for-Fees Program and Payment Election
Form
|
|
10.6(12)+
|
Amended
and Restated Employment Agreement by and between Sun Healthcare Group,
Inc. and Richard K. Matros dated as of October 26, 2009
|
|
10.7(6)+
|
Amended
and Restated Employment Agreement by and between Sun Healthcare Group,
Inc. and L. Bryan Shaul dated as of December 17, 2008
|
55
SUN HEALTHCARE GROUP, INC. AND
SUBSIDIARIES
|
10.8(6)+
|
Amended
and Restated Employment Agreement by and between Sun Health Specialty
Services, Inc. and William A. Mathies dated as of December 17,
2008
|
|
10.9(6)+
|
Amended
and Restated Employment Agreement by and between Sun Healthcare Group,
Inc. and Michael Newman dated as of December 17, 2008
|
|
10.10(6)+
|
Amended
and Restated Employment Agreement by and between Sun Healthcare Group,
Inc. and Chauncey J. Hunker dated as of December 17,
2008
|
|
10.11(8)+
|
Non-Employee
Director Compensation Policy of Sun Healthcare Group, Inc. adopted as of
March 18, 2008
|
|
10.12*+
|
Sun
Healthcare Group, Inc. Executive Bonus Plan
|
|
10.13(10)
|
Second
Amended and Restated Master Lease Agreement among Sun Healthcare Group,
Inc. and certain of its subsidiaries (as Lessees) and Omega Healthcare
Investors, Inc. and certain of its subsidiaries (as Lessors) dated
February 1, 2008
|
|
10.13.1(6)
|
First
Amendment to Second Amended and Restated Master Lease Agreement among Sun
Healthcare Group, Inc. and certain of its subsidiaries (as Lessees) and
Omega Healthcare Investors, Inc. and certain of its subsidiaries (as
Lessors) dated August 26, 2008
|
|
10.13.2(6)
|
Second
Amendment to Second Amended and Restated Master Lease Agreement among Sun
Healthcare Group, Inc. and certain of its subsidiaries (as Lessees) and
Omega Healthcare Investors, Inc. and certain of its subsidiaries (as
Lessors) dated February 26, 2009
|
|
10.14(9)+
|
Sun
Healthcare Group, Inc. Deferred Compensation Plan
|
|
10.15(11)+
|
Amended
and Restated Severance Benefits Agreement dated as of December 17, 2008 by
and between Richard L. Peranton and CareerStaff Unlimited,
Inc.
|
|
10.16*+
|
2010
Incentive Bonus Plan for President of SunDance Rehabilitation
Corporation
|
|
10.17(13)+
|
Sun
Healthcare Group, Inc. 2009 Performance Incentive Plan
|
|
10.18*+
|
Amended
and Restated Severance Benefits Agreement dated as of December 17, 2008 by
and between Sue Gwyn and SunDance Rehabilitation
Corporation
|
|
14.1(2)
|
Code
of Ethics for Chief Executive Officer, Financial Officers and Financial
Personnel
|
|
21.1*
|
Subsidiaries
of Sun Healthcare Group, Inc.
|
|
23.1*
|
Consent
of PricewaterhouseCoopers LLP
|
|
23.2*
|
Consent
of Ernst & Young LLP
|
|
31.1*
|
Section
302 Sarbanes-Oxley Certifications by Principal Executive
Officer
|
56
SUN
HEALTHCARE GROUP, INC. AND SUBSIDIARIES
|
31.2*
|
Section
302 Sarbanes-Oxley Certifications by Principal Financial and Accounting
Officer
|
|
32.1*
|
Section
906 Sarbanes-Oxley Certifications by Principal Executive
Officer
|
|
32.2*
|
Section
906 Sarbanes-Oxley Certifications by Principal Financial and Accounting
Officer
|
_______________
* Filed
herewith.
+ Designates
a management compensation plan, contract or arrangement
|
(1)
|
Incorporated
by reference from exhibits to our Form 8-K filed on October 25,
2006
|
|
(2)
|
Incorporated
by reference from exhibits to our Form 10-Q filed on May 7,
2004
|
|
(3)
|
Incorporated
by reference from exhibits to our Form 8-K filed on December 27,
2007
|
|
(4)
|
Incorporated
by reference from exhibits to our Form 8-K filed on April 18,
2007
|
|
(5)
|
Incorporated
by reference from exhibits to our Form 8-K filed on April 25,
2007
|
|
(6)
|
Incorporated
by reference from exhibits to our Form 10-K filed on March 4,
2009
|
|
(7)
|
Incorporated
by reference from exhibits to our Form 10-Q filed on August 16,
2002
|
|
(8)
|
Incorporated
by reference from exhibits to our Form 8-K filed on April 3,
2008
|
|
(9)
|
Incorporated
by reference from exhibits to our Form 10-Q filed on April 29,
2009
|
|
(10)
|
Incorporated
by reference from exhibits to our Form 10-K filed on March 7,
2008
|
|
(11)
|
Incorporated
by reference from exhibits to our Form 10-Q filed on August 7,
2009
|
|
(12)
|
Incorporated
by reference from exhibits to our Form 10-Q filed on October 28,
2009
|
|
(13)
|
Incorporated
by reference from exhibits to our Form 8-K filed on June 11,
2009
|
SIGNATURES
Pursuant
to the requirements of Section 13 or 15(d) of the Securities Exchange
Act of 1934, the registrant has duly caused this Report to be signed on its
behalf by the undersigned, thereunto duly authorized.
|
SUN
HEALTHCARE GROUP, INC.
|
|
|
By: /s/ L. Bryan
Shaul
|
|
|
L.
Bryan Shaul
|
|
|
Chief
Financial Officer
|
March 4,
2010
57
SUN
HEALTHCARE GROUP, INC. AND SUBSIDIARIES
Pursuant
to the requirements of the Securities Exchange Act of 1934, this Report has been
signed below by the following persons on behalf of the registrant as of March 4,
2010 in the capacities indicated.
|
Signatures
|
Title
|
|
Chairman
of the Board and Chief Executive Officer
|
|
|
/s/ Richard K.
Matros
|
(Principal
Executive Officer)
|
|
Richard
K. Matros
|
|
|
Executive
Vice President and Chief Financial
|
|
|
/s/ L. Bryan
Shaul
|
Officer
(Principal Financial and Accounting Officer)
|
|
L.
Bryan Shaul
|
|
| /s/ Gregory S. Anderson |
Director
|
|
Gregory
S. Anderson
|
|
| /s/ Tony M. Astorga |
Director
|
|
Tony
M. Astorga
|
|
| /s/ Christian K. Bement |
Director
|
|
Christian
K. Bement
|
|
| /s/ Michael J. Foster |
Director
|
|
Michael
J. Foster
|
|
| /s/ Barbara B. Kennelly |
Director
|
|
Barbara
B. Kennelly
|
|
| /s/ Steven M. Looney |
Director
|
|
Steven
M. Looney
|
|
| /s/ Milton J. Walters |
Director
|
|
Milton
J. Walters
|
|
58
SUN
HEALTHCARE GROUP, INC. AND SUBSIDIARIES
Index
to Consolidated Financial Statements
December
31, 2009
|
Page
|
|
|
Report
of PricewaterhouseCoopers LLP, Independent Registered Public Accounting
Firm
|
F-2
|
|
Report
of Ernst & Young LLP, Independent Registered Public Accounting
Firm
|
F-3
|
|
Consolidated
Balance Sheets
|
F-4
– F-5
|
|
As
of December 31, 2009 and 2008
|
|
|
Consolidated
Income Statements
|
F-6
|
|
For
the years ended December 31, 2009, 2008 and 2007
|
|
|
Consolidated
Statements of Stockholders’ Equity and Comprehensive
Income
|
F-7
|
|
For
the years ended December 31, 2009, 2008 and 2007
|
|
|
Consolidated
Statements of Cash Flows
|
F-8
– F-9
|
|
For
the years ended December 31, 2009, 2008 and 2007
|
|
|
Notes
to Consolidated Financial Statements
|
F-10
– F-55
|
|
Supplementary
Data (Unaudited) - Quarterly Financial Data
|
1 –
3
|
|
Schedule
II – Valuation and Qualifying Accounts
|
4
|
F-1
Report
of Independent Registered Public Accounting Firm
To the
Board of Directors and Stockholders
Sun
Healthcare Group, Inc.
In our
opinion, the consolidated financial statements listed in the accompanying index
present fairly, in all material respects, the financial position of Sun
Healthcare Group, Inc and its subsidiaries at December 31, 2009 and 2008, and
the results of their operations and their cash flows for the years then ended in
conformity with accounting principles generally accepted in the United States of
America. In addition, in our opinion the financial statement schedule
listed in the accompanying index on page F-1 presents fairly, in all material
respects, the information set forth therein when read in conjunction with the
related consolidated financial statements. Also in our opinion, the Company
maintained, in all material respects, effective internal control over financial
reporting as of December 31, 2009, based on criteria established in Internal Control - Integrated
Framework issued by the Committee of Sponsoring Organizations of the
Treadway Commission (COSO). The Company's management is responsible for these
financial statements and financial statement schedule, for maintaining
effective internal control over financial reporting and for its assessment of
the effectiveness of internal control over financial reporting, included in
Management's Report on Internal Control over Financial Reporting appearing under
Item 9A. Our responsibility is to express opinions on these financial
statements, on the financial statement schedule, and on the Company's
internal control over financial reporting based on our integrated audits. We
conducted our audits in accordance with the standards of the Public Company
Accounting Oversight Board (United States). Those standards require
that we plan and perform the audits to obtain reasonable assurance about whether
the financial statements are free of material misstatement and whether effective
internal control over financial reporting was maintained in all material
respects. Our audits of the financial statements included examining,
on a test basis, evidence supporting the amounts and disclosures in the
financial statements, assessing the accounting principles used and significant
estimates made by management, and evaluating the overall financial statement
presentation. Our audit of internal control over financial reporting
included obtaining an understanding of internal control over financial
reporting, assessing the risk that a material weakness exists, and testing and
evaluating the design and operating effectiveness of internal control based on
the assessed risk. Our audits also included performing such other
procedures as we considered necessary in the circumstances. We believe that our
audits provide a reasonable basis for our opinions.
A
company’s internal control over financial reporting is a process designed to
provide reasonable assurance regarding the reliability of financial reporting
and the preparation of financial statements for external purposes in accordance
with generally accepted accounting principles. A company’s internal
control over financial reporting includes those policies and procedures that
(i) pertain to the maintenance of records that, in reasonable detail,
accurately and fairly reflect the transactions and dispositions of the assets of
the company; (ii) provide reasonable assurance that transactions are
recorded as necessary to permit preparation of financial statements in
accordance with generally accepted accounting principles, and that receipts and
expenditures of the company are being made only in accordance with
authorizations of management and directors of the company; and
(iii) provide reasonable assurance regarding prevention or timely detection
of unauthorized acquisition, use, or disposition of the company’s assets that
could have a material effect on the financial statements.
Because
of its inherent limitations, internal control over financial reporting may not
prevent or detect misstatements. Also, projections of any evaluation
of effectiveness to future periods are subject to the risk that controls may
become inadequate because of changes in conditions, or that the degree of
compliance with the policies or procedures may deteriorate.
/s/
PricewaterhouseCoopers LLP
Irvine,
California
March 4,
2010
F-2
Report
of Ernst & Young LLP, Independent Registered Public Accounting
Firm
The Board
of Directors and Stockholders
Sun
Healthcare Group, Inc.
We have
audited the accompanying consolidated statements of income, stockholders’ equity
and comprehensive income, and cash flows of Sun Healthcare Group, Inc. (the
Company) for the year ended December 31, 2007. These financial
statements are the responsibility of the Company's management. Our
responsibility is to express an opinion on these financial statements based on
our audit.
We
conducted our audits in accordance with the standards of the Public Company
Accounting Oversight Board (United States). Those standards require that we plan
and perform the audit to obtain reasonable assurance about whether the financial
statements are free of material misstatement. An audit includes examining, on a
test basis, evidence supporting the amounts and disclosures in the financial
statements. An audit also includes assessing the accounting principles used and
significant estimates made by management, as well as evaluating the overall
financial statement presentation. We believe that our audits provide a
reasonable basis for our opinion.
In our
opinion, the financial statements referred to above present fairly, in all
material respects, the consolidated results of operations and cash flows of Sun
Healthcare Group, Inc. for the year ended December 31, 2007, in conformity with
U.S. generally accepted accounting principles.
As
discussed in Notes 2 and 10 to the consolidated financial statements, effective
January 1, 2007, the Company has changed its method of accounting for uncertain
tax positions.
/s/ Ernst
& Young LLP
Dallas,
Texas
March 5,
2008,
except
for Notes 2(n) and 8(b), as to which the date is
March 4,
2010
F-3
SUN
HEALTHCARE GROUP, INC. AND SUBSIDIARIES
CONSOLIDATED
BALANCE SHEETS
ASSETS
(in
thousands)
|
December
31, 2009
|
December
31, 2008
|
|||||
|
Current
assets:
|
||||||
|
Cash
and cash equivalents
|
$
|
104,483
|
$
|
92,153
|
||
|
Restricted
cash
|
24,034
|
34,676
|
||||
|
Accounts
receivable, net of allowance for doubtful accounts of
$55,402
|
||||||
|
and
$44,830 at December 31, 2009 and 2008, respectively
|
220,319
|
205,620
|
||||
|
Prepaid
expenses and other assets
|
21,757
|
21,456
|
||||
|
Assets
held for sale
|
-
|
3,654
|
||||
|
Deferred
tax assets
|
68,415
|
57,261
|
||||
|
Total
current assets
|
439,008
|
414,820
|
||||
|
Property
and equipment, net of accumulated depreciation and
amortization
|
||||||
|
of
$153,854 and $114,415 at December 31, 2009 and 2008,
respectively
|
622,682
|
603,645
|
||||
|
Intangible
assets, net of accumulated amortization of $19,005 and $13,292
at
|
||||||
|
December
31, 2009 and 2008, respectively
|
53,931
|
54,388
|
||||
|
Goodwill
|
338,296
|
326,808
|
||||
|
Restricted
cash, non-current
|
3,317
|
3,303
|
||||
|
Deferred
tax assets
|
108,999
|
134,807
|
||||
|
Other
assets
|
4,961
|
5,563
|
||||
|
Total
assets
|
$
|
1,571,194
|
$
|
1,543,334
|
||
F-4
SUN
HEALTHCARE GROUP, INC. AND SUBSIDIARIES
CONSOLIDATED
BALANCE SHEETS (Continued)
LIABILITIES
AND STOCKHOLDERS' EQUITY
(in
thousands, except share data)
|
December
31, 2009
|
December
31, 2008
|
|||||
|
Current
liabilities:
|
||||||
|
Accounts
payable
|
$
|
57,109
|
$
|
62,000
|
||
|
Accrued
compensation and benefits
|
58,953
|
60,660
|
||||
|
Accrued
self-insurance obligations, current portion
|
45,661
|
45,293
|
||||
|
Other
accrued liabilities
|
55,265
|
56,857
|
||||
|
Current
portion of long-term debt and capital lease obligations
|
46,416
|
17,865
|
||||
|
Total
current liabilities
|
263,404
|
242,675
|
||||
|
Accrued
self-insurance obligations, net of current portion
|
121,948
|
114,557
|
||||
|
Long-term
debt and capital lease obligations, net of current portion
|
654,132
|
707,976
|
||||
|
Unfavorable
lease obligations, net of accumulated amortization of
|
||||||
|
$16,450
and $13,599 at December 31, 2009 and 2008, respectively
|
12,663
|
15,514
|
||||
|
Other
long-term liabilities
|
69,983
|
58,903
|
||||
|
Total
liabilities
|
1,122,130
|
1,139,625
|
||||
|
Commitments
and contingencies (Note 9)
|
||||||
|
Stockholders'
equity:
|
||||||
|
Preferred
stock of $.01 par value, authorized 10,000,000
|
||||||
|
shares,
zero shares issued and outstanding as of
|
||||||
|
December
31, 2009 and 2008
|
-
|
-
|
||||
|
Common
stock of $.01 par value, authorized 125,000,000
|
||||||
|
shares,
43,764,240 shares issued and outstanding
|
||||||
|
as
of December 31, 2009 and 43,544,765 shares issued
|
||||||
|
and
outstanding as of December 31, 2008
|
438
|
435
|
||||
|
Additional
paid-in capital
|
655,667
|
650,543
|
||||
|
Accumulated
deficit
|
(204,012
|
)
|
(242,683
|
)
|
||
|
Accumulated
other comprehensive loss, net
|
(3,029
|
)
|
(4,586
|
)
|
||
|
Total
stockholders' equity
|
449,064
|
403,709
|
||||
|
Total
liabilities and stockholders' equity
|
$
|
1,571,194
|
$
|
1,543,334
|
See
accompanying notes.
F-5
SUN
HEALTHCARE GROUP, INC. AND SUBSIDIARIES
CONSOLIDATED
INCOME STATEMENTS
(in
thousands, except per share data)
|
For
the Years Ended December 31,
|
|||||||||
|
2009
|
2008
|
2007
|
|||||||
|
Total
net revenues
|
$
|
1,881,799
|
$
|
1,823,503
|
$
|
1,557,756
|
|||
|
Costs
and expenses:
|
|||||||||
|
Operating
salaries and benefits
|
1,057,645
|
1,028,987
|
888,102
|
||||||
|
Self-insurance
for workers' compensation and general
|
|||||||||
|
and
professional liability insurance
|
63,752
|
59,694
|
44,524
|
||||||
|
Operating
administrative expenses
|
50,924
|
51,171
|
39,950
|
||||||
|
Other
operating costs
|
384,832
|
373,084
|
319,010
|
||||||
|
Center
rent expense
|
73,149
|
73,601
|
70,412
|
||||||
|
General
and administrative expenses
|
62,068
|
62,302
|
64,835
|
||||||
|
Depreciation
and amortization
|
45,463
|
40,354
|
31,218
|
||||||
|
Provision
for losses on accounts receivable
|
21,197
|
14,107
|
8,982
|
||||||
|
Interest,
net of interest income of $383, $1,781, and $3,255,
respectively
|
49,327
|
54,603
|
44,347
|
||||||
|
Loss
(gain) on sale of assets, net
|
42
|
(976
|
)
|
24
|
|||||
|
Loss
on extinguishment of debt
|
-
|
-
|
3,173
|
||||||
|
Restructuring
costs
|
1,304
|
-
|
-
|
||||||
|
Total
costs and expenses
|
1,809,703
|
1,756,927
|
1,514,577
|
||||||
|
Income
before income taxes and discontinued operations
|
72,096
|
66,576
|
43,179
|
||||||
|
Income
tax expense (benefit)
|
29,616
|
(47,348
|
)
|
(10,914
|
)
|
||||
|
Income
from continuing operations
|
42,480
|
113,924
|
54,093
|
||||||
|
Discontinued
operations:
|
|||||||||
|
(Loss)
income from discontinued operations
|
(3,476
|
)
|
(1,636
|
)
|
3,617
|
||||
|
Loss
on disposal of discontinued operations, net of related
|
|||||||||
|
tax
benefit of $231, $1,949, and $0, respectively
|
(333
|
)
|
(3,001
|
)
|
(200
|
)
|
|||
|
(Loss)
income from discontinued operations
|
(3,809
|
)
|
(4,637
|
)
|
3,417
|
||||
|
Net
income
|
$
|
38,671
|
$
|
109,287
|
$
|
57,510
|
|||
|
Basic
earnings per common and common equivalent share:
|
|||||||||
|
Income
from continuing operations
|
$
|
0.97
|
$
|
2.63
|
$
|
1.28
|
|||
|
(Loss)
income from discontinued operations, net
|
(0.09
|
)
|
(0.11
|
)
|
0.08
|
||||
|
Net
income
|
$
|
0.88
|
$
|
2.52
|
$
|
1.36
|
|||
|
Diluted
earnings per common and common equivalent share:
|
|||||||||
|
Income
from continuing operations
|
$
|
0.97
|
$
|
2.59
|
$
|
1.25
|
|||
|
(Loss)
income from discontinued operations, net
|
(0.09
|
)
|
(0.10
|
)
|
0.08
|
||||
|
Net
income
|
$
|
0.88
|
$
|
2.49
|
$
|
1.33
|
|||
|
Weighted
average number of common and common equivalent
|
|||||||||
|
shares
outstanding:
|
|||||||||
|
Basic
|
43,841
|
43,331
|
42,350
|
||||||
|
Diluted
|
43,963
|
43,963
|
43,390
|
||||||
See
accompanying notes.
F-6
SUN
HEALTHCARE GROUP, INC. AND SUBSIDIARIES
CONSOLIDATED
STATEMENTS OF STOCKHOLDERS' EQUITY AND
COMPREHENSIVE INCOME
(in
thousands)
|
For
the Years Ended December 31,
|
|||||||||||||||
|
2009
|
2008
|
2007
|
|||||||||||||
|
Shares
|
Amount
|
Shares
|
Amount
|
Shares
|
Amount
|
||||||||||
|
Common
stock
|
|||||||||||||||
|
Issued
and outstanding at beginning of period
|
43,545
|
$
|
435
|
43,016
|
$
|
430
|
42,890
|
$
|
429
|
||||||
|
Retirement
of common stock
|
-
|
-
|
-
|
-
|
(160
|
)
|
(2
|
)
|
|||||||
|
Issuance
of common stock
|
219
|
3
|
529
|
5
|
286
|
3
|
|||||||||
|
Common
stock issued and outstanding at
|
|||||||||||||||
|
end
of period
|
43,764
|
438
|
43,545
|
435
|
43,016
|
430
|
|||||||||
|
Additional
paid-in capital
|
|||||||||||||||
|
Balance
at beginning of period
|
650,543
|
600,199
|
553,275
|
||||||||||||
|
Issuance
of common stock in excess of par value
|
101
|
2,488
|
1,619
|
||||||||||||
|
Stock
based compensation expense
|
5,810
|
5,270
|
-
|
||||||||||||
|
Retirement
of common stock
|
-
|
-
|
(2,647
|
)
|
|||||||||||
|
Realization
of pre-emergence tax benefits
|
-
|
43,093
|
45,587
|
||||||||||||
|
Other
|
(787
|
)
|
(507
|
)
|
2,365
|
||||||||||
|
Additional
paid-in capital at end of period
|
655,667
|
650,543
|
600,199
|
||||||||||||
|
Accumulated
deficit
|
|||||||||||||||
|
Balance
at beginning of period
|
(242,683
|
)
|
(351,970
|
)
|
(409,480
|
)
|
|||||||||
|
Net
income
|
38,671
|
109,287
|
57,510
|
||||||||||||
|
Accumulated
deficit at end of period
|
(204,012
|
)
|
(242,683
|
)
|
(351,970
|
)
|
|||||||||
|
Accumulated
other comprehensive loss
|
|||||||||||||||
|
Balance
at beginning of period
|
(4,586
|
)
|
(2,403
|
)
|
-
|
||||||||||
|
Other
comprehensive income (loss) from cash
flow hedge, net of related tax expense (benefit) of $1,038, ($3,058) and ($1,602) |
1,557
|
(2,183
|
)
|
(2,403
|
)
|
||||||||||
|
Accumulated
other comprehensive loss at
|
|||||||||||||||
|
end
of period
|
(3,029
|
)
|
(4,586
|
)
|
(2,403
|
)
|
|||||||||
|
Common
stock in treasury
|
|||||||||||||||
|
Common
stock in treasury at beginning of period
|
-
|
-
|
-
|
-
|
10
|
(91
|
)
|
||||||||
|
Shares
reacquired
|
-
|
-
|
-
|
-
|
150
|
(2,558
|
)
|
||||||||
|
Retirement
of common stock in treasury
|
-
|
-
|
-
|
-
|
(160
|
)
|
2,649
|
||||||||
|
Common
stock in treasury at end of period
|
-
|
-
|
-
|
-
|
-
|
-
|
|||||||||
|
Total
stockholders' equity
|
$
|
449,064
|
$
|
403,709
|
$
|
246,256
|
|||||||||
|
Comprehensive
income:
|
|||||||||||||||
|
Net
income
|
$
|
38,671
|
$
|
109,287
|
$
|
57,510
|
|||||||||
|
Other
comprehensive income (loss) from cash
flow hedge, net of related tax expense (benefit) of
$1,038 ($3,058) and ($1,602)
|
1,557
|
(2,183
|
)
|
(2,403
|
)
|
||||||||||
|
Comprehensive
income
|
$
|
40,228
|
$
|
107,104
|
$
|
55,107
|
|||||||||
See
accompanying notes.
F-7
SUN
HEALTHCARE GROUP, INC. AND SUBSIDIARIES
CONSOLIDATED
STATEMENTS OF CASH FLOWS
(in
thousands)
|
For
the Years Ended December 31,
|
|||||||||
|
2009
|
2008
|
2007
|
|||||||
|
Cash
flows from operating activities:
|
|||||||||
|
Net
income
|
$
|
38,671
|
$
|
109,287
|
$
|
57,510
|
|||
|
Adjustments
to reconcile net income to net cash provided by
|
|||||||||
|
operating
activities, including discontinued operations:
|
|||||||||
|
Depreciation
and amortization
|
45,465
|
40,614
|
31,801
|
||||||
|
Amortization
of favorable and unfavorable lease intangibles
|
(1,824
|
)
|
(1,879
|
)
|
(1,315
|
)
|
|||
|
Provision
for losses on accounts receivable
|
21,196
|
15,283
|
10,345
|
||||||
|
Loss
on sale of assets, including discontinued operations, net
|
605
|
2,151
|
224
|
||||||
|
Impairment
charge for discontinued operation
|
-
|
1,800
|
-
|
||||||
|
Stock-based
compensation expense
|
5,810
|
5,270
|
3,678
|
||||||
|
Deferred
taxes
|
27,003
|
(51,128
|
)
|
(33,581
|
)
|
||||
|
Loss
on extinguishment of debt
|
-
|
-
|
3,173
|
||||||
|
Other
|
-
|
(10
|
)
|
(866
|
)
|
||||
|
Changes
in operating assets and liabilities, net of acquisitions:
|
|||||||||
|
Accounts
receivable
|
(33,547
|
)
|
(35,136
|
)
|
(9,899
|
)
|
|||
|
Restricted
cash
|
10,628
|
3,215
|
2,497
|
||||||
|
Prepaid
expenses and other assets
|
2,940
|
(4,213
|
)
|
16,127
|
|||||
|
Accounts
payable
|
(8,390
|
)
|
4,032
|
(17,266
|
)
|
||||
|
Accrued
compensation and benefits
|
(2,989
|
)
|
(2,367
|
)
|
14,486
|
||||
|
Accrued
self-insurance obligations
|
7,759
|
4,773
|
(12,108
|
)
|
|||||
|
Income
taxes payable
|
-
|
(1,806
|
)
|
4,779
|
|||||
|
Other
accrued liabilities
|
(3,196
|
)
|
(8,719
|
)
|
3,615
|
||||
|
Other
long-term liabilities
|
(1,223
|
)
|
7,020
|
10,637
|
|
||||
|
Net
cash provided by operating activities
|
108,908
|
88,187
|
83,837
|
||||||
|
Cash
flows from investing activities:
|
|||||||||
|
Capital
expenditures
|
(54,312
|
)
|
(42,543
|
)
|
(33,450
|
)
|
|||
|
Purchase
of leased real estate
|
(3,275
|
)
|
(8,956
|
)
|
(56,462
|
)
|
|||
|
Proceeds
from sale of assets held for sale
|
2,174
|
18,354
|
7,589
|
||||||
|
Acquisitions,
net of cash acquired
|
(14,936
|
)
|
(11,734
|
)
|
(368,454
|
)
|
|||
|
Insurance
proceeds received
|
-
|
628
|
-
|
||||||
|
Net
cash used for investing activities
|
(70,349
|
)
|
(44,251
|
)
|
(450,777
|
)
|
|||
|
Cash
flows from financing activities:
|
|||||||||
|
Net
repayments under revolving credit facility
|
-
|
-
|
(9,994
|
)
|
|||||
|
Borrowings
of long-term debt
|
20,822
|
20,290
|
347,000
|
||||||
|
Principal
repayments of long-term debt and capital lease obligations
|
(46,292
|
)
|
(29,627
|
)
|
(54,509
|
)
|
|||
|
Payment
to non-controlling interest
|
(311
|
)
|
(418
|
)
|
(57
|
)
|
|||
|
Distribution
to non-controlling interest
|
(549
|
)
|
(353
|
)
|
(657
|
)
|
|||
|
Proceeds
from issuance of common stock
|
101
|
2,493
|
1,459
|
||||||
|
Release
of cash collateral
|
-
|
-
|
25,640
|
||||||
|
Deferred
financing costs
|
-
|
-
|
(18,045
|
)
|
|||||
|
Net
cash (used for) provided by financing activities
|
(26,229
|
)
|
(7,615
|
)
|
290,837
|
||||
|
Net
increase (decrease) in cash and cash equivalents
|
12,330
|
36,321
|
(76,103
|
)
|
|||||
|
Cash
and cash equivalents at beginning of period
|
92,153
|
55,832
|
131,935
|
||||||
|
Cash
and cash equivalents at end of period
|
$
|
104,483
|
$
|
92,153
|
$
|
55,832
|
|||
|
Supplemental
disclosure of cash flow information:
|
|||||||||
|
Interest
payments
|
$
|
48,781
|
$
|
52,208
|
$
|
35,346
|
|||
|
Capitalized
interest
|
$
|
523
|
$
|
447
|
$
|
442
|
|||
|
Income
taxes paid, net
|
$
|
3,484
|
$
|
2,231
|
$
|
1,780
|
|||
F-8
SUN
HEALTHCARE GROUP, INC. AND SUBSIDIARIES
CONSOLIDATED
STATEMENTS OF CASH FLOWS (CONTINUED)
(in
thousands)
Supplemental
Disclosures of Non-Cash Investing and Financing Activities
For the
year ended December 31, 2009, capital lease
obligations of $79 were incurred in 2009 when we entered into new equipment and
vehicle leases.
For the
year ended December 31, 2008, stockholders’
equity increased by $43,093 due to a change in the valuation allowance for
deferred tax assets and income tax payable attributable to fresh-start
accounting and business combinations (see Note 10 – “Income
Taxes”). Capital lease obligations of $575 were incurred in 2008 when
we entered into new equipment and vehicle leases.
For the
year ended December 31, 2007, in connection with the
purchase of leased real estate, we assumed mortgages payable of $29,825 and
reduced notes receivable by $7,487. See Note 6 – “Acquisitions” for
non-cash activity related to the Harborside
acquisition. Capital lease obligations of $1,693 were incurred
in 2007 when we entered into new equipment and vehicle
leases. Stockholders’ equity increased by $45,587 due to a change in
the valuation allowance for deferred tax assets attributable to fresh-start
accounting and business combinations (see Note 10 – “Income
Taxes”).
See
accompanying notes
F-9
SUN
HEALTHCARE GROUP, INC. AND SUBSIDIARIES
NOTES
TO CONSOLIDATED FINANCIAL STATEMENTS
DECEMBER
31, 2009
(1) Nature
of Business
References
throughout this document to the Company include Sun Healthcare Group, Inc. and
our consolidated subsidiaries. In accordance with the Securities and Exchange
Commission's “Plain English” guidelines, this Annual Report has been written in
the first person. In this document, the words “we,” “our,” “ours” and “us” refer
to Sun Healthcare Group, Inc. and its direct and indirect consolidated
subsidiaries and not any other person.
Business
Our
subsidiaries provide long-term, subacute and related specialty healthcare in the
United States. We operate through three principal business segments:
(i) inpatient services, (ii) rehabilitation therapy services, and (iii) medical
staffing services. Inpatient services represent the most significant
portion of our business. We operated 205 healthcare facilities in 25
states as of December 31, 2009.
Restructuring
Costs
As we
continue to focus on reducing costs and maximizing occupancy, we have evaluated
and will continue to evaluate certain restructuring activities in our operations
and administrative functions. During the year ended December 31,
2009, we incurred $1.3 million of restructuring costs, of which $1.0 million was
paid during 2009 and the remainder paid in 2010. The costs consisted
primarily of severance benefits resulting from reductions of administrative
staff and costs related to closure of a center in Massachusetts.
Comparability
of Financial Information
GAAP
requires reclassification of the results of operations of subsequent
divestitures that qualify as discontinued operations for all periods
presented.
(2) Summary
of Significant Accounting Policies
(a) Use of
Estimates
The
preparation of financial statements in conformity with accounting principles
generally accepted in the United States requires management to make estimates
and assumptions that affect the reported amounts of assets and liabilities, the
disclosure of contingent assets and liabilities at the date of the consolidated
financial statements and the reported amounts of revenues and expenses during
the reporting period. Significant estimates include determination of net
revenues, allowances for doubtful accounts, self-insurance obligations, goodwill
and other intangible assets (including impairments), and allowances for deferred
tax assets. Actual results could differ from those
estimates.
(b) Principles of
Consolidation
Our
consolidated financial statements include the accounts of our subsidiaries in
which we own more than 50% of the voting interest. Investments of companies in
which we own between 20% - 50% of the voting interests and have significant
influence were accounted for using the equity method, which records as income an
ownership percentage of the reported income of the
subsidiary. Investments in companies in which we own less than 20% of
the voting interests and do not have significant influence are carried at lower
of cost or fair value. All significant intersegment accounts and transactions
have been eliminated in consolidation.
F-10
SUN
HEALTHCARE GROUP, INC. AND SUBSIDIARIES
NOTES
TO CONSOLIDATED FINANCIAL STATEMENTS (CONTINUED)
DECEMBER
31, 2009
(c) Cash and Cash
Equivalents
We
consider all highly liquid, unrestricted investments with original maturities of
three months or less when purchased to be cash equivalents. Cash equivalents are
stated at fair value.
(d) Restricted Cash
Certain
of our cash balances are restricted for specific purposes such as funding of
self-insurance reserves, mortgage escrow requirements and capital expenditures
on HUD-insured buildings (see Note 9 – “Commitments and
Contingencies”). These balances are presented separately from cash
and cash equivalents on our consolidated balance sheets and are classified as a
current asset when expected to be utilized within the next
year. Restricted cash balances are stated at fair value.
(e) Net Revenues
Net
revenues consist of long-term and subacute care revenues, rehabilitation therapy
services revenues, temporary medical staffing services revenues and other
ancillary services revenues. Net revenues are recognized as services are
provided. Revenues are recorded net of provisions for discount arrangements with
commercial payors and contractual allowances with third-party payors, primarily
Medicare and Medicaid. Net revenues realizable under third-party payor
agreements are subject to change due to examination and retroactive adjustment.
Estimated third-party payor settlements are recorded in the period the related
services are rendered. The methods of making such estimates are reviewed
periodically, and differences between the net amounts accrued and subsequent
settlements or estimates of expected settlements are reflected in the current
period results of operations. Laws and regulations governing the Medicare and
Medicaid programs are extremely complex and subject to
interpretation.
Revenues
from Medicaid accounted for 40.0%, 40.0%, and 41.4% of our net revenue for the
years ended December 31, 2009, 2008 and 2007, respectively. Revenues
from Medicare comprised 29.5%, 28.6%, and 26.9% of our net revenues for the
years ended December 31, 2009, 2008 and 2007, respectively.
(f) Accounts
Receivable
Our
accounts receivable relate to services provided by our various operating
divisions to a variety of payors and customers. The primary payors for services
provided in healthcare centers that we operate are the Medicare program and the
various state Medicaid programs. Our rehabilitation therapy service operations
provide services to patients in unaffiliated healthcare centers. The billings
for those services are submitted to the unaffiliated centers. Many of the
unaffiliated healthcare centers receive a large majority of their revenues from
the Medicare program and the state Medicaid programs.
Estimated
provisions for losses on accounts receivable are recorded each period as an
expense in the income statement. In evaluating the collectibility of
accounts receivable, we consider a number of factors, including the age of the
accounts, changes in collection patterns, the financial condition of our
customers, the composition of patient accounts by payor type, the status of
ongoing disputes with third-party payors and general industry and economic
conditions. Any changes in these factors or in the actual collections
of accounts receivable in subsequent periods may require changes in the
estimated provision for loss. Changes in these estimates are charged or credited
to the results of operations in the period of change. In addition, a
retrospective collection analysis is performed within each operating company to
test the adequacy of the reserve.
F-11
SUN
HEALTHCARE GROUP, INC. AND SUBSIDIARIES
NOTES
TO CONSOLIDATED FINANCIAL STATEMENTS (CONTINUED)
DECEMBER
31, 2009
The allowance
for doubtful accounts related to centers that we have divested was based on a
percentage of outstanding accounts receivable at the time of divestiture and is
recorded with the gain or loss on disposal of discontinued
operations. As collections are realized, the allowance is adjusted as
appropriate. As of December 31, 2009 and 2008, accounts receivable for divested
operations were significantly reserved.
(g) Property and
Equipment
Property
and equipment are stated at historical cost. Property and equipment held under
capital lease are stated at the net present value of future minimum lease
payments and their amortization is included in depreciation
expense. Major renewals or improvements are capitalized whereas
ordinary maintenance and repairs are expensed as incurred. Depreciation is
computed using the straight-line method over the estimated useful lives of the
assets as follows: buildings and improvements – five to forty years; leasehold
improvements - the shorter of the estimated useful lives of the assets or the
life of the lease; and equipment - three to twenty years. We subject
our long-lived assets to an impairment test if an indicator of potential
impairment is present. (See Note 7 – “Goodwill, Intangible Assets and Long-Lived
Assets.”)
(h) Intangible
Assets
Consistent
with GAAP, we do not amortize goodwill and intangible assets with indefinite
lives. Consequently, we subject them at a minimum to annual impairment tests.
Intangible assets with definite lives are amortized over their estimated useful
lives. (See Note 7 – “Goodwill, Intangible Assets and Long-Lived
Assets.”)
(i) Insurance
We
self-insure for certain insurable risks, including general and professional
liabilities, workers' compensation liabilities and employee health insurance
liabilities, through the use of self-insurance or retrospective and self-funded
insurance policies and other hybrid policies, which vary by the states in which
we operate. There is a risk that amounts funded to our self-insurance programs
may not be sufficient to respond to all claims asserted under those programs.
Provisions for estimated reserves, including incurred but not reported losses,
are provided in the period of the related coverage. These provisions are based
on actuarial analyses, internal evaluations of the merits of individual claims,
and industry loss development factors or lag analyses. The methods of making
such estimates and establishing the resulting reserves are reviewed periodically
and are based on historical paid claims information and nationwide nursing home
trends. Any resulting adjustments are reflected in current earnings. Claims are
paid over varying periods, and future payments may differ materially than the
estimated reserves. (See Note 9 – “Commitments and
Contingencies.”)
(j) Stock-Based
Compensation
We follow
the fair value recognition provisions of GAAP, which requires all share-based
payments to employees, including grants of employee stock options, to be
recognized in the statement of operations based on their fair
values. (See Note 12 – “Capital Stock.”)
(k) Income
Taxes
Pursuant
to GAAP, an asset or liability is recognized for the deferred tax consequences
of temporary differences between the tax bases of assets and liabilities and
their reported amounts in the financial statements. These temporary
differences would result in taxable or deductible amounts in future years when
the reported
F-12
SUN
HEALTHCARE GROUP, INC. AND SUBSIDIARIES
NOTES
TO CONSOLIDATED FINANCIAL STATEMENTS (CONTINUED)
DECEMBER
31, 2009
amounts
of the assets are recovered or liabilities are settled. Deferred tax
assets are also recognized for the future tax benefits from net operating loss,
capital loss and tax credit carryforwards. A valuation allowance is
to be provided for the net deferred tax assets if it is more likely than not
that some portion or all of the net deferred tax assets will not be
realized.
In
evaluating the need to record or continue to reflect a valuation allowance, all
items of positive evidence (e.g., future sources of taxable income and tax
planning strategies) and negative evidence (e.g., history of taxable losses) are
considered. In determining future sources of taxable income, we use
management-approved budgets and projections of future operating results for an
appropriate number of future periods, taking into consideration our history of
operating results, taxable income and losses, etc. This future
taxable income is then used, along with all other items of positive and negative
evidence, to determine the amount of valuation allowance that is needed, and
whether any amount of such allowance should be reversed.
We are
subject to income taxes in the U.S. and numerous state and local
jurisdictions. Significant judgment is required in evaluating our
uncertain tax positions and determining our provision for income
taxes. Effective January 1, 2007, we adopted the GAAP guidance for
accounting for uncertainty in income tax positions, which contains a two-step
approach to recognizing and measuring uncertain tax positions. The
first step is to evaluate the tax position for recognition by determining if the
weight of available evidence indicates that it is more likely than not that the
position will be sustained on audit, including resolution of related appeals or
litigation processes, if any. The second step is to measure the tax
benefit as the largest amount that is more than 50% likely of being realized
upon settlement. We reserve for our uncertain tax positions, and we
adjust these reserves in light of changing facts and circumstances, such as the
closing of a tax audit or the refinement of an estimate. (See Note 10
– “Income Taxes.”)
(l) Net Income Per
Share
Basic net
income per share is based upon the weighted average number of common shares
outstanding during the period. The weighted average number of common
shares for the years ended December 31, 2009, 2008 and 2007 includes all the
common shares that are presently outstanding and the common shares issued as
common stock awards and exclude non-vested restricted stock. (See
Note 12 – “Capital Stock.”)
The
diluted calculation of income per common share includes the dilutive effect of
warrants, stock options and non-vested restricted stock, using the treasury
stock method (see Note 12 – “Capital Stock). However, in periods of losses from
continuing operations, diluted net income per common share is based upon the
weighted average number of common shares outstanding.
(m) Discontinued Operations and Assets
Held for Sale
GAAP
requires that long-lived assets to be disposed of be measured at the lower of
carrying amount or fair value less cost to sell, whether reported in continuing
operations or in discontinued operations. GAAP also requires the
reporting of discontinued operations which include all components of an entity
with operations that can be distinguished from the rest of the entity and that
will be eliminated from the ongoing operations of the entity in a disposal
transaction. Depreciation is discontinued once an asset is classified as held
for sale. (See Note 8 – “Sale of Assets, Discontinued Operations and
Assets and Liabilities Held for Sale.”)
F-13
SUN
HEALTHCARE GROUP, INC. AND SUBSIDIARIES
NOTES
TO CONSOLIDATED FINANCIAL STATEMENTS (CONTINUED)
DECEMBER
31, 2009
(n) Reclassifications
Certain
reclassifications have been made to the prior period financial statements to
conform to the 2009 financial statement presentation. Specifically,
we have reclassified the results of operations of material divestitures
subsequent to December 31, 2008 (see Note 8 – “Sale of Assets,
Discontinued Operations and Assets and Liabilities Held for Sale”) for all periods
presented to discontinued operations within the income statement, in accordance
with GAAP. As discussed in “Recent Accounting Pronouncements” below,
the adoption of the new guidance for accounting for noncontrolling interests did
not have a material impact on our financial position, cash flows or results of
operations. We have, however, reclassified $1.5 million previously
reported as minority interest payable on our December 31, 2008 consolidated
balance sheet in our 2008 Form 10-K to other long-term liabilities on our
consolidated balance sheet in this Form 10-K to conform to the 2009 financial
statement presentation.
(o) Interest Rate Swap
Agreements
We manage
interest expense using a mix of fixed and variable rate debt, and to help manage
borrowing costs, we have entered into interest rate swap agreements. Under these
arrangements, we agree to exchange, at specified intervals, the difference
between fixed and variable interest amounts calculated by reference to an
agreed-upon notional principal amount. We use interest rate swaps to manage
interest rate risk related to borrowings. Our intent is to only enter
such arrangements that qualify for hedge accounting
treatment. Accordingly, we designate all such arrangements as
cash-flow hedges and perform initial and quarterly effectiveness testing using
the hypothetical derivative method. To the extent that such
arrangements are effective hedges, changes in fair value are recognized through
other comprehensive (loss). Ineffectiveness, if any, would be
recognized in earnings. (See Note 3 – “Loan
Agreements.”)
(p) Recent Accounting
Pronouncements
In
December 2007, the Financial Accounting Standards Board (the “FASB”) issued
revised guidance for accounting for noncontrolling interests. The
guidance requires that a noncontrolling interest in a subsidiary be reported as
equity in the consolidated financial statements; that net income attributable to
the parent and the noncontrolling interest be clearly identifiable; that changes
in a parent’s ownership interest, while the parent retains its controlling
financial interest in its subsidiary, be accounted for as equity transactions
and that disclosures be expanded to clearly identify and distinguish between the
interests of the parent and the interests of the noncontrolling
owners. The guidance was effective beginning January 1, 2009, and did
not have a material impact on our financial position, cash flows or results of
operations.
In March
2008, the FASB issued rules that expanded quarterly disclosure requirements
about an entity’s derivative instruments and hedging activities. The expanded
disclosure requirements were required effective for fiscal years beginning
January 1, 2009, and we have included the required disclosures in Note 4 –
“Long-Term Debt and Capital Lease Obligations” to our consolidated financial
statements included in this Annual Report on Form 10-K.
In May
2009, the FASB issued guidance on accounting for and disclosure of events that
occur after the balance sheet date but before financial statements are issued or
are available to be issued. Companies are required to evaluate events
or transactions taking place after the balance sheet date for recognition in the
financial statements prior to issuance. These requirements became
effective for our interim and annual reporting periods on April 1, 2009 and
their adoption did not have a material impact on our financial position, cash
flows or results of operations.
F-14
SUN
HEALTHCARE GROUP, INC. AND SUBSIDIARIES
NOTES
TO CONSOLIDATED FINANCIAL STATEMENTS (CONTINUED)
DECEMBER
31, 2009
In June
2009, the FASB established the FASB Accounting Standards CodificationTM
(“Codification”) as the source of authoritative accounting principles
recognized by the FASB to be applied by nongovernmental entities in the
preparation of financial statements in conformity with
GAAP. Recognition of the Codification in financial statements is
effective for interim and annual periods ending after September 15,
2009. The impact in our financial statements was only to references
for accounting guidance.
(3) Loan
Agreements
In April
2007, we issued $200.0 million aggregate principal amount of 9-1/8% Senior
Subordinated Notes due 2015 (the “Notes”), which mature on April 15,
2015. We are entitled to redeem some or all of the Notes at any time
on or after April 15, 2011 at certain pre-specified redemption
prices. In addition, prior to April 15, 2011, we may redeem some
or all of the Notes at a price equal to 100% of the principal amount thereof,
plus accrued and unpaid interest, if any, plus a “make whole”
premium. We are entitled to redeem up to 35% of the aggregate
principal amount of the Notes until April 15, 2010 with the net proceeds
from certain equity offerings at certain pre-specified redemption
prices. The Notes accrue interest at an annual rate of 9-1/8% and pay
interest semi-annually on April 15th and
October 15th of
each year through the April 15, 2015 maturity date. The Notes are
unconditionally guaranteed on a senior subordinated basis by certain of our
subsidiaries but are not secured by any of our assets or those of our
subsidiaries. (See Note 16 – “Summarized Consolidating
Information.”)
In April
2007, we entered into a $485.0 million senior secured credit facility with a
syndicate of financial institutions led by Credit Suisse as the administrative
agent and collateral agent (the “Credit Agreement”) in connection with our
acquisition of Harborside (see Note 6 – “Acquisitions”). The Credit
Agreement provides for $365.0 million in term loans (of which $329.1 million was
outstanding as of December 31, 2009), a $50.0 million revolving credit facility
(undrawn at December 31, 2009) and a $70.0 million letter of credit facility
($62.8 million outstanding at December 31, 2009). The final maturity
date of the term loans is April 19, 2014, and the revolving credit facility and
letter of credit facility terminate on April 19, 2013. Availability
of amounts under the revolving credit facility is subject to compliance with
financial covenants, including an interest coverage test, a total leverage
covenant and a senior leverage covenant. We were in compliance with these
covenants as of December 31, 2009. The Credit Agreement contains
customary events of default, such as our failure to make payment of amounts due,
defaults under other agreements evidencing indebtedness, certain bankruptcy
events and a change of control (as defined in the Credit Agreement). The Credit
Agreement also contains customary covenants restricting, among other things,
incurrence of indebtedness, liens, payment of dividends, repurchase of stock,
acquisitions and dispositions, mergers and investments. The Credit
Agreement is collateralized by our assets and the assets of most of our
subsidiaries.
Amounts
borrowed under the term loan facility are due in quarterly installments of 0.25%
of the aggregate principal amount of the term loans under the term loan facility
outstanding as of January 15, 2008, with the remaining principal amount due
on the maturity date of the term loans. Accrued interest is payable
at the end of an interest period, but no less frequently than every three
months. The loans under the Credit Agreement bear interest on the
outstanding unpaid principal amount at a rate equal to an applicable percentage
plus, at our option, either (a) an alternative base rate determined by reference
to the higher of (i) the prime rate announced by Credit Suisse and (ii) the
federal funds rate plus one-half of 1.0%, or (b) the London Interbank Offered
Rate (“LIBOR”), adjusted for statutory reserves. The applicable percentage
for term loans is 1.0% for alternative base rate loans and 2.0% for LIBOR loans;
and the applicable percentage for revolving loans is up to 1.0% for alternative
base rate revolving loans and up to 2.0% for LIBOR rate revolving loans based on
our total leverage ratio. Each year, commencing in 2009, within 90 days of
the prior fiscal year end, we are required to prepay a portion of the term loans
in an amount based on the prior year’s excess cash flows, if any, as defined in
the Credit Agreement. Pursuant to this requirement, we paid $8.5
million during 2009 and we estimate that we will pay $18.9 million in
2010.
F-15
SUN
HEALTHCARE GROUP, INC. AND SUBSIDIARIES
NOTES
TO CONSOLIDATED FINANCIAL STATEMENTS (CONTINUED)
DECEMBER
31, 2009
We manage
interest expense using a mix of fixed and variable rate debt, and to help manage
borrowing costs, we may enter into interest rate swap agreements. Under these
arrangements, we agree to exchange, at specified intervals, the difference
between fixed and variable interest amounts calculated by reference to an
agreed-upon notional principal amount. We use interest rate swaps to manage
interest rate risk related to borrowings. Our intent is to only enter
such arrangements that qualify for hedge accounting treatment in accordance with
GAAP. Accordingly, we designate all such arrangements as cash-flow
hedges and perform initial and quarterly effectiveness testing using the
hypothetical derivative method. To the extent that such arrangements
are effective hedges, changes in fair value are recognized through other
comprehensive loss. Ineffectiveness, if any, would be recognized in
earnings.
We
entered into interest rate swap agreements in July 2008 and July 2007 for
interest rate risk management purposes. The interest rate swap
agreements effectively modify our exposure to interest rate risk by converting a
portion of our floating rate debt to a fixed rate. These agreements
involve the receipt of floating rate amounts in exchange
for fixed rate interest payments over the life of the agreement without an
exchange of the underlying principal amount. The July 2008 agreement
is based on a notional amount of $50.0 million and has a term of two
years. Settlement occurs on a quarterly basis, which is based upon a
floating rate of LIBOR and an annual fixed rate of 3.65%. The July
2007 agreement is based on a notional amount of $100.0 million and has a term of
three years. Settlement occurs on a quarterly basis, which is based
upon a floating rate of LIBOR and an annual fixed rate of 5.388%.
The
interest rate swap agreements qualify for hedge accounting treatment and have
been designated as cash flow hedges. Hedge effectiveness testing for
the years ended December 31, 2009, 2008 and 2007 indicates that the swaps are
highly effective hedges and as such, the derivative mark-to-market adjustment
increased our other comprehensive loss by $3.0 million, $4.6 million and $2.4
million, respectively, net of related tax benefit. We do not anticipate our 2009
other comprehensive loss to be reclassified into earnings within the next
year. Also, since the swaps are highly effective hedging
arrangements, there is no amount related to hedging ineffectiveness to
expense.
The fair
values of our interest rate swap agreements as presented in the consolidated
balance sheets at December 31 are as follows (in thousands):
|
Liability
Derivatives
|
|||||||||||
|
2009
|
2008
|
||||||||||
|
Balance
Sheet
|
Balance
Sheet
|
||||||||||
|
Location
|
Fair
Value
|
Location
|
Fair
Value
|
||||||||
|
Derivatives
designated as
|
|||||||||||
|
hedging
instruments:
|
|||||||||||
|
Interest
rate swap
|
Other
Long-Term
|
Other
Long-Term
|
|||||||||
|
agreements
|
Liabilities
|
$
|
5,048
|
Liabilities
|
$
|
7,644
|
|||||
F-16
SUN
HEALTHCARE GROUP, INC. AND SUBSIDIARIES
NOTES
TO CONSOLIDATED FINANCIAL STATEMENTS (CONTINUED)
DECEMBER
31, 2009
The
effect of the interest rate swap agreements on our consolidated comprehensive
income, net of related taxes, for the year ended December 31 is as follows (in
thousands):
|
Gain
Reclassified from
|
||||||||||||
|
Amount
of Income/(Loss)
|
Accumulated
Other Comprehensive
|
|||||||||||
|
In
Other Comprehensive
Income/(Loss)
|
Loss
to Net Income (ineffective
portion)
|
|||||||||||
|
2009
|
2008
|
2009
|
2008
|
|||||||||
|
Derivatives
designated as cash
|
||||||||||||
|
flow
hedges:
|
||||||||||||
|
Interest
rate swap agreements
|
$
|
1,557
|
$
|
(2,183
|
)
|
$
|
-
|
$
|
-
|
|||
(4) Long-Term Debt and Capital Lease
Obligations
Our
long-term debt and capital lease obligations consisted of the following as of
December 31 (in thousands):
|
2009
|
2008
|
|||||
|
Revolving
loans
|
$
|
-
|
$
|
-
|
||
|
Mortgage
notes payable due at various dates through 2037, interest
at
|
||||||
|
rates
from 3.3% to 11.6%, collateralized by the carrying values
of
|
||||||
|
various
centers totaling approximately $200,000 (1)
|
170,608
|
178,142
|
||||
|
Term
loans
|
329,107
|
346,359
|
||||
|
Senior
subordinated notes
|
200,000
|
200,000
|
||||
|
Capital
leases
|
833
|
1,340
|
||||
|
Total
long-term obligations
|
700,548
|
725,841
|
||||
|
Less
amounts due within one year
|
(46,416
|
)
|
(17,865
|
)
|
||
|
Long-term
obligations, net of current portion
|
$
|
654,132
|
$
|
707,976
|
|
(1)
|
The
mortgage notes payable balance includes fair value premiums of $0.7
million related to acquisitions.
|
The
scheduled or expected maturities of long-term obligations, excluding premiums,
as of December 31, 2009 were as follows (in thousands):
|
2010
|
$
|
46,416
|
|
2011
|
42,002
|
|
|
2012
|
6,629
|
|
|
2013
|
7,947
|
|
|
2014
|
328,760
|
|
|
Thereafter
|
268,117
|
|
|
$
|
699,871
|
F-17
SUN
HEALTHCARE GROUP, INC. AND SUBSIDIARIES
NOTES
TO CONSOLIDATED FINANCIAL STATEMENTS (CONTINUED)
DECEMBER
31, 2009
(5) Property
and Equipment
Property
and equipment consisted of the following as of December 31 (in
thousands):
|
2009
|
2008
|
|||||
|
Land
|
$
|
78,848
|
$
|
75,383
|
||
|
Buildings
and improvements
|
464,136
|
451,001
|
||||
|
Equipment
|
128,939
|
106,410
|
||||
|
Leasehold
improvements
|
83,751
|
69,302
|
||||
|
Construction
in process(1)
|
20,862
|
15,964
|
||||
|
Total
|
776,536
|
718,060
|
||||
|
Less
accumulated depreciation and amortization
|
(153,854
|
)
|
(114,415
|
)
|
||
|
Property
and equipment, net
|
$
|
622,682
|
$
|
603,645
|
|
(1)
|
Capitalized
interest associated with construction in process at December 31, 2009 is
$0.4 million.
|
(6) Acquisitions
Hospice
Companies
On
October 1, 2009 we acquired a hospice company that provides services to patients
in Maine, Massachusetts and New Hampshire, for $16.1 million in cash, excluding
transaction costs. The purchase price excludes $0.5 million of
transaction costs, primarily investment banker success fees, that were expensed
in the accompanying income statement in accordance with GAAP. Pro
forma information related to this acquisition is not provided because the impact
on our consolidated financial position and results of operations is not
significant. The purchase price was funded through cash on-hand at
the time of the acquisition and allocated to the following fair values of assets
acquired and liabilities assumed at the date of acquisition (in
thousands):
|
Net
working capital
|
$
|
632
|
|
|
Property
and equipment
|
264
|
||
|
Licensing
intangible asset
|
6,271
|
||
|
Goodwill(1)
|
11,276
|
||
|
Other
long-term assets
|
24
|
||
|
Total
assets acquired
|
18,467
|
||
|
Liabilities
assumed
|
(2,322
|
)
|
|
|
Net
assets acquired
|
$
|
16,145
|
(1) Tax-deductible
goodwill is $3.6 million.
F-18
SUN
HEALTHCARE GROUP, INC. AND SUBSIDIARIES
NOTES
TO CONSOLIDATED FINANCIAL STATEMENTS (CONTINUED)
DECEMBER
31, 2009
On September
5, 2008, we acquired a company that conducts hospice operations in the State of
New Jersey. Its results of operations have been included in the
consolidated financial statements since September 1, 2008. Pro forma
information related to this acquisition is not provided because the impact on
our consolidated financial position and results of operations is not
significant. The $7.7 million purchase price was funded through cash
on-hand at the time of acquisition and allocated to the following fair values of
assets acquired and liabilities assumed at the date of acquisition (in
thousands):
|
Net
working capital
|
$
|
695
|
|
|
Property
and equipment
|
7
|
||
|
Identifiable
intangible assets
|
3,317
|
||
|
Goodwill
|
3,657
|
||
|
Other
long-term assets
|
96
|
||
|
Total
assets acquired
|
7,772
|
||
|
Debt
assumed
|
(92
|
)
|
|
|
Net
assets acquired
|
$
|
7,680
|
The
identifiable intangible asset was a regulatory license from the state in which
the hospice company operates. Its value was based upon incremental cash flows of
the hospice company with licensing versus cash flows without the licensing in
place. Actual cost data to acquire licensing was also a factor of the fair value
determination and based on estimates from our experience in other states’
licensing approval processes.
We paid a
premium (i.e., goodwill) over the fair value of the net tangible and identified
intangible assets acquired because we believed the acquisition of the hospice
company would create the following benefits: (1) increase the scale
of our operations, thus leveraging our corporate and regional infrastructure and
(2) expand our hospice operations into a state in which we did not previously
have a presence due to limitations with regulatory licensing.
Harborside
On April
19, 2007, we acquired Harborside, a privately-held healthcare company that
operated 73 skilled nursing centers, one assisted living center and one
independent living center with approximately 9,000 licensed beds in ten states,
by purchasing all of the outstanding Harborside stock for $349.4
million. In addition to the purchase price paid for Harborside, the
former shareholders of Harborside are entitled to a distribution of cash in an
amount equal to the future tax benefits realized by us from the deductibility of
specified employee compensation and unamortized debt costs related to Harborside
and which is included in other long-term liabilities. In connection with the
acquisition of Harborside, we entered into the Credit Agreement. The proceeds
from the Credit Agreement, plus cash on hand and the net proceeds from our
issuance of the Notes, were used to purchase all of the outstanding stock of
Harborside, refinance certain of the Harborside debt and replace our prior
revolving credit facility. Harborside’s results of operations have been included
in the consolidated financial statements since April 1, 2007.
F-19
SUN
HEALTHCARE GROUP, INC. AND SUBSIDIARIES
NOTES
TO CONSOLIDATED FINANCIAL STATEMENTS (CONTINUED)
DECEMBER
31, 2009
The total
purchase price of the Harborside acquisition is as follows (in
thousands):
|
Cash
consideration paid
|
$
|
349,401
|
|
Refinanced
debt obligations, net of associated transaction costs
|
219,270
|
|
|
Estimated
direct transaction costs
|
17,238
|
|
|
$
|
585,909
|
The
purchase price was funded with the following (in thousands):
|
Term
loan facility, net of fees and expenses
|
$
|
298,223
|
|
Senior
subordinated notes, net of fees and expenses
|
194,257
|
|
|
Revolving
credit facility
|
15,000
|
|
|
Cash
on hand
|
78,429
|
|
|
$
|
585,909
|
In
addition to the above, we exercised real estate purchase options acquired with
Harborside for $54.1 million plus assumption of $29.8 million of mortgages
payable and a $7.5 million reduction of notes receivable.
Under the
purchase method of accounting, the total purchase price, as shown in the table
above plus the exercise of real estate purchase options, was allocated to
Harborside’s net tangible and intangible assets based upon their estimated fair
values as of April 1, 2007. The excess of the purchase price over the
estimated fair value of the net tangible and intangible assets is recorded as
goodwill.
We paid a
premium (i.e., goodwill) over the fair value of the net tangible and identified
intangible assets acquired because we believed the acquisition of Harborside
would create the following benefits: (1) increase the scale of our
operations, thus leveraging our corporate and regional infrastructure; (2)
improve our payor mix with increased revenue derived from Medicare; (3) increase
our services to high-acuity patients for whom we are reimbursed at higher rates;
(4) increase our percentage of owned skilled nursing centers; and (5) increase
our presence in four states and expand into six contiguous states.
The
application of the accounting for business combinations requires that the total
purchase price be allocated to the fair value of assets acquired and liabilities
assumed based on their fair values at the effective acquisition date, with
amounts exceeding fair values being recorded as goodwill. The
allocation process requires an analysis of acquired fixed assets, contracts,
contractual commitments, legal contingencies and brand value to identify and
record the fair value of assets acquired and liabilities assumed. In
valuing acquired assets and liabilities assumed, fair values were based on, but
not limited to: future expected discounted cash flows for trade names
and customer relationships; current replacement cost for similar capacity and
obsolescence for certain fixed assets; comparable market rates for contractual
obligations and certain investments, real estate, and liabilities; expected
settlement amounts for litigation and contingencies, including self-insurance
reserves; and appropriate discount rates and growth rates. Other than
for a contingent liability related to a litigation matter (see Note 13 – “Other
Events”) and any payments related to third-party reimbursements as a result of
the acquisition, the valuation of Harborside’s assets and liabilities, including
intangibles and insurance reserves for general and professional and workers’
compensation liabilities, was completed during the fourth quarter of
2007.
Property
and equipment values were based primarily on the cost and market
approaches. The land value was based upon comparisons to sales of
similar properties. The building and improvements were valued at
replacement
F-20
SUN
HEALTHCARE GROUP, INC. AND SUBSIDIARIES
NOTES
TO CONSOLIDATED FINANCIAL STATEMENTS (CONTINUED)
DECEMBER
31, 2009
costs
estimated utilizing the Marshall Valuation Service cost
guide. Equipment values were determined based on historical
costs adjusted to reflect costs as of the acquisition date.
Values
for favorable or unfavorable lease intangibles were based on stabilized net
income for each leased location based upon historical and budgeted income and
expense trends for each property. Market rent was estimated for each
location using a coverage ratio technique and then deducted from the stabilized
net income to derive a market net income after lease payments. Then a direct
capitalization approach was utilized for each location based on its risk profile
and market data. The capitalization rates generally ranged from 7% to
11%. These rates are greater than the rates utilized for owned
locations above due to differing risk profiles and lessors’ expectation of a
premium over owned location returns. The net present value of the
above or below market lease in place was added to adjust for the favorable or
unfavorable value effect of the lease.
The
intangible value for Certificates of Need (“CONs”) in certain states was based
upon incremental cash flows of Harborside with CONs versus cash flows without
the CONs in place. Actual cost data to acquire CONs was also a factor and based
on estimates from market sources for each of those states.
The
intangible value for tradenames was based on the relief-from-royalty
method. This method is a discounted cash flow model based on an
estimated royalty rate, which is then applied to revenues expected to be
generated from the services sold using the tradename. The royalty
rate was determined based on many quantitative and qualitative factors including
industry analysis, market share and barriers to entry. Market
evidence of royalty rates was also considered.
The fair
values of assets acquired and liabilities assumed at the date of acquisition
were as follows (in thousands):
|
Net
working capital
|
$
|
33,109
|
|
Property
and equipment
|
271,258
|
|
|
Identifiable
intangible assets
|
24,258
|
|
|
Deferred
tax assets
|
27,792
|
|
|
Goodwill
|
273,316
|
|
|
Other
long-term assets
|
14,440
|
|
|
Total
assets acquired
|
644,173
|
|
|
Debt
|
22,858
|
|
|
Other
long-term liabilities
|
35,406
|
|
|
Total
liabilities assumed
|
58,264
|
|
|
Net
assets acquired
|
$
|
585,909
|
We
identified $24.3 million in intangible assets in connection with the Harborside
acquisition: $11.0 million related to CONs, $13.0 million related to tradenames
and the remaining $0.3 million related to deferred financing costs. The $273.3
million in goodwill has been assigned to the Inpatient Services segment and none
of the goodwill is expected to be deductible for tax purposes.
F-21
SUN
HEALTHCARE GROUP, INC. AND SUBSIDIARIES
NOTES
TO CONSOLIDATED FINANCIAL STATEMENTS (CONTINUED)
DECEMBER
31, 2009
The CONs are an indefinite life intangible asset. The tradenames are
a finite life intangible with a useful life of eight years. The
deferred financing costs will be amortized into interest expense over the
remaining life of the debt to which the costs relate.
As a
result of the exercise of Harborside’s real estate purchase options, property
and equipment increased by $76.3 million, resulting in a $15.1 million increase
to goodwill, which adjustment is reflected in the fair value table
above.
The
following unaudited summarized pro forma results of operations for the year
ended December 31, 2007 assume that the Harborside acquisition occurred at the
beginning of the period. These unaudited pro forma results are not
necessarily indicative of the actual results of operations that would have been
achieved, nor are they necessarily indicative of future results of operations
(in thousands, except per share data):
| For the Year Ended | |||
|
December
31, 2007
|
|||
|
(pro
forma)
|
|||
|
Revenues
|
$
|
1,718,656
|
|
|
Costs
and expenses:
|
|||
|
Operating
costs
|
1,511,685
|
||
|
Center
rent expense
|
77,366
|
||
|
Depreciation
and amortization
|
35,918
|
||
|
Interest,
net
|
48,940
|
||
|
Non-operating
costs
|
3,196
|
||
|
Total
costs and expenses
|
1,677,105
|
||
|
Income
before income taxes and
|
|||
|
discontinued
operations
|
41,551
|
||
|
Income
tax benefit
|
(11,734
|
)
|
|
|
Income
from continuing operations
|
53,285
|
||
|
Income
from discontinued
|
|||
|
operations,
net
|
2,359
|
||
|
Net
income
|
$
|
55,644
|
|
|
Earnings
per share:
|
|||
|
Basic:
|
|||
|
Income
from continuing operations
|
$
|
1.26
|
|
|
Net
income
|
$
|
1.31
|
|
|
Diluted:
|
|||
|
Income
from continuing operations
|
$
|
1.23
|
|
|
Net
income
|
$
|
1.28
|
F-22
SUN
HEALTHCARE GROUP, INC. AND SUBSIDIARIES
NOTES
TO CONSOLIDATED FINANCIAL STATEMENTS (CONTINUED)
DECEMBER
31, 2009
(7) Goodwill, Intangible Assets and Long-Lived Assets
(a) Goodwill
The
following table provides information regarding our goodwill, which is included
in the accompanying consolidated balance sheets at December 31 (in
thousands):
|
Rehabilitation
|
Medical
|
||||||||
|
Inpatient
|
Therapy
|
Staffing
|
|||||||
|
Services
|
Services
|
Services
|
Consolidated
|
||||||
|
Balance
as of January 1, 2008
|
$
|
319,744
|
$
|
-
|
$
|
4,533
|
$
|
324,277
|
|
|
Goodwill
acquired
|
3,657
|
75
|
-
|
3,732
|
|||||
|
Purchase
price adjustments for prior
|
|||||||||
|
year
acquisition
|
(1,201
|
)
|
-
|
-
|
(1,201
|
)
|
|||
|
Balance
as of December 31, 2008
|
$
|
322,200
|
$
|
75
|
$
|
4,533
|
$
|
326,808
|
|
|
Goodwill
acquired
|
11,276
|
-
|
-
|
11,276
|
|||||
|
Purchase
price adjustments for prior
|
|||||||||
|
year
acquisition
|
212
|
-
|
-
|
212
|
|||||
|
Balance
as of December 31, 2009
|
$
|
333,688
|
$
|
75
|
$
|
4,533
|
$
|
338,296
|
F-23
SUN
HEALTHCARE GROUP, INC. AND SUBSIDIARIES
NOTES
TO CONSOLIDATED FINANCIAL STATEMENTS (CONTINUED)
DECEMBER
31, 2009
(b) Intangible
Assets
The
following table provides information regarding our intangible assets, which are
included in the accompanying consolidated balance sheets at December 31 (in
thousands):
|
Gross
|
||||||||
|
Carrying
|
Accumulated
|
Net
|
||||||
|
Amount
|
Amortization
|
Total
|
||||||
|
Finite-lived
Intangibles:
|
||||||||
|
Favorable
lease intangibles:
|
||||||||
|
2009
|
$
|
10,311
|
$
|
3,140
|
$
|
7,171
|
||
|
2008
|
11,653
|
2,995
|
8,658
|
|||||
|
Deferred
financing costs:
|
||||||||
|
2009
|
$
|
24,548
|
$
|
9,306
|
$
|
15,242
|
||
|
2008
|
24,263
|
5,902
|
18,361
|
|||||
|
Management
and customer contracts:
|
||||||||
|
2009
|
$
|
3,334
|
$
|
2,024
|
$
|
1,310
|
||
|
2008
|
3,334
|
1,501
|
1,833
|
|||||
|
Tradenames:
|
||||||||
|
2009
|
$
|
13,121
|
$
|
4,535
|
$
|
8,586
|
||
|
2008
|
13,119
|
2,894
|
10,225
|
|||||
|
Indefinite-lived
Intangibles:
|
||||||||
|
Certificates
of need/licenses:
|
||||||||
|
2009
|
$
|
21,433
|
$
|
-
|
$
|
21,433
|
||
|
2008
|
15,195
|
-
|
15,195
|
|||||
|
Other
intangible assets:
|
||||||||
|
2009
|
$
|
189
|
$
|
-
|
$
|
189
|
||
|
2008
|
116
|
-
|
116
|
|||||
|
Total
Intangible Assets:
|
||||||||
|
2009
|
$
|
72,936
|
$
|
19,005
|
$
|
53,931
|
||
|
2008
|
67,680
|
13,292
|
54,388
|
|||||
|
Unfavorable
Lease Obligations:
|
||||||||
|
2009
|
$
|
29,113
|
$
|
16,450
|
$
|
12,663
|
||
|
2008
|
29,113
|
13,599
|
15,514
|
A net
credit to rent expense was a result of the amortization of favorable and
unfavorable lease intangibles, recognized as adjustments in rent expense in
connection with fair market valuations performed on our center lease agreements
associated with fresh-start accounting and our
acquisitions. Amortization of deferred financing costs is included in
interest expense.
F-24
SUN
HEALTHCARE GROUP, INC. AND SUBSIDIARIES
NOTES
TO CONSOLIDATED FINANCIAL STATEMENTS (CONTINUED)
DECEMBER
31, 2009
The net
amount recorded to amortization was as follows for the years ended December 31
(in thousands):
|
2009
|
2008
|
2007
|
|||||||
|
Amortization
expense
|
$
|
7,367
|
$
|
7,246
|
$
|
6,241
|
|||
|
Amortization
of unfavorable
|
|||||||||
|
and
favorable lease intangibles, net
|
|||||||||
|
included
in rent expense
|
(1,831
|
)
|
(1,714
|
)
|
(1,318
|
)
|
|||
|
Amortization
of deferred financing
|
|||||||||
|
costs,
included in interest expense
|
(3,333
|
)
|
(3,363
|
)
|
(3,215
|
)
|
|||
|
$
|
2,203
|
$
|
2,169
|
$
|
1,708
|
Total
estimated amortization expense (credit) for our intangible assets for the next
five years is as follows (in thousands):
|
Expense
|
Credit
|
Net
|
|||||||
|
2010
|
$
|
6,191
|
$
|
(2,848
|
)
|
$
|
3,343
|
||
|
2011
|
6,014
|
(2,972
|
)
|
3,042
|
|||||
|
2012
|
5,816
|
(2,703
|
)
|
3,113
|
|||||
|
2013
|
5,299
|
(2,172
|
)
|
3,127
|
|||||
|
2014
|
3,959
|
(1,171
|
)
|
2,788
|
The
weighted-average amortization period for lease intangibles is approximately six
years at December 31, 2009.
(c) Impairment of Intangible
Assets
Goodwill
We
perform our annual goodwill impairment analysis for our reporting units during
the fourth quarter of each year. A reporting unit is a business for
which discrete financial information is produced and reviewed by operating
segment management and provides services that are distinct from the other
components of the operating segment and are reviewed at the division
level. For our Rehabilitation Therapy Services and Medical Staffing
Services segments, the reporting unit for our annual goodwill impairment
analysis was determined to be at the segment level. For our Inpatient
Services segment, the reporting unit for our annual goodwill impairment analysis
was determined to be at one level below our segment level. We
determined potential impairment by comparing the net assets of each reporting
unit to their respective fair values. We determined the estimated fair value of
each reporting unit using a discounted cash flow analysis and other appropriate
valuation methodologies. In the event a unit's net assets exceed its fair value,
an implied fair value of goodwill must be determined by assigning the unit's
fair value to each asset and liability of the unit. The excess of the fair value
of the reporting unit over the amounts assigned to its assets and liabilities is
the implied fair value of goodwill. An impairment loss is measured by the
difference between the goodwill carrying value and the implied fair value. Based
on the analysis performed, we determined there was no goodwill impairment for
the years ended December 31, 2009, 2008, or 2007.
During
2008, we determined that the valuation allowance for net deferred tax assets
related to our recent acquisitions should be reduced by $1.2 million, which
decreased goodwill.
F-25
SUN
HEALTHCARE GROUP, INC. AND SUBSIDIARIES
NOTES
TO CONSOLIDATED FINANCIAL STATEMENTS (CONTINUED)
DECEMBER
31, 2009
Indefinite
Lived Intangibles
Our
indefinite lived intangibles consist primarily of values assigned to CONs
obtained through our acquisition of Harborside.
We
evaluate the recoverability of our indefinite lived intangibles, which are
principally CONs, by comparing the asset's respective carrying value to
estimates of fair value. We determine the estimated fair value of these
intangible assets through an estimate of incremental cash flows with the
intangible assets versus cash flows without the intangible assets in place. We
determined there was
no impairment of our indefinite lived intangibles for the years ended
December 31, 2009, 2008 or 2007.
During
2007, we determined that a portion of the income tax payable balance established
in fresh-start could be offset by net operating loss (“NOL”)
carrybacks. We also determined that a portion of the pre-emergence
net deferred tax assets will more likely than not be realized, and a reduction
in the valuation allowance established in fresh-start accounting has been
recorded. Accordingly, we have reduced remaining intangible assets
recorded in fresh-start accounting by $0.7 million, which consisted primarily of
favorable lease intangibles. (See Note 10 – “Income
Taxes.”)
Finite Lived
Intangibles
Our
finite lived intangibles include tradenames (principally recognized with the
Harborside acquisition), favorable lease intangibles, deferred financing costs,
customer contracts and various licenses.
We
evaluate the recoverability of our finite lived intangibles if an impairment
indicator is present. As there were no such indicators, we determined
there was no impairment of our finite lived intangibles for the years ended
December 31, 2009, 2008 or 2007.
(d) Impairment of Long-Lived
Assets
GAAP
requires impairment losses to be recognized for long-lived assets used in
operations when indicators of impairment are present and the estimated
undiscounted cash flows are not sufficient to recover the assets' carrying
amounts. In estimating the undiscounted cash flows for our impairment
assessment, we primarily use our internally prepared budgets and forecast
information including adjustments for the following items: Medicare and Medicaid
funding; overhead costs; capital expenditures; and patient care liability
costs. We assess the need for an impairment write-down when such
indicators of impairment are present. We determined there was no
impairment of long-lived assets used in continuing operations for the
years ended December 31, 2009, 2008 or 2007.
(e) Long Lived Assets to be Disposed
Of
GAAP
requires that long-lived assets to be disposed of be measured at the lower of
carrying amount or fair value less cost to sell, whether reported in continuing
operations or in discontinued operations. GAAP defines the reporting
of discontinued operations to include all components of an entity with
operations that can be distinguished from the rest of the entity and that will
be eliminated from the ongoing operations of the entity in a disposal
transaction. Depreciation is discontinued once an asset is classified as held
for sale.
F-26
SUN
HEALTHCARE GROUP, INC. AND SUBSIDIARIES
NOTES
TO CONSOLIDATED FINANCIAL STATEMENTS (CONTINUED)
DECEMBER
31, 2009
(8) Sale
of Assets, Discontinued Operations and Assets and Liabilities Held for
Sale
(a) Gain (Loss) on Sale of Assets, net
of related taxes
We
reported a $0.3 million net loss, $3.0 million net loss, and $0.2 million net
loss for the years ended December 31, 2009, 2008, and 2007, respectively,
primarily related to the disposals of assets associated with discontinued
operations.
(b) Discontinued
Operations
In
accordance with GAAP, the results of operations of assets to be disposed of,
disposed assets and the gains (losses) related to these divestitures have been
classified as discontinued operations for all periods presented in the
accompanying consolidated income statements as their operations and cash flows
have been (or will be) eliminated from our ongoing operations and we will not
have any significant continuing involvement in their operations after their
disposal.
Inpatient Services: During
2009, we reclassified one assisted living center into discontinued operations as
we elected to not renew that center’s lease and allowed operations to transfer
to another operator.
During
2008, we reclassified six skilled nursing centers into discontinued operations
because they were divested, sold or qualified as assets held for sale. In the
second quarter of 2008, we sold two hospitals that were classified as held for
sale since 2007 for $10.1 million and recorded a net loss of $2.7 million. In
the third quarter of 2008, we exercised an option to purchase a skilled nursing
center in Indiana that was classified as held for sale since 2007 and
simultaneously sold the asset for a net $0.4 million and recorded a net loss of
$0.2 million. In the third quarter of 2008, we also exercised options
to purchase two skilled nursing centers in Oklahoma that were classified as held
for sale and sold three skilled nursing centers in Oklahoma for $7.6 million and
recorded a net loss of $0.9 million, and transferred operations of a leased
skilled nursing center in Tennessee to an outside party. In the fourth quarter
of 2008, we transferred operations of a leased skilled nursing center in Utah to
an outside party.
During
2007, we reclassified two hospitals and one skilled nursing center into
discontinued operations because they were divested, sold or qualified as assets
held for sale. In the first quarter of 2007, we sold a skilled nursing center
that was classified as held for sale since 2006 for $4.9 million and recorded a
net loss of $0.5 million.
The two
hospitals moved to discontinued operations in 2007 are part of a larger master
lease agreement. In 2008, the lessor sold the two hospitals to a
third party and reduced the master lease’s rent charged to
us. However, the rent reduction was only a portion of the rent
charged to us and we will continue to be responsible for the
remainder. Therefore, in accordance with the accounting guidance for
costs associated with exit activities, we accrued a liability
for continuing costs incurred without economic benefit upon disposal of the
operation (i.e. the “cease-use” date). The liability at December 31,
2008 was $6.0 million, $1.0 million of which is in current liabilities in the
accompanying consolidated balance sheet.
Home Health Services: In
October 2007, we sold our 75% interest in a home health services subsidiary,
which we acquired as part of the Harborside acquisition, for $1.6 million, and
we recorded a net loss of $0.1 million.
Laboratory and Radiology
Services: In the second quarter of 2007, we sold our remaining laboratory
and radiology business for $3.2 million, and we recorded a net gain of $1.6
million.
F-27
SUN
HEALTHCARE GROUP, INC. AND SUBSIDIARIES
NOTES
TO CONSOLIDATED FINANCIAL STATEMENTS (CONTINUED)
DECEMBER
31, 2009
Other: We also sold a
subsidiary that provided adolescent rehabilitation and special education
services during the fourth quarter of 2008.
(c) Assets and Liabilities
Held for Sale
We had no
assets held for sale as of December 31, 2009. As of December 31,
2008, assets held for sale consisted of (i) a skilled nursing center with a net
carrying amount of $2.8 million, primarily consisting of property and equipment
and, (ii) an undeveloped parcel of land valued at $0.9 million, which was
classified in our Corporate segment in our consolidated financial
statements.
Other
discontinued operations are principally comprised of the operations of a
regional provider of adolescent rehabilitation and special education
services.
A summary
of the discontinued operations for the years ended December 31 is as follows (in
thousands):
|
2009
|
|||||||||
|
Inpatient
|
|||||||||
|
Services
|
Other
|
Total
|
|||||||
|
Net
operating revenues
|
$
|
521
|
$
|
-
|
$
|
521
|
|||
|
Loss
from discontinued operations, net (1)
|
$
|
(3,442
|
)
|
$
|
(34
|
)
|
$
|
(3,476
|
)
|
|
Loss
on disposal of discontinued operations, net (2)
|
(317
|
)
|
(16
|
)
|
(333
|
)
|
|||
|
Loss
from discontinued operations, net
|
$
|
(3,759
|
)
|
$
|
(50
|
)
|
$
|
(3,809
|
)
|
(1) Net
of related tax benefit of $2,416
(2) Net
of related tax benefit of $231
|
2008
|
|||||||||
|
Inpatient
|
|||||||||
|
Services
|
Other
|
Total
|
|||||||
|
Net
operating revenues
|
$
|
42,288
|
$
|
17,888
|
$
|
60,176
|
|||
|
Loss
from discontinued operations, net (1)
|
$
|
(1,423
|
)
|
$
|
(213
|
)
|
$
|
(1,636
|
)
|
|
Loss
on disposal of discontinued operations, net (2)
|
(2,246
|
)
|
(755
|
)
|
(3,001
|
)
|
|||
|
Loss
from discontinued operations, net
|
$
|
(3,669
|
)
|
$
|
(968
|
)
|
$
|
(4,637
|
)
|
(1) Net
of related tax benefit of $1,125
(2) Net
of related tax benefit of $1,949
F-28
SUN
HEALTHCARE GROUP, INC. AND SUBSIDIARIES
NOTES
TO CONSOLIDATED FINANCIAL STATEMENTS (CONTINUED)
DECEMBER
31, 2009
|
2007
|
|||||||||
|
Inpatient
|
|||||||||
|
Services
|
Other
|
Total
|
|||||||
|
Net
operating revenues
|
$
|
76,634
|
$
|
24,474
|
$
|
101,108
|
|||
|
Income
(loss) from discontinued operations, net (1)
|
$
|
5,796
|
$
|
(2,179
|
)
|
$
|
3,617
|
||
|
Income
(loss) on disposal of discontinued operations, net
(2)
|
(1,588
|
)
|
1,388
|
(200
|
)
|
||||
|
Loss
from discontinued operations, net
|
$
|
4,208
|
$
|
(791
|
)
|
$
|
3,417
|
||
(1) Net
of related tax benefit of $653
(2) Net
of related tax expense of $0
(9) Commitments
and Contingencies
(a) Lease
Commitments
We lease
real estate and equipment under cancelable and noncancelable agreements. Most of
our operating leases have original terms from seven to twelve years and contain
at least one renewal option (which could extend the terms of the leases by five
to ten years), escalation clauses (primarily related to inflation) and
provisions for payments by us of real estate taxes, insurance and maintenance
costs. Leases with a fixed escalation are accounted for on a straight-line
basis. Future minimum operating lease payments as of December 31, 2009
under real estate leases and non-cancelable equipment leases are as follows (in
thousands):
|
2010
|
$
|
89,141
|
|
|
2011
|
83,700
|
||
|
2012
|
80,446
|
||
|
2013
|
76,955
|
||
|
2014
|
44,523
|
||
|
Thereafter
|
125,623
|
||
|
Total
minimum lease payments
|
$
|
500,388
|
Center
rent expense for continuing operations totaled $73.1 million, $73.6 million, and
$70.4 million for the years ended December 31, 2009, 2008, and 2007,
respectively. Center rent expense for discontinued operations for the years
ended December 31, 2009, 2008 and 2007 was $0.2 million, $3.6 million, and $6.7
million, respectively.
(b) Purchase
Commitments
We have
an agreement establishing Medline Industries, Inc. (“Medline”) as the primary
medical supply vendor through December 31, 2014 for all of the healthcare
centers that we operate. The agreement provides that the long-term
care division of the Inpatient Services segment shall purchase at least 90% of
its medical supply products from Medline.
We have
an agreement establishing SYSCO Corporation (“SYSCO”) as our primary foodservice
supply vendor through March 31, 2010 for all of our healthcare
centers. The agreement provides that the long-term care division of
the Inpatient Services segment shall purchase at least 80% of its foodservice
supply products from SYSCO.
F-29
SUN
HEALTHCARE GROUP, INC. AND SUBSIDIARIES
NOTES
TO CONSOLIDATED FINANCIAL STATEMENTS (CONTINUED)
DECEMBER
31, 2009
We have an
agreement establishing Omnicare Pharmacy Services as the primary pharmacy
services vendor through December 31, 2010 for all of the healthcare centers that
we currently operate and acquire during the term of the agreement.
(c) Insurance
We
self-insure for certain insurable risks, including general and professional
liabilities, workers' compensation liabilities and employee health insurance
liabilities through the use of self-insurance or retrospective and self-funded
insurance policies and other hybrid policies, which vary by the states in which
we operate. There is a risk that amounts funded to our self-insurance programs
may not be sufficient to respond to all claims asserted under those
programs. Insurance reserves represent estimates of future claims
payments. This liability includes an estimate of the development of reported
losses and losses incurred but not reported. Provisions for changes in insurance
reserves are made in the period of the related coverage. An
independent actuarial analysis is prepared twice a year to assist management in
determining the adequacy of the self-insurance obligations booked as liabilities
in our financial statements. The methods of making such estimates and
establishing the resulting reserves are reviewed periodically and are based on
historical paid claims information and nationwide nursing home trends. Any
adjustments resulting there from are reflected in current earnings. Claims are
paid over varying periods, and future payments may be different than the
estimated reserves.
We
evaluate the adequacy of our self-insurance reserves on a quarterly basis and
perform detailed actuarial analyses semi-annually in the second and fourth
quarters. The analyses use generally accepted actuarial methods in evaluating
the workers’ compensation reserves and general and professional liability
reserves. For both the workers’ compensation reserves and the general
and professional liability reserves, those methods include reported and paid
loss development methods, expected loss method and the reported and paid
Bornhuetter-Ferguson methods. Reported loss methods focus on
development of case reserves for incurred losses through claims closure. Paid
loss methods focus on development of claims actually paid to date. Expected loss
methods are based upon an anticipated loss per unit of measure. The
Bornhuetter-Ferguson method is a combination of loss development methods and
expected loss methods.
The
foundation for most of these methods is our actual historical reported and/or
paid loss data, over which we have effective internal controls. We utilize
third-party administrators (“TPAs”) to process claims and to provide us with the
data utilized in our semi-annual actuarial analyses. The TPAs are under the
oversight of our in-house risk management and legal functions. These functions
ensure that the claims are properly administered so that the historical data is
reliable for estimation purposes. Case reserves, which are approved by our legal
and risk management departments, are determined based on our estimate of the
ultimate settlement of individual claims. In cases where our historical data are
not statistically credible, stable, or mature, we supplement our experience with
nursing home industry benchmark reporting and payment patterns.
The use
of multiple methods tends to eliminate any biases that one particular method
might have. Management’s judgment based upon each method’s inherent limitations
is applied when weighting the results of each method. The results of
each of the methods are estimates of ultimate losses which includes the case
reserves plus an estimate for future development of these reserves based on past
trends, and an estimate for losses incurred but not
reported. These results are compared by accident year and an
estimated unpaid loss and allocated loss adjustment expense are determined for
the open accident years based on judgment reflecting the range of estimates
produced by the methods.
During
2009, we determined that the previous estimates for workers’ compensation
reserves for accident years
F-30
SUN
HEALTHCARE GROUP, INC. AND SUBSIDIARIES
NOTES
TO CONSOLIDATED FINANCIAL STATEMENTS (CONTINUED)
DECEMBER
31, 2009
prior to
2009 were understated based on currently available information, by $2.0 million
or approximately 2.9%. Of that amount, $1.7 million related to
continuing operations and $0.3 million related to discontinued
operations. While certain of the claims settled for less than the
case reserves, a number also settled for greater than the case
reserves. There were no large or unusual settlements during the
period. As of December 31, 2009, the discounting of the policy
periods resulted in a reduction to our reserves of $13.0 million.
We also
determined during 2009 that the previous estimates for general and professional
liabilities reserves for accident years prior to 2009 were understated, based on
currently available information, by $7.4 million or approximately
8.5%. Of that amount, $6.5 million related to continuing operations
and $0.9 million related to discontinued operations. Although there
were no large or unusual settlements or significant new claims during the
period, we experienced in 2009 a higher amount of claims than anticipated.
Professional liability claims have a reporting tail that exceeds one
year. A significant component of our reserves is estimates for
incidents that have been incurred but not reported. The reduction in prior
period’s reserves is driven in part by a decrease in our estimate of incurred
but not reported claims.
Activity
in our insurance reserves as of and for the years ended December 31, 2009, 2008
and 2007 is as follows (in thousands):
|
Professional
Liability
|
Workers’
Compensation
|
Total
|
|||||||
|
Balance
as of January 1, 2007
|
$
|
75,078
|
$
|
51,521
|
$
|
126,599
|
|||
|
Current
year provision, continuing operations
|
28,413
|
24,709
|
53,122
|
||||||
|
Current
year provision, discontinued operations
|
1,611
|
1,365
|
2,976
|
||||||
|
Prior
year reserve adjustments, continuing operations
|
(6,605
|
)
|
(1,994
|
)
|
(8,599
|
)
|
|||
|
Prior
year reserve adjustments, discontinued operations
|
(2,395
|
)
|
(1,506
|
)
|
(3,901
|
)
|
|||
|
Claims
paid, continuing operations
|
(12,936
|
)
|
(15,600
|
)
|
(28,536
|
)
|
|||
|
Claims
paid, discontinued operations
|
(8,547
|
)
|
(4,850
|
)
|
(13,397
|
)
|
|||
|
Amounts
paid for administrative services and other
|
(6,124
|
)
|
(6,558
|
)
|
(12,682
|
)
|
|||
|
Reserve
established through purchase accounting
|
17,796
|
14,352
|
32,148
|
||||||
|
Balance
as of December 31, 2007
|
$
|
86,291
|
$
|
61,439
|
$
|
147,730
|
|||
|
Current
year provision, continuing operations
|
29,454
|
29,339
|
58,793
|
||||||
|
Current
year provision, discontinued operations
|
790
|
848
|
1,638
|
||||||
|
Prior
year reserve adjustments, continuing operations
|
(1,700
|
)
|
2,600
|
900
|
|||||
|
Prior
year reserve adjustments, discontinued operations
|
(20
|
)
|
400
|
380
|
|||||
|
Claims
paid, continuing operations
|
(20,343
|
)
|
(18,499
|
)
|
(38,842
|
)
|
|||
|
Claims
paid, discontinued operations
|
(3,755
|
)
|
(3,674
|
)
|
(7,429
|
)
|
|||
|
Amounts
paid for administrative services and other
|
(3,435
|
)
|
(5,865
|
)
|
(9,300
|
)
|
|||
|
Balance
as of December 31, 2008
|
$
|
87,282
|
$
|
66,588
|
$
|
153,870
|
|||
|
Current
year provision, continuing operations
|
27,152
|
28,380
|
55,532
|
||||||
|
Current
year provision, discontinued operations
|
1,512
|
632
|
2,144
|
||||||
|
Prior
year reserve adjustments, continuing operations
|
6,500
|
1,720
|
8,220
|
||||||
|
Prior
year reserve adjustments, discontinued operations
|
890
|
230
|
1,120
|
||||||
|
Claims
paid, continuing operations
|
(20,394
|
)
|
(20,165
|
)
|
(40,559
|
)
|
|||
|
Claims
paid, discontinued operations
|
(3,699
|
)
|
(2,530
|
)
|
(6,229
|
)
|
|||
|
Amounts
paid for administrative services and other
|
(4,313
|
)
|
(7,349
|
)
|
(11,662
|
)
|
|||
|
Balance
as of December 31, 2009
|
$
|
94,930
|
$
|
67,506
|
$
|
162,436
|
F-31
SUN
HEALTHCARE GROUP, INC. AND SUBSIDIARIES
NOTES
TO CONSOLIDATED FINANCIAL STATEMENTS (CONTINUED)
DECEMBER
31, 2009
A summary
of the assets and liabilities related to insurance risks at December 31 is as
indicated below (in thousands):
|
2009
|
|
|
2008
|
|||||||||||||||
|
Professional
|
Workers'
|
|
|
Professional
|
Workers'
|
|||||||||||||
|
Liability
|
Compensation
|
Total
|
|
|
Liability
|
Compensation
|
Total
|
|||||||||||
|
Assets
(1):
|
|
|
||||||||||||||||
|
Restricted
cash
|
|
|
||||||||||||||||
|
Current
|
$
|
3,406
|
$
|
12,013
|
$
|
15,419
|
|
|
$
|
3,439
|
$
|
22,131
|
$
|
25,570
|
||||
|
Non-current
|
-
|
-
|
-
|
|
|
-
|
-
|
-
|
||||||||||
|
Total
|
$
|
3,406
|
$
|
12,013
|
$
|
15,419
|
|
|
$
|
3,439
|
$
|
22,131
|
$
|
25,570
|
||||
|
|
|
|||||||||||||||||
|
Liabilities
(2)(3):
|
|
|
||||||||||||||||
|
Self-insurance
|
|
|
||||||||||||||||
|
liabilities
|
|
|
||||||||||||||||
|
Current
|
$
|
20,369
|
$
|
20,119
|
$
|
40,488
|
|
|
$
|
20,739
|
$
|
18,574
|
$
|
39,313
|
||||
|
Non-current
|
74,561
|
47,387
|
121,948
|
|
|
66,543
|
48,014
|
114,557
|
||||||||||
|
Total
|
$
|
94,930
|
$
|
67,506
|
$
|
162,436
|
|
|
$
|
87,282
|
$
|
66,588
|
$
|
153,870
|
||||
|
(1)
|
Total
restricted cash excluded $11,932 and $12,409 at December 31, 2009 and
2008, respectively, held for bank collateral, various mortgages, bond
payments and capital expenditures on HUD-insured
buildings.
|
|
(2)
|
Total
self-insurance liabilities excluded $5,173 and $5,980 at December 31, 2009
and 2008, respectively, related to our health insurance
liabilities.
|
|
(3)
|
Total
self-insurance liabilities are collateralized, in addition to the
restricted cash, by letters of credit of $250 and $53,191 for general and
professional liability insurance and workers' compensation, respectively,
as of December 31, 2009 and $750 and $48,172 for general and
professional liability insurance and workers' compensation, respectively,
as of December 31, 2008.
|
(d) Construction
Commitments
As of
December 31, 2009, we had construction commitments under various contracts of
approximately $1.9 million. These items consisted primarily of contractual
commitments to improve existing centers.
(e) Labor Relations
As of
December 31, 2009, SunBridge operated 35 centers with union employees.
Approximately 2,856 of our employees (9.5% of all of our employees) who worked
in healthcare centers in Alabama, California, Connecticut, Georgia,
Massachusetts, Maryland, Montana, New Jersey, Ohio, Rhode Island, Washington and
West Virginia were covered by collective bargaining contracts. Collective
bargaining agreements covering approximately 1,429 of these employees (4.8% of
all our employees) either are currently in renegotiations or will shortly be in
renegotiations due to the expiration of the collective bargaining
agreements.
F-32
SUN
HEALTHCARE GROUP, INC. AND SUBSIDIARIES
NOTES
TO CONSOLIDATED FINANCIAL STATEMENTS (CONTINUED)
DECEMBER
31, 2009
(10) Income
Taxes
The
provision for income taxes was based upon management's estimate of taxable
income or loss for each respective accounting period. We recognized
an asset or liability for the deferred tax consequences of temporary differences
between the tax bases of assets and liabilities and their reported amounts in
the financial statements. These temporary differences would result in
taxable or deductible amounts in future years when the reported amounts of the
assets are recovered or liabilities are settled. We also recognized
as deferred tax assets the future tax benefits from net operating loss, capital
loss, and tax credit carryforwards. A valuation allowance was
provided for certain deferred tax assets, since it is more likely than not that
a portion of the net deferred tax assets will not be realized.
Income
tax expense/(benefit) on income attributable to continuing operations consisted
of the following for the years ended December 31 (in thousands):
|
2009
|
2008
|
2007
|
|||||||
|
Current:
|
|||||||||
|
Federal
|
$
|
-
|
$
|
941
|
$
|
177
|
|||
|
State
|
2,300
|
1,417
|
1,026
|
||||||
|
2,300
|
2,358
|
1,203
|
|||||||
|
Deferred:
|
|||||||||
|
Federal
|
24,829
|
(40,150
|
)
|
(9,788
|
)
|
||||
|
State
|
2,487
|
(9,556
|
)
|
(2,329
|
)
|
||||
|
27,316
|
(49,706
|
)
|
(12,117
|
)
|
|||||
|
Total
|
$
|
29,616
|
$
|
(47,348
|
)
|
$
|
(10,914
|
)
|
Actual
tax expense/(benefit) differed from the expected tax expense , which was
computed by applying the U.S. Federal corporate income tax rate of 35% to our
profit before income taxes for the years ended December 31 as follows (in
thousands):
|
2009
|
2008
|
2007
|
|||||||
|
Computed
expected tax expense
|
$
|
25,234
|
$
|
23,302
|
$
|
15,113
|
|||
|
Adjustments
in income taxes resulting from:
|
|||||||||
|
Change
in valuation allowance
|
-
|
(70,465
|
)
|
(28,834
|
)
|
||||
|
State
income tax expense, net of Federal
|
|||||||||
|
income
tax effect
|
3,814
|
3,568
|
2,357
|
||||||
|
Reduction
in unrecognized tax benefits
|
(56)
|
(2,202
|
)
|
-
|
|||||
|
Refunds
from net operating loss carrybacks
|
-
|
-
|
(322
|
)
|
|||||
|
Tax
credits
|
(1,339)
|
(1,114
|
)
|
(320
|
)
|
||||
|
Nondeductible
compensation
|
53
|
137
|
197
|
||||||
|
Other
nondeductible expenses
|
728
|
964
|
1,018
|
||||||
|
Other
|
1,182
|
(1,538
|
)
|
(123
|
)
|
||||
|
Total
|
$
|
29,616
|
$
|
(47,348
|
)
|
$
|
(10,914
|
)
|
F-33
SUN
HEALTHCARE GROUP, INC. AND SUBSIDIARIES
NOTES
TO CONSOLIDATED FINANCIAL STATEMENTS (CONTINUED)
DECEMBER
31, 2009
Deferred
tax assets (liabilities) at December 31 consisted of the following (in
thousands):
|
2009
|
2008
|
|||||
|
Deferred
tax assets:
|
||||||
|
Accounts
and notes receivable
|
$
|
22,722
|
$
|
18,977
|
||
|
Accrued
liabilities
|
82,018
|
79,136
|
||||
|
Intangible
assets
|
19,555
|
26,873
|
||||
|
Write-down
of assets held for sale
|
1,016
|
1,016
|
||||
|
Partnership
investments
|
4,274
|
3,657
|
||||
|
Minimum
tax and other credit carryforwards
|
8,794
|
7,720
|
||||
|
State
net operating loss carryforwards
|
25,035
|
33,918
|
||||
|
Federal
net operating loss carryforwards
|
79,122
|
85,060
|
||||
|
Other
|
37
|
182
|
||||
|
242,573
|
256,539
|
|||||
|
Less
valuation allowance
|
(27,572)
|
(34,321
|
)
|
|||
|
Total
deferred tax assets
|
215,001
|
222,218
|
||||
|
Deferred
tax liabilities:
|
||||||
|
Property
and equipment
|
(37,587)
|
(30,150
|
)
|
|||
|
Deferred
tax assets, net
|
$
|
177,414
|
$
|
192,068
|
The $6.7
million decrease in the valuation allowance resulted from the expiration of
certain state net operating loss (“NOL”) carryforwards, which were fully
reserved. As such, the deferred tax asset for these expired state net
operating losses and the corresponding valuation allowance were reduced
accordingly. In evaluating the need to maintain a valuation allowance
on our net deferred tax assets, all items of positive evidence (e.g., future
sources of taxable income and tax planning strategies) and negative evidence
(e.g., history of taxable losses) were considered. This assessment
required significant judgment. Based upon our estimates of future
taxable income, we believe that we will more likely than not realize a
significant portion of our net deferred tax assets. If any future
reversals of the remaining valuation allowance of $27.6 million as of December
31, 2009, should occur, then such reversal would reduce the provision for income
taxes.
Internal
Revenue Code Section 382 imposes a limitation on the use of a company’s NOL
carryforwards and other losses when the company has an ownership
change. In general, an ownership change occurs when shareholders
owning 5% or more of a “loss corporation” (a corporation entitled to use NOL or
other loss carryovers) have increased their ownership of stock in such
corporation by more than 50 percentage points during any 3-year testing period
beginning on the first day following the change date for an earlier ownership
change. The annual base Section 382 limitation is calculated by
multiplying the loss corporation's value at the time of the ownership change
times the greater of the long-term tax-exempt rate determined by the IRS in the
month of the ownership change or the two preceding months.
The
issuance of our common stock in connection with an acquisition in 2005 resulted
in an ownership change under Section 382. The annual base Section 382
limitation to be applied to our tax attribute carryforwards as a result of this
ownership change is approximately $10.3 million. Accordingly, our
NOL, capital loss, and tax credit carryforwards have been reduced to take into
account this limitation and the respective carryforward periods for
these
F-34
SUN
HEALTHCARE GROUP, INC. AND SUBSIDIARIES
NOTES
TO CONSOLIDATED FINANCIAL STATEMENTS (CONTINUED)
DECEMBER
31, 2009
tax
attributes. In addition, a separate annual base Section 382
limitation of approximately $14.6 million is to be applied to the tax attribute
carryforwards of Harborside as a result of the Harborside
acquisition.
After
considering the reduction in tax attributes resulting from the Section 382
limitation discussed above, we have Federal NOL carryforwards of approximately
$226.1 million with expiration dates from 2019 through 2027. Various
subsidiaries have state NOL carryforwards totaling approximately $518.1 million
with expiration dates beginning in 2010 through the year 2029. Our application of
the rules under Section 382 is subject to challenge upon IRS
review. A successful challenge could significantly impact our ability
to utilize tax attribute carryforwards from periods prior to the ownership
change dates.
We are
subject to income taxes in the U.S. and numerous state and local
jurisdictions. Significant judgment is required in evaluating our
uncertain tax positions and determining our provision for income
taxes. Effective January 1, 2007, we adopted the guidance for
accounting for uncertain tax positions, which contains a two-step approach to
recognizing and measuring uncertain tax positions. The first step is
to evaluate the tax position for recognition by determining if the weight of
available evidence indicates that it is more likely than not that the position
will be sustained on audit, including resolution of related appeals or
litigation processes, if any. The second step is to measure the tax
benefit as the largest amount that is more than 50% likely of being realized
upon settlement.
Although
we believe we have adequately reserved for our uncertain tax positions, no
assurance can be given that the final tax outcome of these matters will not be
different. We adjust these reserves in light of changing facts and
circumstances, such as the closing of a tax audit or the expiration of the
statute of limitations. To the extent that the final tax outcome of
these matters is different than the amounts recorded, such differences will
impact the provision for income taxes in the period in which such determination
is made. The provision for income taxes includes the impact of
reserve provisions and changes to reserves that are considered appropriate, as
well as the related net interest.
A
reconciliation of the beginning and ending amount of unrecognized tax benefits
is as follows (in thousands):
|
2009
|
2008
|
2007
|
|||||||
|
Balance
at the beginning of the period
|
$
|
25,654
|
$
|
5,417
|
$
|
17,989
|
|||
|
Additions
for tax positions of prior years
|
730
|
-
|
-
|
||||||
|
Reductions
for tax positions of prior years
|
-
|
(1,501
|
)
|
-
|
|||||
|
Additions
based on tax positions related to the current year
|
-
|
23,497
|
1,417
|
||||||
|
Lapsing
of statutes of limitations
|
(68)
|
(1,759
|
)
|
-
|
|||||
|
Other
adjustments
|
-
|
-
|
(13,989
|
)
|
|||||
|
Balance
at the end of the period
|
$
|
26,316
|
$
|
25,654
|
$
|
5,417
|
|||
All of
the gross unrecognized tax benefits would affect the effective tax rate if
recognized. Unrecognized tax benefits are adjusted in the period in
which new information about a tax position becomes available or the final
outcome differs from the amount recorded. Unrecognized tax benefits
are not expected to change significantly over the next twelve
months.
We
recognize potential accrued interest related to unrecognized tax benefits in
income tax expense. Penalties,
F-35
SUN
HEALTHCARE GROUP, INC. AND SUBSIDIARIES
NOTES
TO CONSOLIDATED FINANCIAL STATEMENTS (CONTINUED)
DECEMBER
31, 2009
if
incurred, would also be recognized as a component of income tax
expense. The amount of accrued interest related to unrecognized tax
benefits as of December 31, 2009, and 2008 was $0.2 million and $0.1 million,
respectively.
We file
numerous consolidated and separate state and local income tax returns in
addition to our consolidated U.S. federal income tax return. With few
exceptions, we are no longer subject to U.S. federal, state or local income tax
examinations for years before 2005. These jurisdictions can, however,
adjust NOL carryforwards from earlier years.
(11) Fair
Value of Financial Instruments
The
estimated fair values of our financial instruments as of December 31 were
as follows (in thousands):
|
2009
|
2008
|
|||||||
|
Carrying
|
Carrying
|
|||||||
|
Amount
|
Fair
Value
|
Amount
|
Fair
Value
|
|||||
|
Cash
and cash equivalents
|
$
|
104,483
|
$
|
104,483
|
$
|
92,153
|
$
|
92,153
|
|
Restricted
cash
|
$
|
27,351
|
$
|
27,351
|
$
|
37,979
|
$
|
37,979
|
|
Long-term
debt and capital lease obligations,
|
||||||||
|
including
current portion
|
$
|
700,548
|
$
|
574,770
|
$
|
725,841
|
$
|
645,434
|
|
Interest
rate swap agreements
|
$
|
5,048
|
$
|
5,048
|
$
|
7,644
|
$
|
7,644
|
The cash
and cash equivalents and restricted cash carrying amounts approximate fair value
because of the short maturity of these instruments. At December 31, 2009 and
2008, the fair value of our long-term debt, including current maturities, and
our interest rate swap agreement was based on estimates using present value
techniques that are significantly affected by the assumptions used concerning
the amount and timing of estimated future cash flows and discount rates that
reflect varying degrees of risk.
The FASB
accounting guidance establishes a hierarchy for ranking the quality and
reliability of the information used to determine fair values. This
guidance requires that assets and liabilities carried at fair value be
classified and disclosed in one of the following three categories:
|
Level
1:
|
Unadjusted
quoted market prices in active markets for identical assets or
liabilities.
|
|
Level
2:
|
Unadjusted
quoted prices in active markets for similar assets or liabilities,
unadjusted quoted prices for identical or similar assets or liabilities in
markets that are not active, or inputs other than quoted prices that are
observable for the asset or liability.
|
|
Level
3:
|
Unobservable
inputs for the asset or liability.
|
F-36
SUN
HEALTHCARE GROUP, INC. AND SUBSIDIARIES
NOTES
TO CONSOLIDATED FINANCIAL STATEMENTS (CONTINUED)
DECEMBER
31, 2009
We
endeavor to utilize the best available information in measuring fair
value. The following table summarizes the valuation of our financial
instruments by the above pricing levels as of December 31 (in
thousands):
|
December
31, 2009
|
||||||
|
Unadjusted
Quoted
|
Significant
Other
|
|||||
|
Market
Prices
|
Observable
Inputs
|
|||||
|
Total
|
(Level
1)
|
(Level
2)
|
||||
|
Cash
equivalents – money market
|
||||||
|
funds/certificate
of deposit
|
$
|
36,480
|
$
|
31,429
|
$
|
5,051
|
|
Restricted
cash – money market funds
|
$
|
1,275
|
$
|
1,275
|
$
|
-
|
|
Interest
rate swap agreement – liability
|
$
|
5,048
|
$
|
-
|
$
|
5,048
|
|
December
31, 2008
|
||||||
|
Unadjusted
Quoted
|
Significant
Other
|
|||||
|
Market
Prices
|
Observable
Inputs
|
|||||
|
Total
|
(Level
1)
|
(Level
2)
|
||||
|
Cash
equivalents – money market
|
||||||
|
funds/certificate
of deposit
|
$
|
10,098
|
$
|
5,053
|
$
|
5,045
|
|
Restricted
cash – money market funds
|
$
|
1,272
|
$
|
1,272
|
$
|
-
|
|
Interest
rate swap agreement – liability
|
$
|
7,644
|
$
|
-
|
$
|
7,644
|
We
currently have no other financial instruments subject to fair value measurement
on a recurring basis.
(12) Capital
Stock
(a) Basic and Diluted
Shares
Basic net
income per common share is calculated by dividing net income applicable to
common stock by the weighted average number of common shares outstanding during
the period. The calculation of diluted net income per common share is similar to
that of basic net income per common share, except the denominator is increased
to include the number of additional common shares that would have been
outstanding if all potentially dilutive common shares, principally those
issuable upon the exercise of stock options and warrants and the vesting of
stock units, were issued during the period.
F-37
SUN
HEALTHCARE GROUP, INC. AND SUBSIDIARIES
NOTES
TO CONSOLIDATED FINANCIAL STATEMENTS (CONTINUED)
DECEMBER
31, 2009
The
following table summarizes the calculation of basic and diluted net income per
common share for each period (in thousands except per share data):
|
2009
|
2008
|
2007
|
|||||||
|
Numerator:
|
|||||||||
|
Net
income
|
$
|
38,671
|
$
|
109,287
|
$
|
57,510
|
|||
|
Denominator:
|
|||||||||
|
Weighted
average shares for basic net
|
|||||||||
|
income
per common share
|
43,841
|
43,331
|
42,350
|
||||||
|
Add
dilutive effect of assumed exercise of
|
|||||||||
|
stock
options and warrants and vesting
|
|||||||||
|
of
restricted stock units using the
|
|||||||||
|
treasury
stock method
|
122
|
632
|
1,040
|
||||||
|
Weighted
average shares for diluted net
|
|||||||||
|
income
per common share
|
43,963
|
43,963
|
43,390
|
||||||
|
Basic
net income per common share
|
$
|
0.88
|
$
|
2.52
|
$
|
1.36
|
|||
|
Diluted
net income per common share
|
$
|
0.88
|
$
|
2.49
|
$
|
1.33
|
(b) Equity Incentive
Plans
Pursuant
to our 2004 Equity Incentive Plan (the “2004 Plan”), as of December 31, 2009 our
employees and directors held options to purchase 1,809,432 shares of common
stock and 512,904 unvested restricted stock units. No additional awards can be
made under the 2004 Plan.
As of
December 31, 2009, our directors held options to purchase 20,000 shares under
our 2002 Non-employee Director Equity Incentive Plan (the “Director Plan”). No
additional awards can be made under the Director Plan.
Our 2009
Performance Incentive Plan (the “2009 Plan”) allows for the issuance of shares
of common stock equal to the sum of: (i) 5.2 million shares, plus
(ii) the number of any shares subject to stock options granted under the 2004
Plan or the Director Plan which expire, or for any reason are
canceled or terminated, without being exercised, plus (3) 1.25 times the number
of any shares subject to restricted stock units under the 2004 Plan which are
forfeited, terminated or cancelled without having become vested. As
of December 31, 2009 our employees and directors held options to purchase
480,236 shares of common stock and 486,503 unvested restricted stock
units.
Option
awards are granted with an exercise price equal to the market price of our stock
at the date of grant; those option awards generally vest based on four years of
continuous service and have seven-year contractual terms. Share
awards generally vest over four years and no dividends are paid on unexercised
options or unvested share awards. Certain option and share awards
provide for accelerated vesting if there is a change in control (as defined in
the applicable plan).
During
the year ended December 31, 2009, we issued 219,475 shares of common stock upon
the vesting of restricted stock shares and restricted stock units and the
exercise of stock options.
In
connection with an acquisition in 2005, we assumed the Peak Medical Corporation
1998 Stock Incentive Plan (the “Peak Plan”). As of December 31, 2009, there were
no options outstanding to purchase shares of common
F-38
SUN
HEALTHCARE GROUP, INC. AND SUBSIDIARIES
NOTES
TO CONSOLIDATED FINANCIAL STATEMENTS (CONTINUED)
DECEMBER
31, 2009
stock
under the Peak Plan and 100,837 shares had been issued upon the exercise of
stock options. No additional awards can be made under the Peak
Plan.
A summary
of option activity under the 2004 Plan, the 2009 Plan, the Director Plan and the
Peak Plan during the year ended December 31, 2009 is presented
below:
|
Weighted-
|
||||||||||||
|
Average
|
Aggregate
|
|||||||||||
|
Weighted-
|
Remaining
|
Intrinsic
|
||||||||||
|
Shares
|
Average
|
Contractual
|
Value
|
|||||||||
|
Options
|
(in
thousands)
|
Exercise
Price
|
Term
(in years)
|
(in
thousands)
|
||||||||
|
Outstanding
at January 1, 2009
|
1,898
|
$
|
10.12
|
|||||||||
|
Granted
|
493
|
9.86
|
||||||||||
|
Exercised
|
(20
|
)
|
6.84
|
|||||||||
|
Forfeited
|
(61
|
)
|
11.66
|
|||||||||
|
Outstanding
at December 31, 2009
|
2,310
|
$
|
10.05
|
4
|
$
|
561
|
||||||
|
Exercisable
at December 31, 2009
|
1,130
|
$
|
8.94
|
4
|
$
|
255
|
The fair
value of each option award is estimated on the date of grant using a
Black-Scholes option valuation model that uses the assumptions noted in the
following table. Expected volatility is based on the historical
volatility of our stock. The expected term of options granted is
derived using a temporary “shortcut approach” of our “plain vanilla” employee
stock options as we do not have sufficient data to develop a more precise
estimate. Under this approach, the expected term would be presumed to be the
mid-point between the vesting date and the end of the contractual
term. The risk-free rate for the period within the contractual life
of the option is based on the U.S. Treasury yield curve in effect at the time of
the grant. The weighted-average grant-date fair value of stock options granted
during the year ended December 31, 2009, 2008 and 2007 was $9.86, $5.78 and
$6.38, respectively.
The
significant assumptions in the valuation model for the years ended December 31
are as follows:
|
2009
|
2008
|
2007
|
|||
|
Expected
volatility
|
51.2%
- 51.9%
|
50.7%
- 80.6%
|
52.4%
- 80.6%
|
||
|
Weighted-average
volatility
|
51.6%
|
61.3%
|
63.2%
|
||
|
Expected
term (in years)
|
4.75
|
4.75
|
4.75
|
||
|
Risk-free
rate
|
1.8%
- 2.6%
|
1.6%
- 5.0%
|
3.0%
- 5.0%
|
F-39
SUN
HEALTHCARE GROUP, INC. AND SUBSIDIARIES
NOTES
TO CONSOLIDATED FINANCIAL STATEMENTS (CONTINUED)
DECEMBER
31, 2009
In connection
with the restricted stock units granted to employees we recognized the full fair
value of the shares of nonvested restricted stock awards. A summary
of restricted stock activity with our share-based compensation plans during the
year ended December 31, 2009 is as follows:
|
Weighted-
|
|||||
|
Average
|
|||||
|
Shares
|
Grant-Date
|
||||
|
Nonvested
Shares
|
(in
thousands)
|
Fair
Value
|
|||
|
Nonvested
at January 1, 2009
|
902
|
$
|
11.60
|
||
|
Granted
|
521
|
9.86
|
|||
|
Vested
|
(381
|
)
|
10.92
|
||
|
Forfeited
|
(43
|
)
|
11.65
|
||
|
Nonvested
at December 31, 2009
|
999
|
10.93
|
|||
The total
fair value of restricted shares vested was $4.0 million for the year ended
December 31, 2009 and $3.3 million for the year ended December 31,
2008.
We
recognized stock compensation expense of $5.8 million, $5.3 million and $3.7
million for the years ended December 31, 2009, 2008 and 2007,
respectively.
(13) Other
Events
(a) Litigation
We are a
party to various legal actions and administrative proceedings and are subject to
various claims arising in the ordinary course of our business, including claims
that our services have resulted in injury or death to the residents of our
centers and claims relating to employment and commercial matters. Although we
intend to vigorously defend ourselves in these matters, there can be no
assurance that the outcomes of these matters will not have a material adverse
effect on our results of operations, financial condition and cash
flows. In certain states in which we have operations, insurance
coverage for the risk of punitive damages arising from general and professional
liability litigation may not be available due to state law public policy
prohibitions. There can be no assurance that we will not be liable
for punitive damages awarded in litigation arising in states for which punitive
damage insurance coverage is not available.
We
operate in an industry that is extensively regulated. As such, in the ordinary
course of business, we are continuously subject to state and federal regulatory
scrutiny, supervision and control. Such regulatory scrutiny often includes
inquiries, investigations, examinations, audits, site visits and surveys, some
of which are non-routine. In addition to being subject to direct regulatory
oversight of state and federal regulatory agencies, these industries are
frequently subject to the regulatory supervision of fiscal intermediaries. If a
provider is found by a court of competent jurisdiction to have engaged in
improper practices, it could be subject to civil, administrative or criminal
fines, penalties or restitutionary relief; and reimbursement authorities could
also seek the suspension or exclusion of the provider or individual from
participation in their program. We believe that there has been, and will
continue to be, an increase in governmental investigations of long-term care
providers, particularly in the area of
F-40
SUN
HEALTHCARE GROUP, INC. AND SUBSIDIARIES
NOTES
TO CONSOLIDATED FINANCIAL STATEMENTS (CONTINUED)
DECEMBER
31, 2009
Medicare/Medicaid
false claims, as well as an increase in enforcement actions resulting from these
investigations. Adverse determinations in legal proceedings or governmental
investigations, whether currently asserted or arising in the future, could have
a material adverse effect on our financial position, results of operations and
cash flows.
In
December 2006, Harborside was notified by the United States Department of
Justice (“DOJ”) that one of its subsidiaries is one of a significant number of
unrelated defendants in a qui
tam lawsuit filed under the Federal False Claims Act. We have
cooperated with the DOJ since we became aware of the lawsuit and have
consistently denied the allegations in the lawsuit, which relate to Medicare
billings for durable medical equipment. In October 2009, we agreed to
settle this lawsuit to avoid the protracted costs of litigation. The
settlement agreement provides that the settlement is not an admission of
liability by us or the defendants, releases Harborside and its subsidiary from
all liability arising from allegations in the lawsuit, and required the
defendants to pay $1.4 million, which was paid prior to December 31,
2009.
(b) Other Inquiries
From time
to time, fiscal intermediaries and Medicaid agencies examine cost reports filed
by predecessor operators of our skilled nursing centers. If, as a result of any
such examination, it is concluded that overpayments to a predecessor operator
were made, we, as the current operator of such centers, may be held financially
responsible for such overpayments. At this time we are unable to predict the
outcome of any existing or future examinations.
(c) Legislation, Regulations and Market
Conditions
We are
subject to extensive federal, state and local government regulation relating to
licensure, conduct of operations, ownership of centers, expansion of centers and
services and reimbursement for services. As such, in the ordinary course of
business, our operations are continuously subject to state and federal
regulatory scrutiny, supervision and control. Such regulatory scrutiny often
includes inquiries, investigations, examinations, audits, site visits and
surveys, some of which may be non-routine. We believe that we are in substantial
compliance with the applicable laws and regulations. However, if we are ever
found to have engaged in improper practices, we could be subjected to civil,
administrative or criminal fines, penalties or restitutionary relief, which may
have a material adverse impact on our financial position, results of operations
and cash flows.
(14) Segment
Information
We
operate predominantly in the long-term care segment of the healthcare industry.
We are a provider of nursing, rehabilitative, and related ancillary care
services to nursing home patients.
The
following summarizes the services provided by our reportable and other
segments:
Inpatient
Services: This segment provides, among other services,
inpatient skilled nursing and custodial services as well as rehabilitative,
restorative and transitional medical services. We provide 24-hour nursing care
in these centers by registered nurses, licensed practical nurses and certified
nursing aids. At December 31, 2009, we operated 205 healthcare
centers (consisting of 183 skilled nursing centers, 14 assisted living and
independent living centers and eight mental health centers) with 23,205 licensed
beds as compared with 207 healthcare centers (consisting of 184 skilled nursing
centers, 15 assisted living and independent living centers and eight mental
health centers) with 23,345 licensed beds at December 31, 2008.
F-41
SUN
HEALTHCARE GROUP, INC. AND SUBSIDIARIES
NOTES
TO CONSOLIDATED FINANCIAL STATEMENTS (CONTINUED)
DECEMBER
31, 2009
Rehabilitation Therapy
Services: This segment provides, among other services,
physical, occupational, speech and respiratory therapy supplies and services to
affiliated and nonaffiliated skilled nursing centers. At December 31, 2009,
this segment provided services in 36 states via 464 contracts, 337 nonaffiliated
and 127 affiliated, as compared to 445 contracts at December 31, 2008, of which
327 were nonaffiliated and 118 were affiliated.
Medical Staffing
Services: For the year ended December 31, 2009, this segment
provided services in 44 states and derived 56.1% of its revenues from hospitals
and other providers, 24.7% from skilled nursing centers, 15.3% from schools and
3.9% from prisons. We provide (i) licensed therapists skilled in the areas of
physical, occupational and speech therapy, (ii) nurses, (iii) pharmacists,
pharmacist technicians and medical imaging technicians, (iv) physicians, and (v)
related medical personnel. As of December 31, 2009, this segment had
30 branch offices, which provided temporary therapy, nursing, pharmacy and
physician staffing services in major metropolitan areas and one office servicing
locum tenens. As of December 31, 2008, this segment had 29 branch
offices, which provided temporary therapy, nursing, pharmacy and physician
staffing services in major metropolitan areas and one division office, which
specializes in the placement of temporary traveling therapists, and one office
servicing locum tenens.
Corporate
assets primarily consist of cash and cash equivalents, receivables from
subsidiary segments, notes receivable, property and equipment and unallocated
intangible assets. Although corporate assets include unallocated intangible
assets, the amortization, if applicable, is reflected in the results of
operations of the associated segment.
The
accounting policies of the segments are the same as those described in Note 2 –
“Summary of Significant Accounting Policies.” We primarily evaluate segment
performance based on profit or loss from operations before reorganization and
restructuring items, income taxes and extraordinary items. Gains or losses on
sales of assets and certain items including impairment of assets recorded in
connection with annual impairment testing and restructuring costs are not
considered in the evaluation of segment performance. Interest expense is
recorded in the segment carrying the obligation to which the interest
relates.
Our
reportable segments are strategic business units that provide different products
and services. They are managed separately because each business has
different marketing strategies due to differences in types of customers,
distribution channels and capital resource needs. We evaluate the
operational strengths and performance of each segment based on financial
measures, including net segment income. Net segment income is defined
as earnings before loss (gain) on sale of assets, net, restructuring costs,
income tax benefit and discontinued operations. Net segment income for the year
ended December 31, 2009 for (1) our inpatient services segment increased $1.8
million, or 1.2%, to $156.1 million, (2) our rehabilitation therapy services
segment increased $2.6 million, or 30.6%, to $11.1 million and (3) our medical
staffing services segment decreased $1.1 million, or 11.3%, to $8.6 million due
to the factors discussed below for each segment. We use the measure
of net segment income to help identify opportunities for improvement and assist
in allocating resources to each segment.
F-42
SUN
HEALTHCARE GROUP, INC. AND SUBSIDIARIES
NOTES
TO CONSOLIDATED FINANCIAL STATEMENTS (CONTINUED)
DECEMBER
31, 2009
|
As
of and for the
|
|||||||||||||||||||
|
Year
Ended
|
|||||||||||||||||||
|
December
31, 2009
|
Segment
Information (in thousands):
|
||||||||||||||||||
|
Rehabilitation
|
Medical
|
||||||||||||||||||
|
Inpatient
|
Therapy
|
Staffing
|
Intersegment
|
||||||||||||||||
|
Services
|
Services
|
Services
|
Corporate
|
Eliminations
|
Consolidated
|
||||||||||||||
|
Revenues
from external customers
|
$
|
1,675,775
|
$
|
105,366
|
$
|
100,624
|
$
|
34
|
$
|
-
|
$
|
1,881,799
|
|||||||
|
Intersegment
revenues
|
-
|
74,166
|
1,930
|
-
|
(76,096
|
)
|
-
|
||||||||||||
|
Total
revenues
|
1,675,775
|
179,532
|
102,554
|
34
|
(76,096
|
)
|
1,881,799
|
||||||||||||
|
Operating
salaries and benefits
|
835,038
|
150,271
|
72,336
|
-
|
-
|
1,057,645
|
|||||||||||||
|
Self
insurance for workers'
|
|||||||||||||||||||
|
compensation
and general and
|
|||||||||||||||||||
|
professional
liability insurance
|
59,842
|
2,161
|
1,331
|
418
|
-
|
63,752
|
|||||||||||||
|
Other
operating costs
|
437,594
|
7,620
|
15,713
|
1
|
(76,096
|
)
|
384,832
|
||||||||||||
|
General
and administrative expenses
|
41,243
|
6,868
|
2,811
|
62,070
|
-
|
112,992
|
|||||||||||||
|
Provision
for losses on
|
|||||||||||||||||||
|
accounts
receivable
|
20,660
|
482
|
55
|
-
|
-
|
21,197
|
|||||||||||||
|
Segment
operating income (loss)
|
$
|
281,398
|
$
|
12,130
|
$
|
10,308
|
$
|
(62,455
|
)
|
$
|
-
|
$
|
241,381
|
||||||
|
Center
rent expense
|
71,749
|
480
|
920
|
-
|
-
|
73,149
|
|||||||||||||
|
Depreciation
and amortization
|
41,335
|
540
|
780
|
2,808
|
-
|
45,463
|
|||||||||||||
|
Interest,
net
|
12,226
|
(2
|
)
|
(2
|
)
|
37,105
|
-
|
49,327
|
|||||||||||
|
Net
segment income (loss)
|
$
|
156,088
|
$
|
11,112
|
$
|
8,610
|
$
|
(102,368
|
)
|
$
|
-
|
$
|
73,442
|
||||||
|
Identifiable
segment assets
|
$
|
1,194,306
|
$
|
16,011
|
$
|
25,143
|
$
|
856,259
|
$
|
(528,456
|
)
|
$
|
1,563,263
|
||||||
|
Goodwill
|
$
|
333,688
|
$
|
75
|
$
|
4,533
|
$
|
-
|
$
|
-
|
$
|
338,296
|
|||||||
|
Segment
capital expenditures
|
$
|
50,418
|
$
|
650
|
$
|
74
|
$
|
3,170
|
$
|
-
|
$
|
54,312
|
|||||||
_____________________________________
General
and administrative expenses include operating administrative
expenses.
The term
“segment operating income (loss)” is defined as earnings before center rent
expense, depreciation and amortization, interest, net, loss (gain) on sale of
assets, net, restructuring costs, loss on extinguishment of debt, income tax
benefit and discontinued operations.
The term
“net segment income (loss)” is defined as earnings before loss (gain) on sale of
assets, net, restructuring costs, income tax benefit and discontinued
operations.
F-43
SUN
HEALTHCARE GROUP, INC. AND SUBSIDIARIES
NOTES
TO CONSOLIDATED FINANCIAL STATEMENTS (CONTINUED)
DECEMBER
31, 2009
|
As
of and for the
|
|||||||||||||||||||
|
Year
Ended
|
|||||||||||||||||||
|
December
31, 2008
|
Segment
Information (in thousands):
|
||||||||||||||||||
|
Rehabilitation
|
Medical
|
||||||||||||||||||
|
Inpatient
|
Therapy
|
Staffing
|
Intersegment
|
||||||||||||||||
|
Services
|
Services
|
Services
|
Corporate
|
Eliminations
|
Consolidated
|
||||||||||||||
|
Revenues
from external customers
|
$
|
1,616,059
|
$
|
89,619
|
$
|
117,788
|
$
|
37
|
$
|
-
|
$
|
1,823,503
|
|||||||
|
Intersegment
revenues
|
-
|
60,856
|
2,622
|
-
|
(63,478
|
)
|
-
|
||||||||||||
|
Total
revenues
|
1,616,059
|
150,475
|
120,410
|
37
|
(63,478
|
)
|
1,823,503
|
||||||||||||
|
Operating
salaries and benefits
|
817,825
|
124,817
|
86,345
|
-
|
-
|
1,028,987
|
|||||||||||||
|
Self
insurance for workers'
|
|||||||||||||||||||
|
compensation
and general and
|
|||||||||||||||||||
|
professional
liability insurance
|
55,485
|
2,138
|
1,514
|
557
|
-
|
59,694
|
|||||||||||||
|
Other
operating costs
|
411,899
|
7,113
|
17,553
|
(2
|
)
|
(63,478
|
)
|
373,085
|
|||||||||||
|
General
and administrative expenses
|
41,380
|
6,806
|
2,983
|
62,303
|
-
|
113,472
|
|||||||||||||
|
Provision
for losses on
|
|||||||||||||||||||
|
accounts
receivable
|
13,331
|
213
|
563
|
-
|
-
|
14,107
|
|||||||||||||
|
Segment
operating income (loss)
|
$
|
276,139
|
$
|
9,388
|
$
|
11,452
|
$
|
(62,821
|
)
|
$
|
-
|
$
|
234,158
|
||||||
|
Center
rent expense
|
72,231
|
394
|
976
|
-
|
-
|
73,601
|
|||||||||||||
|
Depreciation
and amortization
|
35,957
|
533
|
806
|
3,058
|
-
|
40,354
|
|||||||||||||
|
Interest,
net
|
13,670
|
(1
|
)
|
(20
|
)
|
40,954
|
-
|
54,603
|
|||||||||||
|
Net
segment income (loss)
|
$
|
154,281
|
$
|
8,462
|
$
|
9,690
|
$
|
(106,833
|
)
|
$
|
-
|
$
|
65,600
|
||||||
|
Identifiable
segment assets
|
$
|
1,148,320
|
$
|
12,489
|
$
|
28,262
|
$
|
880,428
|
$
|
(528,449
|
)
|
$
|
1,541,050
|
||||||
|
Goodwill
|
$
|
322,200
|
$
|
75
|
$
|
4,533
|
$
|
-
|
$
|
-
|
$
|
326,808
|
|||||||
|
Segment
capital expenditures
|
$
|
39,976
|
$
|
286
|
$
|
188
|
$
|
1,962
|
$
|
-
|
$
|
42,412
|
|||||||
_____________________________________
General
and administrative expenses include operating administrative
expenses.
The term
“segment operating income (loss)” is defined as earnings before center rent
expense, depreciation and amortization, interest, net, loss (gain) on sale of
assets, net, restructuring costs, loss on extinguishment of debt, income tax
benefit and discontinued operations.
The term
“net segment income (loss)” is defined as earnings before loss (gain) on sale of
assets, net, restructuring costs, income tax benefit and discontinued
operations.
F-44
SUN
HEALTHCARE GROUP, INC. AND SUBSIDIARIES
NOTES
TO CONSOLIDATED FINANCIAL STATEMENTS (CONTINUED)
DECEMBER
31, 2009
|
As
of and for the
|
|||||||||||||||||||
|
Year
Ended
|
|||||||||||||||||||
|
December
31, 2007
|
Segment
Information (in thousands):
|
||||||||||||||||||
|
Rehabilitation
|
Medical
|
||||||||||||||||||
|
Inpatient
|
Therapy
|
Staffing
|
Intersegment
|
||||||||||||||||
|
Services
|
Services
|
Services
|
Corporate
|
Eliminations
|
Consolidated
|
||||||||||||||
|
Revenues
from external customers
|
$
|
1,367,399
|
$
|
82,198
|
$
|
108,082
|
$
|
77
|
$
|
-
|
$
|
1,557,756
|
|||||||
|
Intersegment
revenues
|
-
|
44,857
|
3,150
|
-
|
(48,007
|
)
|
-
|
||||||||||||
|
Total
revenues
|
1,367,399
|
127,055
|
111,232
|
77
|
(48,007
|
)
|
1,557,756
|
||||||||||||
|
Operating
salaries and benefits
|
696,487
|
106,173
|
85,441
|
-
|
-
|
888,101
|
|||||||||||||
|
Self
insurance for workers'
|
|||||||||||||||||||
|
compensation
and general and
|
|||||||||||||||||||
|
professional
liability insurance
|
40,615
|
1,782
|
1,656
|
471
|
-
|
44,524
|
|||||||||||||
|
Other
operating costs
|
349,536
|
6,292
|
11,165
|
24
|
(48,007
|
)
|
319,010
|
||||||||||||
|
General
and administrative expenses
|
31,998
|
4,978
|
2,974
|
64,835
|
-
|
104,785
|
|||||||||||||
|
Provision
(adjustment) for losses on
|
|||||||||||||||||||
|
accounts
receivable
|
9,549
|
(670
|
)
|
103
|
-
|
-
|
8,982
|
||||||||||||
|
Segment
operating income (loss)
|
$
|
239,214
|
$
|
8,500
|
$
|
9,893
|
$
|
(65,253
|
)
|
$
|
-
|
$
|
192,354
|
||||||
|
Center
rent expense
|
69,298
|
208
|
907
|
-
|
-
|
70,413
|
|||||||||||||
|
Depreciation
and amortization
|
25,994
|
528
|
749
|
3,947
|
-
|
31,218
|
|||||||||||||
|
Interest,
net
|
11,487
|
11
|
16
|
32,833
|
-
|
44,347
|
|||||||||||||
|
Net
segment income (loss)
|
$
|
132,435
|
$
|
7,753
|
$
|
8,221
|
$
|
(102,033
|
)
|
$
|
-
|
$
|
46,376
|
||||||
|
Identifiable
segment assets
|
$
|
1,095,763
|
$
|
15,430
|
$
|
37,217
|
$
|
724,553
|
$
|
(521,049
|
)
|
$
|
1,351,914
|
||||||
|
Goodwill
|
$
|
319,744
|
$
|
-
|
$
|
4,533
|
$
|
-
|
$
|
-
|
$
|
324,277
|
|||||||
|
Segment
capital expenditures
|
$
|
27,472
|
$
|
1,324
|
$
|
426
|
$
|
3,589
|
$
|
-
|
$
|
32,811
|
|||||||
_____________________________________
General
and administrative expenses include operating administrative
expenses.
The term
“segment operating income (loss)” is defined as earnings before center rent
expense, depreciation and amortization, interest, net, loss (gain) on sale of
assets, net, restructuring costs, loss on extinguishment of debt, income tax
benefit and discontinued operations.
The term
“net segment income (loss)” is defined as earnings before loss (gain) on sale of
assets, net, restructuring costs, income tax benefit and discontinued
operations.
F-45
SUN
HEALTHCARE GROUP, INC. AND SUBSIDIARIES
NOTES
TO CONSOLIDATED FINANCIAL STATEMENTS (CONTINUED)
DECEMBER
31, 2009
Measurement
of Segment Income or Loss
The
accounting policies of the operating segments are the same as those described in
the summary of significant accounting policies (See Note 2 – “Summary of
Significant Accounting Policies”). We evaluate financial performance
and allocate resources primarily based on income or loss from operations before
income taxes, excluding any unusual items.
The
following table reconciles net segment income to consolidated income before
income taxes and discontinued operations for the years ended December 31 (in
thousands):
|
2009
|
2008
|
2007
|
|||||||
|
Net
segment income
|
$
|
73,442
|
$
|
65,600
|
$
|
46,376
|
|||
|
Restructuring
costs, net
|
(1,304
|
)
|
-
|
-
|
|||||
|
Loss
on extinguishment of debt
|
-
|
-
|
(3,173
|
)
|
|||||
|
(Loss)
gain on sale of assets, net
|
(42
|
)
|
976
|
(24
|
)
|
||||
|
Income
before income taxes and
|
|||||||||
|
discontinued
operations
|
$
|
72,096
|
$
|
66,576
|
$
|
43,179
|
(15) 401(k)
Plan
We have a
defined contribution plan (the “401(k) plan”). Employees who have completed
three months of service are eligible to participate. The 401(k) plan allows for
a discretionary employer match of contributions made by participants for any
participants employed on the last day of the year. We may make matching
contributions under this plan of 25% of a participant’s contribution, up to 6%
of the participant's compensation. Expenses for discretionary matching
contributions are recognized in the year they are determined. In January 2008,
matching contributions for the 2007 participant contributions of $1.4 million
were authorized. In January 2009, matching contributions for the 2008
participant contributions of $1.9 million were authorized. There were
no matching contributions in January 2010 for 2009 participant contributions as
the discretionary matching program was suspended.
F-46
SUN
HEALTHCARE GROUP, INC. AND SUBSIDIARIES
NOTES
TO CONSOLIDATED FINANCIAL STATEMENTS (CONTINUED)
DECEMBER
31, 2009
(16)
Summarized Consolidating Information
In
connection with the Company's offering of the Notes in April 2007, certain
100% owned subsidiaries of the Company (the “Guarantors”) have, jointly and
severally, unconditionally guaranteed the Notes. These guarantees are
subordinated to all existing and future senior debt and senior guarantees of the
Guarantors and are unsecured.
The
Company conducts all of its business through and derives virtually all of its
income from its subsidiaries. Therefore, the Company's ability to make required
payments with respect to its indebtedness (including the Notes) and other
obligations depends on the financial results and condition of its subsidiaries
and its ability to receive funds from its subsidiaries.
Pursuant
to Rule 3-10 of Regulation S-X, the following summarized consolidating
information is provided for the Company (the “Parent”), the Guarantors, and the
Company's non-Guarantor subsidiaries with respect to the Notes. This summarized
financial information has been prepared from the books and records maintained by
the Company, the Guarantors and the non-Guarantor subsidiaries. The summarized
financial information may not necessarily be indicative of the results of
operations or financial position had the Guarantors or non-Guarantor
subsidiaries operated as independent entities. The separate financial statements
of the Guarantors are not presented because management has determined they would
not be material to investors. In addition, intercompany activities between
subsidiaries and the Parent are presented within operating activities on the
condensed consolidating statement of cash flows.
Condensed
consolidating financial statements for the Company and its subsidiaries,
including the Parent only, the combined Guarantor Subsidiaries and the combined
Non-Guarantor Subsidiaries are as follows:
F-47
SUN
HEALTHCARE GROUP, INC. AND SUBSIDIARIES
NOTES
TO CONSOLIDATED FINANCIAL STATEMENTS (CONTINUED)
DECEMBER
31, 2009
CONDENSED CONSOLIDATING BALANCE
SHEETS
As
of December 31, 2009
(in
thousands)
|
Combined
|
Combined
|
||||||||||||||
|
Parent
|
Guarantor
|
Non-Guarantor
|
|||||||||||||
|
Company
|
Subsidiaries
|
Subsidiaries
|
Elimination
|
Consolidated
|
|||||||||||
|
Current
assets:
|
|||||||||||||||
|
Cash and cash
equivalents
|
$
|
82,463
|
$
|
19,659
|
$
|
2,361
|
$
|
-
|
$
|
104,483
|
|||||
|
Restricted cash
|
15,419
|
5,288
|
3,327
|
-
|
24,034
|
||||||||||
|
Accounts receivable,
net
|
-
|
217,805
|
2,542
|
(28
|
)
|
220,319
|
|||||||||
|
Prepaid expenses and
other assets
|
9,493
|
13,383
|
608
|
(1,727
|
)
|
21,757
|
|||||||||
|
Deferred tax
assets
|
-
|
85,766
|
1,266
|
(18,617
|
)
|
68,415
|
|||||||||
|
Total current
assets
|
107,375
|
341,901
|
10,104
|
(20,372
|
)
|
439,008
|
|||||||||
|
Property and
equipment, net
|
9,195
|
546,772
|
66,715
|
-
|
622,682
|
||||||||||
|
Intangible assets,
net
|
32,702
|
16,897
|
2,336
|
1,996
|
53,931
|
||||||||||
|
Goodwill
|
-
|
334,338
|
3,958
|
-
|
338,296
|
||||||||||
|
Restricted cash,
non-current
|
2,972
|
345
|
-
|
-
|
3,317
|
||||||||||
|
Other assets
|
280
|
4,741
|
9
|
(69
|
)
|
4,961
|
|||||||||
|
Deferred tax
assets
|
15,393
|
123,963
|
-
|
(30,357
|
)
|
108,999
|
|||||||||
|
Intercompany
balances
|
307,307
|
-
|
7,925
|
(315,232
|
)
|
-
|
|||||||||
|
Investment in
subsidiaries
|
640,821
|
-
|
-
|
(640,821
|
)
|
-
|
|||||||||
|
Total assets
|
$
|
1,116,045
|
$
|
1,368,957
|
$
|
91,047
|
$
|
(1,004,855
|
)
|
$
|
1,571,194
|
||||
|
Current
liabilities:
|
|||||||||||||||
|
Accounts payable
|
$
|
10,883
|
$
|
45,130
|
$
|
1,124
|
$
|
(28
|
)
|
$
|
57,109
|
||||
|
Accrued
compensation and benefits
|
9,546
|
48,617
|
790
|
-
|
58,953
|
||||||||||
|
Accrued
self-insurance obligations, current
|
4,034
|
41,627
|
-
|
-
|
45,661
|
||||||||||
|
Other accrued
liabilities
|
11,275
|
41,272
|
2,718
|
-
|
55,265
|
||||||||||
|
Deferred tax
liability
|
9,843
|
-
|
-
|
(9,843
|
)
|
-
|
|||||||||
|
Current portion of
long-term debt
|
22,244
|
18,592
|
5,580
|
-
|
46,416
|
||||||||||
|
Total current
liabilities
|
67,825
|
195,238
|
10,212
|
(9,871
|
)
|
263,404
|
|||||||||
|
Accrued
self-insurance obligations, net of current
|
48,200
|
73,319
|
429
|
-
|
121,948
|
||||||||||
|
Deferred tax
liability
|
-
|
-
|
11,559
|
(11,559
|
)
|
-
|
|||||||||
|
Long-term debt, net
of current
|
507,394
|
87,916
|
58,822
|
-
|
654,132
|
||||||||||
|
Unfavorable lease
obligations, net
|
-
|
14,659
|
-
|
(1,996
|
)
|
12,663
|
|||||||||
|
Intercompany
balances
|
-
|
340,608
|
-
|
(340,608
|
)
|
-
|
|||||||||
|
Other long-term
liabilities
|
43,562
|
23,206
|
3,215
|
-
|
69,983
|
||||||||||
|
Total
liabilities
|
666,981
|
734,946
|
84,237
|
(364,034
|
)
|
1,122,130
|
|||||||||
|
Stockholders’
equity:
|
|||||||||||||||
|
Common stock
|
438
|
-
|
-
|
-
|
438
|
||||||||||
|
Additional paid-in
capital
|
655,667
|
-
|
-
|
-
|
655,667
|
||||||||||
|
Accumulated
deficit
|
(204,012
|
)
|
634,011
|
6,810
|
(640,821
|
)
|
(204,012
|
)
|
|||||||
|
Accumulated
other comprehensive loss
|
(3,029
|
)
|
-
|
-
|
-
|
(3,029
|
)
|
||||||||
|
Total stockholders'
equity
|
449,064
|
634,011
|
6,810
|
(640,821
|
)
|
449,064
|
|||||||||
|
Total
liabilities and stockholders' equity
|
$
|
1,116,045
|
$
|
1,368,957
|
$
|
91,047
|
$
|
(1,004,855
|
)
|
$
|
1,571,194
|
F-48
SUN
HEALTHCARE GROUP, INC. AND SUBSIDIARIES
NOTES
TO CONSOLIDATED FINANCIAL STATEMENTS (CONTINUED)
DECEMBER
31, 2009
CONDENSED CONSOLIDATING BALANCE
SHEETS
As
of December 31, 2008
(in
thousands)
|
Combined
|
Combined
|
||||||||||||||
|
Parent
|
Guarantor
|
Non-Guarantor
|
|||||||||||||
|
Company
|
Subsidiaries
|
Subsidiaries
|
Elimination
|
Consolidated
|
|||||||||||
|
Current
assets:
|
|||||||||||||||
|
Cash and cash
equivalents
|
$
|
72,529
|
$
|
17,952
|
$
|
1,672
|
$
|
-
|
$
|
92,153
|
|||||
|
Restricted cash
|
25,570
|
5,135
|
3,971
|
-
|
34,676
|
||||||||||
|
Accounts receivable,
net
|
-
|
201,390
|
4,251
|
(21
|
)
|
205,620
|
|||||||||
|
Prepaid expenses and
other assets
|
8,909
|
13,229
|
496
|
(1,178
|
)
|
21,456
|
|||||||||
|
Assets held for
sale
|
951
|
2,693
|
10
|
-
|
3,654
|
||||||||||
|
Deferred tax
assets
|
-
|
64,445
|
1,261
|
(8,445
|
)
|
57,261
|
|||||||||
|
Total current
assets
|
107,959
|
304,844
|
11,661
|
(9,644
|
)
|
414,820
|
|||||||||
|
Property and
equipment, net
|
7,877
|
527,413
|
68,355
|
-
|
603,645
|
||||||||||
|
Intangible assets,
net
|
37,202
|
12,681
|
4,505
|
-
|
54,388
|
||||||||||
|
Goodwill
|
-
|
323,062
|
3,746
|
-
|
326,808
|
||||||||||
|
Restricted cash,
non-current
|
2,963
|
340
|
-
|
-
|
3,303
|
||||||||||
|
Other assets
|
912
|
4,643
|
16
|
(8
|
)
|
5,563
|
|||||||||
|
Deferred tax
assets
|
15,140
|
132,718
|
-
|
(13,051
|
)
|
134,807
|
|||||||||
|
Intercompany
balances
|
372,179
|
-
|
3,730
|
(375,909
|
)
|
-
|
|||||||||
|
Investment in
subsidiaries
|
539,385
|
-
|
-
|
(539,385
|
)
|
-
|
|||||||||
|
Total assets
|
$
|
1,083,617
|
$
|
1,305,701
|
$
|
92,013
|
$
|
(937,997
|
)
|
$
|
1,543,334
|
||||
|
Current
liabilities:
|
|||||||||||||||
|
Accounts payable
|
$
|
14,630
|
$
|
46,107
|
$
|
1,284
|
$
|
(21
|
)
|
$
|
62,000
|
||||
|
Accrued
compensation and benefits
|
9,271
|
50,433
|
956
|
-
|
60,660
|
||||||||||
|
Accrued
self-insurance obligations, current
|
4,001
|
40,735
|
557
|
-
|
45,293
|
||||||||||
|
Other accrued
liabilities
|
14,741
|
42,585
|
709
|
(1,178
|
)
|
56,857
|
|||||||||
|
Deferred tax
liability
|
8,445
|
-
|
-
|
(8,445
|
)
|
-
|
|||||||||
|
Current portion of
long-term debt
|
10,255
|
6,394
|
1,216
|
-
|
17,865
|
||||||||||
|
Total current
liabilities
|
61,343
|
186,254
|
4,722
|
(9,644
|
)
|
242,675
|
|||||||||
|
Accrued
self-insurance obligations, net of current
|
43,159
|
70,969
|
429
|
-
|
114,557
|
||||||||||
|
Deferred tax
liability
|
-
|
-
|
13,051
|
(13,051
|
)
|
-
|
|||||||||
|
Long-term debt, net
of current
|
543,214
|
100,360
|
64,402
|
-
|
707,976
|
||||||||||
|
Unfavorable lease
obligations, net
|
-
|
15,514
|
-
|
-
|
15,514
|
||||||||||
|
Intercompany
balances
|
-
|
375,917
|
-
|
(375,917
|
)
|
-
|
|||||||||
|
Other long-term
liabilities
|
32,192
|
26,711
|
-
|
-
|
58,903
|
||||||||||
|
Total
liabilities
|
679,908
|
775,725
|
82,604
|
(398,612
|
)
|
1,139,625
|
|||||||||
|
Stockholders’
equity:
|
|||||||||||||||
|
Common stock
|
435
|
-
|
-
|
-
|
435
|
||||||||||
|
Additional paid-in
capital
|
650,543
|
-
|
-
|
-
|
650,543
|
||||||||||
|
Accumulated
deficit
|
(242,683
|
)
|
529,976
|
9,409
|
(539,385
|
)
|
(242,683
|
)
|
|||||||
|
Accumulated
other comprehensive loss
|
(4,586
|
)
|
-
|
-
|
-
|
(4,586
|
)
|
||||||||
|
Total stockholders'
equity
|
403,709
|
529,976
|
9,409
|
(539,385
|
)
|
403,709
|
|||||||||
|
Total
liabilities and stockholders' equity
|
$
|
1,083,617
|
$
|
1,305,701
|
$
|
92,013
|
$
|
(937,997
|
)
|
$
|
1,543,334
|
F-49
SUN
HEALTHCARE GROUP, INC. AND SUBSIDIARIES
NOTES
TO CONSOLIDATED FINANCIAL STATEMENTS (CONTINUED)
DECEMBER
31, 2009
CONDENSED CONSOLIDATING INCOME
STATEMENTS
For
the Year Ended December 31, 2009
(in
thousands)
|
Combined
|
Combined
|
||||||||||||||
|
Parent
|
Guarantor
|
Non-Guarantor
|
|||||||||||||
|
Company
|
Subsidiaries
|
Subsidiaries
|
Elimination
|
Consolidated
|
|||||||||||
|
Total
net revenues
|
$
|
34
|
$
|
1,927,595
|
$
|
30,266
|
$
|
(76,096
|
)
|
$
|
1,881,799
|
||||
|
Costs
and expenses:
|
|||||||||||||||
|
Operating
salaries and benefits
|
-
|
1,041,057
|
16,588
|
-
|
1,057,645
|
||||||||||
|
Self
insurance for workers’ compensation
|
|||||||||||||||
|
and
general and professional liability
|
|||||||||||||||
|
insurance
|
418
|
62,721
|
613
|
-
|
63,752
|
||||||||||
|
Other
operating costs
|
-
|
453,705
|
7,223
|
(76,096
|
)
|
384,832
|
|||||||||
|
Center
rent expense
|
-
|
72,392
|
757
|
-
|
73,149
|
||||||||||
|
General
and administrative expenses(1)
|
63,555
|
49,437
|
-
|
-
|
112,992
|
||||||||||
|
Depreciation
and amortization
|
2,808
|
40,304
|
2,351
|
-
|
45,463
|
||||||||||
|
Provision
for losses on accounts receivable
|
-
|
20,681
|
516
|
-
|
21,197
|
||||||||||
|
Interest,
net
|
36,571
|
8,286
|
4,470
|
-
|
49,327
|
||||||||||
|
Loss
(gain) on sale of assets, net
|
-
|
49
|
(7
|
)
|
-
|
42
|
|||||||||
|
Restructuring
costs, net
|
1,161
|
143
|
-
|
-
|
1,304
|
||||||||||
|
Income
from investment in subsidiaries
|
(101,436
|
)
|
-
|
-
|
101,436
|
-
|
|||||||||
|
Total
costs and expenses
|
3,077
|
1,748,775
|
32,511
|
25,340
|
1,809,703
|
||||||||||
|
(Loss)
income before income taxes and
|
|||||||||||||||
|
discontinued
operations
|
(3,043
|
)
|
178,820
|
(2,245
|
)
|
(101,436
|
)
|
72,096
|
|||||||
|
Income
tax (benefit) expense
|
(42,780
|
)
|
73,316
|
(920
|
)
|
-
|
|
29,616
|
|||||||
|
Income
from continuing operations
|
39,737
|
105,504
|
(1,325
|
)
|
(101,436
|
)
|
42,480
|
||||||||
|
Discontinued
operations:
|
|||||||||||||||
|
Loss
from discontinued
|
|||||||||||||||
|
operations,
net
|
(1,066
|
)
|
(905
|
)
|
(1,505
|
)
|
-
|
(3,476
|
)
|
||||||
|
(Loss)
gain on disposal of discontinued
|
|||||||||||||||
|
operations,
net
|
-
|
(564
|
)
|
231
|
-
|
(333
|
)
|
||||||||
|
Loss
on discontinued operations, net
|
(1,066
|
)
|
(1,469
|
)
|
(1,274
|
)
|
-
|
(3,809
|
)
|
||||||
|
Net
income
|
$
|
38,671
|
$
|
104,035
|
$
|
(2,599
|
)
|
$
|
(101,436
|
)
|
$
|
38,671
|
|||
(1)
Includes operating administrative expenses
F-50
SUN
HEALTHCARE GROUP, INC. AND SUBSIDIARIES
NOTES
TO CONSOLIDATED FINANCIAL STATEMENTS (CONTINUED)
DECEMBER
31, 2009
CONDENSED CONSOLIDATING INCOME
STATEMENTS
For
the Year Ended December 31, 2008
(in
thousands)
|
Combined
|
Combined
|
||||||||||||||
|
Parent
|
Guarantor
|
Non-Guarantor
|
|||||||||||||
|
Company
|
Subsidiaries
|
Subsidiaries
|
Elimination
|
Consolidated
|
|||||||||||
|
Total
net revenues
|
$
|
37
|
$
|
1,856,726
|
$
|
30,218
|
$
|
(63,478
|
)
|
$
|
1,823,503
|
||||
|
Costs
and expenses:
|
|||||||||||||||
|
Operating
salaries and
benefits
|
-
|
1,015,839
|
13,148
|
-
|
1,028,987
|
||||||||||
|
Self
insurance for workers’ compensation
|
|||||||||||||||
|
and
general and professional liability
|
|||||||||||||||
|
insurance
|
557
|
58,504
|
633
|
-
|
59,694
|
||||||||||
|
Other
operating costs
|
2
|
430,171
|
6,389
|
(63,478
|
)
|
373,084
|
|||||||||
|
Center
rent expense
|
-
|
72,914
|
687
|
-
|
73,601
|
||||||||||
|
General
and administrative expenses(1)
|
61,780
|
51,693
|
-
|
-
|
113,473
|
||||||||||
|
Depreciation
and amortization
|
3,058
|
35,035
|
2,261
|
-
|
40,354
|
||||||||||
|
Provision
for losses on accounts receivable
|
-
|
13,719
|
388
|
-
|
14,107
|
||||||||||
|
Interest,
net
|
40,954
|
8,770
|
4,879
|
-
|
54,603
|
||||||||||
|
(Gain)
loss on sale of assets, net
|
(976
|
)
|
-
|
-
|
-
|
(976
|
)
|
||||||||
|
Income
from investment in subsidiaries
|
(289,483
|
)
|
-
|
-
|
289,483
|
-
|
|||||||||
|
Total
costs and
expenses
|
(184,107
|
)
|
1,686,645
|
28,385
|
226,005
|
1,756,927
|
|||||||||
|
Income
before income taxes and
|
|||||||||||||||
|
discontinued
operations
|
184,145
|
170,081
|
1,833
|
(289,483
|
)
|
66,576
|
|||||||||
|
Income
tax expense (benefit)
|
74,858
|
(120,903
|
)
|
(1,303
|
)
|
-
|
(47,348
|
)
|
|||||||
|
Income
from continuing operations
|
109,287
|
290,984
|
3,136
|
(289,483
|
)
|
113,924
|
|||||||||
|
Discontinued
operations:
|
|||||||||||||||
|
(Loss)
income from discontinued
|
|||||||||||||||
|
operations,
net
|
-
|
(2,575
|
)
|
939
|
-
|
(1,636
|
)
|
||||||||
|
(Loss)
gain on disposal of discontinued
|
|||||||||||||||
|
operations,
net
|
-
|
(4,896
|
)
|
1,895
|
-
|
(3,001
|
)
|
||||||||
|
(Loss)
income on discontinued operations, net
|
-
|
(7,471
|
)
|
2,834
|
-
|
(4,637
|
)
|
||||||||
|
Net
income
|
$
|
109,287
|
$
|
283,513
|
$
|
5,970
|
$
|
(289,483
|
)
|
$
|
109,287
|
(1)
Includes operating administrative expenses
F-51
SUN
HEALTHCARE GROUP, INC. AND SUBSIDIARIES
NOTES
TO CONSOLIDATED FINANCIAL STATEMENTS (CONTINUED)
DECEMBER
31, 2009
CONDENSED CONSOLIDATING INCOME
STATEMENTS
For
the Year Ended December 31, 2007
(in
thousands)
|
Combined
|
Combined
|
||||||||||||||
|
Parent
|
Guarantor
|
Non-Guarantor | |||||||||||||
|
Company
|
Subsidiaries
|
Subsidiaries
|
Elimination
|
Consolidated
|
|||||||||||
|
Total
net revenues
|
$
|
78
|
$
|
1,587,609
|
$
|
18,076
|
$
|
(48,007
|
)
|
$
|
1,557,756
|
||||
|
Costs
and expenses:
|
|||||||||||||||
|
Operating
salaries and benefits
|
-
|
879,017
|
9,085
|
-
|
888,102
|
||||||||||
|
Self
insurance for workers’ compensation
|
|||||||||||||||
|
and
general and professional liability
|
|||||||||||||||
|
insurance
|
470
|
43,567
|
487
|
-
|
44,524
|
||||||||||
|
Other
operating costs
|
-
|
363,142
|
3,893
|
(48,025
|
)
|
319,010
|
|||||||||
|
Center
rent expense
|
-
|
72,539
|
(2,127
|
)
|
-
|
70,412
|
|||||||||
|
General
and administrative expenses(1)
|
65,991
|
38,777
|
17
|
-
|
104,785
|
||||||||||
|
Depreciation
and amortization
|
3,947
|
25,214
|
2,057
|
-
|
31,218
|
||||||||||
|
Provision
for losses on accounts receivable
|
-
|
8,676
|
306
|
-
|
8,982
|
||||||||||
|
Interest,
net
|
32,170
|
7,761
|
4,416
|
-
|
44,347
|
||||||||||
|
Loss
on extinguishment of debt
|
3,173
|
-
|
-
|
-
|
3,173
|
||||||||||
|
Loss
on sale of assets, net
|
-
|
24
|
-
|
-
|
24
|
||||||||||
|
Income
from investment in subsidiaries
|
(150,890
|
)
|
-
|
-
|
150,890
|
-
|
|||||||||
|
Total
costs and expenses
|
(45,139
|
)
|
1,438,717
|
18,134
|
102,865
|
1,514,577
|
|||||||||
|
Income
(loss) before income taxes and
|
|||||||||||||||
|
discontinued
operations
|
45,217
|
148,892
|
(58
|
)
|
(150,872
|
)
|
43,179
|
||||||||
|
Income
tax benefit
|
(11,458
|
)
|
-
|
-
|
544
|
(10,914
|
)
|
||||||||
|
Income
(loss) from continuing operations
|
56,675
|
148,892
|
(58
|
)
|
(151,416
|
)
|
54,093
|
||||||||
|
Discontinued
operations:
|
|||||||||||||||
|
Income
from discontinued
|
|||||||||||||||
|
operations,
net
|
1,035
|
2,012
|
1,079
|
(509
|
)
|
3,617
|
|||||||||
|
(Loss)
gain on disposal of discontinued
|
|||||||||||||||
|
operations,
net
|
(200
|
)
|
(1,669
|
)
|
1,467
|
202
|
(200
|
)
|
|||||||
|
Income
(loss) on discontinued operations, net
|
835
|
343
|
2,546
|
(307
|
)
|
3,417
|
|||||||||
|
Net
income
|
$
|
57,510
|
$
|
149,235
|
$
|
2,488
|
$
|
(151,723
|
)
|
$
|
57,510
|
||||
(1)
Includes operating administrative expenses
F-52
SUN
HEALTHCARE GROUP, INC. AND SUBSIDIARIES
NOTES
TO CONSOLIDATED FINANCIAL STATEMENTS (CONTINUED)
DECEMBER
31, 2009
CONDENSED
CONSOLIDATING STATEMENTS OF CASH FLOWS
For
the Year Ended December 31, 2009
(in
thousands)
|
Combined
|
Combined
|
||||||||||||||
|
Parent
|
Guarantor
|
Non-Guarantor | |||||||||||||
|
Company
|
Subsidiaries
|
Subsidiaries
|
Elimination
|
Consolidated
|
|||||||||||
|
Net
cash provided by operating activities
|
$
|
30,334
|
$
|
71,832
|
$
|
6,742
|
$
|
-
|
$
|
108,908
|
|||||
|
Cash
flows from investing activities:
|
|||||||||||||||
|
Capital
expenditures
|
(3,167
|
)
|
(50,708
|
)
|
(437
|
)
|
-
|
(54,312
|
)
|
||||||
|
Purchase
of lease real estate
|
-
|
(3,275
|
)
|
-
|
-
|
(3,275
|
)
|
||||||||
|
Proceeds
from sale of assets held for sale
|
-
|
2,174
|
-
|
-
|
2,174
|
||||||||||
|
Acquisitions
|
-
|
(14,936
|
)
|
-
|
-
|
(14,936
|
)
|
||||||||
|
Net
cash used for investing activities
|
(3,167
|
)
|
(66,745
|
)
|
(437
|
)
|
-
|
(70,349
|
)
|
||||||
|
Cash
flows from financing activities:
|
|||||||||||||||
|
Borrowings
of long-term debt
|
-
|
20,822
|
-
|
-
|
20,822
|
||||||||||
|
Principal
repayments of long-term debt and capital
lease obligations |
(17,334
|
)
|
(24,202
|
)
|
(4,756
|
)
|
-
|
(46,292
|
)
|
||||||
|
Payment
to non-controlling interest
|
-
|
-
|
(311
|
)
|
-
|
(311
|
)
|
||||||||
|
Distribution
to non-controlling interest
|
-
|
-
|
(549
|
)
|
-
|
(549
|
)
|
||||||||
|
Proceeds
from issuance of common stock
|
101
|
-
|
-
|
-
|
101
|
||||||||||
|
Net
cash used for financing activities
|
(17,233
|
)
|
(3,380
|
)
|
(5,616
|
)
|
-
|
(26,229
|
)
|
||||||
|
Net
(decrease) increase in cash and cash equivalents
|
9,934
|
1,707
|
689
|
-
|
12,330
|
||||||||||
|
Cash
and cash equivalents at beginning of period
|
72,529
|
17,952
|
1,672
|
-
|
92,153
|
||||||||||
|
Cash
and cash equivalents at end of period
|
$
|
82,463
|
$
|
19,659
|
$
|
2,361
|
$
|
-
|
$
|
104,483
|
|||||
F-53
SUN
HEALTHCARE GROUP, INC. AND SUBSIDIARIES
NOTES
TO CONSOLIDATED FINANCIAL STATEMENTS (CONTINUED)
DECEMBER
31, 2009
CONDENSED
CONSOLIDATING STATEMENTS OF CASH FLOWS
For
the Year Ended December 31, 2008
(in
thousands)
|
Combined
|
Combined
|
||||||||||||||
|
Parent
|
Guarantor
|
Non-Guarantor | |||||||||||||
|
Company
|
Subsidiaries
|
Subsidiaries
|
Elimination
|
Consolidated
|
|||||||||||
|
Net
cash provided by operating activities
|
$
|
44,955
|
$
|
37,135
|
$
|
6,097
|
$
|
-
|
$
|
88,187
|
|||||
|
Cash
flows from investing activities:
|
|||||||||||||||
|
Capital
expenditures
|
(1,960
|
)
|
(40,304
|
)
|
(279
|
)
|
-
|
(42,543
|
)
|
||||||
|
Purchase
of leased real estate
|
-
|
(8,956
|
)
|
-
|
-
|
(8,956
|
)
|
||||||||
|
Proceeds
from sale of assets held for sale
|
-
|
18,354
|
-
|
-
|
18,354
|
||||||||||
|
Acquisitions
|
-
|
(7,633
|
)
|
(4,101
|
)
|
-
|
(11,734
|
)
|
|||||||
|
Insurance
proceeds received
|
628
|
-
|
-
|
-
|
628
|
||||||||||
|
Net
cash used for investing activities
|
(1,332
|
)
|
(38,539
|
)
|
(4,380
|
)
|
-
|
(44,251
|
)
|
||||||
|
Cash
flows from financing activities:
|
|||||||||||||||
|
Borrowings
of long-term debt
|
-
|
20,290
|
-
|
-
|
20,290
|
||||||||||
|
Principal
repayments of long-term debt and capital
lease obligations
|
(3,808
|
)
|
(24,481
|
)
|
(1,338
|
)
|
-
|
(29,627
|
)
|
||||||
|
Payment
to non-controlling interest
|
-
|
-
|
(418
|
)
|
-
|
(418
|
)
|
||||||||
|
Distribution
to non-controlling interest
|
-
|
-
|
(353
|
)
|
-
|
(353
|
)
|
||||||||
|
Proceeds
from issuance of common stock
|
2,493
|
-
|
-
|
-
|
2,493
|
||||||||||
|
Net
cash used for financing activities
|
(1,315
|
)
|
(4,191
|
)
|
(2,109
|
)
|
-
|
(7,615
|
)
|
||||||
|
Net
(decrease) increase in cash and cash equivalents
|
42,308
|
(5,595
|
)
|
(392
|
)
|
-
|
36,321
|
||||||||
|
Cash
and cash equivalents at beginning of period
|
30,221
|
23,547
|
2,064
|
-
|
55,832
|
||||||||||
|
Cash
and cash equivalents at end of period
|
$
|
72,529
|
$
|
17,952
|
$
|
1,672
|
$
|
-
|
$
|
92,153
|
|||||
F-54
SUN
HEALTHCARE GROUP, INC. AND SUBSIDIARIES
NOTES
TO CONSOLIDATED FINANCIAL STATEMENTS (CONTINUED)
DECEMBER
31, 2009
CONDENSED
CONSOLIDATING STATEMENTS OF CASH FLOWS
For
the Year Ended December 31, 2007
(in
thousands)
|
Combined
|
Combined
|
||||||||||||||
|
Parent
|
Guarantor
|
Non-Guarantor | |||||||||||||
|
Company
|
Subsidiaries
|
Subsidiaries
|
Elimination
|
Consolidated
|
|||||||||||
|
Net
cash (used for) provided by operating activities
|
$
|
(34,392
|
)
|
$
|
122,199
|
$
|
(3,970
|
)
|
$
|
-
|
$
|
83,837
|
|||
|
Cash
flows from investing activities:
|
|||||||||||||||
|
Capital
expenditures
|
(3,642
|
)
|
(29,368
|
)
|
(440
|
)
|
-
|
(33,450
|
)
|
||||||
|
Purchase
of lease real estate
|
7,487
|
(63,949
|
)
|
-
|
-
|
(56,462
|
)
|
||||||||
|
Proceeds
from sale of assets held for sale
|
3,851
|
3,238
|
500
|
-
|
7,589
|
||||||||||
|
Acquisitions
|
(367,757
|
)
|
(697
|
)
|
-
|
-
|
(368,454
|
)
|
|||||||
|
Net
cash (used for) provided by investing activities
|
(360,061
|
)
|
(90,776
|
)
|
60
|
-
|
(450,777
|
)
|
|||||||
|
Cash
flows from financing activities:
|
|||||||||||||||
|
Net
repayments under Credit Agreement
|
(9,994
|
)
|
-
|
-
|
-
|
(9,994
|
)
|
||||||||
|
Borrowings
of long-term debt
|
324,142
|
10,404
|
12,454
|
-
|
347,000
|
||||||||||
|
Principal
repayments of long-term debt and capital
lease
obligations
|
(18,338
|
)
|
(29,560
|
)
|
(6,611
|
)
|
-
|
(54,509
|
)
|
||||||
|
Payment
to non-controlling interest
|
-
|
-
|
(657
|
)
|
-
|
(657
|
)
|
||||||||
|
Distribution
to non-controlling interest
|
-
|
(57
|
)
|
-
|
-
|
(57
|
)
|
||||||||
|
Proceeds
from issuance of common stock
|
1,459
|
-
|
-
|
-
|
1,459
|
||||||||||
|
Deferred
financing costs
|
(18,045
|
)
|
-
|
-
|
-
|
(18,045
|
)
|
||||||||
|
Release
of third party collateral
|
25,640
|
-
|
-
|
-
|
25,640
|
||||||||||
|
Net
cash provided by (used for) financing activities
|
304,864
|
(19,213
|
)
|
5,186
|
-
|
290,837
|
|||||||||
|
Net
(decrease) increase in cash and cash equivalents
|
(89,589
|
)
|
12,210
|
1,276
|
-
|
(76,103
|
)
|
||||||||
|
Cash
and cash equivalents at beginning of period
|
119,810
|
11,337
|
788
|
-
|
131,935
|
||||||||||
|
Cash
and cash equivalents at end of period
|
$
|
30,221
|
$
|
23,547
|
$
|
2,064
|
$
|
-
|
$
|
55,832
|
|||||
F-55
SUN
HEALTHCARE GROUP, INC. AND SUBSIDIARIES
SUPPLEMENTARY
DATA (UNAUDITED)
QUARTERLY
FINANCIAL DATA
The
following tables reflect unaudited quarterly financial data for fiscal years
2009 and 2008 (in thousands, except per share data):
|
For
the Year Ended
|
|||||||||||||||
|
December
31, 2009 (1)
|
|||||||||||||||
|
Fourth
|
Third
|
Second
|
First
|
||||||||||||
|
Quarter
|
Quarter
|
Quarter
|
Quarter
|
Total
|
|||||||||||
|
Total
net revenues
|
$
|
474,064
|
$
|
470,893
|
$
|
468,713
|
$
|
468,129
|
$
|
1,881,799
|
|||||
|
Income
from continuing operations
|
$
|
9,678
|
$
|
10,389
|
$
|
10,811
|
$
|
11,602
|
$
|
42,480
|
|||||
|
Loss
from discontinued operations
|
$
|
(1,003
|
)
|
$
|
(731
|
)
|
$
|
(715
|
)
|
$
|
(1,359
|
)
|
$
|
(3,809
|
)
|
|
Net
income
|
$
|
8,675
|
$
|
9,658
|
$
|
10,096
|
$
|
10,243
|
$
|
38,671
|
|||||
|
Basic
earnings per common and
|
|||||||||||||||
|
common
equivalent share:
|
|||||||||||||||
|
Income
from continuing operations
|
$
|
0.22
|
$
|
0.24
|
$
|
0.25
|
$
|
0.27
|
$
|
0.97
|
|||||
|
Loss
from discontinued operations
|
(0.02
|
)
|
(0.02
|
)
|
(0.02
|
)
|
(0.04
|
)
|
(0.09
|
)
|
|||||
|
Net
income
|
$
|
0.20
|
$
|
0.22
|
$
|
0.23
|
$
|
0.23
|
$
|
0.88
|
|||||
|
Diluted
earnings per common and
|
|||||||||||||||
|
common
equivalent share:
|
|||||||||||||||
|
Income
from continuing operations
|
$
|
0.22
|
$
|
0.24
|
$
|
0.25
|
$
|
0.26
|
$
|
0.97
|
|||||
|
Loss
from discontinued operations
|
(0.02
|
)
|
(0.02
|
)
|
(0.02
|
)
|
(0.03
|
)
|
(0.09
|
)
|
|||||
|
Net
income
|
$
|
0.20
|
$
|
0.22
|
$
|
0.23
|
$
|
0.23
|
$
|
0.88
|
|||||
|
Weighted
average number of
|
|||||||||||||||
|
common
and common equivalent
|
|||||||||||||||
|
shares
outstanding:
|
|||||||||||||||
|
Basic
|
43,944
|
43,923
|
43,851
|
43,643
|
43,841
|
||||||||||
|
Diluted
|
44,602
|
44,015
|
43,960
|
43,872
|
43,963
|
||||||||||
1
|
For
the Year Ended
|
|||||||||||||||
|
December
31, 2008 (1)(2)
|
|||||||||||||||
|
Fourth
|
Third
|
Second
|
First
|
||||||||||||
|
Quarter
|
Quarter
|
Quarter
|
Quarter
|
Total
|
|||||||||||
|
Total
net revenues
|
$
|
466,796
|
$
|
455,757
|
$
|
450,756
|
$
|
450,194
|
$
|
1,823,503
|
|||||
|
Income
from continuing operations (3)
|
$
|
83,826
|
$
|
9,421
|
$
|
12,602
|
$
|
8,075
|
$
|
113,924
|
|||||
|
(Loss)
income from discontinued operations
|
$
|
(1,405
|
)
|
$
|
(817
|
)
|
$
|
(2,917
|
)
|
$
|
502
|
$
|
(4,637
|
)
|
|
|
Net
income
|
$
|
82,421
|
$
|
8,604
|
$
|
9,685
|
$
|
8,577
|
$
|
109,287
|
|||||
|
Basic
earnings per common and
|
|||||||||||||||
|
common
equivalent share:
|
|||||||||||||||
|
Income
from continuing operations
|
$
|
1.92
|
$
|
0.22
|
$
|
0.29
|
$
|
0.19
|
$
|
2.63
|
|||||
|
(Loss)
income from discontinued operations
|
(0.03
|
)
|
(0.02
|
)
|
(0.07
|
)
|
0.01
|
(0.11
|
)
|
||||||
|
Net
income
|
$
|
1.89
|
$
|
0.20
|
$
|
0.22
|
$
|
0.20
|
$
|
2.52
|
|||||
|
Diluted
earnings per common and
|
|||||||||||||||
|
common
equivalent share:
|
|||||||||||||||
|
Income
from continuing operations
|
$
|
1.91
|
$
|
0.21
|
$
|
0.29
|
$
|
0.18
|
$
|
2.59
|
|||||
|
(Loss)
income from discontinued operations
|
(0.03
|
)
|
(0.02
|
)
|
(0.07
|
)
|
0.01
|
(0.10
|
)
|
||||||
|
Net
income
|
$
|
1.88
|
$
|
0.19
|
$
|
0.22
|
$
|
0.19
|
$
|
2.49
|
|||||
|
Weighted
average number of
|
|||||||||||||||
|
common
and common equivalent
|
|||||||||||||||
|
shares
outstanding:
|
|||||||||||||||
|
Basic
|
43,602
|
43,468
|
43,188
|
43,067
|
43,331
|
||||||||||
|
Diluted
|
43,873
|
44,478
|
43,928
|
44,474
|
43,963
|
||||||||||
|
(1)
|
We
have reclassified all activity related to entities whose operations were
divested or identified for disposal for the years ended December 31, 2009
and 2008 to discontinued operations. Therefore, the quarterly
financial data presented above including revenues, income (loss) before
income taxes and discontinued operations and income (loss) on discontinued
operations will not reflect the amounts reported previously in our
Quarterly Reports on Form 10-Q filed with the SEC. However, net
income remains the same.
|
|
(2)
|
Results
for the year ended December 31, 2008 include a full year of revenues and
expenses of Harborside, which was acquired on April 1, 2007 (see Note 6 –
“Acquisitions”), a release of $70.5 million of deferred tax valuation
allowance, an increase of $0.9 million of self-insurance reserves for
general and professional liability and workers’ compensation related to
prior years’ continuing operations, and a gain of $0.9 million related to
the sale of non-core business assets.
|
|
(3)
|
In
2008, we recorded a benefit of $70.5 million in the fourth quarter from
the release of a portion of the valuation allowance on our net deferred
tax assets (see Note 10 – “Income Taxes”). Additionally, we
recorded a net gain on the sale of assets in the 2008 fourth quarter of
$0.9 million.
|
2
SUN
HEALTHCARE GROUP, INC. AND SUBSIDIARIES
SUPPLEMENTARY
DATA (UNAUDITED)
INSURANCE
RESERVES
Activity
in our insurance reserves as of and for the three months ending December 31,
2009 and 2008 is as follows (in thousands):
|
Professional
Liability
|
Workers’
Compensation
|
Total
|
|||||||
|
Balance
as of September 30, 2008
|
$
|
81,980
|
$
|
63,763
|
$
|
145,743
|
|||
|
Current
year provision, continuing operations
|
7,607
|
7,554
|
15,161
|
||||||
|
Current
year provision, discontinued operations
|
45
|
13
|
58
|
||||||
|
Prior
year reserve adjustments, continuing operations
|
3,550
|
-
|
3,550
|
||||||
|
Prior
year reserve adjustments, discontinued operations
|
750
|
-
|
750
|
||||||
|
Claims
paid, continuing operations
|
(5,816
|
)
|
(3,213
|
)
|
(9,029
|
)
|
|||
|
Claims
paid, discontinued operations
|
(659
|
)
|
(932
|
)
|
(1,591
|
)
|
|||
|
Amounts
paid for administrative services and other
|
(175
|
)
|
(597
|
)
|
(772
|
)
|
|||
|
Balance
as of December 31, 2008
|
$
|
87,282
|
$
|
66,588
|
$
|
153,870
|
|||
|
Balance
as of September 30, 2009
|
$
|
90,007
|
$
|
65,554
|
$
|
155,561
|
|||
|
Current
year provision, continuing operations
|
6,942
|
7,263
|
14,205
|
||||||
|
Current
year provision, discontinued operations
|
434
|
158
|
592
|
||||||
|
Prior
year reserve adjustments, continuing operations
|
2,200
|
1,720
|
3,920
|
||||||
|
Prior
year reserve adjustments, discontinued operations
|
300
|
230
|
530
|
||||||
|
Claims
paid, continuing operations
|
(4,045
|
)
|
(4,901
|
)
|
(8,946
|
)
|
|||
|
Claims
paid, discontinued operations
|
(635
|
)
|
(680
|
)
|
(1,315
|
)
|
|||
|
Amounts
paid for administrative services and other
|
(273
|
)
|
(1,838
|
)
|
(2,111
|
)
|
|||
|
Balance
as of December 31, 2009
|
$
|
94,930
|
$
|
67,506
|
$
|
162,436
|
3
SCHEDULE
II
SUN
HEALTHCARE GROUP, INC. AND SUBSIDIARIES
VALUATION
AND QUALIFYING ACCOUNTS
(in
thousands)
|
Column
A
|
Column
B
|
Column
C
|
Column
D
|
Column
E
|
|||||||||||
|
Balance
at
|
Charged
to
|
Additions
|
Balance
at
|
||||||||||||
|
Beginning
|
Costs
and
|
Charged
to
|
Deductions
|
End
of
|
|||||||||||
|
Description
|
of
Period
|
Expenses(1)
|
Other
Accounts(2)
|
Other(3)
|
Period
|
||||||||||
|
Year
ended December 31, 2009
|
|||||||||||||||
|
Allowance for doubtful accounts
|
$
|
44,830
|
$
|
21,196
|
$
|
214
|
$
|
(10,838
|
)
|
$
|
55,402
|
||||
|
Other receivables reserve (4)
|
$
|
1,077
|
$
|
105
|
$
|
-
|
$
|
-
|
$
|
1,182
|
|||||
|
Allowance for deferred tax assets
|
$
|
34,321
|
$
|
-
|
$
|
-
|
$
|
(6,749
|
)
|
$
|
27,572
|
||||
|
Year
ended December 31, 2008
|
|||||||||||||||
|
Allowance for doubtful accounts
|
$
|
42,144
|
$
|
15,283
|
$
|
180
|
$
|
(12,777
|
)
|
$
|
44,830
|
||||
|
Other receivables reserve (4)
|
$
|
1,587
|
$
|
-
|
$
|
-
|
$
|
(510
|
)
|
$
|
1,077
|
||||
|
Allowance for deferred tax assets
|
$
|
132,905
|
$
|
-
|
$
|
13,945
|
$
|
(112,529
|
)
|
$
|
34,321
|
||||
|
Year
ended December 31, 2007
|
|||||||||||||||
|
Allowance for doubtful accounts
|
$
|
24,866
|
$
|
10,345
|
$
|
19,011
|
$
|
(12,078
|
)
|
$
|
42,144
|
||||
|
Other receivables reserve (4)
|
$
|
3,064
|
$
|
273
|
$
|
-
|
$
|
(1,750
|
)
|
$
|
1,587
|
||||
|
Allowance for deferred tax assets
|
$
|
185,473
|
$
|
-
|
$
|
22,750
|
$
|
(75,318
|
)
|
$
|
132,905
|
|
(1)
|
Charges
included in (adjustment) provision for losses on accounts receivable of
$(1), $1,176, and $1,363 for the years ended December 31, 2009, 2008, and
2007, respectively, related to discontinued operations. The
year ended December 31, 2007 also included a recovery of $2.3 million as a
result of an indemnification claim relating to a 2005
acquisition.
|
|
(2)
|
Column
C primarily represents increases that resulted from acquisition activity
(see Note 6 – “Acquisitions”).
|
|
(3)
|
Column
D primarily represents write offs and recoveries of receivables that have
been fully reserved or releases of valuation allowance on deferred tax
assets (see Note 10 – “Income Taxes”).
|
|
(4)
|
The
other receivables reserve is classified in prepaid and other assets on our
consolidated balance sheets. Other receivables, net of
reserves, were $4,943, $5,599, and $1,635 as of December 31, 2009, 2008
and 2007, respectively.
|
4