Attached files
| file | filename |
|---|---|
| 8-K - FORM 8-K - ZIONS BANCORPORATION, NATIONAL ASSOCIATION /UT/ | form8_k.htm |

1
25 May 2010
SunTrust Robinson Humphrey
Financial Services Unconference
Financial Services Unconference

2
Forward-Looking Statements
This presentation contains statements that relate to the projected performance of Zions Bancorporation
and elements of or affecting such performance, including statements with respect to the beliefs, plans,
objectives, goals, guidelines, expectations, anticipations and estimates of management. These
statements constitute forward-looking information within the meaning of the Private Securities Litigation
Reform Act. Actual facts, determinations, results or achievements may differ materially from the
statements provided in this presentation since such statements involve significant known and unknown
risks and uncertainties. Factors that might cause such differences include, but are not limited to:
competitive pressures among financial institutions; economic, market and business conditions, either
nationally or locally in areas in which Zions Bancorporation conducts its operations, being less
favorable than expected; changes in the interest rate environment reducing expected interest margins;
changes in debt, equity and securities markets; adverse legislation or regulatory changes; and other
factors described in Zions Bancorporation’s most recent annual and quarterly reports. In addition, the
statements contained in this presentation are based on facts and circumstances as understood by
management of the company on the date of this presentation, which may change in the future. Zions
Bancorporation disclaims any obligation to update any statements or to publicly announce the result of
any revisions to any of the forward-looking statements included herein to reflect future events,
developments, determinations or understandings.

3
Agenda
|
Capital
Overview of Zions
Key Performance Drivers
–Revenue
–Credit Quality
–Term CRE
–Securities Portfolio
Outlook Summary
|
|
|

4
Zions’ Recent Capital Announcement
• On May 19, Zions announced a series of capital
actions expected to create $600 million of Tier 1
capital
actions expected to create $600 million of Tier 1
capital
– Warrants:
• As announced: $150 million + $10 million greenshoe
• As completed: $175 million (additional $10 million greenshoe option expires June 18, 2010)
– No EPS dilution until Zions’ stock price reaches strike price of $36.63; gradual increase in
sharecount thereafter, based on price of common stock (i.e. net share settlement / treasury
method)
sharecount thereafter, based on price of common stock (i.e. net share settlement / treasury
method)
– Issued 21.1 million warrants (excluding greenshoe)
– Breakeven dilution to EPS occurs at a ZION stock price of $55.50
– Matures May 2020
– Common Equity Distribution Program: $300 million
– Additional $150 million of Tier 1 capital
• Capital actions expected to increase Tier 1 ratio by
approximately 120 basis points
approximately 120 basis points
• Actions expected to be accretive to tangible common equity
per common share today ($19.89 at 3/31/10)
per common share today ($19.89 at 3/31/10)

5
Pro Forma Capital Ratios
|
|
1Q09
|
1Q10
|
Pro Forma
For Sub Debt Conversion |
Pro Forma Equity Distribution, Warrants, $150mm other Tier 1 |
|
Tangible Common Equity (TCE)
|
5.26%
|
6.30%
|
6.23%
|
7.05%
|
|
Tier 1 Common
|
5.73%
|
7.14%
|
7.02%
|
7.94%
|
|
Tier 1 Risk Based
|
9.43%
|
11.19%
|
11.35%
|
12.58%
|
|
Total Risk Based
|
13.39%
|
13.93%
|
13.97%
|
15.20%
|
Note: Capital ratios pro forma for sub debt conversion include conversion of $116.6 million face value of convertible subordinated debt which elected to convert
into preferred equity, effective May 17, 2010, as detailed on Form 8-K filed with the SEC on May 18, 2010.
into preferred equity, effective May 17, 2010, as detailed on Form 8-K filed with the SEC on May 18, 2010.
Capital ratios pro forma for equity distribution, warrants and $150 million other Tier 1 assume a combined $450 million is raised via equity distribution
program and warrants, and an additional $150 million of capital that qualifies for Tier 1 regulatory capital treatment
program and warrants, and an additional $150 million of capital that qualifies for Tier 1 regulatory capital treatment
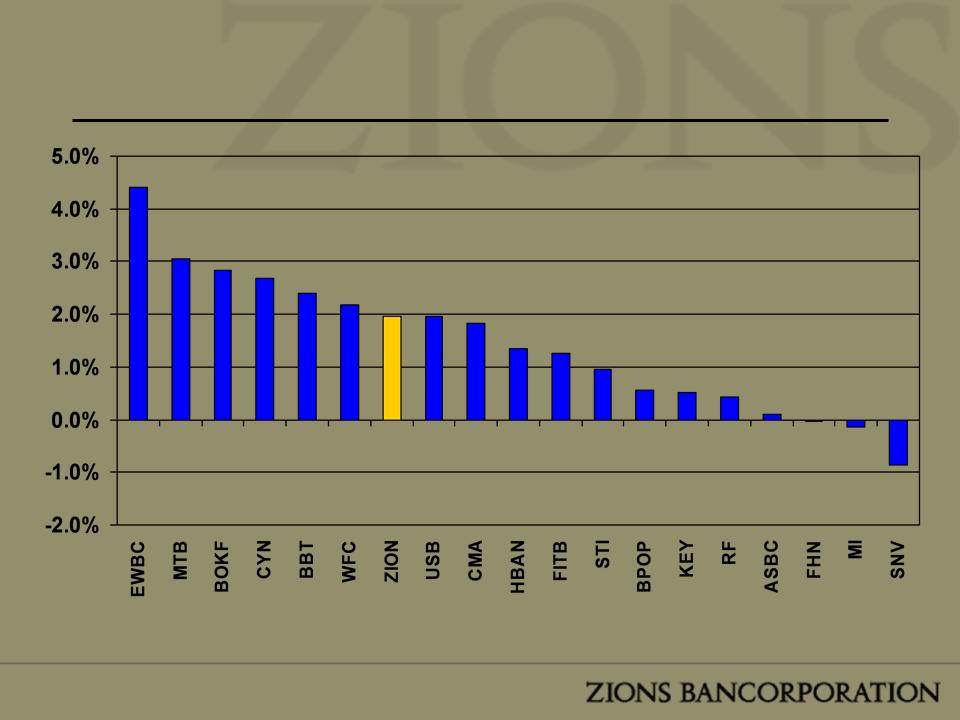
6
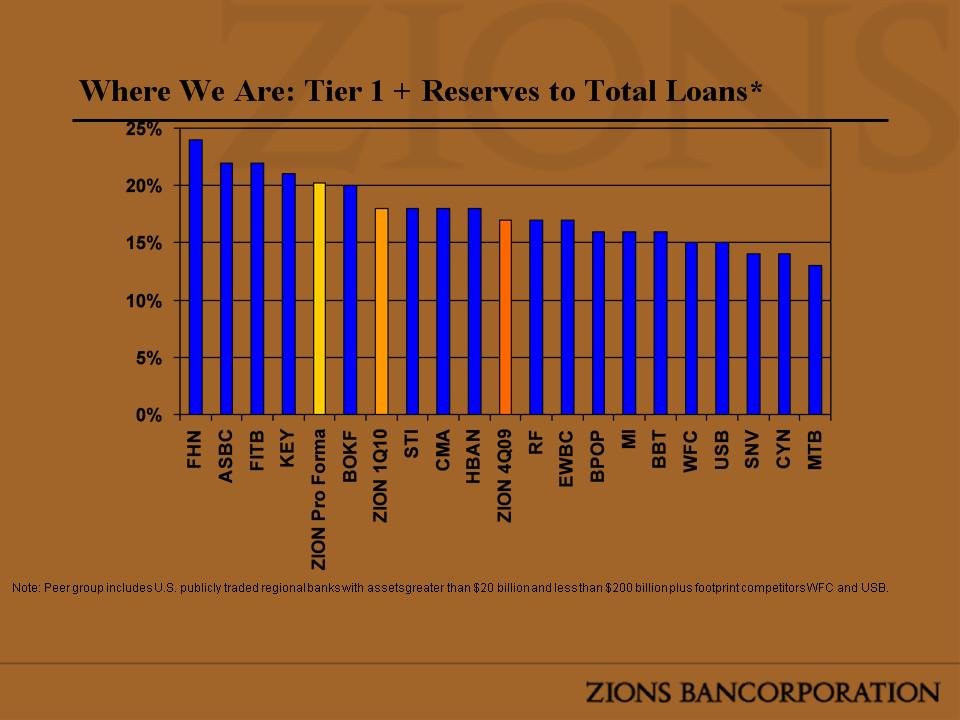
Source: SNL
TARP is included in Tier 1 Capital for the following companies: FHN, ASBC, FITB, KEY, ZION, STI, HBAN, RF, EWBC, MI, SNV, MTB.
Non-TARP: CYN, USB, WFC, BBT, CMA, BOKF; Converted TARP to TruP: BPOP.
*All data as of 1Q10 except Zions 4Q09 & 1Q10 Pro Forma, which includes $450 million combined common equity distribution and warrants, and $150 million of additional
capital that qualifies for Tier 1 regulatory capital treatment.
capital that qualifies for Tier 1 regulatory capital treatment.

7
Agenda
|
Capital
Overview of Zions
Key Performance Drivers
–Revenue
–Credit Quality
–Term CRE
–Securities Portfolio
Outlook Summary
|
|
|

8
A Collection of Great Banks

9
Strong Focus on Business Banking - Loan Mix, Profit Mix
C&I
47%
Consumer
21%
CRE
32%
*Includes FDIC Supported Assets
Loan Portfolio 1Q10
* Commercial Loans: 79%
* Retail & Other Loans: 21%

10
Small Business Banking:
National Awards:
• Overall Satisfaction
• Relationship Manager Performance
• Financial Stability
• Overall Treasury Management
Regional Awards:
• Overall Satisfaction - West
• Overall Satisfaction - Treasury Management -
West
West
What Others Say About Us
2009 Greenwich Excellence Awards
in Small Business and Middle Market Banking
Middle Market Banking
National Awards:
• Overall Satisfaction
• Personal Banking
• Relationship Manager Performance
• Credit Policy
• Financial Stability
• Overall Treasury Management
• Accuracy of Operations
• Customer Service
• Treasury Product Capabilities
Regional Awards:
• Overall Satisfaction - West
• Overall Satisfaction - Treasury Management - West

11
Zions’ Strengths & Recent Improvements
• NIM: 4.03% in 1Q10, ranked #3 of 19 regional banks/peers*
• 3rd among peers* for non-interest bearing deposits as a percent of
earning assets
earning assets
• Strong allowance for credit loss: 4.5% of net loans (excluding FDIC
supported loans)
supported loans)
• Low original LTV ratios on term commercial real estate loans
• Markets with strong long term growth profile
• Established market-leading small business lender
– Leading SBA Lender
– Superior Treasury Management Products
• Competitive operating cost structure
– Expense / Loan ratio: Best quartile
*Peer group includes U.S. publicly traded regional banks with assets greater than $20 billion and less
than $200 billion plus footprint competitors WFC and USB (updated annually at year end).
than $200 billion plus footprint competitors WFC and USB (updated annually at year end).

12
Zions’ Challenges
• Rising NPAs, to 6.4% of loans in first quarter from 6.0% in 4Q09;
5.4% in 3Q09 (1)
5.4% in 3Q09 (1)
– Total delinquent + NPA increased by 2.8% in 1Q10 compared to the prior quarter
• Net charge-off rate 2.4% in 1Q10; full year 2009 net charge-off
rate of 2.9%(1)
rate of 2.9%(1)
– Gross charge-offs down 36% from 3Q09 peak
• Continued securities impairments (OTTI), primarily on
bank/insurance CDOs - $31.3 million in 1Q10
bank/insurance CDOs - $31.3 million in 1Q10
– Although OCI mark is already reflected in GAAP capital ratios, the
difference between Amortized Cost (OTTI mark) and Carrying Value (OCI
mark) is $599 million, representing a potential earnings impairment
difference between Amortized Cost (OTTI mark) and Carrying Value (OCI
mark) is $599 million, representing a potential earnings impairment
(1) Excludes FDIC supported assets

13
Agenda
|
Capital
Overview of Zions
Key Performance Drivers
–Revenue
–Credit Quality
–Term CRE
–Securities Portfolio
Outlook Summary
|
|
|

14
Net Interest Margin
Note: Peer group includes U.S. publicly traded regional banks with assets greater than $20 billion and
less than $200 billion plus footprint competitors WFC and USB (updated annually as of year end).
less than $200 billion plus footprint competitors WFC and USB (updated annually as of year end).
Source: SNL (As Reported NIM)
Strong NIM
Driven by Strong Demand Deposits

15
Core NIM Trends
Core NIM Performance
• Due to the
extinguishment/
reissuance of
subordinated debt in
June 2009, Zions
experiences non-cash
discount accretion,
which increases interest
expense, reducing GAAP
NIM
extinguishment/
reissuance of
subordinated debt in
June 2009, Zions
experiences non-cash
discount accretion,
which increases interest
expense, reducing GAAP
NIM
Core NIM (excludes discount accretion) has been generally stable
• 1Q09 experienced a temporary dip partially due to an intentional build-up of
excess liquidity during the significant turmoil during late 2008/early 2009.
excess liquidity during the significant turmoil during late 2008/early 2009.
• Issuance of senior notes in September 2009 had about 8 bps adverse impact
on the core NIM in 4Q09.
on the core NIM in 4Q09.
16

17
Agenda
|
Capital
Overview of Zions
Key Performance Drivers
–Revenue
–Credit Quality
–Term CRE
–Securities Portfolio
Outlook Summary
|
|
|

18
Credit Quality Trends
(Regional Bank Peers)
(Regional Bank Peers)
*Annualized
Zions excludes FDIC supported assets
Note: Peer group includes U.S. publicly traded regional banks with assets greater than $20 billion and less than $200 billion plus
footprint competitors WFC and USB (updated annually as of year end).
footprint competitors WFC and USB (updated annually as of year end).
Source: SNL; Peer data includes estimates from previous quarter if current quarter is unavailable at time of printing
NPAs + Greater than 90 Days
Delinquent / Loans + OREO
Delinquent / Loans + OREO
Net Charge-offs as
a % of Loans*
a % of Loans*

19
Note: Peer group includes U.S. publicly traded regional banks with assets greater
than $20 billion and less than $200 billion plus footprint competitors WFC and USB.
than $20 billion and less than $200 billion plus footprint competitors WFC and USB.
Source: SNL
Net Charge Offs - By Loan Type
(Regional Bank Peers)
(Regional Bank Peers)
Percentage of Zions
Total Loans
Total Loans
Shaded Portion Represents
Gaming Credits
Gaming Credits

20
Agenda
|
Capital
Overview of Zions
Key Performance Drivers
–Revenue
–Credit Quality
–Term CRE
–Securities Portfolio
Outlook Summary
|
|
|
21
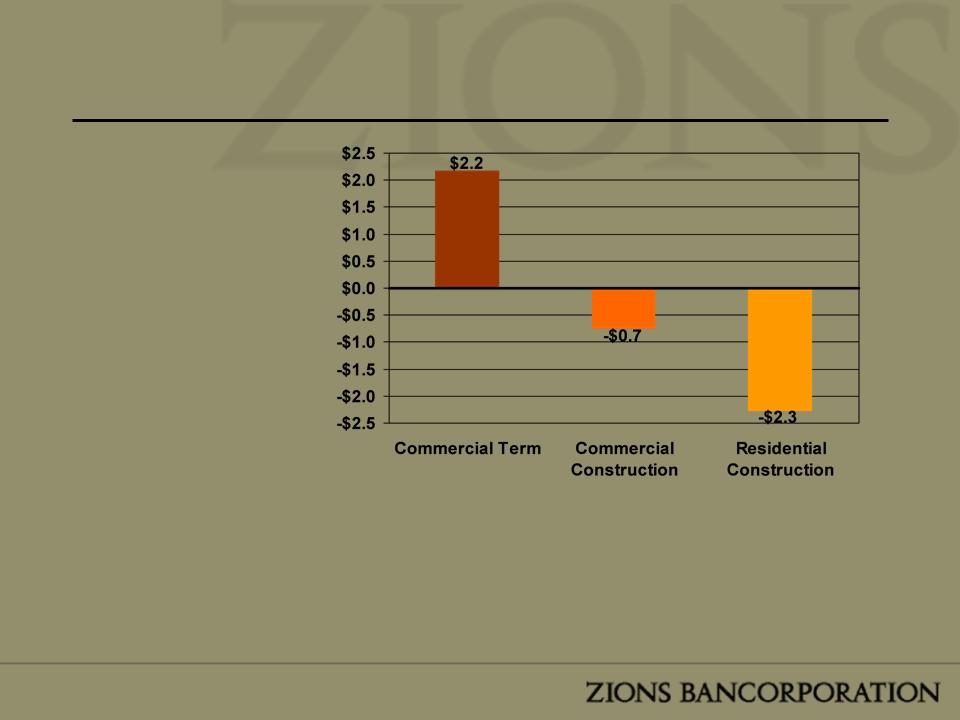
Change in CRE Loan Outstandings in $billions (4Q07 to 1Q10)
• A decline in
construction has
been partially offset
by Term CRE loan
growth
construction has
been partially offset
by Term CRE loan
growth
• Commercial
construction loans
must qualify for
“pass grade”
underwriting in
order to move from
Construction to
Term CRE
construction loans
must qualify for
“pass grade”
underwriting in
order to move from
Construction to
Term CRE

22
Term CRE Maturity Stratification

23
Term CRE - LTV Stratification At Origination*
*Or most recent appraisal; reappraisals are by policy conducted when a loan is downgraded
to special mention, and periodically thereafter as warranted by market conditions
to special mention, and periodically thereafter as warranted by market conditions
|
Percentage of Loans within each bucket that are Non-Accrual
|
||||||
|
1.9%
|
3.7%
|
1.6%
|
8.1%
|
29.9%
|
15.5%
|
12.7%
|
24
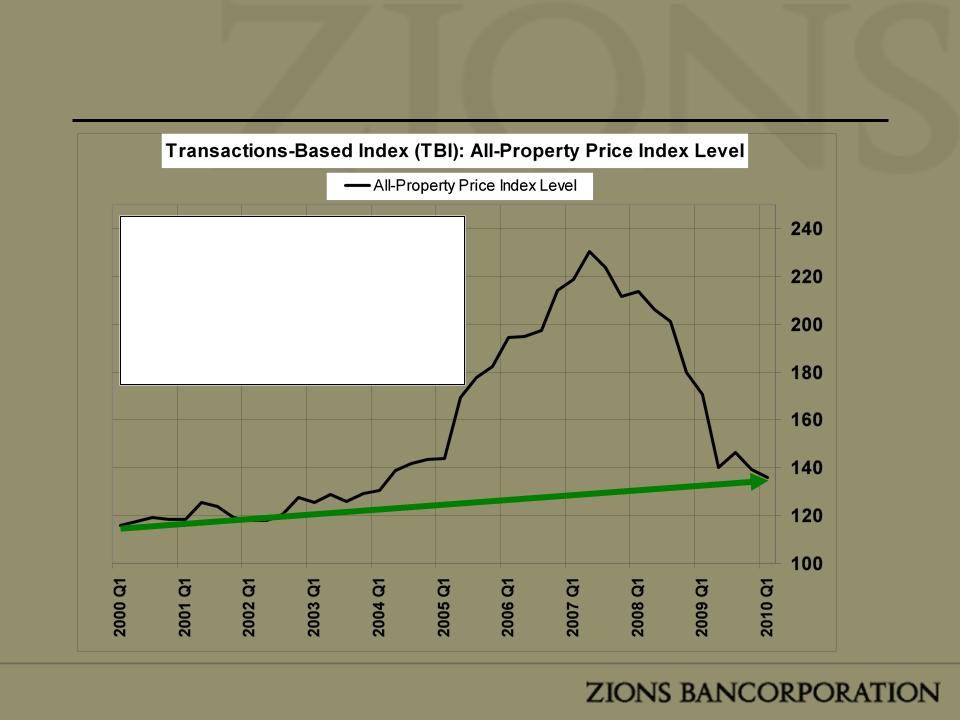
Macroeconomic Data - MIT’s Transaction Based Index
•Property prices have
appreciated at a CAGR of
1.6% during the past 10 years
appreciated at a CAGR of
1.6% during the past 10 years
•Prices are now back to 2Q04
levels
levels

25
Term CRE - TBI-Adjusted LTV Stratification (3-31-10)
The MIT Transaction Based Index is a national index that has
been applied to Zions’ mostly regional CRE Portfolio
been applied to Zions’ mostly regional CRE Portfolio
|
Percentage of Loans within each bucket that are Non-Accrual
|
||||||
|
2.3%
|
2.7%
|
3.9%
|
3.7%
|
8.8%
|
8.6%
|
4.0%
|

26
Day of Reckoning - or Not?
• Market Perception (top left chart): Eighty percent
of the industry’s CRE loans maturing in 2014 are
projected to be underwater (LTV >100%).
of the industry’s CRE loans maturing in 2014 are
projected to be underwater (LTV >100%).
• Zions Specific Data (bottom right chart): Based on
loans adjusted for price declines as reflected in the
1Q10 MIT Transaction Based Index (TBI),
approximately 7% of loans maturing at Zions in
2014 would be underwater.
loans adjusted for price declines as reflected in the
1Q10 MIT Transaction Based Index (TBI),
approximately 7% of loans maturing at Zions in
2014 would be underwater.
Source: American Banker, Foresight Analytics (Dec. 29, 2009)
Total amt maturing
(left scale)
(left scale)
About $65 MM of
loans @ risk
loans @ risk
Loan to Value > 100%
(right scale)
(right scale)

27
Nonaccrual Loan Migration
- Nonaccrual loan
inflows improved in
early 2010
inflows improved in
early 2010
- Favorable resolutions*
in stable range
in stable range
- Unfavorable
resolutions** continue
to improve
resolutions** continue
to improve
*Favorable resolutions include - change to accrual status, paid off, paid down
**Unfavorable resolutions include - charged off/down, movement to OREO status

28
Agenda
|
Capital
Overview of Zions
Key Performance Drivers
–Revenue
–Credit Quality
–Term CRE
–Securities Portfolio
Outlook Summary
|
|
|

29
CDO Portfolio Summary
•Credit-related OTTI losses $31.3 million in 1Q10
– Approximately 85% of the credit-related net impairment losses
came from original A and BBB rated, predominantly bank CDOs
came from original A and BBB rated, predominantly bank CDOs
•Noncredit-related losses on securities of $17.3 million in
1Q10 recognized in OCI
1Q10 recognized in OCI
*This table includes $2.2 billion par value of CDOs that are
backed predominantly by bank trust preferred securities. The
par value of all Bank & Insurance backed CDOs is $2.7 billion
backed predominantly by bank trust preferred securities. The
par value of all Bank & Insurance backed CDOs is $2.7 billion

30
CDO Stress Testing - OTTI
“Deterioration in PDs %” means that the default
curve applied to the performing collateral of
each deal is made worse by the percentage
indicated. Thus a deal with a default curve of
5% stressed to a 25% “Deterioration in PDs %”
would have a 6.25% default probability curve
applied to it, a deal with 20% would go to 25%
and so forth. A “Deterioration in PDs %” stress
of 100% would double the PD curve being
applied to a deal's collateral.
•Moderate Stress - The PD curve that was
applied to the performing collateral of each
CDO deal in the 4Q09 pricing run is increased
by the % indicated and the resultant values
were used to estimate OTTI losses.
applied to the performing collateral of each
CDO deal in the 4Q09 pricing run is increased
by the % indicated and the resultant values
were used to estimate OTTI losses.
•Adverse Stress - Incorporates all of the
deterioration of PDs applied to the performing
collateral, but also stresses the PDs applied to
collateral in deferral by the same deterioration
percentages. PDs on deferring collateral are
used to estimate the value of the potential for
this collateral to cure in the future through
recovery or re-performance.
•Extreme Stress - This is a very severe stress
scenario that uses the “Moderate Stress”
assumptions for performing collateral, but also
immediately defaults all deferring collateral
instantly with no recovery and no probability to
re-perform in the future.
scenario that uses the “Moderate Stress”
assumptions for performing collateral, but also
immediately defaults all deferring collateral
instantly with no recovery and no probability to
re-perform in the future.

31
CDO Stress Testing - Capital
|
Model Implied Bank Failures (1 year)
|
|||
|
Scenario @ 100%
|
Total within Zions’ CDOs
|
Total in Banking Universe
|
Zions % of Universe
|
|
Actual Bank Failures in 2009
|
57
|
132*
|
43%
|
|
Actual Bank Failures in 1Q 2010
|
13
|
41
|
32%
|
|
Future 1 Year Failures Implied in 4Q09 Pricing
|
95
|
221
|
43%
|
|
Moderate Stress
|
117
|
272
|
43%
|
|
Adverse Stress
|
162
|
377
|
43%
|
|
Extreme Stress
|
218
|
507
|
43%
|
• Under various stress scenarios,
Zions’ modeling indicates that
OCI (accumulated other
comprehensive income) would
erode, although at a significantly
lower amount than OTTI (other
than temporary impairment)
Zions’ modeling indicates that
OCI (accumulated other
comprehensive income) would
erode, although at a significantly
lower amount than OTTI (other
than temporary impairment)
• OTTI: Under the moderate stress
scenario at 100% greater PD,
OTTI incurred would be
approximately $111 million (after
tax).
scenario at 100% greater PD,
OTTI incurred would be
approximately $111 million (after
tax).
• OCI: Under the same moderate
stress scenario at 100% greater
PD, OCI would deteriorate by
approximately $45 million (after
tax).
stress scenario at 100% greater
PD, OCI would deteriorate by
approximately $45 million (after
tax).
*FBOP, which failed in 2009, had 9 subsidiary banks, for consistency
in comparison of exposure Zions treated these 9 failures as 1 failure
in comparison of exposure Zions treated these 9 failures as 1 failure

32
History of Bank Deferrals & Defaults in Zions’ CDOs
As of 4-23-10

33
Outlook Summary
|
|
|
|
|
|
|
▼
|
|
Loans
|
|
|
▲
|
|
Low-Cost Deposit Growth
|
|
|
▼
|
|
Credit Costs
|
|
|
◄►
|
|
Core Net Interest Margin
|
|
|
◄►
|
|
Core Non-interest Expenses
|
|
|
◄►
|
|
OTTI
|
|
|
▲
|
|
Capital Ratios and Quality of Capital
|

34
25 May 2010

35
Appendix
36
Risk-adjusted Net Interest Margin* (MRQ)
*(Net Interest Income - Net Charge-offs)/Average Earning Assets (annualized)
Note: Peer group includes U.S. publicly traded regional banks with assets greater than $20 billion and less than
$200 billion plus footprint competitors WFC and USB (updated annually at year end).
$200 billion plus footprint competitors WFC and USB (updated annually at year end).
Source: SNL

37

38
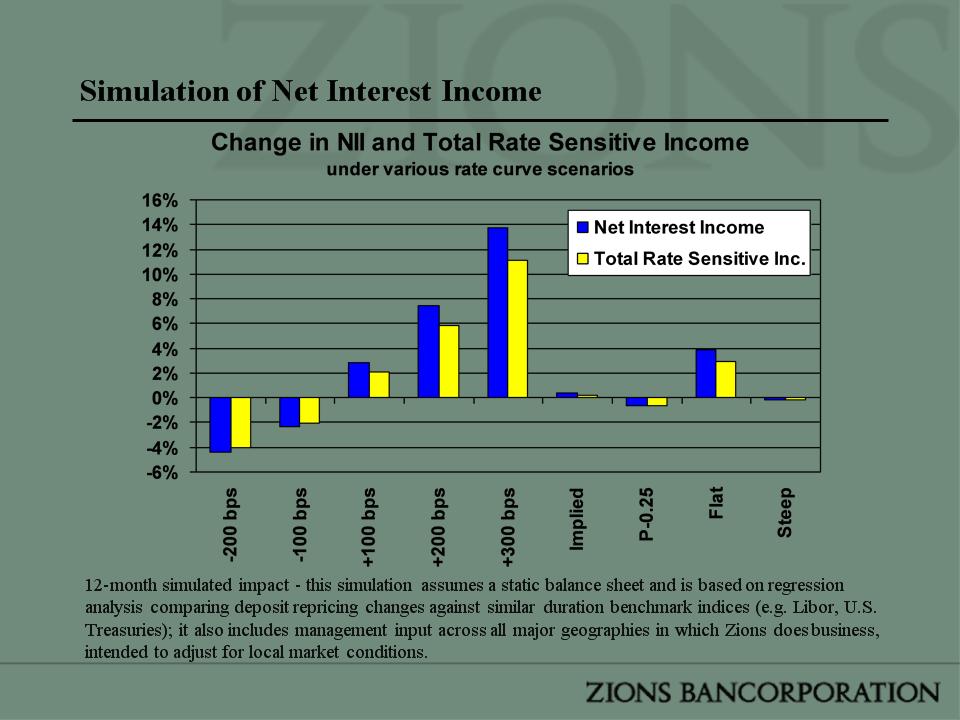
Asset Sensitivity
Fixed-rate loans:
– 27% of portfolio
– Duration of about 1 year
Variable-rate loans:
– 73% of portfolio
– Floors on 46% of variable-rate loans (79% of those loans are at the floor rate)
– Swaps: $570 million (Pay Floating, Receive Fixed)
• Continual reduction of interest rate swaps (increasing asset sensitivity)
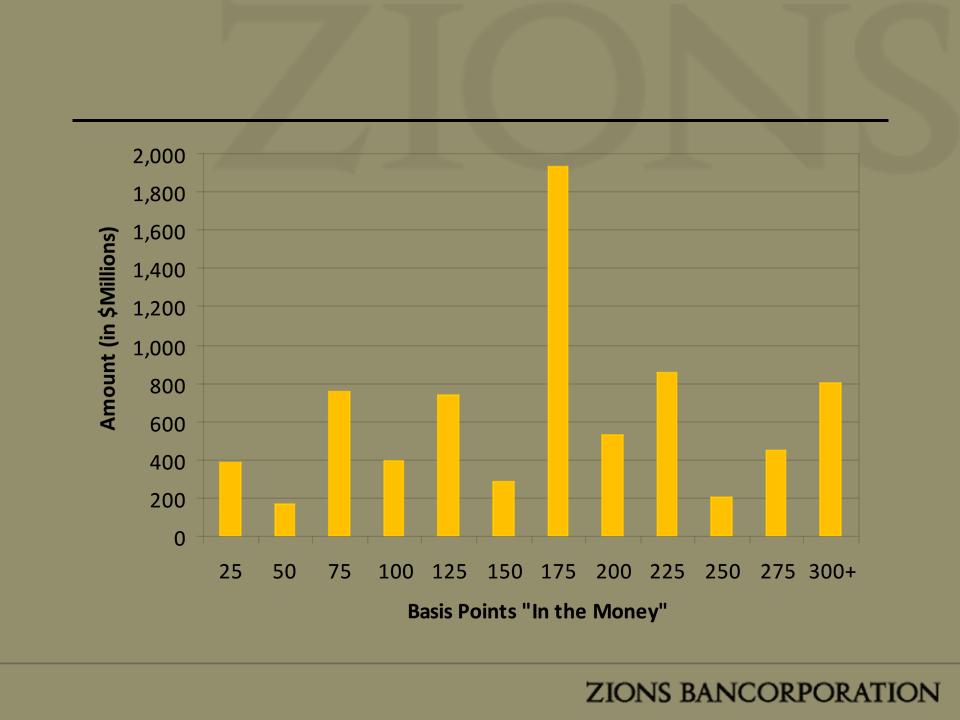
39
Loans with Floors (as of 12/31/09)