Attached files
| file | filename |
|---|---|
| 8-K - REHABCARE INVESTOR DAY MAY 18, 2010 - REHABCARE GROUP INC | eightkirday510.htm |

Welcome and Introductions
John H. Short
President and CEO
Exhibit 99
Company Overview
2
n Headquartered in St. Louis, MO; over 18,000 full/part-time & PRN employees
n Established in 1982
n Largest contract manager of rehabilitation services; fourth largest post-acute
hospital operator, third largest long-term acute care hospital provider
hospital operator, third largest long-term acute care hospital provider
n Triumph HealthCare merger created more diversified business lines, reducing
reliance on management contracts for revenue and EBITDA streams
reliance on management contracts for revenue and EBITDA streams
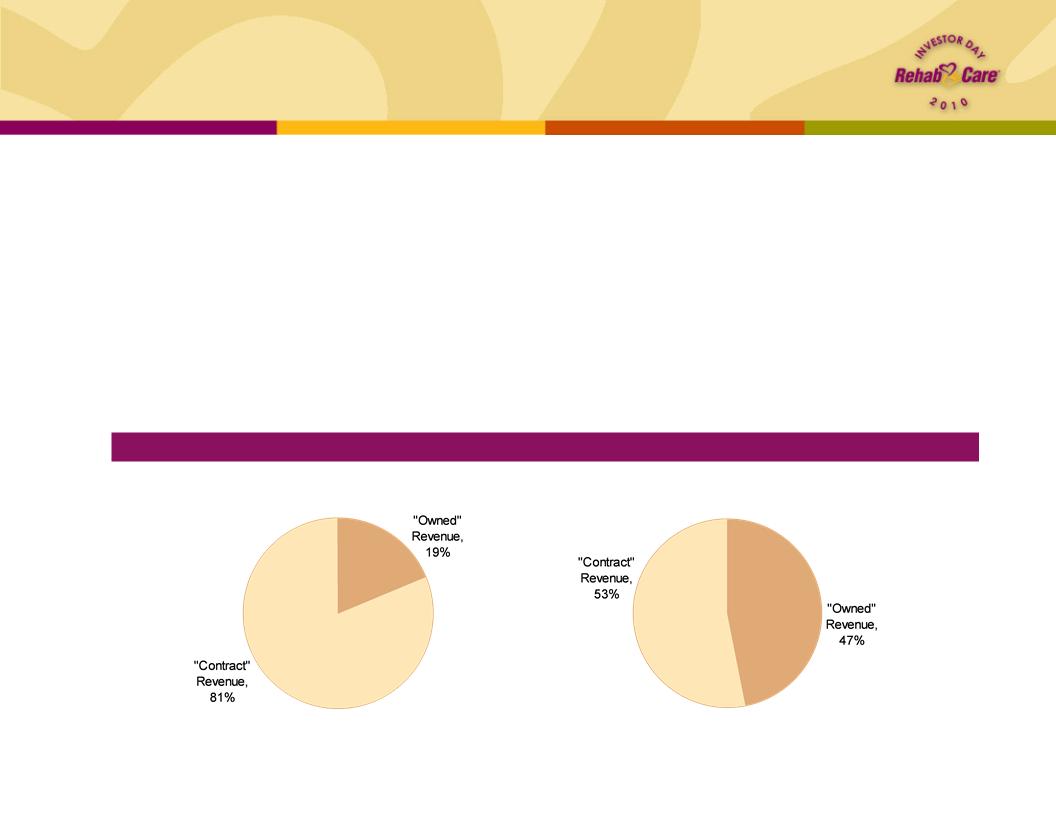
RehabCare excluding Triumph
Pro Forma w/Triumph
FYE 2009 “Owned” Revenue vs. “Contract” Revenue

Division Overviews
Skilled Nursing
Rehabilitation Services
n $499 mm - 39% of pro
forma revenue
forma revenue
n Created in 1997
n 1,125 locations in 37 states
n 8.1 mm annual patient
visits
visits
$1.3 billion pro forma operating revenues for LTM 3/31/10
Hospital Rehabilitation
Services
n $178 mm - 14% of pro
forma revenue
forma revenue
n Opened first program in
1983
1983
n 144 locations in 32 states
n Annually, 43,000 inpatient
rehabilitation discharges,
1.2 mm outpatient visits
rehabilitation discharges,
1.2 mm outpatient visits
n $594 mm - 47% of pro
forma revenue
forma revenue
n Launched in 2005
n 291 long-term acute care
hospitals, 6 inpatient
rehabilitation facilities in 13
states
hospitals, 6 inpatient
rehabilitation facilities in 13
states
n 410,000 annual patient
days
days
Hospital Division
3
1Includes Triumph Hospital-The Heights, which opened in April

Day’s Agenda
n Hospital Rehabilitation Services (HRS) Division
Mary Pat Welc
Senior Vice President, HRS Operations
n Skilled Nursing Rehabilitation Services (SRS) Division
Pat Henry
Executive Vice President, SRS Operations
n Hospital Division
Kevin Gross, Senior Vice President, Hospital Operations
Brock Hardaway, Triumph President and Chief Operating Officer
n RehabCare Strategic Direction
John Short
n Q&A with Executive Management Team
n Lunch
n Tours of Clear Lake Rehabilitation Hospital and Triumph Hospital-Clear Lake
4

Hospital Rehabilitation
Services
Services
Mary Pat Welc
Senior Vice President, HRS Operations

n Manages hospital-based Inpatient Rehabilitation Facilities (IRFs) and outpatient
therapy programs on a contract basis, providing our partners with:
therapy programs on a contract basis, providing our partners with:
n Improved internal patient flow
n Ability to attract ≈ 30% admissions from external sources
n Successful clinical outcomes and broader clinical programming (brain, stroke, spinal dysfunction)
n Regulatory compliance (60% rule, RAC, 3-hour rule)
n Recruiting and labor management
Hospital Rehabilitation Services (HRS)
Division overview
Division overview
Competitive Landscape
Market Size1: 981 hospital
-based IRFs
-based IRFs
Source: Information available from public filings or from
company websites
company websites
1MedPAC March 2010 Report to Congress
²American Hospital Directory
3,8592 short-term acute
care hospitals
care hospitals
Have IRF
No IRF
6

HRS Division
Clinical outcomes
Clinical outcomes
7
|
Quality Metric
|
Benchmark1
|
Q1 10
|
|
Functional Independence Measure (FIM) Score Gain
|
>24.1
|
25.5
|
|
Discharge to Community
|
>72.4%
|
75.4%
|
|
Discharge to Short-Term Acute Care (STAC)
|
<12.2%
|
9.2%
|
1eRehab national average unadjusted data for Q1 10
|
|
2008
|
2009
|
2010
|
|
FIM Gain
|
23.6
|
24.4
|
25.5
|

HRS Division
Client profile
Client profile
n 144 total contracts at end of Q1 10
n Core contract base is 103 IRF agreements - average size, 20 beds
n Approximately 30% of our IRF contracts have an associated second product -
primarily OP
primarily OP
n Typical customer
n Small to mid-size hospital - average approximately 100 med/surg ADC
n View rehab as being outside their core competencies
n Contract model
n At Risk - Typically priced on a basis that matches CMS’ reimbursement methodology
• IRF - Fee per discharge
• OP - Fee per unit of service
n Initial contract 3 - 5 years in length, with successive renewals of 1 - 3 years each
n Our average client has been with us 9 years
n RehabCare provides an on-site management team in all contracts and therapists in
approximately 55% of IRF contracts and 75% of OP contracts
approximately 55% of IRF contracts and 75% of OP contracts
8

HRS Division
Growth strategy
Growth strategy
n Integration of business development and senior operations team
n Strategies to increase market share
n Strategic market focus- small systems, hub and spoke
n CRM process to reduce closures from historic 8% - 12% churn rate
n Product development - increased flexibility in product offerings, creating centers of
excellence
excellence
n Second product sales - OP and hospital-based skilled
n Strategies to increase same store growth
n Electronic pre-screen to reduce time to admission
n Bed expansions
n Investment in enabling technology
n Upgrade Inpatient operating system
n Develop and integrate therapy point-of-care device
n Benefits:
• Increased integration with hospital operating systems
• Improved management of regulatory compliance and productivity
• Opportunity to upsell therapy management services
• Solid base for development of next generation technology
9
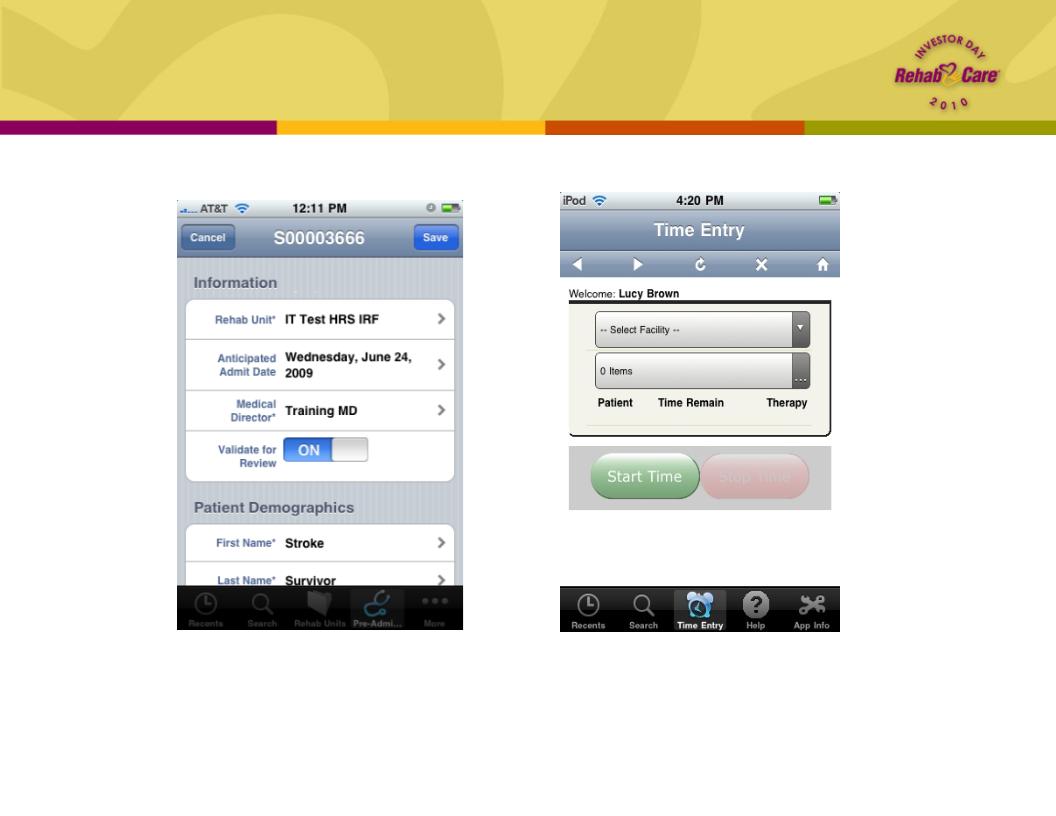
HRS Division
Technology sample
Technology sample
Therapist Handheld Device
Electronic Pre-Screening App
• Decrease time to admission
• Ensure compliance with screening
requirements
requirements
• Increase productivity
• Increase integration with operations systems
• Ensure compliance with 3-hour rule
10

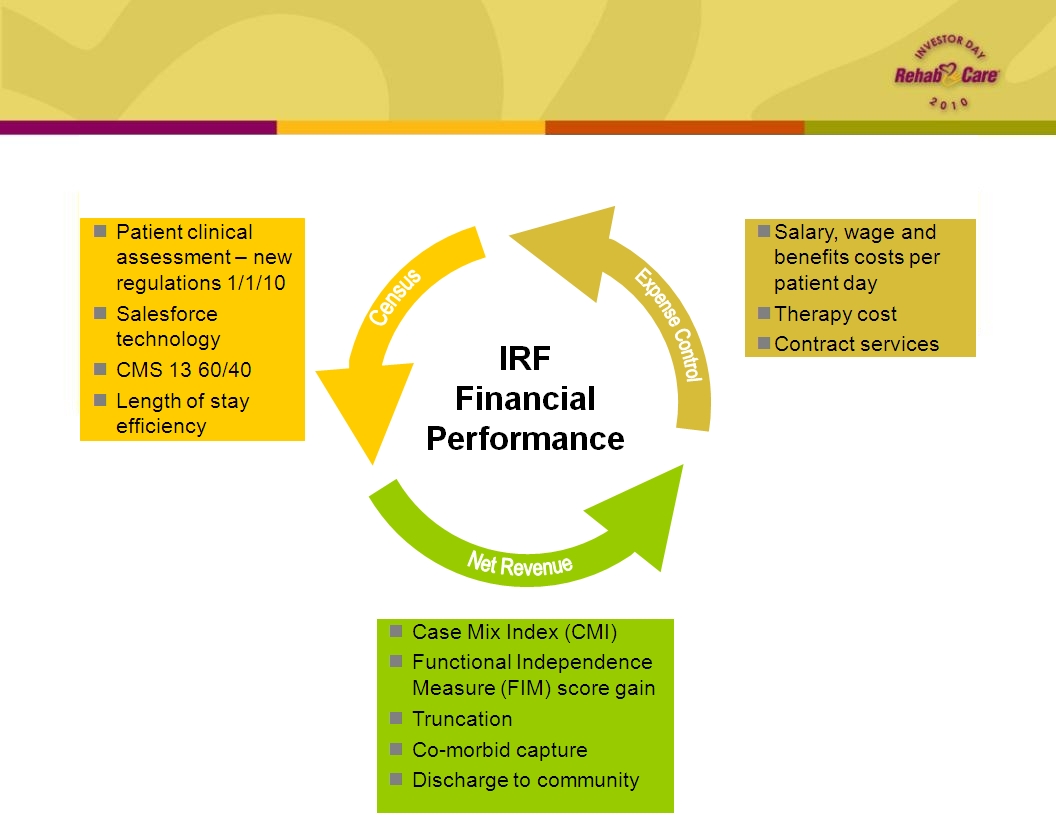
HRS Division
Outlook
Outlook
n HRS is not directly impacted by changes in CMS reimbursement, but impact on our
clients may drive pricing pressure
clients may drive pricing pressure
n Inpatient
• Market basket increases will be reduced by a fraction of a percentage
• Payments will be subject to reductions for industry “productivity” gains
n Outpatient
• Hospital-based outpatient services are exempt from therapy caps
• All outpatient therapies are reimbursed based on the physician fee schedule
• Congress continues to postpone reductions to the physician fee schedule
n Expect 15% - 17% operating earnings margin for FY2010
n Anticipate 2 - 4% year-over-year growth in IRF same store discharges for FY2010
n Unit count expected to decrease in first half of year with recovery in second,
resulting in flat unit growth for year
resulting in flat unit growth for year
n 12 known openings YTD 2010 vs. 6 openings for FY2009
|
Openings
|
YTD 2010
|
FY2009
|
|
IRF
|
6
|
5
|
|
Skilled Nursing
|
4
|
0
|
|
Outpatient
|
2
|
1
|
11

Skilled Nursing
Rehabilitation Services
Rehabilitation Services
Pat Henry
Executive Vice President,
SRS Operations
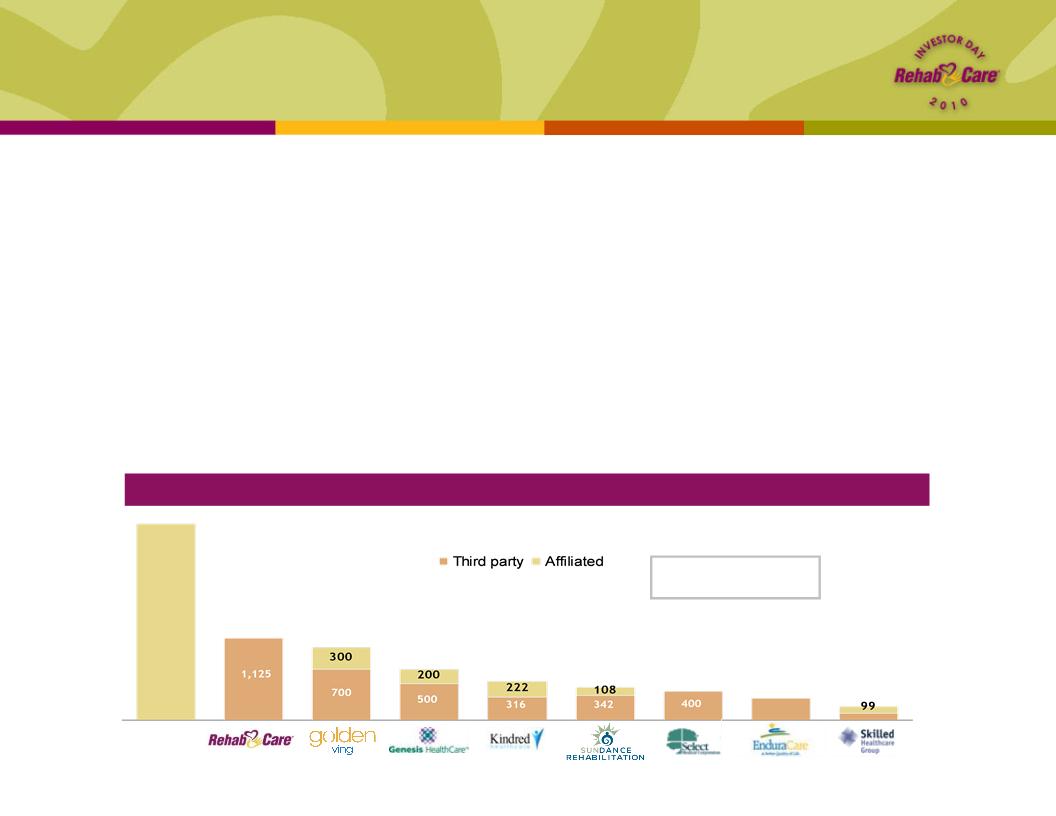
Competitive Landscape — # of facilities served
Self-
operated
Market Size1: 15,000+
Medicare-certified SNFs
Medicare-certified SNFs
Skilled Nursing Rehabilitation Services (SRS)
Division overview
Division overview
n Manages rehab programs for 1,125 Skilled Nursing Facilities (SNF), associated Long-
Term Care Centers and Assisted/Independent Living locations
Term Care Centers and Assisted/Independent Living locations
n Each Medicare-certified SNF is required to provide physical, speech and occupational therapy, but
many prefer outsourcing this component of their business
many prefer outsourcing this component of their business
n Long-term care and assisted/independent living resident services under Medicare Part B
n RehabCare provides a compelling value proposition to its SNF partners
n Access to advanced technology platform
n Broader array of clinical programming
n Better access to therapist labor pool
n Reimbursement expertise and denials management
Source: Information available from public filings or from company websites
¹Source: MedPAC Report to Congress, March 2010
11,000+
1,125
1,000
700
538
450
400
300
188
13

SRS Division
Client profile
Client profile
n Average SNF includes 120-140 beds
n Medicare Part A - 20 beds
n Residential Long-Term Care/Part B
n RHB client
n Freestanding SNF (85% of total contracts)
n Small to mid-size chain of facilities (chains of 3 or more facilities account for 47% of total
contracts)
contracts)
• Average size of chain client is 9 facilities
n Campus of Care - Assisted and Independent Living
n Contracts
n Typically 1-2 years at the outset with an automatic renewal
n Average contract life is 3.3 years
n 10% annual contract turnover
• Reasons for closures:
– Competition - 46%
– Change of ownership or facility closure - 38%
– Payment problems - 11%
– Other - 5%
14

SRS Division
Technology platform
Technology platform
n State-of-the-art iPhone and iPod Touch technology
n Planned rollout to all clinicians by year end
n Currently in the hands of about 500 therapists
n Increases speed and accuracy
• Maximizes therapist productivity
• Reduces billing errors and subsequent denials
n Systems with advanced reporting capability
n Captures Resource Utilization Group (RUG) specific information
for Minimum Data Set (MDS) input
for Minimum Data Set (MDS) input
n RUG category placement results in appropriate payment
n Records patient outcome data
n Includes discharge location and hospital re-admissions
n Tracks data to ensure optimal outcomes at lowest cost
n Benchmarking reports
n National comparative data for SNFs in RehabCare universe
• Ability to track common metrics across venues of service
• Support future research on decision making for post-acute
patient placement
patient placement
15

SRS Division
Technology sample
Technology sample
Upon logging in, therapists have the
ability to choose which facility they’re
working in, clock in for the day,
enter/edit treatment information,
balance their time card, review the
patient schedule and synchronize their
data
ability to choose which facility they’re
working in, clock in for the day,
enter/edit treatment information,
balance their time card, review the
patient schedule and synchronize their
data
The therapist chooses the appropriate
CPT codes and enters the number of
minutes spent providing each treatment.
Once the minutes have been distributed,
the daily note icon appears in yellow to
signify a note is now required.
CPT codes and enters the number of
minutes spent providing each treatment.
Once the minutes have been distributed,
the daily note icon appears in yellow to
signify a note is now required.
16

SRS Division
Clinical programming
Clinical programming
n Patient-specific care planning tools
n Care maps designed to guide decision making in patient treatment
• Incorporated into point-of-service technology
• Link initial care planning with discharge planning
• Outcomes drive future placement or discharge to home
n Provide clinical staff with the ability to determine cost of care and options for expanded
service
service
n Smart Moves Health and Wellness
n Meets the increasing demand for services designed for residents of Assisted and
Independent Living Retirement communities
Independent Living Retirement communities
• Promotes resident ability to remain at desired level of care (“Age in Place”)
n Meets demand of the “older adult” for such services
17
SRS Division
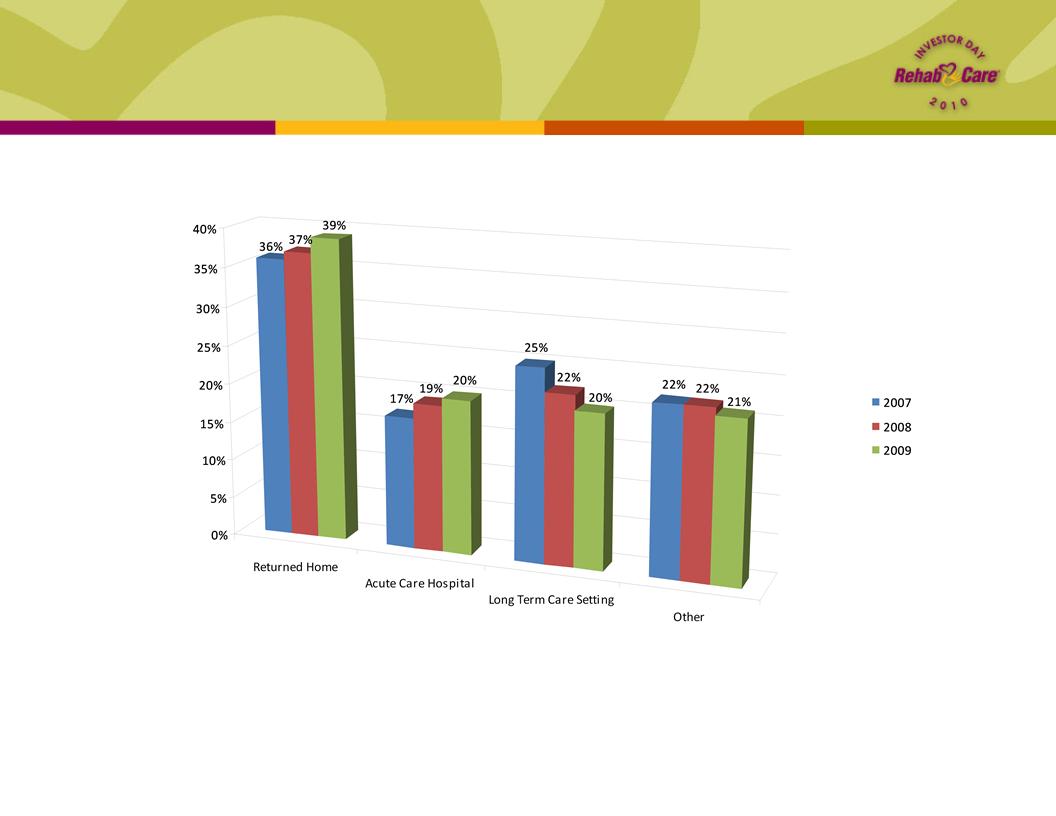
Clinical outcomes
Clinical outcomes
18
Discharge Disposition
n Based on internal universe of over 1,100 programs; no standardized
industry benchmarks exist for SNFs
industry benchmarks exist for SNFs

SRS Division
Access to therapy staff
Access to therapy staff
n RehabCare model of regional employment teams
n Shared resource between RehabCare divisions
n 7 teams of recruiting and staffing management
• Linked closely to operations; hired 2,150 therapists in 2009
n Student programs
• 275 academic affiliations and 332 RehabCare clinical education sites
• Providing iTouch technology and applications to selected schools
• Student hires tend to have a greater sense of loyalty
– 2005 : hired 83 new grads
– 2009 : hired 605 new grads
– 2010 : goal to hire over 750
n Industry leading therapist retention rates
n Turnover rates at 10%
n Advantages of market density for RehabCare
n Staffing managers move staff as demand changes
n Flexibility to meet patient need
• Diverse clinical opportunity supports retention
19

SRS Division
Challenges and opportunities
Challenges and opportunities
n Implementation of change to concurrent therapy rules
n Preparation underway
n RehabCare existing policy on concurrent therapy delivery model has been restrictive
n Mitigation plan in progress:
• Analysis of treatment methods - concurrent, group and individual
• Leverage technology advantage to drive enhanced productivity and offset
increased staff need
increased staff need
n RUGs IV / MDS 3.0
n October 1, 2010 or October 1, 2011????
n RUGs IV delayed but on schedule with MDS 3.0 and concurrent therapy changes
n Rehab in the SNF setting
• Rehab patients in the SNF setting will continue to be profitable
• Medically complex patients provide the opportunity to fill more Medicare beds
n Market share opportunity
n Take advantage of reimbursement changes and provide support and training to SNF
operators
operators
n Our advanced technology will be key as complexity of reporting increases
• Track superior clinical outcomes at lowest cost
• Monitor key indicators such as hospital readmission rates
20

SRS Division
Outlook
Outlook
n Growth strategy
n New sales with focus on self-operated programs
n Same store growth as patient population requiring rehabilitation increases
n Expect 7% - 8% operating earnings margins for the full year 2010, driven by mid
-single digit year-over-year same store revenue growth
-single digit year-over-year same store revenue growth
n Reflects the estimated impact of new concurrent therapy rules, the rollout of new
technologies, pricing pressures and wage rate increases during the year
technologies, pricing pressures and wage rate increases during the year
n Anticipate 50 to 75 new units in 2010
n Patient Protection and Affordable Care Act (PPACA) extended the Part B
therapy cap exception process through Dec. 31, 2010
therapy cap exception process through Dec. 31, 2010
21

Hospital Division
Kevin Gross
Senior Vice President, Hospital Operations
Brock Hardaway
Triumph HealthCare President & COO

Hospital Division
Overview
Overview
Competitive Landscape
1MedPAC, March 2010 Report to Congress
2Includes Triumph Hospital-The Heights, which opened in April
n Post Triumph merger, fourth largest post-acute hospital operator, third
largest long-term acute care hospital provider
largest long-term acute care hospital provider
n RehabCare pursues joint venture hospital partnerships (nine currently,
representing 15 locations) with market-leading acute care providers and
physician groups, in addition to our wholly owned facilities
representing 15 locations) with market-leading acute care providers and
physician groups, in addition to our wholly owned facilities
Market Size1: 221 IRFs
(Freestanding and HIHs)
Market Size1: 386 LTACHs
IRFs
LTACHs
23
Source: Information available from public
filings or from company websites
filings or from company websites
99
95
83
35
23
19
16
14
8
4
2

Hospital Division
Locations
Locations
Note: Bed figures represent licensed beds
Triumph Lima
Beds: 26
Triumph Mansfield
Beds: 33
Triumph Fargo
Beds: 31
Triumph Central Dakotas
Beds: 41
Triumph El Paso
Beds: 62
Triumph Easton
Beds: 31
Triumph Central
Houston
Beds: 40
Triumph Aurora
Beds: 37
Triumph Amarillo
Beds: 72
Triumph
Northwest
Beds: 85
Triumph
Clear Lake
Beds: 110
Triumph
Channelview
Beds: 83
Triumph
North
Beds: 86
Triumph
Tomball
Beds: 75
Triumph
Baytown
Beds: 37
Triumph
Town & Country
Beds: 66
Triumph Victoria
Beds: 23
Triumph Philadelphia
Beds: 58
Triumph Our Lady
of Peace - South
Bend
of Peace - South
Bend
Beds: 32
Triumph Heights
Beds: 42
Clear Lake
Beds: 60
Triumph
Southwest
Beds: 105
Northwest TX
Beds: 44
St. Luke’s
Beds: 35
Northland
Beds: 35
Tulsa
Beds: 60
Rome
Beds: 24
Arlington
Dallas
Central Texas
Beds: 24
Beds: 24
Beds: 20
Beds: 60
Lafayette
Beds: 68
New Orleans
Beds: 56
West Gables
Beds: 60
Denotes Hospital in Hospital (HIH) - remaining facilities are freestanding (note: freestanding LTACHs are not subject to the 25% rule)
New Orleans - grandfathered from the 25% rule
Indicates Inpatient Rehabilitation Facility (IRF)
Indicates Long-Term Acute Care Hospital (LTACH)
Greater Peoria
Beds: 50
Triumph Detroit
Beds: 77
24

25
Hospital Division
Strategy
Strategy
n Development Projects
n Houston Heights (remote provider for Triumph North)
• 42-bed LTACH - Opened April 15, 2010
n Rome, Georgia (expansion)
• 24 beds expanded to 45-bed LTACH - Opening Q2 11
n Central Texas (expansion)
• 20 beds expanded to 60-bed IRF - Opening Q1 12
n Net revenue growth
n Managed care and commercial payors
n Developing IRF opportunities within Triumph facilities
n Adding services to legacy RehabCare LTACHs - ICU, CT, expanded
laboratory
laboratory
n Leverage support functions in Houston
IRFs
Key operating metrics
Key operating metrics
26

IRFs
Quality measures
Quality measures
1per 1000 patient days
2eRehab national average unadjusted data for Q1 10
|
Quality and Risk Indicators
|
Benchmark
|
Q1 10
|
|
Hospital Acquired Central Line Infection Rate1
|
<1.5
|
1.66
|
|
Hospital Acquired Pressure Wound Rate1
|
<1
|
0.82
|
|
FIM Score Gain
|
>24.12
|
23.1
|
|
Discharge to Community
|
>72.4%2
|
68%
|
|
Discharge to Short-Term Acute Care (STAC)
|
<12.2%2
|
14%
|
27

Overview and Update
on LTACHs
on LTACHs
Brock Hardaway

LTACHs
Overview
Overview
n Update on integration
n Update on progress made with implementing key operating metrics at
legacy RehabCare LTACHs
legacy RehabCare LTACHs
n Update on Triumph
n Role of LTACHs in continuum
n Healthcare reform and the future
29

LTACHs
Integration update
Integration update
n Integration of back office support is either on or ahead of schedule
n Houston is Hospital Division office
n Triumph name will be used to brand all 29 LTACHs
n Taking advantage of combined scale for additional GPO savings (drugs and
supplies)
supplies)
n New regional operations structure effective May 1
n Gulf Coast Region (Texas and Louisiana)
n National Region (All other hospitals)
n Promotes a single approach and culture across the Hospital Division
n Overall, integration has been smooth
30

LTACHs
Key operating metrics
Key operating metrics
31

LTACHs
Progress w/implementing Triumph metrics
Progress w/implementing Triumph metrics
|
Performance Metric for
legacy hospitals |
2009 Actual
|
Q1 10
Actual
|
|
Volume
|
|
|
|
Occupancy
|
56%
|
58%
|
|
Case Management
|
|
|
|
Window %
|
33%
|
44%
|
|
CMI
|
1.00
|
1.01
|
|
Medicare Net Revenue per patient
day (PPD) |
$1,176
|
$1,424
|
|
Non-Medicare Net $ PPD
|
|
|
|
Commercial $ PPD
|
$1,258
|
$1,339
|
32
n Operating performance for RehabCare legacy LTACHs improved
sequentially in Q1 10 by $2.6 million
sequentially in Q1 10 by $2.6 million

LTACHs (all)
Performance on key metrics
Performance on key metrics
Medicare Net Revenue
*2009 operating stats are Pro forma
33

LTACHs
2010 operational outlook
2010 operational outlook
n Implementing services and programs that will improve quality of care and
quality of earnings
quality of earnings
n ICU (Tulsa and Rome - new construction)
n Around-the-clock physician coverage (Tulsa, Dallas, Lafayette, Peoria, Kansas
City)
City)
n Ancillary enhancements (Tulsa, Dallas, Lafayette, Peoria, El Paso)
• CT scanners
• Hyperbaric chamber(s)
• Special procedure rooms
n New hospitals are performing
n The Heights already exceeding volume expectations
n Peoria hospital ended qualifying period at the end of April
n New regional operations structure gives stability, direction and support to drive
performance across the portfolio
performance across the portfolio
34

LTACHs
Role within the continuum
Role within the continuum
n LTACHs represent the earliest discharge option from the STAC setting
n ICU/high observation unit (HOU) allows for early and safe transfer of medically
complex patients
complex patients
n Availability of ancillary services, advanced equipment and experienced staff
n LTACHs can discharge patients home or to highest level of functionality faster
n Multi-disciplinary approach means all caregivers are focused on same outcome
n Strong therapy component results in patients going home or to the next level of care
faster; therapists work with the nursing staff to resolve medical issues while dealing
with physical rehabilitation aspects of the treatment plan
faster; therapists work with the nursing staff to resolve medical issues while dealing
with physical rehabilitation aspects of the treatment plan
n LTACHs should:
n Accept patients from STAC/ICU setting within 3-5 days of diagnosis and stabilization
n Discharge at least 50% of their patients home and within the Medicare defined
expected ALOS
expected ALOS
n Return less than 5% of their patients to the STAC setting for services the LTACH can’t
provide or manage safely
provide or manage safely
n Reduce 90-day STAC discharge readmit rates by healing and educating patients and
families on care/prevention
families on care/prevention
35

LTACHs
Triumph approach
Triumph approach
n Equipped ICU or HOU with experienced, well-trained ICU staff
n 88% of Triumph hospitals have an ICU or HOU today
n All but one will have an ICU or HOU by this time next year
n Availability of on-site, 24/7 physician coverage
n 75% of Triumph hospitals have either 24/7 on-site coverage or on-site coverage on nights and
weekends and attending physicians during the day
weekends and attending physicians during the day
n All freestanding hospitals with an ICU will have 24/7 physician coverage immediately available and on
-site by end of 2010
-site by end of 2010
n Nursing and respiratory therapy on-site and dedicated around the clock
n 100% of Triumph hospitals provide on-site and dedicated nursing and RT staff
n 100% of Triumph hospitals have at least one RN on site at all times
n Ancillary support necessary to provide safe care to complex patients
n CT scanner and other routine radiological services on-site or contracted to be readily available
n Hyperbaric oxygen chamber and/or other advanced equipment for treating complex wounds on-site or
contracted to be readily available
contracted to be readily available
n Procedure room capable of doing basic procedures or contracted to be readily available
n Report quality outcomes
n Triumph benchmarks all hospitals on monthly/quarterly basis
n Core measures are tracked for all hospitals and reported to Sr. Management
n Admit high proportion of high acuity patients (CCs, MCCs, etc.)
n Triumph does not admit any patients that have a primary condition of rehabilitation
n Over 90% of Triumph Medicare discharges have either MCC or CC
n Triumph utilizes Interqual criteria
Facility/Services
Patient Admission Criteria
36

LTACHs
Quality measures
Quality measures
n Triumph measures, tracks and reports
quality related data elements - core
measures
quality related data elements - core
measures
n Variances to benchmark require
management intervention
management intervention
n Internal and external benchmarks
n Quality of earnings almost always follows
quality of care
quality of care
n Triumph core measures
n Wound improvement
n Ventilator weaning
n Hospital acquired infection rate
n Hospital acquired pressure wound
rate
rate
n Mortality rate
n Readmissions to STAC
n Little or no comparative data exists
n ALTHA benchmarking program
n Industry-wide effort to develop quality
standards
standards
n Data collection starting for Q110
|
Measure |
Benchmark |
Triumph
2009 Actual* |
|
Wound
Improvement Rate |
90% |
89% |
|
Ventilator
Weaning Rate |
75% |
62% |
|
Hospital
Acquired Infection |
2.6/1,000 days |
1.8/1,000 days |
|
Hospital
Acquired Pressure Wounds |
2.3/1,000 days |
1.8/1,000 days |
|
Mortality
Rate |
18% |
12% |
|
Unplanned
Transfers to STAC |
5% |
4% |
*excluding legacy RehabCare
37

LTACHs
Healthcare reform and proposed RY2011 Rule
Healthcare reform and proposed RY2011 Rule
n Healthcare reform signed into law March 23, 2010
n Extends all provisions of MMSEA until end of 2012
• Moratorium on new LTACH beds
• HIH quota % frozen at 50% or higher
• Restricts CMS from implementing one-time budget neutrality adjustment
• Restricts CMS from implementing short-stay outlier policy
n 25bps reduction to market basket effective Apr. 1, 2010 and another 50bps reduction
effective Oct. 1, 2010
effective Oct. 1, 2010
n Prohibits new physician-owned hospitals
n Impact of the insured patient population created by healthcare reform is unclear
n Post-acute bundling pilots
n Proposed RY2011 Rule for LTACHs
n Slight decrease in the Federal Rate
n Slight increase in the fixed loss threshold for outliers
n Adjustments to Wage Index which results in some winners and some losers
n Adjustments to Diagnosis-Related Group (DRG) weights
n If passed as proposed, the RY2011 rule would have less than a 1% impact (before
behavioral changes)
behavioral changes)
38

LTACHs
Growth plans and the future
Growth plans and the future
n With MMSEA extended until end of 2012, growth will come from acquisitions
n Growing number of interested LTACH sellers
n Attractive purchase multiples
n Triumph management team has proven results and track record
n Impact of healthcare reform
n More insured lives in markets will likely result in more pressure on inpatient utilization at
STAC hospitals
STAC hospitals
n Could result in higher referral volumes from STAC hospitals
n Working on post-acute bundling in Houston market
• Triumph has 11 LTACH locations in the Houston market
• RehabCare has 2 IRF locations in the Houston market
• RehabCare has many strong SRS client locations in the Houston market
• Relationship with Memorial Hermann
39

Hospital Division
Outlook
Outlook
40
n Expect FY2010 revenue of $650 - $675 mm
n Anticipate EBITDA of $90 - $100 mm for FY2010
n Reflects the impact of:
• Market basket reductions for IRFs and LTACHs
• RY2011 proposed LTACH rule
n Reaffirm breakeven operating earnings run rate for 13 legacy hospitals by
the end of Q2 10 and breakeven operating earnings for FY2010
the end of Q2 10 and breakeven operating earnings for FY2010
n Dallas LTACH anticipated to be accretive by end of Q2 10
n Triumph hospitals expected to achieve 18% to 20% EBITDA margins for
FY2010
FY2010
n Net income attributable to noncontrolling interests expected to approximate
$3 million for FY2010
$3 million for FY2010

Strategic Direction
John Short

Drive Continued Growth
n Achieve margin expansion in legacy RehabCare hospitals through
Triumph merger
Triumph merger
n Develop IRF opportunities in Triumph markets
n Achieve unit and same store growth in contract services divisions
n Identify and evaluate add-on acquisitions in each division
n Leverage continuum capabilities
42
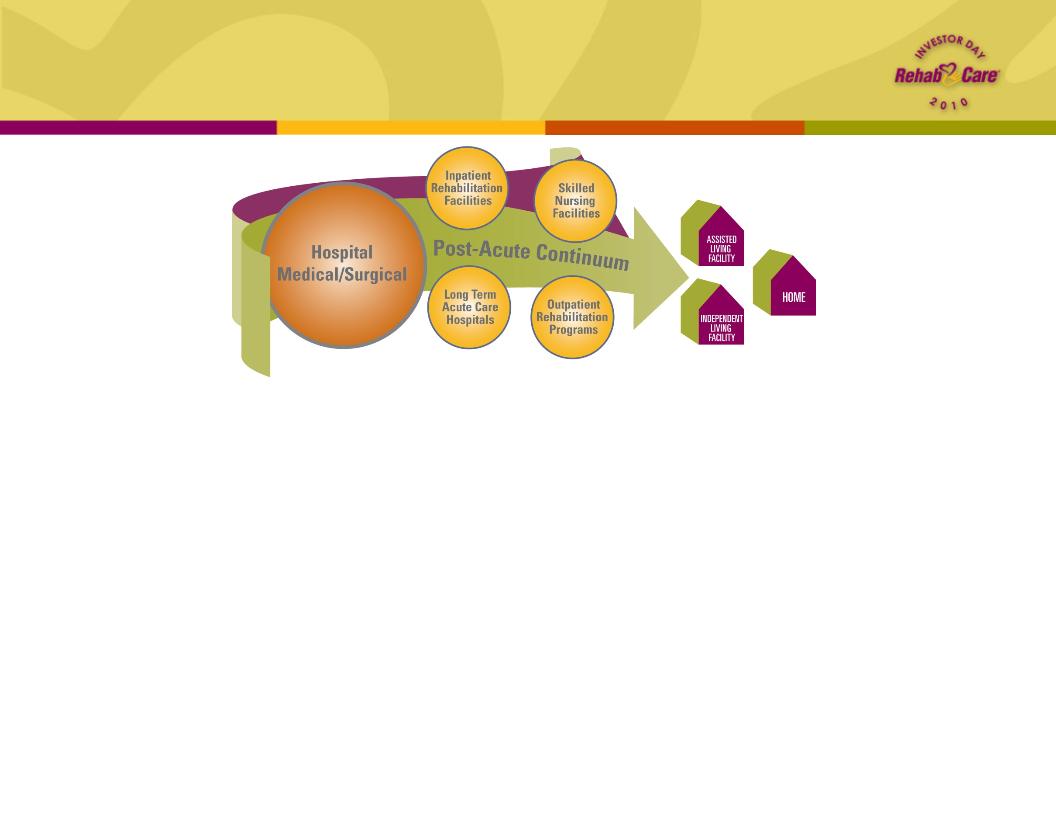
Leverage Continuum Capabilities
43
n Diversity gives us ability to withstand market pressures in any one segment
n Strong positioning in primary venues of post-acute care provides “one-stop
shop” for acute care discharge planners
shop” for acute care discharge planners
n Ensures seamless transition of patients to the right level of care at the right
time, with the best possible outcomes
time, with the best possible outcomes
n Offers flexible solutions to clients and partners and positions RehabCare for
bundled reimbursement
bundled reimbursement
n Provides opportunity to share resources, link referral relationships and
integrate clinical services in markets with significant overlap
integrate clinical services in markets with significant overlap

Market Sector Overlap
Examples
Examples
|
Market Area
|
Skilled Nursing
Rehabilitation Services programs |
Hospital
Rehabilitation Services programs |
Hospitals
|
|
Houston
|
26
|
1 Inpatient
|
11 LTACHs
1 IRF
|
|
Philadelphia
|
13
|
3 Inpatient
1 Skilled Nursing
8 Outpatient
|
2 LTACHs
|
|
Detroit
|
13
|
1 Inpatient
4 Outpatient
|
1 LTACH
|
|
St. Louis
|
99
|
3 Inpatient
|
1 IRF
|
|
Dallas
|
46
|
1 Inpatient
1 Outpatient
|
1 LTACH
1 IRF
|
44

Promote Integration
Through information sharing
Through information sharing
n Customer Relationship Management (CRM) to build and manage client relationships
n Development of Electronic Medical Record (EMR) to build consolidated repository of
clinical data
clinical data
n Human Capital Management (HCM) to integrate processes for building and retaining
workforce
workforce
n Single solution for Back Office operations to unify and standardize
n Application of Google Cloud-Based Technology to minimize capital expenditure
45

Electronic Medical Record
n Facilitates care coordination across settings
and geographic locations, reduces
administrative burden of dueling data sets
and geographic locations, reduces
administrative burden of dueling data sets
n Integrates with or provides EMR structure for
host facility (opportunity to upsell mgt. services)
host facility (opportunity to upsell mgt. services)
n Our point-of-service technology provides
currency of data
currency of data
n Enhances our ability to evaluate patient
appropriateness, provide timely information to
referrers and address care follow-up (i.e.
impact readmissions)
appropriateness, provide timely information to
referrers and address care follow-up (i.e.
impact readmissions)
46
Deploying cloud-based EMR platform to conform to
meaningful use standards; in SRS by end of 2011,
Hospitals by end of 2012
meaningful use standards; in SRS by end of 2011,
Hospitals by end of 2012
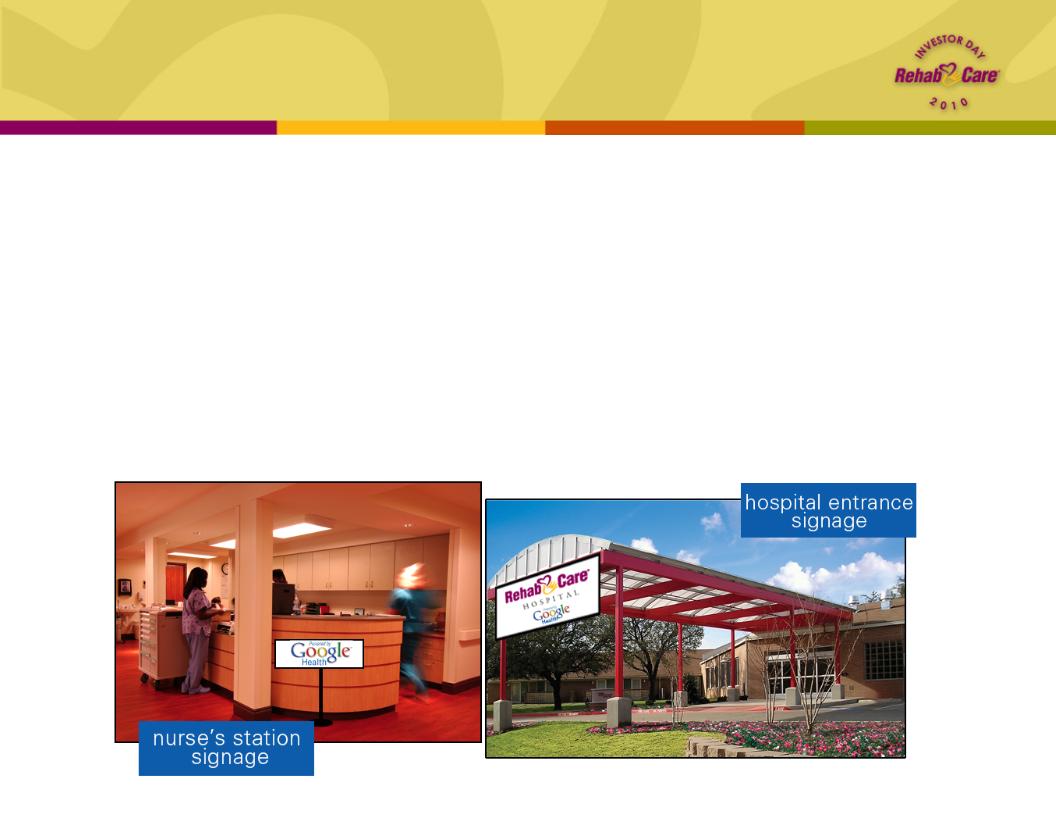
Google PHR
n Working with Google Health on customization of free, cloud-based Personal
Health Record (PHR) to be applied across divisions
Health Record (PHR) to be applied across divisions
n Allows monitoring of patient’s compliance with discharge plan and progress with
recovery goals
recovery goals
n Further engages patient and family in treatment process and teaches patient how
to make healthy lifestyle choices
to make healthy lifestyle choices
n Goal is to ensure optimal outcome post-discharge and prevent readmission
n Added benefit: Google name recognition gives RehabCare greater visibility
47

n Initially targeted at Medicare beneficiaries; demonstration project will determine
what structures and processes work best and where
what structures and processes work best and where
n Shifts away from traditional fee-for-service model
n Providers are rewarded for better care coordination that meets quality of care
indicators and cost savings targets
indicators and cost savings targets
n Provides us opportunity to participate in voluntary ACOs; broadened our product
offerings to include solutions for an ACO model as well as other integrated
delivery systems
offerings to include solutions for an ACO model as well as other integrated
delivery systems
Promote Integration
Under health reform
Under health reform
Shared savings program is established in 2012 for
providers organized as Accountable Care Organizations
(ACOs) that voluntarily meet quality thresholds.
providers organized as Accountable Care Organizations
(ACOs) that voluntarily meet quality thresholds.
48

Promote Integration
Under health reform
Under health reform
n Houston network model
n Utilizing our broad continuum services and system relationships (e.g. Memorial
Hermann) to test post-acute network strategy
Hermann) to test post-acute network strategy
n Beginning in 2011, working to determine components of successful bundling model
to assist CMS in setting national study parameters
to assist CMS in setting national study parameters
n AMRPA Continuing Care Hospital (CCH) project
n Serving on AMRPA (American Medical Rehabilitation Providers Assoc.) committee
that will be developing industry pilot to test CCH model
that will be developing industry pilot to test CCH model
n Would be an amalgam of post-acute care settings (either actual building or virtual
entity) that would be paid on a per-episode basis, which includes full period of stay
plus 30 days post discharge
entity) that would be paid on a per-episode basis, which includes full period of stay
plus 30 days post discharge
n One estimate indicates bundling acute and post-acute services could save $20
billion over 10 years; also eliminates need for complex maze of regulations
billion over 10 years; also eliminates need for complex maze of regulations
In 2013, CMS begins 3-year national pilot project to study
the effectiveness of a bundled payment system.
the effectiveness of a bundled payment system.
49

Safe Harbor
Forward-looking statements have been provided pursuant to the
safe harbor provisions of the Private Securities Litigation Reform
Act of 1995. Such statements are based on the Company’s current
expectations and could be affected by numerous factors, risks and
uncertainties discussed in the Company’s filings with the
Securities and Exchange Commission, including its most recent
report on Form 10-K, subsequent reports on Form 10-Q and current
reports on Form 8-K. Do not rely on forward looking statements as
the Company cannot predict or control many factors that affect its
ability to achieve the results estimated. The Company makes no
promise to update any forward-looking statements whether as a
result of changes in underlying factors, new information, future
events or otherwise.
50