Attached files
| file | filename |
|---|---|
| 8-K - FORM 8-K - Superior Well Services, INC | l39754e8vk.htm |
Exhibit 99.1
| May 2010 Presentation |

| 2 Forward-Looking Statements This presentation includes "forward-looking statements" within the meaning of Section 27A of the Securities Act of 1933, as amended, and Section 21E of the Securities Act of 1934, as amended. All statements, other than statements of historical facts, included in this presentation that address activities, events or developments that Superior expects, believes or anticipates will or may occur in the future are forward-looking statements. These statements are based on certain assumptions made by Superior based on management's experience and perception of historical trends, current conditions, expected future developments and other factors it believes are appropriate in the circumstances. Such statements are subject to a number of assumptions, risks and uncertainties, many of which are beyond Superior's control, which may cause Superior's actual results to differ materially from those implied or expressed by the forward-looking statements. These risks include, but are not limited to: a sustained or further decrease in domestic spending by the oil and natural gas exploration and production industry; a continued decline in or substantial volatility of crude oil and natural gas commodity prices; current weakness in the credit and capital markets and lack of credit availability; overcapacity and competition in our industry; our inability to comply with the financial and other covenants in our debt agreements as a result of reduced revenues and financial performance; unanticipated costs, delays or other difficulties in executing our growth strategy, including difficulties associated with the integration of the Diamondback asset acquisition; the loss of one or more significant customers; the loss of or interruption in operations of one or more key suppliers; and the incurrence of significant costs and liabilities in the future resulting from our failure to comply with new or existing environmental regulations or an accidental release of hazardous substances into the environment. These risks and uncertainties are detailed in Superior's Annual Report on Form 10-K for the year ended December 31, 2009, Superior's Quarterly Reports on Form 10-Q and other reports filed with the Securities and Exchange Commission. Superior undertakes no obligation to publicly update or revise any forward-looking statements. |

| 3 Company Overview Company Overview |

| Leading provider of comprehensive, high- tech Completion services Technical Pumping: stimulation, cementing and nitrogen Down-Hole Surveying: well logging and perforating Rental and Completion: rental tool, completion and production Fluid Logistics services Obtain, transport, store and dispose fluids 4 Company Overview Q1 2010 Revenues Market Data: Market Capitalization $433 MM (05/10/10) Exchange/Ticker NASDAQ: SWSI Shares Outstanding 30.9 MM Daily Volume 419,000 Shares (Apr. Avg.) Insider Ownership 32% |

| 5 Investment Highlights Leading U.S. Pressure Pumping Company 430,000 HP of pumping capacity Substantial exposure to Marcellus, Haynesville, Bakken and Barnett shale plays Technical fluids expertise One of the Youngest Fleets in the Industry 98% net capacity added since 2003 Lower operating costs and maintenance associated with newer fleet Higher reliability is a differentiator to customers High-Margin Technical Fluids / Pumping Expertise Basin-specific technical / sales teams enable unique, tailored solutions for customers Operational Durability Geographic diversification and broad service line Large customer list, including leading E&P companies Experienced and Incentivized Management Team has managed through multiple down cycles in the industry Considerable expertise in technologies, sales, operations and service Management team owns approximately 10% of the shares outstanding |
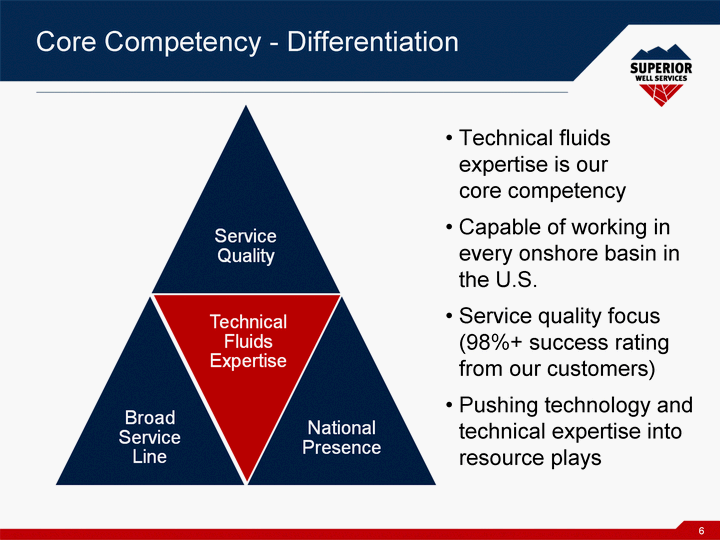
| 6 Core Competency - Differentiation Technical fluids expertise is our core competency Capable of working in every onshore basin in the U.S. Service quality focus (98%+ success rating from our customers) Pushing technology and technical expertise into resource plays |

| Located in High-Growth Basins 7 Service centers located in nearly all major U.S. basins Leadership in the Marcellus Significant presence in other unconventional plays including Haynesville, Bakken, Woodford and Barnett [] |

| 8 Competitive Landscape Source: Spears & Associates. (Thousands of Horsepower) Superior has one of the youngest fleets in North America Following BHI's acquisition of BJS, Superior has the largest fleet of any "independent" U.S. based public pressure pumper North American Pressure Pumping Capacity |

| 9 Technology Leadership Technology Leadership Technology Investments Provide Competitive Differentiation Labs to assure cement blend quality Labs in Marcellus, Haynesville, Bossier, Anadarko and Woodford shale plays New cross-linked gel fluids for use in deep, high temperature plays Patents on chemistry relating to fracturing fluids Award winning GammaFRacTM Slickwater system re-uses 25 to 50% of flowback water Utilizes Award Winning WFR-3BTM Slickwater System Significant interest in Marcellus and Haynesville Increases reserve potential by strategically targeting discrete pay intervals |
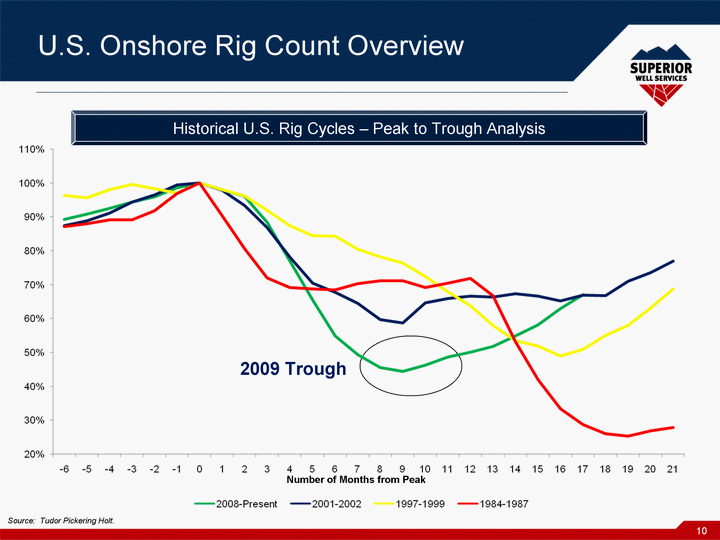
| 10 U.S. Onshore Rig Count Overview Number of Months from Peak Source: Tudor Pickering Holt. Historical U.S. Rig Cycles - Peak to Trough Analysis 2009 Trough |
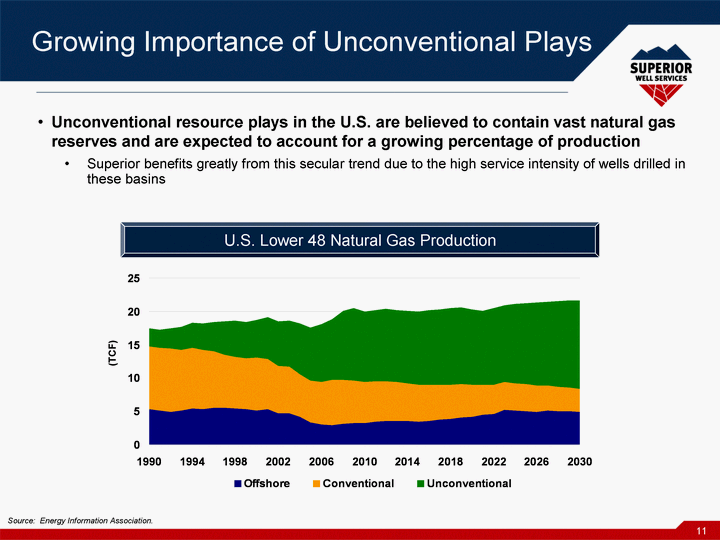
| Unconventional resource plays in the U.S. are believed to contain vast natural gas reserves and are expected to account for a growing percentage of production Superior benefits greatly from this secular trend due to the high service intensity of wells drilled in these basins 11 Source: Energy Information Association. (TCF) Growing Importance of Unconventional Plays U.S. Lower 48 Natural Gas Production |

| Superior has developed a significant presence in all of the prolific North American unconventional resource plays 12 North American Unconventional Plays |

| 13 Operations Overview |

| 14 Cementing - Technical Pumping Cementing is critical for protecting fresh water zones and isolating productive zones 3 to 6 member crews 314 cement trucks Created cement testing lab 2006 Up to 14,400 feet and 370oF Exploration and initial drilling Production Completion timeline of standard well Surface Cementing Cementing 10% % Revenue (3/31/10 Q) Target Zone Cementing |

| 15 Logging - Down-Hole Surveying Open-hole logging for identifying target zone characteristics 2 to 4 member crews 30 logging trucks Exploration and initial drilling Production Completion timeline of standard well Surface Cementing Target Zone Cementing Logging % Revenue (3/31/10 Q) Cementing 10% |

| 16 Perforating - Down-Hole Surveying Cased-hole perforating services use explosives to penetrate the producing zones 86 perforating trucks and cranes Up to 17,000 feet and 6,000 psi Exploration and initial drilling Production Completion timeline of standard well Surface Cementing Target Zone Cementing Logging Perforating Cementing 10% % Revenue (3/31/10 Q) Logging and Perforating 5% |

| 17 Nitrogen - Technical Pumping Foam-based nitrogen stimulation for CBM, shales, tight gas sands, and low-pressure reservoirs 2 to 8 member crews 53 nitrogen pump trucks 40 nitrogen transport vehicles Exploration and initial drilling Production Completion timeline of standard well Surface Cementing Target Zone Cementing Logging Perforating Nitrogen Cementing 10% Logging and Perforating 5% Nitrogen 4% % Revenue (3/31/10 Q) |

| 18 Stimulation Stimulation & Completion - Technical Pumping Fracturing and acidizing for increasing flow of oil and gas from producing zones Specialized equipment 6 to 30 member crews 1,221 vehicles (high-tech pump trucks, blenders and frac vans) Exploration and initial drilling Production Completion timeline of standard well Surface Cementing Target Zone Cementing Logging Perforating Nitrogen % Revenue (3/31/10 Q) Stimulation 75% Nitrogen 4% Logging and Perforating 5% Cementing 10% |
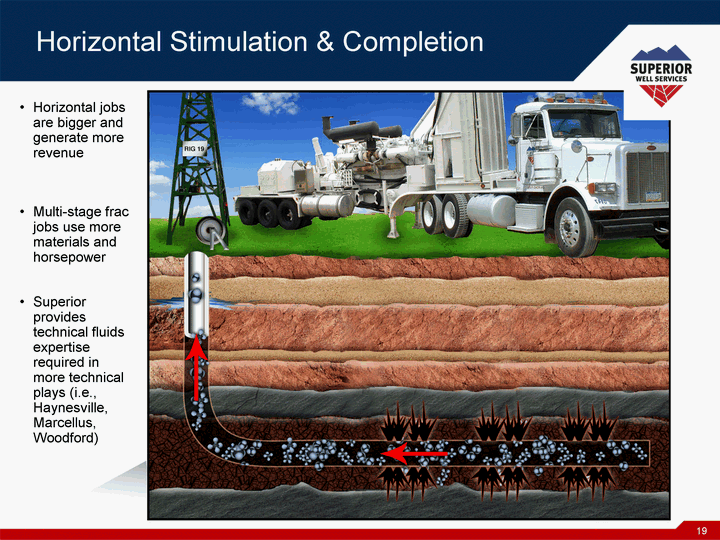
| Horizontal Stimulation & Completion Horizontal jobs are bigger and generate more revenue Multi-stage frac jobs use more materials and horsepower Superior provides technical fluids expertise required in more technical plays (i.e., Haynesville, Marcellus, Woodford) 19 |

| Fluid Logistics Added in connection with the Diamondback asset acquisition 4% of Q1 2010 revenue Three service centers (one in Texas, two in Oklahoma) More than 100 fluid hauling transports and trucks Approximately 400 frac tanks (mostly 2004 to 2007 vintage) Six disposal wells (four in Texas, two in Oklahoma) 20 |
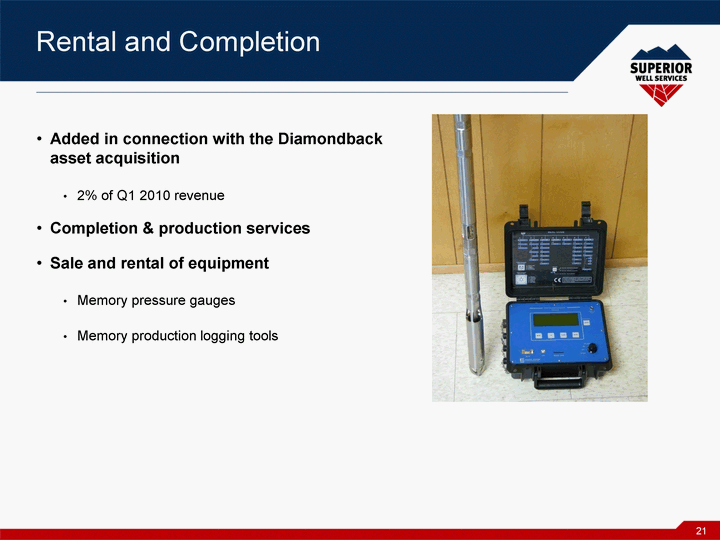
| Rental and Completion Added in connection with the Diamondback asset acquisition 2% of Q1 2010 revenue Completion & production services Sale and rental of equipment Memory pressure gauges Memory production logging tools 21 |

| 22 Financial Overview |
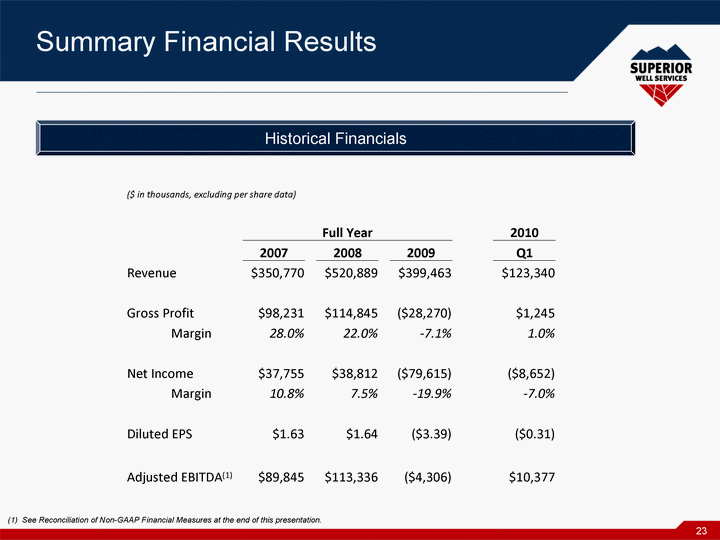
| 23 Summary Financial Results (1) See Reconciliation of Non-GAAP Financial Measures at the end of this presentation. Historical Financials ($ in thousands, excluding per share data) ($ in thousands, excluding per share data) ($ in thousands, excluding per share data) ($ in thousands, excluding per share data) ($ in thousands, excluding per share data) ($ in thousands, excluding per share data) Full Year Full Year Full Year Full Year Full Year 2010 2007 2008 2009 Q1 Revenue Revenue $350,770 $520,889 $399,463 $123,340 Gross Profit Gross Profit $98,231 $114,845 ($28,270) $1,245 Margin 28.0% 22.0% -7.1% 1.0% Net Income Net Income $37,755 $38,812 ($79,615) ($8,652) Margin 10.8% 7.5% -19.9% -7.0% Diluted EPS Diluted EPS $1.63 $1.64 ($3.39) ($0.31) Adjusted EBITDA(1) Adjusted EBITDA(1) Adjusted EBITDA(1) $89,845 $113,336 ($4,306) $10,377 |
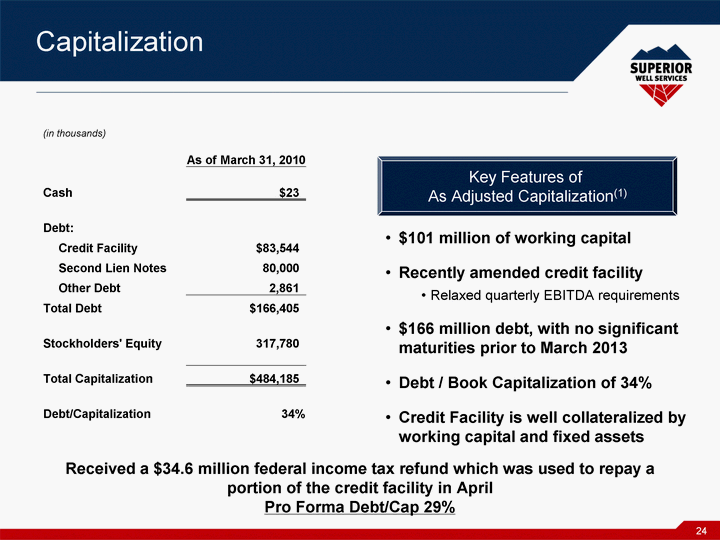
| 24 Capitalization $101 million of working capital Recently amended credit facility Relaxed quarterly EBITDA requirements $166 million debt, with no significant maturities prior to March 2013 Debt / Book Capitalization of 34% Credit Facility is well collateralized by working capital and fixed assets Key Features of As Adjusted Capitalization(1) (in thousands) (in thousands) (in thousands) As of March 31, 2010 Cash Cash $23 Debt: Debt: Credit Facility Credit Facility $83,544 Second Lien Notes Second Lien Notes 80,000 Other Debt Other Debt 2,861 Total Debt Total Debt $166,405 Stockholders' Equity Stockholders' Equity Stockholders' Equity 317,780 Total Capitalization Total Capitalization Total Capitalization $484,185 Debt/Capitalization Debt/Capitalization Debt/Capitalization 34% Received a $34.6 million federal income tax refund which was used to repay a portion of the credit facility in April Pro Forma Debt/Cap 29% |
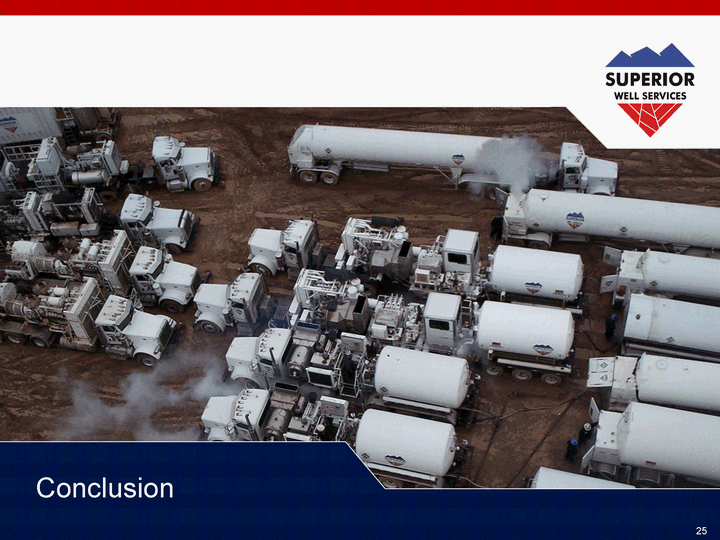
| 25 Conclusion |
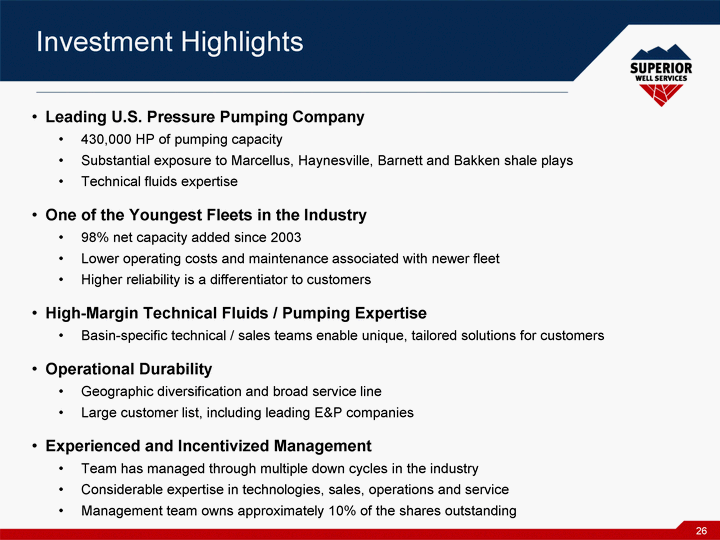
| 26 Investment Highlights Leading U.S. Pressure Pumping Company 430,000 HP of pumping capacity Substantial exposure to Marcellus, Haynesville, Barnett and Bakken shale plays Technical fluids expertise One of the Youngest Fleets in the Industry 98% net capacity added since 2003 Lower operating costs and maintenance associated with newer fleet Higher reliability is a differentiator to customers High-Margin Technical Fluids / Pumping Expertise Basin-specific technical / sales teams enable unique, tailored solutions for customers Operational Durability Geographic diversification and broad service line Large customer list, including leading E&P companies Experienced and Incentivized Management Team has managed through multiple down cycles in the industry Considerable expertise in technologies, sales, operations and service Management team owns approximately 10% of the shares outstanding |

| 27 Appendix |
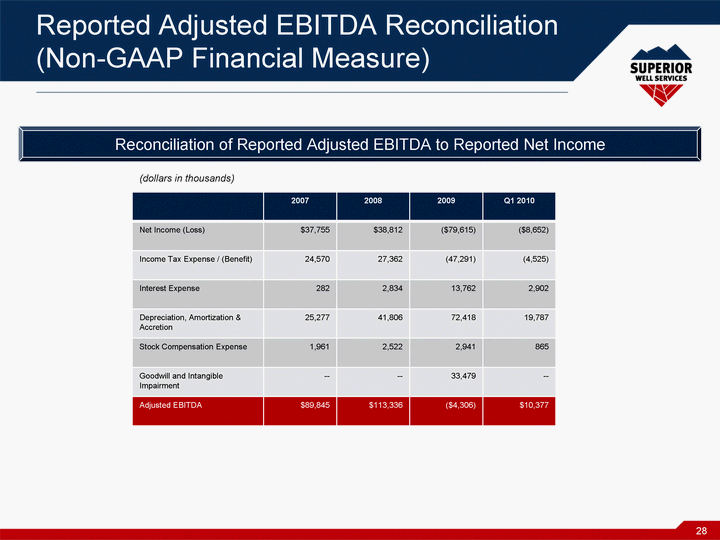
| 28 Reported Adjusted EBITDA Reconciliation (Non-GAAP Financial Measure) 2007 2008 2009 Q1 2010 Net Income (Loss) $37,755 $38,812 ($79,615) ($8,652) Income Tax Expense / (Benefit) 24,570 27,362 (47,291) (4,525) Interest Expense 282 2,834 13,762 2,902 Depreciation, Amortization & Accretion 25,277 41,806 72,418 19,787 Stock Compensation Expense 1,961 2,522 2,941 865 Goodwill and Intangible Impairment -- -- 33,479 -- Adjusted EBITDA $89,845 $113,336 ($4,306) $10,377 (dollars in thousands) Reconciliation of Reported Adjusted EBITDA to Reported Net Income |
