Attached files
| file | filename |
|---|---|
| 8-K - FORM 8-K - MEDCO HEALTH SOLUTIONS INC | c00951e8vk.htm |
Exhibit 99.1

| 1 1 It's what we do. It's who we are. It's in our DNA. Bank of America - Merrill Lynch Healthcare Conference May 13, 2010 David B. Snow, Jr. Chairman and CEO |
| 2 Forward-Looking Statements This presentation contains "forward-looking statements" as that term is defined in the Private Securities Litigation Reform Act of 1995. These statements involve risks and uncertainties that may cause results to differ materially from those set forth in the statements. No forward-looking statement can be guaranteed, and actual results may differ materially from those projected. We undertake no obligation to publicly update any forward-looking statement, whether as a result of new information, future events or otherwise. The forward-looking statements are not historical facts, but rather are based on current expectations, estimates, assumptions and projections about the business and future financial results of the pharmacy benefit management ("PBM") and specialty pharmacy industries, and other legal, regulatory and economic developments. We use words such as "anticipates," "believes," "plans," "expects," "projects," "future," "intends," "may," "will," "should," "could," "estimates," "predicts," "potential," "continue," "guidance" and similar expressions to identify these forward-looking statements. Medco's actual results could differ materially from the results contemplated by these forward-looking statements due to a number of factors. Forward-looking statements in this presentation should be evaluated together with the risks and uncertainties that affect our business, particularly those mentioned in the Risk Factors section of the Company's Annual Report on Form 10-K, Quarterly Reports on Form 10-Q and other documents filed from time to time with the Securities and Exchange Commission. |

| 3 Who is Medco Ranked #35 on the 2010 Fortune 100 List Largest PBM Measured by Drug Spend Leading Specialty Pharmacy Largest Mail-Order Pharmacies in the World Leader in Clinical Innovation 2009 Revenues of $59.8 B ~65 Million Members Accredo Health Group 2009 Revenues of $9.5 B State-of-the-Art Automated Dispensing Facilities Medco Therapeutic Resource Centers(r) Personalized Medicine |

| 4 Financial Strategy New Business Mail Order Generics Specialty Pharmacy Medicare Clinical Innovations TRCs & Pharmacogenomics Medco Health Store(tm)/OTC International e-Prescribing Biosimilars Medco: A Portfolio of Drivers Shareholder Value Smarter Medicine Comparative Effectiveness |
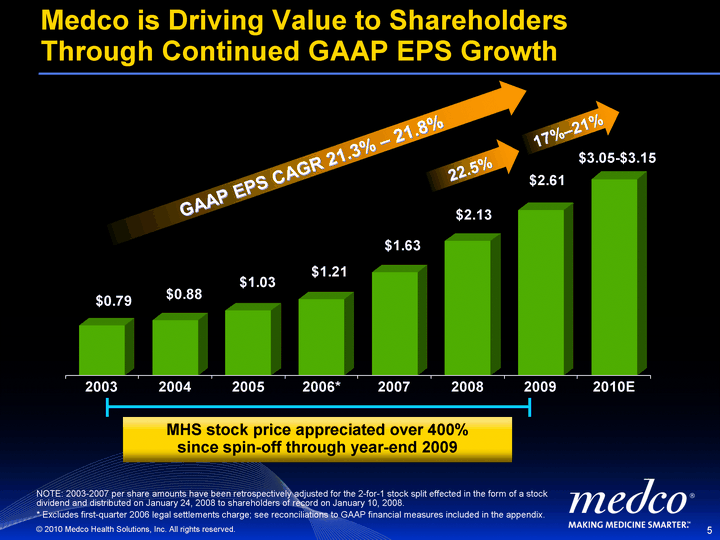
| 5 2003 2004 2005 2006* 2007 2008 2009 2010E GAAP EPS 0.79 0.88 1.03 1.21 1.63 2.13 2.61 3.1 Medco is Driving Value to Shareholders Through Continued GAAP EPS Growth NOTE: 2003-2007 per share amounts have been retrospectively adjusted for the 2-for-1 stock split effected in the form of a stock dividend and distributed on January 24, 2008 to shareholders of record on January 10, 2008. * Excludes first-quarter 2006 legal settlements charge; see reconciliations to GAAP financial measures included in the appendix. GAAP EPS CAGR 21.3% - 21.8% 22.5% 17%-21% MHS stock price appreciated over 400% since spin-off through year-end 2009 |
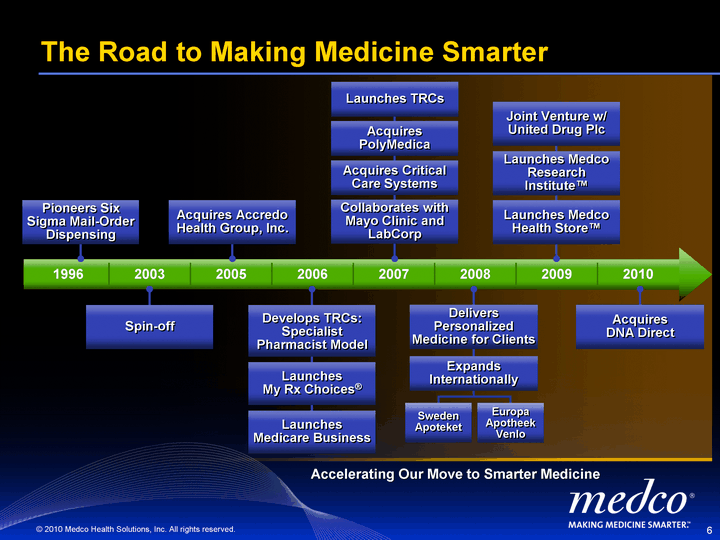
| 6 Accelerating Our Move to Smarter Medicine 1996 2003 2005 2006 2007 2008 2009 2010 The Road to Making Medicine Smarter Pioneers Six Sigma Mail-Order Dispensing Spin-off Acquires Accredo Health Group, Inc. Collaborates with Mayo Clinic and LabCorp Acquires Critical Care Systems Acquires PolyMedica Launches TRCs Europa Apotheek Venlo Sweden Apoteket Expands Internationally Delivers Personalized Medicine for Clients Develops TRCs: Specialist Pharmacist Model Launches My Rx Choices(r) Launches Medicare Business Launches Medco Health Store(tm) Launches Medco Research Institute(tm) Joint Venture w/ United Drug Plc Acquires DNA Direct |
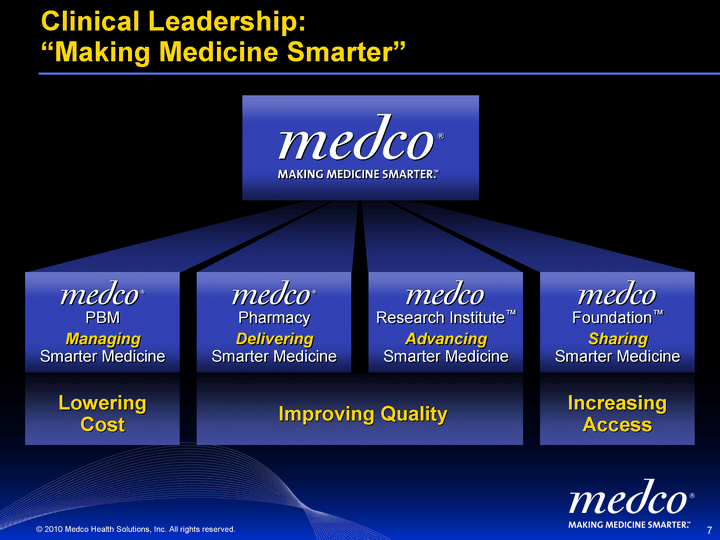
| 7 Clinical Leadership: "Making Medicine Smarter" PBM Managing Smarter Medicine Pharmacy Delivering Smarter Medicine Research Institute(tm) Advancing Smarter Medicine Foundation(tm) Sharing Smarter Medicine Improving Quality Lowering Cost Increasing Access |

| 8 The Case for Smarter Medicine: Getting Granular Poor Management of Chronic and Complex Diseases Can Lead to $350 Billion of Excess Total Healthcare Costs3 1. Medco Research 2. Center for Disease Control 3. Medco estimate 50% of US Population1 96% of drug costs in the US1 75% of medical expenses in the US2 For 88% of chronic and complex diseases, drugs are a first choice for medical intervention1 Chronic & Complex Diseases Represent: Non-compliance: up to 50% non-compliance rates after one year of therapy are not uncommon in many of the key disease categories Omissions in care: 33% of patients experienced an omission in therapy gap1 Instability of a Chronic or Complex Patient is Most Often Tied to Gaps-in-Care |

| 9 Clinical Trials Efficacy Ability of drug to work in ideal patients under ideal practice conditions Under clinical trial conditions, only a 10% drop in persistence is experienced after 5.4 years1 TRCs + Pharmacogenomics Drives Real World Medicine to a Smarter Place Persistence 1. Lancet 1994 Nov 19;344(8934):1383-9. Randomised study of cholesterol lowering in 4444 patients with coronary heart disease: the Scandinavian Simvastatin Survival Study (4S). Example: Cholesterol Time |
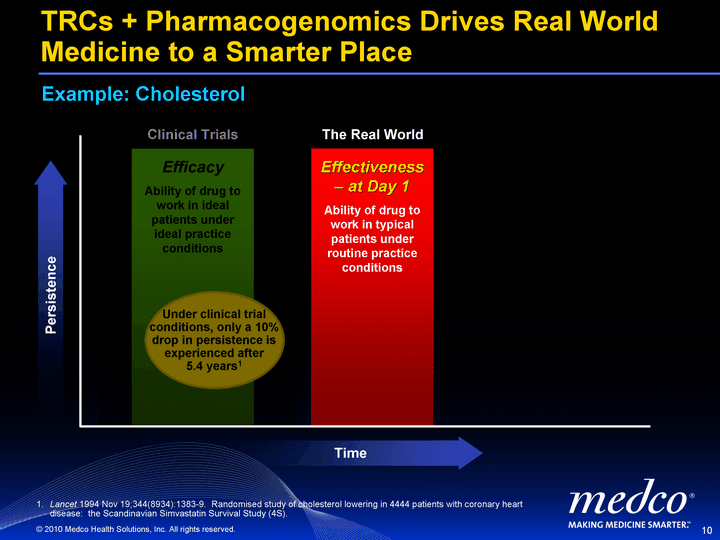
| 10 Clinical Trials Efficacy Ability of drug to work in ideal patients under ideal practice conditions Under clinical trial conditions, only a 10% drop in persistence is experienced after 5.4 years1 TRCs + Pharmacogenomics Drives Real World Medicine to a Smarter Place Persistence The Real World Effectiveness - at Day 1 Ability of drug to work in typical patients under routine practice conditions 1. Lancet 1994 Nov 19;344(8934):1383-9. Randomised study of cholesterol lowering in 4444 patients with coronary heart disease: the Scandinavian Simvastatin Survival Study (4S). Example: Cholesterol Time |
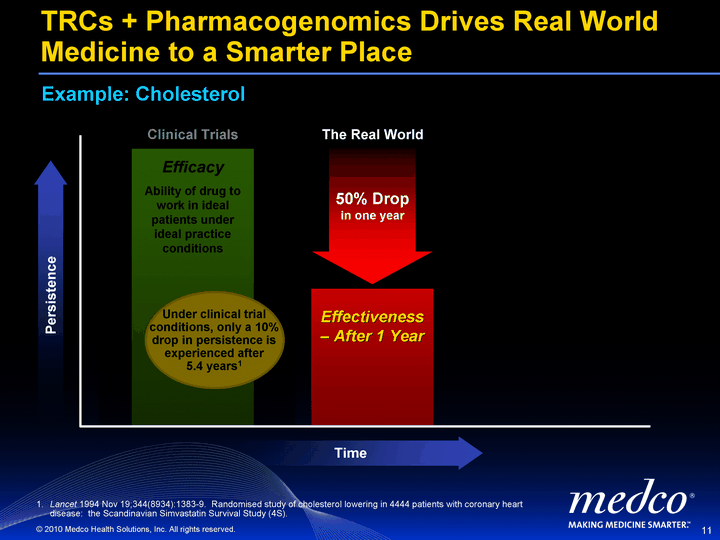
| 11 Clinical Trials Efficacy Ability of drug to work in ideal patients under ideal practice conditions Under clinical trial conditions, only a 10% drop in persistence is experienced after 5.4 years1 TRCs + Pharmacogenomics Drives Real World Medicine to a Smarter Place Persistence The Real World Effectiveness - at Day 1 Ability of drug to work in typical patients under routine practice conditions Effectiveness - After 1 Year 1. Lancet 1994 Nov 19;344(8934):1383-9. Randomised study of cholesterol lowering in 4444 patients with coronary heart disease: the Scandinavian Simvastatin Survival Study (4S). Example: Cholesterol Time 50% Drop in one year |
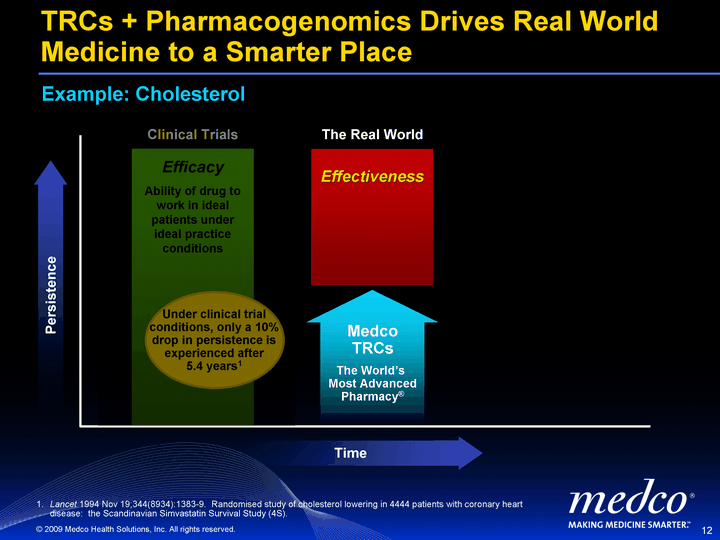
| 12 Persistence 50% Drop in one year Medco TRCs The World's Most Advanced Pharmacy(r) Effectiveness Clinical Trials Efficacy Ability of drug to work in ideal patients under ideal practice conditions Under clinical trial conditions, only a 10% drop in persistence is experienced after 5.4 years1 The Real World TRCs + Pharmacogenomics Drives Real World Medicine to a Smarter Place Example: Cholesterol Time (c) 2009 Medco Health Solutions, Inc. All rights reserved. 1. Lancet 1994 Nov 19;344(8934):1383-9. Randomised study of cholesterol lowering in 4444 patients with coronary heart disease: the Scandinavian Simvastatin Survival Study (4S). Practice of Precision Medicine |
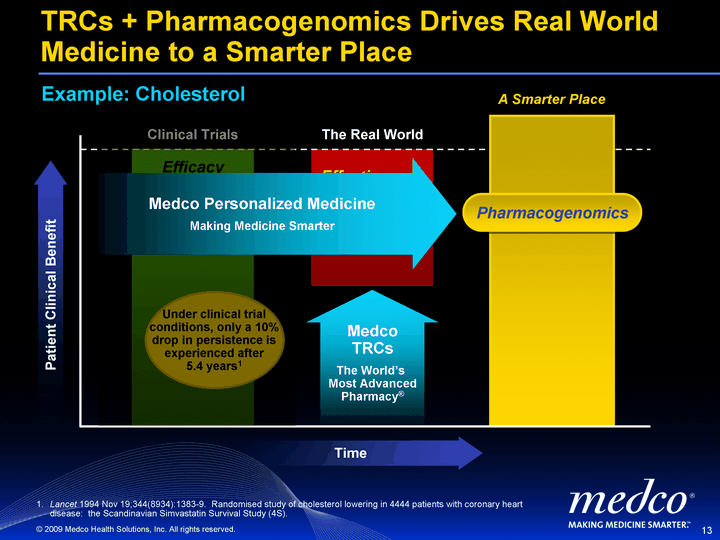
| 13 Patient Clinical Benefit Medco TRCs The World's Most Advanced Pharmacy(r) Effectiveness Clinical Trials Efficacy Ability of drug to work in ideal patients under ideal practice conditions Under clinical trial conditions, only a 10% drop in persistence is experienced after 5.4 years1 The Real World TRCs + Pharmacogenomics Drives Real World Medicine to a Smarter Place Example: Cholesterol Time (c) 2009 Medco Health Solutions, Inc. All rights reserved. 1. Lancet 1994 Nov 19;344(8934):1383-9. Randomised study of cholesterol lowering in 4444 patients with coronary heart disease: the Scandinavian Simvastatin Survival Study (4S). Practice of Precision Medicine A Smarter Place Pharmacogenomics Medco Personalized Medicine Making Medicine Smarter |
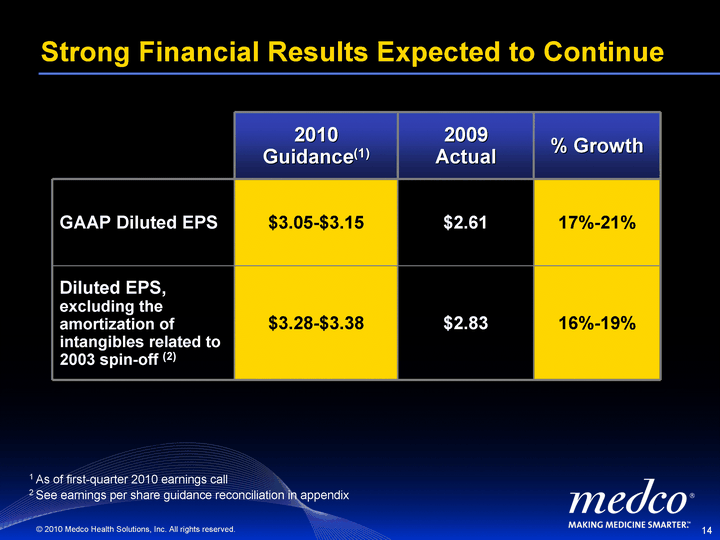
| 14 Strong Financial Results Expected to Continue 2010 Guidance(1) 2009 Actual % Growth GAAP Diluted EPS $3.05-$3.15 $2.61 17%-21% Diluted EPS, excluding the amortization of intangibles related to 2003 spin-off (2) $3.28-$3.38 $2.83 16%-19% 1 As of first-quarter 2010 earnings call 2 See earnings per share guidance reconciliation in appendix |

| 15 |
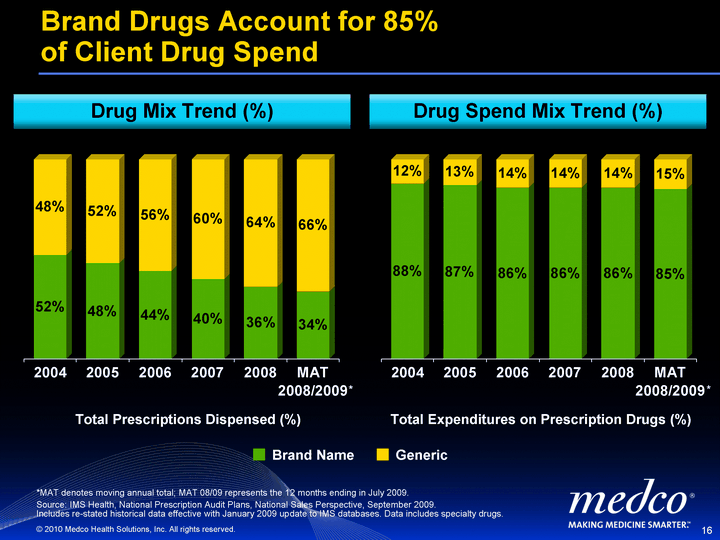
| 16 Drug Mix Trend (%) Brand Drugs Account for 85% of Client Drug Spend Brand Name Generic Total Prescriptions Dispensed (%) 2004 0.52 0.48 2005 0.48 0.52 2006 0.44 0.56 2007 0.4 0.6 2008 0.36 0.64 MAT 2008/2009 0.34 0.66 2004 0.88 0.12 2005 0.87 0.13 2006 0.86 0.14 2007 0.86 0.14 2008 0.86 0.14 MAT 2008/2009 0.85 0.15 Total Expenditures on Prescription Drugs (%) * * *MAT denotes moving annual total; MAT 08/09 represents the 12 months ending in July 2009. Source: IMS Health, National Prescription Audit Plans, National Sales Perspective, September 2009. Includes re-stated historical data effective with January 2009 update to IMS databases. Data includes specialty drugs. Drug Spend Mix Trend (%) |
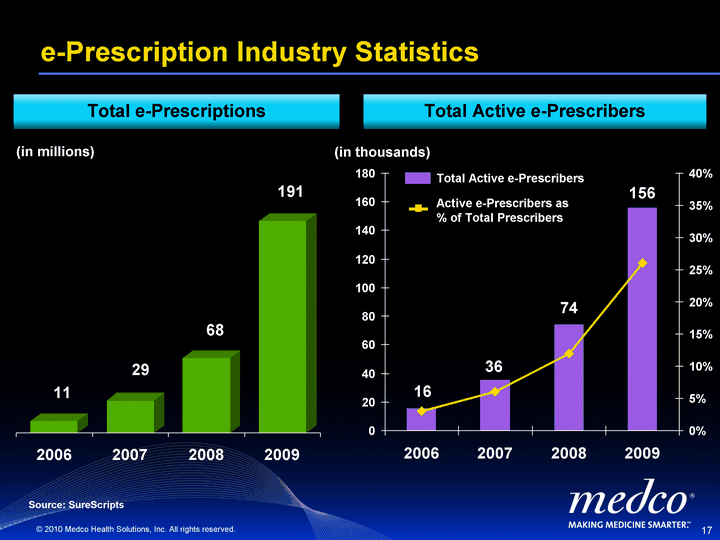
| 17 2006 2007 2008 2009 Acute e-Rx's 10949896 29447150 67749689 191000000 e-Prescription Industry Statistics 2006 2007 2008 2009 Active e-Prescribers 15.868 35.597 74.487 155.917 Active e-Prescribers as % of Total 0.03 0.06 0.12 0.26 Total e-Prescriptions Total Active e-Prescribers (in millions) Source: SureScripts 11 68 29 191 Total Active e-Prescribers Active e-Prescribers as % of Total Prescribers (in thousands) 16 36 74 156 |
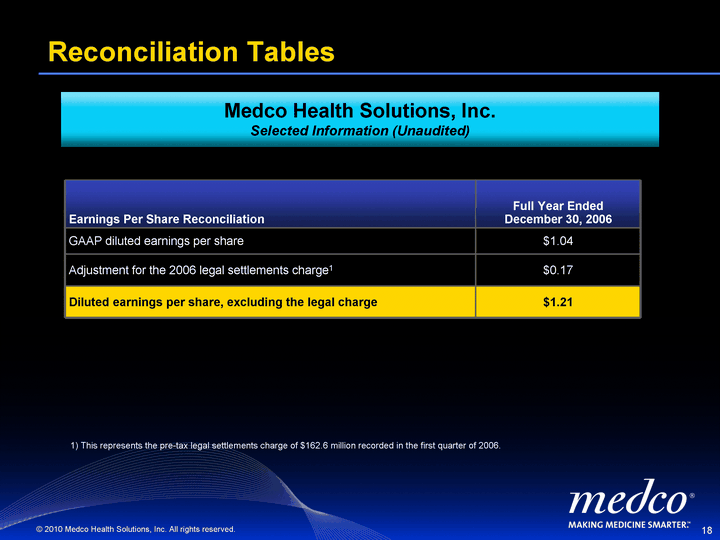
| 18 Reconciliation Tables Earnings Per Share Reconciliation Full Year Ended December 30, 2006 GAAP diluted earnings per share $1.04 Adjustment for the 2006 legal settlements charge1 $0.17 Diluted earnings per share, excluding the legal charge $1.21 1) This represents the pre-tax legal settlements charge of $162.6 million recorded in the first quarter of 2006. Medco Health Solutions, Inc. Selected Information (Unaudited) |

| 19 Reconciliation Tables Full Year Ended December 26, 2009 Estimated Full Year Ended December 25, 2010 Estimated Full Year Ended December 25, 2010 Earnings Per Share Guidance Reconciliation Actual Low End High End GAAP diluted earnings per share $2.61 $3.05 $3.15 Adjustment for the amortization of intangible assets(1) 0.22 0.23 0.23 Diluted earnings per share, excluding intangible amortization $2.83 $3.28 $3.38 GAAP diluted earnings per share growth over prior year 17% 21% Diluted earnings per share growth over prior year, excluding intangible amortization 16% 19% 1) This adjustment represents the per share effect of the intangible amortization from the 2003 spin-off, when Medco became a publicly traded company. Medco Health Solutions, Inc. Selected Information (Unaudited) |
