Attached files
| file | filename |
|---|---|
| 8-K - FORM 8-K - DORCHESTER MINERALS, L.P. | d8k.htm |
 Dorchester Minerals, LP
1
Dorchester Minerals, LP
Annual Meeting
May 12, 2010
Exhibit 99.1 |
 Dorchester Minerals, LP
2
Forward-Looking Statements
•
Portions of this document may constitute "forward-looking
statements" as defined by federal law. Such statements are
subject to certain risks, uncertainties and assumptions.
Should one or more of these risks or uncertainties
materialize, or should underlying assumptions prove
incorrect, actual results may vary materially from those
anticipated, estimated or projected. Examples of such
uncertainties and risk factors include, but are not limited to,
changes in the price or demand for oil and natural gas,
changes in the operations on or development of the
Partnership’s properties, changes in economic and industry
conditions and changes in regulatory requirements (including
changes in environmental requirements) and the
Partnership’s consolidated financial position, business
strategy and other plans and objectives for future operations.
These and other factors are set forth in the Partnership's
filings with the Securities and Exchange Commission.
|
 Dorchester Minerals, LP
3
•
Overview of 2009
–
Distributions and Financial Results
–
Production and Reserves
–
Peer Group Analysis
–
Royalty Cash Receipts
•
Maecenas Minerals Acquisition
•
Property Highlights
–
Portfolio Overview
–
Royalty Properties
–
Net Profits Interests
•
Developing Plays
Presentation Outline |
 Dorchester Minerals, LP
4
Overview of 2009 Results |
 Dorchester Minerals, LP
5
2009 Distributions
Royalty
Revenue
$37.3 MM
Total Revenue
$50.2 MM
Other
Revenue
$0.9 MM
NPI
Revenue
$12.0 MM
LP
Distribution
$43.3 MM
GP
Distribution
$1.4 MM
Total
Expenses
$5.5 MM
•
Cash Distributions Paid in Calendar 2009
–
Reflects Q4 2008 to Q3 2009 activity |
 Dorchester Minerals, LP
6
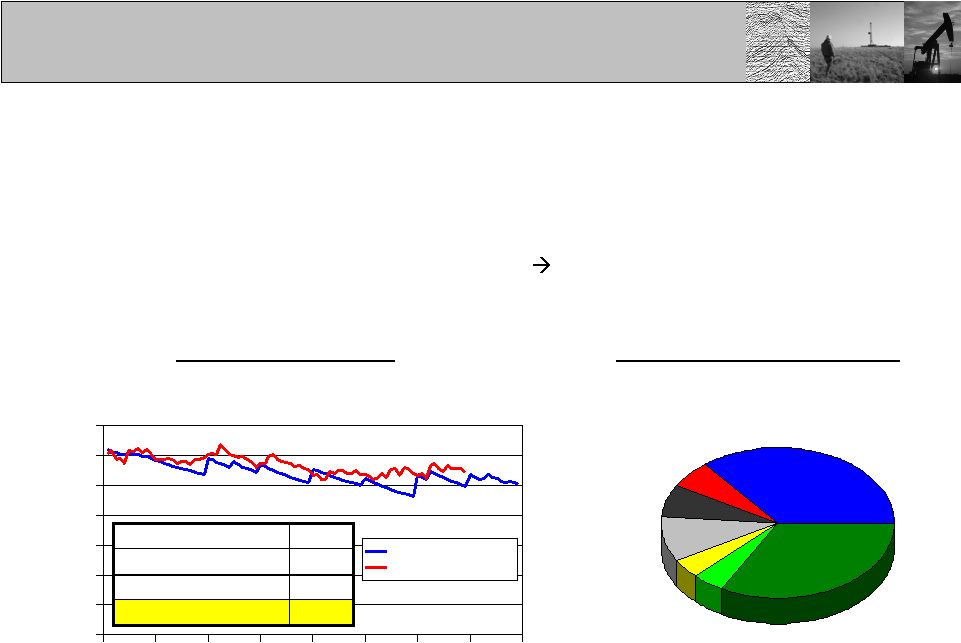
2009 Financial Results
$49.2
$56.8
$79.8
$74.9
$65.4
Operating Revenue ($MM)
Gas Price ($/Mcf)
Distributions ($/unit)
•
Revenue –
Price –
Distributions
–
Royalty properties contributed 77% to total operating revenues
–
Gross Revenue
63% gas sales, 36% oil sales, 1% other revenue
–
NPI and lease bonuses have become a smaller portion of revenues
$89.9
$43.6
Note: Gross Revenue does not reflect production costs or other expenses
incorporated in calculating the net profits interest payments to LP distributions
$0
$20
$40
$60
$80
$100
2003
2004
2005
2006
2007
2008
2009
$0.00
$2.00
$4.00
$6.00
$8.00
$10.00
Royalties
NPI
Lease Bonus
Gas Price ($/Mcf)
2003
2004
2005
2006
2007
2008
2009
$0.00
$1.00
$2.00
$3.00
$4.00
$5.00
Distributions
Gas Price ($/Mcf) |
 Dorchester Minerals, LP
7
2009 Production Overview
Geographic Breakdown
Fayetteville
Shale (RI)
4%
Mid-Continent
(Other)
6%
West TX/
SE NM
7%
Gulf Coast/
South TX
10%
Miscellaneous
33%
Mid-Continent
(Hugoton NPI)
36%
Daily Production (MMcfepd)
1.6%
Annualized Decline
10.5%
Decline Since Inception
1.4%
3-year Decline Rate
(1.2%)
1-year Decline Rate
Production Profile
•
Total Production of 10.33 Bcfe
–
82% of total production was natural gas, 18% oil and condensate
–
High quality properties + Diverse portfolio
Low decline rate
–
Year-over-year production rate increased 1.2%
Note: Total production on wellhead basis, daily production on sales basis,
gas-oil equivalency based on 6:1 ratio Barnett
Shale
4%
0
5,000
10,000
15,000
20,000
25,000
30,000
35,000
2003
2004
2005
2006
2007
2008
2009
2010
2011
Forecasted Prod.
Actual Prod. |
 Dorchester Minerals, LP
8
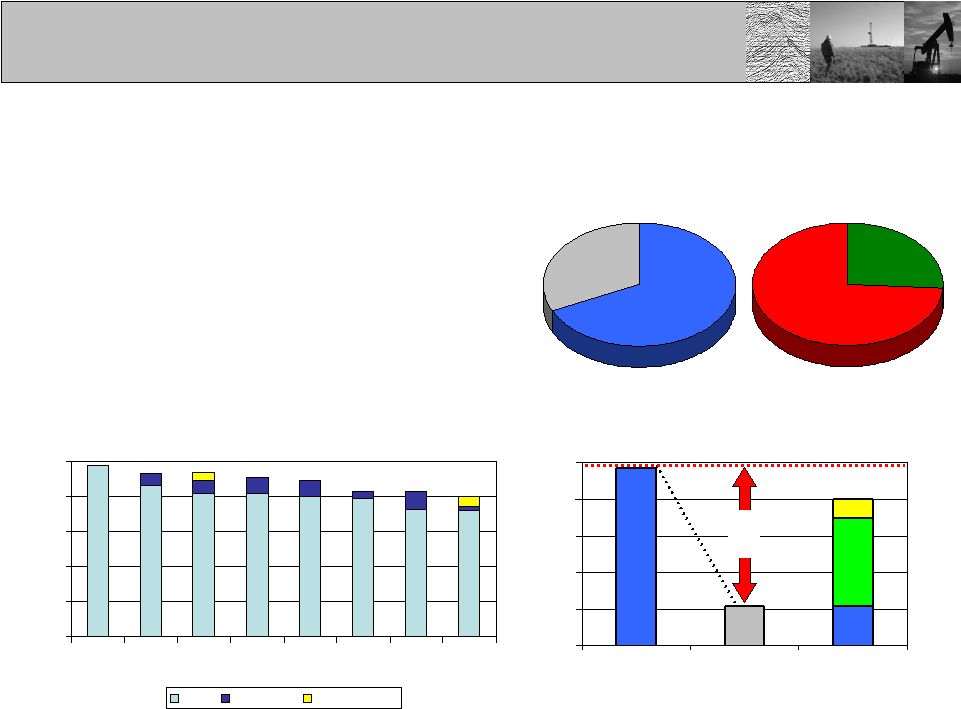
2009 Reserves Overview
•
Total Proved Reserves of 79.9 Bcfe
on 12/31/09
Gas &
NGL
75%
Oil
25%
NPI
32%
Royalty
68%
Year-end Reserves (Bcfe)
0
20
40
60
80
100
Actual
01/31/2003
Projected
12/31/2009
Actual
12/31/2009
79.9
97.0
21.5
Cumulative Reserve Revisions (Bcfe)
2003-2009
Production
(75.5 Bcfe)
–
All reported reserves are Proved Developed
–
Demonstrated history of positive revisions
–
Revisions and acquisitions account
for
73% of current reserves
–
Driven by new plays, field
extensions,
infill drilling, new technology, etc.
–
2.8% of reserves from Fayetteville Shale (RI only)
Reserve
Revisions
(48.0 Bcfe)
Reserve
Acquisitions
(10.4 Bcfe)
Reserve
Base
(21.5 Bcfe)
Note: 10.4 Bcf
of acquired reserves at time transactions closed.
0
20
40
60
80
100
'Feb
2003
2003
2004
2005
2006
2007
2008
2009
Base
Revisions
Acquisitions |
 Dorchester Minerals, LP
9
Peer Group Comparison
30
40
50
60
70
80
90
100
110
120
2003
2004
2005
2006
2007
2008
2009
Normalized Reserves (Indexed to 2003)
30
40
50
60
70
80
90
100
110
120
2003
2004
2005
2006
2007
2008
2009
Normalized Production (Indexed to 2003)
•
Reserves and Production Performance
–
DMLP is a cross between a royalty trust with 100% net profits interests (SJT) and
one with 100% royalties (SBR), plus the upside of a large non-producing
mineral portfolio with potential for future drilling and development
–
DMLP has the ability to expand its portfolio of assets through acquisitions
DMLP
HGT
SJT
PBT
MTR
CRT
SBR
Source: SEC 10-K filings |
 Dorchester Minerals, LP
10
Peer Group Comparison
80
90
100
110
120
130
140
150
160
Jan
Feb
Mar
Apr
YTD 2010 Normalized Returns (reinvested)
0
100
200
300
400
500
600
700
2003
2004
2005
2006
2007
2008
2009
2010
2003-2009 Normalized Returns (reinvested)
•
Market Performance
–
Pure
royalties
lack
operating
leverage
inherent
in
net
profits
interests
Less
volatility
•
Underperforming in high price environment (mid-2008)
•
Outperforming in low price environment (mid-2009) due to lower fixed cost
structure DMLP
HGT
SJT
PBT
MTR
CRT
SBR
Note: Dist. reinvested on last day of quarter |
 Dorchester Minerals, LP
11
Royalty Cash Receipts
Jan
Feb
Mar
Apr
May
Jun
Jul
Aug
Oil and Gas
Produced
Cash
receipts
begin
1st Quarter
Distribution
declared
Dist. Paid
(Feb-Mar cash)
2nd Quarter
Distribution
declared
Dist. Paid
(Apr-Jun cash)
LP distribution of all cash attributable to January production
may occur as late as August , a 7-month time lag
•
Long delay between production and cash distribution
–
Cash receipts extend over multiple months due to adjustments, releases, etc.
–
Prices
can
change
dramatically
between
production
and
payment
of
distribution
–
Example of a typical cash receipt cycle : |
 Dorchester Minerals, LP
12
Royalty Cash Receipts
•
Long delay between production and cash distribution
–
Peak cash receipt month was June 2008
–
Peak distribution was paid in November 2008
–
Actual cash receipts, distributions and gas price:
0.0
5.0
10.0
15.0
20.0
25.0
30.0
Jan-07
Jan-08
Jan-09
Jan-10
$0.00
$2.00
$4.00
$6.00
$8.00
$10.00
$12.00
$14.00
Total Cash Receipts
Cash Distributions
Gas Price (HSC)
Cash Receipts/Distribution ($MM)
HSC Gas Price ($/Mcf) |
 Dorchester Minerals, LP
13
Maecenas Minerals
Acquisition |
 Dorchester Minerals, LP
14
Maecenas Minerals Acquisition
•
Minerals
and
Royalties
–
206
counties
in
17
states
–
Closed transaction on 03/31/10 as a non-taxable exchange for 835,000
units –
Assets concentrated in Texas and North Dakota with increased exposure to oil
plays •
Permian Basin
Seminole
(San
Andres),
Goldsmith,
Wolfberry
potential
•
Williston Basin
Cedar
Hills
South
Unit,
Bakken
and
Three
Forks/Sanish
potential
–
DMLP already
owns
interests
in
all
acquired
properties
–
no
additional
overhead
–
Simple integration into existing accounting and land systems
–
Portfolio includes significant undeveloped acreage with upside potential
–
Analysis of Q1 2010 cash receipts:
$0.468
$0.406
Cash per Unit
$0.39 MM
$12.13 MM
Cash to LP
835,000
29,840,431
Units
15.3%
Maecenas Minerals
DMLP (stand-alone)
Accretion |
 Dorchester Minerals, LP
15
Maecenas Minerals Acquisition
•
Goldsmith
Andector
Unit
–
Ector
County,
Texas
–
Representative of assets in the Maecenas portfolio
–
Substantial
production
from
large
multi-well
units
with
little
concentration
of
risk
–
Long-life
reserves
+
Diversified
base
+
Development
potential
Stable
decline
profile
–
Adding
high
quality
properties
improves
DMLP’s
decline
curve
Gross Daily Oil Rate (boepd)
1,000
10,000
100,000
2003
2004
2005
2006
2007
2008
2009
2010
174 Wells
291 Wells |
 Dorchester Minerals, LP
16
Property Highlights
Royalty Properties |
 Dorchester Minerals, LP
17
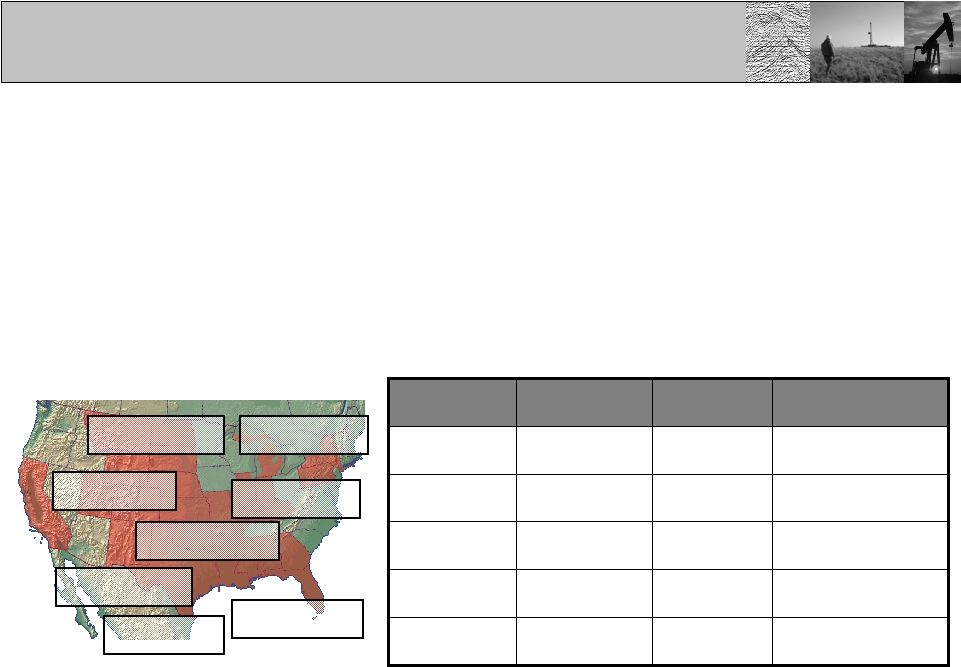
Property Highlights
Williston
101,810 net acres
Mid-Continent
35,223 net acres
Texas
141,581 net acres
Gulf Coast
18,819 net acres
Eastern
25,273 net acres
Appalachia
23,834 net acres
Other
3,783 net acres
Rockies
5,369 net acres
•
Mineral Portfolio Overview
–
355,692 net acres (3,122,867 gross acres) –
574 counties in 25 states
–
Majority of acreage is undeveloped
–
Wide geographic spread including most major producing basins
–
Assets range from mature legacy production to areas with exploratory
potential Expansion
Potential
Ongoing
Development
Legacy
Production
Basin/Area
Three Forks
Sanish
Bakken
Red River
Nesson
Anticline
Williston
Basin
Marcellus/Utica
Upper Devonian
Appalachia
Horizontal
Granite Wash
Fayetteville
Hugoton
Mid-Continent
Horizontal Wilcox
Bob West
Jeffress
McAllen Ranch
Gulf Coast
South Texas
Delaware Basin
West TX Overthrust
Wolfberry
Denver Unit
Wasson
West Texas
Southeast NM
Note: Acreage count as of 12/31/2009, excludes Maecenas transaction
|
 Dorchester Minerals, LP
18
Royalty Properties
•
Leasing and Development Activity
–
Consummated 53 leases/elections on 1,724 net acres in 22 counties/
parishes in four states
–
Lease bonus payments up to $1,200/acre
–
Initial royalty terms up to 30%
–
92 active lease offers as of May 2010
–
Identified 353 new wells on royalty properties in 11 states
–
Fayetteville Shale activity continued to ramp up in 2009
–
Low price environment reduced infill drilling and redevelopment on
legacy properties |
 Dorchester Minerals, LP
19
Property Highlights
Barnett Shale
|
 Dorchester Minerals, LP
20
Royalty Properties
•
Barnett
Shale
–
Tarrant
County,
Texas
–
Closed transaction on 06/30/09 as a non-taxable
exchange for 1,600,000 units
–
Producing and non-producing royalty and ORRI’s
–
100% undivided mineral interest in 6 tracts totaling 1,824
acres and overriding royalty interests in 2 of these tracts
–
NRIs
range from 0.5% to 20%
–
High quality, long-life reserves with development potential
–
Properties integrated into DMLP royalty system with
minimal additional overhead
–
New play adds diversification to DMLP’s
existing portfolio
–
Analysis of Q2 2009 to Q1 2010 cash receipts:
$1.675
$1.278
Cash per Unit
$2.68 MM
$36.09 MM
Cash to LP
1,600,000
28,240,431
Units
31.1%
Barnett Shale
DMLP (stand-alone)
Accretion |
 Dorchester Minerals, LP
21
1,000
10,000
100,000
2005
2006
2007
2008
2009
2010
0
15
30
45
60
–
Current Development Activity (CHK Operated)
•
29 producing wells
•
7 wells drilling or waiting on pipeline
•
5 permitted locations
–
Upside potential in undeveloped acreage, downspacing
and improved stimulation
Royalty Properties
Gross Daily Gas Rate (Mcfepd)
Well Count
•
Barnett Shale –
Tarrant County, Texas
DMLP Acquired
Interest
41 wells/permits |
 Dorchester Minerals, LP
22
Property Highlights
Net Profits Interests |
 Dorchester Minerals, LP
23
Net Profits Interests
•
NPI Provides LP Exposure to Working Interest
Potential Without Generating UBTI
–
Four NPI groups were created at the time of formation in 2003
–
Capitalize on strong negotiating position to capture additional value
–
Leverage information franchise
–
Optional working interest participation in numerous leases
–
Minerals NPI represents the majority of new development activity
–
Elected to participated in 56 wells in Arkansas and Oklahoma
•
30 wells completed in 2009
•
11 wells in various stages of drilling or completion at year-end 2009
•
15 wells waiting to spud at year-end 2009 |
 Dorchester Minerals, LP
24
1%
99%
Minerals NPI
Other NPI
Net Profits Interests
$0.0
$1.0
$2.0
$3.0
$4.0
$5.0
$6.0
Historical NPI CAPEX ($MM)
2009 NPI CAPEX
•
Capital Expenditures Through Year-end 2009
–
$21.6 million of cumulative investments in all net profits interest
properties –
2009 capital investments virtually unchanged from 2008
–
Majority of CAPEX was used to drill new wells in the Minerals NPI
–
Continue to reinvest Minerals NPI cash flow |
 Dorchester Minerals, LP
25
Net Profits Interests
•
Minerals NPI Performance
–
Production and reserves growing steadily since inception
–
204 wells/units producing in Q4 2009 (175 in pay status)
–
2.6 Bcfe
in production receipts through year-end 2009
–
Total
proved
reserves
of
3.4
Bcfe
at
year-end
2009,
a
43%
increase
over
2008
–
Minerals NPI production and reserves are not included in DMLP results
Note: Gas rate based on sales volumes
0.0
0.5
1.0
1.5
2.0
2.5
3.0
3.5
2003
2004
2005
2006
2007
2008
2009
Proved Reserves (Bcfe)
Net Daily Gas Rate (Mcfd)
100
1,000
10,000
2003
2004
2005
2006
2007
2008
2009
2010 |
 Dorchester Minerals, LP
26
Net Profits Interests
($4.0)
($3.0)
($2.0)
($1.0)
$0.0
$1.0
2003
2004
2005
2006
2007
2008
2009
2010
Investment
Net Operating Income
Surplus (Deficit)
($MM)
•
Minerals
NPI
Cash
Flow
–
Inception
through
Q1
2010
Cumulative Revenue
$19.1 MM
Cumulative Expense (LOE, taxes, etc)
($3.4 MM)
Cumulative Operating Income
$15.7 MM
Cumulative Investment
($18.7 MM)
Cumulative Surplus (Deficit)
($3.0 MM)
Surplus balance must
be positive before the
Minerals NPI contributes
to LP distributions
Note: Figures provide on a cash basis |
 Dorchester Minerals, LP
27
Net Profits Interests
•
Hugoton
Area
–
Operated
Properties
–
2009 production within 1% of projection
–
Year-over-year decline of 7.2%
–
World-class asset but limited upside potential
Gas Rate (Mcfepd)
Well Count
1,000
10,000
100,000
2003
2004
2005
2006
2007
2008
2009
2010
0
50
100
150
200
Note: Gas rate based on sales volumes |
 Dorchester Minerals, LP
28
Property Highlights
Fayetteville Shale
|
 Dorchester Minerals, LP
29
Fayetteville Shale
•
Eastern
Arkoma
Basin
–
Northern
Arkansas
–
Ownership summary
•
23,336 gross/11,464 net acres in trend
•
196 sections in 8 counties
–
“Hybrid”
leases in 179 sections (9,800 net acres)
•
Bonus and 25% royalty retained by DMLP
•
Participation option owned by the operating partnership
•
Option may be exercised on a well-by-well basis
•
Leverage data gained through mineral ownership
•
Working interests subject to Minerals NPI
2.6%
3.5%
111
Optional WI (NPI)
4.7%
0.0%
Avg. WI
4.7%
4
Unleased
MI (NPI)
2.1%
179
Royalty (DMLP)
Avg. NRI
Sections
Interest Type |
 Dorchester Minerals, LP
30
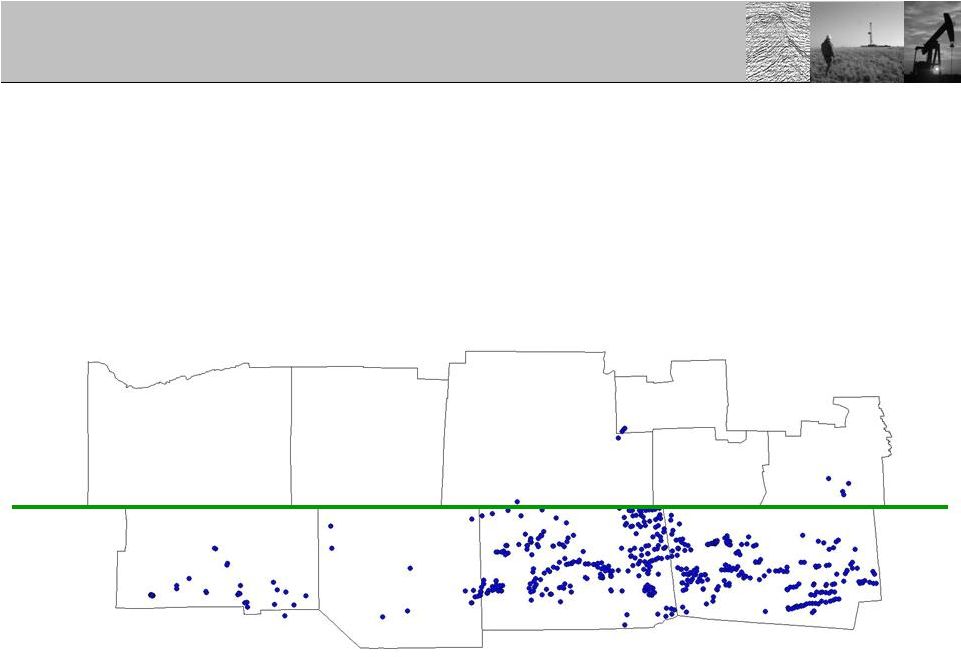
Fayetteville Shale
•
Six County Core Area
–
Current development activity on DMLP acreage
•
142 wells completed as producers (110 in pay status)
•
58 wells in various stages of drilling or completion
•
27 wells permitted and/or proposed by operator
–
Drilling or permitting activity has occurred on 48% of DMLP sections (28% in
2008) Dorchester Acreage
Wells with IP > 6 MMcfd
Productive Fairway
2,264 Producing Wells
428 Active Permits
290 Locations
Note:
Data
from
HPDI,
“Active
Permit”
–
well
spud
but
not
completed,
“Location”
–
well
permitted
but
not
spud
227 wells/permits |
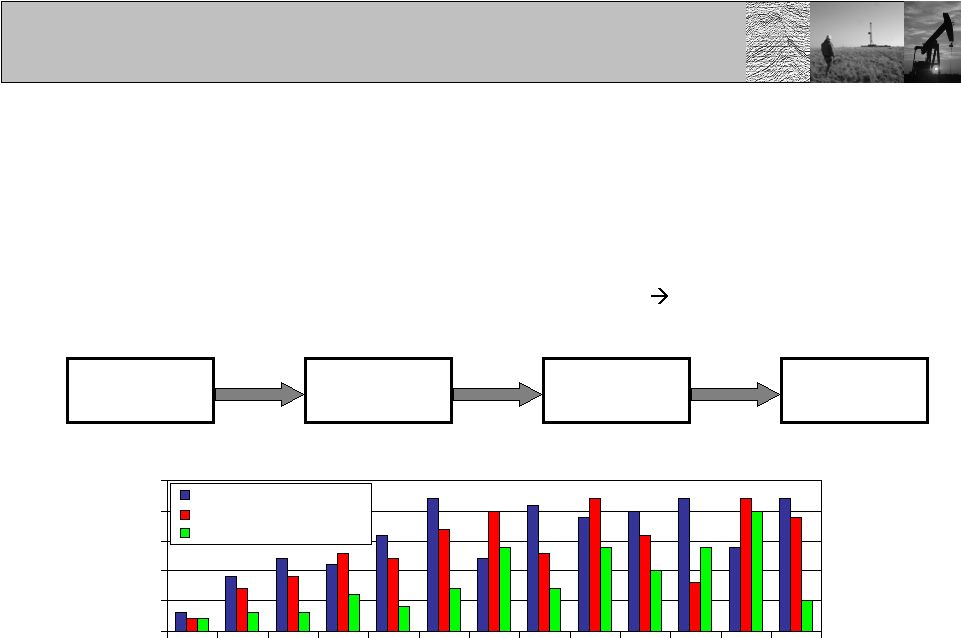 Dorchester Minerals, LP
31
Fayetteville Shale
–
Development activity remains at high levels, driven by SWN and CHK
–
Well spuds have been outpaced by well permits, a leading indicator
–
Substantial
time-lag
between
permit
and
first
payment
359
days
•
Permitting, Drilling and Payment History
First
Payment
First
Production
Well
Spud
Well
Permitted
54 days
118 days
187 days
Well Count
0
5
10
15
20
25
Q1
07
Q2
07
Q3
07
Q4
07
Q1
08
Q2
08
Q3
08
Q4
08
Q1
09
Q2
09
Q3
09
Q4
09
Q1
10
New Permits
New Wells Spud
1st Payment Received |
 Dorchester Minerals, LP
32
•
Capital Expenditures
Fayetteville Shale
•
2009 Reserves
0.0
1.0
2.0
3.0
4.0
5.0
2006
2007
2008
2009
DMLP (RI)
Minerals NPI (WI)
Proved Reserves (Bcf)
–
Year-end reserves of 4.9 Bcf
(124 wells)
•
2.3 Bcf
(WI)
•
2.6 Bcf
(RI)
–
69% Year-over-year reserve increase
–
Only completed wells with test rates are
included in reserve estimates (no PUDs)
0.0
1.0
2.0
3.0
4.0
5.0
2006
2007
2008
2009
Capital Expenditures ($MM)
–
All expenditures within Minerals NPI
–
Total Fayetteville investments of
$10.4 MM through Q1 2010
–
Average $3.1 MM per well in 2009
–
Drilling and completion costs may
increase with longer lateral lengths |
 Dorchester Minerals, LP
33
•
Well Performance
•
Production Results
Fayetteville Shale
Net Daily Production (Mcfd)
0
1,000
2,000
3,000
4,000
5,000
2006
2007
2008
2009
2010
Net RI Production
Net WI Production
–
123 wells producing at year-end 2009
•
2.4 MMcfd
(WI)
•
2.0 MMcfd
(RI)
–
91% Year-over-year rate increase
–
Produced 1.2 Bcf
in 2009
–
54% from working interest wells
Normalized Production Rate (Mcfd)
0
500
1,000
1,500
2,000
2,500
3,000
3,500
0
2
4
6
8
10
12
2.0 Bcf (SEECO)
2.5 Bcf (SEECO)
3.0 Bcf (SEECO)
DMLP (2009 Avg)
Months on Production
–
Improved stimulation and longer laterals
have increased average initial rate
•
2006
1.9 MMcfd
(Max 2.9 MMcfd)
•
2007
1.7 MMcfd
(Max 3.5 MMcfd)
•
2008
2.4 MMcfd
(Max 5.5 MMcfd)
•
2009
3.1 MMcfd
(Max 5.9 MMcfd)
Note:
Volumes
from
AOGC,
1
st
point
on
DMLP
normalize
curve
based
on
estimates
from
partial
month
data
4.4 MMcfd |
 Dorchester Minerals, LP
34
Property Highlights
Horizontal Bakken |
 Dorchester Minerals, LP
35
Horizontal Bakken
•
Williston Basin –
Northwestern North Dakota
–
Diversified acreage position
•
70,390 gross acres/9,503 net acres
–
Operators: Continental, EOG, Whiting, Marathon
–
Elected non-consent option in 88 wells to date
•
Average royalty of all leases in unit (~15% royalty)
•
Back-in for 100% WI after payout + 50% penalty
•
Working interest subject to Minerals NPI
–
Historical activity trend:
0
5
10
15
20
Q1
07
Q2
07
Q3
07
Q4
07
Q1
08
Q2
08
Q3
08
Q4
08
Q1
09
Q2
09
Q3
09
Q4
09
Q1
10
New Permits
New Wells Spud
Wells Reaching Payout
Well Count |
 Dorchester Minerals, LP
36
Horizontal Bakken
•
Six County Core Area
–
Current development activity on DMLP acreage
•
64 wells completed as producers (4 reached payout status)
•
14 wells in various stages of drilling or completion
•
10 wells permitted and/or proposed by operator
–
Rig count has increased 268% since May 2009
–
Three rigs currently drilling on DMLP acreage
Parshall,
Sanish
&
Stanley
fields
(426 nma)
Lila
1-36H
Owan-Nehring
27-34 1H
Harstad
1-18-19H
2.45%
0.42%
561
Lila 1-36H (Continental)
0.11%
1.65%
5.82%
2.47%
19.76%
APO
NRI
0.02%
0.21%
0.73%
0.52%
4.15%
BPO
NRI
Test Rate
(boepd)
Well Name (Operator)
1,476
McGregor 1-15H (Continental)
2,513
Owan-Nehring
27-34 1H (BEXP)
681
Harstad
18-19H (Fidelity)
1,639
Pederson 1-33H (EOG)
1,693
Austin 20-29H (EOG)
Pederson
1-33H
Austin
20-29H
McGregor
1-15H
88 wells/permits |
 Dorchester Minerals, LP
37
Developing Play
Highlights |
 Dorchester Minerals, LP
38
Developing Play Highlights
•
Devonian Shale (Appalachia)
–
New York and Pennsylvania
–
Concentrated acreage position
•
32,447 gross acres
•
24,774 net acres
•
70% in Allegany and Steuben Counties, NY
–
Challenging political environment in New York
–
Potential targets
•
Upper Devonian oil (shallow)
•
Marcellus/Devonian shale gas (middle)
•
Trenton-Black River gas (deep)
–
Operators: Anadarko, Cabot, Chesapeake,
EOG, EXCO, Fortuna Energy, Range, XTO
–
No reserves booked in 2009
Allegany & Steuben
Counties |
 Dorchester Minerals, LP
39
Developing Play Highlights
•
Southern Tier NY & Northern Tier PA
–
Regulatory
environment
in
New
York
has
limited
activity
relative
to
Pennsylvania
–
Prospectivity
of
acreage
in
Allegany
and
Steuben
Counties
is
undetermined
due
to
limited testing of potential shale gas zones
–
Continuing to monitor industry activity in the area
Allegany
13,216 nma
Steuben
4,714 nma
Chemung
308 nma
Schuyler
459 nma
Tioga
163 nma
Bradford
0 nma
Potter
846 nma
McKean
1,158 nma
Cattaraugus
0 nma
Tioga
41 nma
NY
PA
NY
PA |
 Dorchester Minerals, LP
40
Developing Play Highlights
•
Granite Wash –
Texas Panhandle
–
Concentrated acreage position in Northeast Wheeler County
•
DMLP owns 5,444 gross/1,189 net acres
–
Substantial liquids component to production
–
Multiple active lease offers
Horizontal Wells/Permits
NFX: 10.1 MMcfd
NFX: 12.7 MMcfd
FST: 10.2 MMcfd
NFX: 16.1 MMcfd
CHK: 18.5 MMcfd
DVN: 18.0 MMcfd
NFX: 20.1 MMcfd
APA: 6.6 MMcfd |
 Dorchester Minerals, LP
41
Dorchester Minerals, LP
Annual Meeting
May 12, 2010 |
 Dorchester Minerals, LP
42
Appendix |
 Dorchester Minerals, LP
43
•
What is the Minerals NPI and How Does it Work?
Appendix
–
Upon its formation, Dorchester Minerals, LP (DMLP, the public partnership and owner
of the mineral interests) provided for future development opportunities on its
undeveloped mineral interests by the creation of the Minerals Net Profits
Interest (Minerals NPI). –
DMLP has negotiated and may continue to negotiate the right but not the obligation to
participate in development activity in addition to retaining a royalty
interest. –
This right may take the form of an optional heads-up (unpromoted) working
interest, carried working interest or reversionary (back-in) working
interest. In some instances, an unleased mineral interest may
be treated as a working interest subject to statutory non-consent
provisions. –
DMLP assigns this right to Dorchester Minerals Operating LP (the
operating partnership or DMOLP)
subject to the terms of the Minerals NPI.
–
DMOLP is an indirect wholly owned affiliate of DMLP’s
General Partner.
–
DMOLP funds all costs associated with this right, including drilling and completion
costs. –
DMLP and its partners are not liable for any costs or expenses.
–
DMOLP pays to DMLP 96.97% of the monthly “Net Proceeds”
attributable to the properties subject to the
Minerals NPI.
–
Net Proceeds is defined as total revenues less total expenses plus an amount
equivalent to interest at a prevailing rate on any prior period deficit
balance. In other words, DMOLP pays 100% of all costs, receives 100% of all
revenues plus interest, and thereafter (sometimes called “Payout”) pays 96.97% of
net cashflow
to DMLP.
–
LP distributions reflect 96% of royalty net cashflow
and 99% of NPI net cashflow
99% x 96.97% = 96%. |
 Dorchester Minerals, LP
44
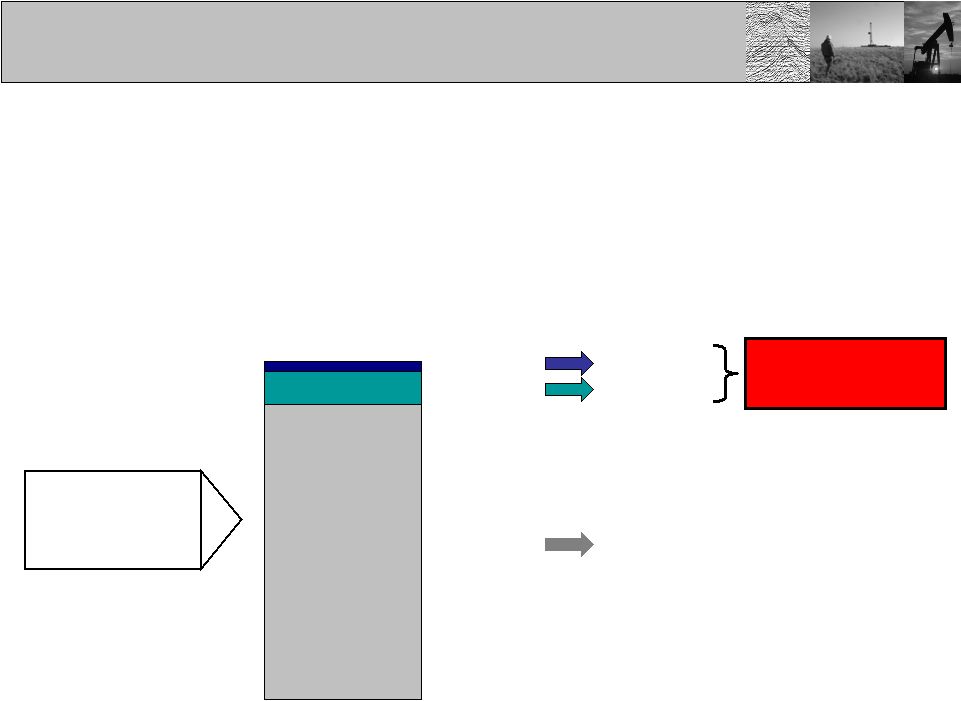
Appendix
DMLP
Lease to third party for
royalty and optional
participation right
Participation right
assigned to DMOLP
NPI payment
(96.97% of cash flow)
Distributable Cash
DMOLP pays 100% of costs
and receives 100% of revenue
plus interest equivalent on
total NPI basis
Royalty
(100% of cash flow)
General
Partner
4% of
royalties
1% of NPI’s
Limited
Partners
96% of
royalties
99% of NPI’s
•
What is the Minerals NPI and How Does it Work? |
 Dorchester Minerals, LP
45
Appendix
•
Distribution Determinations
4% of Net Cash Receipts from Royalty Properties
$ --------
$1,309
96% of Net Cash Receipts from Royalty Properties
$31,416
$ --------
1% of Net Profits Interests Paid to our Partnership
$ --------
$120
Total Distributions
$43,299
$1,429
99% of Net Profits Interests Paid to our Partnership
$11,883
$ --------
Operating Partnership Share (3.03% of Net Proceeds)
$ --------
$375
Total General Partner Share
$1,804
% Total
96%
4%
Limited
Partners
General
Partner
–
Period from October 2008 through September 2009
($ thousands) |
 Dorchester Minerals, LP
46
Appendix
2009 Cash
Distributions
$44.7 MM
Mgmt GP
Mgmt LP
Other LP
$1.4 MM
$3.6 MM
$39.7 MM
Mgmt LP is 2.6
times Mgmt GP
•
Alignment of GP and LP interests
–
GP has no incentive distribution rights –
fixed sharing ratio
–
Management’s LP interest exceeds its GP interest
–
Not incentivized to make dilutive transactions
88.8 %
8.1 %
3.1 % |
 Dorchester Minerals, LP
47
•
Operating Leverage –
Royalty Interest vs. NPI
Appendix
Net Profits Interest
Royalty Interest
1,000 Mcf
$6.00/Mcf
$6,000
($0)
$6,000
25% Royalty
$1,500
1,000 Mcf
$7.80/Mcf
$7,800
($0)
$7,800
25% Royalty
$1,950
1,000 Mcf
$6.00/Mcf
$6,000
($1,000)
$5,000
25% NPI
$1,250
1,000 Mcf
$7.80/Mcf
$7,800
($1,000)
$6,800
25% NPI
$1,700
30% Increase in
Royalty Cash Flow
36% Increase in
NPI Cash Flow
30% Increase in Gas Price
Production Volume
Gas Price
Revenue
Fixed Production Costs
Operating Income
Net Interest
Net Cash Flow
Production Volume
Gas Price
Revenue
Fixed Production Costs
Operating Income
Net Interest
Net Cash Flow |