Attached files
Table of Contents
Index to Financial Statements
UNITED STATES
SECURITIES AND EXCHANGE COMMISSION
WASHINGTON, D.C. 20549
FORM 10-K
| x | Annual Report Pursuant to Section 13 or 15(d) of the Securities Exchange Act of 1934 for the fiscal year ended December 31, 2009 | |
| Or | ||
| ¨ | Transition Report Pursuant to Section 13 or 15(d) of the Securities Exchange Act of 1934 for the transition Period from to | |
Commission File Number: 000-50175
DORCHESTER MINERALS, L.P.
(Exact name of registrant as specified in its charter)
| Delaware | 81-0551518 | |
| (State of incorporation) | (I.R.S. employer identification number) |
3838 Oak Lawn Avenue, Suite 300
Dallas, Texas 75219
(Address of principal executive offices) (Zip Code)
(214) 559-0300
(Registrant’s telephone number, including area code)
SECURITIES REGISTERED PURSUANT TO SECTION 12(b) OF THE ACT:
| Title of Each Class |
Name of Exchange on which Registered | |
| Common Units Representing Limited Partnership Interests | NASDAQ Global Select Market |
SECURITIES REGISTERED PURSUANT TO SECTION 12(g) OF THE ACT:
Title of Class
None
Indicate by check mark if the registrant is a well-known seasoned issuer, as defined in Rule 405 of the Securities Act. Yes ¨ No x
Indicate by check mark if the registrant is not required to file reports pursuant to Section 13 or 5(d) of the Act. Yes ¨ No x
Indicate by check mark whether the registrant (1) has filed all reports required to be filed by Section 13 or 15(d) of the Securities Exchange Act of 1934 during the preceding 12 months (or for such shorter period that the registrant was required to file such reports), and (2) has been subject to such filing requirements for the past 90 days. Yes x No ¨
Indicate by check mark whether the registrant has submitted electronically and posted on its corporate Web site, if any, every Interactive Data File required to be submitted and posted pursuant to Rule 405 of Regulation S-T (§ 232.405 of this chapter) during the preceding 12 months (or for such shorter period that the registrant was required to submit and post such files). Yes ¨ No ¨
Indicate by check mark if disclosure of delinquent filers pursuant to Item 405 of Regulation S-K is not contained herein, and will not be contained, to the best of the registrant’s knowledge, in definitive proxy or information statements incorporated by reference in Part III of this Form 10-K or any amendment to this Form 10-K. ¨
Indicate by check mark whether the registrant is a large accelerated filer, an accelerated filer, a non-accelerated filer or a smaller reporting company. See definitions of “accelerated filer, large accelerated filer and smaller reporting company” in Rule 12b-2 of the Exchange Act. (Check one):
| Large accelerated filer ¨ |
Accelerated filer x | Non-accelerated filer ¨ | Smaller reporting company ¨ |
(Do not check if a smaller reporting company)
Indicate by check mark whether the registrant is a shell company (as defined in Rule 12b-2 of the Act.): Yes ¨ No x
The aggregate market value of the common units held by non-affiliates of the registrant (treating all managers, executive officers and 10% unitholders of the registrant as if they may be affiliates of the registrant) was approximately $498,987,651 as of June 30, 2009, based on $22.80 per unit, the closing price of the common units as reported on the NASDAQ Global Select Market on such date.
Number of Common Units outstanding as of February 25, 2010: 29,840,431
DOCUMENTS INCORPORATED BY REFERENCE
Portions of the definitive proxy statement for the registrant’s 2010 Annual Meeting of Unitholders to be held on May 12, 2010, are incorporated by reference in Part III of this Form 10-K. Such definitive proxy statement will be filed with the Securities and Exchange Commission not later than 120 days subsequent to December 31, 2009.
Table of Contents
Index to Financial Statements
Table of Contents
Index to Financial Statements
| ITEM 1. | BUSINESS |
General
Dorchester Minerals, L.P. is a publicly traded Delaware limited partnership that commenced operations on January 31, 2003 upon the combination of Dorchester Hugoton, Ltd., Republic Royalty Company, L.P. and Spinnaker Royalty Company, L.P. Dorchester Hugoton was a publicly traded Texas limited partnership, and Republic and Spinnaker were private Texas limited partnerships. Our common units are listed on the NASDAQ Global Select Market. American Stock Transfer & Trust Company is our registrar and transfer agent. Their address and telephone number is 59 Maiden Lane, New York, NY 10038, (800) 937-5449. Our executive offices are located at 3838 Oak Lawn Avenue, Suite 300, Dallas, Texas, 75219-4541, and our telephone number is (214) 559-0300. We have established an Internet website at www.dmlp.net that only contains the last annual meeting presentation and a link to the NASDAQ website. You may obtain all current filings free of charge at the NASDAQ website by clicking “Real-Time SEC Filings.” We will provide electronic or paper copies of our annual report on Form 10-K, quarterly reports on Form 10-Q, or current reports on Form 8-K and amendments to those reports filed or furnished to the Securities and Exchange Commission (“SEC”) free of charge upon written request at our executive offices. In this report, the term “Partnership,” as well as the terms “us,” “our,” “we,” and “its” are sometimes used as abbreviated references to Dorchester Minerals, L.P. itself or Dorchester Minerals, L.P. and its related entities.
Our general partner is Dorchester Minerals Management LP, which is managed by its general partner, Dorchester Minerals Management GP LLC. As a result, the Board of Managers of Dorchester Minerals Management GP LLC exercises effective control of our Partnership. In this report, the term “general partner” is used as an abbreviated reference to Dorchester Minerals Management LP. Our general partner also controls and owns, directly and indirectly, all of the partnership interests in Dorchester Minerals Operating LP and its general partner. Dorchester Minerals Operating LP owns working interests and other properties underlying our Net Profits Interests, provides day-to-day operational and administrative services to us and our general partner, and is the employer of all the employees who perform such services. In this report, the term “operating partnership” is used as an abbreviated reference to Dorchester Minerals Operating LP.
Our general partner and the operating partnership are Delaware limited partnerships, and the general partners of their general partners are Delaware limited liability companies. These entities and our Partnership were initially formed in December 2001 in connection with the combination. Our wholly owned subsidiary, Dorchester Minerals Oklahoma LP and its general partner are Oklahoma entities that acquired our wholly owned acquisition subsidiary and its general partner by merger on December 31, 2009.
Our business may be described as the acquisition, ownership and administration of Net Profits Interests and Royalty Properties. The Net Profits Interests represent net profits overriding royalty interests in various properties owned by the operating partnership. The Royalty Properties consist of producing and nonproducing mineral, royalty, overriding royalty, net profits, and leasehold interests located in 574 counties and parishes in 25 states.
Our partnership agreement requires that we distribute quarterly an amount equal to all funds that we receive from the Net Profits Interests and the Royalty Properties less certain expenses and reasonable reserves.
We intend to grow by acquiring additional oil and natural gas properties, subject to the limitations described below. The approval of the holders of a majority of our outstanding common units is required for our general partner to cause us to acquire or obtain any oil and natural gas property interest, unless the acquisition is complementary to our business and is made either:
| • | in exchange for our limited partner interests, including common units, not exceeding 20% of the common units outstanding after issuance; or |
1
Table of Contents
Index to Financial Statements
| • | in exchange for cash, if the aggregate cost of any acquisitions made for cash during the twelve-month period ending on the first to occur of the execution of a definitive agreement for the acquisition or its consummation is no more than 10% of our aggregate cash distributions for the four most recent fiscal quarters. |
Unless otherwise approved by the holders of a majority of our common units, in the event that we acquire properties for a combination of cash and limited partner interests, including common units, (i) the cash component of the acquisition consideration must be equal to or less than 5% of the aggregate cash distributions made by our Partnership for the four most recent quarters and (ii) the amount of limited partnership interests, including common units, to be issued in such acquisition, after giving effect to such issuance, shall not exceed 10% of the common units outstanding.
Credit Facilities and Financing Plans
We do not have a credit facility in place, nor do we anticipate doing so. We do not anticipate incurring any debt, other than trade debt incurred in the ordinary course of our business. Our partnership agreement prohibits us from incurring indebtedness, other than trade payables, (i) in excess of $50,000 in the aggregate at any given time; or (ii) which would constitute “acquisition indebtedness” (as defined in Section 514 of the Internal Revenue Code of 1986, as amended), in order to avoid unrelated business taxable income for federal income tax purposes. We may finance any growth of our business through acquisitions of oil and natural gas properties by issuing additional limited partnership interests or with cash, subject to the limits described above and in our partnership agreement.
Under our partnership agreement, we may also finance our growth through the issuance of additional partnership securities, including options, rights, warrants and appreciation rights with respect to partnership securities from time to time in exchange for the consideration and on the terms and conditions established by our general partner in its sole discretion. However, we may not issue limited partnership interests that would represent over 20% of the outstanding limited partnership interests immediately after giving effect to such issuance or that would have greater rights or powers than our common units without the approval of the holders of a majority of our outstanding common units. Except in connection with qualifying acquisitions, we do not currently anticipate issuing additional partnership securities. We have an effective registration statement on Form S-4 registering 5,000,000 common units that may be offered and issued by the Partnership from time to time in connection with asset acquisitions or other business combination transactions. At present, 3,400,000 units remain available.
Regulation
Many aspects of the production, pricing and marketing of crude oil and natural gas are regulated by federal and state agencies. Legislation affecting the oil and natural gas industry is under constant review for amendment or expansion, which frequently increases the regulatory burden on affected members of the industry.
Exploration and production operations are subject to various types of regulation at the federal, state and local levels. Such regulation includes:
| • | permits for the drilling of wells; |
| • | bonding requirements in order to drill or operate wells; |
| • | the location and number of wells; |
| • | the method of drilling and casing wells; |
| • | the surface use and restoration of properties upon which wells are drilled; |
| • | the plugging and abandonment of wells; |
2
Table of Contents
Index to Financial Statements
| • | numerous federal and state safety requirements; |
| • | environmental requirements; |
| • | property taxes and severance taxes; and |
| • | specific state and federal income tax provisions. |
Oil and natural gas operations are also subject to various conservation laws and regulations. These regulations govern the size of drilling and spacing units or proration units and the density of wells that may be drilled and the unitization or pooling of oil and natural gas properties. In addition, state conservation laws establish a maximum allowable production from oil and natural gas wells. These state laws also generally prohibit the venting or flaring of natural gas and impose certain requirements regarding the ratability of production. These regulations can limit the amount of oil and natural gas that the operators of our properties can produce.
The transportation of natural gas after sale by operators of our properties is sometimes subject to regulation by state authorities. The interstate transportation of natural gas is subject to federal governmental regulation, including regulation of tariffs and various other matters, by the Federal Energy Regulatory Commission.
Customers and Pricing
The pricing of oil and natural gas sales is primarily determined by supply and demand in the marketplace and can fluctuate considerably. As a royalty owner and non-operator, we have extremely limited access to timely information, involvement, and operational control over the volumes of oil and natural gas produced and sold and the terms and conditions on which such volumes are marketed and sold.
Since 2004 the operating partnership has sold most of its natural gas production to a Williams entity (currently Williams Gas Marketing, Inc.) on a daily market price basis using a yearly contract that will continue through October 2010. The operating partnership frequently reviews alternative gas purchasers. We believe that the loss of Williams by the operating partnership or the loss of any single customer would not have a material adverse effect on us due to alternative purchasers.
Competition
The energy industry in which we compete is subject to intense competition among many companies, both larger and smaller than we are, many of which have financial and other resources greater than we have.
Business Opportunities Agreement
Pursuant to a business opportunities agreement among us, our general partner, the general partner of our general partner, the owners of the general partner of our general partner (the “GP Parties”), and, in their individual capacities as officers of the general partner of our general partner, William Casey McManemin, James E. Raley and H.C. Allen, Jr., we have agreed that, except with the consent of our general partner, which it may withhold in its sole discretion, we will not engage in any business not permitted by our partnership agreement, and we will have no interest or expectancy in any business opportunity that does not consist exclusively of the oil and natural gas business within a designated area that includes portions of Texas County, Oklahoma and Stevens County, Kansas. All opportunities that are outside the designated area or are not oil and natural gas business activities are called renounced opportunities.
3
Table of Contents
Index to Financial Statements
The parties also have agreed that, as long as the activities of the general partner, the GP Parties and their affiliates or manager designees are conducted in accordance with specified standards, or are renounced opportunities:
| • | our general partner, the GP Parties and their affiliates or the manager designees will not be prohibited from engaging in the oil and natural gas business or any other business, even if such activity is in direct or indirect competition with our business activities; |
| • | affiliates of our general partner, the GP Parties and their affiliates and the manager designees will not have to offer us any business opportunity; |
| • | we will have no interest or expectancy in any business opportunity pursued by affiliates of our general partner, the GP Parties or their affiliates and the manager designees; and |
| • | we waive any claim that any business opportunity pursued by our general partner, the GP Parties or their affiliates and the manager designees constitutes a corporate opportunity that should have been presented to us. |
The standards specified in the business opportunities agreement generally provide that the GP Parties and their affiliates and manager designees must conduct their business through the use of their own personnel and assets and not with the use of any personnel or assets of us, our general partner or operating partnership. A manager designee or personnel of a company in which any affiliate of our general partner or any GP Party or their affiliates has an interest or in which a manager designee is an owner, director, manager, partner or employee (except for our general partner and its general partner and their subsidiaries) is not allowed to usurp a business opportunity solely for his or her personal benefit, as opposed to pursuing, for the benefit of the separate party an opportunity in accordance with the specified standards.
In certain circumstances, if a GP Party or any subsidiary thereof, any officer of the general partner of our general partner or any of their subsidiaries, or a manager of the general partner of our general partner that is an affiliate of a GP Party signs a binding agreement to purchase oil and natural gas interests, excluding oil and natural gas working interests, then such party must notify us prior to the consummation of the transactions so that we may determine whether to pursue the purchase of the oil and natural gas interests directly from the seller. If we do not pursue the purchase of the oil and natural gas interests or fail to respond to the purchasing party’s notice within the provided time, the opportunity will also be considered a renounced opportunity.
In the event any GP Party or one of their subsidiaries acquires an oil and natural gas interest, including oil and natural gas working interests, in the designated area, it will offer to sell these interests to us within one month of completing the acquisition. This obligation also applies to any package of oil and natural gas interests, including oil and natural gas working interests, if at least 20% of the net acreage of the package is within the designated area; however, this obligation does not apply to interests purchased in a transaction in which the procedures described above were applied and followed by the applicable affiliate.
Operating Hazards and Uninsured Risks
Our operations do not directly involve the operational risks and uncertainties associated with drilling for, and the production and transportation of, oil and natural gas. However, we may be indirectly affected by the operational risks and uncertainties faced by the operators of our properties, including the operating partnership, whose operations may be materially curtailed, delayed or canceled as a result of numerous factors, including:
| • | the presence of unanticipated pressure or irregularities in formations; |
| • | accidents; |
| • | title problems; |
| • | weather conditions; |
4
Table of Contents
Index to Financial Statements
| • | compliance with governmental requirements; and |
| • | shortages or delays in the delivery of equipment. |
Also, the ability of the operators of our properties to market oil and natural gas production depends on numerous factors, many of which are beyond their control, including:
| • | capacity and availability of oil and natural gas systems and pipelines; |
| • | effect of federal and state production and transportation regulations; |
| • | changes in supply and demand for oil and natural gas; and |
| • | creditworthiness of the purchasers of oil and natural gas. |
The occurrence of an operational risk or uncertainty that materially impacts the operations of the operators of our properties could have a material adverse effect on the amount that we receive in connection with our interests in production from our properties, which could have a material adverse effect on our financial condition or result of operations.
In accordance with customary industry practices, we maintain insurance against some, but not all, of the risks to which our business exposes us. While we believe that we are reasonably insured against these risks, the occurrence of an uninsured loss could have a material adverse effect on our financial condition or results of operations.
Employees
As of February 25, 2010, the operating partnership had 19 full-time employees in our Dallas, Texas office and eight full-time employees in field locations.
| ITEM 1A. | RISK FACTORS |
Risks Related to Our Business
Our cash distributions are highly dependent on oil and natural gas prices, which have historically been very volatile.
Our quarterly cash distributions depend significantly on the prices realized from the sale of oil and, in particular, natural gas. Historically, the markets for oil and natural gas have been volatile and may continue to be volatile in the future. Various factors that are beyond our control will affect prices of oil and natural gas, such as:
| • | the worldwide and domestic supplies of oil and natural gas; |
| • | the ability of the members of the Organization of Petroleum Exporting Countries and others to agree to and maintain oil prices and production controls; |
| • | political instability or armed conflict in oil-producing regions; |
| • | the price and level of foreign imports; |
| • | the level of consumer demand; |
| • | the price and availability of alternative fuels; |
| • | the availability of pipeline capacity; |
| • | weather conditions; |
| • | domestic and foreign governmental regulations and taxes; and |
| • | the overall economic environment. |
5
Table of Contents
Index to Financial Statements
Lower oil and natural gas prices may reduce the amount of oil and natural gas that is economic to produce and may reduce our revenues and operating income. The volatility of oil and natural gas prices reduces the accuracy of estimates of future cash distributions to unitholders.
We do not control operations and development of the Royalty Properties or the properties underlying the Net Profits Interests that the operating partnership does not operate, which could impact the amount of our cash distributions.
As the owner of a fractional undivided mineral or royalty interest, we do not control the development of the Royalty or Net Profits Interests properties or the volumes of oil and natural gas produced from them, and our ability to influence development of nonproducing properties is severely limited. Also, since one of our stated business objectives is to avoid the generation of unrelated business taxable income, we are prohibited from participation in the development of our properties as a working interest or other expense-bearing owner. The decision to explore or develop these properties, including infill drilling, exploration of horizons deeper or shallower than the currently producing intervals, and application of enhanced recovery techniques will be made by the operator and other working interest owners of each property (including our lessees) and may be influenced by factors beyond our control, including but not limited to oil and natural gas prices, interest rates, budgetary considerations and general industry and economic conditions.
Our unitholders are not able to influence or control the operation or future development of the properties underlying the Net Profits Interests. The operating partnership is unable to influence significantly the operations or future development of properties that it does not operate. The operating partnership and the other current operators of the properties underlying the Net Profits Interests are under no obligation to continue operating the underlying properties. The operating partnership can sell any of the properties underlying the Net Profits Interests that it operates and relinquish the ability to control or influence operations. Any such sale or transfer must also simultaneously include the Net Profits Interests at a corresponding price. Our unitholders do not have the right to replace an operator.
Our lease bonus revenue depends in significant part on the actions of third parties, which are outside of our control.
Significant portions of the Royalty Properties are unleased mineral interests. With limited exceptions, we have the right to grant leases of these interests to third parties. We anticipate receiving cash payments as bonus consideration for granting these leases in most instances. Our ability to influence third parties’ decisions to become our lessees with respect to these nonproducing properties is severely limited, and those decisions may be influenced by factors beyond our control, including but not limited to oil and natural gas prices, interest rates, budgetary considerations and general industry and economic conditions.
The operating partnership may transfer or abandon properties that are subject to the Net Profits Interests.
Our general partner, through the operating partnership, may at any time transfer all or part of the properties underlying the Net Profits Interests. Our unitholders are not entitled to vote on any transfer; however, any such transfer must also simultaneously include the Net Profits Interests at a corresponding price.
The operating partnership or any transferee may abandon any well or property if it reasonably believes that the well or property can no longer produce in commercially economic quantities. This could result in termination of the Net Profits Interests relating to the abandoned well.
Cash distributions are affected by production and other costs, some of which are outside of our control.
The cash available for distribution that comes from our royalty and mineral interests, including the Net Profits Interests, is directly affected by increases in production costs and other costs. Some of these costs are
6
Table of Contents
Index to Financial Statements
outside of our control, including costs of regulatory compliance and severance and other similar taxes. Other expenditures are dictated by business necessity, such as drilling additional wells in response to the drilling activity of others.
Our oil and natural gas reserves and the underlying properties are depleting assets, and there are limitations on our ability to replace them.
Our revenues and distributions depend in large part on the quantity of oil and natural gas produced from properties in which we hold an interest. Over time, all of our producing oil and natural gas properties will experience declines in production due to depletion of their oil and natural gas reservoirs, with the rates of decline varying by property. Replacement of reserves to maintain production levels requires maintenance, development or exploration projects on existing properties, or the acquisition of additional properties.
The timing and size of maintenance, development or exploration projects will depend on the market prices of oil and natural gas and on other factors beyond our control. Many of the decisions regarding implementation of such projects, including drilling or exploration on any unleased and undeveloped acreage, will be made by third parties. In addition, development possibilities in the Hugoton field are limited by the developed nature of that field and by regulatory restrictions.
Our ability to increase reserves through future acquisitions is limited by restrictions on our use of cash and limited partnership interests for acquisitions and by our general partner’s obligation to use all reasonable efforts to avoid unrelated business taxable income. In addition, the ability of affiliates of our general partner to pursue business opportunities for their own accounts without tendering them to us in certain circumstances may reduce the acquisitions presented to us for consideration.
Drilling activities on our properties may not be productive, which could have an adverse effect on future results of operations and financial condition.
The operating partnership may undertake drilling activities in limited circumstances on the properties underlying the Net Profits Interests, and third parties may undertake drilling activities on our other properties. Any increases in our reserves will come from such drilling activities or from acquisitions.
Drilling involves a wide variety of risks, including the risk that no commercially productive oil or natural gas reservoirs will be encountered. The cost of drilling, completing and operating wells is often uncertain, and drilling operations may be delayed or canceled as a result of a variety of factors, including:
| • | pressure or irregularities in formations; |
| • | equipment failures or accidents; |
| • | unexpected drilling conditions; |
| • | shortages or delays in the delivery of equipment; |
| • | adverse weather conditions; and |
| • | disputes with drill-site owners. |
Future drilling activities on our properties may not be successful. If these activities are unsuccessful, this failure could have an adverse effect on our future results of operations and financial condition. In addition, under the terms of the Net Profits Interests, the costs of unsuccessful future drilling on the working interest properties that are subject to the Net Profits Interests will reduce amounts payable to us under the Net Profits Interests by 96.97% of these costs.
7
Table of Contents
Index to Financial Statements
Our ability to identify and capitalize on acquisitions is limited by contractual provisions and substantial competition.
Our partnership agreement limits our ability to acquire oil and natural gas properties in the future, especially for consideration other than our limited partnership interests. Because of the limitations on our use of cash for acquisitions and on our ability to accumulate cash for acquisition purposes, we may be required to attempt to effect acquisitions with our limited partnership interests. However, sellers of properties we would like to acquire may be unwilling to take our limited partnership interests in exchange for properties.
Our partnership agreement obligates our general partner to use all reasonable efforts to avoid generating unrelated business taxable income. Accordingly, to acquire working interests we would have to arrange for them to be converted into overriding royalty interests, net profits interests, or another type of interest that does not generate unrelated business taxable income. Third parties may be less likely to deal with us than with a purchaser to which such a condition would not apply. These restrictions could prevent us from pursuing or completing business opportunities that might benefit us and our unitholders, particularly unitholders who are not tax-exempt investors.
The duty of affiliates of our general partner to present acquisition opportunities to our Partnership is limited, pursuant to the terms of the business opportunities agreement. Accordingly, business opportunities that could potentially be pursued by us might not necessarily come to our attention, which could limit our ability to pursue a business strategy of acquiring oil and natural gas properties.
We compete with other companies and producers for acquisitions of oil and natural gas interests. Many of these competitors have substantially greater financial and other resources than we do.
Any future acquisitions will involve risks that could adversely affect our business, which our unitholders generally will not have the opportunity to evaluate.
Our current strategy contemplates that we may grow through acquisitions. We expect to participate in discussions relating to potential acquisition and investment opportunities. If we consummate any additional acquisitions, our capitalization and results of operations may change significantly, and our unitholders will not have the opportunity to evaluate the economic, financial and other relevant information that we will consider in connection with the acquisition, unless the terms of the acquisition require approval of our unitholders. Additionally, our unitholders will bear 100% of the dilution from issuing new common units while receiving essentially 96% of the benefit as 4% of the benefit goes to our general partner.
Acquisitions and business expansions involve numerous risks, including assimilation difficulties, unfamiliarity with new assets or new geographic areas and the diversion of management’s attention from other business concerns. In addition, the success of any acquisition will depend on a number of factors, including the ability to estimate accurately the recoverable volumes of reserves, rates of future production and future net revenues attributable to reserves and to assess possible environmental liabilities. Our review and analysis of properties prior to any acquisition will be subject to uncertainties and, consistent with industry practice, may be limited in scope. We may not be able to successfully integrate any oil and natural gas properties that we acquire into our operations, or we may not achieve desired profitability objectives.
A natural disaster or catastrophe could damage pipelines, gathering systems and other facilities that service our properties, which could substantially limit our operations and adversely affect our cash flow.
If gathering systems, pipelines or other facilities that serve our properties are damaged by any natural disaster, accident, catastrophe or other event, our income could be significantly interrupted. Any event that interrupts the production, gathering or transportation of our oil and natural gas, or which causes us to share in significant expenditures not covered by insurance, could adversely impact the market price of our limited partnership units and the amount of cash available for distribution to our unitholders. We do not carry business interruption insurance.
8
Table of Contents
Index to Financial Statements
The vast majority of the properties subject to the Net Profits Interests are geographically concentrated, which could cause net proceeds payable under the Net Profits Interests to be impacted by regional events.
The vast majority of the properties subject to the Net Profits Interests are all natural gas properties that are located almost exclusively in the Hugoton field in Oklahoma and Kansas. Because of this geographic concentration, any regional events, including natural disasters that increase costs, reduce availability of equipment or supplies, reduce demand or limit production may impact the net proceeds payable under the Net Profits Interests more than if the properties were more geographically diversified.
The number of prospective natural gas purchasers and methods of delivery are considerably less than would otherwise exist from a more geographically diverse group of properties. As a result, natural gas sales after gathering and compression tend to be sold to one buyer in each state, thereby increasing credit risk.
Under the terms of the Net Profits Interests, much of the economic risk of the underlying properties is passed along to us.
Under the terms of the Net Profits Interests, virtually all costs that may be incurred in connection with the properties, including overhead costs that are not subject to an annual reimbursement limit, are deducted as production costs or excess production costs in determining amounts payable to us. Therefore, to the extent of the revenues from the burdened properties, we bear 96.97% of the costs of the working interest properties. If costs exceed revenues, we do not receive any payments under the Net Profits Interests. However, except as described below, we are not required to pay any excess costs.
The terms of the Net Profits Interests provide for excess costs that cannot be charged currently because they exceed current revenues to be accumulated and charged in future periods, which could result in us not receiving any payments under the Net Profits Interests until all prior uncharged costs have been recovered by the operating partnership.
Damages associated with the production and gathering of our oil and natural gas properties could affect our cash flow.
The operating partnership owns and operates gathering systems and compression facilities. Casualty losses or damages from these operations would be production costs under the terms of the Net Profits Interests and could adversely affect our cash flow.
We may indirectly experience costs from repair or replacement of aging equipment.
Some of the operating partnership’s current working interest wells were drilled and have been producing since prior to 1954. The 132-mile Oklahoma gas pipeline gathering system was originally installed in or about 1948 and because of its age is in need of periodic repairs and upgrades. Should major components of this system require significant repairs or replacement, the operating partnership may incur substantial capital expenditures in the operation of the Oklahoma properties, which, as production costs, would reduce our cash flow from these properties.
Our cash flow is subject to operating hazards and unforeseen interruptions for which we may not be fully insured.
Neither we nor the operating partnership are fully insured against certain risks, either because such insurance is not available or because of high premium costs. Operations that affect the properties are subject to all of the risks normally incident to the oil and natural gas business, including blowouts, cratering, explosions and pollution and other environmental damage, any of which could result in substantial decreases in the cash flow from our overriding royalty interests and other interests due to injury or loss of life, damage to or destruction of wells, production facilities or other property, clean-up responsibilities, regulatory investigations and penalties and suspension of operations. Any uninsured costs relating to the properties underlying the Net Profits Interests will be deducted as a production cost in calculating the net proceeds payable to us.
9
Table of Contents
Index to Financial Statements
Governmental policies, laws and regulations could have an adverse impact on our business and cash distributions.
Our business and the properties in which we hold interests are subject to federal, state and local laws and regulations relating to the oil and natural gas industry as well as regulations relating to safety matters. These laws and regulations can have a significant impact on production and costs of production. For example, both Oklahoma and Kansas, where properties that are subject to the Net Profits Interests are located, have the ability, directly or indirectly, to limit production from those properties, and such limitations or changes in those limitations could negatively impact us in the future.
As another example, Oklahoma regulations currently require administrative hearings to change the concentration of the operating partnership’s gas production wells from one well for each 640 acres in the Guymon-Hugoton field. Previously, certain interested parties have sought regulatory changes in Oklahoma for “infill,” or increased density drilling similar to that which is available in Kansas, which allows one well for each 320 acres. Should Oklahoma change its existing regulations to readily permit infill drilling, it is possible that a number of producers will commence increased density drilling in areas adjacent to the properties in Oklahoma that are subject to the Net Profits Interests. If the operating partnership or other operators of our properties do not do the same, our production levels relating to these properties may decrease, or mineral owners may demand increased density drilling. Capital expenditures relating to increased density on the properties underlying the Net Profits Interests would be deducted from amounts payable to us under the Net Profits Interests.
Environmental costs and liabilities and changing environmental regulation could affect our cash flow.
As with other companies engaged in the ownership and production of oil and natural gas, we always expect to have some risk of exposure to environmental costs and liabilities because the costs associated with environmental compliance or remediation could reduce the amount we would receive from our properties. The properties in which we hold interests are subject to extensive federal, state, tribal and local regulatory requirements relating to environmental affairs, health and safety and waste management. Governmental authorities have the power to enforce compliance with applicable regulations and permits, which could increase production costs on our properties and affect their cash flow. Third parties may also have the right to pursue legal actions to enforce compliance. It is likely that expenditures in connection with environmental matters, individually or as part of normal capital expenditure programs, will affect the net cash flow from our properties. Future environmental law developments, such as stricter laws, regulations or enforcement policies, could significantly increase the costs of production from our properties and reduce our cash flow.
Federal hydraulic fracturing legislation could delay or restrict development of our oil and natural gas properties.
Several proposals are before the U.S. Congress that, if implemented, would subject the process of hydraulic fracturing to regulation. Hydraulic fracturing involves the injection of water, sand and chemicals under pressure into rock formations to stimulate production. The use of hydraulic fracturing is necessary to produce commercial quantities of crude oil and natural gas from many reservoirs. Although it is not possible at this time to predict the final outcome of the legislation, any new federal restrictions on hydraulic fracturing could significantly increase operating, capital and compliance costs. Such cost increases could delay or restrict development by operators of our oil and natural gas properties.
Certain U.S. federal income tax deductions currently available with respect to oil and natural gas exploration and development may be eliminated as a result of future legislation.
The Proposed Fiscal Year 2010 Federal Budget includes legislation that would, if enacted into law, make significant changes to United States tax laws, including the elimination of certain key U.S. federal income tax incentives currently available to oil and natural gas exploration activities. These changes include, but are not limited to, (i) the repeal of the percentage depletion allowance for oil and natural gas properties, (ii) the
10
Table of Contents
Index to Financial Statements
elimination of current deductions for intangible drilling and development costs, and (iii) an extension of the amortization period for certain geological and geophysical expenditures. It is unclear whether any such changes will be enacted or how soon any such changes could become effective. The passage of any legislation as a result of these proposals or any other similar changes in U.S. federal income tax laws could eliminate certain tax deductions that are currently available to our unitholders and to oil and natural gas operators that we rely upon to develop our properties. Such legislation or changes could negatively impact both our unitholders and our Partnership financially.
The adoption of climate change legislation by Congress could result in increased operating costs and reduced demand for the oil and natural gas production from our properties.
On June 26, 2009, the U.S. House of Representatives approved adoption of the “American Clean Energy and Security Act of 2009,” also known as the “cap-and-trade legislation” or ACESA. One of the purposes of ACESA is to control and reduce emissions of “greenhouse gases,” or “GHGs,” in the United States. GHGs are certain gases, including carbon dioxide and methane, which may be contributing to warming of the Earth’s atmosphere and other climatic changes. ACESA would establish an economy-wide cap on emissions of GHGs in the United States and would require a gradual overall reduction in GHG emissions. The net effect of ACESA will be to impose increasing costs on the combustion of carbon-based fuels such as oil, refined petroleum products, and natural gas. The U.S. Senate has begun work on its own legislation for controlling and reducing emissions of GHGs in the United States. In addition to the pending climate legislation, the EPA has issued greenhouse gas monitoring and reporting regulations that went into effect January 1, 2010, and require reporting by regulated facilities by March 2011 and annually thereafter. Beyond measuring and reporting, the EPA issued an “Endangerment Finding” under section 202(a) of the Clean Air Act, concluding greenhouse gas pollution threatens the public health and welfare of current and future generations. The EPA has proposed regulation that would require permits for and reductions in greenhouse gas emissions for certain facilities and may issue final rules this year. Although it is not possible at this time to predict whether or when the Senate may act on climate change legislation or how any bill approved by the Senate would be reconciled with ACESA, any laws or regulations that may be adopted to restrict or reduce emissions of GHGs could require the operating partnership and oil and natural gas operators that develop our properties to incur increased operating costs and could have an adverse effect on demand for the oil and natural gas produced from our properties.
Our oil and natural gas reserve data and future net revenue estimates are uncertain.
Estimates of proved reserves and related future net revenues are projections based on engineering data and reports of independent consulting petroleum engineers hired for that purpose. The process of estimating reserves requires substantial judgment, resulting in imprecise determinations. Different reserve engineers may make different estimates of reserve quantities and related revenue based on the same data. Therefore, those estimates should not be construed as being accurate estimates of the current market value of our proved reserves. If these estimates prove to be inaccurate, our business may be adversely affected by lower revenues. We are affected by changes in oil and natural gas prices. Oil prices and natural gas prices may experience inverse price changes.
Risks Inherent In An Investment In Our Common Units
Cost reimbursement due our general partner may be substantial and reduce our cash available to distribute to our unitholders.
Prior to making any distribution on the common units, we reimburse the general partner and its affiliates for reasonable costs and expenses of management. The reimbursement of expenses could adversely affect our ability to pay cash distributions to our unitholders. Our general partner has sole discretion to determine the amount of these expenses, subject to the annual limit of 5% of an amount primarily based on our distributions to partners for that fiscal year. The annual limit includes carry-forward and carry-back features, which could allow costs in a year to exceed what would otherwise be the annual reimbursement limit. In addition, our general partner and its affiliates may provide us with other services for which we will be charged fees as determined by our general partner.
11
Table of Contents
Index to Financial Statements
Our net income as reported for tax and financial statement purposes may differ significantly from our cash flow that is used to determine cash available for distributions.
Net income as reported for financial statement purposes is presented on an accrual basis in conformity with accounting principles generally accepted in the United States of America. Unitholder K-1 tax statements are calculated based on applicable tax conventions, and taxable income as calculated for each year will be allocated among unitholders who hold units on the last day of each month. Distributions, however, are calculated on the basis of actual cash receipts, changes in cash reserves, and disbursements during the relevant reporting period. Consequently, due to timing differences between the receipt of proceeds of production and the point in time at which the production giving rise to those proceeds actually occurs, net income reported on our consolidated financial statements and on unitholder K-1’s will not reflect actual cash distributions during that reporting period.
Our unitholders have limited voting rights and do not control our general partner, and their ability to remove our general partner is limited.
Our unitholders have only limited voting rights on matters affecting our business. The general partner of our general partner manages our activities. Our unitholders only have the right to annually elect the managers comprising the Advisory Committee of the Board of Managers of the general partner of our general partner. Our unitholders do not have the right to elect the other managers of the general partner of our general partner on an annual or any other basis.
Our general partner may not be removed as our general partner except upon approval by the affirmative vote of the holders of at least a majority of our outstanding common units (including common units owned by our general partner and its affiliates), subject to the satisfaction of certain conditions. Our general partner and its affiliates do not own sufficient common units to be able to prevent its removal as general partner, but they do own sufficient common units to make the removal of our general partner by other unitholders difficult.
These provisions may discourage a person or group from attempting to remove our general partner or acquire control of us without the consent of our general partner. As a result of these provisions, the price at which our common units trade may be lower because of the absence or reduction of a takeover premium in the trading price.
The control of our general partner may be transferred to a third party without unitholder consent.
Our general partner has agreed not to withdraw voluntarily as our general partner on or before December 31, 2010 (with limited exceptions), unless the holders of at least a majority of our outstanding common units (excluding common units owned by our general partner and its affiliates) approve the withdrawal. However, the general partner may transfer its general partner interest to a third party in a merger or in a sale of all or substantially all of its assets without the consent of our unitholders. Other than some transfer restrictions agreed to among the owners of our general partner relating to their interests in our general partner, there is no restriction in our partnership agreement or otherwise for the benefit of our limited partners on the ability of the owners of our general partner to transfer their ownership interests to a third party. The new owner of the general partner would then be in a position to replace the management of our Partnership with its own choices.
Our general partner and its affiliates have conflicts of interests, which may permit our general partner and its affiliates to favor their own interests to the detriment of unitholders.
We and our general partner and its affiliates share, and therefore compete for, the time and effort of general partner personnel who provide services to us. Officers of our general partner and its affiliates do not, and are not required to, spend any specified percentage or amount of time on our business. In fact, our general partner has a duty to manage our Partnership in the best interests of our unitholders, but it also has a duty to operate its business for the benefit of its partners. Some of our officers are also involved in management and ownership roles in other oil and natural gas enterprises and have similar duties to them and devote time to their businesses.
12
Table of Contents
Index to Financial Statements
Because these shared officers function as both our representatives and those of our general partner and its affiliates and of third parties, conflicts of interest could arise between our general partner and its affiliates, on the one hand, and us or our unitholders, on the other, or between us or our unitholders on the one hand and the third parties for which our officers also serve management functions. As a result of these conflicts, our general partner and its affiliates may favor their own interests over the interests of unitholders.
We may issue additional securities, diluting our unitholders’ interests.
We can and may issue additional common units and other capital securities representing limited partnership units, including options, warrants, rights, appreciation rights and securities with rights to distributions and allocations or in liquidation equal or superior to our common units; however, a majority of the unitholders must approve such issuance if (i) the partnership securities to be issued will have greater rights or powers than our common units or (ii) if after giving effect to such issuance, such newly issued partnership securities represent over 20% of the outstanding limited partnership interests.
If we issue additional common units, it will reduce our unitholders’ proportionate ownership interest in us. This could cause the market price of the common units to fall and reduce the per unit cash distributions paid to our unitholders. In addition, if we issued limited partnership units with voting rights superior to the common units, it could adversely affect our unitholders’ voting power.
Our unitholders may not have limited liability in the circumstances described below and may be liable for the return of certain distributions.
Under Delaware law, our unitholders could be held liable for our obligations to the same extent as a general partner if a court determined that the right of unitholders to remove our general partner or to take other action under our partnership agreement constituted participation in the “control” of our business.
Our general partner generally has unlimited liability for the obligations of our Partnership, such as its debts and environmental liabilities, except for those contractual obligations of our Partnership that are expressly made without recourse to the general partner.
In addition, Section 17-607 of the Delaware Revised Uniform Limited Partnership Act provides that, under certain circumstances, a unitholder may be liable for the amount of distribution for a period of three years from the date of distribution.
Because we conduct our business in various states, the laws of those states may pose similar risks to our unitholders. To the extent to which we conduct business in any state, our unitholders might be held liable for our obligations as if they were general partners if a court or government agency determined that we had not complied with that state’s partnership statute, or if rights of unitholders constituted participation in the “control” of our business under that state’s partnership statute. In some of the states in which we conduct business, the limitations on the liability of limited partners for the obligations of a limited partnership have not been clearly established.
We are dependent upon key personnel, and the loss of services of any of our key personnel could adversely affect our operations.
Our continued success depends to a considerable extent upon the abilities and efforts of the senior management of our general partner, particularly William Casey McManemin, its Chief Executive Officer, James E. Raley, its Chief Operating Officer, and H. C. Allen, Jr., its Chief Financial Officer. The loss of the services of any of these key personnel could have a material adverse effect on our results of operations. We have not obtained insurance or entered into employment agreements with any of these key personnel.
13
Table of Contents
Index to Financial Statements
We are dependent on service providers who assist us with providing Schedule K-1 tax statements to our unitholders.
There are a very limited number of service firms that currently perform the detailed computations needed to provide each unitholder with estimated depletion and other tax information to assist the unitholder in various United States income tax computations. There are also very few publicly traded limited partnerships that need these services. As a result, the future costs and timeliness of providing Schedule K-1 tax statements to our unitholders is uncertain.
Tax Risks
The tax consequences to a unitholder of the ownership and sale of common units will depend in part on the unitholder’s tax circumstances. Each unitholder should, therefore, consult such unitholder’s own tax advisor about the federal, state and local tax consequences of the ownership of common units.
We have not received a ruling or assurances from the IRS or any state or local taxing authority on any matters affecting us.
We have not requested, and will not request, any ruling from the Internal Revenue Service, or IRS, or any state or local taxing authority with respect to owning and disposing of our common units or any other matter. It may be necessary to resort to administrative or court proceedings in an effort to sustain some or all of those conclusions or positions taken or expressed by us, and some or all of those conclusions or positions ultimately may not be sustained. Our unitholders and general partner will bear, directly or indirectly, the costs of any contest with the IRS or other taxing authority.
We will be subject to federal income tax and possibly certain state corporate income or franchise taxes if we are classified as a corporation and not as a partnership for federal income tax purposes.
As stated above, we have not requested, and will not request, any ruling from the IRS as to our status as a partnership for federal income tax purposes. If the IRS were to challenge our federal income tax status, such a challenge could result in an audit of our unitholders’ tax returns and adjustments to items on their tax returns that are unrelated to their ownership of our common units. In addition, our unitholders would bear the cost of any expenses incurred in connection with an examination of their personal tax returns.
If we were taxable as a corporation for federal income tax purposes in any taxable year, our income, gains, losses and deductions would be reflected on our tax return rather than being passed through proportionately to our unitholders, and our net income would be taxed at corporate rates. In addition, some or all of the distributions made to our unitholders would be treated as dividend income without offset for depletion, and distributions would be reduced as a result of the federal, state and local taxes paid by us.
The foregoing discussion relates to federal income taxes and possible application of certain state-level corporate income taxes and/or franchise taxes.
The IRS could reallocate items of income, gain, deduction and loss between transferors and transferees of common units if the IRS does not accept our monthly convention for allocating such items.
In general, each of our items of income, gain, loss and deduction will, for federal income tax purposes, be determined annually, and one twelfth of each annual amount will be allocated to those unitholders who hold common units on the last business day of each month in that year. In certain circumstances we may make these allocations in connection with extraordinary or nonrecurring events on a more frequent basis. As a result, transferees of our common units may be allocated items of our income, gain, loss and deduction realized by us prior to the date of their acquisition of our common units. There is no specific authority addressing the utilization of this method of allocating items of income, gain, loss and deduction by a publicly traded partnership such as us between transferors and transferees of its common units. If this method is determined to be an unreasonable
14
Table of Contents
Index to Financial Statements
method of allocation, our income, gain, loss and deduction would be reallocated among our unitholders and our general partner, and our unitholders may have more taxable income or less taxable loss. Our general partner is authorized to revise our method of allocation between transferors and transferees, as well as among our other unitholders whose common units otherwise vary during a taxable period, to conform to a method permitted or required by the Internal Revenue Code and the regulations or rulings promulgated thereunder.
Our unitholders may not be able to deduct losses attributable to their common units.
Any losses relating to our unitholders’ common units will be losses related to portfolio income and their ability to use such losses may be limited.
Our unitholders’ partnership tax information may be audited.
We will furnish our unitholders with a Schedule K-1 tax statement that sets forth their allocable share of income, gains, losses and deductions. In preparing this schedule, we will use various accounting and reporting conventions and various depreciation and amortization methods we have adopted. This schedule may not yield a result that conforms to statutory or regulatory requirements or to administrative pronouncements of the IRS. Further, our tax return may be audited, and any such audit could result in an audit of our unitholders’ individual income tax returns as well as increased liabilities for taxes because of adjustments resulting from the audit. An audit of our unitholders’ returns also could be triggered if the tax information relating to their common units is not consistent with the Schedule K-1 that we are required to provide to the IRS.
Our unitholders may have more taxable income or less taxable loss with respect to their common units if the IRS does not respect our method for determining the adjusted tax basis of their common units.
We have adopted a reporting convention that will enable our unitholders to track the basis of their individual common units or unit groups and use this basis in calculating their basis adjustments under Section 743 of the Internal Revenue Code and gain or loss on the sale of common units. This method does not comply with an IRS ruling that requires a portion of the combined tax basis of all common units to be allocated to each of the common units owned by a unitholder upon a sale or disposition of less than all of the common units and may be challenged by the IRS. If such a challenge is successful, our unitholders may have to recognize more taxable income or less taxable loss with respect to common units disposed of and common units they continue to hold.
Tax-exempt investors may recognize unrelated business taxable income.
Generally, unrelated business taxable income, or UBTI, can arise from a trade or business unrelated to the exempt purposes of the tax-exempt entity that is regularly carried on by either the tax-exempt entity or a partnership in which the tax-exempt entity is a partner. However, UBTI does not apply to interest income, royalties (including overriding royalties) or net profits interests, whether the royalties or net profits are measured by production or by gross or taxable income from the property. Pursuant to the provisions of our partnership agreement, our general partner shall use all reasonable efforts to prevent us from realizing income that would constitute UBTI. In addition, our general partner is prohibited from incurring certain types and amounts of indebtedness and from directly owning working interests or cost bearing interests and, in the event that any of our assets become working interests or cost bearing interests, is required to assign such interests to the operating partnership subject to the reservation of a net profits overriding royalty interest. However, it is possible that we may realize income that would constitute UBTI in an effort to maximize unitholder value.
Tax consequences of certain Net Profits Interests are uncertain.
We are prohibited from owning working interests or cost-bearing interests. At the time of the creation of the Minerals NPI, we assigned to the operating partnership all rights in any such working interests or cost-bearing interests that might subsequently be created from the mineral properties that were and are subject of the Minerals
15
Table of Contents
Index to Financial Statements
NPI. As additional working interests and other cost-bearing interests are created out of such mineral properties, they are owned by the operating partnership pursuant to such original assignment, and we have executed various documents since the creation of the Minerals NPI to confirm such treatment under the original assignment. This treatment could be characterized differently by the IRS, and in such a case we are unable to predict, with certainty, all of the income tax consequences relating to the Minerals NPI as it relates to such working interests and other cost-bearing interests.
Our unitholders may not be entitled to deductions for percentage depletion with respect to our oil and natural gas interests.
Our unitholders will be entitled to deductions for the greater of either cost depletion or (if otherwise allowable) percentage depletion with respect to the oil and natural gas interests owned by us. However, percentage depletion is generally available to a unitholder only if he qualifies under the independent producer exemption contained in the Internal Revenue Code. For this purpose, an independent producer is a person not directly or indirectly involved in the retail sale of oil, natural gas, or derivative products or the operation of a major refinery. If a unitholder does not qualify under the independent producer exemption, he generally will be restricted to deductions based on cost depletion.
Our unitholders may have more taxable income or less taxable loss on an ongoing basis if the IRS does not accept our method of allocating depletion deductions.
The Internal Revenue Code requires that income, gain, loss and deduction attributable to appreciated or depreciated property that is contributed to a partnership in exchange for a partnership interest in the partnership must be allocated so that the contributing partner is charged with, or benefits from, gain or unrealized loss, referred to as “Built-in Gain” and “Built-in Loss,” respectively, associated with the property at the time of its contribution to the partnership. Our partnership agreement provides that the adjusted tax basis of the oil and natural gas properties contributed to us is allocated to the contributing partners for the purpose of separately determining depletion deductions. Any gain or loss resulting from the sale of property contributed to us will be allocated to the partners that contributed the property, in proportion to their percentage interest in the contributed property, to take into account any Built-in Gain or Built-in Loss. This method of allocating Built-in Gain and Built-in Loss is not specifically permitted by United States Treasury regulations, and the IRS may challenge this method. Such a challenge, if successful, could cause our unitholders to recognize more taxable income or less taxable loss on an ongoing basis in respect of their common units.
Our unitholders may have more taxable income or less taxable loss on an ongoing basis if the IRS does not accept our method of determining a unitholder’s share of the basis of partnership property.
Our general partner utilizes a method of calculating each unitholder’s share of the basis of partnership property that results in an aggregate basis for depletion purposes that reflects the purchase price of common units as paid by the unitholder. This method is not specifically authorized under applicable Treasury regulations, and the IRS may challenge this method. Such a challenge, if successful, could cause our unitholders to recognize more taxable income or less taxable loss on an ongoing basis in respect of their common units.
The ratio of the amount of taxable income that will be allocated to a unitholder to the amount of cash that will be distributed to a unitholder is uncertain, and cash distributed to a unitholder may not be sufficient to pay tax on the income we allocate to a unitholder.
The amount of taxable income realized by a unitholder will be dependent upon a number of factors including: (i) the amount of taxable income recognized by us; (ii) the amount of any gain recognized by us that is attributable to specific asset sales that may be wholly or partially attributable to Built-in Gain and the resulting allocation of such gain to a unitholder, depending on the asset being sold; (iii) the amount of basis adjustment pursuant to the Internal Revenue Code available to a unitholder based on the purchase price for any common
16
Table of Contents
Index to Financial Statements
units and the amount by which such price was greater or less than a unitholder’s proportionate share of inside tax basis of our assets attributable to the common units when the common units were purchased; and (iv) the method of depletion available to a unitholder. Therefore, it is not possible for us to predict the ratio of the amount of taxable income that will be allocated to a unitholder to the amount of cash that will be distributed to a unitholder.
A unitholder may lose his status as a partner of our Partnership for federal income tax purposes if he lends our common units to a short seller to cover a short sale of such common units.
If a unitholder loans his common units to a short seller to cover a short sale of common units, he may be considered as having disposed of his ownership of those common units for federal income tax purposes. If so, the unitholder would no longer be a partner of our Partnership for tax purposes with respect to those common units during the period of the loan and may recognize gain or loss from the disposition. As a result, during this period, any of our income, gain, loss or deduction with respect to those common units would not be reportable, and any cash distributions received for those common units would be fully taxable and may be treated as ordinary income.
If we are not notified (either directly or through a broker) of a sale or other transfer of common units, some distributions and federal income tax information or reports with respect to such units may not be provided to the purchaser or other transferee of the units and may instead continue to be provided to the original transferor.
If our transfer agent or any other nominee holding common units on behalf of a partner is not timely notified, and a proper transfer of ownership is not recorded on the appropriate books and records, of a sale or other transfer of common units, some distributions and federal income tax information or reports with respect to these common units may not be made or provided to the transferee of the units and may instead continue to be made or provided to the original transferor. Notwithstanding a transferee’s failure to receive distributions and federal income tax information or reports from us with respect to these units, the IRS may contend that such transferee is a partner for federal income tax purposes and that some allocations of income, gain, loss or deduction by us should have been reported by such transferee. Alternatively, the IRS may contend that the transferor continues to be a partner for federal income tax purposes and that allocations of income, gain, loss or deduction by us should have been reported by such transferor. If the transferor is not treated as a partner for federal income tax purposes, any cash distributions received by such transferor with respect to the transferred units following the transfer would be fully taxable as ordinary income to the transferor.
A sale or exchange of 50% or more of the total interests in our capital and profits within a 12-month period could result in adverse tax consequences to a unitholder.
We will terminate for federal income tax purposes if there is a sale or exchange of 50% or more of the total interests in our capital and profits within a 12-month period. A termination would result in the closing of our taxable year for a unitholder. As a result, if a unitholder has a different taxable year than we have, he may be required to include his allocable share of our income, gain, loss, deduction, credits and other items from both the taxable year ending prior to the year of our termination and the short taxable year ending at the time of our termination in the same taxable year. A termination also could result in penalties if we were unable to determine that the termination occurred.
Foreign, state and local taxes could be withheld on amounts otherwise distributable to a unitholder.
A unitholder may be required to file tax returns and be subject to tax liability in the foreign, state or local jurisdictions where he resides and in each state or local jurisdiction in which we have assets or otherwise do business. We also may be required to withhold state income tax from distributions otherwise payable to a unitholder, and state income tax may be withheld by others on royalty payments to us.
17
Table of Contents
Index to Financial Statements
Disclosure Regarding Forward-Looking Statements
Statements included in this report that are not historical facts (including any statements concerning plans and objectives of management for future operations or economic performance, or assumptions or forecasts related thereto), are forward-looking statements. These statements can be identified by the use of forward-looking terminology including “may,” “believe,” “will,” “expect,” “anticipate,” “estimate,” “continue” or other similar words. These statements discuss future expectations, contain projections of results of operations or of financial condition or state other forward-looking information.
These forward-looking statements are made based upon management’s current plans, expectations, estimates, assumptions and beliefs concerning future events impacting us and, therefore, involve a number of risks and uncertainties. We caution that forward-looking statements are not guarantees and that actual results could differ materially from those expressed or implied in the forward-looking statements for a number of important reasons, including those discussed under “Risk Factors” and elsewhere in this report.
You should read these statements carefully because they may discuss our expectations about our future performance, contain projections of our future operating results or our future financial condition, or state other forward-looking information. Before you invest, you should be aware that the occurrence of any of the events herein described in “Risk Factors” and elsewhere in this report could substantially harm our business, results of operations and financial condition and that upon the occurrence of any of these events, the trading price of our common units could decline, and you could lose all or part of your investment.
| ITEM 1B. | UNRESOLVED STAFF COMMENTS |
None.
| ITEM 2. | PROPERTIES |
Facilities
Our office in Dallas consists of 11,847 square feet of leased office space. The operating partnership owns a field office in Hooker, Oklahoma and leases part of an office in Amarillo, Texas.
Properties
We own two categories of properties: Royalty Properties and Net Profits Interests.
Royalty Properties
We own Royalty Properties representing producing and nonproducing mineral, royalty, overriding royalty, net profits and leasehold interests in properties located in 574 counties and parishes in 25 states. Acreage amounts listed herein represent our best estimates based on information provided to us as a royalty owner. Due to the significant number of individual deeds, leases and similar instruments involved in the acquisition and development of the Royalty Properties by us or our predecessors, acreage amounts are subject to change as new information becomes available. In addition, as a royalty owner, our access to information concerning activity and operations on the Royalty Properties is limited. Most of our producing properties are subject to old leases and other contracts pursuant to which we are not entitled to well information. Some of our newer leases provide for access to technical data and other information. We may have limited access to public data in some areas through third party subscription services. Consequently, the exact number of wells producing from or drilling on the Royalty Properties is not determinable. The primary manner by which we will become aware of activity on the Royalty Properties is the receipt of division orders or other correspondence from operators or purchasers.
18
Table of Contents
Index to Financial Statements
Acreage Summary
The following table sets forth as of December 31, 2009, a summary of our gross and net, where applicable, acres of mineral, royalty, overriding royalty and leasehold interests, and a compilation of the number of counties and parishes and states in which these interests are located. The majority of our net mineral acres are unleased. Acreage amounts may not add across due to overlapping ownership among categories.
| Mineral | Royalty | Overriding Royalty |
Leasehold | Total | ||||||
| Number of States |
25 | 17 | 17 | 8 | 25 | |||||
| Number of Counties/Parishes |
465 | 190 | 137 | 34 | 574 | |||||
| Gross Acres |
2,308,263 | 617,081 | 208,755 | 37,338 | 3,122,867 | |||||
| Net Acres (where applicable) |
355,692 | — | — | — | 355,692 |
Our net interest in production from royalty, overriding royalty and leasehold interests is based on lease royalty and other third-party contractual terms, which vary from property to property. Consequently, net acreage ownership in these categories is not determinable. Our net interest in production from properties in which we own a royalty or overriding royalty interest may be affected by royalty terms negotiated by the mineral interest owners in such tracts and their lessees. Our interest in the majority of these properties is perpetual in nature. However, a minor portion of the properties are subject to terms and conditions pursuant to which a portion of our interest may terminate upon cessation of production.
The following table sets forth, as of December 31, 2009, the combined summary of total gross and net (where applicable) acres of mineral, royalty, overriding royalty and leasehold interests in each of the states in which these interests are located.
| State |
Gross | Net | State |
Gross | Net | |||||
| Alabama |
106,055 | 7,797 | Missouri | 344 | 43 | |||||
| Arkansas |
47,434 | 15,732 | Montana | 281,890 | 62,850 | |||||
| California |
1,451 | 162 | Nebraska | 3,360 | 257 | |||||
| Colorado |
22,880 | 1,424 | New Mexico | 42,410 | 2,489 | |||||
| Florida |
88,832 | 24,249 | New York | 23,077 | 18,440 | |||||
| Georgia |
3,676 | 1,024 | North Dakota | 293,251 | 37,694 | |||||
| Illinois |
4,729 | 885 | Oklahoma | 230,560 | 16,806 | |||||
| Indiana |
303 | 113 | Pennsylvania | 9,513 | 4,841 | |||||
| Kansas |
13,981 | 2,385 | South Dakota | 14,407 | 1,266 | |||||
| Kentucky |
1,995 | 553 | Texas | 1,641,199 | 141,581 | |||||
| Louisiana |
131,075 | 2,415 | Utah | 5,937 | 200 | |||||
| Michigan |
54,234 | 2,623 | Wyoming | 28,248 | 1,256 | |||||
| Mississippi |
72,026 | 8,607 |
Leasing Activity
We received cash payments in the amount of $663,000 during 2009 attributable to lease bonus on 47 leases and six pooling elections in lands located in 22 counties and parishes in four states. These leases reflected bonus payments ranging up to $1,200/acre and initial royalty terms ranging up to 30%. Many of these leases contain additional overriding royalty interests and provisions for optional working interest participation in subsequent wells, back-in working interests after payout or escalating royalty terms.
We received cash payments in the amount of $61,000 during the fourth quarter of 2009 attributable to lease bonus on eight leases of our interests in lands located in six counties and parishes in two states. These leases reflected bonus payments ranging up to $400/acre and initial royalty terms ranging up to 25%.
19
Table of Contents
Index to Financial Statements
The following table sets forth a summary of leases and pooling elections consummated during 2007 through 2009.
| 2009 | 2008 | 2007 | ||||||||||
| Consummated Leases |
||||||||||||
| Number |
53 | 51 | 107 | |||||||||
| Number of States |
4 | 4 | 6 | |||||||||
| Number of Counties |
22 | 19 | 27 | |||||||||
| Average Royalty |
23.4 | % | 25.0 | % | 24.1 | % | ||||||
| Average Bonus, $/acre |
$ | 565 | $ | 398 | $ | 222 | ||||||
| Total Lease Bonus—cash basis |
$ | 663,000 | $ | 441,000 | $ | 609,000 | ||||||
Three leases were granted for no bonus consideration in 2009, which reflected royalty terms of 25%. Average bonus and royalty terms reflected above include these three leases. One lease was granted in 2009, which included (in addition to royalty or bonus) an overriding royalty interest, back-in working interest or optional working interest participation. Average royalty terms reflected above do not reflect these additional interests. Amounts reflected above may differ from our consolidated financial statements, which are presented on an accrual basis. Average royalty and average bonus exclude amounts attributable to pooling elections. Payments received for gas storage, shut-in and delay rental payments, coal royalty, surface use agreements, litigation judgments and settlement proceeds are reflected in our consolidated financial statements in various categories including, but not limited to, other operating revenues and other income.
Net Profits Interests
We own net profits overriding royalty interests (referred to as the Net Profits Interests) in various properties owned by the operating partnership. We receive monthly payments equaling 96.97% of the net profits actually realized by the operating partnership from these properties in the preceding month. In the event costs exceed revenues on a cash basis in a given month for properties subject to a Net Profits Interest, no payment is made and any deficit is accumulated and carried over and reflected in the following month’s calculation of net profit.
We own five separate Net Profits Interests, four of which were created in connection with the combination in 2003 and one immaterial deficit Net Profits Interest that was subsequently created. Three of these Net Profits Interests have been in a continuous profit status other than temporary deficits in that revenues have exceeded costs and cash payments have been made by the operating partnership to us each quarter. The purpose of such Net Profits Interests is to avoid the participation as a working interest or other cost-bearing owner that could result in unrelated business taxable income. Net profits interest payments are not considered unrelated business taxable income for tax purposes. The fourth Net Profits Interest, referred to as the Minerals NPI, has continuously had costs that exceed revenues. As of December 31, 2009, cumulative operating and development costs presented in the following table, which include amounts equivalent to an interest charge, exceeded cumulative revenues of the Minerals NPI, resulting in a cumulative deficit. All cumulative deficits (which represent cumulative excess of operating and development costs over revenue received) are borne 100% by our general partner until the Minerals NPI recovers the deficit amount. Once in profit status, we will receive the Net Profits Interest payments attributable to these properties. Our consolidated financial statements do not reflect activity attributable to properties subject to Net Profits Interests that are in a deficit status. Consequently, net profits interest payments, production sales volumes and prices, and oil and natural gas reserves set forth in other portions of this annual report do not reflect amounts attributable to the Minerals NPI, which includes all of the operating partnership’s Fayetteville Shale working interest properties in Arkansas.
20
Table of Contents
Index to Financial Statements
The following tables set forth cash receipts and disbursements, production volumes and reserves attributable to the Minerals NPI from inception through 2004 and the calendar years 2005 through 2009.
| Minerals NPI Cash Basis Results Year Ended December 31, (in Thousands) |
Total | |||||||||||||||||||||||||||
| Inception through 2004 |
2005 | 2006 | 2007 | 2008 | 2009 | |||||||||||||||||||||||
| Cash received for revenue |
$ | 1,011 | $ | 1,447 | $ | 2,487 | $ | 3,255 | $ | 6,016 | $ | 3,408 | $ | 17,624 | ||||||||||||||
| Cash paid for operating costs |
151 | 249 | 452 | 521 | 853 | 865 | 3,091 | |||||||||||||||||||||
| Cash paid for development costs |
1,534 | 1,086 | 1,691 | 2,635 | 4,778 | 4,348 | 16,072 | |||||||||||||||||||||
| Budgeted capital expenditures |
905 | 890 | 1,795 | |||||||||||||||||||||||||
| Net cash (paid) received |
$ | (674 | ) | $ | 112 | $ | 344 | $ | 99 | $ | (520 | ) | $ | (2,695 | ) | $ | (3,334 | ) | ||||||||||
| Cumulative NPI Deficit |
$ | (674 | ) | $ | (562 | ) | $ | (218 | ) | $ | (119 | ) | $ | (639 | ) | $ | (3,334 | ) | ||||||||||
The revenue amounts, the production volumes, and the proved reserves presented include only properties producing revenue. The development cost amounts pertain to more properties than the properties producing revenue due to timing differences between operating partnership expenditures and oil and natural gas production and payments to the operating partnership.
| Minerals NPI Cash Basis Production Year ended December 31, |
Total | |||||||||||||||||||
| Inception through 2004 |
2005 | 2006 | 2007 | 2008 | 2009 | |||||||||||||||
| Natural Gas mcf |
138,657 | 126,167 | 190,903 | 291,278 | 418,743 | 596,341 | 1,762,089 | |||||||||||||
| Oil & Condensate bbl |
5,115 | 9,434 | 17,447 | 19,662 | 22,480 | 21,104 | 95,242 | |||||||||||||
| Indicated Gas Price, $/mcf |
$ | 7.37 | $ | 7.26 | $ | 6.58 | $ | 8.55 | $ | 3.74 | $ | 6.17 | ||||||||
| Indicated Oil/Condensate Price, $/bbl |
$ | 54.58 | $ | 61.05 | $ | 62.93 | $ | 100.98 | $ | 48.80 | $ | 66.16 | ||||||||
The indicated prices set forth above are calculated by dividing each year’s gross revenues for each product by the production volume of the corresponding product. Cash received for revenue includes minor amounts of non-product revenue. Such calculation does not necessarily reflect contractual terms for sales and may be affected by transportation costs, location differentials, quality and gravity adjustments and timing differences between production and cash receipts, including release of suspended funds, initial payments for accumulated sales, or prior period adjustments.
| All Proved Developed and Located in the United States |
Minerals NPI Reserves Year ended December 31, | ||||||||||||||||||||
| 2004(2) | 2005(2) | 2006(2) | 2007(2) | 2008(2) | 2009(2) | 2009(1) | |||||||||||||||
| Proved Reserves |
|||||||||||||||||||||
| Natural Gas (mmcf) |
273 | 313 | 532 | 1,442 | 1,993 | 3,239 | 3,016 | ||||||||||||||
| Oil & Condensate (mbbls) |
7 | 32 | 46 | 34 | 65 | 66 | 65 | ||||||||||||||
| Future Net Revenues ($ in thousands) |
$ | 1,352 | $ | 3,399 | $ | 4,309 | $ | 10,523 | $ | 9,341 | $ | 15,843 | $ | 8,950 | |||||||
| Standardized Measure ($ in thousands) |
$ | 1,033 | $ | 2,655 | $ | 3,405 | $ | 7,253 | $ | 6,533 | $ | 11,078 | $ | 6,451 | |||||||
| (1) | Based on unweighted arithmetic average of the first day-of-the-month price of oil and natural gas |
| (2) | Based on year-end pricing of oil and natural gas |
Amounts in the above tables reflect the operating partnership’s ownership of the subject properties. Net Profits Interest payments to us, if any, will equal 96.97% of the cumulative net profits actually received by the operating partnership attributable to the subject properties. The above production sales volumes, indicated prices, oil and natural gas reserves, and financial information attributable to the Minerals NPI may not be indicative of future results of the Minerals NPI and may not indicate when the deficit status may end and when Net Profits Interests payment may begin from the Minerals NPI.
21
Table of Contents
Index to Financial Statements
The Minerals NPI includes numerous opportunities for the operating partnership to participate as a working interest owner in drilling activity on lands in which we owned a mineral or royalty interest as of the date such Minerals NPI was created. Most of these opportunities are evidenced by a contractual option, but not the obligation, to participate in activity located in defined lands and leases, although some arise by non-contractual means or by operation of law. With regard to the opportunities evidenced by a contractual option, the operating partnership’s decision to exercise these options and participate as a working interest owner is made on a well-by-well basis and only in the event a third party proposes to drill a well subject to the contractual option. With regard to the opportunities to participate as a working interest owner that arise non-contractually or by operation of law, we obtain or are provided those opportunities due to the actions of persons that we do not control. Thus, we are unable to project when wells may be drilled, whether the operating partnership may elect to participate, or otherwise end up participating, in such drilling or the magnitude of the corresponding investment, either individually or in the aggregate, with respect to the Minerals NPI. In the event the operating partnership does elect to participate pursuant to these options, or otherwise ends up so participating per force of certain non-contractual relationships or by operation of law, the Minerals NPI deficit is likely to increase. Regardless of the operating partnership’s future voluntary or involuntary participation, we believe net profits interest payments, if any, made upon the Minerals NPI’s first reaching profit status will be minimal as development of these properties, and consequently the operating partnership’s payments of development expenditures associated therewith, is likely to continue for at least five years. See the discussion under “Drilling Activity” below for additional information on some of these working interest participation options and possibilities.
Acreage Summary
The following tables set forth, as of December 31, 2009, information concerning properties owned by the operating partnership and subject to the Net Profits Interests, including the Minerals NPI properties. Acreage amounts listed under “Leasehold” reflect gross acres leased by the operating partnership and the working interest share (net acres) in those properties. Acreage amounts listed under “Mineral” reflect gross acres in which the operating partnership owns a mineral interest and the undivided mineral interest (net acres) in those properties. The operating partnership’s interest in these properties may be unleased, leased by others or a combination thereof. Acreage amounts may not add across due to overlapping ownership among categories.
| Mineral | Royalty | Leasehold | Total | |||||
| Number of States |
11 | 2 | 6 | 12 | ||||
| Number of Counties/Parishes |
58 | 2 | 13 | 65 | ||||
| Gross Acres |
48,570 | 640 | 109,543 | 158,753 | ||||
| Net Acres |
5,405 | — | 83,865 | 89,270 |
The following table reflects the states in which the acreage amounts listed above are located.
| Mineral/Royalty | Leasehold | Total | ||||||||||
| Gross | Net | Gross | Net | Gross | Net | |||||||
| Oklahoma |
11,200 | 955 | 79,861 | 74,031 | 91,061 | 74,986 | ||||||
| Kansas |
640 | 20 | 7,035 | 7,035 | 7,675 | 7,055 | ||||||
| Arkansas |
679 | 308 | 19,787 | 2,637 | 20,466 | 2,945 | ||||||
| All Others |
36,691 | 4,122 | 2,860 | 162 | 39,551 | 4,284 | ||||||
| Totals |
49,210 | 5,405 | 109,543 | 83,865 | 158,753 | 89,270 | ||||||
The operating partnership owns working interests below the currently producing horizons in 47,360 gross/46,960 net acres in Texas County, Oklahoma. The operating partnership has from time to time farmed out its leasehold interests in portions of these lands, reserving an overriding royalty interest therein, and will consider additional exploration or development of these lands as circumstances warrant. The leasehold acreage includes all of the acreage in the Fayetteville Shale properties of Arkansas in which we have the right to participate.
22
Table of Contents
Index to Financial Statements
Costs Incurred
The following table sets forth information regarding 100% of the costs incurred on a cash basis by the operating partnership during the periods indicated in connection with the properties underlying the Net Profits Interests.
| Years ended December 31, | |||||||||
| 2009 | 2008 | 2007 | |||||||
| (in thousands) | |||||||||
| Acquisition costs |
$ | 35,245 | $ | — | $ | — | |||
| Development costs (1) |
5,791 | 5,795 | 3,821 | ||||||
| Total |
$ | 41,036 | $ | 5,795 | $ | 3,821 | |||
| (1) | The years ended December 31, 2007, 2008 and 2009 include $2,647,000, $5,698,000 and $5,753,000, respectively, attributable to NPIs not yet in pay status. |
Productive Well Summary
The following table sets forth, as of December 31, 2009, the combined number of producing wells on the properties subject to the Net Profits Interests, including the Minerals NPI. Gross wells refer to wells in which a working interest is owned. Net wells are determined by multiplying gross wells by the working interest in those wells.
| Productive Wells/Units(1) | ||||
| Location |
Gross | Net | ||
| Oklahoma |
200 | 120.3 | ||
| Kansas |
20 | 20.0 | ||
| All others |
224 | 10.9 | ||
| Total |
444 | 151.2 | ||
| (1) | Multiple well units operated by someone other than the operating partnership and in which we own Net Profits Interests are included as one gross well. |
Drilling Activity
We received division orders for or otherwise identified 353 new wells completed on our Royalty Properties in 11 states during 2009. Forty-nine new wells were completed and we identified nine wells that were completed in prior years on our Net Profits Interests properties, all located in four states during 2009, with 10 additional wells in various stages of drilling or completion operations at year-end. Selected new wells and the royalty interests owned by us and the working and net revenue interests owned by the operating partnership are summarized below.
23
Table of Contents
Index to Financial Statements
This table does not include wells drilled in the Fayetteville Shale trend as they are detailed in a subsequent discussion and table.
| DMLP NRI(2) |
DMOLP | Test Rates per day | |||||||||||||||||
| ST |
County/Parish | Operator |
Well Name |
WI(1) | NRI(2) | Gas, mcf | Oil, bbls | ||||||||||||
| AR |
Logan | XTO Energy | Winters, Bobby 1-18 | 2.74 | % | 2,039 | |||||||||||||
| AR |
Logan | XTO Energy | Turner Unit 4-18 | 2.74 | % | 1,968 | |||||||||||||
| AR |
Logan | XTO Energy | K K Williams #06-03 | 0.92 | % | 5,404 | |||||||||||||
| LA |
De Soto | Comstock Oil & Gas | HA RA SUA; Robert Crews #3ALT | 2.73 | % | 2,350 | |||||||||||||
| LA |
De Soto | Comstock Oil & Gas | Lena Crews #5 Alt | 2.73 | % | 1,700 | |||||||||||||
| ND |
Mountrail | EOG Resources | Austin 20-29 H | 2.97 | % | 587 | 1,595 | ||||||||||||
| OK |
Caddo | St. Mary Land & Exp. | Reiss Trust 1-16 | 1.32 | % | 1.32 | % | 9,896 | |||||||||||
| OK |
Ellis | Plains Marketing LP | Raiders 5-27H | 3.75 | % | 9.06 | % | 1,142 | 176 | ||||||||||
| OK |
Roger Mills | Burlington Resources | Troy Miller #17-11 | 1.67 | % | 2,803 | 5 | ||||||||||||
| OK |
Washita | Chesapeake Operating | Schones 1-10H | 1.04 | % | 4,335 | 166 | ||||||||||||
| TX |
Hidalgo | Chesapeake Operating | Barton Gas Unit #1 | 3.13 | % | 2,435 | |||||||||||||
| TX |
Matagorda | Square Mile Energy | Highwire #1 Gas Unit | 6.67 | % | 1,086 | |||||||||||||
| TX |
Shelby | Devon Energy Corp. | Oliver Gas Unit 4 | 0.36 | % | 19,623 | |||||||||||||
| TX |
Starr | El Paso E & P Co., LP | Guerra USA GU “D” #17 | 8.19 | % | 6,800 | |||||||||||||
| TX |
Starr | RAM Operating Co. | Garza Hitchcock #18 | 2.65 | % | 2,491 | |||||||||||||
| TX |
Tarrant | Chesapeake Operating | Bass 311 B #2H | 20.00 | % | 2,092 | |||||||||||||
| TX |
Wheeler | Devon Energy Corp. | Effie Hayes #18-5H | 3.13 | % | 4,377 | |||||||||||||
| TX |
Wheeler | Kaiser-Francis Oil Co. | Burrell A W 104 | 0.71 | % | 8,964 | |||||||||||||
| (1) | WI means the working interest owned by the operating partnership and subject to the Net Profits Interest. |
| (2) | NRI means the net revenue interest attributable to our royalty interest or to the operating partnership’s royalty and working interest, which is subject to the Net Profits Interest. |
24
Table of Contents
Index to Financial Statements
Additional information concerning selected recent activity is summarized below:
Fayetteville Shale Trend of Northern Arkansas—We own varying undivided perpetual mineral interests totaling 23,336/11,464 gross/net acres located in Cleburne, Conway, Faulkner, Franklin, Johnson, Pope, Van Buren, and White counties, Arkansas in an area commonly referred to as the “Fayetteville Shale” trend of the Arkoma Basin. One hundred ninety-nine wells have been permitted on the lands as of December 31, 2009, of which the operating partnership has an interest in 129. In total, 166 wells had been spud, 140 had been completed as producers and 23 were in various stages of drilling or completion operations. Wells that have been proposed to be drilled by the operator but for which permits have not yet been issued by the Arkansas Oil & Gas Commission are not reflected in this number. Available test results for wells completed in 2009, along with ownership interests owned by us and interests owned by the operating partnership subject to the Minerals NPI, are summarized in the following table.
| DMLP NRI(2) |
DMOLP | Gas Test Rates Mcf per day | ||||||||||
| County |
Operator | Well Name |
WI(1) | NRI(2) | ||||||||
| Cleburne |
SEECO | Mulliniks 9-12 #5-35H36 | 1.716 | 3.661 | 2.746 | 5,015 | ||||||
| Cleburne |
SEECO | Mulliniks 9-12 #4-35H36 | 1.997 | 2.841 | 2.130 | 5,023 | ||||||
| Cleburne |
SEECO | Mulliniks 9-12 #6-35H2 | 1.401 | 1.992 | 1.494 | 4,323 | ||||||
| Conway |
Chesapeake | Collinsworth 7-16 #1-10H3 | 2.336 | 4.599 | 3.449 | 4,815 | ||||||
| Conway |
SEECO | Charles Reeves 9-15 #3-10H3 | 2.954 | 4.726 | 3.544 | 3,976 | ||||||
| Conway |
SEECO | Charles Reeves 9-15 #5-10H3 | 2.943 | 4.709 | 3.532 | 3,884 | ||||||
| Conway |
SEECO | Polk 9-15 #4-30H | 5.930 | 5.561 | 4.220 | 2,434 | ||||||
| Conway |
Chesapeake | Collinsworth 7-16 #2-10H | 2.343 | 4.614 | 3.460 | 4,121 | ||||||
| Conway |
SEECO | Jerome Carr 9-15 #4-31H | 2.188 | 3.796 | 2.847 | 3,911 | ||||||
| Conway |
SEECO | Deltic Timber 9-16 #4-36H31 | 1.384 | 2.400 | 1.800 | 4,625 | ||||||
| Conway |
SEECO | Charles Reeves 9-15 #4-10H3 | 3.038 | 4.861 | 3.645 | 1,895 | ||||||
| Conway |
SEECO | Bryant 9-15 #4-32H31 | 0.985 | 1.709 | 1.282 | 5,499 | ||||||
| Faulkner |
Chesapeake | Glover 8-13 #2-25H | 2.990 | 4.807 | 3.614 | 2,439 | ||||||
| Faulkner |
Chesapeake | Glover 8-13 #1-25H | 3.222 | 7.185 | 5.648 | 1,433 | ||||||
| Van Buren |
SEECO | Howard Family Trust 10-12 #2-9H16 | 2.594 | 4.576 | 3.432 | 5,184 | ||||||
| Van Buren |
SEECO | Handy 10-12 #5-18H | 2.972 | 6.347 | 4.760 | 3,679 | ||||||
| Van Buren |
SEECO | Handy 10-12 #6-18H | 2.972 | 6.347 | 4.760 | 3,422 | ||||||
| Van Buren |
SEECO | Handy 10-12 #4-18H | 2.971 | 6.344 | 4.758 | 2,876 | ||||||
| Van Buren |
SEECO | Linn 10-12 #4-8H16 | 3.798 | 4.149 | 3.133 | 2,766 | ||||||
| Van Buren |
SEECO | Linn 10-12 #3-8H16 | 2.769 | 3.412 | 2.572 | 3,175 | ||||||
| Van Buren |
SEECO | Collums-Pennington 10-12 #2-20H | 2.344 | 4.375 | 3.281 | 2,229 | ||||||
| White |
Chesapeake | Webb 9-6 #3-35H | 2.344 | 4.380 | 3.285 | 2,258 | ||||||
| White |
Chesapeake | Webb 9-6 #2-35H | 2.344 | 4.380 | 3.285 | 2,250 | ||||||
| (1) | WI means the working interest owned by the operating partnership and subject to the Minerals NPI. |
| (2) | NRI means the net revenue interest attributable to our royalty interest or to the operating partnership’s royalty and working interest, which is subject to the Minerals NPI. |
Set forth below is a summary of all permitting, drilling and completion activity through December 31, 2009 for wells in which we have a royalty or Net Profits Interest. This includes wells subject to the Minerals NPI, which is currently in deficit status.
| 2004 through 2006 |
2007 | 2008 | Q1 2009 |
Q2 2009 |
Q3 2009 |
Q4 2009 |
Total to Date | |||||||||
| New Well Permits |
14 | 35 | 71 | 19 | 20 | 22 | 18 | 199 | ||||||||
| Wells Spud |
10 | 33 | 62 | 22 | 16 | 7 | 16 | 166 | ||||||||
| Wells Completed |
6 | 23 | 56 | 13 | 14 | 14 | 14 | 140 | ||||||||
| Royalty Wells in Pay Status(1) |
1 | 14 | 32 | 14 | 10 | 14 | 20 | 105 |
| (1) | Wells in Pay Status means wells for which revenue was initially received during the indicated period. |
25
Table of Contents
Index to Financial Statements
Our estimated proved reserves as of December 31, 2009, include reserves attributable to our royalty interest in 115 wells totaling 2.26 bcf. Proved reserves attributable to working interests owned by the operating partnership totaled 2.60 bcf in 84 wells. These estimates only include wells for which test rates have been obtained.
Net cash receipts for the Royalty Properties attributable to interests in these lands totaled $1,497,000 in 2009 from 91 wells. Net cash receipts for the Minerals NPI properties attributable to interests in these lands totaled $1,309,000 in 2009 from 60 wells. Fourth quarter net cash receipts for the Royalty Properties and the Minerals NPI properties totaled $375,000 from 88 wells and $317,000 from 55 wells, respectively.
Horizontal Bakken, Williston Basin—We own varying undivided perpetual mineral interests totaling 70,390/7,602 gross/net acres located in Burke, Divide, Dunn, McKenzie, Mountrail and Williams Counties, North Dakota. Operators active in this area include Continental Resources, EOG Resources, Hess Corporation, Marathon Oil Company, and Whiting Oil & Gas. There have been a total of 83 wells permitted on these lands as of December 31, 2009 with 60 completed as producers. In all cases we have elected not to lease our lands and not to pay our share of well costs, thus becoming a non-consenting mineral owner. According to North Dakota law, non-consenting owners receive the average royalty rate from the date of first production and back-in for their full working interest after the operator has recovered 150% of drilling and completion costs. Once 150% payout occurs, the working interest will be owned by the operating partnership and subject to the Minerals NPI. Non-consenting owners are not entitled to well data other than public information available from the North Dakota Industrial Commission. As of December 31, 2009, these wells had achieved 150% payout.
Set forth below is a summary of all permitting, drilling and completion activity through December 31, 2009 for wells in which we have a royalty or Net Profits Interest. This includes wells subject to the Minerals NPI, which is currently in a deficit status.
| 2004 through 2006 |
2007 | 2008 | Q1 2009 |
Q2 2009 |
Q3 2009 |
Q4 2009 |
Total to Date | |||||||||
| New Well Permits |
3 | 15 | 45 | 0 | 6 | 0 | 14 | 83 | ||||||||
| Wells Spud |
2 | 12 | 27 | 11 | 4 | 7 | 6 | 69 | ||||||||
| Wells Completed |
2 | 7 | 23 | 9 | 8 | 9 | 2 | 60 | ||||||||
| Wells in Pay Status(1) |
0 | 0 | 3 | 0 | 0 | 0 | 0 | 3 |
| (1) | Wells in Pay Status means wells for which revenue was initially received during the indicated period. |
Appalachian Basin—We own varying undivided perpetual mineral interests in approximately 31,000/22,000 gross/net acres in 19 counties in southern New York and northern Pennsylvania. Approximately 75% of these net acres are located in eastern Allegany and western Steuben Counties, New York, an area which some industry press reports suggest may be prospective for gas production from unconventional reservoirs, including the Marcellus Shale. The New York State Department of Environmental Conservation has restricted permitting in the Marcellus shale pending a regulatory review of high-volume hydraulic fracturing practices. Development of these natural gas resources will be limited until this regulatory issue has been resolved. We continue to monitor industry activity and encourage dialogue with industry participants to determine the proper course of action regarding our interests in this area.
Barnett Shale—We own producing and nonproducing mineral and royalty interests located in Tarrant County, Texas. The properties consist of varying undivided mineral and overriding royalty interests in six tracts totaling approximately 1,820 acres in what is commonly referred to as the Core Area of the Barnett Shale Trend. All of the mineral interests were leased in 2003 to a predecessor of Chesapeake Energy Corporation, the current operator of and majority working interest owner in the properties. Approximately 577 acres of the subject lands are pooled into six units totaling 1,800 acres; approximately 1,129 acres are developed on a lease basis and the remaining lands are leased but not pooled or drilled upon. As of December 31, 2009, 36 wells were drilled from 11 padsites located on or adjacent to the properties, of which 29 wells were completed for production and six were drilled but not yet completed or connected to a pipeline. Permits to drill one additional well on the properties had been issued by regulatory agencies.
26
Table of Contents
Index to Financial Statements
Oil and Natural Gas Reserves
The following table reflects the Partnership’s proved developed and total proved reserves at December 31, 2009. The reserves are based on the reports of two independent petroleum engineering consulting firms: Calhoun, Blair & Associates and Huddleston & Co., Inc. As described above, the Partnership does not have information that would be available to a company with oil and natural gas operations because detailed information is not generally available to owners of royalty interests. The Partnership’s engineering manager gathers production information and provides such information to our two independent engineering consulting firms who extrapolate from such information estimates of the reserves attributable to the Royalty Properties and Net Profits Interests based on their expertise in the oil and natural gas fields where the Royalty Properties and Net Profits Interests are situated, as well as publicly available information. Ensuring compliance with generally accepted petroleum engineering principles is the responsibility of the Partnership’s engineering manager. Our engineering manager has a bachelor’s degree in Petroleum Engineering from the University of Alberta and has worked in the upstream oil and natural gas business in various capacities since 1996. The engineering manager reports directly to the chief executive officer. Our chief executive officer ensures compliance with SEC guidance. He received his Bachelor of Science degree in Petroleum Engineering from Texas A&M University in 1984 and has been a Registered Professional Engineer in Texas since 1988. Calhoun Blair & Associates is registered with the Engineering Board of the State of Texas and has been engaged in the business of oil and natural gas property evaluation since 1998. Huddleston & Co, Inc. is registered with the Engineering Board of the State of Texas and has been engaged in the business of oil and natural gas property evaluation since its formation in 1966. Other than those filed with the SEC, our estimated proved reserves have not been filed with or included in any reports to any federal agency. Copies of the reports prepared by Calhoun, Blair & Associates and Huddleston & Co., Inc. are attached hereto as Exhibits 99.1 and 99.2.
Summary of Oil and Gas Reserves as of Fiscal Year-End based on Average Fiscal-Year Prices
| All Proved Developed and located in the United States |
Total | |||||||||||
| Royalty Properties | Net Profits Interests(1) | |||||||||||
| Reserves Category | Oil (mbbls) |
Natural Gas (mmcf) |
Oil (mbbls) |
Natural Gas (mmcf) |
Oil (mbbls) |
Natural Gas (mmcf) | ||||||
| 2009 |
3,237 | 34,923 | 40 | 25,357 | 3,277 | 60,280 | ||||||
| (1) | Reserves reflect 96.97% of the corresponding amounts assigned to the operating partnership’s interests in the properties underlying the Net Profits Interests. |
Proved oil and natural gas reserves means the estimated quantities of crude oil, natural gas, and natural gas liquids which geological and engineering data demonstrate with reasonable certainty to be recoverable in future years from known reservoirs under existing economic and operating conditions, i.e., 12 month unweighted arithmetic average of the first day of the month prices and costs as of the date the estimate is made. Previously, year-end pricing and costs were used. Please see Management’s Discussion and Analysis of Financial Condition and Results of Operations—Results of Operations for average sales prices.
Oil and Gas Reserves as of Fiscal Year-End
| All Proved Developed and located in the United States Based on Year-End Oil and Natural Gas Prices |
Total | |||||||||||
| Royalty Properties | Net Profits Interests(1) | |||||||||||
| Reserves Category | Oil (mbbls) |
Natural Gas (mmcf) |
Oil (mbbls) |
Natural Gas (mmcf) |
Oil (mbbls) |
Natural Gas (mmcf) | ||||||
| 2009 |
3,237 | 35,287 | 42 | 25,426 | 3,279 | 60,713 | ||||||
| 2008 |
3,514 | 32,028 | 56 | 28,949 | 3,570 | 60,977 | ||||||
| 2007 |
3,501 | 29,555 | 65 | 31,700 | 3,566 | 61,255 | ||||||
27
Table of Contents
Index to Financial Statements
| (1) | Reserves reflect 96.97% of the corresponding amounts assigned to the operating partnership’s interests in the properties underlying the Net Profits Interests. |
The Hugoton Field reflected in the Net Profits Interests above is the only significant field, defined as more than 15% of total proved developed reserves. Hugoton Field production for the last three years is listed below:
Production by Significant Field
| Numbers in Thousands | ||||
| MCFE | BOE | |||
| 2009 | 3,945 | 658 | ||
| 2008 | 4,240 | 707 | ||
| 2007 | 4,496 | 749 | ||
Title to Properties
We believe we have satisfactory title to all of our assets. Record title to essentially all of our assets has undergone the appropriate filings in the jurisdictions in which such assets are located. Title to property may be subject to encumbrances. We believe that none of such encumbrances should materially detract from the value of our properties or from our interest in these properties or should materially interfere with their use in the operation of our business.
| ITEM 3. | LEGAL PROCEEDINGS |
In January 2002, some individuals and an association called Rural Residents for Natural Gas Rights sued Dorchester Hugoton, Ltd., along with several other operators in Texas County, Oklahoma regarding the use of natural gas from the wells in residences. The operating partnership now owns and operates the properties formerly owned by Dorchester Hugoton. These properties contribute a major portion of the Net Profits Interests amounts paid to us. On April 9, 2007, plaintiffs, for immaterial costs, dismissed with prejudice all claims against the operating partnership regarding such residential gas use. On October 4, 2004, the plaintiffs filed severed claims against the operating partnership regarding royalty underpayments, which the Texas County District Court subsequently dismissed with a grant of time to replead. On January 27, 2006, one of the original plaintiffs again sued the operating partnership for underpayment of royalty, seeking class action certification. On October 1, 2007, the Texas County District Court granted the operating partnership’s motion for summary judgment finding no royalty underpayments. Subsequently, the District Court denied the plaintiff’s motion for reconsideration, and the plaintiff filed an appeal. At present, the litigation awaits result of the appeal to the Oklahoma Supreme Court. An adverse appellate decision could reduce amounts we receive from the Net Profits Interests.
The Partnership and the operating partnership are involved in other legal and/or administrative proceedings arising in the ordinary course of their businesses, none of which have predictable outcomes and none of which are believed to have any significant effect on financial position or operating results.
| ITEM 4. | SUBMISSION OF MATTERS TO A VOTE OF UNITHOLDERS |
No matters were submitted to a vote of unitholders during the fourth quarter of the year ended December 31, 2009.
28
Table of Contents
Index to Financial Statements
| ITEM 5. | MARKET FOR REGISTRANT’S COMMON EQUITY, RELATED UNITHOLDER MATTERS AND ISSUER PURCHASES OF EQUITY SECURITIES |
Our common units began trading on the NASDAQ National Market (now the NASDAQ Global Select Market) on February 3, 2003. The following summarizes the high and low sales information for the common units for the period indicated. The information below reflects inter-dealer prices without retail mark-up, mark-down or commission and may not necessarily represent actual transactions.
| 2009 | 2008 | |||||||||||
| High | Low | High | Low | |||||||||
| First Quarter |
$ | 20.40 | $ | 14.37 | $ | 22.00 | $ | 18.70 | ||||
| Second Quarter |
$ | 23.03 | $ | 16.05 | $ | 36.49 | $ | 20.65 | ||||
| Third Quarter |
$ | 25.78 | $ | 21.06 | $ | 35.84 | $ | 19.24 | ||||
| Fourth Quarter |
$ | 23.85 | $ | 20.01 | $ | 24.00 | $ | 14.80 | ||||
As of December 31, 2009, there were 12,062 common unitholders.
Beginning with the quarter ended March 31, 2003, as required by our partnership agreement, we distributed and will continue to distribute, on a quarterly basis, within 45 days of the end of the quarter, all of our available cash. Available cash means all cash and cash equivalents on hand at the end of that quarter, less any amount of cash reserves that our general partner determines is necessary or appropriate to provide for the conduct of its business or to comply with applicable laws or agreements or obligations to which we may be subject.
Unitholder cash distributions per common unit for the past four years have been:
| Per Unit Amount | ||||||||||||
| 2009 | 2008 | 2007 | 2006 | |||||||||
| First Quarter |
$ | 0.401205 | $ | 0.572300 | $ | 0.461146 | $ | 0.729852 | ||||
| Second Quarter |
$ | 0.271354 | $ | 0.769206 | $ | 0.473745 | $ | 0.778120 | ||||
| Third Quarter |
$ | 0.286968 | $ | 0.948472 | $ | 0.560502 | $ | 0.516082 | ||||
| Fourth Quarter |
$ | 0.321540 | $ | 0.542081 | $ | 0.514625 | $ | 0.478596 | ||||
Distributions beginning with the second quarter of 2009 were paid on 29,840,431 units; previous distributions above were paid on 28,240,431 units. Fourth quarter distributions are paid in February of the following calendar year to unitholders of record in January or February of such following year. The partnership agreement requires the next cash distribution to be paid by May 15, 2010.
Please see “Fourth Quarter 2009 Distribution Indicated Price” discussion contained in “Item 7.—Management’s Discussion and Analysis of Financial Condition and Results of Operations—Liquidity and Capital Resources—Distributions” for production periods and cash receipts and weighted average prices corresponding to the fourth quarter 2009 distribution.
29
Table of Contents
Index to Financial Statements
Performance Graph
The following graph compares the performance of our common units with the performance of the NASDAQ Composite Index (the “NASDAQ Index”) and a peer group index from December 31, 2004 through December 31, 2009. The graph assumes that at the beginning of the period, $100 was invested in each of (1) our common units, (2) the NASDAQ Index, and (3) the peer group, and that all distributions or dividends were reinvested. We do not believe that any published industry or line-of-business index accurately reflects our business. Accordingly, we have created a special peer group index consisting of companies whose royalty trust units are publicly traded on the New York Stock Exchange. Our peer group index includes the units of the following companies: Cross Timbers Royalty Trust, Mesa Royalty Trust, Sabine Royalty Trust, Permian Basin Royalty Trust, Hugoton Royalty Trust and the San Juan Basin Royalty Trust.
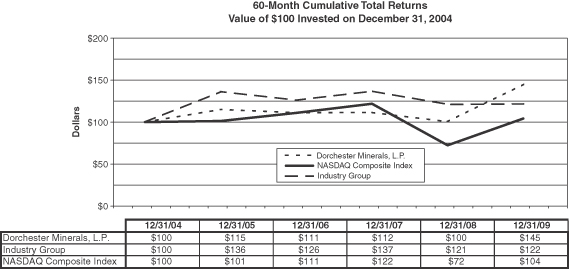
30
Table of Contents
Index to Financial Statements
| ITEM 6. | SELECTED CONSOLIDATED FINANCIAL DATA |
Basis of Presentation
This table should be read in conjunction with the consolidated financial statements and related notes included elsewhere in this document.
| Fiscal Year Ended December 31, (in thousands, except per unit data) | |||||||||||||||
| 2009 | 2008 | 2007 | 2006 | 2005 | |||||||||||
| Total operating revenues |
$ | 43,631 | $ | 89,925 | $ | 65,365 | $ | 74,927 | $ | 79,832 | |||||
| Depreciation, depletion and amortization |
15,599 | 14,739 | 15,567 | 18,470 | 20,858 | ||||||||||
| Net earnings (loss) |
21,681 | 66,783 | 43,048 | 50,210 | 52,775 | ||||||||||
| Net earnings (loss) per unit |
0.72 | 2.30 | 1.48 | 1.72 | 1.82 | ||||||||||
| Cash distributions(1) |
44,728 | 81,648 | 57,401 | 82,295 | 58,028 | ||||||||||
| Cash distributions per unit(1) |
1.50 | 2.80 | 1.97 | 2.83 | 2.00 | ||||||||||
| Total assets |
152,768 | 139,562 | 154,251 | 168,429 | 200,830 | ||||||||||
| Total liabilities |
737 | 980 | 804 | 629 | 945 | ||||||||||
| Partners’ capital |
152,031 | 138,582 | 153,447 | 167,800 | 199,885 | ||||||||||
| (1) | Because of depletion (which is usually higher in the early years of production), a portion of every distribution of revenues from properties represents a return of a limited partner’s original investment. Until a limited partner receives cash distributions equal to his original investment, in certain circumstances, 100% of such distributions may be deemed to be a return of capital. Cash distributions by year exclude the fourth quarter distribution declared in January of the following year, but include the prior year fourth quarter distribution declared in January of the current year. |
| ITEM 7. | MANAGEMENT’S DISCUSSION AND ANALYSIS OF FINANCIAL CONDITION AND RESULTS OF OPERATIONS |
2009 Overview
Our results during 2009 were strong despite significant drops in natural gas prices and drilling activity in most producing areas. Significant results include the following:
| • | Net income of $21.7 million; |
| • | Distributions of $43.3 million to our limited partners; |
| • | Identified 353 new wells located on our Royalty Properties in 11 states; |
| • | Identified 48 new wells located on our Net Profits Interest Properties in four states; and |
| • | Consummated 47 leases of our mineral interest in undeveloped properties located in 17 counties and parishes in four states. |
Critical Accounting Policies
We utilize the full cost method of accounting for costs related to our oil and natural gas properties. Under this method, all such costs are capitalized and amortized on an aggregate basis over the estimated lives of the properties using the units-of-production method. These capitalized costs are subject to a ceiling test, however, which limits such pooled costs to the aggregate of the present value of future net revenues attributable to proved oil and natural gas reserves discounted at 10% plus the lower of cost or market value of unproved properties. Our Partnership did not assign any book or market value to unproved properties, including nonproducing royalty, mineral and leasehold interests. The full cost ceiling is evaluated at the end of each quarter and when events indicate possible impairment. No impairments have been recorded since 2003.
The discounted present value of our proved oil and natural gas reserves is a major component of the ceiling calculation and requires many subjective judgments. Estimates of reserves are forecasts based on engineering and geological analyses. Different reserve engineers may reach different conclusions as to estimated quantities of
31
Table of Contents
Index to Financial Statements
natural gas or crude oil reserves based on the same information. Our reserve estimates are prepared by independent consultants. The passage of time provides more qualitative information regarding reserve estimates, and revisions are made to prior estimates based on updated information. However, there can be no assurance that more significant revisions will not be necessary in the future. Significant downward revisions could result in an impairment representing a non-cash charge to earnings. In addition to the impact on calculation of the ceiling test, estimates of proved reserves are also a major component of the calculation of depletion.
While the quantities of proved reserves require substantial judgment, the associated prices of oil and natural gas reserves that are included in the discounted present value of our reserves are objectively determined. Effective December 31, 2009, the ceiling test calculation requires use of the unweighted arithmetic average of the first day of the month price during the 12-month period ending on the balance sheet date and costs in effect as of the last day of the accounting period, which are generally held constant for the life of the properties. As a result, the present value is not necessarily an indication of the fair value of the reserves. Oil and natural gas prices have historically been volatile, and the prevailing prices at any given time may not reflect our Partnership’s or the industry’s forecast of future prices.
The preparation of financial statements in conformity with accounting principles generally accepted in the United States of America requires management to make estimates and assumptions that affect the reported amounts of assets and liabilities and disclosure of contingent assets and liabilities at the date of the financial statements and the reported amounts of revenues and expenses during the reporting period. For example, estimates of uncollected revenues and unpaid expenses from Royalty Properties and Net Profits Interests operated by non-affiliated entities are particularly subjective due to the inability to gain accurate and timely information. Therefore, actual results could differ from those estimates. Please see “Item 1. Business—Customers and Pricing” and “Item 2. Properties—Royalty Properties” for additional discussion.
New Accounting Standards
The Financial Accounting Standards Board (“FASB”) Accounting Standards Codification (“ASC”) 105-10-5, General Principles, Generally Accepted Accounting Principles defines the new hierarchy for U.S. GAAP and explains how the FASB will use its Accounting Standards Codification as the sole source for all authoritative guidance. FASB ASC 105-10-5 replaces SFAS 162, The Hierarchy of Generally Accepted Accounting Principles, which was issued in May 2008. It was effective for all reporting periods ending after September 15, 2009, and we have revised all references to pre-codification GAAP in our financial statements. It did not have a material impact on our consolidated financial statements.
FASB ASC 805-10, Business Combinations, among other things, establishes principles and requirements for how the acquirer in a business combination (a) recognizes and measures in its financial statements the identifiable assets acquired, the liabilities assumed, and any noncontrolling interest in the acquired business, (b) changes the accounting for contingent consideration, in process research and development, and restructuring costs, c) expenses acquisition-related costs as incurred, (d) recognizes and measures the goodwill acquired in the business combination or a gain from a bargain purchase, and (e) determines what information to disclose to enable users of the financial statements to evaluate the nature and financial effects of the business combination. We adopted FASB ASC 805-10 as of January 1, 2009 with no material impact on our consolidated financial statements.
FASB ASC 855-10, Subsequent Events, incorporates the accounting and disclosure requirements for subsequent events into U.S. generally accepted accounting principles. FASB ASC 855-10 introduces new terminology, defines a date through which management must evaluate subsequent events, and lists the circumstances under which an entity must recognize and disclose events or transactions occurring after the balance sheet date. We adopted FASB ASC 855-10 as of June 30, 2009, which was the required effective date.
32
Table of Contents
Index to Financial Statements
FASB Accounting Standards Update (“ASU”) 2010-03 was issued on January 6, 2010, and aligns the current oil and natural gas reserve estimation and disclosure requirements of ASC 932 with those in the SEC Final Rule Modernization of Oil and Gas Reporting issued December 31, 2008. The rules only apply prospectively as a change in estimate. The most significant amendments to the reserve and disclosure requirements include the following:
| • | Commodity Prices—Economic producibility of reserves and discounted cash flows will be based on an unweighted arithmetic average of the first day of the month commodity price during the 12-month period ending on the balance sheet date unless contractual arrangements designate the price to be used. |
| • | Disclosure of Unproved Reserves—Probable and possible reserves may be disclosed separately on a voluntary basis. |
| • | Proved Undeveloped Reserve Guidelines—Reserves may be classified as proved undeveloped if there is a high degree of confidence that the quantities will be recovered. |
| • | Reserve Estimation Using New Technologies—Reserves may be estimated through the use of reliable technology in addition to flow tests and production history. |
| • | Reserve Personnel and Estimation Process—Additional disclosure is required regarding the qualifications of the chief technical person who oversees our reserves estimation process. We will also be required to provide a general discussion of our internal controls used to assure the objectivity of the reserves estimate. |
| • | Disclosure by Geographic Area—Reserves in foreign countries or continents must be presented separately if they represent more than 15% of our total oil and natural gas proved reserves. |
| • | Non-Traditional Resources—The definition of oil and natural gas producing activities will expand and focus on the marketable product rather than the method of extraction. |
ASU 2010-03 is effective for entities with annual reporting periods ending on or after December 31, 2009. We adopted both the FASB and the SEC rules as of December 31, 2009 with no material impact on our consolidated financial statements.
Contractual Obligations
Our office lease in Dallas, Texas comprises our contractual obligations.
| Total | Payments due by Period | ||||||||||||||
| Contractual Obligations |
Less than 1 year | 1-3 years | 3-5 years | More than 5 years | |||||||||||
| Operating Lease Obligations |
$ | 1,280,000 | $ | 228,000 | $ | 477,000 | $ | 510,000 | $ | 65,000 | |||||
33
Table of Contents
Index to Financial Statements
Results of Operations
Normally, our period-to-period changes in net earnings and cash flows from operating activities are principally determined by changes in oil and natural gas sales volumes and prices, and to a lesser extent, by capital expenditures deducted under the Net Profits Interests calculation. Our portion of oil and natural gas sales volumes and weighted average sales prices are shown in the following table.
| Years Ended December 31, | |||||||||
| 2009 | 2008 | 2007 | |||||||
| Accrual Basis Sales Volumes: |
|||||||||
| Royalty Properties Gas Sales (mmcf) |
4,457 | 4,003 | 3,623 | ||||||
| Royalty Properties Oil Sales (mbbls) |
294 | 301 | 300 | ||||||
| Net Profits Interests Gas Sales (mmcf) |
3,593 | 3,877 | 4,133 | ||||||
| Net Profits Interests Oil Sales (mbbls) |
11 | 12 | 16 | ||||||
| Accrual Basis Weighted Averages Sales Price: |
|||||||||
| Royalty Properties Gas Sales ($/mcf) |
$ | 3.71 | $ | 8.25 | $ | 6.64 | |||
| Royalty Properties Oil Sales ($/bbl) |
$ | 57.35 | $ | 96.02 | $ | 67.75 | |||
| Net Profits Interests Gas Sales ($/mcf) |
$ | 3.91 | $ | 8.58 | $ | 6.63 | |||
| Net Profits Interests Oil Sales ($/bbl) |
$ | 51.83 | $ | 98.76 | $ | 62.40 | |||
| Accrual Basis Production Costs Deducted under the |
$ | 1.50 | $ | 1.89 | $ | 1.99 | |||
| (1) | Provided to assist in determination of revenues; applies only to Net Profits Interests sales volumes prices. |
Comparison of the twelve-month periods ended December 31, 2009, 2008 and 2007
Royalty Properties’ oil sales volumes were virtually unchanged during 2008 compared to 2007. Royalty Properties’ oil sales volumes decreased 2.3% from 301 mbbls during 2008 to 294 mbbls during 2009 because of natural declines. Royalty Properties’ gas sales volumes increased 10.5% from 3,623 mmcf during 2007 to 4,003 mmcf during 2008 and then increased 11.3% to 4,457 mmcf during 2009. The increase in natural gas volumes in 2008 was attributable to new drilling activity on the Royalty Properties. In 2009, natural gas volumes increased primarily due to the acquisition of royalty and overriding royalty interests in the Barnett Shale Trend.
Net Profits Interests properties’ oil sales volumes decreased 25% from 16 mbbls during 2007 to 12 mbbls during 2008, primarily due to an operator’s adjustments to production from prior periods and subsequently decreased to 11 mbbls during 2009. Net Profits Interests properties’ gas sales volumes decreased 6.2% from 4,133 mmcf during 2007 to 3,877 mmcf during 2008 and subsequently decreased 7.3% to 3,593 mmcf in 2009 principally as a result of natural reservoir depletion in the Guymon-Hugoton field in Oklahoma.
Weighted average oil sales prices attributable to the Royalty Properties increased 41.7% from $67.75 per bbl in 2007 to $96.02 per bbl in 2008 and subsequently decreased 40.3% to $57.35 per bbl in 2009. Royalty Properties’ weighted average gas sales prices increased 24.2% from $6.64 per mcf during 2007 to $8.25 per mcf during 2008 and then decreased 55.0% to $3.71 per mcf during 2009. All such fluctuations resulted from changing market conditions.
Weighted average Net Profits Interests properties’ gas sales prices increased 29.4% from $6.63 per mcf during 2007 to $8.58 per mcf during 2008 and then decreased 54.4% to $3.91 per mcf in 2009. Net Profits Interests properties’ weighted average oil sales prices increased 58.3% from $62.40 per bbl during 2007 to $98.76 per bbl during 2008 followed by a decrease of 47.5% to $51.83 per bbl in 2009. All such fluctuations resulted from changing market conditions. Additionally, 2008 natural gas prices include a natural gas liquids payment accrual of $0.59/mcf related to 2008 production. Similarly, an additional amount of approximately $1.8 million for 2009 production is anticipated to be received during the first quarter of 2010. The accrued 2010 natural gas liquids payment of $0.51/mcf is included in the $3.91/mcf average gas sales price for 2009. The
34
Table of Contents
Index to Financial Statements
natural gas liquids payments are based on an Oklahoma Guymon-Hugoton field 1994 gas delivery agreement that is in effect through 2015. Under the terms of the agreement, when the market price of natural gas liquids increases sufficiently disproportionately to natural gas market prices, the operating partnership receives a portion of that increase in an annual payment. In the event the evaluation at the end of the annual contract period shows the payment to be determinable and collectable, the revenue is accrued. Only immaterial amounts were received prior to 2007.
Our operating revenues decreased 51.5% from $89,925,000 during 2008 to $43,631,000 in 2009 primarily as a result of decreased oil and natural gas prices. Our operating revenues increased 37.6% from $65,365,000 during 2007 to $89,925,000 during 2008 primarily as a result of increased oil and natural gas prices during the 2008 summer months along with a 2007 natural gas liquids payment received during the first half of 2008 and an accrued natural gas liquid payment received during the first quarter of 2009.
General and administrative (“G&A”) costs decreased 6.3% from $3,965,000 in 2008 to $3,715,000 in 2009 due to reduced capital expenditures reimbursed. G&A costs increased 10.4% from $3,591,000 in 2007 to $3,965,000 in 2008 due to increased costs related to, among other things, increased number of unitholder accounts requiring K-1’s and ongoing modernizing of land records begun in mid-2007.
Depletion and amortization decreased 5.3% from $15,567,000 in 2007 to $14,739,000 in 2008 primarily as a result of a lower depletable base due to the effects of previous depletion and upward revisions in oil and natural gas reserve estimates. During 2009, depletion and amortization increased 5.8% to $15,599,000, primarily as a result of the acquisition of new properties along with low natural gas pricing impacting depletable reserves. Cash flow from operations and cash distributions to unitholders are not affected by depletion, depreciation and amortization. Changes in reserve calculations did not increase depletion materially.
Net cash provided by operating activities increased 41.9% from $58,432,000 during 2007 to $82,908,000 during 2008 due primarily to increased oil and natural gas prices during the second and third quarters along with abnormal gas liquid payments. See discussion of operating revenues above for more details. Net cash provided by operating activities decreased 54.9% to $37,396,000 during 2009 primarily due to decreased oil and natural gas prices.
Climate Change
Climate change has become the subject of an important public policy debate. Climate change legislation and regulations have been adopted by many foreign countries and some states in the United States; however, legislation and regulations have not been enacted at the federal level, although the United States Congress and several more states have or are considering adopting climate change legislation. The current state of development of many state and federal climate change regulatory initiatives makes it difficult to predict with certainty the future impact on us, including accurately estimating the related compliance costs that the operating partnership and oil and natural gas operators that develop our properties may incur.
See Item 1A. Risk Factors – “Environmental costs and liabilities and changing environmental regulation could affect our cash flow” and “The adoption of climate change legislation by Congress could result in increased operating costs and reduced demand for the oil and natural gas production from our properties.”
Texas Margin Tax
Texas imposes a margin tax at a rate of 1% on gross revenues less certain deductions, as specifically set forth in the Texas margin tax statute. The Texas margin tax applies to corporations and limited liability companies, general and limited partnerships (unless otherwise exempt), limited liability partnerships, trusts (unless otherwise exempt), business trusts, business associations, professional associations, joint stock companies, holding companies, joint ventures and certain other business entities having limited liability protection.
35
Table of Contents
Index to Financial Statements
Limited partnerships that receive at least 90% of their gross income from designated passive sources, including royalties from mineral properties and other non-operated mineral interest income, and do not receive more than 10% of their income from operating an active trade or business, are generally exempt from the Texas margin tax as “passive entities.” We believe our Partnership meets the requirements for being considered a “passive entity” for Texas margin tax purposes and, therefore, it is exempt from the Texas margin tax. If exempt from tax at the Partnership level as a passive entity, each unitholder that is considered a taxable entity under the Texas margin tax would generally be required to include its portion of Partnership revenues in its own Texas margin tax computation. The Texas Administrative Code provides such income is sourced according to the principal place of business of the Partnership, which would be the state of Texas.
Each unitholder is urged to consult his own tax advisor regarding the requirements for filing state income, franchise and Texas margin tax returns.
Liquidity and Capital Resources
Capital Resources
Our primary sources of capital are our cash flow from the Net Profits Interests and the Royalty Properties. We are not directly liable for the payment of any exploration, development or production costs. We do not have any transactions, arrangements or other relationships that could materially affect our liquidity or the sustainability of capital resources.
Pursuant to the terms of our partnership agreement, we cannot incur indebtedness, other than trade payables, (i) in excess of $50,000 in the aggregate at any given time or (ii) which would constitute “acquisition indebtedness” (as defined in Section 514 of the Internal Revenue Code of 1986, as amended).
Our only cash requirements are the distributions of all our net cash flow to our unitholders, the payment of oil and natural gas production and property taxes not otherwise deducted from gross production revenues and general and administrative expenses incurred on our behalf and allocated in accordance with our partnership agreement. Since the distributions to our unitholders are, by definition, determined after the payment of all expenses actually paid by us, the only cash requirements that may create liquidity concerns for us are the payments of expenses. Since many of these expenses vary directly with oil and natural gas prices and sales volumes, such as production taxes, we anticipate that sufficient funds will be available at all times for payment of these expenses. Of the expenses that do not vary with oil and natural gas prices and sales volumes, most are reimbursements to our general partner for allocable general and administrative costs including home office rent, salaries, and employee benefit plans. Such reimbursements are generally limited to 5% of an amount primarily based on annual distributions to our limited partners. Historically, all such reimbursements have been substantially below the 5% limit established by the partnership agreement. Consequently, even during the 2008 economic downturn, our business risks were essentially limited to distribution amount decreases. See “Item 1. Business – Credit Facilities and Financing Plans.” See “Item 1A. Risk Factors – Risks Related to our Business – Cash distributions are affected by production and other costs, some of which are outside of our control.” See “Item 1A. Risk Factors – Risks Inherent In An Investment In Our Common Units – Cost reimbursement due our general partner may be substantial and reduce our cash available to distribute to our unitholders.” See “Notes to Consolidated Financial Statements – Note 3 – Related Party Transactions.”
Off-Balance Sheet Arrangements
We have no significant off-balance sheet arrangements that have or are reasonably likely to have a current or future effect on our financial condition, changes in financial condition, revenues or expenses, results of operations, liquidity, capital expenditures or capital resources that are material to unitholders.
36
Table of Contents
Index to Financial Statements
Expenses and Capital Expenditures
The operating partnership plans to continue its efforts to increase production in Oklahoma by techniques that may include fracture treating, deepening, recompleting, and drilling. Costs vary widely and are not predictable as each effort requires specific engineering. Such activities by the operating partnership could influence the amount we receive from the Net Profits Interests as reflected in the accrual basis production costs $/mcfe in the table under “Results of Operations.”
The operating partnership owns and operates the wells, pipelines and natural gas compression and dehydration facilities located in Kansas and Oklahoma. The operating partnership anticipates gradual increases in expenses as repairs to these facilities become more frequent and anticipates gradual increases in field operating expenses as reservoir pressure declines. The operating partnership does not anticipate incurring significant expense to replace these facilities at this time. These capital and operating costs are reflected in the Net Profits Interests payments we receive from the operating partnership.
In 1998, Oklahoma regulations removed production quantity restrictions in the Guymon-Hugoton field and did not address efforts by third parties to persuade Oklahoma to permit infill drilling in the Guymon-Hugoton field. Infill drilling could require considerable capital expenditures. The outcome and the cost of such activities are unpredictable and could influence the amount we receive from the Net Profits Interests. The operating partnership believes it now has sufficient field compression and permits for vacuum operation for the foreseeable future.
Liquidity and Working Capital
Year-end cash and cash equivalents totaled $10,124,000 for 2009, $16,211,000 for 2008, and $15,001,000 for 2007.
Distributions
Distributions to limited partners and the general partner related to cash receipts for the period from October 2008 through December 2009 were as follows:
| Year |
Quarter | Record Date |
Payment Date |
Per Unit Amount |
$ in Thousands | ||||||||||
| Limited Partners |
General Partner | ||||||||||||||
| 2008 | 4th | January 26, 2009 | February 5, 2009 | $ | 0.542081 | $ | 15,309 | $ | 520 | ||||||
| 2009 | 1st | April 27, 2009 | May 7, 2009 | 0.401205 | 11,330 | 313 | |||||||||
| 2009 | 2nd | July 24, 2009 | August 3, 2009 | 0.271354 | 8,097 | 289 | |||||||||
| 2009 | 3rd | October 26, 2009 | November 5, 2009 | 0.286968 | 8,563 | 307 | |||||||||
| Total distributions paid in 2009 |
$ | 43,299 | $ | 1,429 | |||||||||||
| 2009 | 4th | January 25, 2010 | February 4, 2010 | $ | 0.321540 | $ | 9,595 | $ | 339 | ||||||
In general, the limited partners are allocated 96% of the Royalty Properties’ net receipts and 99% of our Net Profits Interests net receipts.
Net Profits Interests
We receive monthly payments from the operating partnership equal to 96.97% of the net proceeds actually realized by the operating partnership from the properties underlying the Net Profits Interests. The operating partnership retains the 3.03% balance of these net proceeds. Net proceeds generally reflect gross proceeds attributable to oil and natural gas production actually received during the month less production costs actually paid during the same month. Production costs generally reflect drilling, completion, operating and general and administrative costs and exclude depletion, amortization and other non-cash costs. The operating partnership
37
Table of Contents
Index to Financial Statements
made Net Profits Interests payments to us totaling $12,003,000 during October 2008 through September 2009, which payments reflected 96.97% of total net proceeds of $12,378,000 realized from September 2008 through August 2009. Net proceeds realized by the operating partnership during September through November 2009 were reflected in Net Profits Interests payments made during October through December 2009. These payments were included in the fourth quarter distribution paid in early 2010 and are excluded from this 2009 analysis.
Royalty Properties
Revenues from the Royalty Properties are typically paid to us with proportionate severance (production) taxes deducted and remitted by others. Additionally, we generally pay ad valorem taxes, general and administrative costs, and marketing and associated costs since royalties and lease bonuses generally do not otherwise bear operating or similar costs. After deduction of the above described costs including cash reserves, our net cash receipts from the Royalty Properties during the period October 2008 through September 2009 were $32,725,000, of which $31,416,000 (96%) was distributed to the limited partners and $1,309,000 (4%) was distributed to the general partner. Proceeds received by us from the Royalty Properties during the period October through December 2009 became part of the fourth quarter distribution paid in early 2010, which is excluded from this 2009 analysis.
Distribution Determinations
The actual calculation of distributions is performed each calendar quarter in accordance with our partnership agreement. The following calculation covering the period October 2008 through September 2009 demonstrates the method.
| $ In Thousands | ||||||||
| Limited Partners |
General Partner |
|||||||
| 4% of Net Cash Receipts from Royalty Properties |
$ | — | $ | 1,309 | ||||
| 96% of Net Cash Receipts from Royalty Properties |
31,416 | — | ||||||
| 1% of Net Profits Interests Paid to our Partnership |
— | 120 | ||||||
| 99% of Net Profits Interests Paid to our Partnership |
11,883 | — | ||||||
| Total Distributions |
$ | 43,299 | $ | 1,429 | ||||
| Operating Partnership Share (3.03% of Net Proceeds) |
— | 375 | ||||||
| Total General Partner Share |
$ | 1,804 | ||||||
| % of Total |
96 | % | 4 | % | ||||
In summary, our limited partners received 96%, and our general partner received 4% of the net cash generated by our activities and those of the operating partnership during this period. Due to these fixed percentages, our general partner does not have any incentive distribution rights or other right or arrangement that will increase its percentage share of net cash generated by our activities or those of the operating partnership.
During the period October 2008 through September 2009, our Partnership’s quarterly distribution payments to limited partners were based on all of its available cash. Our Partnership’s only significant cash reserves that influenced quarterly payments were $1,137,000 for ad valorem taxes. Additionally, certain production costs under the Net Profits Interests calculation and a small portion of management expense reimbursements include amounts for which funds were set aside monthly to enable payment when due. Examples are contributions to SEP-IRA accounts and payroll taxes. These amounts generally are not held for periods over one year.
Fourth Quarter 2009 Distribution Indicated Price
In an effort to provide information concerning prices of oil and natural gas sales that correspond to our quarterly distributions, management calculates the weighted average price by dividing gross revenues received
38
Table of Contents
Index to Financial Statements
by the net volumes of the corresponding product without regard to the timing of the production to which such sales may be attributable. This “indicated price” does not necessarily reflect the contractual terms for such sales and may be affected by transportation costs, location differentials, and quality and gravity adjustments. While the relationship between the Partnership’s cash receipts and the timing of the production of oil and natural gas may be described generally, actual cash receipts may be materially impacted by purchasers’ release of suspended funds and by prior period adjustments.
Cash receipts attributable to the Partnership’s Royalty Properties during the 2009 fourth quarter totaled approximately $8.8 million. These receipts generally reflect oil sales during September through November 2009 and natural gas sales during August through October 2009. The weighted average indicated prices for oil and natural gas sales during the 2009 fourth quarter attributable to the Royalty Properties were $69.57/bbl and $3.17/mcf.
Cash receipts attributable to the Partnership’s Net Profits Interests during the 2009 fourth quarter totaled approximately $1.9 million. These receipts generally reflect oil and natural gas sales from the properties underlying the Net Profits Interests during August through October 2009. The weighted average indicated prices for oil and natural gas sales during the 2009 fourth quarter attributable to the Net Profits Interests were $62.55/bbl and $3.31/mcf.
General and Administrative Costs
In accordance with our partnership agreement, we bear all general and administrative and other overhead expenses subject to certain limitations. We reimburse our general partner for certain allocable costs, including rent, wages, salaries and employee benefit plans. This reimbursement is limited to an amount equal to the sum of 5% of our distributions plus certain costs previously paid. Through December 31, 2009, the limitation was in excess of the reimbursement amounts actually paid or accrued.
| ITEM 7A. | QUANTITATIVE AND QUALITATIVE DISCLOSURES ABOUT MARKET RISK |
The following information provides quantitative and qualitative information about our potential exposures to market risk. The term “market risk” refers to the risk of loss arising from adverse changes in oil and natural gas prices, interest rates and currency exchange rates. The disclosures are not meant to be precise indicators of expected future losses, but rather indicators of possible losses.
Market Risk Related to Oil and Natural Gas Prices
Essentially all of our assets and sources of income are from the Net Profits Interests and the Royalty Properties, which generally entitle us to receive a share of the proceeds from oil and natural gas production on those properties. Consequently, we are subject to market risk from fluctuations in oil and natural gas prices. Pricing for oil and natural gas production has been volatile and unpredictable for several years. We do not anticipate entering into financial hedging activities intended to reduce our exposure to oil and natural gas price fluctuations.
Absence of Interest Rate and Currency Exchange Rate Risk
We do not anticipate having a credit facility or incurring any debt, other than trade debt. Therefore, we do not expect interest rate risk to be material to us. We do not anticipate engaging in transactions in foreign currencies which could expose us to foreign currency related market risk.
| ITEM 8. | CONSOLIDATED FINANCIAL STATEMENTS AND SUPPLEMENTARY DATA |
The consolidated financial statements are set forth herein commencing on page F-1.
39
Table of Contents
Index to Financial Statements
| ITEM 9. | CHANGES IN AND DISAGREEMENTS WITH ACCOUNTANTS ON ACCOUNTING AND FINANCIAL DISCLOSURE |
None.
| ITEM 9A. | CONTROLS AND PROCEDURES |
Evaluation of Disclosure Controls and Procedures
Our management, with the participation of our Chief Executive Officer and Chief Financial Officer, has evaluated the effectiveness of our disclosure controls and procedures (as defined in Rules 13a-15(e) and 15d-15(e) under the Exchange Act) as of December 31, 2009. Based on this evaluation, our Chief Executive Officer and Chief Financial Officer have concluded that, as of December 31, 2009, our disclosure controls and procedures were effective, in that they ensure that information required to be disclosed by us in the reports that we file or submit under the Exchange Act is (1) recorded, processed, summarized and reported within the time periods specified in the SEC’s rules and forms, and (2) accumulated and communicated to our management, including our Chief Executive Officer and Chief Financial Officer, as appropriate to allow timely decisions regarding required disclosure.
Management’s Annual Report on Internal Control Over Financial Reporting
Management acknowledges its responsibility for establishing and maintaining adequate internal control over financial reporting in accordance with Rule 13a-15(f) promulgated under the Exchange Act. Management has also evaluated the effectiveness of its internal control over external financial reporting in accordance with generally accepted accounting principles within the guidelines of the Committee of Sponsoring Organizations of the Treadway Commission framework. Based on the results of this evaluation, management has determined that the Partnership’s internal control over financial reporting was effective as of December 31, 2009. The independent registered public accounting firm of Grant Thornton LLP, as auditors of the Partnership’s financial statements included in the Annual Report, has issued an attestation report on the Partnership’s internal control over financial reporting.
Changes in Internal Controls
There were no changes in our Partnership’s internal control over financial reporting (as defined in Rule 13a-15(f) of the Securities Exchange Act of 1934) during the quarter ended December 31, 2009, that have materially affected, or are reasonably likely to materially affect, our internal control over financial reporting.
| ITEM 9B. | OTHER INFORMATION |
None.
40
Table of Contents
Index to Financial Statements
| ITEM 10. | DIRECTORS, EXECUTIVE OFFICERS AND CORPORATE GOVERNANCE |
The information required by this item is incorporated herein by reference to the 2010 Proxy Statement, which will be filed with the Securities and Exchange Commission not later than 120 days subsequent to December 31, 2009.
| ITEM 11. | EXECUTIVE COMPENSATION |
The information required by this item is incorporated herein by reference to the 2010 Proxy Statement, which will be filed with the Securities and Exchange Commission not later than 120 days subsequent to December 31, 2009.
| ITEM 12. | SECURITY OWNERSHIP OF CERTAIN BENEFICIAL OWNERS AND MANAGEMENT AND RELATED UNITHOLDER MATTERS |
The information required by this item is incorporated herein by reference to the 2010 Proxy Statement, which will be filed with the Securities and Exchange Commission not later than 120 days subsequent to December 31, 2009.
| ITEM 13. | CERTAIN RELATIONSHIPS AND RELATED TRANSACTIONS, AND DIRECTOR INDEPENDENCE |
The information required by this item is incorporated herein by reference to the 2010 Proxy Statement, which will be filed with the Securities and Exchange Commission not later than 120 days subsequent to December 31, 2009.
| ITEM 14. | PRINCIPAL ACCOUNTING FEES AND SERVICES |
The information required by this item is incorporated herein by reference to the 2010 Proxy Statement, which will be filed with the Securities and Exchange Commission not later than 120 days subsequent to December 31, 2009.
41
Table of Contents
Index to Financial Statements
| ITEM 15. | EXHIBITS AND FINANCIAL STATEMENT SCHEDULES |
(a) Financial Statements and Schedules
| (1) | See the Index to Consolidated Financial Statements on page F-1. |
| (2) | No schedules are required. |
| (3) | Exhibits. |
| Number |
Description | |
| 3.1 | Certificate of Limited Partnership of Dorchester Minerals, L.P. (incorporated by reference to Exhibit 3.1 to Dorchester Minerals’ Registration Statement on Form S-4, Registration Number 333-88282) | |
| 3.2 | Amended and Restated Agreement of Limited Partnership of Dorchester Minerals, L.P. (incorporated by reference to Exhibit 3.2 to Dorchester Minerals’ Annual Report on Form 10-K for the year ended December 31, 2002) | |
| 3.3 | Certificate of Limited Partnership of Dorchester Minerals Management LP (incorporated by reference to Exhibit 3.4 to Dorchester Minerals’ Registration Statement on Form S-4, Registration Number 333-88282) | |
| 3.4 | Amended and Restated Agreement of Limited Partnership of Dorchester Minerals Management LP (incorporated by reference to Exhibit 3.4 to Dorchester Minerals’ Annual Report on Form 10-K for the year ended December 31, 2002) | |
| 3.5 | Certificate of Formation of Dorchester Minerals Management GP LLC (incorporated by reference to Exhibit 3.7 to Dorchester Minerals’ Registration Statement on Form S-4, Registration Number 333-88282) | |
| 3.6 | Amended and Restated Limited Liability Company Agreement of Dorchester Minerals Management GP LLC (incorporated by reference to Exhibit 3.6 to Dorchester Minerals’ Annual Report on Form 10-K for the year ended December 31, 2002) | |
| 3.7 | Certificate of Formation of Dorchester Minerals Operating GP LLC (incorporated by reference to Exhibit 3.10 to Dorchester Minerals’ Registration Statement on Form S-4, Registration Number 333-88282) | |
| 3.8 | Limited Liability Company Agreement of Dorchester Minerals Operating GP LLC (incorporated by reference to Exhibit 3.11 to Dorchester Minerals’ Registration Statement on Form S-4, Registration Number 333-88282) | |
| 3.9 | Certificate of Limited Partnership of Dorchester Minerals Operating LP (incorporated by reference to Exhibit 3.12 to Dorchester Minerals’ Registration Statement on Form S-4, Registration Number 333-88282) | |
| 3.10 | Amended and Restated Agreement of Limited Partnership of Dorchester Minerals Operating LP (incorporated by reference to Exhibit 3.10 to Dorchester Minerals’ Annual Report on Form 10-K for the year ended December 31, 2002) | |
| 3.11 | Certificate of Limited Partnership of Dorchester Minerals Oklahoma LP (incorporated by reference to Exhibit 3.11 to Dorchester Minerals’ Annual Report on Form 10-K for the year ended December 31, 2002) | |
| 3.12 | Agreement of Limited Partnership of Dorchester Minerals Oklahoma LP (incorporated by reference to Exhibit 3.12 to Dorchester Minerals’ Annual Report on Form 10-K for the year ended December 31, 2002) | |
| 3.13 | Certificate of Incorporation of Dorchester Minerals Oklahoma GP, Inc. (incorporated by reference to Exhibit 3.13 to Dorchester Minerals’ Annual Report on Form 10-K for the year ended December 31, 2002) | |
42
Table of Contents
Index to Financial Statements
| Number |
Description | |
| 3.14 | Bylaws of Dorchester Minerals Oklahoma GP, Inc. (incorporated by reference to Exhibit 3.14 to Dorchester Minerals’ Annual Report on Form 10-K for the year ended December 31, 2002) | |
| 10.1 | Amended and Restated Business Opportunities Agreement dated as of December 13, 2001 by and between the Registrant, the General Partner, Dorchester Minerals Management GP LLC, SAM Partners, Ltd., Vaughn Petroleum, Ltd., Smith Allen Oil & Gas, Inc., P.A. Peak, Inc., James E. Raley, Inc., and certain other parties (incorporated by reference to Exhibit 10.1 to Dorchester Minerals’ Annual Report on Form 10-K for the year ended December 31, 2002) | |
| 10.2 | Transfer Restriction Agreement (incorporated by reference to Exhibit 10.2 to Dorchester Minerals’ Annual Report on Form 10-K for the year ended December 31, 2002) | |
| 10.3 | Registration Rights Agreement (incorporated by reference to Exhibit 10.3 to Dorchester Minerals’ Annual Report on Form 10-K for the year ended December 31, 2002) | |
| 10.4 | Lock-Up Agreement by William Casey McManemin (incorporated by reference to Exhibit 10.4 to Dorchester Minerals’ Annual Report on Form 10-K for the year ended December 31, 2002) | |
| 10.5 | Form of Indemnity Agreement (incorporated by reference to Exhibit 10.1 to Dorchester Minerals’ Quarterly Report on Form 10-Q for the quarter ended June 30, 2004) | |
| 10.6 | Contribution and Exchange Agreement by and among Dorchester Minerals, L.P., Tiggator, Inc., TRB Minerals, LP and West Fork Partners dated May 15, 2009 (incorporated by reference to Exhibit 10.1 to Dorchester Minerals’ Current Report on Form 8-K dated June 30, 2009) | |
| 10.7 | Amendment No. 1 dated June 26, 2009 to Contribution and Exchange Agreement by and among Dorchester Minerals, L.P., Tiggator, Inc., TRB Minerals, LP and West Fork Partners dated May 15, 2009 (incorporated by reference to Exhibit 10.2 to Dorchester Minerals’ Quarterly Report on Form 10-Q for the quarter ended June 30, 2009) | |
| 10.8 | Lock-up Agreement by Tiggator, Inc. dated June 30, 2009 (incorporated by reference to Exhibit 10.2 to Dorchester Minerals’ Current Report on Form 8-K dated June 30, 2009) | |
| 10.9 | Lock-up Agreement by TRB Minerals, LP dated June 30, 2009 (incorporated by reference to Exhibit 10.2 to Dorchester Minerals’ Current Report on Form 8-K dated June 30, 2009) | |
| 10.10 | Lock-up Agreement by West Fork Partners, LP dated June 30, 2009 (incorporated by reference to Exhibit 10.2 to Dorchester Minerals’ Current Report on Form 8-K dated June 30, 2009) | |
| 21.1* | Subsidiaries of the Registrant | |
| 23.1* | Consent of Grant Thornton LLP | |
| 23.2* | Consent of Calhoun, Blair & Associates | |
| 23.3* | Consent of Huddleston & Co., Inc. | |
| 31.1* | Certification of Chief Executive Officer of our Partnership pursuant to Rule 13a-14(a) of the Securities Exchange Act of 1934 | |
| 31.2* | Certification of Chief Financial Officer of our Partnership pursuant to Rule 13a-14(a) of the Securities Exchange Act of 1934 | |
| 32.1* | Certification of Chief Executive Officer and Chief Financial Officer pursuant to 18 U.S.C. Sec. 1350 | |
| 99.1* | Report of Calhoun, Blair & Associates | |
| 99.2* | Report of Huddleston & Co., Inc. | |
| * | Filed herewith |
43
Table of Contents
Index to Financial Statements
GLOSSARY OF CERTAIN OIL AND NATURAL GAS TERMS
The definitions set forth below shall apply to the indicated terms as used in this document. All volumes of natural gas referred to herein are stated at the legal pressure base of the state or area where the reserves exist and at 60 degrees Fahrenheit and in most instances are rounded to the nearest major multiple.
“bbl” means a standard barrel of 42 U.S. gallons and represents the basic unit for measuring the production of crude oil, natural gas liquids and condensate.
“bcf” means one billion cubic feet under prescribed conditions of pressure and temperature and represents a unit for measuring the production of natural gas.
“Depletion” means (a) the volume of hydrocarbons extracted from a formation over a given period of time, (b) the rate of hydrocarbon extraction over a given period of time expressed as a percentage of the reserves existing at the beginning of such period, or (c) the amount of cost basis at the beginning of a period attributable to the volume of hydrocarbons extracted during such period.
“Division order” means a document to protect lessees and purchasers of production, in which all parties who may have a claim to the proceeds of the sale of production agree upon how the proceeds are to be divided.
“Enhanced recovery” means the process or combination of processes applied to a formation to extract hydrocarbons in addition to those that would be produced utilizing the natural energy existing in that formation. Examples of enhanced recovery include water flooding and carbon dioxide (CO2) injection.
“Estimated future net revenues” (also referred to as “estimated future net cash flow”) means the result of applying current prices of oil and natural gas to estimated future production from oil and natural gas proved reserves, reduced by estimated future expenditures, based on current costs to be incurred in developing and producing the proved reserves, excluding overhead.
“Formation” means a distinct geologic interval, sometimes referred to as the strata, which has characteristics (such as permeability, porosity and hydrocarbon saturations) that distinguish it from surrounding intervals.
“Gross acre” means the number of surface acres in which a working interest is owned.
“Gross well” means a well in which a working interest is owned.
“Lease bonus” means the initial cash payment made to a lessor by a lessee in consideration for the execution and conveyance of the lease.
“Leasehold” means an acre in which a working interest is owned.
“Lessee” means the owner of a lease of a mineral interest in a tract of land.
“Lessor” means the owner of the mineral interest who grants a lease of his interest in a tract of land to a third party, referred to as the lessee.
“Mineral interest” means the interest in the minerals beneath the surface of a tract of land. A mineral interest may be severed from the ownership of the surface of the tract. Ownership of a mineral interest generally involves four incidents of ownership: (1) the right to use the surface; (2) the right to incur costs and retain profits, also called the right to develop; (3) the right to transfer all or a portion of the mineral interest; and (4) the right to retain lease benefits, including bonuses and delay rentals.
44
Table of Contents
Index to Financial Statements
“mcf” means one thousand cubic feet under prescribed conditions of pressure and temperature and represents the basic unit for measuring the production of natural gas.
“mbbls” means one thousand standard barrels of 42 U.S. gallons and represents the basic unit for measuring the production of crude oil, natural gas liquids and condensate.
“mmcf” means one million cubic feet under prescribed conditions of pressure and temperature and represents the basic unit for measuring the production of natural gas.
“Net acre” means the product determined by multiplying gross acres by the interest in such acres.
“Net well” means the product determined by multiplying gross oil and natural gas wells by the interest in such wells.
“Net profits interest” means a non-operating interest that creates a share in gross production from another (operating or non-operating) interest in oil and natural gas properties. The share is determined by net profits from the sale of production and customarily provides for the deduction of capital and operating costs from the proceeds of the sale of production. The owner of a net profits interest is customarily liable for the payment of capital and operating costs only to the extent that revenue is sufficient to pay such costs but not otherwise.
“Operator” means the individual or company responsible for the exploration, development, and production of an oil or natural gas well or lease.
“Overriding royalty interest” means a royalty interest created or reserved from another (operating or non-operating) interest in oil and natural gas properties. Its term extends for the same term as the interest from which it is created.
“Payout” or “Back-in” occurs when the working interest owners who participate in the costs of drilling and completing a well recoup the costs and expenses, or a multiple of the costs and expenses, of drilling and completing that well. Only then are the owners who chose not to contribute to these initial costs entitled to participate with the other owners in production and share in the expenses and revenues associated with the well. The reversionary interest or back-in interest of an owner similarly occurs when the owner becomes entitled to a specified share of the working or overriding royalty interest when specified costs have been recovered from production.
“Proved developed reserves” means reserves that can be expected to be recovered (i) through existing wells with existing equipment and operating methods or in which the cost of the required equipment is relatively minor compared to the cost of a new well; and (ii) through installed extraction equipment and infrastructure operational at the time of the reserves estimate if the extraction is by means not involving a well.
“Proved reserves” or “Proved oil and natural gas reserves” means those quantities of oil and natural gas, which, by analysis of geoscience and engineering data, can be estimated with reasonable certainty to be economically producible—from a given date forward, from known reservoirs, and under existing economic conditions, operating methods, and governmental regulations—prior to the time at which contracts providing the right to operate expire, unless evidence indicates that renewal is reasonably certain, regardless of whether deterministic or probabilistic methods are used for the estimation. The project to extract the hydrocarbons must have commenced or the operator must be reasonably certain that it will commence the project within a reasonable time.
“Proved undeveloped reserves” means proved reserves that are expected to be recovered from new wells on undrilled acreage, or from existing wells where a relatively major expenditure is required for recompletion.
45
Table of Contents
Index to Financial Statements
“Royalty” means an interest in an oil and natural gas lease that gives the owner of the interest the right to receive a portion of the production from the leased acreage (or of the proceeds of the sale thereof) but generally does not require the owner to pay any portion of the costs of drilling or operating the wells on the leased acreage.
“Severance tax” means an amount of tax, surcharge or levy recovered by governmental agencies from the gross proceeds of oil and natural gas sales. Production tax may be determined as a percentage of proceeds or as a specific amount per volumetric unit of sales. Severance tax is usually withheld from the gross proceeds of oil and natural gas sales by the first purchaser (e.g., pipeline or refinery) of production.
“Standardized measure of discounted future net cash flows” (also referred to as “standardized measure”) means the pretax present value of estimated future net revenues to be generated from the production of proved reserves calculated in accordance with SEC guidelines, net of estimated production and future development costs, using prices and costs as of the date of estimation without future escalation, without giving effect to non-property related expenses such as general and administrative expenses, debt service and depreciation, depletion and amortization, and discounted using an annual discount rate of 10%.
“Test Rate” means a daily volume of oil, gas or condensate at which a well produced to a pipeline or tank battery within that well’s first month of production based on information obtained from public sources or from the operator.
“Undeveloped acreage” means lease acreage on which wells have not been drilled or completed to a point that would permit the production of commercial quantities of oil and natural gas regardless of whether such acreage contains proved reserves.
“Unitization” means the process of combining mineral interests or leases thereof in separate tracts of land into a single entity for administrative, operating or ownership purposes. Unitization is sometimes called “pooling” or “communitization” and may be voluntary or involuntary.
“Working interest” (also referred to as an “operating interest”) means a real property interest entitling the owner to receive a specified percentage of the proceeds of the sale of oil and natural gas production or a percentage of the production but requiring the owner of the working interest to bear the cost to explore for, develop and produce such oil and natural gas. A working interest owner who owns a portion of the working interest may participate either as operator or by voting his percentage interest to approve or disapprove the appointment of an operator and certain activities in connection with the development and operation of a property.
46
Table of Contents
Index to Financial Statements
Pursuant to the requirements of Section 13 or 15(d) of the Securities Exchange Act of 1934, the Registrant has duly caused this report to be signed on its behalf by the undersigned, thereunto duly authorized.
| DORCHESTER MINERALS, L.P. | ||
| By: | Dorchester Minerals Management LP, | |
| its general partner | ||
| By: | Dorchester Minerals Management GP LLC, | |
| its general partner | ||
| By: | /s/ William Casey McManemin | |
| William Casey McManemin Chief Executive Officer | ||
Date: February 25, 2010
Pursuant to the requirements of the Securities and Exchange Act of 1934, this report has been signed below by the following persons on behalf of the Registrant and in the capacities and on the dates indicated.
| /s/ William Casey McManemin |
/s/ H.C. Allen, Jr. | |||
| William Casey McManemin Chief Executive Officer and Manager (Principal Executive Officer) Date: February 25, 2010 |
H.C. Allen, Jr. Chief Financial Officer and Manager (Principal Financial and Accounting Officer) Date: February 25, 2010 | |||
| /s/ James E. Raley |
/s/ Buford P. Berry | |||
| James E. Raley Chief Operating Officer and Manager Date: February 25, 2010 |
Buford P. Berry Manager Date: February 25, 2010 | |||
| /s/ Preston A. Peak |
/s/ C. W. Russell | |||
| Preston A. Peak Manager Date: February 25, 2010 |
C. W. Russell Manager Date: February 25, 2010 | |||
| /s/ Ronald P. Trout |
/s/ Robert C. Vaughn | |||
| Ronald P. Trout Manager Date: February 25, 2010 |
Robert C. Vaughn Manager Date: February 25, 2010 | |||
47
Table of Contents
Index to Financial Statements
(A Delaware Limited Partnership)
INDEX TO CONSOLIDATED FINANCIAL STATEMENTS
Dorchester Minerals, L.P.
F-1
Table of Contents
Index to Financial Statements
REPORT OF INDEPENDENT REGISTERED PUBLIC ACCOUNTING FIRM
General Partner and Unitholders
Dorchester Minerals, L.P.
We have audited Dorchester Minerals, L.P.’s (a Delaware Limited Partnership) and subsidiaries’ (collectively, the “Partnership”) internal control over financial reporting as of December 31, 2009, based on criteria established in Internal Control—Integrated Framework issued by the Committee of Sponsoring Organizations of the Treadway Commission (COSO). The Partnership’s management is responsible for maintaining effective internal control over financial reporting and for its assessment of the effectiveness of internal control over financial reporting, included in the accompanying Management’s Annual Report on Internal Control Over Financial Reporting. Our responsibility is to express an opinion on the Partnership’s internal control over financial reporting based on our audit.
We conducted our audit in accordance with the standards of the Public Company Accounting Oversight Board (United States). Those standards require that we plan and perform the audit to obtain reasonable assurance about whether effective internal control over financial reporting was maintained in all material respects. Our audit included obtaining an understanding of internal control over financial reporting, assessing the risk that a material weakness exists, testing and evaluating the design and operating effectiveness of internal control based on the assessed risk, and performing such other procedures as we considered necessary in the circumstances. We believe that our audit provides a reasonable basis for our opinion.
A company’s internal control over financial reporting is a process designed to provide reasonable assurance regarding the reliability of financial reporting and the preparation of financial statements for external purposes in accordance with generally accepted accounting principles. A company’s internal control over financial reporting includes those policies and procedures that (1) pertain to the maintenance of records that, in reasonable detail, accurately and fairly reflect the transactions and dispositions of the assets of the company; (2) provide reasonable assurance that transactions are recorded as necessary to permit preparation of financial statements in accordance with generally accepted accounting principles, and that receipts and expenditures of the company are being made only in accordance with authorizations of management and directors of the company; and (3) provide reasonable assurance regarding prevention or timely detection of unauthorized acquisition, use, or disposition of the company’s assets that could have a material effect on the financial statements.
Because of its inherent limitations, internal control over financial reporting may not prevent or detect misstatements. Also, projections of any evaluation of effectiveness to future periods are subject to the risk that controls may become inadequate because of changes in conditions, or that the degree of compliance with the policies or procedures may deteriorate.
In our opinion, the Partnership maintained, in all material respects, effective internal control over financial reporting as of December 31, 2009, based on criteria established in Internal Control—Integrated Framework issued by COSO.
We also have audited, in accordance with the standards of the Public Company Accounting Oversight Board (United States), the consolidated balance sheets of the Partnership as of December 31, 2009 and 2008 and the related consolidated statements of operations, cash flows, and changes in partnership capital for each of the three years in the period ended December 31, 2009, and our report dated February 25, 2010 expressed an unqualified opinion on those financial statements.
/s/ GRANT THORNTON LLP
Grant Thornton LLP
Dallas, Texas
February 25, 2010
F-2
Table of Contents
Index to Financial Statements
REPORT OF INDEPENDENT REGISTERED PUBLIC ACCOUNTING FIRM
General Partner and Unitholders
Dorchester Minerals, L.P.
We have audited the accompanying consolidated balance sheets of Dorchester Minerals, L.P. (a Delaware Limited Partnership) and subsidiaries (collectively, the “Partnership”) as of December 31, 2009 and 2008, and the related statements of operations, cash flows, and changes in partnership capital for each of the three years in the period ended December 31, 2009. These financial statements are the responsibility of the Partnership’s management. Our responsibility is to express an opinion on these financial statements based on our audits.
We conducted our audits in accordance with the standards of the Public Company Accounting Oversight Board (United States). Those standards require that we plan and perform the audit to obtain reasonable assurance about whether the financial statements are free of material misstatement. An audit includes examining, on a test basis, evidence supporting the amounts and disclosures in the financial statements. An audit also includes assessing the accounting principles used and significant estimates made by management, as well as evaluating the overall financial statement presentation. We believe that our audits provide a reasonable basis for our opinion.
In our opinion, the consolidated financial statements referred to above present fairly, in all material respects, the financial position of the Partnership as of December 31, 2009 and 2008, and the results of its operations and its cash flows for each of the three years in the period ended December 31, 2009, in conformity with accounting principles generally accepted in the United States of America.
As discussed in Note 1 to the consolidated financial statements, the Partnership has changed its reserve estimates and related disclosures as a result of adopting new oil & gas reserve estimation and disclosure requirements as of December 31, 2009.
We also have audited, in accordance with the standards of the Public Company Accounting Oversight Board (United States), the Partnership’s internal control over financial reporting as of December 31, 2009, based on criteria established in Internal Control__Integrated Framework issued by the Committee of Sponsoring Organizations of the Treadway Commission (COSO) and our report dated February 25, 2010 expressed an unqualified opinion.
/s/ Grant Thornton LLP
Grant Thornton LLP
Dallas, Texas
February 25, 2010
F-3
Table of Contents
Index to Financial Statements
(A Delaware Limited Partnership)
CONSOLIDATED BALANCE SHEETS
December 31, 2009 and 2008
(Dollars in Thousands)
| 2009 | 2008 | |||||||
| ASSETS | ||||||||
| Current assets: |
||||||||
| Cash and cash equivalents |
$ | 10,124 | $ | 16,211 | ||||
| Trade and other receivables |
5,419 | 5,053 | ||||||
| Net profits interests receivable—related party |
3,703 | 4,428 | ||||||
| Total current assets |
19,246 | 25,692 | ||||||
| Other non-current assets |
19 | 19 | ||||||
| Property and leasehold improvements—at cost: |
||||||||
| Oil and natural gas properties (full cost method) |
327,069 | 291,818 | ||||||
| Accumulated full cost depletion |
(193,822 | ) | (178,272 | ) | ||||
| Total |
133,247 | 113,546 | ||||||
| Leasehold improvements |
512 | 512 | ||||||
| Accumulated amortization |
(256 | ) | (207 | ) | ||||
| Total |
256 | 305 | ||||||
| Net property and leasehold improvements |
133,503 | 113,851 | ||||||
| Total assets |
$ | 152,768 | $ | 139,562 | ||||
| LIABILITIES AND PARTNERSHIP CAPITAL | ||||||||
| Current liabilities: |
||||||||
| Accounts payable and other current liabilities |
$ | 529 | $ | 733 | ||||
| Current portion of deferred rent incentive |
39 | 39 | ||||||
| Total current liabilities |
568 | 772 | ||||||
| Deferred rent incentive less current portion |
169 | 208 | ||||||
| Total liabilities |
737 | 980 | ||||||
| Commitments and contingencies (Note 4) |
||||||||
| Partnership capital: |
||||||||
| General partner |
5,240 | 5,971 | ||||||
| Unitholders |
146,791 | 132,611 | ||||||
| Total partnership capital |
152,031 | 138,582 | ||||||
| Total liabilities and partnership capital |
$ | 152,768 | $ | 139,562 | ||||
The accompanying notes are an integral part of these consolidated financial statements.
F-4
Table of Contents
Index to Financial Statements
(A Delaware Limited Partnership)
CONSOLIDATED STATEMENTS OF OPERATIONS
For the Years Ended December 31, 2009, 2008 and 2007 (Dollars in Thousands, except per unit amounts)
| 2009 | 2008 | 2007 | |||||||
| Operating revenues: |
|||||||||
| Royalties |
$ | 33,412 | $ | 61,973 | $ | 44,398 | |||
| Net profits interests |
9,449 | 27,441 | 20,347 | ||||||
| Lease bonus |
688 | 441 | 575 | ||||||
| Other |
82 | 70 | 45 | ||||||
| Total operating revenues |
43,631 | 89,925 | 65,365 | ||||||
| Costs and expenses: |
|||||||||
| Production taxes |
1,202 | 2,792 | 2,093 | ||||||
| Operating expenses |
2,160 | 1,980 | 1,774 | ||||||
| Depreciation, depletion and amortization |
15,599 | 14,739 | 15,567 | ||||||
| General and administrative expenses |
3,715 | 3,965 | 3,591 | ||||||
| Total costs and expenses |
22,676 | 23,476 | 23,025 | ||||||
| Operating income |
20,955 | 66,449 | 42,340 | ||||||
| Other income, net |
726 | 334 | 708 | ||||||
| Net earnings |
$ | 21,681 | $ | 66,783 | $ | 43,048 | |||
| Allocation of net earnings: |
|||||||||
| General Partner |
$ | 698 | $ | 1,999 | $ | 1,274 | |||
| Unitholders |
$ | 20,983 | $ | 64,784 | $ | 41,774 | |||
| Net earnings per common unit (basic and diluted) |
$ | 0.72 | $ | 2.30 | $ | 1.48 | |||
| Weighted average common units outstanding (000’s) |
29,044 | 28,240 | 28,240 | ||||||
The accompanying notes are an integral part of these consolidated financial statements.
F-5
Table of Contents
Index to Financial Statements
(A Delaware Limited Partnership)
CONSOLIDATED STATEMENTS OF CASH FLOWS
For the Years Ended December 31, 2009, 2008 and 2007
(Dollars in Thousands)
| 2009 | 2008 | 2007 | ||||||||||
| Cash flows from operating activities: |
||||||||||||
| Net earnings |
$ | 21,681 | $ | 66,783 | $ | 43,048 | ||||||
| Adjustments to reconcile net earnings to net cash provided by operating activities: |
||||||||||||
| Depreciation, depletion and amortization |
15,599 | 14,739 | 15,567 | |||||||||
| Write-off related to unsuccessful acquisition |
— | 62 | 57 | |||||||||
| Amortization of deferred rent |
(39 | ) | (40 | ) | (39 | ) | ||||||
| Changes in operating assets and liabilities: |
||||||||||||
| Trade and other receivables |
(366 | ) | 2,000 | (965 | ) | |||||||
| Net profits interests receivable—related party |
725 | (852 | ) | 550 | ||||||||
| Accounts payable and other current liabilities |
(204 | ) | 216 | 214 | ||||||||
| Net cash provided by operating activities |
37,396 | 82,908 | 58,432 | |||||||||
| Cash flows from investing activities: |
||||||||||||
| Proceeds from note receivable—related party |
— | — | 55 | |||||||||
| Adjustment related to acquisition of natural gas properties |
1,251 | — | — | |||||||||
| Capital expenditures |
(6 | ) | (50 | ) | (12 | ) | ||||||
| Net cash provided by (used in) investing activities |
1,245 | (50 | ) | 43 | ||||||||
| Cash flows from financing activities: |
||||||||||||
| Distributions paid to partners |
(44,728 | ) | (81,648 | ) | (57,401 | ) | ||||||
| Increase (decrease) in cash and cash equivalents |
(6,087 | ) | 1,210 | 1,074 | ||||||||
| Cash and cash equivalents at beginning of year |
16,211 | 15,001 | 13,927 | |||||||||
| Cash and cash equivalents at end of year |
$ | 10,124 | $ | 16,211 | $ | 15,001 | ||||||
| Non-Cash investing and financing activities |
||||||||||||
| Value of units issued for natural gas properties acquired |
$ | 36,496 | — | — | ||||||||
The accompanying notes are an integral part of these consolidated financial statements.
F-6
Table of Contents
Index to Financial Statements
(A Delaware Limited Partnership)
CONSOLIDATED STATEMENTS OF CHANGES IN PARTNERSHIP CAPITAL
For the Years Ended December 31, 2009, 2008 and 2007
(Dollars in Thousands)
| Year |
General Partner |
Unitholders | Total | Unitholder Units | ||||||||||
| 2007 |
||||||||||||||
| Balance at January 1, 2007 |
$ | 6,797 | $ | 161,003 | $ | 167,800 | 28,240,431 | |||||||
| Net earnings |
1,274 | 41,774 | 43,048 | |||||||||||
| Distributions ($1.973989 per Unit) |
(1,654 | ) | (55,747 | ) | (57,401 | ) | ||||||||
| Balance at December 31, 2007 |
6,417 | 147,030 | 153,447 | 28,240,431 | ||||||||||
| 2008 |
||||||||||||||
| Net earnings |
1,999 | 64,784 | 66,783 | |||||||||||
| Distributions ($2.804603 per Unit) |
(2,445 | ) | (79,203 | ) | (81,648 | ) | ||||||||
| Balance at December 31, 2008 |
5,971 | 132,611 | 138,582 | 28,240,431 | ||||||||||
| 2009 |
||||||||||||||
| Net earnings |
698 | 20,983 | 21,681 | |||||||||||
| Acquisition of assets for units |
— | 36,496 | 36,496 | 1,600,000 | ||||||||||
| Distributions ($1.501608 per Unit) |
(1,429 | ) | (43,299 | ) | (44,728 | ) | ||||||||
| Balance at December 31, 2009 |
$ | 5,240 | $ | 146,791 | $ | 152,031 | 29,840,431 | |||||||
The accompanying notes are an integral part of these consolidated financial statements.
F-7
Table of Contents
Index to Financial Statements
(A Delaware Limited Partnership)
NOTES TO CONSOLIDATED FINANCIAL STATEMENTS
December 31, 2009, 2008 and 2007
| 1. | General and Summary of Significant Accounting Policies |
Nature of Operations—In these Notes, the term “Partnership,” as well as the terms “us,” “our,” “we,” and “its” are sometimes used as abbreviated references to Dorchester Minerals, L.P. itself or Dorchester Minerals, L.P. and its related entities. Our Partnership is a Dallas, Texas based owner of producing and nonproducing natural gas and crude oil royalty, net profits, and leasehold interests in 574 counties and 25 states. We are a publicly traded Delaware limited partnership that was formed in December 2001, and commenced operations on January 31, 2003.
Basis of Presentation—Per-unit information is calculated by dividing the earnings or loss applicable to holders of our Partnership’s common units by the weighted average number of units outstanding. The Partnership has no potentially dilutive securities and, consequently, basic and dilutive earnings per unit do not differ.
Principles of Consolidation—The consolidated financial statements include the accounts of Dorchester Minerals, L.P., Dorchester Minerals Oklahoma, LP, and Dorchester Minerals Oklahoma GP, Inc. Dorchester Minerals Acquisition LP and Dorchester Minerals Acquisition GP, Inc. were merged into Dorchester Minerals Oklahoma, LP and Dorchester Minerals Oklahoma GP, Inc. effective December 31, 2009. All significant intercompany balances and transactions have been eliminated in consolidation.
Estimates—The preparation of financial statements in conformity with accounting principles generally accepted in the United States of America requires management to make estimates and assumptions that affect the reported amounts of assets and liabilities and disclosure of contingent assets and liabilities at the date of the consolidated financial statements and the reported amounts of revenues and expenses during the reporting period. For example, estimates of uncollected revenues and unpaid expenses from royalties and net profits interests in properties operated by non-affiliated entities are particularly subjective due to inability to gain accurate and timely information. Therefore, actual results could differ from those estimates. See “Item 1. Business—Customers and Pricing” and “Item 2. “Properties—Royalty Properties” for additional discussion.
The discounted present value of our proved oil and natural gas reserves is a major component of the ceiling calculation and requires many subjective judgments. Estimates of reserves are forecasts based on engineering and geological analyses. Different reserve engineers may reach different conclusions as to estimated quantities of oil and natural gas reserves based on the same information. The passage of time provides more qualitative information regarding reserve estimates, and revisions are made to prior estimates based on updated information. However, there can be no assurance that more significant revisions will not be necessary in the future. Significant downward revisions could result in an impairment representing a non-cash charge to earnings. In addition to the impact on the calculation of the ceiling test, estimates of proved reserves are also a major component of the calculation of depletion. See the discussion under Property and Equipment.
General Partner—Our general partner is Dorchester Minerals Management LP, referred to in these Notes as “our general partner.” Our general partner owns all of the partnership interests in Dorchester Minerals Operating LP, the operating partnership. See Note 3 —Related Party Transactions. The general partner is allocated 1% and 4% of our Net Profits Interests revenues and Royalty Properties revenues, respectively. Our executive officers all own an interest in our general partner and receive no compensation for services as officers of our Partnership.
Cash and Cash Equivalents—Our principal banking is with major financial institutions. Cash balances in these accounts may, at times, exceed federally insured limits. We have not experienced any losses in such cash accounts and do not believe we are exposed to any significant risk on cash and cash equivalents. Short term
F-8
Table of Contents
Index to Financial Statements
DORCHESTER MINERALS, L.P.
(A Delaware Limited Partnership)
NOTES TO CONSOLIDATED FINANCIAL STATEMENTS—(Continued)
December 31, 2009, 2008 and 2007
investments with a maturity of three months or less are considered to be cash equivalents and are carried at cost, which approximates fair value. Other income includes interest earned on short term investments of $14,000, $329,000, and $578,000 in 2009, 2008, and 2007, respectively.
Concentration of Credit Risks—Our Partnership, as a royalty owner, has no control over the volumes or method of sale of oil and natural gas produced and sold from the Royalty Properties. It is believed that the loss of any single customer would not have a material adverse effect on the consolidated results of our operations.
Fair Value of Financial Instruments—The carrying amount of cash and cash equivalents, trade receivables and payables approximates fair value because of the short maturity of those instruments. These estimated fair values may not be representative of actual values of the financial instruments that could have been realized as of year-end or that will be realized in the future.
Trade Receivables—Our Partnership’s trade receivables consist primarily of Royalty Properties payments receivable and Net Profits Interests payments receivable. Most payments are received two to four months after production date. No allowance for doubtful accounts is deemed necessary.
Note Receivable—Related Party—Our Note Receivable consisted of a five-year note payable by Dorchester Minerals Operating LP, referred to in these Notes as “the operating partnership,” bearing interest at 6% having an original amount of $250,836. Principal and interest payments were received quarterly. The note was paid in full at December 31, 2007.
Property and Equipment—We utilize the full cost method of accounting for costs related to our oil and natural gas properties. Under this method, all such costs are capitalized and amortized on an aggregate basis over the estimated lives of the properties using the units-of-production method. These capitalized costs are subject to a ceiling test, however, which limits such pooled costs to the aggregate of the present value of future net revenues attributable to proved oil and natural gas reserves discounted at 10% plus the lower of cost or market value of unproved properties. Our Partnership did not assign any value to unproved properties, including nonproducing royalty, mineral and leasehold interests. The full cost ceiling is evaluated at the end of each quarter and when events indicate possible impairment.
While the quantities of proved reserves require substantial judgment, the associated prices of oil and natural gas reserves that are included in the discounted present value of our reserves are objectively determined. Beginning December 31, 2009, the ceiling test calculation requires use of the unweighted arithmetic average of the first day of the month price during the 12-month period ending on the balance sheet date (previously year-end prices) and costs in effect as of the last day of the accounting period, which are generally held constant for the life of the properties. As a result, the present value is not necessarily an indication of the fair value of the reserves. Oil and natural gas prices have historically been volatile, and the prevailing prices at any given time may not reflect our Partnership’s or the industry’s forecast of future prices. Changes in determining the price to use in reserve report calculations did not materially increase our depletion expense. See New Accounting Pronouncements below.
Our Partnership’s properties are being depleted on the unit-of-production method using estimates of proved oil and natural gas reserves. Gains and losses are recognized upon the disposition of oil and natural gas properties involving a significant portion (greater than 25%) of our Partnership’s reserves. Proceeds from other dispositions of oil and natural gas properties are credited to the full cost pool. No gains or losses have been recorded for 2009, 2008 or 2007.
F-9
Table of Contents
Index to Financial Statements
DORCHESTER MINERALS, L.P.
(A Delaware Limited Partnership)
NOTES TO CONSOLIDATED FINANCIAL STATEMENTS—(Continued)
December 31, 2009, 2008 and 2007
Due to the nature of our interests, we have no exploratory wells or associated costs pending determination, and no exploratory well costs were charged to expense.
Leasehold improvements include $415,000 received in 2004 as an incentive in our office space lease and is offset in liabilities as deferred rent. Leasehold improvements are amortized over the shorter of their estimated useful lives or the related lease life of 10 years. For leases with renewal periods at the Partnership’s option, we have used the original lease term, excluding renewal option periods to determine useful life. Deferred rent incentive is being amortized to general and administrative expense over the same term as the leasehold improvements, which is 10 years.
Asset Retirement Obligations—Based on the nature of our property ownership, we have no material obligation required to be recorded.
Revenue Recognition—The pricing of oil and natural gas sales from the Royalty Properties is primarily determined by supply and demand in the marketplace and can fluctuate considerably. As a royalty owner, we have extremely limited involvement and operational control over the volumes and method of sale of oil and natural gas produced and sold from the Royalty Properties.
Revenues from Royalty Properties and Net Profits Interests are recorded under the cash receipts approach as directly received from the remitters’ statement accompanying the revenue check. Since the revenue checks are generally received two to four months after the production month, the Partnership accrues for revenue earned but not received by estimating production volumes and product prices.
Income Taxes—We are treated as a partnership for income tax purposes and, as a result, our income or loss is includible in the tax returns of the individual unitholders. Unitholders should consult tax advisors concerning their own tax situation. Depletion of oil and natural gas properties is an expense allowable to each individual partner, and the depletion expense as reported on the consolidated financial statements will not be indicative of the depletion expense an individual partner or unitholder may be able to deduct for income tax purposes.
Texas imposes a margin tax at a rate of 1% on gross revenues less certain deductions, as specifically set forth in the Texas margin tax statute. The Texas margin tax applies to corporations and limited liability companies, general and limited partnerships (unless otherwise exempt), limited liability partnerships, trusts (unless otherwise exempt), business trusts, business associations, professional associations, joint stock companies, holding companies, joint ventures and certain other business entities having limited liability protection.
Limited partnerships that receive at least 90% of their gross income from designated passive sources, including royalties from mineral properties and other non-operated mineral interest income, and do not receive more than 10% of their income from operating an active trade or business, are generally exempt from the Texas margin tax as “passive entities.” We believe our Partnership meets the requirements for being considered a “passive entity” for Texas margin tax purposes and, therefore, it is exempt from the Texas margin tax. If exempt from tax at the Partnership level as a passive entity, each unitholder that is considered a taxable entity under the Texas margin tax would generally be required to include its portion of Partnership revenues in its own Texas margin tax computation. The Texas Administrative Code provides such income is sourced according to the principal place of business of the Partnership, which would be the state of Texas.
F-10
Table of Contents
Index to Financial Statements
DORCHESTER MINERALS, L.P.
(A Delaware Limited Partnership)
NOTES TO CONSOLIDATED FINANCIAL STATEMENTS—(Continued)
December 31, 2009, 2008 and 2007
Each unitholder is urged to consult his own tax advisor regarding the requirements for filing state income, franchise and Texas margin tax returns.
New Accounting Pronouncements—The Financial Accounting Standards Board (“FASB”) Accounting Standards Codification (“ASC”) 105-10-5, General Principles, Generally Accepted Accounting Principles defines the new hierarchy for U.S. GAAP and explains how the FASB will use its Accounting Standards Codification as the sole source for all authoritative guidance. FASB ASC 105-10-5 replaces SFAS 162, The Hierarchy of Generally Accepted Accounting Principles, which was issued in May 2008. It was effective for all reporting periods ending after September 15, 2009, and we have revised all references to pre-codification GAAP in our financial statements. It did not have a material impact on our consolidated financial statements.
FASB ASC 805-10, Business Combinations, among other things, establishes principles and requirements for how the acquirer in a business combination (a) recognizes and measures in its financial statements the identifiable assets acquired, the liabilities assumed, and any noncontrolling interest in the acquired business, (b) changes the accounting for contingent consideration, in process research and development, and restructuring costs, c) expenses acquisition-related costs as incurred, (d) recognizes and measures the goodwill acquired in the business combination or a gain from a bargain purchase, and (e) determines what information to disclose to enable users of the financial statements to evaluate the nature and financial effects of the business combination. We adopted FASB ASC 805-10 as of January 1, 2009 with no material impact on our consolidated financial statements.
FASB ASC 855-10, Subsequent Events, incorporates the accounting and disclosure requirements for subsequent events into U.S. generally accepted accounting principles. FASB ASC 855-10 introduces new terminology, defines a date through which management must evaluate subsequent events, and lists the circumstances under which an entity must recognize and disclose events or transactions occurring after the balance sheet date. We adopted FASB ASC 855-10 as of June 30, 2009, which was the required effective date.
FASB Accounting Standards Update (“ASU”) 2010-03 was issued on January 6, 2010, and aligns the current oil and natural gas reserve estimation and disclosure requirements of ASC 932 with those in the SEC Final Rule Modernization of Oil and Gas Reporting issued December 31, 2008. The rules only apply prospectively as a change in estimate. The most significant amendments to the reserve and disclosure requirements include the following:
| • | Commodity Prices—Economic producibility of reserves and discounted cash flows will be based on an unweighted arithmetic average of the first day of the month commodity price during the 12-month period ending on the balance sheet date unless contractual arrangements designate the price to be used. |
| • | Disclosure of Unproved Reserves—Probable and possible reserves may be disclosed separately on a voluntary basis. |
| • | Proved Undeveloped Reserve Guidelines—Reserves may be classified as proved undeveloped if there is a high degree of confidence that the quantities will be recovered. |
| • | Reserve Estimation Using New Technologies—Reserves may be estimated through the use of reliable technology in addition to flow tests and production history. |
| • | Reserve Personnel and Estimation Process—Additional disclosure is required regarding the qualifications of the chief technical person who oversees our reserves estimation process. We will also be required to provide a general discussion of our internal controls used to assure the objectivity of the reserves estimate. |
F-11
Table of Contents
Index to Financial Statements
DORCHESTER MINERALS, L.P.
(A Delaware Limited Partnership)
NOTES TO CONSOLIDATED FINANCIAL STATEMENTS—(Continued)
December 31, 2009, 2008 and 2007
| • | Disclosure by Geographic Area—Reserves in foreign countries or continents must be presented separately if they represent more than 15% of our total oil and natural gas proved reserves. |
| • | Non-Traditional Resources—The definition of oil and natural gas producing activities will expand and focus on the marketable product rather than the method of extraction. |
ASU 2010-03 is effective for entities with annual reporting periods ending on or after December 31, 2009. We adopted both the FASB and SEC rules described above as of December 31, 2009 with no material impact on our consolidated financial statements. See “Note 6 Unaudited Oil and Natural Gas Reserve and Standardized Measure Information” for more information.
Subsequent Events—We are not aware of any subsequent events, which are not already recognized or disclosed, that would require recognition or disclosure in the financial statements.
| 2. | Acquisitions |
We have an effective registration statement on Form S-4 registering 5,000,000 common units that may be offered and issued by the Partnership from time to time in connection with asset acquisitions or other business combination transactions. On June 30, 2009, we acquired producing and non-producing Barnett Shale mineral and royalty interests located in Tarrant County, Texas for 1,600,000 common units of Dorchester Minerals, L.P. issued pursuant to the shelf registration statement. Net assets acquired at the date of acquisition totaled $36,496,000. The balance sheets presented include $35,245,000 in property additions. After the issuance, 3,400,000 units remain available under the shelf registration statement.
| 3. | Related Party Transactions |
Our general partner owns all of the partnership interests in the operating partnership. It is the employer of all personnel, owns the working interests and other properties underlying our Net Profits Interests, and provides day-to-day operational and administrative services to us and the general partner. In accordance with our partnership agreement, we reimburse the general partner for certain allocable general and administrative costs, including rent, salaries, and employee benefit plans. These types of reimbursements are limited to 5% of distributions, plus certain costs previously paid. All such costs have been below the 5% limit amount. Additionally, certain reimbursable direct costs such as professional and regulatory fees and ad valorem and severance taxes, are not limited. Significant activity between the partnership and the operating partnership consists of the following:
| In Thousands | |||||||||
| From/To Operating Partnership |
2009 | 2008 | 2007 | ||||||
| Net Profits Interests Payments Receivable or Accrued (1) |
$ | 3,703 | $ | 4,428 | $ | 3,576 | |||
| Interest Income related to Net Profits Interests Payments |
$ | 3 | $ | 1 | $ | 1 | |||
| General & Administrative Amounts Payable |
$ | 34 | $ | 146 | $ | 52 | |||
| General & Administrative Amounts Accrued |
$ | 33 | $ | 58 | $ | 31 | |||
| Total General & Administrative Amounts |
$ | 2,448 | $ | 2,690 | $ | 2,365 | |||
| (1) | All Net Profits Interests income on the financial statements is from the operating partnership. |
F-12
Table of Contents
Index to Financial Statements
DORCHESTER MINERALS, L.P.
(A Delaware Limited Partnership)
NOTES TO CONSOLIDATED FINANCIAL STATEMENTS—(Continued)
December 31, 2009, 2008 and 2007
| 4. | Commitments and Contingencies |
In January 2002, some individuals and an association called Rural Residents for Natural Gas Rights sued Dorchester Hugoton, Ltd., along with several other operators in Texas County, Oklahoma regarding the use of natural gas from the wells in residences. The operating partnership now owns and operates the properties formerly owned by Dorchester Hugoton. These properties contribute a major portion of the Net Profits Interests amounts paid to us. On April 9, 2007, plaintiffs, for immaterial costs, dismissed with prejudice all claims against the operating partnership regarding such residential gas use. On October 4, 2004, the plaintiffs filed severed claims against the operating partnership regarding royalty underpayments, which the Texas County District Court subsequently dismissed with a grant of time to replead. On January 27, 2006, one of the original plaintiffs again sued the operating partnership for underpayment of royalty, seeking class action certification. On October 1, 2007, the Texas County District Court granted the operating partnership’s motion for summary judgment finding no royalty underpayments. Subsequently, the District Court denied the plaintiff’s motion for reconsideration, and the plaintiff filed an appeal. At present, the litigation awaits result of the appeal to the Oklahoma Supreme Court. An adverse appellate decision could reduce amounts we receive from the Net Profits Interests.
Dorchester Minerals, L.P filed Cause No. 07-0250-15; Dorchester Minerals, LP v. H&S Production, Inc. in the 15th District Court of Grayson County, Texas in January, 2007. The suit involved claims under an oil and gas lease between us as lessor and H&S as lessee. Our Motion for Summary Judgment, which included damages in the amount of $496,000, was granted by the trial court in May 2008. H&S appealed the Judgment. The Fifth District Court of Appeals affirmed the Judgment on liability and remanded on damages. The subsequent Motion for Rehearing filed by H&S was denied by the Fifth District Appeals Court. The matter was settled on October 22, 2009 with the Appeals Court ruling on liability continuing to stand, the dismissal with prejudice of the remanded action on damages, and receipt of a $500,000 payment from H&S to us. The deposit was recorded in the fourth quarter 2009 financial statements in other income.
Our Partnership and the operating partnership are involved in other legal and/or administrative proceedings arising in the ordinary course of their businesses, none of which have predictable outcomes and none of which are believed to have any significant effect on consolidated financial position, cash flows, or operating results.
Operating Leases—We have entered into a non-cancelable, renewable at prevailing rate for an additional five years, operating lease agreement in the ordinary course of our business activities. The lease is for our office space at 3838 Oak Lawn Avenue, Suite 300, Dallas, Texas, and expires in 2015. Rental expense related to the lease, including operating expenses and consumption of electricity, was $217,000, $200,000, and $199,000 for the years ended December 31, 2009, 2008 and 2007, respectively. The base rent escalates in October 2010. Minimum rental commitments under the terms of our operating lease are as follows:
| Years Ended December 31, |
Minimum Payments | ||
| 2010 |
$ | 228,000 | |
| 2011 |
237,000 | ||
| 2012 |
240,000 | ||
| 2013 |
249,000 | ||
| 2014 |
261,000 | ||
| Thereafter |
65,000 | ||
| Total |
$ | 1,280,000 | |
F-13
Table of Contents
Index to Financial Statements
DORCHESTER MINERALS, L.P.
(A Delaware Limited Partnership)
NOTES TO CONSOLIDATED FINANCIAL STATEMENTS—(Continued)
December 31, 2009, 2008 and 2007
| 5. | Distribution To Holders Of Common Units |
Unitholder cash distributions per common unit have been:
| Per Unit Amount | |||||||||
| 2009 | 2008 | 2007 | |||||||
| First Quarter |
$ | 0.401205 | $ | 0.572300 | $ | 0.461146 | |||
| Second Quarter |
$ | 0.271354 | $ | 0.769206 | $ | 0.473745 | |||
| Third Quarter |
$ | 0.286968 | $ | 0.948472 | $ | 0.560502 | |||
| Fourth Quarter |
$ | 0.321540 | $ | 0.542081 | $ | 0.514625 | |||
Distributions beginning with the second quarter of 2009 were paid on 29,840,431 units; previous distributions above were paid on 28,240,431 units. Fourth quarter distributions are paid in February of the following calendar year to unitholders of record in January or February of such following year. The partnership agreement requires the next cash distribution to be paid by May 15, 2010.
| 6. | Unaudited Oil and Natural Gas Reserve and Standardized Measure Information |
The Net Profits Interests represent net profits overriding royalty interests in various properties owned by the operating partnership. The Royalty Properties consist of producing and nonproducing mineral, royalty, overriding royalty, net profits, and leasehold interests located in 574 counties and parishes in 25 states. Amounts set forth herein attributable to the Net Profits Interests reflect our 96.97% net share. Although new discoveries have occurred on certain of the Royalty Properties, based on engineering studies available to date, no events have occurred since December 31, 2009 that would have a material effect on our estimated proved developed reserves.
In accordance with FASB ASC 932 and Securities and Exchange Commission rules and regulations, the following information is presented with regard to the Net Profits Interests and Royalty Properties oil and natural gas reserves, all of which are proved, developed and located in the United States. These rules require inclusion as a supplement to the basic financial statements a standardized measure of discounted future net cash flows relating to proved oil and natural gas reserves. The standardized measure, in management’s opinion, should be examined with caution. The basis for these disclosures is petroleum engineers’ reserve studies which contain imprecise estimates of quantities and rates of production of reserves. Revision of prior year estimates can have a significant impact on the results. Also, exploration and production improvement costs in one year may significantly change previous estimates of proved reserves and their valuation. Values of unproved properties and anticipated future price and cost increases or decreases are not considered. Therefore, the standardized measure is not necessarily a best estimate of the fair value of oil and natural gas properties or of future net cash flows.
The following summaries of changes in reserves and standardized measure of discounted future net cash flows were prepared from estimates of proved reserves. The production volumes and reserve volumes included for properties formerly owned by Dorchester Hugoton are wellhead volumes, which differ from sales volumes shown in “Item 7.—Management’s Discussion and Analysis of Financial Condition and Results of Operations” because of fuel, shrinkage and pipeline loss. The Standardized Measure of Discounted Future Net Cash Flows reflects adjustments for such fuel, shrinkage and pipeline loss.
F-14
Table of Contents
Index to Financial Statements
DORCHESTER MINERALS, L.P.
(A Delaware Limited Partnership)
NOTES TO CONSOLIDATED FINANCIAL STATEMENTS—(Continued)
December 31, 2009, 2008 and 2007
Summary of Changes in Proved Reserves
| Oil (mbbl) | Natural Gas (mmcf) | |||||||||||||||||||||||
| 2009(1) | 2009 | 2008(1) | 2007(1) | 2009(1) | 2009 | 2008(1) | 2007(1) | |||||||||||||||||
| Estimated quantity, beginning of year |
3,570 | 3,570 | 3,566 | 3,802 | 60,977 | 60,977 | 61,255 | 65,798 | ||||||||||||||||
| Purchase of minerals in place |
— | — | — | — | 5,585 | 5,585 | — | — | ||||||||||||||||
| Revisions in previous estimates |
15 | 13 | 317 | 80 | 2,645 | 2,212 | 8,070 | 3,721 | ||||||||||||||||
| Production |
(306 | ) | (306 | ) | (313 | ) | (316 | ) | (8,494 | ) | (8,494 | ) | (8,348 | ) | (8,264 | ) | ||||||||
| Estimated quantity, end of year |
3,279 | 3,277 | 3,570 | 3,566 | 60,713 | 60,280 | 60,977 | 61,255 | ||||||||||||||||
| (1) | Based on end-of-year pricing of oil and natural gas. |
Standardized Measure of Discounted Future Net Cash Flows
(Dollars in Thousands)
| 2009(1) | 2009 | 2008(1) | 2007(1) | |||||||||||||
| Future estimated gross revenues |
$ | 507,987 | $ | 333,161 | $ | 361,974 | $ | 636,734 | ||||||||
| Future estimated production costs |
(26,041 | ) | (18,488 | ) | (17,381 | ) | (31,969 | ) | ||||||||
| Future estimated net revenues |
481,946 | 314,673 | 344,593 | 604,765 | ||||||||||||
| 10% annual discount for estimated timing of cash flows |
(221,638 | ) | (148,638 | ) | (155,109 | ) | (288,398 | ) | ||||||||
| Standardized measure of discounted future estimated net cash flows |
$ | 260,308 | $ | 166,035 | $ | 189,484 | $ | 316,367 | ||||||||
| Sales of oil and natural gas produced, net of production costs |
$ | (39,498 | ) | $ | (84,642 | ) | $ | (60,877 | ) | |||||||
| Purchase of reserves in place |
7,455 | — | — | |||||||||||||
| Net changes in prices and production costs |
(8,396 | ) | (102,401 | ) | 87,896 | |||||||||||
| Revisions of previous quantity estimates |
4,751 | 22,935 | 16,083 | |||||||||||||
| Accretion of discount |
18,948 | 31,637 | 24,616 | |||||||||||||
| Change in production rate and other |
(6,709 | ) | 5,588 | 2,490 | ||||||||||||
| Net change in standardized measure of discounted future estimated net cash flows |
$ | (23,449 | ) | $ | (126,883 | ) | $ | 70,208 | ||||||||
| Depletion of oil and natural gas properties (dollars per mcfe) |
$ | 1.51 | $ | 1.44 | $ | 1.53 | ||||||||||
| Property acquisition costs |
$ | 35,245 | $ | — | $ | — | ||||||||||
| Average oil price per barrel (2) |
$ | 56.37 | $ | 35.69 | $ | 90.01 | ||||||||||
| Average natural gas price per mcf (2) |
$ | 3.24 | $ | 4.92 | $ | 6.31 | ||||||||||
| (1) | Based on end-of-year pricing of oil and natural gas. |
| (2) | Includes Royalty and Net Profits Interests prices combined by volumetric proportions. |
F-15
Table of Contents
Index to Financial Statements
DORCHESTER MINERALS, L.P.
(A Delaware Limited Partnership)
NOTES TO CONSOLIDATED FINANCIAL STATEMENTS—(Continued)
December 31, 2009, 2008 and 2007
Unaudited Quarterly Financial Data
Quarterly financial data for the last two years (in thousands except per unit data) is summarized as follows:
| 2009 Quarter Ended | 2008 Quarter Ended | |||||||||||||||||||||||
| March 31 | June 30 | Sept. 30 | Dec. 31 | March 31 | June 30 | Sept. 30 | Dec. 31 | |||||||||||||||||
| Total operating revenues |
$ | 8,824 | $ | 9,684 | $ | 10,706 | $ | 14,417 | $ | 21,272 | $ | 28,988 | $ | 24,487 | $ | 15,178 | ||||||||
| Net earnings |
$ | 3,777 | $ | 4,720 | $ | 4,415 | $ | 8,769 | $ | 15,410 | $ | 23,166 | $ | 18,590 | $ | 9,617 | ||||||||
| Net earnings per Unit (basic and diluted) |
$ | 0.13 | $ | 0.16 | $ | 0.14 | $ | 0.29 | $ | 0.53 | $ | 0.80 | $ | 0.64 | $ | 0.33 | ||||||||
| Weighted average common units outstanding |
28,240 | 28,258 | 29,840 | 29,840 | 28,240 | 28,240 | 28,240 | 28,240 | ||||||||||||||||
F-16