Attached files
| file | filename |
|---|---|
| 8-K - FORM 8-K - TELEFLEX INC | c00781e8vk.htm |

| TELEFLEX INCORPORATED COMPANY OVERVIEW Exhibit 99.1 |
| 2 2 2 Forward-Looking Statements/Additional Notes This presentation and our discussion contain forward-looking information and statements including, but not limited to, upcoming 2010 Medical Segment product launches; forecasted 2010 revenue, gross margin, operating margin, diluted earning per share from continuing operations, diluted earnings per share excluding intangible amortization expense, which we refer to as "Cash EPS," and cash flow from continuing operations; forecasted adjusted 2010 gross margin, diluted earnings per share from continuing operations, Cash EPS and cash flow from continuing operations; longer-term growth and profitability objectives over the next 5 years, including, achievement of consolidated organic revenue growth of approximately 5%, consolidated gross margins of approximately 55%, consolidated research and development expense of approximately 5% and consolidated operating margins of approximately 25%; our expectation of becoming a pure-play medical device company; and other matters which inherently involve risks and uncertainties which could cause actual results to differ from those projected or implied in the forward-looking statements. These risks and uncertainties are addressed in the Company's SEC filings, including its most recent Form 10-K. This presentation includes certain non-GAAP financial measures, which include adjusted gross profit and margins; adjusted operating profit and margins; adjusted earnings from continuing operations; adjusted diluted earning per share from continuing operations; adjusted Cash EPS; adjusted cash flow from continuing operations; adjusted segment operating profit and margins; forecasted adjusted gross margin, adjusted operating margin, adjusted diluted earnings per share from continuing operations; adjusted Cash EPS and adjusted cash flow from continuing operations. These non-GAAP measures exclude the impact of restructuring and impairment costs, (gain)/loss on sale of assets and other charges, the impact of an amendment of ASC topic 860, an income tax refund related to gains on a business divestiture and intangible amortization expense. Segment operating profit is defined as a segment's revenues reduced by its materials, labor and other product costs along with the segment's selling, engineering and administrative expenses and noncontrolling interest. Unallocated corporate expenses, restructuring costs, gain or loss on the sale of assets, acquisition integration costs, fair market adjustments for inventory, interest income and expense and taxes on income are excluded from the measure. Core revenues and growth exclude the impact of translating the results of international subsidiaries at different currency exchange rates from year to year and the comparable activity of companies acquired or divested within the most recent twelve-month period. The following slides reflect continuing operations. |
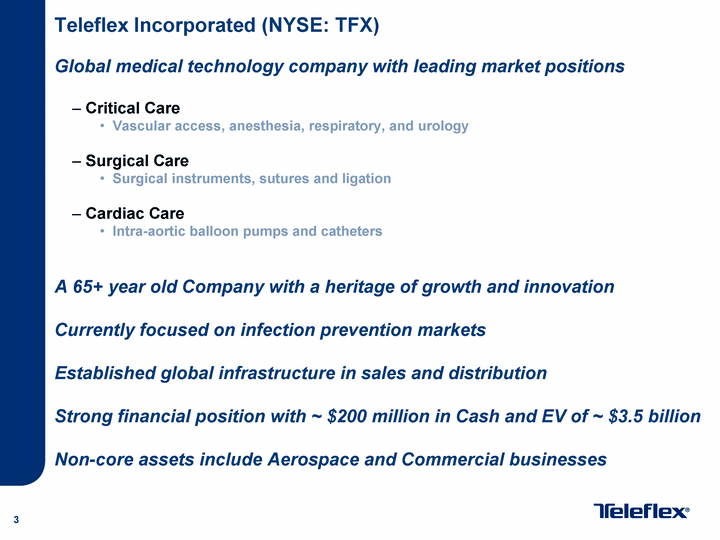
| 3 Teleflex Incorporated (NYSE: TFX) Global medical technology company with leading market positions Critical Care Vascular access, anesthesia, respiratory, and urology Surgical Care Surgical instruments, sutures and ligation Cardiac Care Intra-aortic balloon pumps and catheters A 65+ year old Company with a heritage of growth and innovation Currently focused on infection prevention markets Established global infrastructure in sales and distribution Strong financial position with ~ $200 million in Cash and EV of ~ $3.5 billion Non-core assets include Aerospace and Commercial businesses |
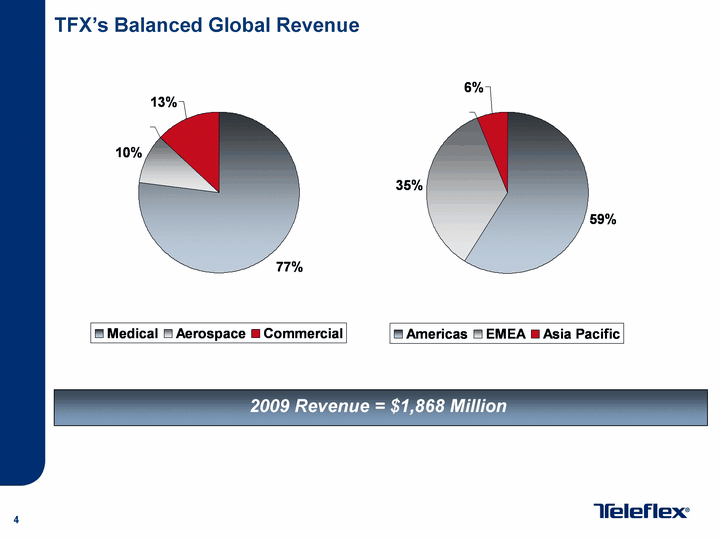
| 4 TFX's Balanced Global Revenue Medical Aerospace Commercial 0.77 0.1 0.13 Americas EMEA Asia Pacific 0.59 0.35 0.06 2009 Revenue = $1,868 Million |
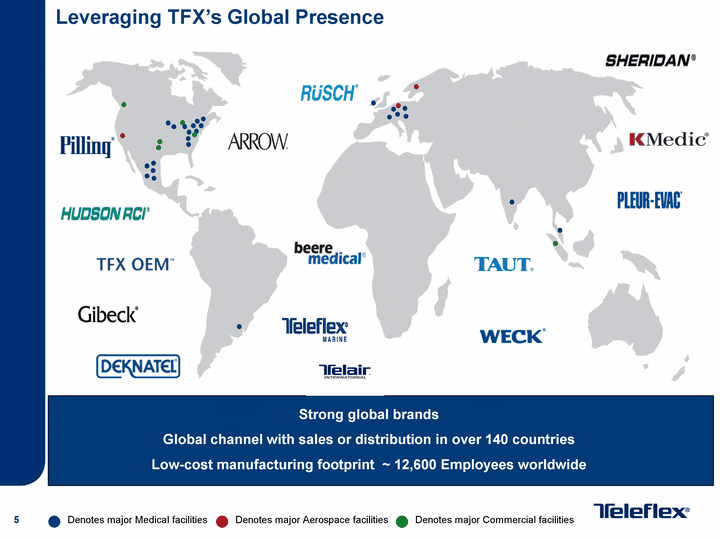
| 5 Leveraging TFX's Global Presence Denotes major Medical facilities Denotes major Aerospace facilities Denotes major Commercial facilities Strong global brands Global channel with sales or distribution in over 140 countries Low-cost manufacturing footprint ~ 12,600 Employees worldwide |

| 6 Medical Device Industry Overview Critical Care Surgical Care Cardiac Care OEM 0.28 0.29 0.02 0.41 Addressable Market Size Sales = $17.3 billion 1 Market Drivers Global demographics Aging population Rising standard of living in emerging markets Increasing demand for medical technology Global healthcare markets Changing regulatory environment Demand for increased quality of life Rising costs Awareness of infection prevention Greater government involvement Industrialization of Healthcare Technology advancements Continuous quality improvements Low-cost / value-added product 1 = based on Company estimates |
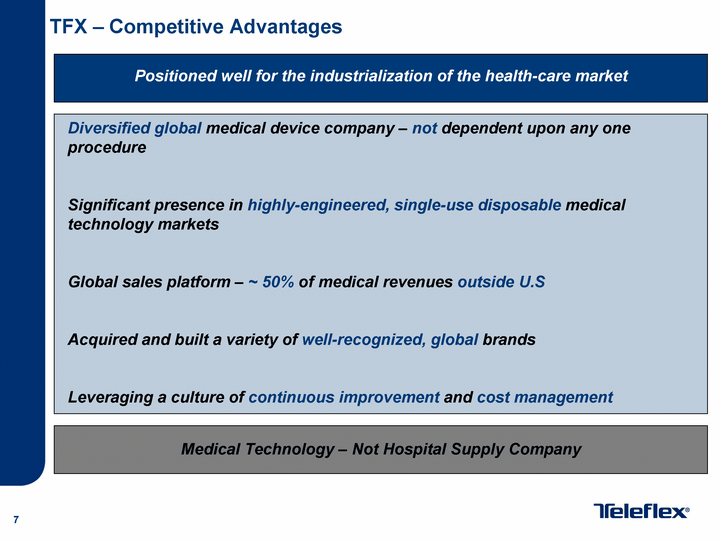
| 7 TFX - Competitive Advantages Diversified global medical device company - not dependent upon any one procedure Significant presence in highly-engineered, single-use disposable medical technology markets Global sales platform - ~ 50% of medical revenues outside U.S Acquired and built a variety of well-recognized, global brands Leveraging a culture of continuous improvement and cost management Positioned well for the industrialization of the health-care market Medical Technology - Not Hospital Supply Company |

| 8 EXECUTING FOR GROWTH |
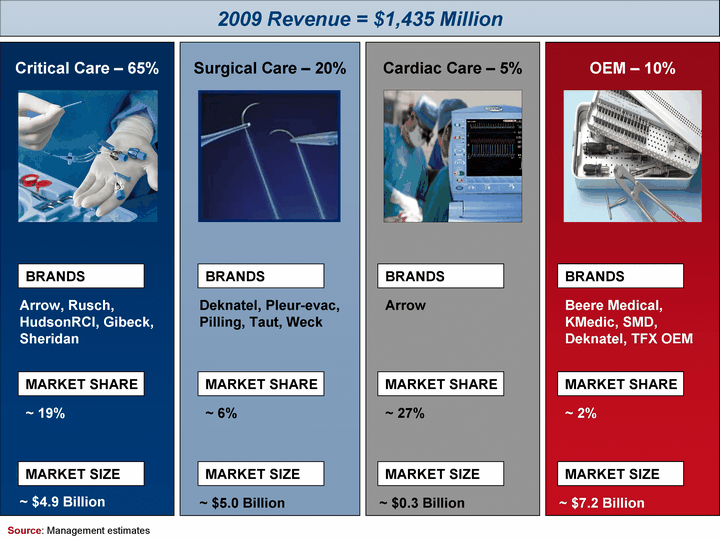
| 2009 Revenue = $1,435 Million Critical Care - 65% Surgical Care - 20% Cardiac Care - 5% OEM - 10% Arrow, Rusch, HudsonRCI, Gibeck, Sheridan ~ 19% ~ $4.9 Billion Deknatel, Pleur-evac, Pilling, Taut, Weck ~ 6% ~ $5.0 Billion Arrow ~ 27% ~ $0.3 Billion Beere Medical, KMedic, SMD, Deknatel, TFX OEM ~ 2% ~ $7.2 Billion BRANDS MARKET SHARE MARKET SIZE BRANDS MARKET SHARE MARKET SIZE BRANDS MARKET SHARE MARKET SIZE BRANDS MARKET SHARE MARKET SIZE Source: Management estimates |
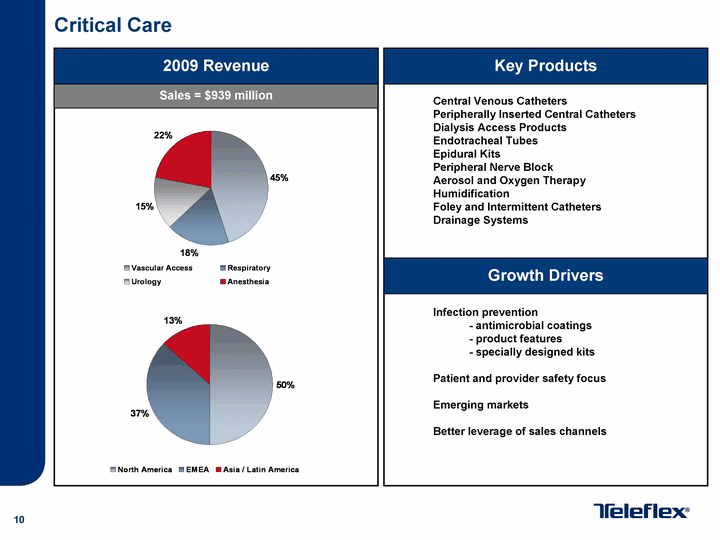
| 10 Critical Care Vascular Access Respiratory Urology Anesthesia 0.45 0.18 0.15 0.22 North America EMEA Asia / Latin America 0.5 0.37 0.13 2009 Revenue Sales = $939 million Key Products Central Venous Catheters Peripherally Inserted Central Catheters Dialysis Access Products Endotracheal Tubes Epidural Kits Peripheral Nerve Block Aerosol and Oxygen Therapy Humidification Foley and Intermittent Catheters Drainage Systems Growth Drivers Infection prevention - antimicrobial coatings - product features - specially designed kits Patient and provider safety focus Emerging markets Better leverage of sales channels |
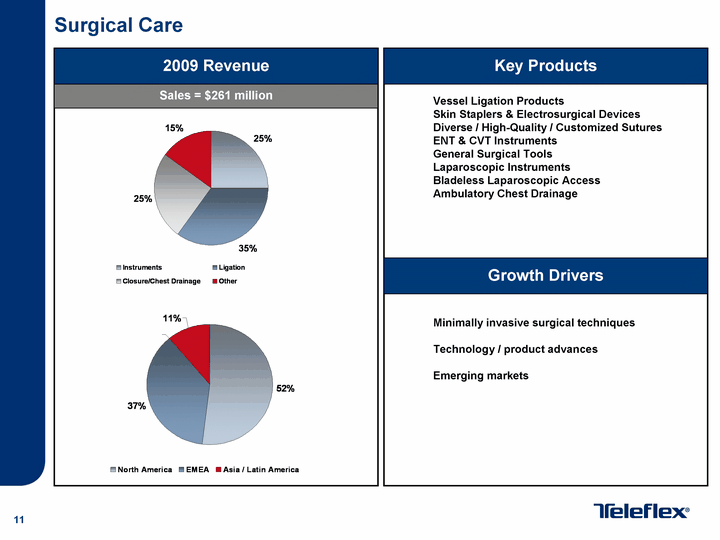
| 11 Surgical Care North America EMEA Asia / Latin America 0.52 0.37 0.11 2009 Revenue Sales = $261 million Key Products Vessel Ligation Products Skin Staplers & Electrosurgical Devices Diverse / High-Quality / Customized Sutures ENT & CVT Instruments General Surgical Tools Laparoscopic Instruments Bladeless Laparoscopic Access Ambulatory Chest Drainage Minimally invasive surgical techniques Technology / product advances Emerging markets Instruments Ligation Closure/Chest Drainage Other 0.25 0.35 0.25 0.15 Growth Drivers |
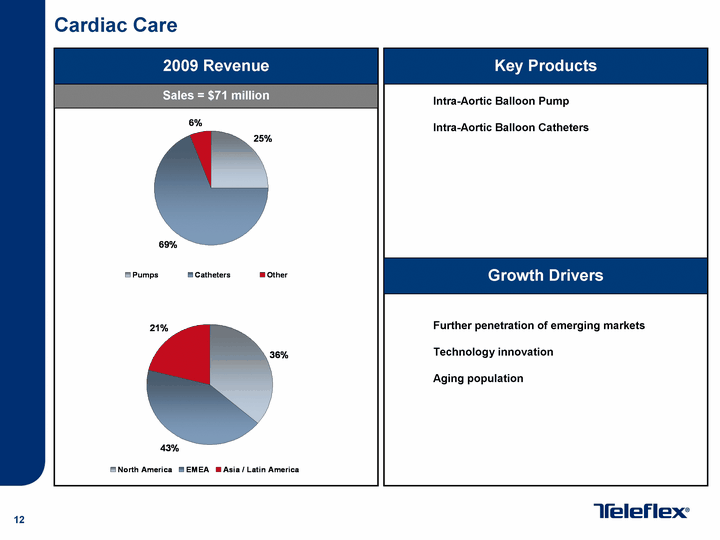
| 12 Cardiac Care North America EMEA Asia / Latin America 0.36 0.43 0.21 2009 Revenue Sales = $71 million Key Products Intra-Aortic Balloon Pump Intra-Aortic Balloon Catheters Further penetration of emerging markets Technology innovation Aging population Pumps Catheters Other 0.25 0.69 0.06 Growth Drivers |
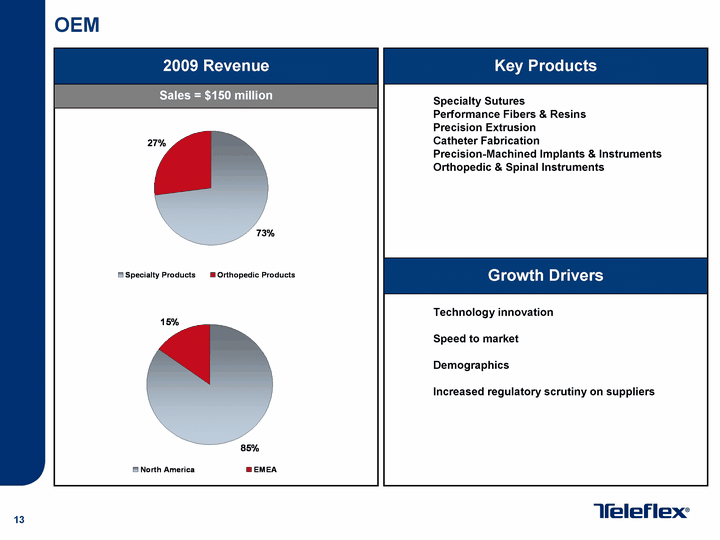
| 13 OEM 2009 Revenue Sales = $150 million Key Products Specialty Sutures Performance Fibers & Resins Precision Extrusion Catheter Fabrication Precision-Machined Implants & Instruments Orthopedic & Spinal Instruments Technology innovation Speed to market Demographics Increased regulatory scrutiny on suppliers Specialty Products Orthopedic Products 0.73 0.27 North America EMEA 0.85 0.15 Growth Drivers |

| 14 INVESTING IN GROWTH |
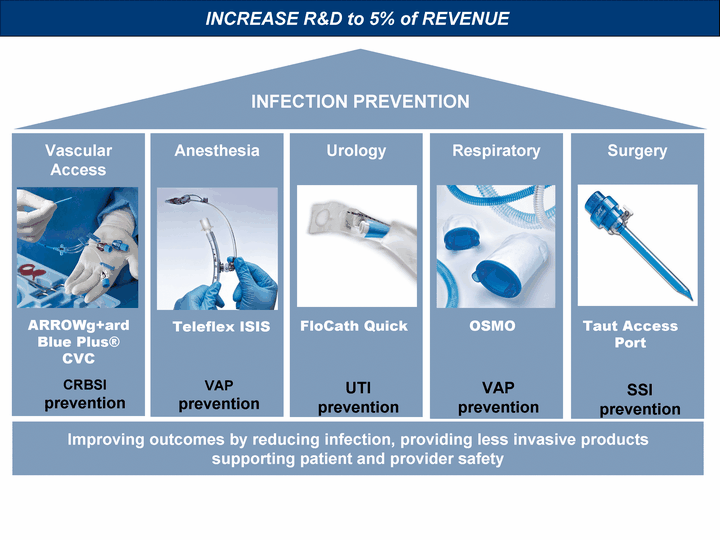
| INFECTION PREVENTION Vascular Access Anesthesia Urology Improving outcomes by reducing infection, providing less invasive products supporting patient and provider safety VAP prevention UTI prevention Surgery SSI prevention Respiratory VAP prevention ARROWg+ard Blue Plus(r) CVC Teleflex ISIS CRBSI prevention FloCath Quick OSMO Taut Access Port INCREASE R&D to 5% of REVENUE |
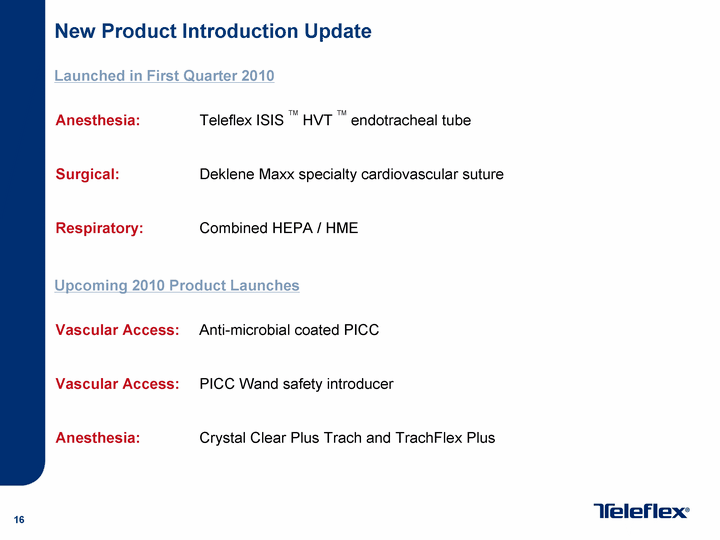
| 16 New Product Introduction Update Launched in First Quarter 2010 Anesthesia: Teleflex ISIS TM HVT TM endotracheal tube Surgical: Deklene Maxx specialty cardiovascular suture Respiratory: Combined HEPA / HME Upcoming 2010 Product Launches Vascular Access: Anti-microbial coated PICC Vascular Access: PICC Wand safety introducer Anesthesia: Crystal Clear Plus Trach and TrachFlex Plus |
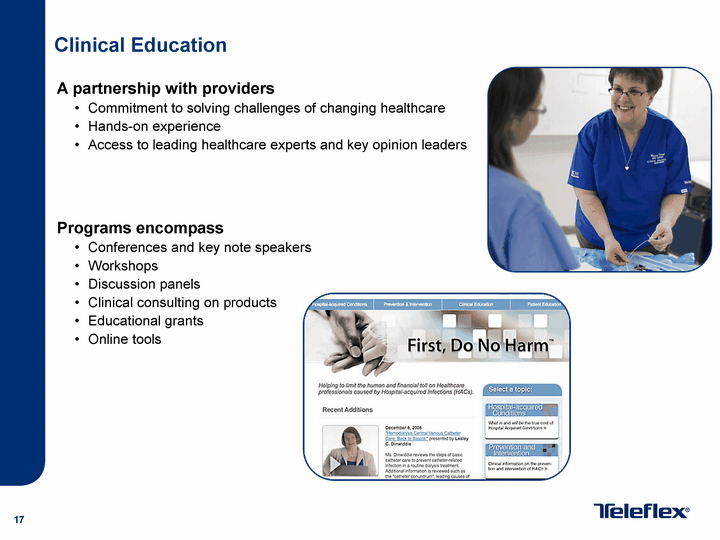
| 17 Clinical Education A partnership with providers Commitment to solving challenges of changing healthcare Hands-on experience Access to leading healthcare experts and key opinion leaders Programs encompass Conferences and key note speakers Workshops Discussion panels Clinical consulting on products Educational grants Online tools |
| 18 NON-MEDICAL SEGMENT BUSINESS REVIEW |
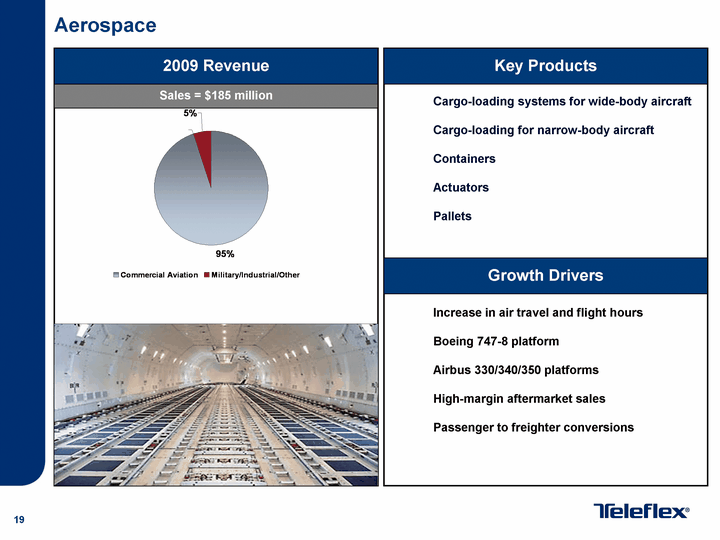
| 19 Aerospace 2009 Revenue Sales = $185 million Key Products Cargo-loading systems for wide-body aircraft Cargo-loading for narrow-body aircraft Containers Actuators Pallets Increase in air travel and flight hours Boeing 747-8 platform Airbus 330/340/350 platforms High-margin aftermarket sales Passenger to freighter conversions Commercial Aviation Military/Industrial/Other 0.95 0.05 Growth Drivers |
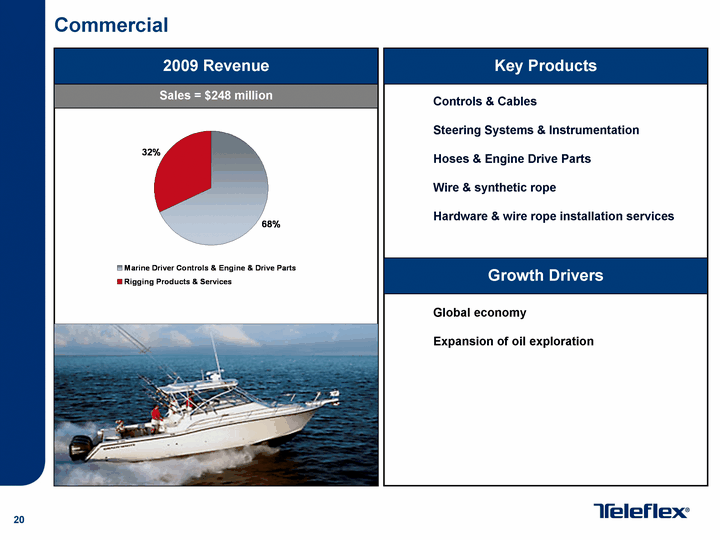
| 20 Commercial 2009 Revenue Sales = $248 million Key Products Controls & Cables Steering Systems & Instrumentation Hoses & Engine Drive Parts Wire & synthetic rope Hardware & wire rope installation services Global economy Expansion of oil exploration Marine Driver Controls & Engine & Drive Parts Rigging Products & Services 0.68 0.32 Growth Drivers |

| 21 FINANCIAL REVIEW |
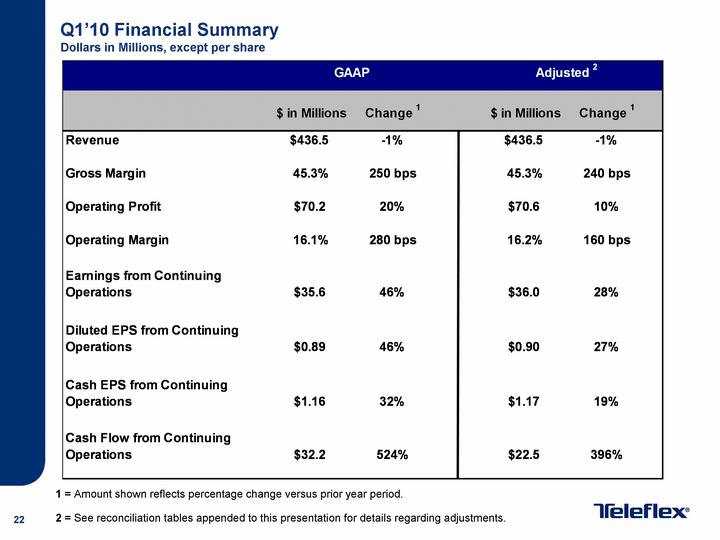
| 22 Q1'10 Financial Summary Dollars in Millions, except per share 1 = Amount shown reflects percentage change versus prior year period. 2 = See reconciliation tables appended to this presentation for details regarding adjustments. |
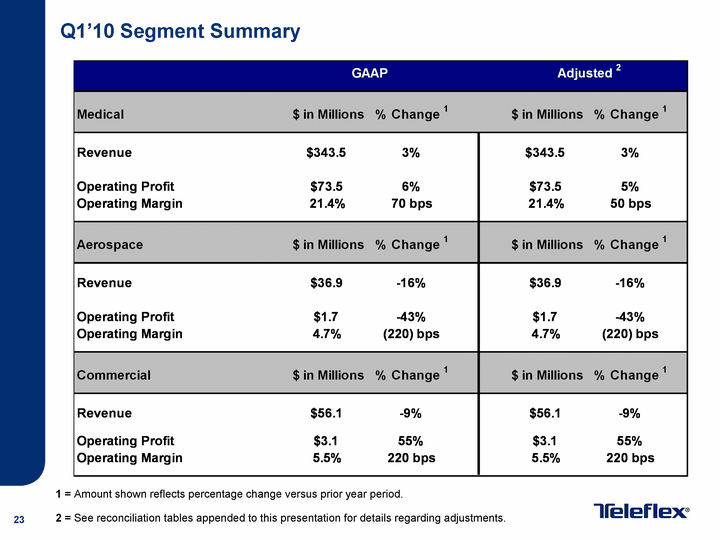
| 23 Q1'10 Segment Summary 1 = Amount shown reflects percentage change versus prior year period. 2 = See reconciliation tables appended to this presentation for details regarding adjustments. |

| 24 2010 Financial Outlook Dollars in Millions, except per share 1 = Amount shown reflects percentage change versus prior year period. 2 = See reconciliation tables appended to this presentation for details regarding adjustments. |

| 25 STRATEGIC OBJECTIVES / BUSINESS DEVELOPMENT |
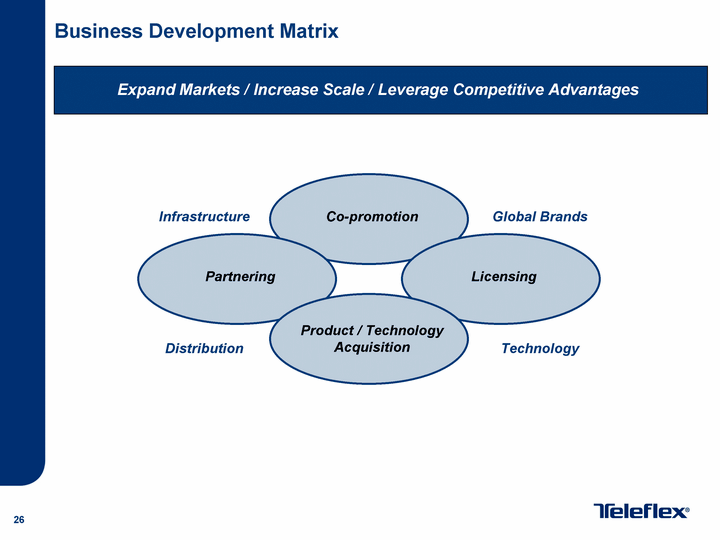
| 26 Business Development Matrix Expand Markets / Increase Scale / Leverage Competitive Advantages Co-promotion Product / Technology Acquisition Licensing Partnering Infrastructure Global Brands Distribution Technology |
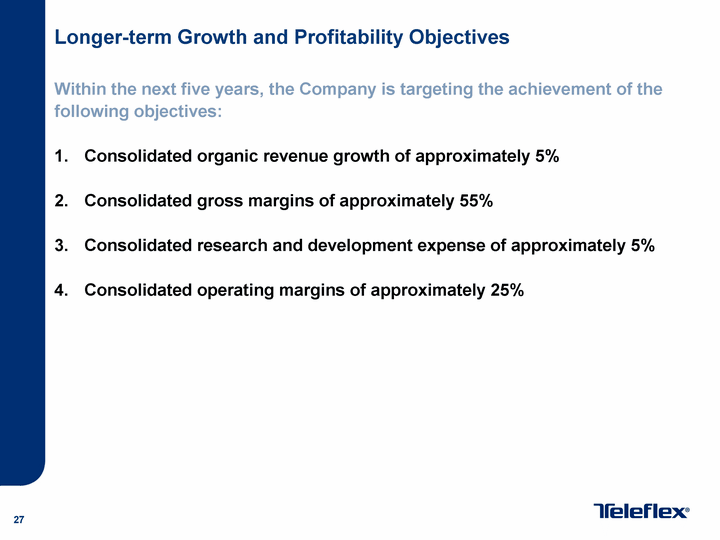
| 27 Longer-term Growth and Profitability Objectives Within the next five years, the Company is targeting the achievement of the following objectives: Consolidated organic revenue growth of approximately 5% Consolidated gross margins of approximately 55% Consolidated research and development expense of approximately 5% Consolidated operating margins of approximately 25% |
| 28 INVESTMENT OPPORTUNITY |
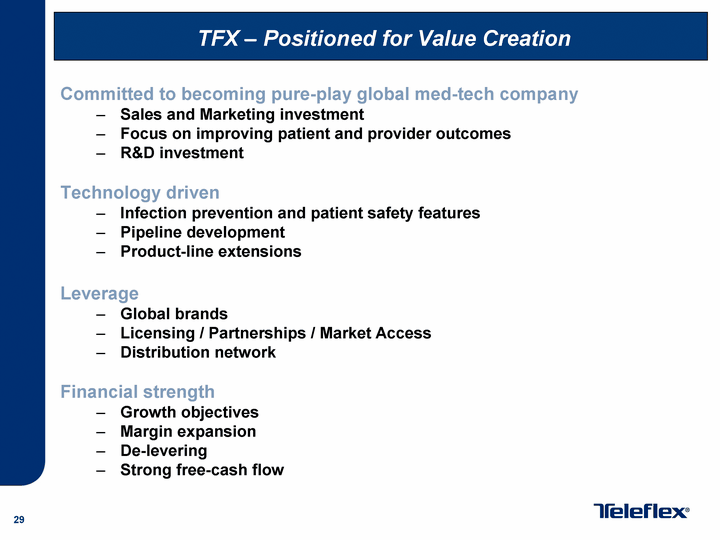
| 29 Committed to becoming pure-play global med-tech company Sales and Marketing investment Focus on improving patient and provider outcomes R&D investment Technology driven Infection prevention and patient safety features Pipeline development Product-line extensions Leverage Global brands Licensing / Partnerships / Market Access Distribution network Financial strength Growth objectives Margin expansion De-levering Strong free-cash flow TFX - Positioned for Value Creation |

| 30 |
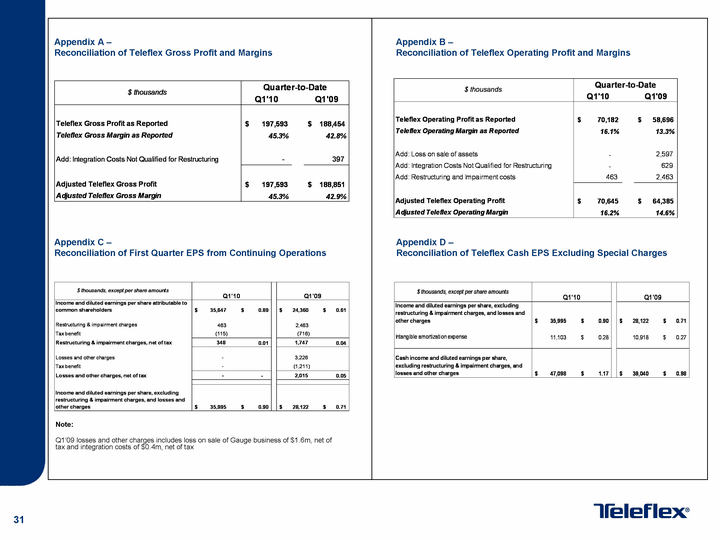
| 31 Appendix A - Reconciliation of Teleflex Gross Profit and Margins Appendix B - Reconciliation of Teleflex Operating Profit and Margins Appendix C - Reconciliation of First Quarter EPS from Continuing Operations Note: Q1'09 losses and other charges includes loss on sale of Gauge business of $1.6m, net of tax and integration costs of $0.4m, net of tax Appendix D - Reconciliation of Teleflex Cash EPS Excluding Special Charges |
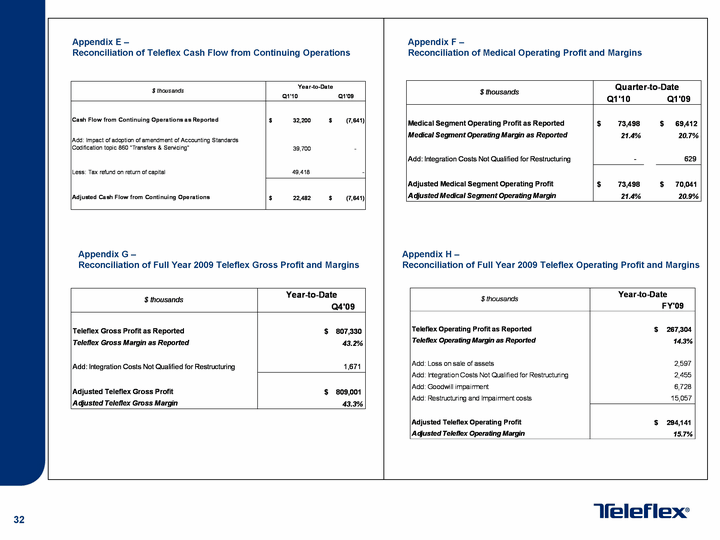
| 32 Appendix E - Reconciliation of Teleflex Cash Flow from Continuing Operations Appendix F - Reconciliation of Medical Operating Profit and Margins Appendix G - Reconciliation of Full Year 2009 Teleflex Gross Profit and Margins Appendix H - Reconciliation of Full Year 2009 Teleflex Operating Profit and Margins |
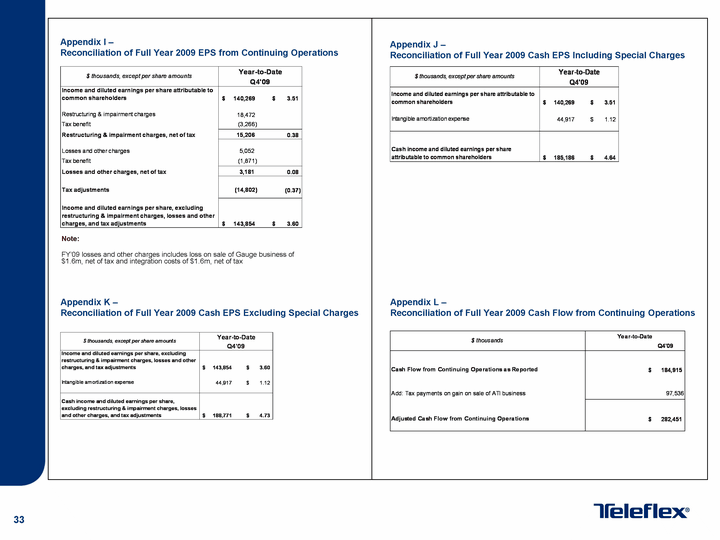
| 33 Appendix I - Reconciliation of Full Year 2009 EPS from Continuing Operations Note: FY'09 losses and other charges includes loss on sale of Gauge business of $1.6m, net of tax and integration costs of $1.6m, net of tax Appendix J - Reconciliation of Full Year 2009 Cash EPS Including Special Charges Appendix K - Reconciliation of Full Year 2009 Cash EPS Excluding Special Charges Appendix L - Reconciliation of Full Year 2009 Cash Flow from Continuing Operations |
