Attached files
| file | filename |
|---|---|
| 8-K - 8-K - KAPSTONE PAPER & PACKAGING CORP | a10-5938_28k.htm |
| EX-99.1 - EX-99.1 - KAPSTONE PAPER & PACKAGING CORP | a10-5938_2ex99d1.htm |
Exhibit 99.2
|
|
First Quarter 2010 Review May 5, 2010 |
|
|
2 Forward Looking Statements The information in this presentation and statements made during this presentation may contain certain forward-looking statements within the meaning of federal securities laws. These statements reflect management’s expectations regarding future events and operating performance. These forward-looking statements involve a number of risks and uncertainties. A list of the factors that could cause actual results to differ materially from those expressed in, or underlying, any forward-looking statements can be found in the Company’s filings with the Securities and Exchange Commission, such as its annual and quarterly reports. The Company disclaims any obligation to revise or update such statements to reflect the occurrence of events after the date of this presentation. |
|
|
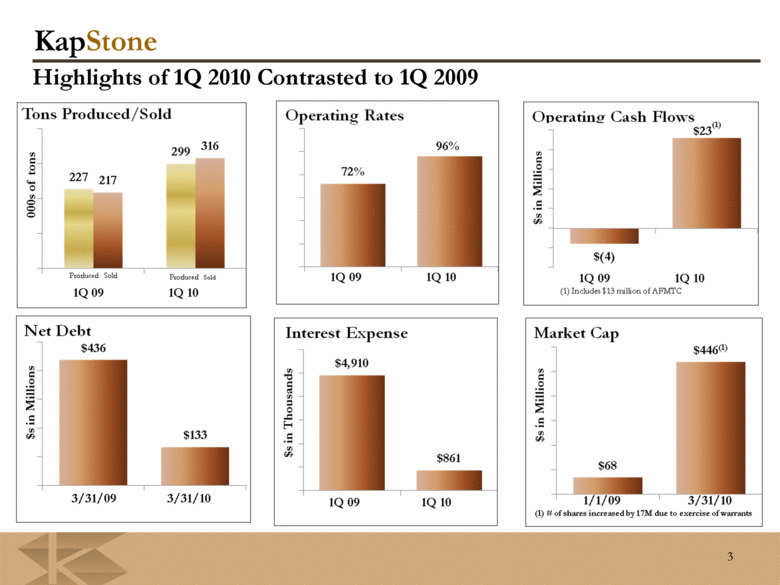
3 Highlights of 1Q 2010 Contrasted to 1Q 2009 |
|
|
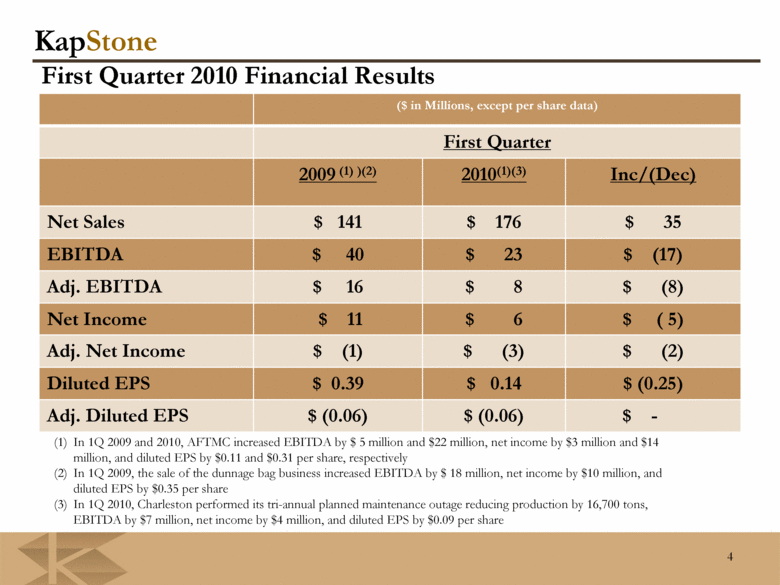
($ in Millions, except per share data) First Quarter 2009 (1) )(2) 2010(1)(3) Inc/(Dec) Net Sales $ 141 $ 176 $ 35 EBITDA $ 40 $ 23 $ (17) Adj. EBITDA $ 16 $ 8 $ (8) Net Income $ 11 $ 6 $ ( 5) Adj. Net Income $ (1) $ (3) $ (2) Diluted EPS $ 0.39 $ 0.14 $ (0.25) Adj. Diluted EPS $ (0.06) $ (0.06) $ - 4 First Quarter 2010 Financial Results In 1Q 2009 and 2010, AFTMC increased EBITDA by $ 5 million and $22 million, net income by $3 million and $14 million, and diluted EPS by $0.11 and $0.31 per share, respectively In 1Q 2009, the sale of the dunnage bag business increased EBITDA by $ 18 million, net income by $10 million, and diluted EPS by $0.35 per share In 1Q 2010, Charleston performed its tri-annual planned maintenance outage reducing production by 16,700 tons, EBITDA by $7 million, net income by $4 million, and diluted EPS by $0.09 per share |
|
|
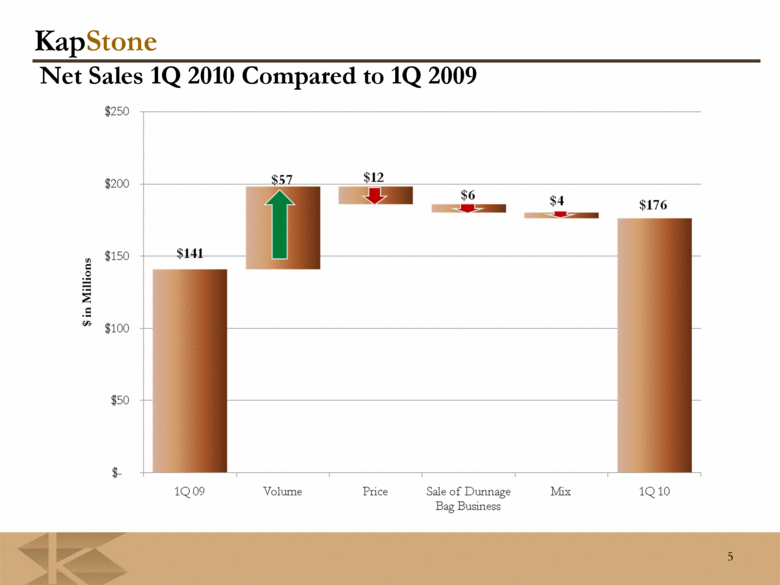
5 Net Sales 1Q 2010 Compared to 1Q 2009 |
|
|
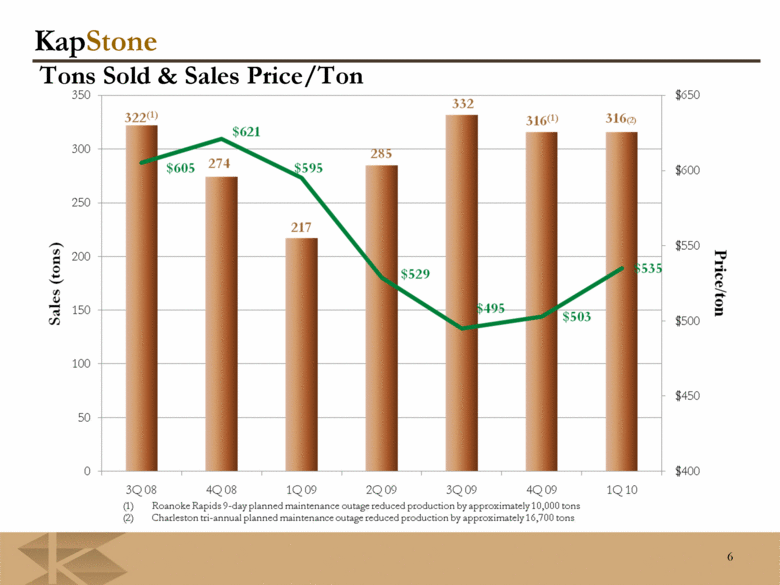
6 Tons Sold & Sales Price/Ton (1) Roanoke Rapids 9-day planned maintenance outage reduced production by approximately 10,000 tons (2) Charleston tri-annual planned maintenance outage reduced production by approximately 16,700 tons |
|
|
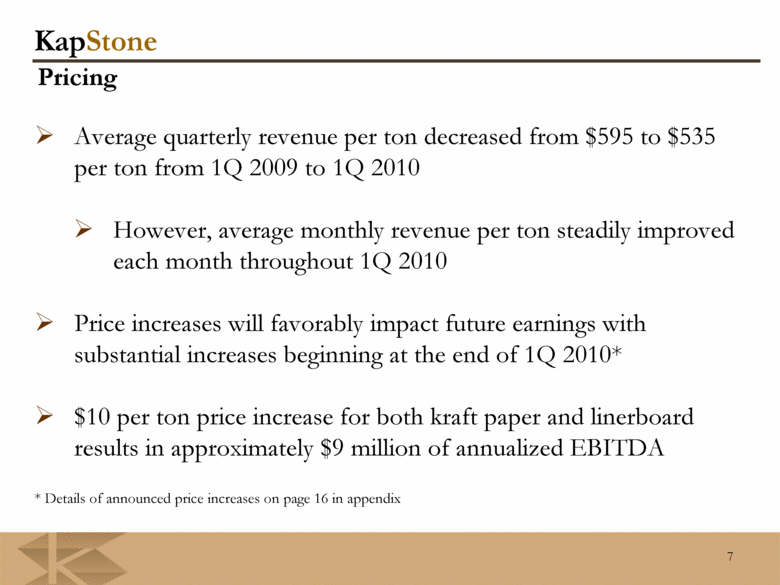
7 Pricing Average quarterly revenue per ton decreased from $595 to $535 per ton from 1Q 2009 to 1Q 2010 However, average monthly revenue per ton steadily improved each month throughout 1Q 2010 Price increases will favorably impact future earnings with substantial increases beginning at the end of 1Q 2010* $10 per ton price increase for both kraft paper and linerboard results in approximately $9 million of annualized EBITDA * Details of announced price increases on page 16 in appendix |
|
|
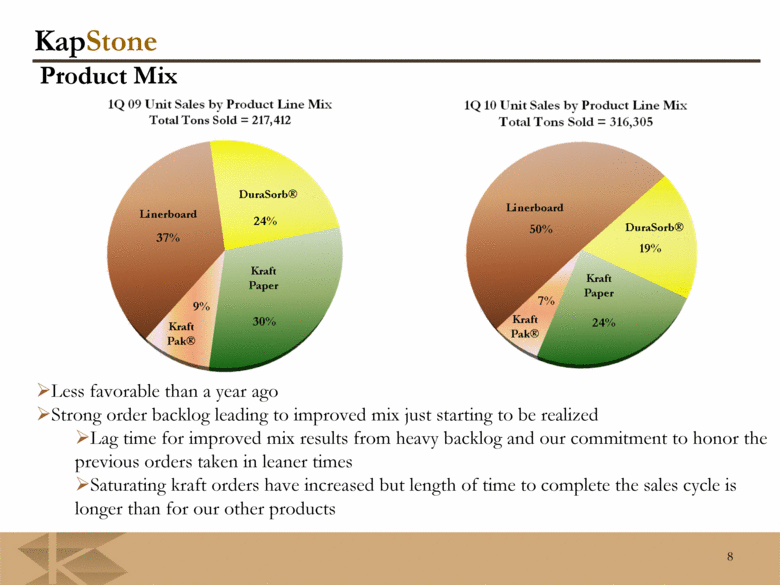
8 Product Mix Less favorable than a year ago Strong order backlog leading to improved mix just starting to be realized Lag time for improved mix results from heavy backlog and our commitment to honor the previous orders taken in leaner times Saturating kraft orders have increased but length of time to complete the sales cycle is longer than for our other products |
|
|
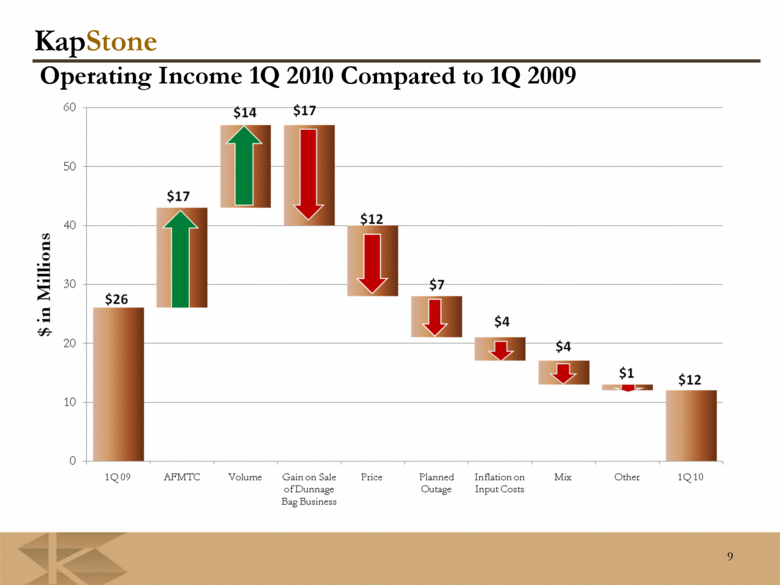
9 Operating Income 1Q 2010 Compared to 1Q 2009 |
|
|
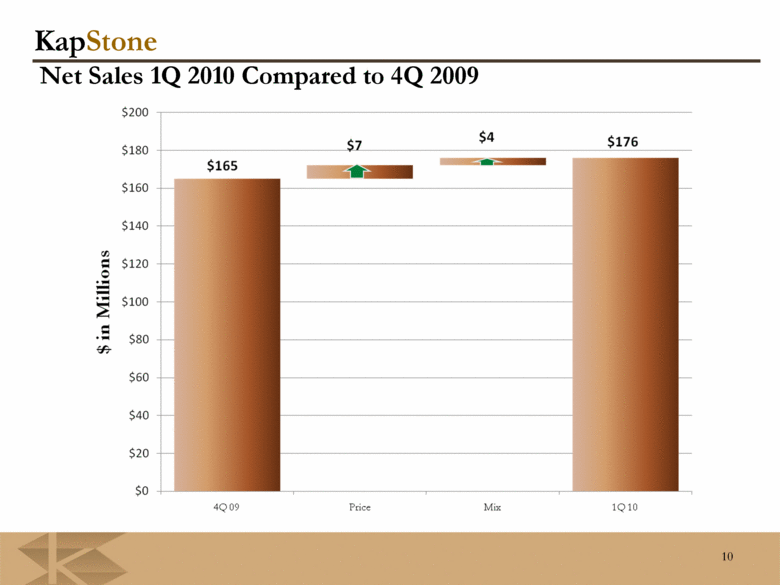
10 Net Sales 1Q 2010 Compared to 4Q 2009 |
|
|
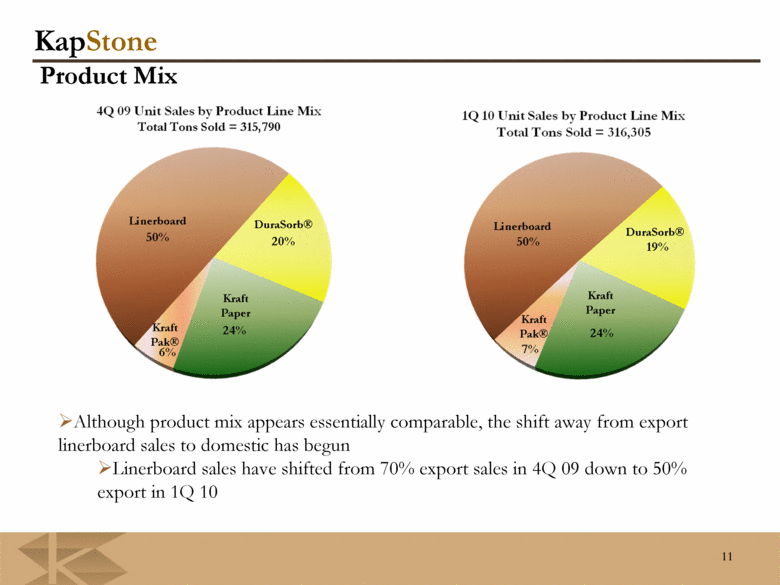
11 Product Mix Although product mix appears essentially comparable, the shift away from export linerboard sales to domestic has begun Linerboard sales have shifted from 70% export sales in 4Q 09 down to 50% export in 1Q 10 |
|
|
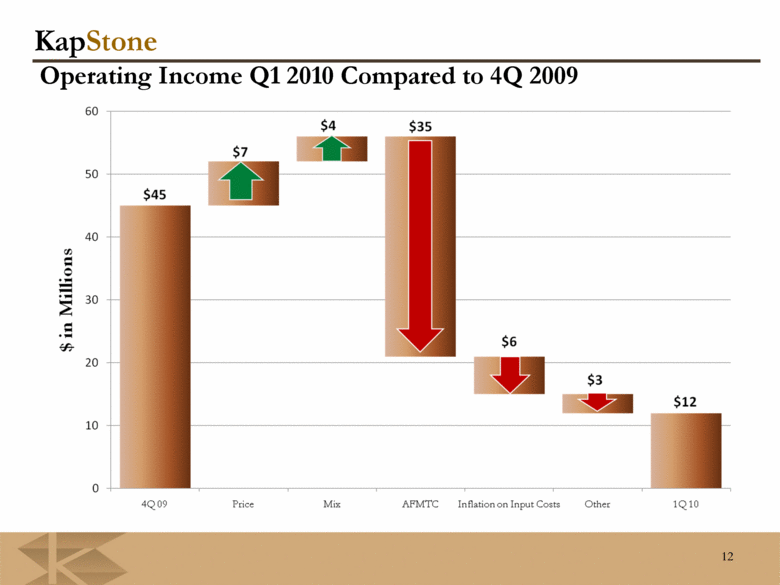
12 Operating Income Q1 2010 Compared to 4Q 2009 |
|
|
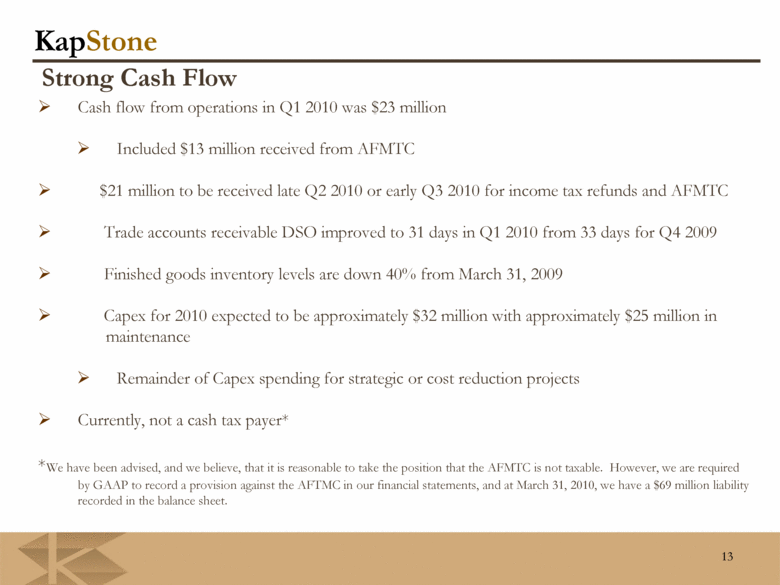
13 Cash flow from operations in Q1 2010 was $23 million Included $13 million received from AFMTC $21 million to be received late Q2 2010 or early Q3 2010 for income tax refunds and AFMTC Trade accounts receivable DSO improved to 31 days in Q1 2010 from 33 days for Q4 2009 Finished goods inventory levels are down 40% from March 31, 2009 Capex for 2010 expected to be approximately $32 million with approximately $25 million in maintenance Remainder of Capex spending for strategic or cost reduction projects Currently, not a cash tax payer* *We have been advised, and we believe, that it is reasonable to take the position that the AFMTC is not taxable. However, we are required by GAAP to record a provision against the AFTMC in our financial statements, and at March 31, 2010, we have a $69 million liability recorded in the balance sheet. Strong Cash Flow |
|
|
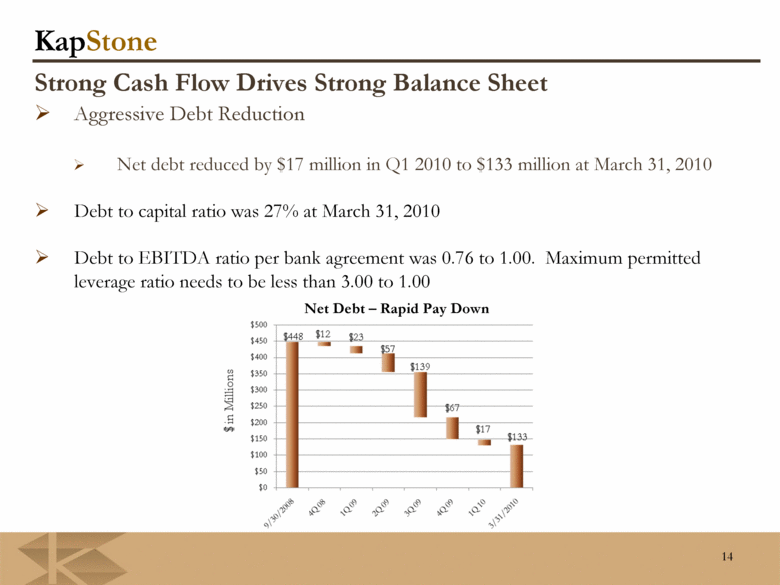
14 Aggressive Debt Reduction Net debt reduced by $17 million in Q1 2010 to $133 million at March 31, 2010 Debt to capital ratio was 27% at March 31, 2010 Debt to EBITDA ratio per bank agreement was 0.76 to 1.00. Maximum permitted leverage ratio needs to be less than 3.00 to 1.00 Strong Cash Flow Drives Strong Balance Sheet Net Debt – Rapid Pay Down |
|
|
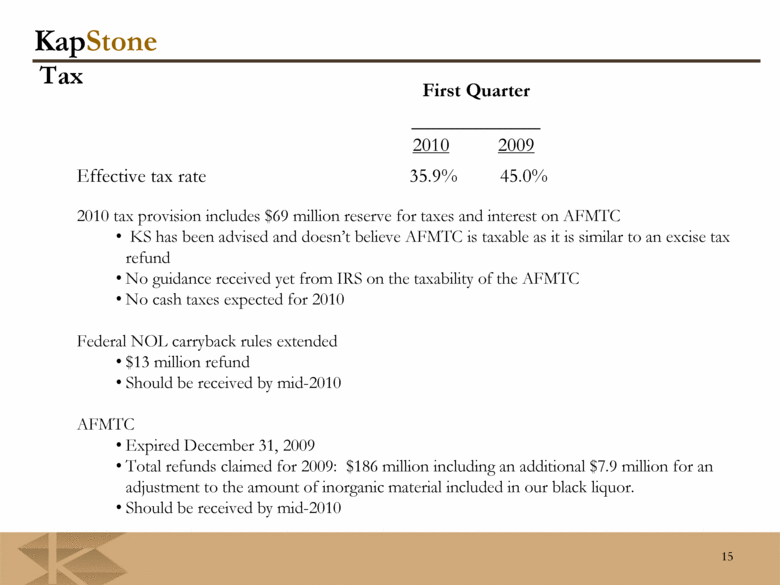
First Quarter 2010 2009 Effective tax rate 35.9% 45.0% 2010 tax provision includes $69 million reserve for taxes and interest on AFMTC KS has been advised and doesn’t believe AFMTC is taxable as it is similar to an excise tax refund No guidance received yet from IRS on the taxability of the AFMTC No cash taxes expected for 2010 Federal NOL carryback rules extended $13 million refund Should be received by mid-2010 AFMTC Expired December 31, 2009 Total refunds claimed for 2009: $186 million including an additional $7.9 million for an adjustment to the amount of inorganic material included in our black liquor. Should be received by mid-2010 15 Tax |
|
|
Appendix |
|
|
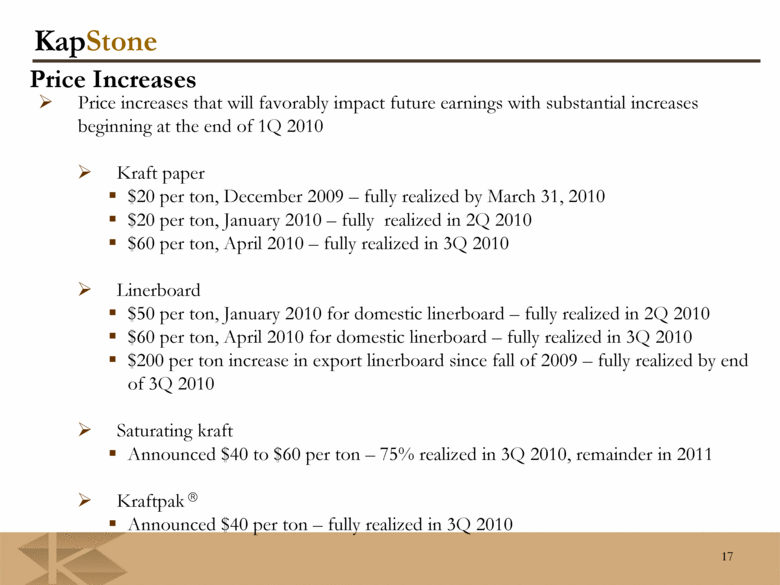
17 Price Increases Price increases that will favorably impact future earnings with substantial increases beginning at the end of 1Q 2010 Kraft paper $20 per ton, December 2009 – fully realized by March 31, 2010 $20 per ton, January 2010 – fully realized in 2Q 2010 $60 per ton, April 2010 – fully realized in 3Q 2010 Linerboard $50 per ton, January 2010 for domestic linerboard – fully realized in 2Q 2010 $60 per ton, April 2010 for domestic linerboard – fully realized in 3Q 2010 $200 per ton increase in export linerboard since fall of 2009 – fully realized by end of 3Q 2010 Saturating kraft Announced $40 to $60 per ton – 75% realized in 3Q 2010, remainder in 2011 Kraftpak â Announced $40 per ton – fully realized in 3Q 2010 |
|
|
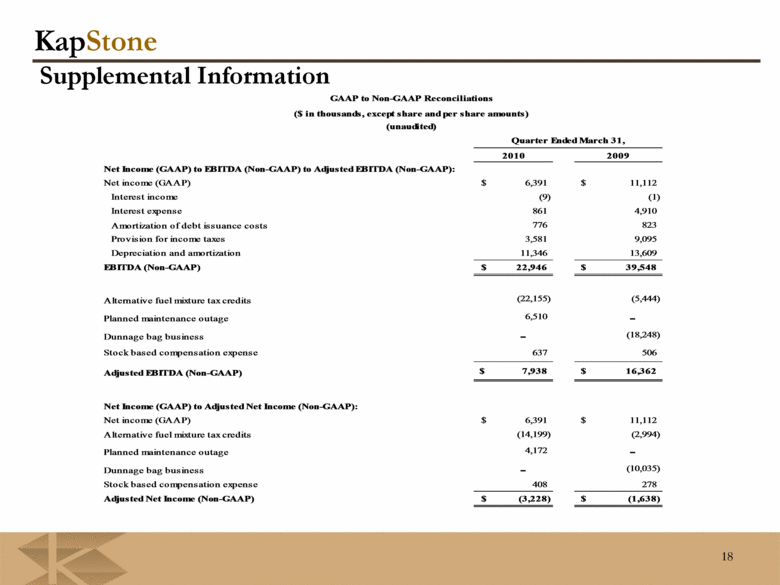
18 Supplemental Information 2010 2009 Net Income (GAAP) to EBITDA (Non-GAAP) to Adjusted EBITDA (Non-GAAP): Net income (GAAP) 6,391 $ 11,112 $ Interest income (9) (1) Interest expense 861 4,910 Amortization of debt issuance costs 776 823 Provision for income taxes 3,581 9,095 Depreciation and amortization 11,346 13,609 EBITDA (Non-GAAP) 22,946 $ 39,548 $ Alternative fuel mixture tax credits (22,155) (5,444) Planned maintenance outage 6,510 - Dunnage bag business - (18,248) Stock based compensation expense 637 506 Adjusted EBITDA (Non-GAAP) 7,938 $ 16,362 $ Net Income (GAAP) to Adjusted Net Income (Non-GAAP): Net income (GAAP) 6,391 $ 11,112 $ Alternative fuel mixture tax credits (14,199) (2,994) Planned maintenance outage 4,172 - Dunnage bag business - (10,035) Stock based compensation expense 408 278 Adjusted Net Income (Non-GAAP) (3,228) $ (1,638) $ (unaudited) Quarter Ended March 31, KapStone Paper and Packaging Corporation Supplemental Information GAAP to Non-GAAP Reconciliations ($ in thousands, except share and per share amounts) |
|
|
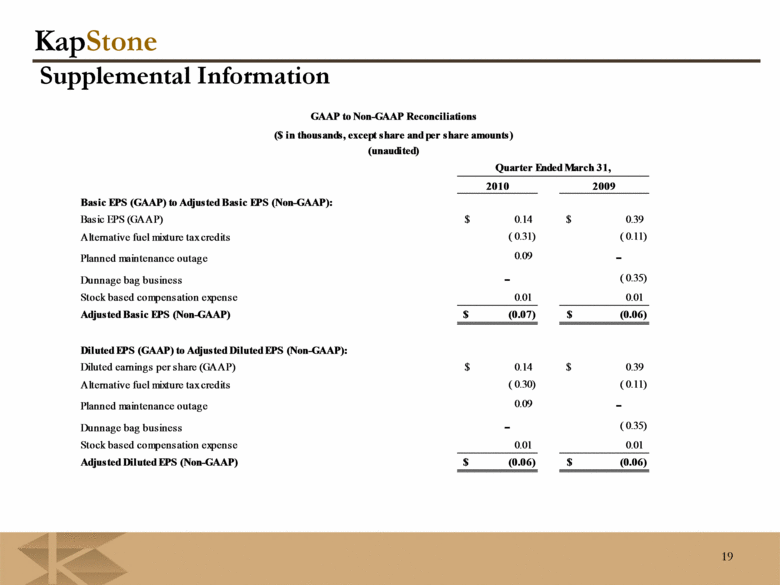
19 Supplemental Information 2010 2009 Basic EPS (GAAP) to Adjusted Basic EPS (Non-GAAP): Basic EPS (GAAP) 0.14 $ 0.39 $ Alternative fuel mixture tax credits ( 0.31) ( 0.11) Planned maintenance outage 0.09 - Dunnage bag business - ( 0.35) Stock based compensation expense 0.01 0.01 Adjusted Basic EPS (Non-GAAP) (0.07) $ (0.06) $ Diluted EPS (GAAP) to Adjusted Diluted EPS (Non-GAAP): Diluted earnings per share (GAAP) 0.14 $ 0.39 $ Alternative fuel mixture tax credits ( 0.30) ( 0.11) Planned maintenance outage 0.09 - Dunnage bag business - ( 0.35) Stock based compensation expense 0.01 0.01 Adjusted Diluted EPS (Non-GAAP) (0.06) $ (0.06) $ (unaudited) Quarter Ended March 31, GAAP to Non-GAAP Reconciliations ($ in thousands, except share and per share amounts) |

