Attached files
| file | filename |
|---|---|
| 8-K - FORM 8-K - MEDCO HEALTH SOLUTIONS INC | c00092e8vk.htm |
Exhibit 99.1

| 1 1 It's what we do. It's who we are. It's in our DNA. Deutsche Bank 35th Annual Healthcare Conference Timothy C. Wentworth Group President, Employer Accounts |
| 2 Forward-Looking Statements This presentation contains "forward-looking statements" as that term is defined in the Private Securities Litigation Reform Act of 1995. These statements involve risks and uncertainties that may cause results to differ materially from those set forth in the statements. No forward-looking statement can be guaranteed, and actual results may differ materially from those projected. We undertake no obligation to publicly update any forward-looking statement, whether as a result of new information, future events or otherwise. The forward-looking statements are not historical facts, but rather are based on current expectations, estimates, assumptions and projections about the business and future financial results of the pharmacy benefit management ("PBM") and specialty pharmacy industries, and other legal, regulatory and economic developments. We use words such as "anticipates," "believes," "plans," "expects," "projects," "future," "intends," "may," "will," "should," "could," "estimates," "predicts," "potential," "continue," "guidance" and similar expressions to identify these forward-looking statements. Medco's actual results could differ materially from the results contemplated by these forward-looking statements due to a number of factors. Forward-looking statements in this presentation should be evaluated together with the risks and uncertainties that affect our business, particularly those mentioned in the Risk Factors section of the Company's Annual Report on Form 10-K, Quarterly Reports on Form 10-Q and other documents filed from time to time with the Securities and Exchange Commission. |

| 3 Who is Medco Largest PBM Measured by Drug Spend 2009 revenues of $59.8 billion Serving ~65 million members Leader in Clinical Innovation Only provider with specialized pharmacists & personalized pharmacy services in practice today Medco Therapeutic Resource Centers(r) Personalized medicine programs Leading Specialty Pharmacy Largest Mail-Order Pharmacies in the World GAAP EPS CAGR of over 22% (2003 - 2009) |

| 4 2003 2004 2005 2006* 2007 2008 2009 2010E GAAP EPS 0.79 0.88 1.03 1.21 1.63 2.13 2.61 3.1 Medco is Driving Value to Shareholders Through Continued GAAP EPS Growth * Excludes first-quarter 2006 legal settlements charge; see reconciliation to GAAP financial measures in appendix. GAAP EPS CAGR 21.3% - 21.8% 22.5% 17%-21% MHS stock price has appreciated over 400% from spin-off through year-end 2009 |

| 5 The Case for Smarter Medicine: Getting Granular Poor Management of Chronic and Complex Diseases Can Lead to $350 Billion of Excess Total Healthcare Costs3 1. Medco Research 2. Center for Disease Control 3. Medco estimate 50% of US Population1 96% of drug costs in the US1 75% of medical expenses in the US2 For 88% of chronic and complex diseases, drugs are a first choice for medical intervention1 Chronic & Complex Diseases Represent: Non-compliance: up to 50% non-compliance rates after one year of therapy are not uncommon in many of the key disease categories Omissions in care: 33% of patients experienced an omission in therapy gap1 Instability of a Chronic or Complex Patient is Most Often Tied to Gaps-in-Care |
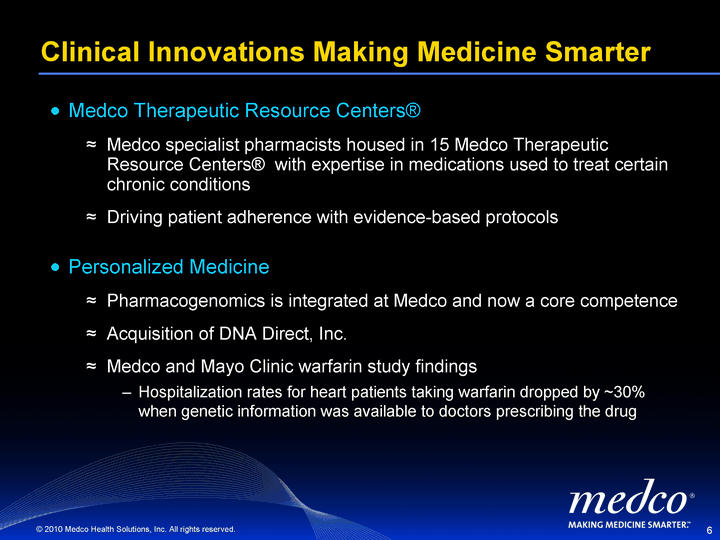
| 6 Clinical Innovations Making Medicine Smarter Medco Therapeutic Resource Centers(r) Medco specialist pharmacists housed in 15 Medco Therapeutic Resource Centers(r) with expertise in medications used to treat certain chronic conditions Driving patient adherence with evidence-based protocols Personalized Medicine Pharmacogenomics is integrated at Medco and now a core competence Acquisition of DNA Direct, Inc. Medco and Mayo Clinic warfarin study findings Hospitalization rates for heart patients taking warfarin dropped by ~30% when genetic information was available to doctors prescribing the drug |
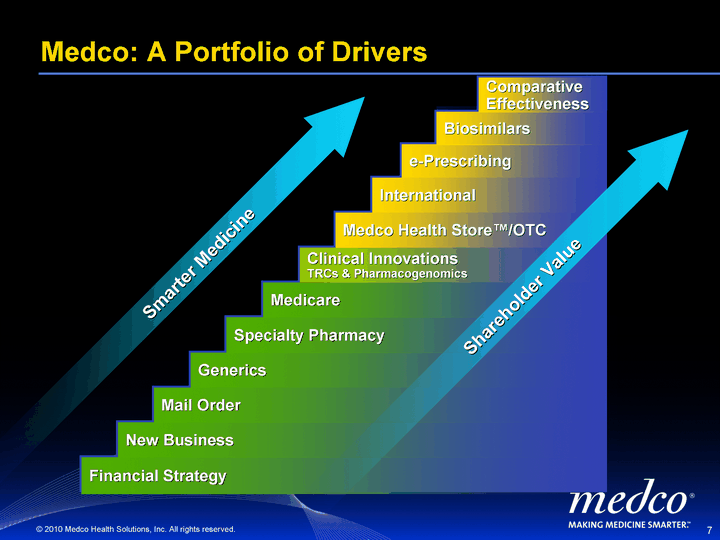
| 7 Financial Strategy New Business Mail Order Generics Specialty Pharmacy Medicare Clinical Innovations TRCs & Pharmacogenomics Medco Health Store(tm)/OTC International e-Prescribing Biosimilars Medco: A Portfolio of Drivers Shareholder Value Smarter Medicine Comparative Effectiveness |
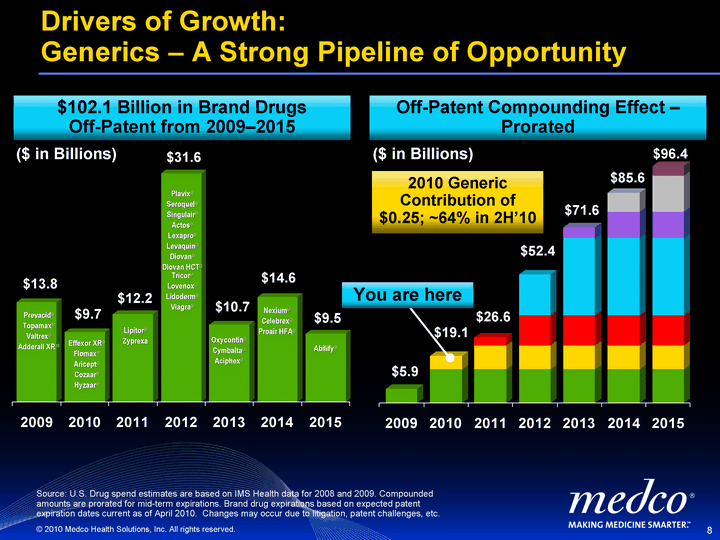
| 8 2009 2010 2011 2012 2013 2014 2015 Acute Chronic/Complex 13.8 9.7 12.2 31.6 10.7 14.6 9.5 Drivers of Growth: Generics - A Strong Pipeline of Opportunity Prevacid(r) Topamax(r) Valtrex(r) Adderall XR (r) Effexor XR(r) Flomax(r) Aricept(r) Cozaar(r) Hyzaar(r) Lipitor(r) Zyprexa Plavix(r) Seroquel(r) Singulair(r) Actos(r) Lexapro(r) Levaquin(r) Diovan(r) Diovan HCT(r) Tricor(r) Lovenox(r) Lidoderm(r) Viagra(r) $13.8 $9.7 $12.2 $31.6 $10.7 $14.6 $9.5 Oxycontin(r) Cymbalta(r) Aciphex(r) Nexium(r) Celebrex(r) Proair HFA(r) Abilify(r) 2009 2010 2011 2012 2013 2014 2015 5.9 13.8 13.8 13.8 13.8 13.8 13.8 5.4 9.7 9.7 9.7 9.7 9.7 3.2 12.2 12.2 12.2 12.2 16.7 31.6 31.6 31.6 4.4 10.7 10.7 7.7 14.6 4 $5.9 $19.1 $26.6 $52.4 $71.6 $85.6 $96.4 Source: U.S. Drug spend estimates are based on IMS Health data for 2008 and 2009. Compounded amounts are prorated for mid-term expirations. Brand drug expirations based on expected patent expiration dates current as of April 2010. Changes may occur due to litigation, patent challenges, etc. $102.1 Billion in Brand Drugs Off-Patent from 2009-2015 Off-Patent Compounding Effect - Prorated 2010 Generic Contribution of $0.25; ~64% in 2H'10 ($ in Billions) ($ in Billions) You are here |
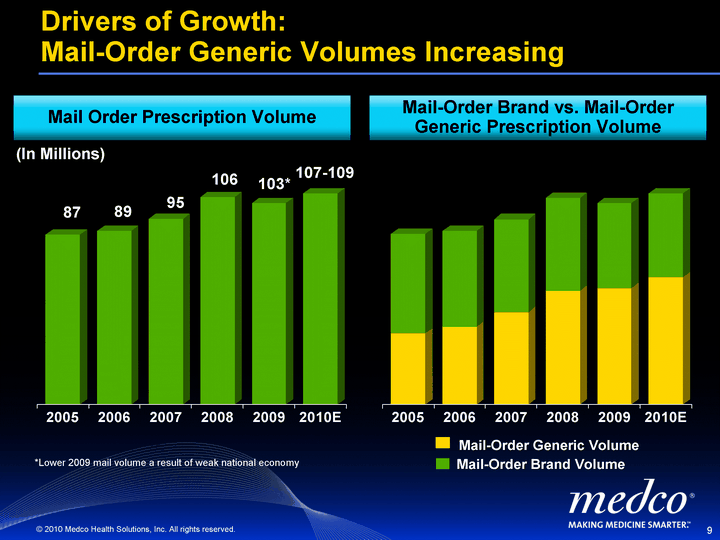
| 9 2005 2006 2007 2008 2009 2010E Mail-Order Generic 36.4 39.9 47.4 58.2 59.6 65 Mail-Order Brand 50.9 49.1 47.4 47.6 43.5 43 Drivers of Growth: Mail-Order Generic Volumes Increasing 2005 2006 2007 2008 2009 2010E New Business 4 4.7 2.9 Mail-Order Volume 87 89 95 106 103.1 108 Mail-Order Generic Volume Mail-Order Brand Volume Mail Order Prescription Volume Mail-Order Brand vs. Mail-Order Generic Prescription Volume (In Millions) *Lower 2009 mail volume a result of weak national economy |
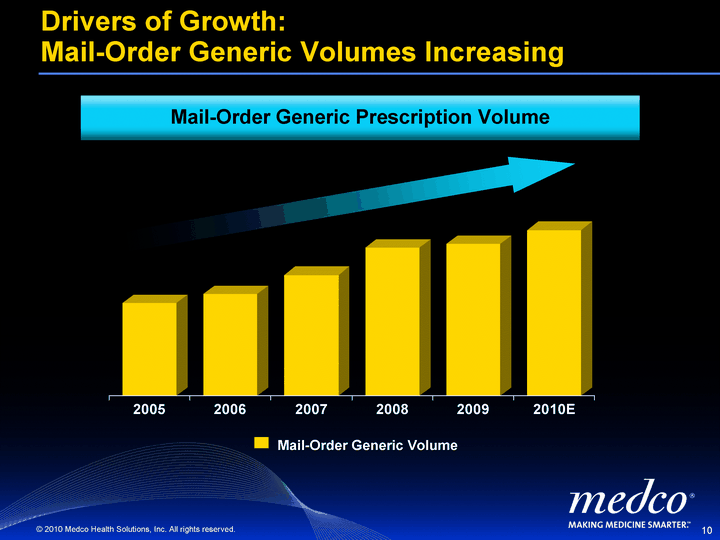
| 10 2005 2006 2007 2008 2009 2010E Mail-Order Generic 36.4 39.9 47.4 58.2 59.6 65 Mail-Order Brand 50.9 49.1 47.4 47.6 43.5 43 Drivers of Growth: Mail-Order Generic Volumes Increasing Mail-Order Generic Volume Mail-Order Generic Prescription Volume |
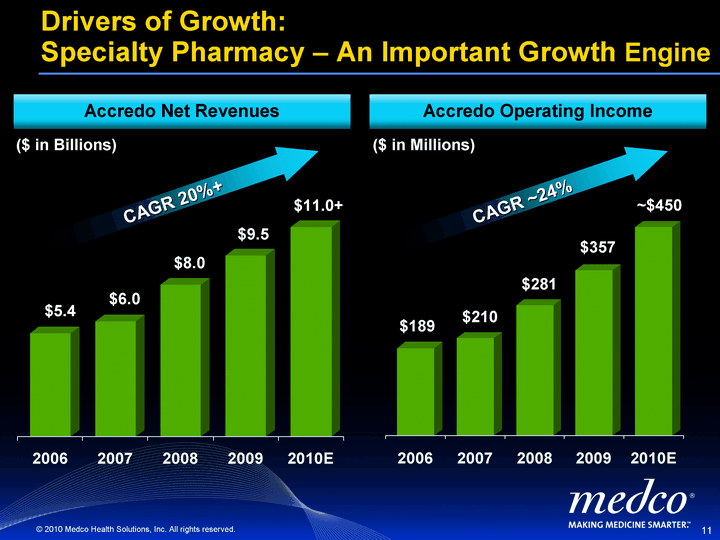
| 11 2006 2007 2008 2009 2010E Acute Chronic/Complex 5437 6043 7974.2 9527.5 11000 Drivers of Growth: Specialty Pharmacy - An Important Growth Engine $5.4 $9.5 $8.0 $6.0 2006 2007 2008 2009 2010E 189 210 281.2 357.1 450 $189 $281 $357 $210 $11.0+ ~$450 Accredo Net Revenues Accredo Operating Income CAGR ~24% CAGR 20%+ ($ in Billions) ($ in Millions) |

| 12 Drivers of Growth: Medicare - Growth and Diversification Retiree Distribution by Medicare Solution (Lives %) RDS PDP Part D Federal Other 2.12 0.33 0.86 0.23 3.23 2007 RDS PDP Part D Federal Other 1.89 0.59 5.27 1.49 3.1 2009 Retiree Drug Subsidy Federal Clients Part D - PBM Inside - "ASO" Medco PDP - "At risk" Other |
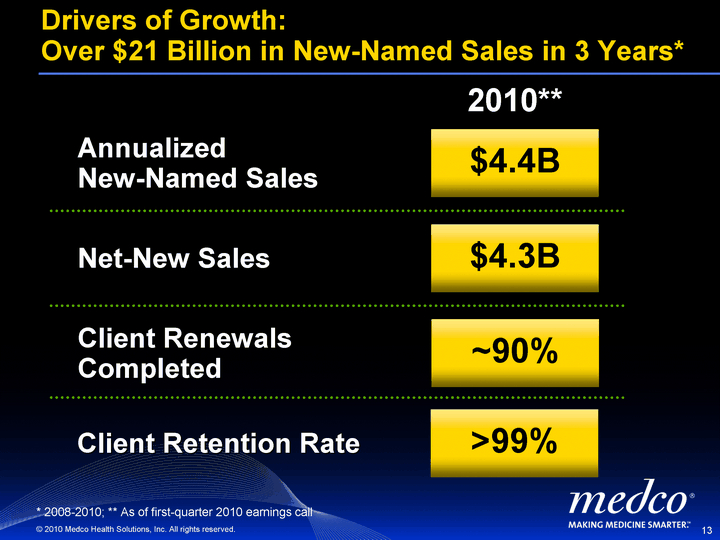
| 13 Drivers of Growth: Over $21 Billion in New-Named Sales in 3 Years* Annualized New-Named Sales Net-New Sales 2010** * 2008-2010; ** As of first-quarter 2010 earnings call $4.4B $4.3B Client Renewals Completed ~90% Client Retention Rate >99% |
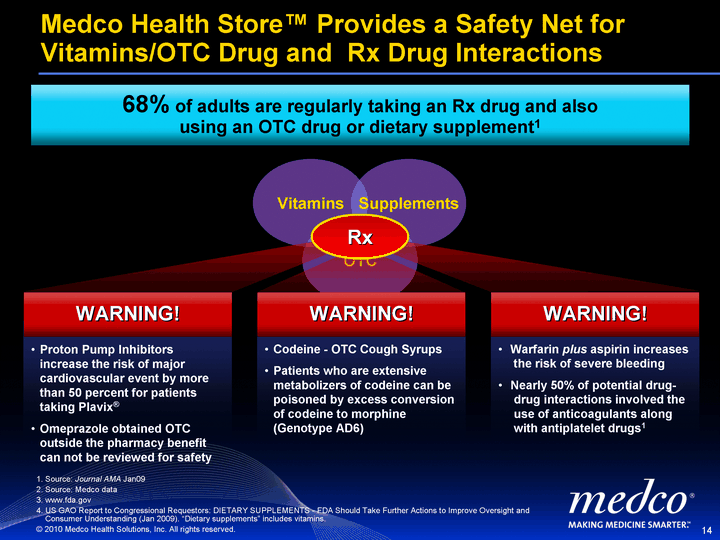
| 14 OTC Vitamins Supplements Rx Rx Medco Health Store(tm) Provides a Safety Net for Vitamins/OTC Drug and Rx Drug Interactions 68% of adults are regularly taking an Rx drug and also using an OTC drug or dietary supplement1 Proton Pump Inhibitors increase the risk of major cardiovascular event by more than 50 percent for patients taking Plavix(r) Omeprazole obtained OTC outside the pharmacy benefit can not be reviewed for safety WARNING! Codeine - OTC Cough Syrups Patients who are extensive metabolizers of codeine can be poisoned by excess conversion of codeine to morphine (Genotype AD6) WARNING! Warfarin plus aspirin increases the risk of severe bleeding Nearly 50% of potential drug- drug interactions involved the use of anticoagulants along with antiplatelet drugs1 WARNING! 1. Source: Journal AMA Jan09 2. Source: Medco data 3. www.fda.gov 4. US GAO Report to Congressional Requestors: DIETARY SUPPLEMENTS - FDA Should Take Further Actions to Improve Oversight and Consumer Understanding (Jan 2009). "Dietary supplements" includes vitamins. |
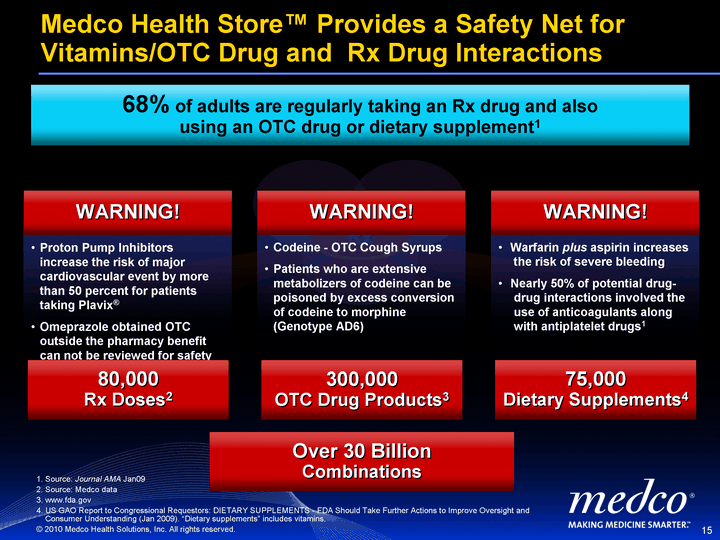
| 15 OTC Vitamins Supplements Rx Rx Rx Rx Medco Health Store(tm) Provides a Safety Net for Vitamins/OTC Drug and Rx Drug Interactions 68% of adults are regularly taking an Rx drug and also using an OTC drug or dietary supplement1 Proton Pump Inhibitors increase the risk of major cardiovascular event by more than 50 percent for patients taking Plavix(r) Omeprazole obtained OTC outside the pharmacy benefit can not be reviewed for safety WARNING! Codeine - OTC Cough Syrups Patients who are extensive metabolizers of codeine can be poisoned by excess conversion of codeine to morphine (Genotype AD6) WARNING! Warfarin plus aspirin increases the risk of severe bleeding Nearly 50% of potential drug- drug interactions involved the use of anticoagulants along with antiplatelet drugs1 WARNING! 80,000 Rx Doses2 300,000 OTC Drug Products3 75,000 Dietary Supplements4 1. Source: Journal AMA Jan09 2. Source: Medco data 3. www.fda.gov 4. US GAO Report to Congressional Requestors: DIETARY SUPPLEMENTS - FDA Should Take Further Actions to Improve Oversight and Consumer Understanding (Jan 2009). "Dietary supplements" includes vitamins. Over 30 Billion Combinations |
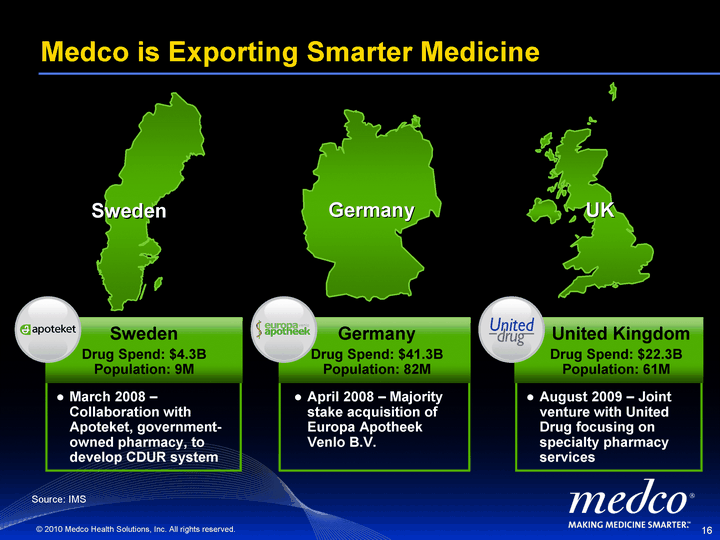
| 16 Medco is Exporting Smarter Medicine Germany Sweden UK August 2009 - Joint venture with United Drug focusing on specialty pharmacy services United Kingdom Drug Spend: $22.3B Population: 61M March 2008 - Collaboration with Apoteket, government- owned pharmacy, to develop CDUR system Sweden Drug Spend: $4.3B Population: 9M April 2008 - Majority stake acquisition of Europa Apotheek Venlo B.V. Germany Drug Spend: $41.3B Population: 82M Source: IMS |
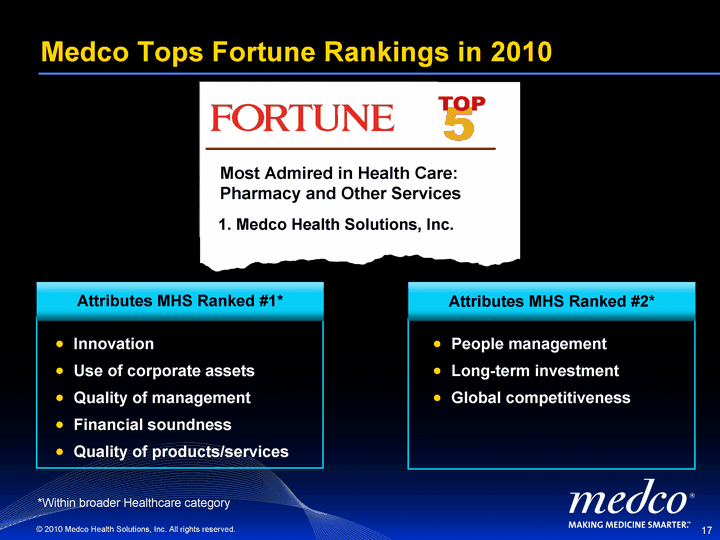
| 17 Medco Tops Fortune Rankings in 2010 Innovation Use of corporate assets Quality of management Financial soundness Quality of products/services Most Admired in Health Care: Pharmacy and Other Services 1. Medco Health Solutions, Inc. People management Long-term investment Global competitiveness Attributes MHS Ranked #1* Attributes MHS Ranked #2* *Within broader Healthcare category |

| 18 Strong Financial Results Expected to Continue 2010 Guidance(1) 2009 Actual % Growth GAAP Diluted EPS $3.05-$3.15 $2.61 17%-21% Diluted EPS, excluding the amortization of intangibles related to 2003 spin-off (2) $3.28-$3.38 $2.83 16%-19% 1 As of first-quarter 2010 earnings call 2 See earnings per share guidance reconciliation in appendix |

| 19 Appendix |
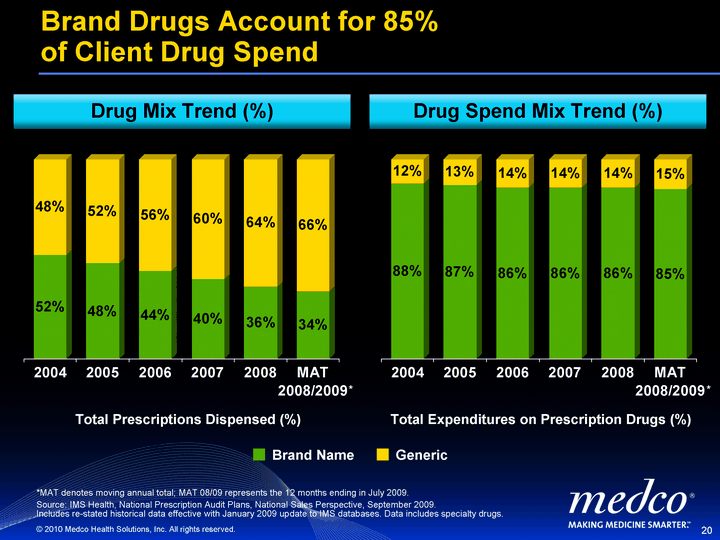
| 20 Drug Mix Trend (%) Brand Drugs Account for 85% of Client Drug Spend Brand Name Generic Total Prescriptions Dispensed (%) 2004 0.52 0.48 2005 0.48 0.52 2006 0.44 0.56 2007 0.4 0.6 2008 0.36 0.64 MAT 2008/2009 0.34 0.66 2004 0.88 0.12 2005 0.87 0.13 2006 0.86 0.14 2007 0.86 0.14 2008 0.86 0.14 MAT 2008/2009 0.85 0.15 Total Expenditures on Prescription Drugs (%) * * *MAT denotes moving annual total; MAT 08/09 represents the 12 months ending in July 2009. Source: IMS Health, National Prescription Audit Plans, National Sales Perspective, September 2009. Includes re-stated historical data effective with January 2009 update to IMS databases. Data includes specialty drugs. Drug Spend Mix Trend (%) |
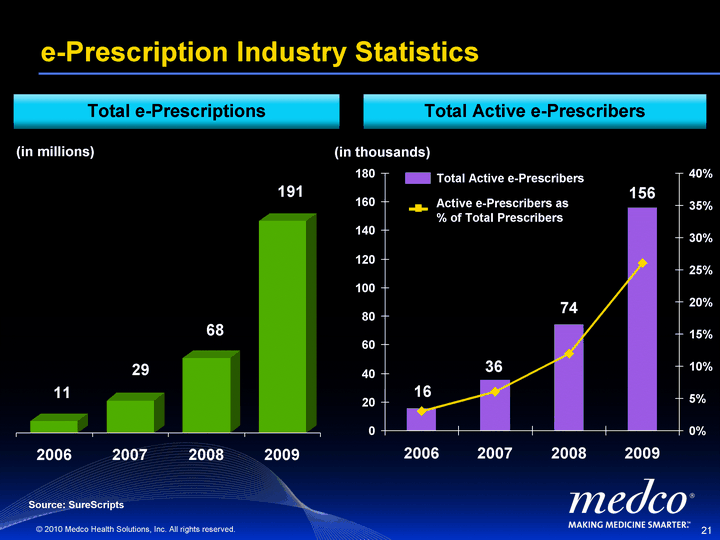
| 21 2006 2007 2008 2009 Acute e-Rx's 10949896 29447150 67749689 191000000 e-Prescription Industry Statistics 2006 2007 2008 2009 Active e-Prescribers 15.868 35.597 74.487 155.917 Active e-Prescribers as % of Total 0.03 0.06 0.12 0.26 Total e-Prescriptions Total Active e-Prescribers (in millions) Source: SureScripts 11 68 29 191 Total Active e-Prescribers Active e-Prescribers as % of Total Prescribers (in thousands) 16 36 74 156 |
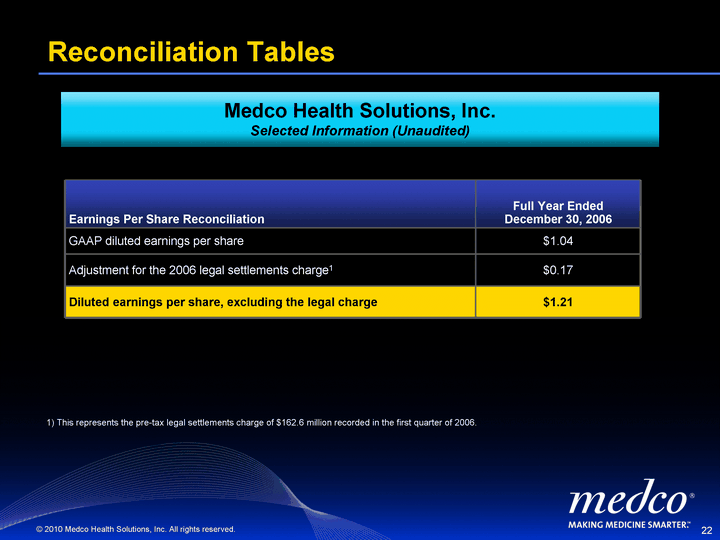
| 22 Reconciliation Tables Earnings Per Share Reconciliation Full Year Ended December 30, 2006 GAAP diluted earnings per share $1.04 Adjustment for the 2006 legal settlements charge1 $0.17 Diluted earnings per share, excluding the legal charge $1.21 1) This represents the pre-tax legal settlements charge of $162.6 million recorded in the first quarter of 2006. Medco Health Solutions, Inc. Selected Information (Unaudited) |
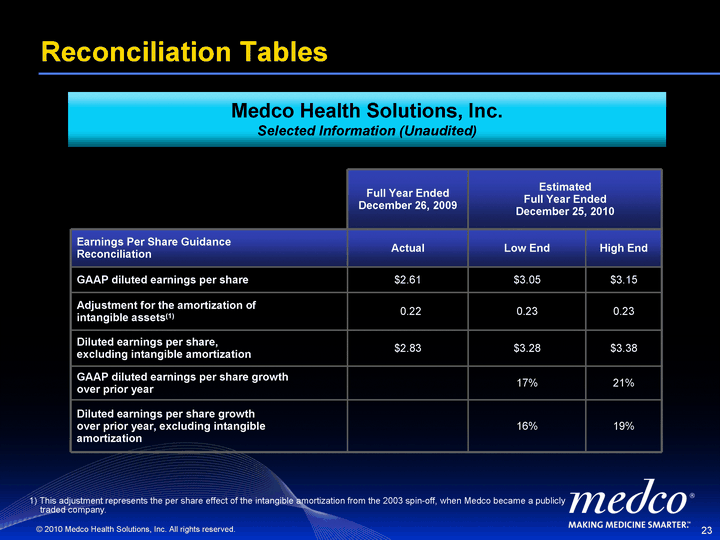
| 23 Reconciliation Tables Full Year Ended December 26, 2009 Estimated Full Year Ended December 25, 2010 Estimated Full Year Ended December 25, 2010 Earnings Per Share Guidance Reconciliation Actual Low End High End GAAP diluted earnings per share $2.61 $3.05 $3.15 Adjustment for the amortization of intangible assets(1) 0.22 0.23 0.23 Diluted earnings per share, excluding intangible amortization $2.83 $3.28 $3.38 GAAP diluted earnings per share growth over prior year 17% 21% Diluted earnings per share growth over prior year, excluding intangible amortization 16% 19% 1) This adjustment represents the per share effect of the intangible amortization from the 2003 spin-off, when Medco became a publicly traded company. Medco Health Solutions, Inc. Selected Information (Unaudited) |
