Attached files
| file | filename |
|---|---|
| 8-K - FORM 8-K - StellarOne CORP | d8k.htm |
 Excellence.
Partnership. Service
Welcome!
2010 Annual Meeting of Shareholders
April 27, 2010
Exhibit 99.1 |
 Ed
Barham Corporate President & CEO |
 Forward Looking Statements
•
In addition to historical information, this presentation contains
forward-looking statements. The forward-looking statements are
subject to certain risks and uncertainties, which could cause actual
results to differ materially from historical results, or those anticipated.
When we use words such as “believes”, “expects”,
“anticipates”
or similar expressions, we are making forward-looking statements.
Readers are cautioned not to place undue reliance on these forward-looking
statements, which reflect management’s analysis only as of the date
thereof. StellarOne wishes to caution the reader that factors, such as
those listed below, in some cases have affected and could affect
StellarOne’s actual results, causing actual results to differ
materially from those in any forward looking statement. These factors
include: (i) expected cost savings from StellarOne’s acquisitions and
dispositions, (ii) competitive pressure in the banking industry or in
StellarOne’s markets may increase significantly, (iii) changes in the
interest rate environment may reduce margins, (iv) general economic
conditions, either nationally or regionally, may be less favorable than
expected, resulting in, among other things, credit quality deterioration, (v)
changes may occur in banking legislation and regulation (vi) changes may occur in
general business conditions and (vii) changes may occur in the securities
markets. Please refer to StellarOne’s filings with the Securities and
Exchange Commission for additional
information,
which
may
be
accessed
at
www.stellarone.com. |
 |
 |
 |
 |
 |
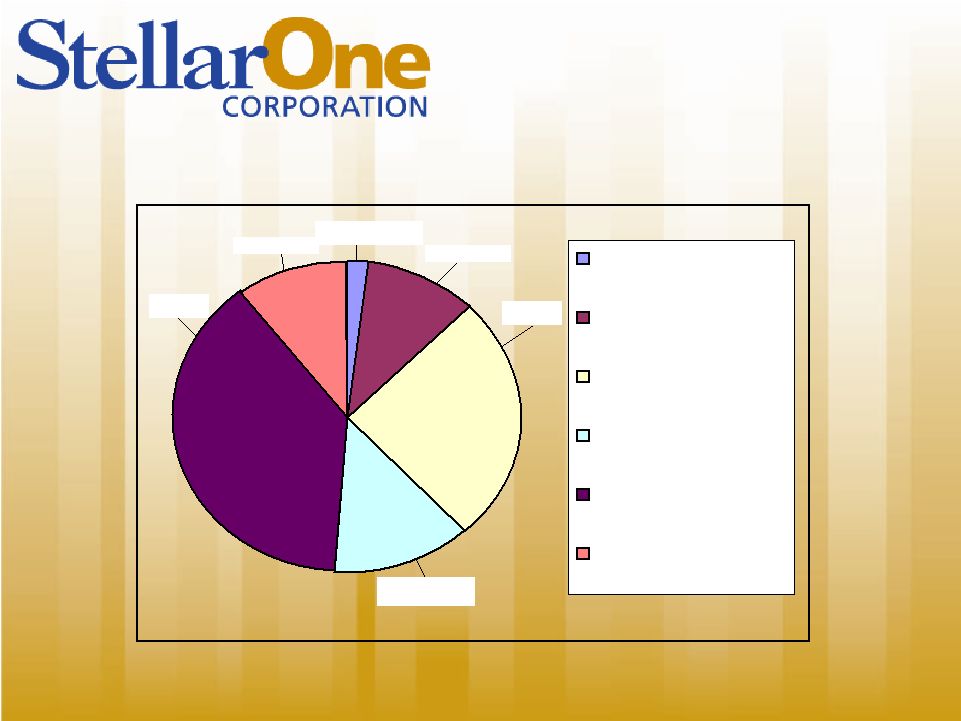 A&D/Construction:
SML
A&D/Construction
(Net of SML)
R/E Mortgage
Consumer
Commercial R/E
Commercial
10.52%
10.15%
38.73%
25.78%
12.93%
1.90%
Total Portfolio $2,181,196,000
As of 12/31/09 |
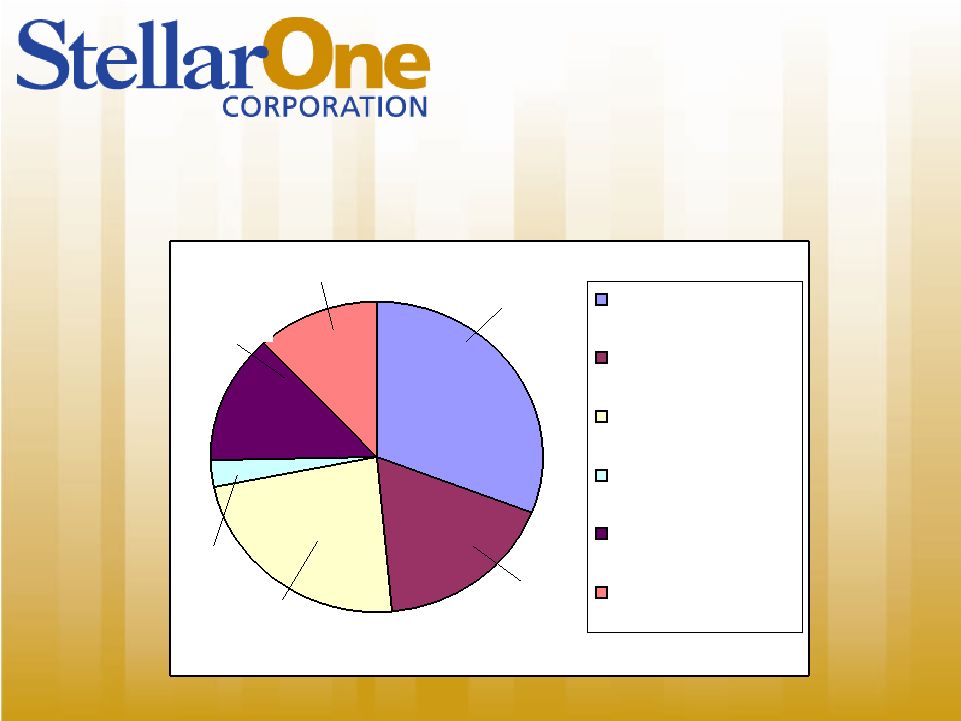 Total Non Performing Loans = $66,254,000
Total Non Performing Loans as a
Percentage of the Total Loan Portfolio = 2.79%
A&D/Construction:
SML
A&D/Construction
(Net of SML)
R/E Mortgage
Consumer
Commercial R/E
Commercial
2.85%
30.72%
17.88%
23.23%
13.47%
11.84%
As of 12/31/09 |
 |
 |
 |
 |
 Line of Business Overview
Mr. Greg Feldmann
Bank President & CEO |
 Retail Snapshot
Households
> 112,000
Deposits
$2.35 billion
Loans
$610 million
Annual Fee Income
$16.1 million
Financial Centers
56
Alternative Channels
CCC, Internet, Phone,
Mobile
Employees
365 |
 Retail 2009 Accomplishments
Production results ~ 2009 vs
2008
Loans:
Total Consumer Loans
á
10.43%
Monthly Average Book Applications
á
8.93 %
Monthly Applications Taken
á
5.47%
Monthly Average Loan Applications
á
1.46%
Deposits:
Total Interest Bearing Deposits
á
5.74%
Total Deposits
á
3.88%
Implemented New Account Follow Up (NAFU) process to
ensure new client satisfaction and optimize cross selling
opportunities |
 Retail 2009 Accomplishments
Bonanza Deposit Campaign
Total Deposits
$96.3MM
Accounts opened
5,431
Wealth Management referral program
Retail referrals up 30% from previous year
Retail revenue up nearly 20% |
 Retail 2009 Accomplishments
Improved branch efficiency through
strategic realignment
Closed/Consolidated 5 Financial Centers
Overall deposit retention rate 95%
Sold Woodstock to 1
st
Bank
Annualized operating cost savings ~
$1.8 million
Relocated Market St. to Franklin
Plaza
Opened Plank Rd. facility |
 2010 Key Initiatives
Retail Focus: Build Relationships, Revenue and Retention
Refinement of Retail Executive Management
Intensify focus on Sales and Service and improvement in
Operations, Compliance and Project Management
Grow noninterest income
Example: Improve check card penetration
Focus on organic growth
Integrate Client Contact Center into Retail
Developing sales campaigns for clients utilizing Next Best
Product Strategy developed through Marketing
StellarOne@Work
being promoted to Business and
Commercial Banking clients |
 2010 Key Initiatives
Continue to improve operating efficiency
More sales per square foot
Manage to staffing model
Driving
“store
owner”
mentality
using
MPC
Relocate Seminole Trail Financial Center to
new Northtowne
location
Lease or sell excess space |
 Plank Road |
 Commercial Snapshot
Market Segments Served
Commercial: $3 to $25 million
Middle Market: >$25 million
Commercial Real Estate: A&D,
Housing, Income producing properties,
Hospitality
Treasury Management Services for
companies and municipalities
Loans
$1.3 billion
Deposits
$93 million non-interest
$62 million in sweep balances
Employees
67 |
 2009 Highlights
•
Loan
production
-
$378
million
commitments
closed
•
Treasury Management:
–
Sweep
balances
-
$62
million
average
–
Account analysis income up 36% to ~$700k annually
•
Established RM staffing metric -
$40MM/150-200 notes
•
Implemented Segmentation Strategy
–
Core Commercial
–
Middle Market
–
Greater focus and refinement of Commercial Real Estate Group
•
Transferred $150mm+ in loans and reassigned 5 officers
to Business Banking to improve relationship coverage
and risk management |
 2010 Initiatives & Goals
•
Grow & diversify loans in C&I
–
Growth goal of 5% on loans and 4% on deposits
–
Evaluate potential markets for LPO
–
Opportunity in government contracting sector
–
Leverage SBA
–
Cross sell treasury management, insurance, wealth management
•
Refine Commercial management structure
–
Regional Portfolio Manager Positions
–
Regional Commercial Banking Manager Positions
•
Commercial Real Estate
–
Remain vigilant on working down problems
•
A&D exposure reduced by $89 million in 2009
–
Be opportunistic in our markets
•
Further enhance products and services
–
Treasury Management capabilities (international, F/X, etc.)
–
Interest Rate hedging alternatives |
 Business Banking
Market Served
Business and professional
groups with revenues $3 million
or less
Market Opportunity
> 300,000 opportunities in VA
Loans
$235 million
Deposits
Drive to Retail centers to
leverage investment in facilities
Business Model
60% business/40% retail (bank
the owners and employees)
Employees
16.5 |
 2009 Highlights
•
Completed “right sizing”
to ensure
effective coverage in prime BB
markets
•
Successfully integrated $150MM loan
portfolio and 5 RMs
•
Developed scorecard system to track
effectiveness of RMs
•
Structured Specialized Lending area
with a focus on SBA lending |
 2010 Initiatives
•
$67 million in new loans/$20 million in core
deposits/Cross sell fee services
–
Rolled out “Premier Profiling Program”
to expand
existing relationships
–
Generating additional fees through investments,
insurance and mortgage
–
Double SBA loan book
–
Developing a new tiered deposit product embedding
treasury management features
–
Partnering with Retail to cross sell StellarOne@Work
•
Utilizing Synapsys (CRM system) to ensure all calling
and selling activity is captured |
 Mortgage Snapshot
Markets Served
Retail: customers and
prospects in or near our
Virginia markets
Wholesale: Smaller banks
and brokers principally in
VA, NC, SC
2009 Customers Served
3,422
2009 Loan Volume
$618 million
2009 Revenues
$5.6 million |
 2009 Accomplishments
•
Implemented Optimal Blue system
•
Made process improvements for underwriting,
closing, and post closing functions
•
Expanded into Richmond market
•
Wholesale developed mini-correspondent
program
•
Website improvements |
 2010 Initiatives
•
Cross sell Bank and affiliate services (e.g., insurance)
–
Achieving 15% or greater cross sell penetration rate
•
Continue to build strong ties to our builders in order to
help them close more business while increasing our
“purchase”
business
•
Better utilize Customer Contact Center
•
Continual improvement in Risk Management
•
Enhance Freddie Mac relationship of delivery channel to
enhance funding and delivery of loans for greater
profitability |
 Wealth Management Overview
Securities
Asset
Management
Total
Employees
11
24
35
Assets
$212MM
$462MM
$674MM
Accounts
4,277
868
5,145
2009
Revenues
$1.2MM
$2.96MM
$4.16MM |
 2009 Accomplishments
•
Securities Division assets grew by $39 million
or 23%
•
Asset Management booked 79 new accounts
with initial funding of $28 million
•
Retained 99.5% of Asset Management
accounts in a volatile market year
•
Hired experienced Relationship Managers in
Roanoke, Fredericksburg and Staunton
•
Implemented Investor’s View |
 2010 Initiatives
•
Business Development / Marketing
–
Holding “Will Workshop”
seminars
–
Planning seminars for centers of influence (attorneys, CPA’s, etc.) that
would include continuing education credits
–
Expansion of number of staff members making business development
calls to better cover the footprint of Wealth Management
•
Account Retention Focus
–
Implementation of a call tracking system based on client tiers
–
Goals established for number of proactive client contacts per year
•
Portfolio Management
–
Implementation of a new performance measurement system
–
Creation of collateral materials documenting investment performance
|
 Financial Report
Mr. Jeffrey W. Farrar
Executive Vice President and
Chief Financial Officer |
 •
Discussion Topics:
–
Profitability
–
Asset Quality
–
Balance Sheet, Capital and Liquidity
–
Overhead and Efficiency Efforts
–
Stock Ownership and Performance |
 First Quarter Preview
•
Earnings improvement that will exceed the
consensus estimate.
•
Decrease in total non-performing assets for the
second consecutive quarter.
•
Higher charge-offs and related provisioning
sequentially.
•
Continued improvement in net interest margin
for second consecutive quarter.
•
Improved contribution from mortgage and wealth
management.
•
Official earnings release on Thursday. |
 Peer Comparisons
•
Sandy Spring
Bancorp
•
City Holding
Company
•
Capital City Group
•
Townebank
•
Cardinal Financial
•
Pinnacle Financial
•
SCBT Financial
•
S&T Bancorp
•
Seacoast Banking
•
Harleysville National
•
Sun Corporation
•
Virginia Commerce |
 Profitability
StellarOne
2009 Actual
2009 Peer
Average
Return on Average
Assets
-.28%
-.18%
Return on Average
Equity
-1.99%
-3.02% |
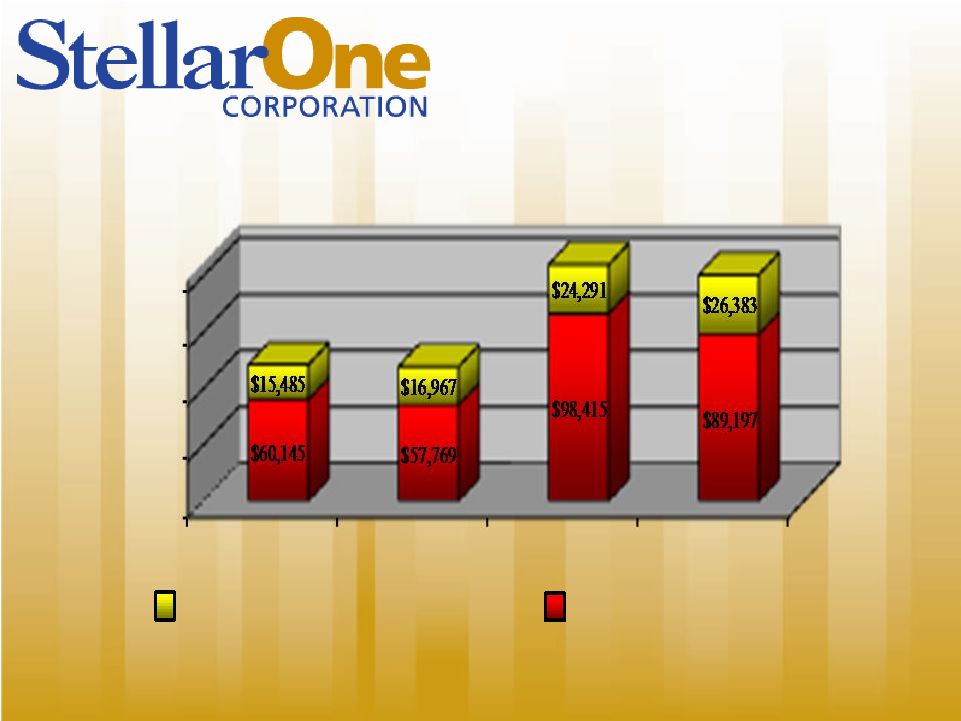 Revenue Growth and Composition
$15,000
$40,000
$65,000
$90,000
$115,000
2006
2007
2008
2009
Non
-
interest Income
Net Interest Income |
 3.52%
3.34%
3.30%
3.45%
3.64%
3.25%
3.35%
3.45%
3.55%
3.65%
3.75%
3.85%
1Q 2009
2Q 2009
3Q 2009
4Q2009
Peer YE
2009
Net Interest Margin |
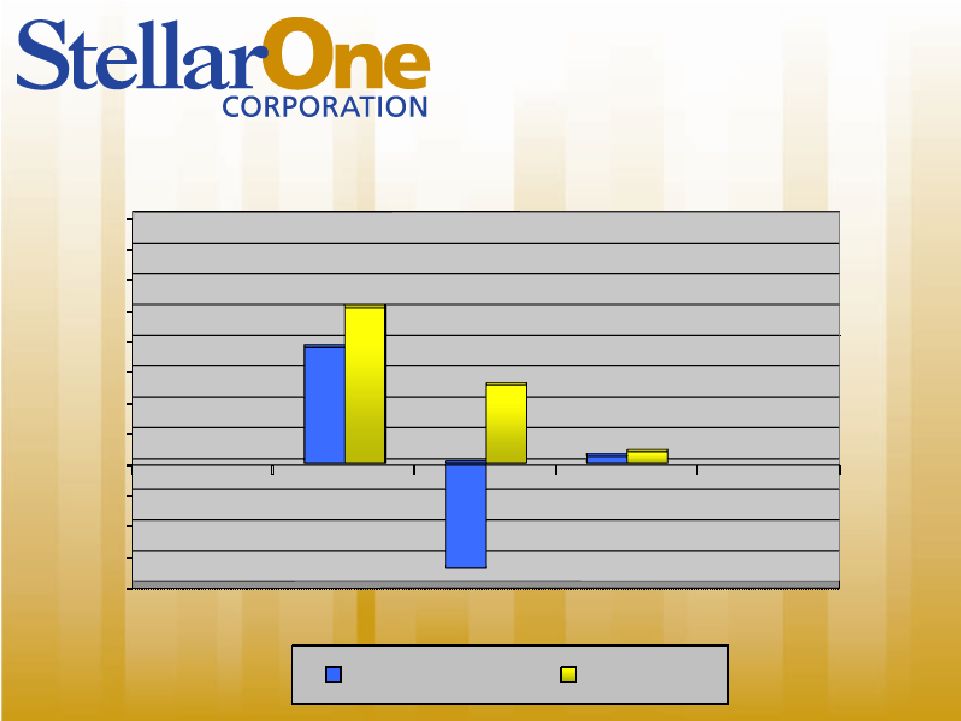 Earnings and Dividends
(in thousands)
-$10,000
-$7,500
-$5,000
-$2,500
$0
$2,500
$5,000
$7,500
$10,000
$12,500
$15,000
$17,500
$20,000
2008
2009
4Q -
2009
$9,411
($8,530)
$546
$12,614
$6,350
$908
Earnings (Loss)
Dividends |
 2006
2007
2008
2009
Peer
Non-performing
Assets / Total
Assets
0.19%
0.44%
1.66%
2.13%
2.60%
Net Charge-offs
/ Average
Loans
(0.01)%
0.12%
0.80%
1.24%
1.09%
Allowance /
Loans
1.19%
1.23%
1.35%
1.84%
1.69%
Asset Quality |
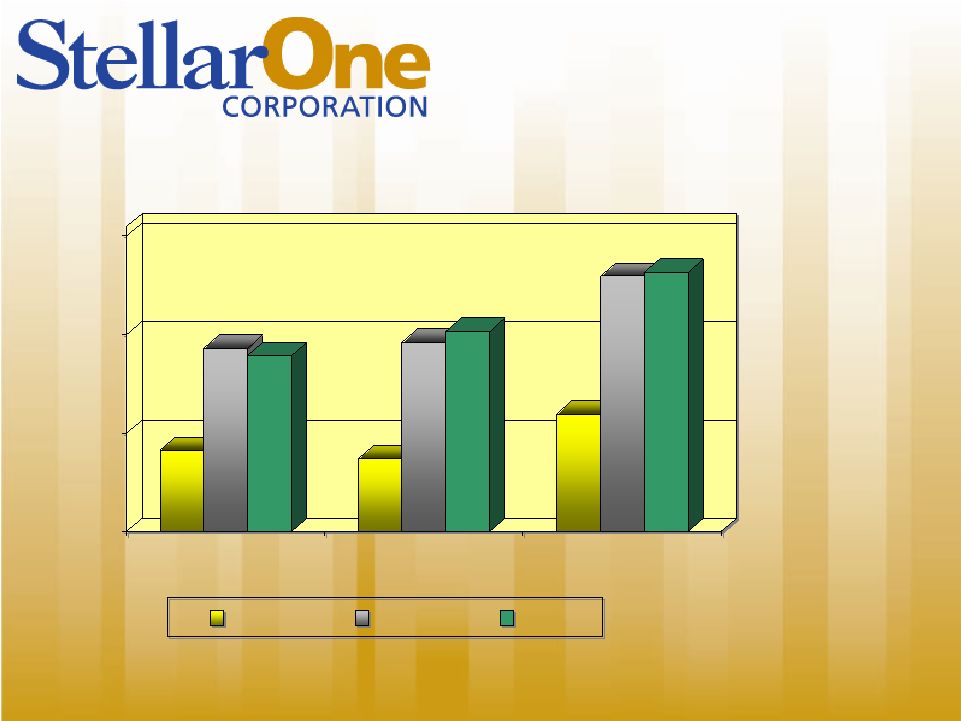 $400
$1,400
$2,400
$3,400
Loans
Deposits
Assets
2007
2008
2009
$400
$1,400
$2,400
$3,400
Loans
Deposits
Assets
2007
2008
2009
Balance Sheet
2009 vs. 2008
Loans
(3.4)%
Deposits
4.9%
Assets
1.3% |
 Deposit Base
Time
Deposits,
40%
Savings
deposits,
8%
Demand
deposits,
39%
Non-
interest
bearing,
12%
Non-
interest
bearing
13%
Savings
deposits
8%
Demand
deposits,
32%
Time
Deposits,
47%
2009 -
$2.44
Billion
2008 –
$2.32
Billion |
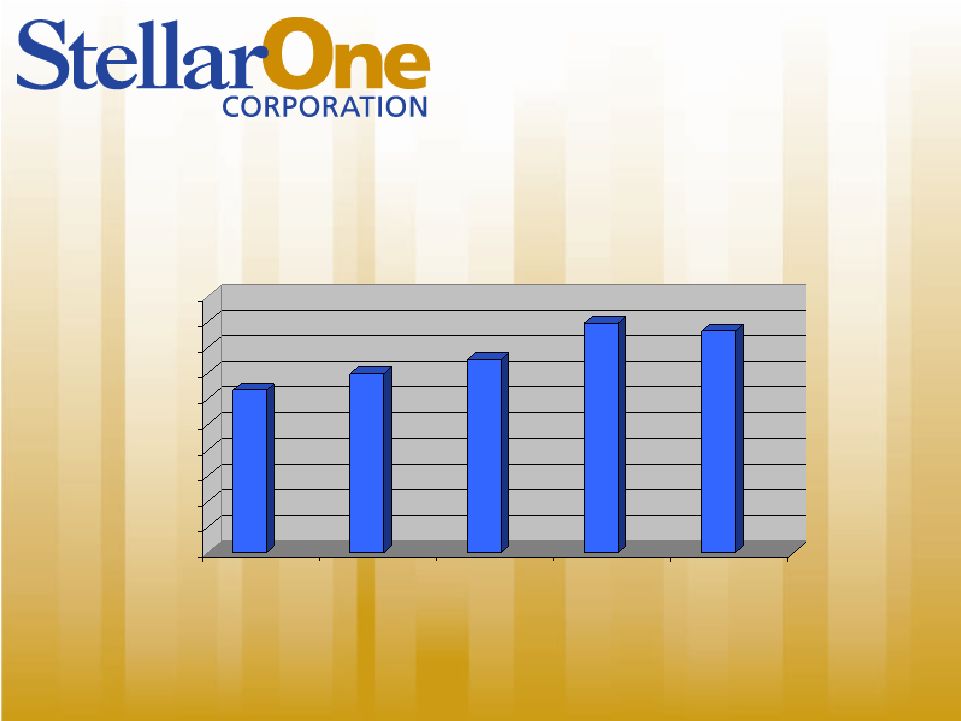 $12.66
$13.97
$15.08
$17.90
$17.30
$0.00
$2.00
$4.00
$6.00
$8.00
$10.00
$12.00
$14.00
$16.00
$18.00
$20.00
2005
2006
2007
2008
2009
Book Value per Common Share |
 Capital Ratios
StellarOne
2009 Actual
2009 Peer
Median
Tier 1 Capital to
Risk Adjusted
Assets
13.21%
12.35%
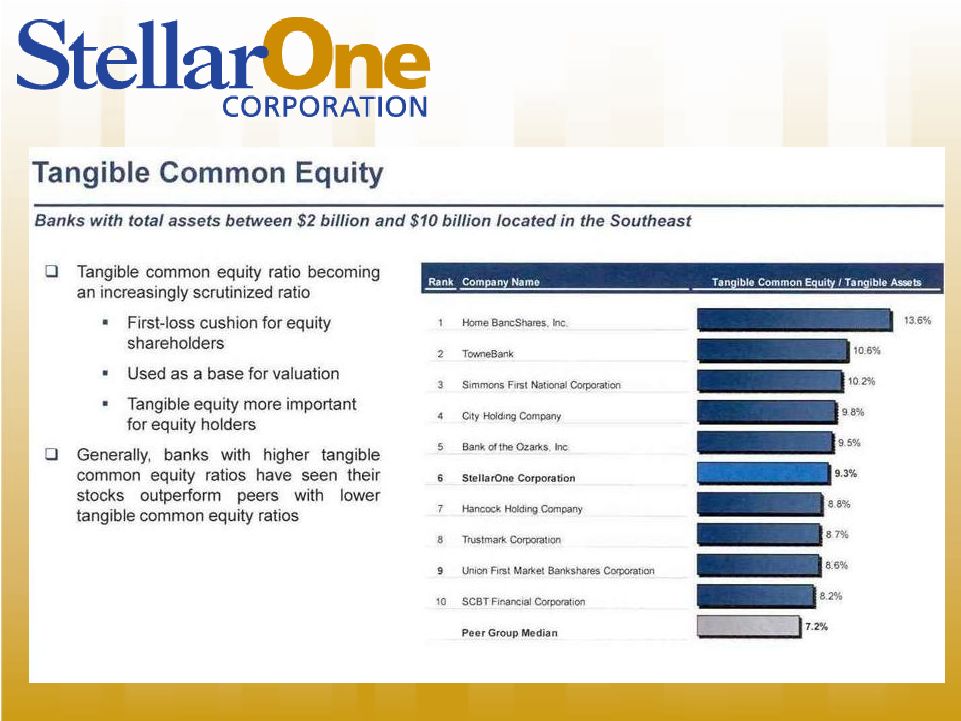
Tangible Equity to
Tangible Assets
10.26%
8.84%
Total
Equity
to
Total
Assets
14.46%
14.48% |
 •
Liquid assets (cash and securities) of $551
million or 18% of balance sheet.
•
Securities portfolio is of a high quality with no
embedded credit risk and short duration.
•
Untapped lines of credit exceed $85 million
which are available if the need warrants for use
as standby sources of liquidity.
Liquidity |
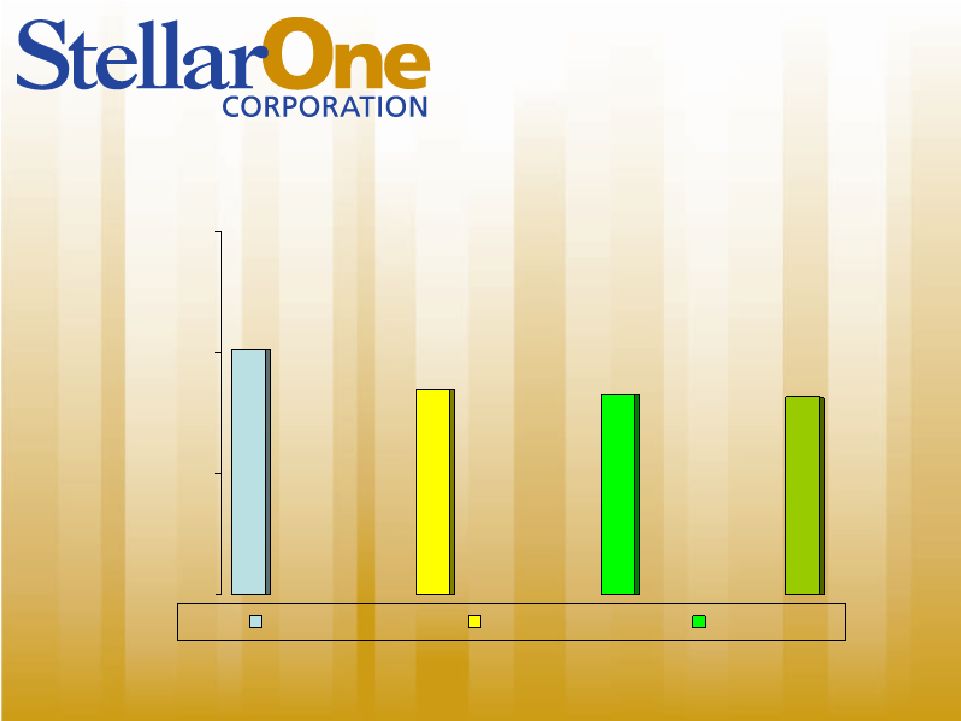
 $22,224
$24,057
$22,748
$24,875
$0
$5,000
$10,000
$15,000
$20,000
$25,000
$30,000
$35,000
1Q - 2009
2Q - 2009
3Q - 2009
4Q - 2009
Overhead by Quarter
(Dollars in thousands) |
 1,013
846
827
815
0
500
1,000
1,500
Jul-07
Dec-08
Dec-09
FTE History |
 Valuation
StellarOne
2009 Actual
2009 Peer
Average
YTD Stock
Performance
44.6%
17.5%
Percentage
of
Book
Value
85%
118%
Market
Capitalization
$343 M
$372 M |
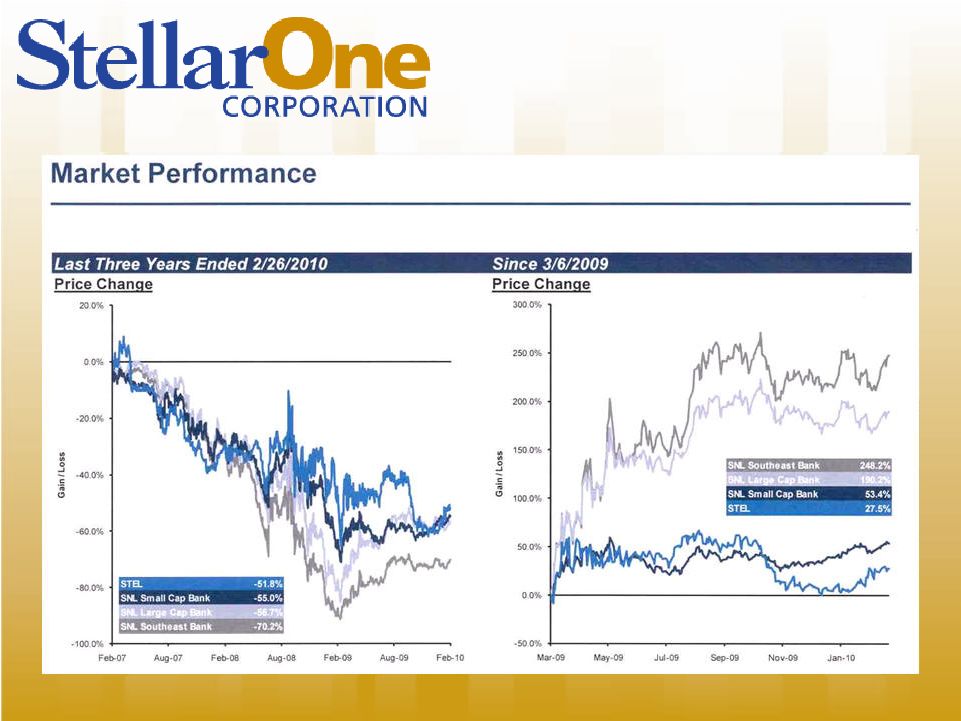
 YTD
%
1yr.
%
5yr.
%
StellarOne (STEL)
46.62%
5.73%
(24.30)%
Peers
32.70%
3.47%
(22.50)%
Total Return Performance |
 Coverage and Ownership
•
StellarOne now covered by ten buy side
analysts.
•
Institutional ownership is now almost 30%
of total ownership.
•
Top four holders:
–
BlackRock
Global
4.88%
–
Vanguard Group
3.99%
–
Dimensional Fund
3.74%
–
Heartland Advisors
2.74% |
 Questions and Discussion
Thank You! |