Attached files
| file | filename |
|---|---|
| EX-99.1 - Q1 2010 PRESS RELEASE - CSX CORP | pressrelease_q12010.htm |
| 8-K - Q1 2010 FORM 8-K - CSX CORP | form8-k_q12010.htm |
Exhibit 99.2

CSX Announces 22% Increase in First Quarter
Earnings Per Share from Continuing Operations
Year-Over-Year Highlights:
|
·
|
Record performance in employee safety
|
|
·
|
Revenue increases 11% to nearly $2.5 billion
|
|
·
|
Operating income increases 21% to $634 million
|
|
·
|
Operating ratio improves 230 basis points to 74.5%
|
Jacksonville, Fla. – April 13, 2010 – CSX Corporation (NYSE: CSX) today announced first quarter earnings per share from continuing operations of $306 million, or 78 cents per share, versus $254 million, or 64 cents per share, in the same period last year. This represents a 22 percent year-over-year improvement in earnings per share from continuing operations.
“CSX drove strong efficiencies in its operations and produced outstanding results as the economy continued to recover,” said Michael J. Ward, chairman, president and chief executive officer. “We are particularly proud of our excellent safety performance in the quarter, as our employees achieved record results in one of America’s safest industries.”
Revenue in the first quarter increased 11 percent from the prior year, to nearly $2.5 billion, with gains across most of the company’s markets. The combination of higher revenues and productivity also resulted in a record first quarter operating ratio of 74.5 percent and record first quarter operating income of $634 million.
“Our focus on safety, service and productivity has positioned CSX to produce strong results as the recovery continues,” Ward said. “These results will enable the company to continue investing in its business to support the nation’s growing demand for freight transportation, while driving shareholder value.”
CSX has invested approximately $5 billion in its network over the past three years, and is investing another $1.7 billion in 2010.
|
Table of Contents
|
The accompanying unaudited
|
CSX CORPORATION
|
CONTACTS:
|
|
financial information should be
|
500 Water Street, C900
|
||
|
read in conjunction with the
|
Jacksonville, FL
|
INVESTOR RELATIONS
|
|
|
Company’s most recent
|
32202
|
David Baggs
|
|
|
Annual Report on Form 10-K,
|
http://www.csx.com
|
(904) 359-4812
|
|
|
Quarterly Reports on Form
|
MEDIA
|
||
|
10-Q, and any Current
|
Lauren Rueger
|
||
|
Reports on Form 8-K.
|
(877) 835-5279
|
1
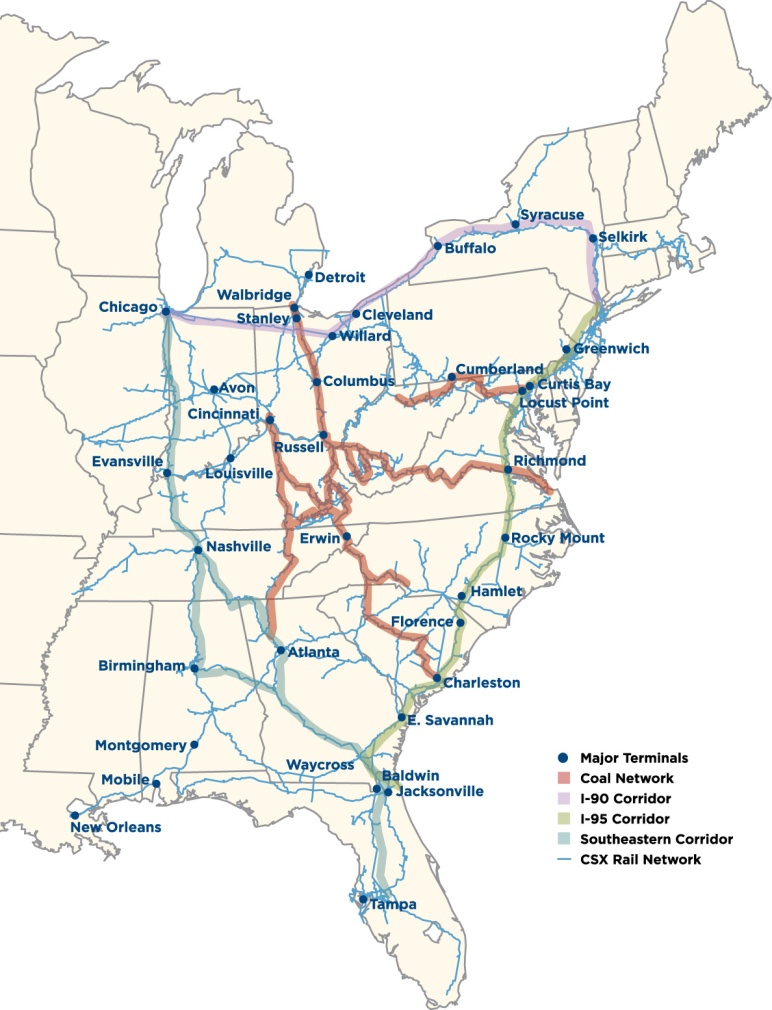
CSX Corporation, based in Jacksonville, Fla., is a leading transportation company providing rail, intermodal and rail-to-truck transload services. The company’s transportation network spans approximately 21,000 miles with service to 23 eastern states and the District of Columbia, and connects to more than 70 ocean, river and lake ports.
This earnings announcement, as well as a package of detailed financial information, is contained in the CSX Quarterly Financial Report available on the company’s website at http://investors.csx.com in the Investors section and on Form 8-K with the Securities and Exchange Commission (“SEC”).
CSX executives will conduct a quarterly earnings conference call with the investment community on April 14, 2010 at 8:30 a.m. ET. Investors, media and the public may listen to the conference call by dialing 888-327-6279 (888-EARN-CSX) and asking for the CSX earnings call. (Callers outside the U.S., dial 773-756-0199). Participants should dial in 10 minutes prior to the call. In conjunction with the call, a live webcast will be accessible and presentation materials will be posted on the company's website at http://investors.csx.com. Following the earnings call, an internet replay of the presentation will be archived on the company website.
##
Forward-looking Statements
This information and other statements by the company may contain forward-looking statements within the meaning of the Private Securities Litigation Reform Act with respect to, among other items: projections and estimates of earnings, revenues, volumes, rates, cost-savings, expenses, or other financial items; statements of management’s plans, strategies and objectives for future operations, and management’s expectations as to future performance and operations and the time by which objectives will be achieved; statements concerning proposed new services; and statements regarding future economic, industry or market conditions or performance. Forward-looking statements are typically identified by words or phrases such as “believe,” “expect,” “anticipate,” “project,” “estimate,” “preliminary” and similar expressions. Forward-looking statements speak only as of the date they are made, and the company undertakes no obligation to update or revise any forward-looking statement. If the company does update any forward-looking statement, no inference should be drawn that the company will make additional updates with respect to that statement or any other forward-looking statements.
Forward-looking statements are subject to a number of risks and uncertainties, and actual performance or results could differ materially from that anticipated by any forward-looking statements. Factors that may cause actual results to differ materially from those contemplated by any forward-looking statements include, among others; (i) the company’s success in implementing its financial and operational initiatives; (ii) changes in domestic or international economic, political or business conditions, including those affecting the transportation industry (such as the impact of industry competition, conditions, performance and consolidation); (iii) legislative or regulatory changes; (iv) the inherent business risks associated with safety and security; (v) the outcome of claims and litigation involving or affecting the company; (vi) natural events such as severe weather conditions or pandemic health crises; and (vii) the inherent uncertainty associated with projecting full year 2010 economic and business conditions.
Other important assumptions and factors that could cause actual results to differ materially from those in the forward-looking statements are specified in the company’s SEC reports, accessible on the SEC’s website at www.sec.gov and the company’s website at www.csx.com.
2
|
CONSOLIDATED INCOME STATEMENTS
|
|||||
|
(Dollars in Millions, Except Per Share Amounts)
|
|||||
|
(Unaudited)
|
|||||
|
Quarters Ended
|
|||||
|
Mar. 26,
|
Mar. 27,
|
||||
|
2010
|
2009
|
$ Change
|
% Change
|
||
|
Revenue
|
$2,491
|
$2,247
|
$244
|
11
|
%
|
|
Expense
|
|||||
|
Labor and Fringe
|
729
|
662
|
(67)
|
(10)
|
|
|
Materials, Supplies and Other
|
453
|
477
|
24
|
5
|
|
|
Fuel
|
283
|
191
|
(92)
|
(48)
|
|
|
Depreciation
|
229
|
224
|
(5)
|
(2)
|
|
|
Equipment and Other Rents
|
100
|
113
|
13
|
12
|
|
|
Inland Transportation
|
63
|
58
|
(5)
|
(9)
|
|
|
Total Expense
|
1,857
|
1,725
|
(132)
|
(8)
|
|
|
Operating Income
|
634
|
522
|
112
|
21
|
|
|
Interest Expense
|
(142)
|
(141)
|
(1)
|
(1)
|
|
|
Other Income - Net
|
11
|
3
|
8
|
267
|
|
|
Earnings From Continuing Operations
|
|||||
|
Before Income Taxes
|
503
|
384
|
119
|
31
|
|
|
Income Tax Expense (a)
|
(197)
|
(130)
|
(67)
|
(52)
|
|
|
Earnings from Continuing Operations
|
306
|
254
|
52
|
20
|
|
|
Discontinued Operations
|
-
|
(8)
|
8
|
100
|
|
|
Net Earnings
|
$306
|
$246
|
$60
|
24
|
%
|
|
Per Common Share
|
|||||
|
Net Earnings Per Share, Assuming Dilution
|
|||||
|
Continuing Operations
|
$0.78
|
$0.64
|
$0.14
|
22
|
%
|
|
Discontinued Operations
|
-
|
(0.02)
|
0.02
|
100
|
|
|
Net Earnings
|
$0.78
|
$0.62
|
$0.16
|
26
|
%
|
|
Average Shares Outstanding,
|
|||||
|
Assuming Dilution (Thousands)
|
394,323
|
394,101
|
|||
|
Cash Dividends Paid Per Common Share
|
$0.24
|
$0.22
|
|||
|
(a)
|
During the first quarter of 2010, the Patient Protection and Affordable Care Act was enacted and signed. This Act included a provision eliminating the tax deductibility of retiree health care costs to the extent of federal subsidies received by plan sponsors that provide retiree prescription drug benefits equivalent to Medicare Part D coverage. As a result of this legislation and the Health Care and Education Reconciliation Act of 2010, the Company recorded tax expense of $7 million.
|
3
|
CSX Corporation
|
||
|
CONSOLIDATED BALANCE SHEETS
|
||
|
(Dollars in Millions)
|
||
|
(Unaudited)
|
||
|
Mar. 26,
|
Dec. 25,
|
|
|
2010
|
2009
|
|
|
ASSETS
|
||
|
Current Assets
|
||
|
Cash and Cash Equivalents
|
$993
|
$1,029
|
|
Short-term Investments
|
57
|
61
|
|
Accounts Receivable - Net
|
971
|
995
|
|
Materials and Supplies
|
218
|
203
|
|
Deferred Income Taxes
|
184
|
158
|
|
Other Current Assets
|
78
|
124
|
|
Total Current Assets
|
2,501
|
2,570
|
|
Properties
|
31,276
|
31,081
|
|
Accumulated Depreciation
|
(7,986)
|
(7,868)
|
|
Properties - Net
|
23,290
|
23,213
|
|
Investment in Conrail
|
654
|
650
|
|
Affiliates and Other Companies
|
442
|
438
|
|
Other Long-term Assets
|
306
|
165
|
|
Total Assets
|
$27,193
|
$27,036
|
|
LIABILITIES AND SHAREHOLDERS' EQUITY
|
||
|
Current Liabilities
|
||
|
Accounts Payable
|
$931
|
$967
|
|
Labor and Fringe Benefits Payable
|
376
|
383
|
|
Casualty, Environmental and Other Reserves
|
185
|
190
|
|
Current Maturities of Long-term Debt
|
617
|
113
|
|
Income and Other Taxes Payable
|
162
|
112
|
|
Other Current Liabilities
|
117
|
100
|
|
Total Current Liabilities
|
2,388
|
1,865
|
|
Casualty, Environmental and Other Reserves
|
553
|
547
|
|
Long-term Debt
|
7,372
|
7,895
|
|
Deferred Income Taxes
|
6,668
|
6,585
|
|
Other Long-term Liabilities
|
1,327
|
1,284
|
|
Total Liabilities
|
18,308
|
18,176
|
|
Common Stock, $1 Par Value
|
389
|
393
|
|
Other Capital
|
-
|
80
|
|
Retained Earnings
|
9,279
|
9,182
|
|
Accumulated Other Comprehensive Loss
|
(798)
|
(809)
|
|
Noncontrolling Interest
|
15
|
14
|
|
Total Shareholders' Equity
|
8,885
|
8,860
|
|
Total Liabilities and Shareholders' Equity
|
$27,193
|
$27,036
|
4
|
CSX Corporation
|
||
|
CONSOLIDATED CASH FLOW STATEMENTS
|
||
|
(Dollars in Millions)
|
||
|
(Unaudited)
|
||
|
Quarters Ended
|
||
|
Mar. 26,
|
Mar. 27,
|
|
|
2010
|
2009
|
|
|
OPERATING ACTIVITIES
|
||
|
Net Earnings
|
$306
|
$246
|
|
Adjustments to Reconcile Net Earnings to Net Cash Provided
|
||
|
by Operating Activities:
|
||
|
Depreciation
|
229
|
224
|
|
Deferred Income Taxes
|
47
|
79
|
|
Other Operating Activities
|
64
|
(65)
|
|
Changes in Operating Assets and Liabilities:
|
||
|
Accounts Receivable
|
24
|
132
|
|
Other Current Assets
|
(35)
|
(76)
|
|
Accounts Payable
|
(26)
|
(36)
|
|
Income and Other Taxes Payable
|
125
|
31
|
|
Other Current Liabilities
|
12
|
(86)
|
|
Net Cash Provided by Operating Activities
|
746
|
449
|
|
INVESTING ACTIVITIES
|
||
|
Property Additions (a)
|
(331)
|
(309)
|
|
Other Investing Activities
|
18
|
37
|
|
Net Cash Used in Investing Activities
|
(313)
|
(272)
|
|
FINANCING ACTIVITIES
|
||
|
Long-term Debt Issued
|
-
|
500
|
|
Long-term Debt Repaid
|
(17)
|
(26)
|
|
Dividends Paid
|
(93)
|
(86)
|
|
Stock Options Exercised
|
6
|
2
|
|
Shares Repurchased
|
(229)
|
-
|
|
Other Financing Activities (a)(b)
|
(137)
|
(180)
|
|
Net Cash Provided by Financing Activities
|
(470)
|
210
|
|
Net Increase in Cash and Cash Equivalents
|
(37)
|
387
|
|
CASH AND CASH EQUIVALENTS
|
||
|
Cash and Cash Equivalents at Beginning of Period
|
1,029
|
669
|
|
Cash and Cash Equivalents at End of Period
|
$992
|
$1,056
|
|
(a)
|
In addition to property additions shown above in investing activities, capital expenditures for 2009 included purchases of new assets using seller financing of approximately $160 million, for which payments are included in other financing activities on the consolidated cash flow statements. There were no purchases of new assets under seller financing agreements during first quarter 2010.
|
|
(b)
|
In first quarter 2010, other financing activities included $141 million paid as cash consideration to exchange higher interest rate debt for lower interest rate debt.
|
5
|
RESULTS OF OPERATIONS (Unaudited)
|
|||||||||
|
(Dollars in Millions)
|
|||||||||
|
Quarters Ended March 26, 2010 and March 27, 2009
|
|||||||||
|
CSX
|
|||||||||
|
Rail (a)
|
Intermodal
|
Consolidated
|
|||||||
|
2010
|
2009
|
2010
|
2009
|
2010
|
2009
|
$ Change
|
% Change
|
||
|
Revenue
|
$2,168
|
$1,977
|
$323
|
$270
|
$2,491
|
$2,247
|
$244
|
11
|
%
|
|
Expense
|
|||||||||
|
Labor and Fringe
|
710
|
644
|
19
|
18
|
729
|
662
|
(67)
|
(10)
|
|
|
Materials, Supplies and Other
|
403
|
432
|
50
|
45
|
453
|
477
|
24
|
5
|
|
|
Fuel
|
282
|
190
|
1
|
1
|
283
|
191
|
(92)
|
(48)
|
|
|
Depreciation
|
223
|
218
|
6
|
6
|
229
|
224
|
(5)
|
(2)
|
|
|
Equipment and Other Rents
|
71
|
88
|
29
|
25
|
100
|
113
|
13
|
12
|
|
|
Inland Transportation
|
(116)
|
(93)
|
179
|
151
|
63
|
58
|
(5)
|
(9)
|
|
|
Total Expense
|
1,573
|
1,479
|
284
|
246
|
1,857
|
1,725
|
(132)
|
(8)
|
|
|
Operating Income
|
$595
|
$498
|
$39
|
$24
|
$634
|
$522
|
$112
|
21
|
%
|
|
Operating Ratio
|
72.6%
|
74.8%
|
87.9%
|
91.1%
|
74.5%
|
76.8%
|
|||
|
(a)
|
In addition to CSX Transportation, Inc., the Rail segment includes non-railroad subsidiaries such as Total Distribution Services, Inc., Transflo Terminal Services, Inc., CSX Technology, Inc. and other subsidiaries.
|
6
|
VOLUME AND REVENUE (Unaudited)
|
|||||||||||||||
|
Volume (Thousands of Units); Revenue (Dollars in Millions); Revenue Per Unit (Dollars)
|
|||||||||||||||
|
Quarters Ended March 26, 2010 and March 27, 2009
|
|||||||||||||||
|
Volume
|
Revenue
|
Revenue Per Unit
|
|||||||||||||
|
2010
|
2009
|
% Change
|
2010
|
2009
|
% Change
|
2010
|
2009
|
% Change
|
|||||||
|
Chemicals
|
112
|
105
|
7
|
%
|
$351
|
$308
|
14
|
%
|
$3,134
|
$2,933
|
7
|
%
|
|||
|
Emerging Markets
|
85
|
91
|
(7)
|
130
|
134
|
(3)
|
1,529
|
1,473
|
4
|
||||||
|
Forest Products
|
63
|
65
|
(3)
|
140
|
140
|
-
|
2,222
|
2,154
|
3
|
||||||
|
Agricultural Products
|
114
|
109
|
5
|
267
|
249
|
7
|
2,342
|
2,284
|
3
|
||||||
|
Metals
|
61
|
48
|
27
|
128
|
97
|
32
|
2,098
|
2,021
|
4
|
||||||
|
Phosphates and Fertilizers
|
79
|
60
|
32
|
123
|
87
|
41
|
1,557
|
1,450
|
7
|
||||||
|
Food and Consumer
|
25
|
25
|
-
|
59
|
60
|
(2)
|
2,360
|
2,400
|
(2)
|
||||||
|
Total Merchandise
|
539
|
503
|
7
|
1,198
|
1,075
|
11
|
2,223
|
2,137
|
4
|
||||||
|
Coal
|
354
|
415
|
(15)
|
701
|
713
|
(2)
|
1,980
|
1,718
|
15
|
||||||
|
Coke and Iron Ore
|
19
|
16
|
19
|
35
|
31
|
13
|
1,842
|
1,938
|
(5)
|
||||||
|
Total Coal
|
373
|
431
|
(13)
|
736
|
744
|
(1)
|
1,973
|
1,726
|
14
|
||||||
|
Automotive
|
74
|
45
|
64
|
170
|
95
|
79
|
2,297
|
2,111
|
9
|
||||||
|
Other
|
-
|
-
|
-
|
64
|
63
|
2
|
-
|
-
|
-
|
||||||
|
Total Rail
|
986
|
979
|
1
|
2,168
|
1,977
|
10
|
2,199
|
2,019
|
9
|
||||||
|
Domestic
|
281
|
254
|
11
|
217
|
184
|
18
|
772
|
724
|
7
|
||||||
|
International
|
219
|
186
|
18
|
102
|
83
|
23
|
466
|
446
|
4
|
||||||
|
Other
|
-
|
-
|
-
|
4
|
3
|
33
|
-
|
-
|
-
|
||||||
|
Total Intermodal
|
500
|
440
|
14
|
323
|
270
|
20
|
646
|
614
|
5
|
||||||
|
Total
|
1,486
|
1,419
|
5
|
%
|
$2,491
|
$2,247
|
11
|
%
|
$1,676
|
$1,584
|
6
|
%
|
|||
7
CSX Corporation
REVENUE
CSX first quarter results reflect strong year-over-year volume and revenue growth as a result of the gradual and steady growth in the economy as compared to the level of economic activity last year. The greatest volume increases occurred in the automotive, phosphates, metals, and intermodal markets. Ongoing yield management initiatives and higher fuel recovery associated with the increase in fuel prices drove revenue-per-unit increases in most markets. These gains more than offset continued weakness in utility coal and construction related markets.
Rail
Merchandise
Chemicals – Volume growth was primarily driven by increased shipments of plastics due to the improvement in demand from the automotive and consumer goods markets, and by growth in shipments of fractionating sand used in natural gas drilling.
Emerging Markets, Forest Products, and Food and Consumer – Volume weakness in building products, appliances, aggregates (which include crushed stone, sand and gravel) was due to the continued softness in residential construction.
Agricultural Products - Volume growth was due to increased shipments of feed ingredients to export markets, driven by greater global demand for meat products. In addition, domestic volume increased as a result of continued growth in the ethanol market.
Metals – Strong volume growth was driven by rebounding steel consumption consistent with the ongoing economic recovery. Improving demand from automotive and energy markets, combined with low inventories pushed domestic steel production higher.
Phosphates and Fertilizers – Significant volume growth occurred in the quarter with increased production to meet both export and domestic demand as buyers rebuilt inventories of fertilizer in anticipation of the spring planting season.
Coal
Revenue and volume declines were driven by lower shipments to utility customers as a result of continued high stockpile levels. This decline was partially offset by growth in the export market due to greater Chinese demand for U.S. metallurgical coal. The increase in revenue per unit was driven by improved yield, longer length of haul, and higher fuel recovery.
Automotive
Strong volume and revenue growth was due to a significant increase in North American light vehicle production driven by an increase in automotive sales.
Intermodal
Domestic – Volume growth was driven by continued strength in truckload conversions and expanded service offerings. Revenue per unit was higher due to increased fuel recovery and a modestly improved competitive truck pricing environment.
International – Volume increased as U.S. inventory replenishments and improving U.S. exports drove significant growth compared to depressed prior year volume. Revenue per unit was higher due to increased fuel recovery and contract price increases.
8
|
|
EXPENSE
|
Expenses increased $132 million from last year’s quarter. Significant variances are described below.
Labor and Fringe expense increased $67 million. This increase was driven by higher incentive compensation, inflation, and several other items. These increases were partially offset by lower staffing levels.
Materials, Supplies and Other expense decreased $24 million. This decrease was primarily driven by insurance and legal recoveries in addition to ongoing benefits from safety improvements.
Fuel expense increased $92 million primarily due to higher prices.
Depreciation expense increased $5 million due to a larger asset base related to higher capital spending, partially offset by lower depreciation rates resulting from the previous periodic review of asset useful lives.
Equipment and Other Rents expense decreased $13 million primarily due to current quarter’s cost savings associated with improved asset utilization and higher prior year settlement expenses with other railroads. These decreases were partially offset by increased rents due to higher volume.
Inland Transportation expense increased $5 million primarily due to higher foreign linehaul traffic from increased intermodal volumes.
|
EMPLOYEE COUNTS (Estimated)
|
|||||||||
|
2010
|
2009
|
||||||||
|
Jan
|
Feb
|
Mar
|
Q1
|
Jan
|
Feb
|
Mar
|
Q1
|
Average
|
|
|
2010
|
2010
|
2010
|
Average
|
2009
|
2009
|
2009
|
Average
|
Change
|
|
|
Rail
|
27,639
|
27,749
|
28,101
|
27,830
|
30,347
|
29,444
|
29,038
|
29,610
|
(1,780)
|
|
Intermodal
|
877
|
881
|
879
|
879
|
964
|
952
|
943
|
953
|
(74)
|
|
Technology, Corporate, and Other
|
589
|
604
|
610
|
601
|
609
|
612
|
614
|
612
|
(11)
|
|
Total
|
29,105
|
29,234
|
29,590
|
29,310
|
31,920
|
31,008
|
30,595
|
31,175
|
(1,865)
|
|
FUEL STATISTICS
|
|||
|
Quarters Ended
|
|||
|
Mar. 26,
|
Mar. 27,
|
||
|
2010
|
2009
|
Change
|
|
|
Estimated Locomotive Fuel Consumption (Millions of gallons)
|
120.9
|
119.6
|
(1.3)
|
|
Price Per Gallon (Dollars)
|
$2.11
|
$1.39
|
$(0.72)
|
|
Total Locomotive Fuel Expense (Dollars in millions)
|
$255
|
$166
|
$(89)
|
|
Total Non-Locomotive Fuel Expense (Dollars in millions)
|
28
|
25
|
(3)
|
|
Total Fuel Expense (Dollars in millions)
|
$283
|
$191
|
$(92)
|
OTHER INCOME – NET (Unaudited)
The Company derives income from items that are not considered operating activities. Income from these items is reported net of related expense. Miscellaneous income (expense) includes equity earnings or losses, investment gains and losses, and other non-operating activities, which can be income or expense. Other income – net consisted of the following:
|
Quarters Ended
|
|||
|
Mar. 26,
|
Mar. 27,
|
||
|
(Dollars in Millions)
|
2010
|
2009
|
$ Change
|
|
Interest Income
|
$1
|
$4
|
$(3)
|
|
Income from Real Estate Operations
|
7
|
1
|
6
|
|
Miscellaneous Income (Expense)
|
3
|
(2)
|
5
|
|
Total Other Income - Net
|
$11
|
$3
|
$8
|
9
|
RAIL OPERATING STATISTICS (Estimated)
|
||||
|
Quarters Ended
|
||||
|
Mar. 26,
|
Mar. 27,
|
Improvement
|
||
|
Coal (Millions of Tons)
|
2010
|
2009
|
(Decline) %
|
|
|
Domestic
|
||||
|
Utility
|
29.8
|
37.0
|
(19)
|
%
|
|
Other
|
2.5
|
2.7
|
(7)
|
|
|
Total Domestic
|
32.3
|
39.7
|
(19)
|
|
|
Export
|
7.4
|
6.1
|
21
|
|
|
Total Coal
|
39.7
|
45.8
|
(13)
|
|
|
Coke and Iron Ore
|
1.7
|
1.2
|
42
|
|
|
Total Coal, Coke and Iron Ore
|
41.4
|
47.0
|
(12)
|
%
|
|
Revenue Ton-Miles (Billions)
|
||||
|
Merchandise
|
29.6
|
27.8
|
6
|
%
|
|
Coal
|
19.0
|
20.5
|
(7)
|
|
|
Automotive
|
1.3
|
0.8
|
63
|
|
|
Intermodal
|
4.4
|
4.0
|
10
|
|
|
Total
|
54.3
|
53.1
|
2
|
%
|
|
Gross Ton-Miles (Billions)
|
||||
|
Total Gross Ton-Miles
|
100.3
|
95.7
|
5
|
%
|
|
(Excludes locomotive gross ton-miles)
|
||||
|
Safety and Service Measurements
|
||||
|
FRA Personal Injuries Frequency Index
|
0.81
|
1.30
|
38
|
%
|
|
Number of FRA-reportable injuries per 200,000 man-hours
|
||||
|
FRA Train Accident Rate
|
3.13
|
3.62
|
14
|
%
|
|
Number of FRA-reportable train accidents per million train miles
|
||||
|
On-Time Train Originations
|
69%
|
83%
|
(17)
|
%
|
|
On-Time Destination Arrivals
|
67%
|
79%
|
(15)
|
%
|
|
Dwell (Hours)
|
25.8
|
24.1
|
(7)
|
%
|
|
Cars-On-Line
|
214,845
|
218,863
|
2
|
%
|
|
Train Velocity (Miles per hour)
|
20.9
|
21.6
|
(3)
|
%
|
|
Resources
|
Decrease %
|
|||
|
Route Miles
|
21,189
|
21,178
|
-
|
%
|
|
Locomotives (Owned and long-term leased)
|
4,067
|
4,129
|
(2)
|
%
|
|
Freight Cars (Owned and long-term leased)
|
82,452
|
90,027
|
(8)
|
%
|
10
11