Attached files
| file | filename |
|---|---|
| 8-K - RHB IR PRESENTATION 4Q09 APRIL 7, 2010 - REHABCARE GROUP INC | eightk4q09present4710.htm |
Investor Presentation
Fourth Quarter 2009
Exhibit 99
Company Overview
n Headquartered in St. Louis, Missouri
n Established in 1982
n Largest contract manager of
rehabilitation services in hospitals and
long-term care settings, with nearly
1,300 locations in 41 states
rehabilitation services in hospitals and
long-term care settings, with nearly
1,300 locations in 41 states
n Fourth largest post-acute hospital
operator and third largest long-term
acute care hospital (LTACH) provider
in U.S.
operator and third largest long-term
acute care hospital (LTACH) provider
in U.S.
n Completed acquisition of Triumph
HealthCare, a leading operator of
LTACHs, on Nov. 24, 2009
HealthCare, a leading operator of
LTACHs, on Nov. 24, 2009
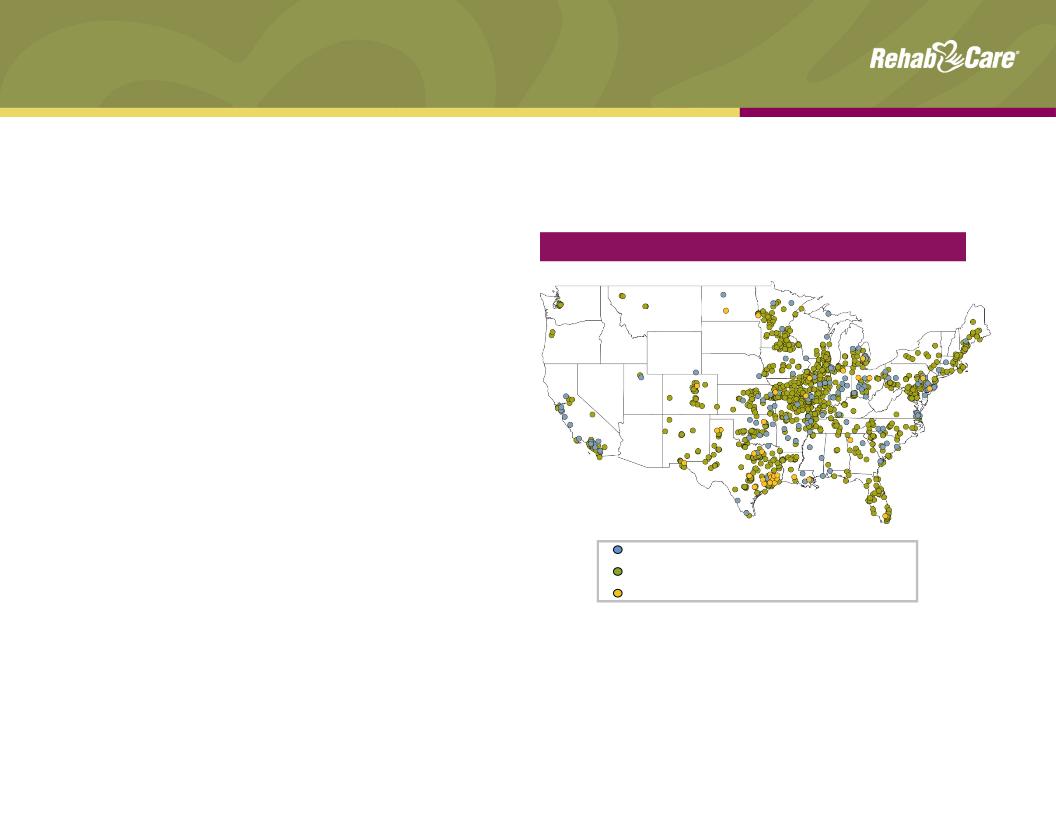
Geographic Presence
Hospital Rehabilitation Services (HRS) Division
Skilled Nursing Rehabilitation Services (SRS) Division
Hospital Division
1

Division Overviews
Skilled Nursing Rehabilitation
Services (SRS)
n $496 mm - 39% of pro forma
revenue
revenue
n 1,118 SNF/long-term care
programs in 37 states
programs in 37 states
n 8.1 mm annual patient visits
n Polaris Group - consulting for
long-term care facilities
long-term care facilities
n VTA Management Services -
therapy and nurse staffing for
New York
therapy and nurse staffing for
New York
$1.3 billion pro forma operating revenues for FYE 2009
Hospital Rehabilitation
Services (HRS)
n $178 mm - 14% of pro forma
revenue
revenue
n 145 hospital-based programs in
32 states
32 states
n 44,000 IRF discharges/year
n 1.3 mm annual outpatient visits
n $588 mm - 47% of pro forma
revenue
revenue
n 28 LTACHs, 6 IRFs; 13 states
n 19 FS LTACHs, 9 HIHs; 4 FS
IRFs, 2 HIHs
IRFs, 2 HIHs
n 1,593 licensed LTACH beds; 243
IRF beds
IRF beds
n 406,000 annual patient days
LTACHs = Long-Term Acute Care Hospitals
IRFs = Inpatient Rehabilitation Facilities
SNFs = Skilled Nursing Facilities
FS = Freestanding
HIH = Hospital in Hospital
Hospital Division
2

13%
Patient Discharge Destination1
LTACH / SNF
IRF
No post-
acute care
acute care
Hospice/Home Health
65%
Acute care
hospital
hospital
3
Market Overview
2MedPAC Data Book, June 2009; does not include Home Health or
Medicare Advantage
Medicare Advantage
3Avalere Health LLC, April 2009; does not include Home Health or
Medicare Advantage
Medicare Advantage
Medicare Post-Acute Spending (in billions)
$
n Large, growing and highly fragmented market
n Positive demographic trends, with first wave of Baby Boomers entering Medicare in 2011
n Medicare expenditures for post-acute services (excluding home health) projected to increase 113%
from 2007 to 2021
from 2007 to 2021
n RehabCare delivers services across the post-acute continuum of care, providing the
most appropriate discharge destination for acute patients
most appropriate discharge destination for acute patients
Projected3
Actual2

Hospital Division
Overview
Overview
Competitive Landscape
1MedPAC, March 2010 Report to the Congress
2Does not include additional Triumph facility scheduled to open April 2010
n Post Triumph merger, RehabCare is the third largest LTACH operator in the U.S., the largest
provider of long-term acute care in Houston and the dominant provider of LTACH services in
9 of its 13 markets
provider of long-term acute care in Houston and the dominant provider of LTACH services in
9 of its 13 markets
n RehabCare pursues joint venture hospital partnerships (nine currently, representing 14
locations) with market-leading acute care providers and physician groups, in addition to its
wholly owned facilities
locations) with market-leading acute care providers and physician groups, in addition to its
wholly owned facilities
Market Size1: 221 IRFs
(Freestanding and HIHs)
Market Size1: 386 LTACHs
IRFs
LTACHs
4
Source: Information available from public filings or
from company websites
from company websites
2
99
95
83
34
23
19
16
14
8
4
Triumph Acquisition
Strategic rationale
Strategic rationale
n Combination provides immediate economies of scale
n Creates stronger, more comprehensive continuum of care, better positioning RehabCare for
potential changes in reimbursement (e.g., bundling)
potential changes in reimbursement (e.g., bundling)
n Additional growth potential through LTACH and IRF development opportunities
n All LTACH business now under Triumph management
n Meaningfully accretive to 2010 EPS; strong cash flow and ability to quickly deleverage
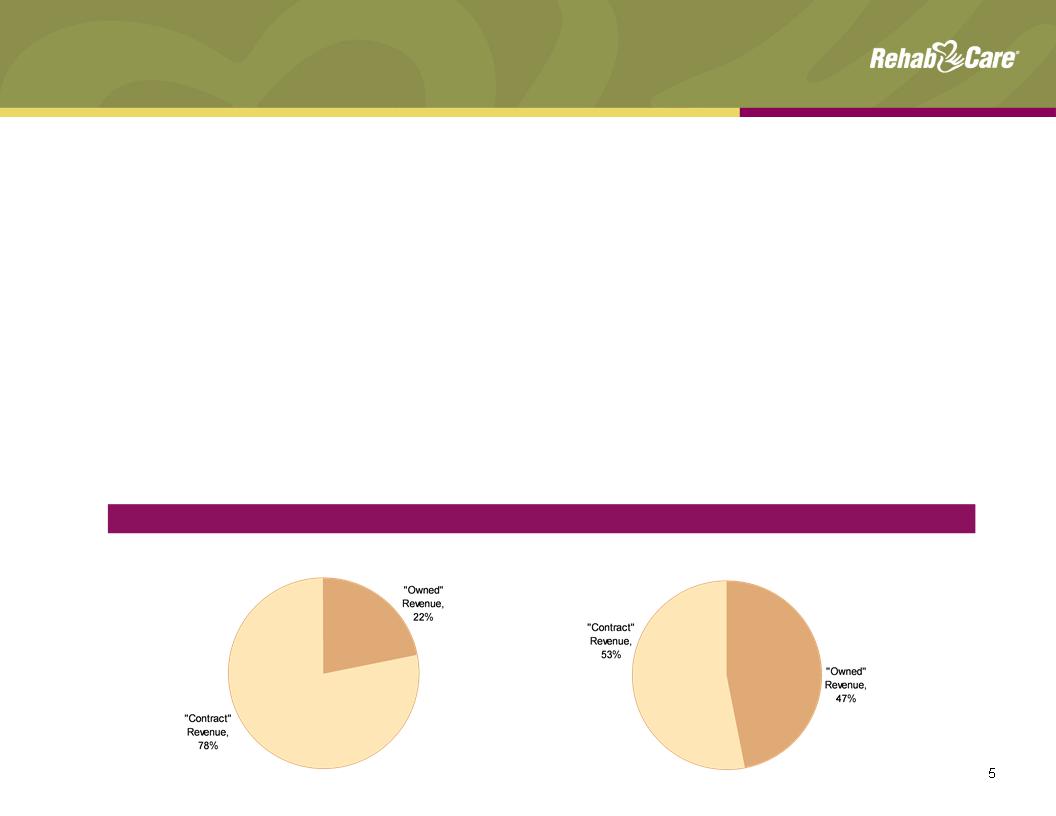
n More diversified business lines, reducing reliance on management contracts for revenue and EBITDA
streams
streams
FYE 2009 “Owned” Revenue vs. “Contract” Revenue
RehabCare
Pro Forma

n Division historically has been impacted by de novo start-up losses and infrastructure investments;
Triumph merger provides level of critical mass as well as ability to adopt proven operational
strengths
Triumph merger provides level of critical mass as well as ability to adopt proven operational
strengths
n Expect total year 2010 revenue of $650.0 - $675.0 mm and EBITDA of $90.0 - $100.0 mm
n Reaffirm breakeven operating earnings run rate for 13 legacy hospitals by the end of the second
quarter of 2010 and breakeven operating earnings for FY2010; Dallas LTACH on track to be
accretive by end of Q210
quarter of 2010 and breakeven operating earnings for FY2010; Dallas LTACH on track to be
accretive by end of Q210
n Triumph impacted by softer volumes and compliance with 25-day length of stay for six hospitals in
Jan. and Feb.; EBITDA margin expected to be at historical level of 18 - 20% in Mar. 2010
Jan. and Feb.; EBITDA margin expected to be at historical level of 18 - 20% in Mar. 2010
Hospital Division
Performance/outlook
Performance/outlook
Operating Earnings ($ in millions)
1Operating earnings excluding start-up & ramp-up losses and transaction and severance related
costs, see Appendix for reconciliation to GAAP
costs, see Appendix for reconciliation to GAAP
2Includes $39.7 million in revenue and operating earnings of $3.7 million generated by Triumph from
11/25/09 - 12/31/09
11/25/09 - 12/31/09
3Includes a $1.5 million pretax charge related to the cancellation of a planned acquisition and
development project
development project
2
New Hospitals: 1 0 1 1 21
4Q2008 1Q2009 2Q2009 3Q2009 4Q2009
6
Revenue ($ in millions) and Patient Days
2
1
3
Skilled Nursing Rehabilitation Services (SRS)
Division overview
Division overview
n Manages rehab programs for SNFs
n Each Medicare-certified SNF is required to provide physical, speech and occupational therapy,
but many lack the know-how and/or scale to effectively manage a program
but many lack the know-how and/or scale to effectively manage a program
n RehabCare provides a compelling value proposition to its SNF partners
n Access to advanced technology platform
n Broader array of services
n Better access to scarce therapist labor pool
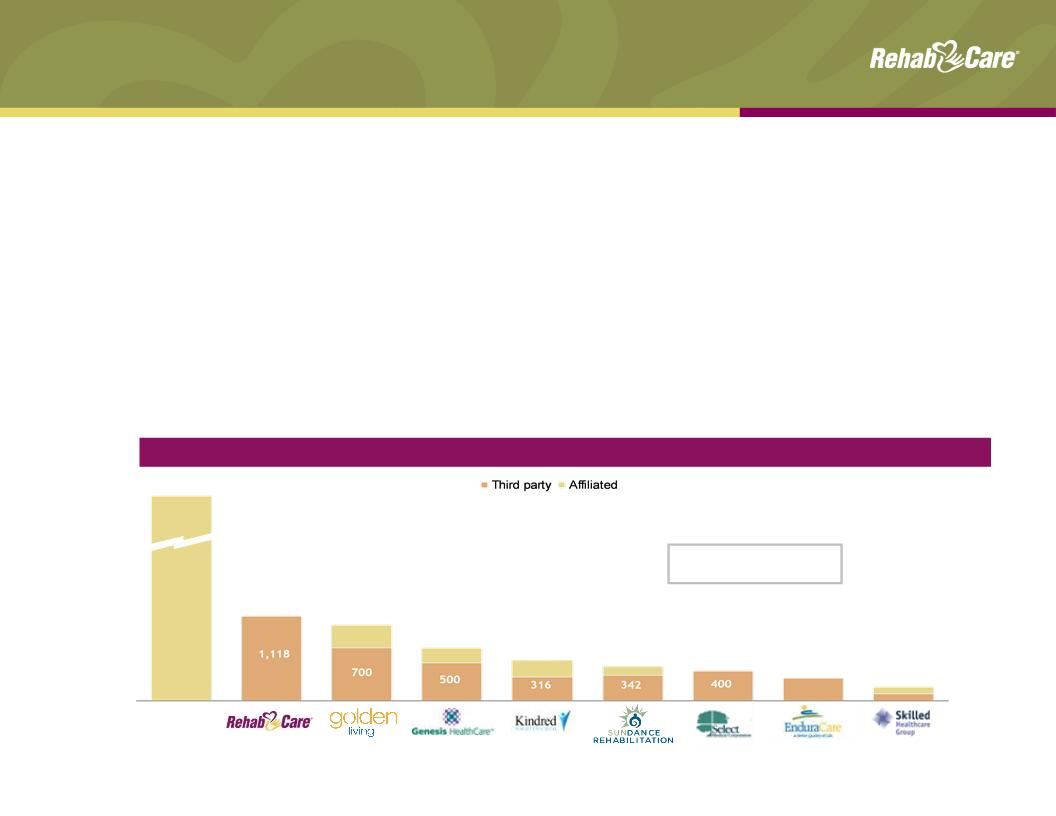
Source: Information available from public filings or from company websites
¹Source: MedPAC Report to Congress, March 2010
Competitive Landscape — # of facilities served
Self-
operated
11,000+
1,118
1,000
700
538
450
400
300
188
Market Size1: 15,000+
Medicare-certified SNFs
Medicare-certified SNFs
7

SRS Division
Performance/outlook
Performance/outlook
Revenue ($ in millions)
Note: Includes Symphony acquisition as of July 1, 2006
1Same store analysis does not include Symphony
% Margin: 5.5% (0.3%) 1.7% 5.6% 7.6%
Operating Earnings ($ in millions)
8
YOY growth: 35.5% 49.9% 24.4% 5.6% 8.5%
Same store: 8.4% 1.0%¹ 7.1%1 12.4% 8.8%
n Significant same store revenue and margin growth since completion of Symphony
integration in 2007
integration in 2007
n Expect 6.5% - 7.5% operating earnings margins for the full year 2010, driven by mid-single
digit year-over-year same store revenue growth (reflects estimated impact of concurrent
therapy rules that go into effect Oct. 1, 2010); 50 to 75 net new units in 2010
digit year-over-year same store revenue growth (reflects estimated impact of concurrent
therapy rules that go into effect Oct. 1, 2010); 50 to 75 net new units in 2010
n First quarter impacted by Part B therapy caps; Senate cleared package of short-term
extenders on Mar. 4, which extended therapy cap exceptions process through Mar. 31,
2010; healthcare reform legislation extends through Dec. 31, 2010
extenders on Mar. 4, which extended therapy cap exceptions process through Mar. 31,
2010; healthcare reform legislation extends through Dec. 31, 2010

RehabCare, 9.1%
Horizon Health, 1.9%
Other, 0.9%
Hospital-based:
Self-op, 69.9%
Other, 9.9%
RehabCare, 0.5%
HealthSouth, 7.8%
Source: Information available from public filings or from
company websites
company websites
1MedPAC March 2010 Report to the Congress
Horizon Health
15.6%
15.6%
Other
9.8%
9.8%
RehabCare
74.6%
74.6%
Freestanding
Hospital-Based
3rd Party
3rd Party
HealthSouth
42.9%
42.9%
Other 54%
RehabCare
3.1%
3.1%
18.2%
11.9%
Hospital Rehabilitation Services (HRS)
Division overview
Division overview
n Manages hospital-based inpatient and outpatient therapy programs on a contract basis, providing
its partners with:
its partners with:
n Improved clinical outcomes
n Ability to attract ≈ 30% admissions from external sources
n Broader clinical programming (brain, stroke, spinal dysfunction)
n Better access to scarce therapist labor pool
n Better compliance (60% rule, RAC, 3-hour rule)
Market Size1: 1,202
hospital-based and
freestanding IRFs
hospital-based and
freestanding IRFs
9

10
HRS Division
Performance/outlook
Performance/outlook
n Revenue and earnings declined due to implementation of 75% Rule in 2004; freeze of rule
at 60% in January 2008 gave runway for revenue growth
at 60% in January 2008 gave runway for revenue growth
n Expect 15% - 17% operating earnings margin and 2 - 4% year-over-year growth in IRF
same store discharges for the full year 2010; unit count expected to decrease in first half of
year with recovery in second, resulting in flat unit growth for year
same store discharges for the full year 2010; unit count expected to decrease in first half of
year with recovery in second, resulting in flat unit growth for year
¹Includes $1.2 mm pretax charge from a bad debt write-down related to an
outpatient transaction
outpatient transaction
Revenue ($ in millions)
CAGR: (1.6%)
YOY growth: (0.5%) (5.3%) (8.7%) 0.9% 7.6%
IRFs: 120 115 107 113 106
Operating Earnings ($ in millions)
% Margin: 11.9% 13.2% 14.0% 13.3% 16.6%
1
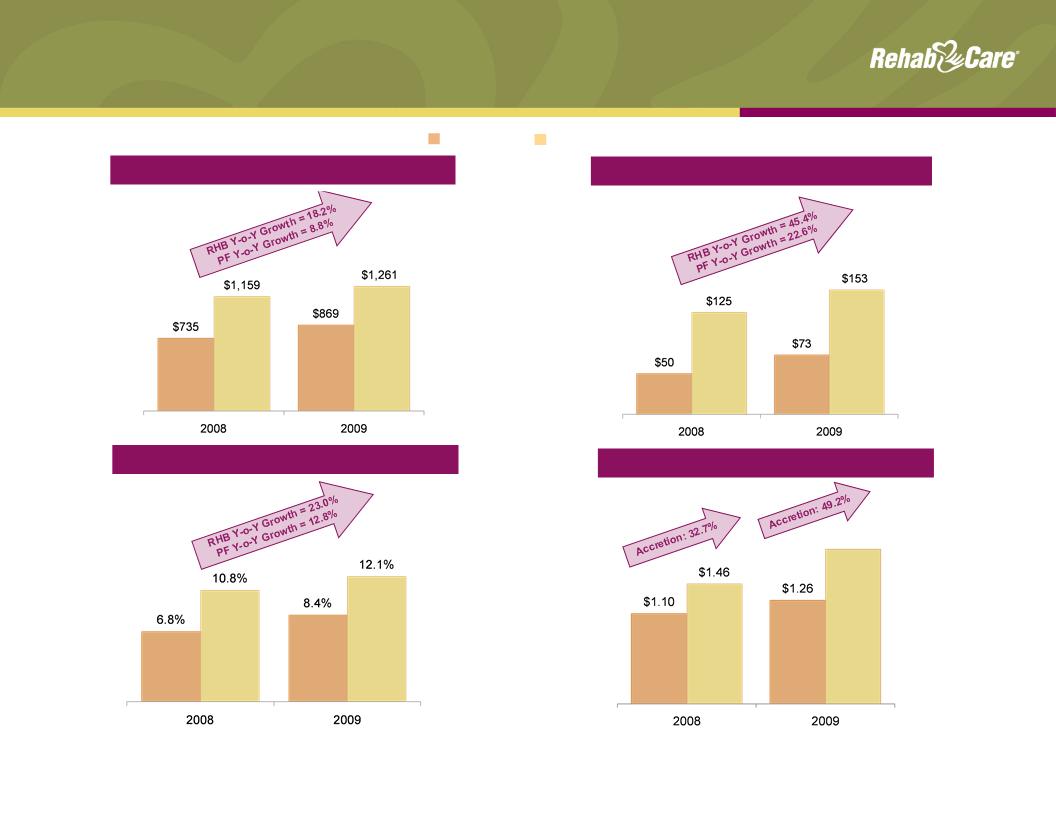
Standalone and Pro Forma
Historical Key Financials
Historical Key Financials
Pro Forma
RehabCare
Diluted Earnings Per Share³
1RehabCare 2009 historical includes $39.7 million in revenue generated by Triumph;
excluding Triumph, RHB Y-o-Y growth would have been 12.8%
excluding Triumph, RHB Y-o-Y growth would have been 12.8%
2See Appendix for reconciliation to GAAP
3Represents net earnings per share from continuing operations, attributable to
RehabCare
RehabCare
Historical Operating Revenue¹ ($mm)
11
Historical Adjusted EBITDA² ($mm)
Historical Adjusted EBITDA Margin (%)
$1.88
4RehabCare 2009 historical includes transaction and severance related pre-tax
charges of $9.4 mm or $0.38 per diluted share. Pro forma 2009 historical includes
severance and other transaction related pre-tax charges of $10.7 mm or $0.27 per
diluted share. Excluding these charges, 2009 accretion would have been 31.1%.
charges of $9.4 mm or $0.38 per diluted share. Pro forma 2009 historical includes
severance and other transaction related pre-tax charges of $10.7 mm or $0.27 per
diluted share. Excluding these charges, 2009 accretion would have been 31.1%.
4
4

12
Consolidated Pro Forma
Balance Sheet
Balance Sheet
n Cash flow from operations was $48.0 mm for fiscal year 2009 consistent with 2008
n Days sales outstanding improved from 66 days at Dec. 31, 2008 to 60 days at Dec.
31, 2009 excluding Triumph
31, 2009 excluding Triumph
n Expect continued strong operating cash flow with DSO of approximately 60 - 65 days
n Capital expenditures anticipated to be $32.0 mm in 2010, consisting of $12.5 mm of
information system investments; $12.5 mm in expansion projects and $7.0 mm related
to maintenance
information system investments; $12.5 mm in expansion projects and $7.0 mm related
to maintenance
Cash and Cash Equivalents
Total Assets
Total Debt
Stockholders’ Equity
Noncontrolling Interests
Percent of Debt to Total Capital¹
Debt to Pro Forma Adjusted EBITDA²
($mm)
$ 24.7
1,110.0
455.3
437.3
22.3
50%
3.0x
12/31/09
1Total capital represents the sum of debt, stockholders’ equity and noncontrolling interests
2Represents Total Debt plus OID of $8.9 mm divided by 2009 Pro forma Adjusted EBITDA; see Appendix for reconciliation of Pro forma
Adjusted EBITDA to GAAP
Adjusted EBITDA to GAAP

Impact of Healthcare Reform
n Extends LTACH provisions of Medicare, Medicaid and SCHIP Extension Act (MMSEA) of 2007
through Dec. 31, 2012
through Dec. 31, 2012
n Maintains existing status related to 25% Rule and short-stay outliers
n Delays one-time budget neutrality adjustment (estimated at 3.75%)
n Continues moratorium on new LTACH beds while facility criteria is established
n Extends auto exception process for Part B therapy caps through Dec. 31, 2010
n Delays implementation of RUGs IV until Oct. 1, 2011; concurrent therapy rules take effect Oct.
1, 2010
1, 2010
n Establishes negative adjustments to annual market basket calculations for IRFs and LTACHs
of an average 32 bps/year beginning Apr. 1, 2010 through rate year 2019; no market basket
adjustments for SNFs; all sectors subject to productivity adjustments beginning in 2012
of an average 32 bps/year beginning Apr. 1, 2010 through rate year 2019; no market basket
adjustments for SNFs; all sectors subject to productivity adjustments beginning in 2012
n Establishes a national pilot program by 2013 to study effectiveness of bundled payment
system for hospital services, physician services and post-acute care delivered three days prior
to hospitalization through 30 days post-discharge
system for hospital services, physician services and post-acute care delivered three days prior
to hospitalization through 30 days post-discharge
n Implements payment penalties for hospitals with high readmission rates
n Beginning in 2012, allows providers organized as Accountable Care Organizations (ACOs) that
voluntarily meet quality thresholds to share in cost savings achieved in Medicare program
voluntarily meet quality thresholds to share in cost savings achieved in Medicare program
n Prohibits physician ownership of hospitals, effective Dec. 31, 2010, and creates new
transparency, reporting and expansion requirements for “grandfathered” hospitals
transparency, reporting and expansion requirements for “grandfathered” hospitals
13

Strategic Direction
n Enhance focus on clinical outcomes through cutting-edge technology and
commitment to excellence
commitment to excellence
n Advance to next generation in point-of-care technology
n Develop Centers of Excellence
n Provide oversight of clinical quality and outcomes through Quality and Patient
Safety Committee
Safety Committee
n Drive organic growth and continue to explore M&A opportunities in existing
businesses
businesses
n Improve profitability of Hospital division through Triumph merger
n Complete three scheduled hospital expansion projects; explore development
opportunities within Triumph facilities
opportunities within Triumph facilities
n Enhance client value proposition through new product offerings for ACOs,
critical access hospitals, etc.; bundling options and IT solutions
critical access hospitals, etc.; bundling options and IT solutions
n Utilize point-of-service technology to increase speed of referrals/admissions,
strengthen relationships with referrers and optimize performance
strengthen relationships with referrers and optimize performance
14

15
Safe Harbor
Forward-looking statements have been provided pursuant to the safe harbor
provisions of the Private Securities Litigation Reform Act of 1995. Such statements
are based on the Company’s current expectations and could be affected by
numerous factors, risks and uncertainties discussed in the Company’s filings with
the Securities and Exchange Commission, including its most recent annual report
on Form 10-K, subsequent quarterly reports on Form 10-Q and current reports on
Form 8-K. Do not rely on forward looking statements as the Company cannot
predict or control many factors that affect its ability to achieve the results
estimated. The Company makes no promise to update any forward looking
statements whether as a result of changes in underlying factors, new information,
future events or otherwise.

Appendix
16

17
Primary Post-Acute Settings
Overview
Overview
|
|
Long Term Acute Care Hospitals
|
Skilled Nursing Facilities
|
Inpatient Rehab Facilities
|
|
Medicare
Spending 2009 |
$4.6 billion
|
$25.5 billion
(est. $6 billion rehab) |
$5.8 billion
|
|
Patients Served
2008 |
130,869 Medicare discharges
|
2.6 million Medicare admissions
|
370,048 Medicare discharges
|
|
Type of Patient
|
High acuity, at least 25 days
|
Low to moderate acuity, may
require some rehab |
High acuity, requires extensive
rehab (min 3 hrs/day) |
|
Avg. Length of
Stay |
At least 25 days
|
27 days
|
13.2 days
|
|
Medicare
Reimbursement |
LTACH PPS - Receive a single payment
when Medicare beneficiary is discharged for all services rendered |
SNF PPS - Receive a per diem
payment under both Medicare Part A and state Medicaid programs |
IRF PPS- Receive a single
payment when Medicare beneficiary is discharged for all services rendered |
|
Medicare
Requirements |
• Patients must have an average length
of stay of >25 days • 25% rule: no more than 25% of
patients may be referred from a single source (fixed at 50% through 2012) • Moratorium on new LTACH beds until
2013 |
Medicare covers up to 100 days
of SNF care following an acute hospital stay of at least 3 days |
60% Rule: 60% of patients
must satisfy one of 13 defined conditions |
Source: MedPAC
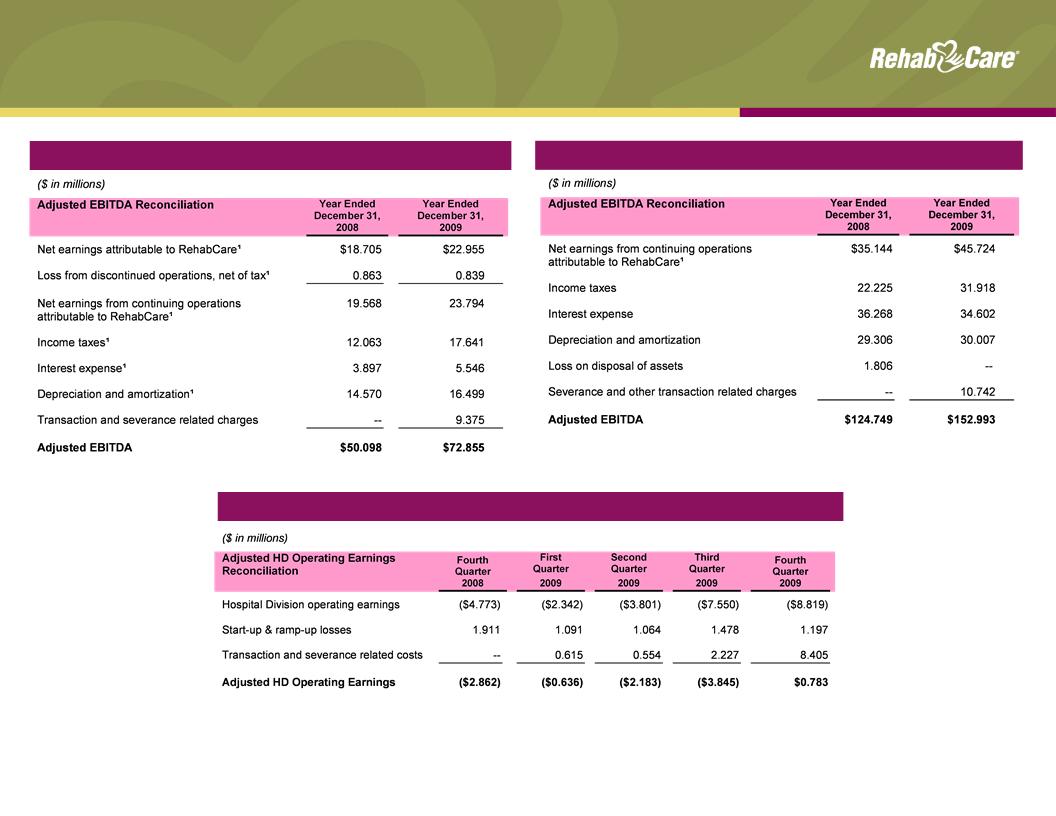
Standalone and Pro Forma Historical
Financial Reconciliations
Financial Reconciliations
RehabCare Adjusted EBITDA
Pro Forma Adjusted EBITDA
1As reflected in the Company’s 2009 Form 10-K financial statements and footnotes
18
Hospital Division Adjusted Operating Earnings