Attached files
| file | filename |
|---|---|
| 8-K - 8-K - RETAIL PROPERTIES OF AMERICA, INC. | a10-7736_18k.htm |
| EX-99.2 - EX-99.2 - RETAIL PROPERTIES OF AMERICA, INC. | a10-7736_1ex99d2.htm |
Exhibit 99.1
|
|
2009 Year-End Update |
|
|
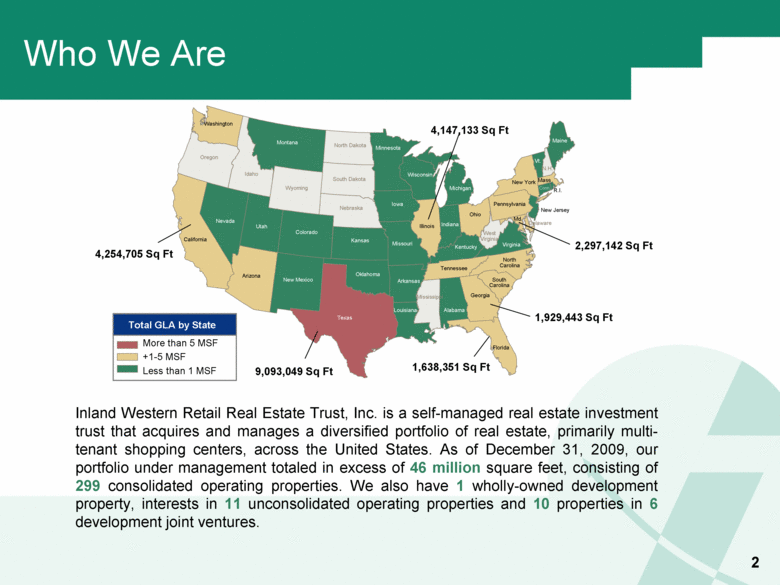
Who We Are 4,254,705 Sq Ft 9,093,049 Sq Ft 1,929,443 Sq Ft 1,638,351 Sq Ft 4,147,133 Sq Ft 2,297,142 Sq Ft Alabama Arizona Arkansas California Colorado Conn. Delaware Florida Georgia Idaho Illinois Indiana Iowa Kansas Kentucky Louisiana Maine Md. Mass. Michigan Minnesota Mississippi Missouri Montana Nebraska Nevada N.H. New Jersey New Mexico New York North Carolina North Dakota Ohio Oklahoma Oregon Pennsylvania R.I. South Carolina South Dakota Tennessee Texas Utah Vt. Virginia Washington West Virginia Wisconsin Wyoming More than 5 MSF +1-5 MSF Less than 1 MSF Total GLA by State 2 Inland Western Retail Real Estate Trust, Inc. is a self-managed real estate investment trust that acquires and manages a diversified portfolio of real estate, primarily multi-tenant shopping centers, across the United States. As of December 31, 2009, our portfolio under management totaled in excess of 46 million square feet, consisting of 299 consolidated operating properties. We also have 1 wholly-owned development property, interests in 11 unconsolidated operating properties and 10 properties in 6 development joint ventures. |
|
|
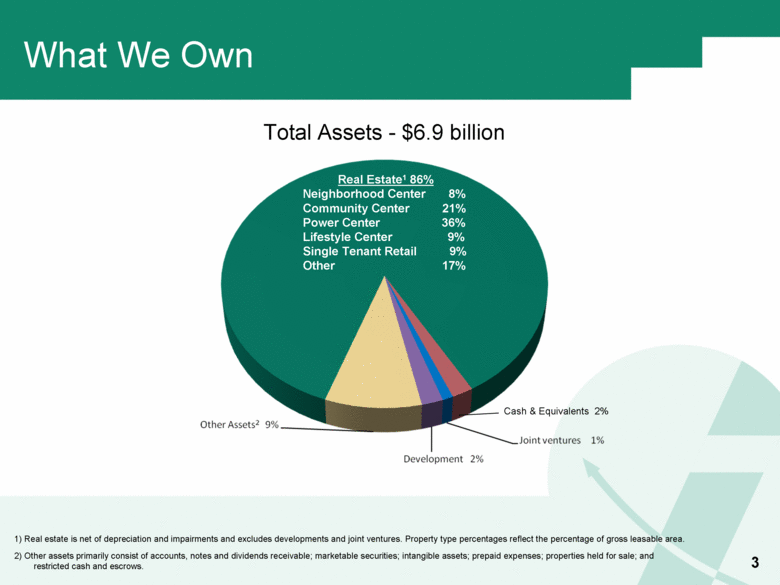
What We Own Total Assets - $6.9 billion 1) Real estate is net of depreciation and impairments and excludes developments and joint ventures. Property type percentages reflect the percentage of gross leasable area. 2) Other assets primarily consist of accounts, notes and dividends receivable; marketable securities; intangible assets; prepaid expenses; properties held for sale; and restricted cash and escrows. Real Estate1 86% Neighborhood Center 8% Community Center 21% Power Center 36% Lifestyle Center 9% Single Tenant Retail 9% Other 17% Cash & Equivalents 2% 3 |
|
|
Our Business Strategy From inception, our strategy has been to: Acquire and manage a portfolio comprised of strategically located assets with tenants who are predominantly credit-rated, value-oriented, necessity-based retailers. Diversify by geography, retail property type and tenant to mitigate risk and exposure to any one segment. Maintain a conservative balance sheet with limited corporate-level debt. The majority of our debt is comprised of individual mortgage loans. Incorporate a disciplined asset management including regular review of portfolio to proactively identify issues and opportunities. 4 |
|
|
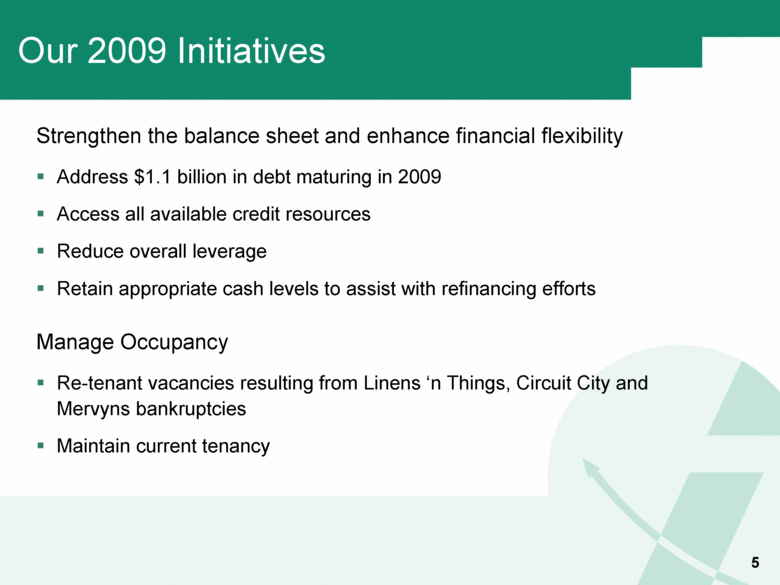
Our 2009 Initiatives Strengthen the balance sheet and enhance financial flexibility Address $1.1 billion in debt maturing in 2009 Access all available credit resources Reduce overall leverage Retain appropriate cash levels to assist with refinancing efforts Manage Occupancy Re-tenant vacancies resulting from Linens ‘n Things, Circuit City and Mervyns bankruptcies Maintain current tenancy 5 |
|
|
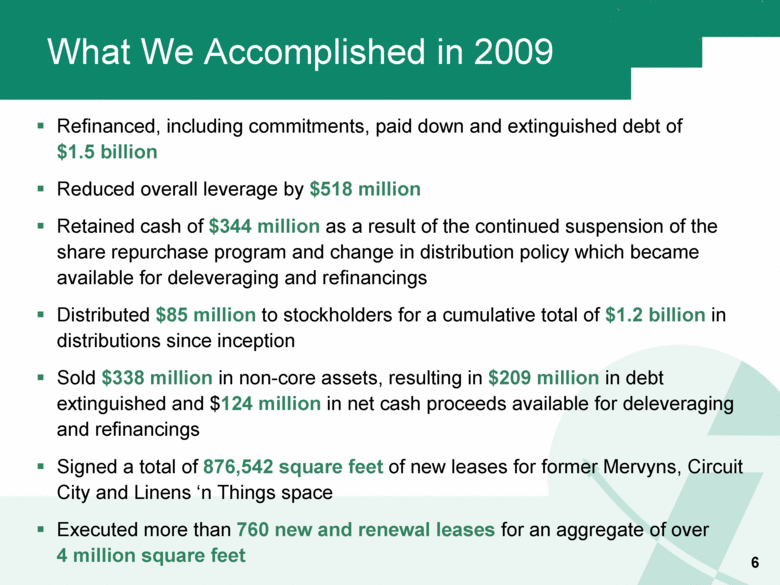
What We Accomplished in 2009 Refinanced, including commitments, paid down and extinguished debt of $1.5 billion Reduced overall leverage by $518 million Retained cash of $344 million as a result of the continued suspension of the share repurchase program and change in distribution policy which became available for deleveraging and refinancings Distributed $85 million to stockholders for a cumulative total of $1.2 billion in distributions since inception Sold $338 million in non-core assets, resulting in $209 million in debt extinguished and $124 million in net cash proceeds available for deleveraging and refinancings Signed a total of 876,542 square feet of new leases for former Mervyns, Circuit City and Linens ‘n Things space Executed more than 760 new and renewal leases for an aggregate of over 4 million square feet 6 |
|
|
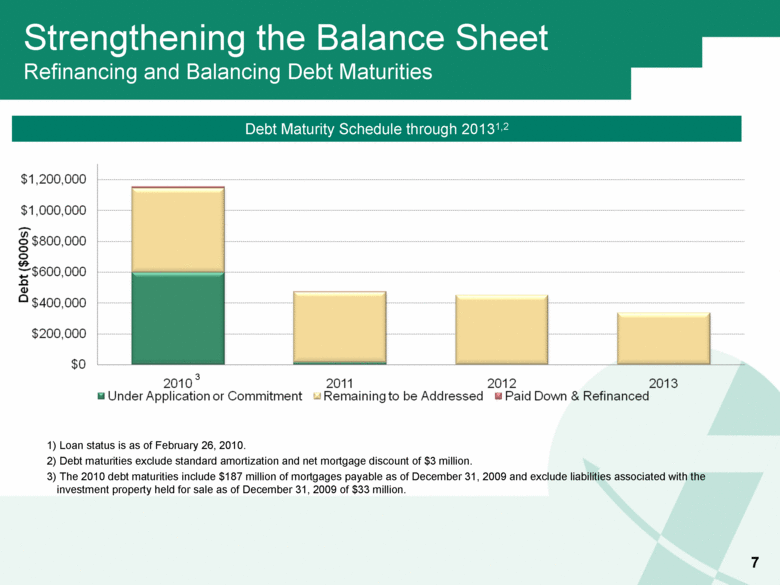
Strengthening the Balance Sheet Refinancing and Balancing Debt Maturities 1) Loan status is as of February 26, 2010. 2) Debt maturities exclude standard amortization and net mortgage discount of $3 million. 3) The 2010 debt maturities include $187 million of mortgages payable as of December 31, 2009 and exclude liabilities associated with the investment property held for sale as of December 31, 2009 of $33 million. Debt Maturity Schedule through 20131,2 3 7 |
|
|
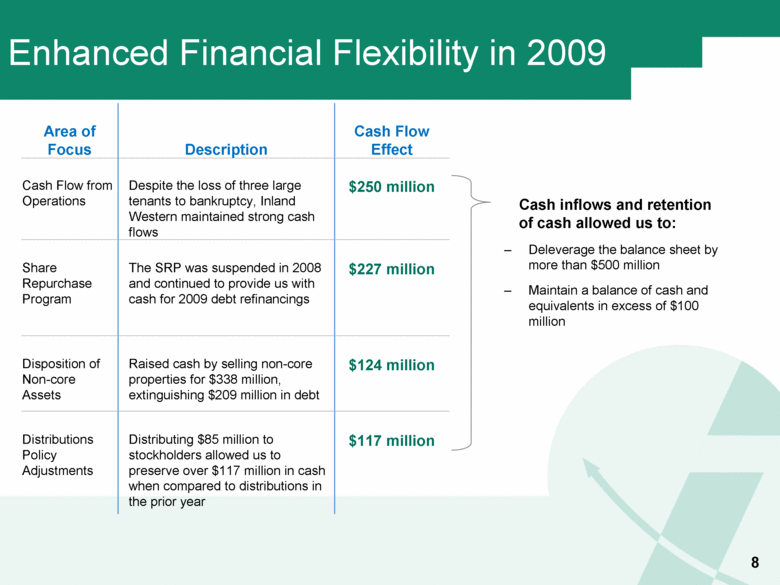
Enhanced Financial Flexibility in 2009 Cash inflows and retention of cash allowed us to: Deleverage the balance sheet by more than $500 million Maintain a balance of cash and equivalents in excess of $100 million Area of Focus Description Cash Flow Effect Cash Flow from Operations Despite the loss of three large tenants to bankruptcy, Inland Western maintained strong cash flows $250 million Share Repurchase Program The SRP was suspended in 2008 and continued to provide us with cash for 2009 debt refinancings $227 million Disposition of Non-core Assets Raised cash by selling non-core properties for $338 million, extinguishing $209 million in debt $124 million Distributions Policy Adjustments Distributing $85 million to stockholders allowed us to preserve over $117 million in cash when compared to distributions in the prior year $117 million 8 |
|
|
9 |
|
|
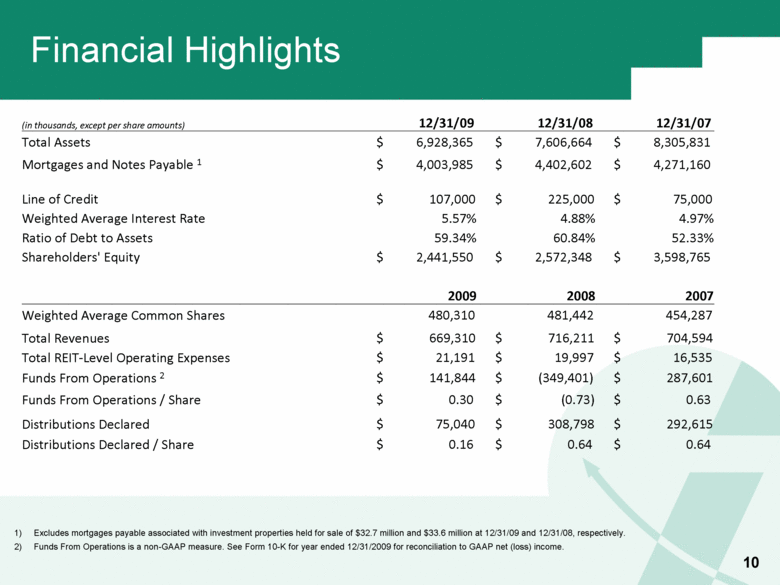
Financial Highlights Excludes mortgages payable associated with investment properties held for sale of $32.7 million and $33.6 million at 12/31/09 and 12/31/08, respectively. Funds From Operations is a non-GAAP measure. See Form 10-K for year ended 12/31/2009 for reconciliation to GAAP net (loss) income. 10 (in thousands, except per share amounts) 12/31/09 12/31/08 12/31/07 Total Assets $ 6,928,365 $ 7,606,664 $ 8,305,831 Mortgages and Notes Payable 1 $ 4,003,985 $ 4,402,602 $ 4,271,160 Line of Credit $ 107,000 $ 225,000 $ 75,000 Weighted Average Interest Rate 5.57% 4.88% 4.97% Ratio of Debt to Assets 59.34% 60.84% 52.33% Shareholders' Equity $ 2,441,550 $ 2,572,348 $ 3,598,765 2009 2008 2007 Weighted Average Common Shares 480,310 481,442 454,287 Total Revenues $ 669,310 $ 716,211 $ 704,594 Total REIT-Level Operating Expenses $ 21,191 $ 19,997 $ 16,535 Funds From Operations 2 $ 141,844 $ (349,401) $ 287,601 Funds From Operations / Share $ 0.30 $ (0.73) $ 0.63 Distributions Declared $ 75,040 $ 308,798 $ 292,615 Distributions Declared / Share $ 0.16 $ 0.64 $ 0.64 |
|
|
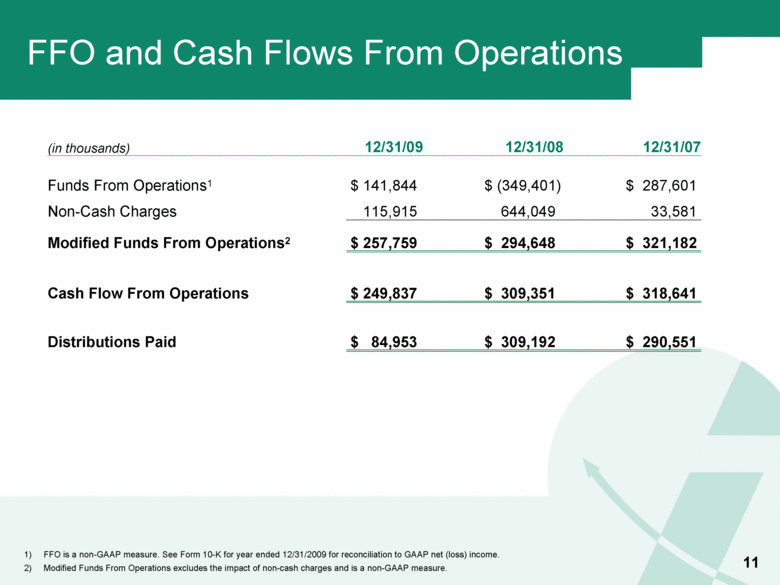
FFO and Cash Flows From Operations FFO is a non-GAAP measure. See Form 10-K for year ended 12/31/2009 for reconciliation to GAAP net (loss) income. Modified Funds From Operations excludes the impact of non-cash charges and is a non-GAAP measure. (in thousands) 12/31/09 12/31/08 12/31/07 Funds From Operations1 $ 141,844 $ (349,401) $ 287,601 Non-Cash Charges 115,915 644,049 33,581 Modified Funds From Operations2 $ 257,759 $ 294,648 $ 321,182 Cash Flow From Operations $ 249,837 $ 309,351 $ 318,641 Distributions Paid $ 84,953 $ 309,192 $ 290,551 11 |
|
|
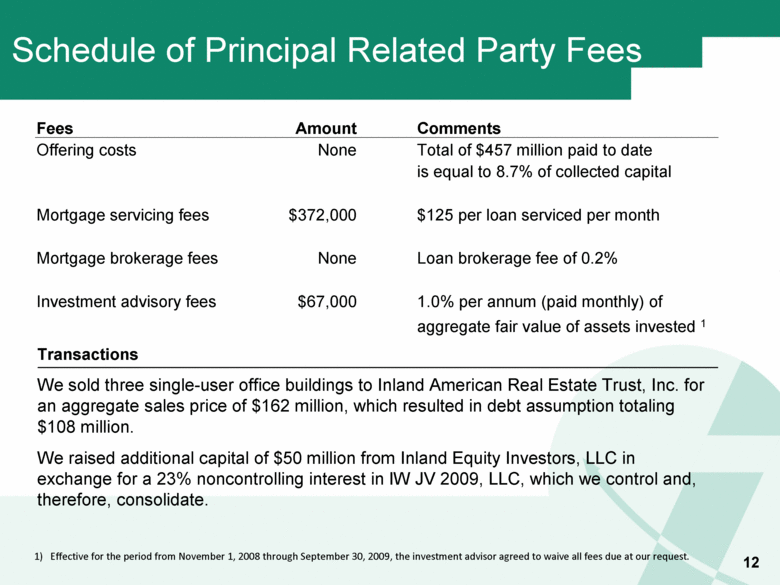
Schedule of Principal Related Party Fees 1) Effective for the period from November 1, 2008 through September 30, 2009, the investment advisor agreed to waive all fees due at our request. Transactions We sold three single-user office buildings to Inland American Real Estate Trust, Inc. for an aggregate sales price of $162 million, which resulted in debt assumption totaling $108 million. We raised additional capital of $50 million from Inland Equity Investors, LLC in exchange for a 23% noncontrolling interest in IW JV 2009, LLC, which we control and, therefore, consolidate. Fees Amount Comments Offering costs None Total of $457 million paid to date is equal to 8.7% of collected capital Mortgage servicing fees $372,000 $125 per loan serviced per month Mortgage brokerage fees None Loan brokerage fee of 0.2% Investment advisory fees $67,000 1.0% per annum (paid monthly) of aggregate fair value of assets invested 1 12 |
|
|
13 |
|
|
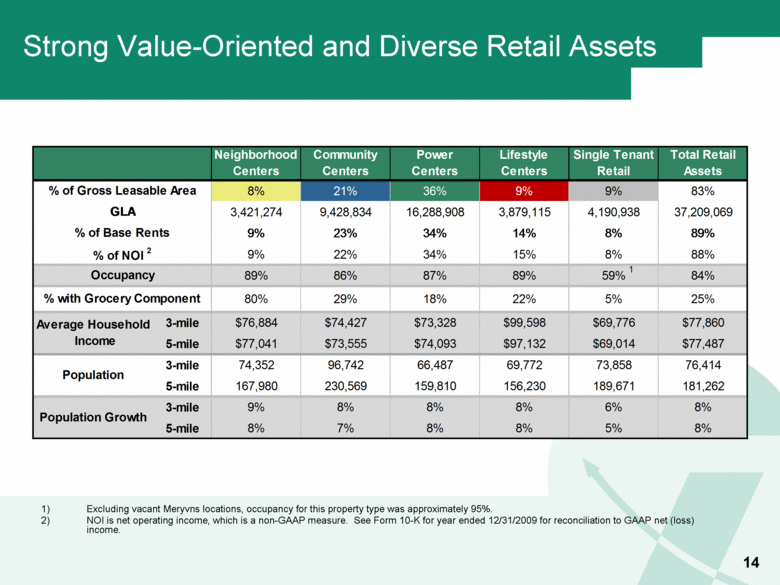
Strong Value-Oriented and Diverse Retail Assets Excluding vacant Meryvns locations, occupancy for this property type was approximately 95%. NOI is net operating income, which is a non-GAAP measure. See Form 10-K for year ended 12/31/2009 for reconciliation to GAAP net (loss) income. 14 Neighborhood Centers Community Centers Power Centers Lifestyle Centers Single Tenant Retail Total Retail Assets 8% 21% 36% 9% 9% 83% 3,421,274 9,428,834 16,288,908 3,879,115 4,190,938 37,209,069 9% 23% 34% 14% 8% 89% 9% 22% 34% 15% 8% 88% 89% 86% 87% 89% 59% 84% 80% 29% 18% 22% 5% 25% 3-mile $76,884 $74,427 $73,328 $99,598 $69,776 $77,860 5-mile $77,041 $73,555 $74,093 $97,132 $69,014 $77,487 3-mile 74,352 96,742 66,487 69,772 73,858 76,414 5-mile 167,980 230,569 159,810 156,230 189,671 181,262 3-mile 9% 8% 8% 8% 6% 8% 5-mile 8% 7% 8% 8% 5% 8% Average Household Income Population Growth Population % of Gross Leasable Area % of Base Rents % of NOI 2 Occupancy % with Grocery Component GLA 1 |
|
|
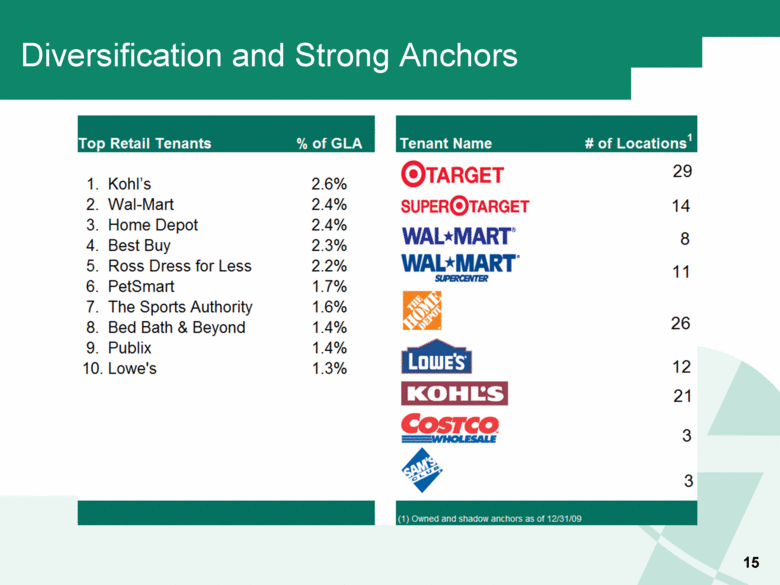
Diversification and Strong Anchors 15 |
|
|
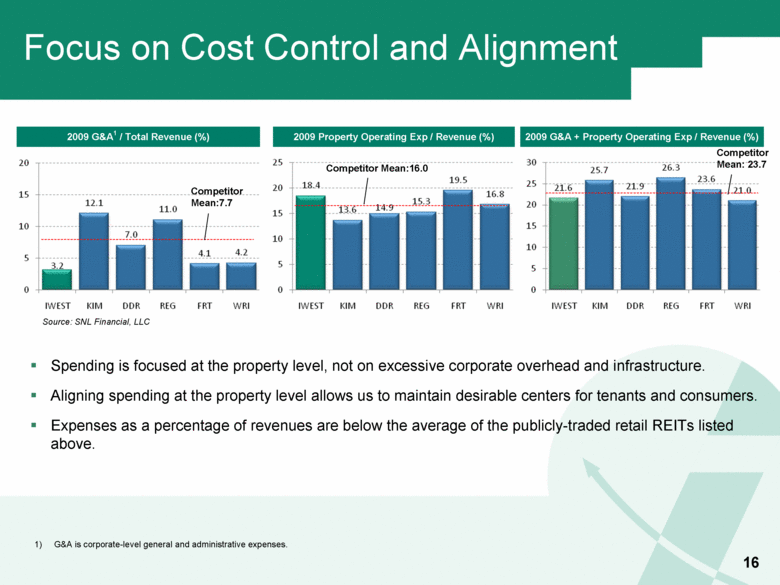
Focus on Cost Control and Alignment 2009 G&A + Property Operating Exp / Revenue (%) 2009 Property Operating Exp / Revenue (%) 2009 G&A1 / Total Revenue (%) G&A is corporate-level general and administrative expenses. Source: SNL Financial, LLC Spending is focused at the property level, not on excessive corporate overhead and infrastructure. Aligning spending at the property level allows us to maintain desirable centers for tenants and consumers. Expenses as a percentage of revenues are below the average of the publicly-traded retail REITs listed above. CompetitorMean:7.7 Competitor Mean:16.0 Competitor Mean: 23.7 16 |
|
|
Award Winning Innovative Marketing Programs Benefit Retailers and Consumers Inland Western’s marketing team partners with retailers and community groups to create one of a kind marketing programs that drive traffic, enhance retail sales and make an impact on the community. The marketing team was recognized by the International Council of Shopping Centers with 7 Silver Maxi awards for its innovative events and programs in 2009. 17 |
|
|
18 |
|
|
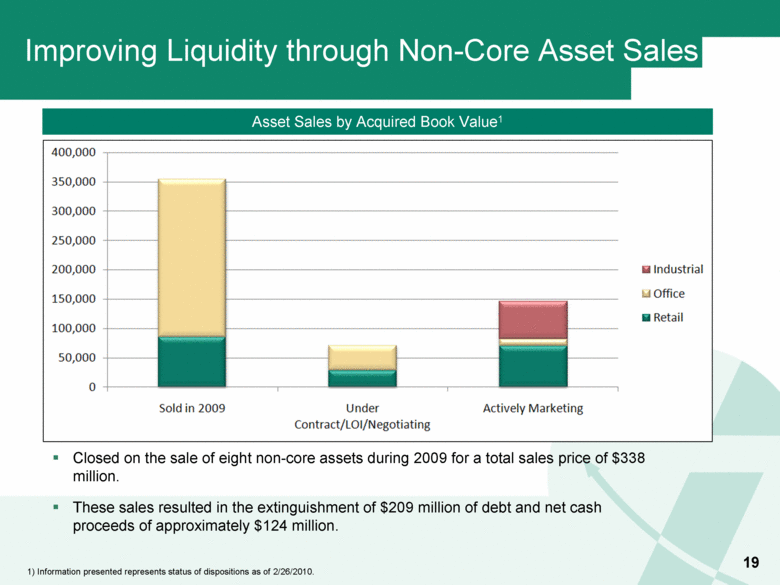
Closed on the sale of eight non-core assets during 2009 for a total sales price of $338 million. These sales resulted in the extinguishment of $209 million of debt and net cash proceeds of approximately $124 million. Improving Liquidity through Non-Core Asset Sales 1) Information presented represents status of dispositions as of 2/26/2010. Asset Sales by Acquired Book Value1 19 |
|
|
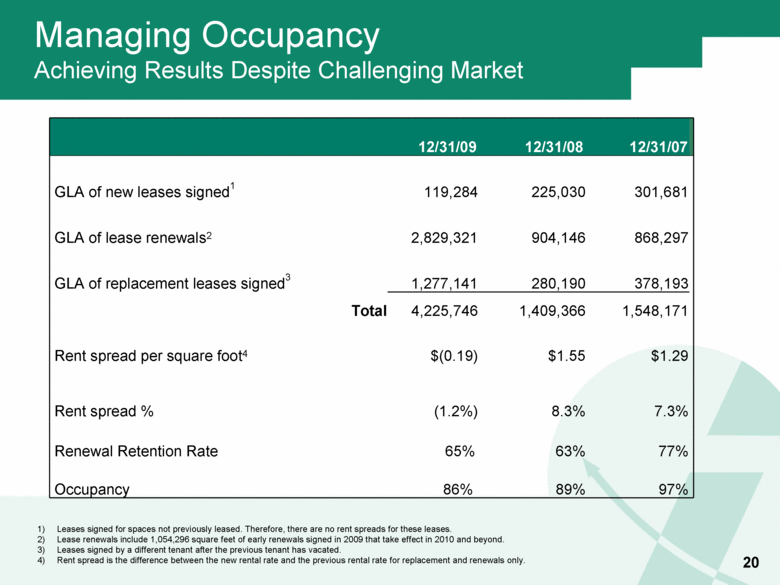
Managing Occupancy Achieving Results Despite Challenging Market Leases signed for spaces not previously leased. Therefore, there are no rent spreads for these leases. Lease renewals include 1,054,296 square feet of early renewals signed in 2009 that take effect in 2010 and beyond. Leases signed by a different tenant after the previous tenant has vacated. Rent spread is the difference between the new rental rate and the previous rental rate for replacement and renewals only. 12/31/09 12/31/08 12/31/07 GLA of new leases signed1 119,284 225,030 301,681 GLA of lease renewals2 2,829,321 904,146 868,297 GLA of replacement leases signed3 1,277,141 280,190 378,193 Total 4,225,746 1,409,366 1,548,171 Rent spread per square foot4 $(0.19) $1.55 $1.29 Rent spread % (1.2%) 8.3% 7.3% Renewal Retention Rate 65% 63% 77% Occupancy 86% 89% 97% 20 |
|
|
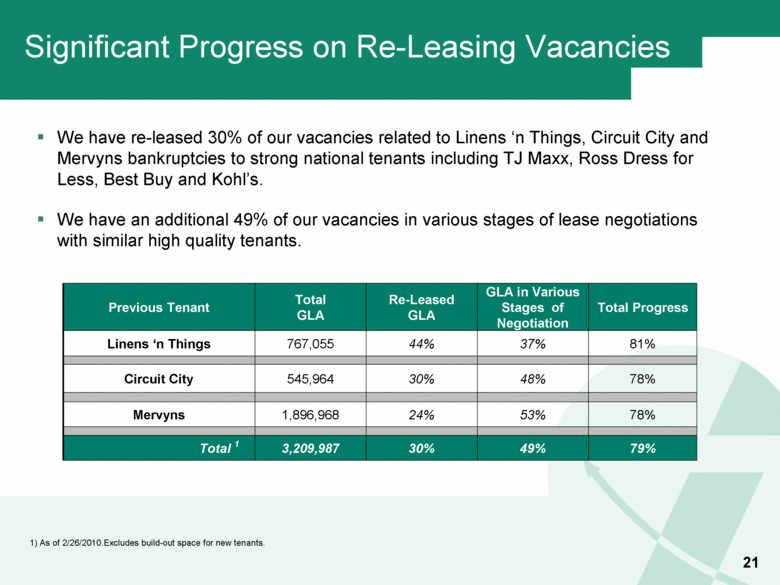
Significant Progress on Re-Leasing Vacancies We have re-leased 30% of our vacancies related to Linens ‘n Things, Circuit City and Mervyns bankruptcies to strong national tenants including TJ Maxx, Ross Dress for Less, Best Buy and Kohl’s. We have an additional 49% of our vacancies in various stages of lease negotiations with similar high quality tenants. Previous Tenant Total GLA Re-Leased GLA GLA in Various Stages of Negotiation Total Progress Linens ‘n Things 767,055 44% 37% 81% Circuit City 545,964 30% 48% 78% Mervyns 1,896,968 24% 53% 78% Total 1 3,209,987 30% 49% 79% 1) As of 2/26/2010.Excludes build-out space for new tenants. 21 |
|
|
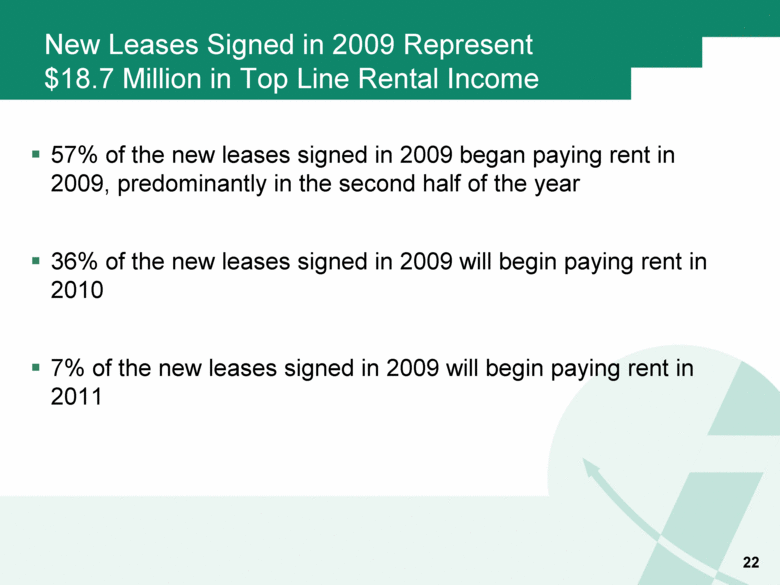
New Leases Signed in 2009 Represent $18.7 Million in Top Line Rental Income 57% of the new leases signed in 2009 began paying rent in 2009, predominantly in the second half of the year 36% of the new leases signed in 2009 will begin paying rent in 2010 7% of the new leases signed in 2009 will begin paying rent in 2011 22 |
|
|
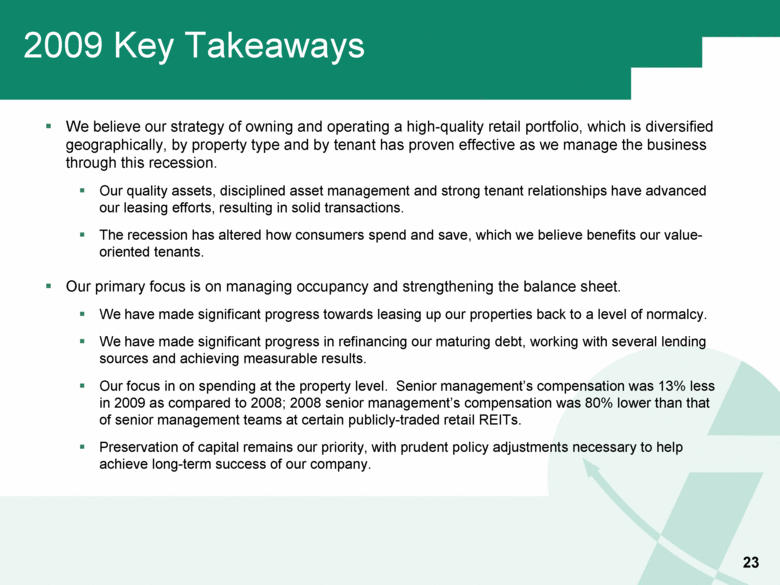
We believe our strategy of owning and operating a high-quality retail portfolio, which is diversified geographically, by property type and by tenant has proven effective as we manage the business through this recession. Our quality assets, disciplined asset management and strong tenant relationships have advanced our leasing efforts, resulting in solid transactions. The recession has altered how consumers spend and save, which we believe benefits our value-oriented tenants. Our primary focus is on managing occupancy and strengthening the balance sheet. We have made significant progress towards leasing up our properties back to a level of normalcy. We have made significant progress in refinancing our maturing debt, working with several lending sources and achieving measurable results. Our focus in on spending at the property level. Senior management’s compensation was 13% less in 2009 as compared to 2008; 2008 senior management’s compensation was 80% lower than that of senior management teams at certain publicly-traded retail REITs. Preservation of capital remains our priority, with prudent policy adjustments necessary to help achieve long-term success of our company. 2009 Key Takeaways 23 |
|
|
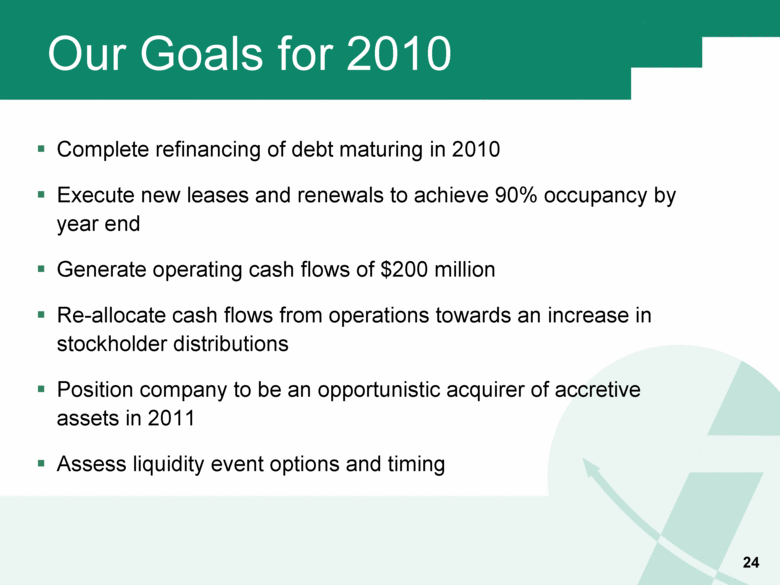
Our Goals for 2010 Complete refinancing of debt maturing in 2010 Execute new leases and renewals to achieve 90% occupancy by year end Generate operating cash flows of $200 million Re-allocate cash flows from operations towards an increase in stockholder distributions Position company to be an opportunistic acquirer of accretive assets in 2011 Assess liquidity event options and timing 24 |
|
|
Forward-Looking Statements Certain statements in this presentation may constitute “forward-looking statements.” Forward-looking statements are statements that are not historical, including statements regarding management’s intentions, beliefs, expectations, representations, plans or predictions of the future and are typically identified by such words as “believe,” “expect,” “anticipate,” “intend,” “estimate,” “may,” “should” and “could.” We intend that such forward-looking statements be subject to the safe harbor provisions created by Section 27A of the Securities Act of 1933 and Section 21E of the Securities Exchange Act of 1934 and the Federal Private Securities Litigation Reform Act of 1995 and we include this statement for the purpose of complying with such safe harbor provisions. Future events and actual results, performance, transactions or achievements, financial or otherwise, may differ materially from the results, performance, transactions or achievements expressed or implied by the forward-looking statements. Risks, uncertainties and other factors that might cause such differences, some of which could be material, include, but are not limited to: Our financial condition will be materially adversely affected if we are unable to refinance all or substantially all of our remaining indebtedness which matured in 2009 of $187 million. We have approximately an additional $1.0 billion of debt, excluding amortization and liabilities associated with the investment property held for sale, which will maturein 2010; Our financial condition may be affected by required debt service payments, the risk of default and restrictions on our ability to incur additional debt or enter into certain transactions under our credit agreement. In addition, we may encounter difficulties in obtaining permanent financing or refinancing existing debt; The level and volatility of interest rates as well as significant challenges in the debt markets that may adversely affect our ability to obtain permanent financing or refinance our existing indebtedness; The ability to dispose of properties on favorable terms or at all as real estate investments can be illiquid, particularly as prospective buyers may experience increased costs of financing or difficulties obtaining financing; Risks of joint venture activities, including development joint ventures; National or local economic, business, real estate and other market conditions, including the ability of the general economy to recover timely from the current volatile economic downturn; General financial risks affecting the real estate industry, including the current economic downturn that may adversely affect the ability of our tenants, or new tenants, to enter into new leases or the ability of our existing tenants to renew their leases at rates at least as favorable as their current rates or at all; Financial stability of tenants, including the ability of tenants to pay rent, the decision of tenants to close stores and the effect of bankruptcy laws and our ability to re-lease any resulting vacant space; Risks of real estate development, including the failure of pending developments and redevelopments to be completed on time and within budget and the failure of newly acquired or developed properties to perform as expected; The effect of inflation and other factors on fixed rental rates, operating expenses and real estate taxes; The competitive environment in which we operate and the supply of and demand for retail goods and services in our markets; The increase in property and liability insurance costs and the ability to obtain appropriate insurance coverage; The ability to maintain our status as a REIT for federal income tax purposes; The effects of hurricanes and other natural disasters; Environmental/safety requirements and costs; and Other risks identified in this presentation and, from time to time, in other reports we file with the Securities and Exchange Commission (SEC). We disclaim any intention or obligation to update or revise any forward-looking statement whether as a result of new information, future events or otherwise. Readers are cautioned not to place undue reliance on these forward-looking statements, which speak only as of December 31, 2009. This presentation should also be read in conjunction with our Annual Reports on Form 10-K and our Quarterly Reports on Form 10-Q as filed with the SEC. Tenant Photographs and Logos The companies depicted may have proprietary interests in their trade names and trademarks. Nothing herein shall be considered to be an endorsement authorization or approval of Inland Western Retail Real Estate Trust, Inc. by the aforementioned companies. Further, none of the aforementioned companies are affiliated with Inland Western Retail Real Estate Trust, Inc. in any manner, other than being a tenant in properties that Inland Western Retail Real Estate Trust, Inc. owns or has interest in. Property Photographs Properties depicted in photographs in this presentation are wholly or partially owned by Inland Western Retail Real Estate Trust, Inc. However, some photographs are of shadow anchors, which are located in or adjacent to our center, but that are not owned by Inland Western Retail Real Estate Trust, Inc. 25 |

