Attached files
| file | filename |
|---|---|
| 8-K - FORM 8-K - GRUBB & ELLIS CO | a55654e8vk.htm |

| Grubb & Ellis Company Investor Presentation March 2010 |

| 1 This presentation contains forward-looking statements within the meaning of the Private Securities Litigation Reform Act of 1995. These statements include assumptions regarding expectations or estimates of future financial and operating results or events, industry and market trends and other market opportunities for Grubb & Ellis. The information in this presentation discusses the state of Grubb & Ellis' business as of the date of presentation. Grubb & Ellis does not assume any obligation to update or correct any information covered herein. There are a number of risks and uncertainties that could cause our actual results to differ materially from those described in the forward-looking statements. For additional information concerning risks that could cause such differences, please refer to our annual report on Form 10-K, quarterly reports on Form 10-Q and other filings with the Securities and Exchange Commission. We may make certain statements during the course of this presentation which include references to "non-GAAP financial measures," as defined by SEC regulations. As required by these regulations, we have provided reconciliations of these measures to what we believe are the most directly comparable GAAP measures, which are attached hereto within the appendix. Forward Looking Statements |

| 2 Positioned for Growth Highly Recognized Brand *Includes Grubb & Ellis affiliates At a Glance as of December 31, 2009 Founded 1958 Stock NYSE: GBE Footprint* 126 offices 6,000+ employees 1,800 brokers Assets under Management $5.8 billion; 31 states SF under Management* 293 million Transaction Services Management Services Corporate Services Investment Services Consulting Services Real Estate Investment Trusts (non-traded REITs) Private Client Management Institutional Funds Joint Ventures Mutual Funds Large, highly fragmented industry Substantial ongoing consolidation Corporate outsourcing trend Unique market position Scalable infrastructure 51-year history One of the most recognized commercial real estate brands Approximately 126 offices across United States* and in partnership with premier network of international providers Broad Capabilities Attractive Market Opportunity |

| 3 2009 Milestones Closed on $97 million private placement of cumulative preferred stock Repaid credit facility in full at discount Named new corporate leadership Significant client wins |

| 4 Mission To make Grubb & Ellis the pre-eminent real estate services and investment firm in the country by providing our clients with superior service and insight |
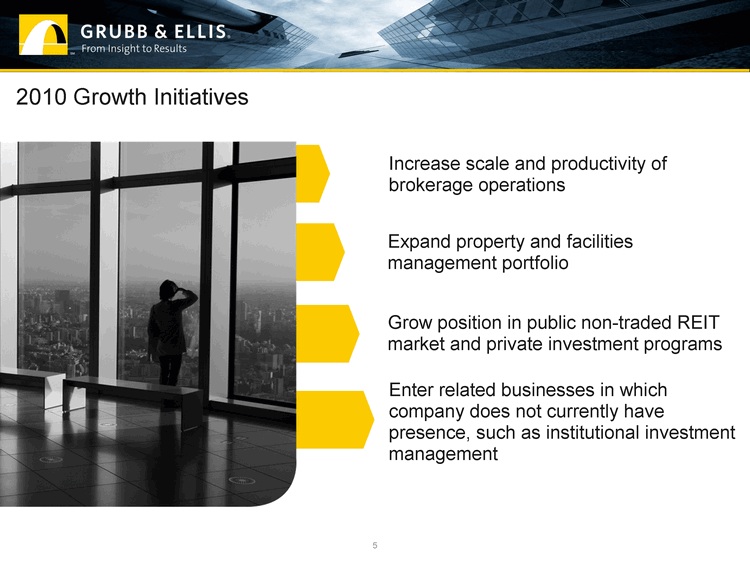
| 5 Expand property and facilities management portfolio Increase scale and productivity of brokerage operations Enter related businesses in which company does not currently have presence, such as institutional investment management 2010 Growth Initiatives Grow position in public non-traded REIT market and private investment programs |
| 6 Long-Term Goals By 2013, Grubb & Ellis will be: $1-billion-dollar service company Preferred FM provider to Middle Market Leading sponsor of non-traded REITs based on equity and shareowner returns Top institutional real estate money manager as measured by AUM Acknowledged leader in research and training |

| 7 Fueling Growth Recapitalization in Q4 2009 Raised $97 million in new preferred capital No near-term debt maturity Realigned cost structure Cut additional $25 million in additional annualized costs in Q1 2010 Recruiting momentum More than 100 senior-level brokerage professionals added over past 18 months New investment products Two non-traded REITs in offering stage |

| 8 126 owned and affiliate offices 1,800 brokerage professionals 100+ local research professionals nationwide Strong local presence and experience GBE currently has 170 Fortune 1,000 clients GBE's top 5 clients are IBM, Microsoft, Citigroup, RBS and Kraft National Presence and Top-Tier Clients |

| 9 Real Estate Services Grubb & Ellis consistently ranked among the top commercial real estate services providers Ranked 12th in investment sales and leasing transactions nationally1 Ranked 7th in property management nationally2 Real estate services include transaction management, consulting services, lease administration, strategic planning, project management, account management and facilities management Over 1,800 brokerage professionals and nearly 300 million square feet under management3 1 National Real Estate Investor, April 2009 2 National Real Estate Investor, July 2009 3 includes affiliates |

| 10 Investment Management Sponsor of real estate investment vehicles Leading sponsor of non-traded REITs tailored for retail investors Grubb & Ellis Healthcare REIT II - $3.0 billion targeted Grubb & Ellis Apartment REIT - $1.0 billion targeted Grubb & Ellis Alesco Global Advisors - Open end mutual fund family Emerging institutional real estate manager Placing investor equity through sole-ownership vehicles and funds across numerous asset classes IM strength as of December 31, 2009 Approximately $12.0 billion in acquisitions and dispositions completed since 1998 $5.8 billion in assets under management |

| 11 Financial Performance |
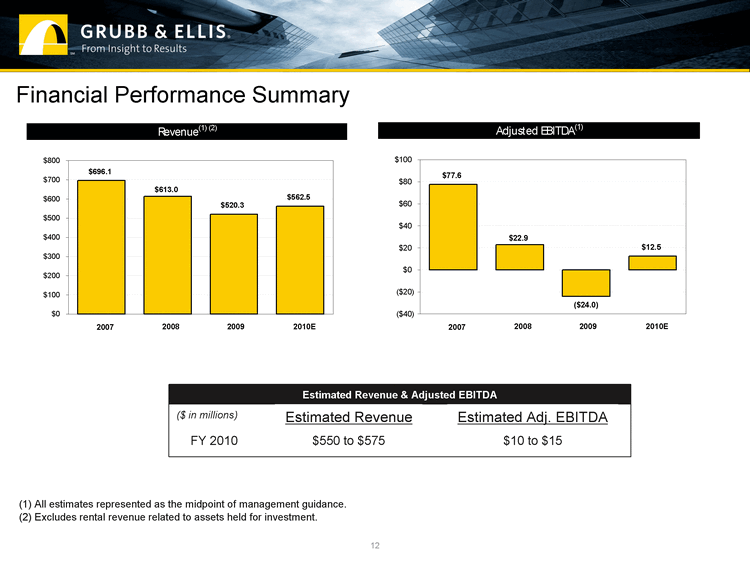
| Financial Performance Summary 12 12 Estimated Revenue & Adjusted EBITDA ($ in millions) Estimated Revenue Estimated Adj. EBITDA FY 2010 $550 to $575 $10 to $15 (1) All estimates represented as the midpoint of management guidance. (2) Excludes rental revenue related to assets held for investment. |
| 13 $40 million of annualized expense reductions or approximately 20 percent since merger, including first quarter 2010 actions Combining numerous divisions, including brokerage and management services, allowing the elimination of excess layers of management Elimination of duplicate corporate functions between GBE and NNN Integration of duplicate back-office systems and functions, such as property accounting, into one organization Expense Reduction Initiatives |

| 14 2009 Condensed Balance Sheet $39 million of cash and no near-term debt maturities December 31 ($ in millions) 2009 Cash & cash equivalents 39.1 $ Other current assets 81.5 Properties held for investment, net 82.2 Intangible assets 95.0 Other long-term assets 59.6 Total Assets 357.3 $ Current liabilities 1 104.0 $ Long-term debt 1 123.3 Other long-term liabilities 38.8 Total liabilities 266.1 Preferred stock 90.1 Common equity 1.2 Total liabilities and shareowners equity 357.3 $ ($ in millions) December 31 On-balance sheet recourse debt: 2009 Maturity Interest Senior notes 2 16.3 $ 8/1/2011 8.75% Mortgage debt secured by 200 Galleria (recourse portion) 10.0 2/1/2017 6.29% Total on-balance sheet recourse debt: 26.3 Non-recourse debt: 200 Galleria 60.0 2/1/2017 6.29% Avallon 37.0 7/1/2014 6.32% Total non-recourse debt 97.0 - Total long-term debt 1 123.3 $ 2 The senior notes have two one-year extension options to extend the maturity date at the Company's discretion Condensed Balance Sheet Schedule of indebtedness 1 Excludes approximately $1.7 million of capital lease obligations ($0.9 million & $0.7 million in short-term and long-term, respectively) from current liabilities and long-term debt and included as other long-term liabilities |

| 15 2010 Business Outlook Increasing signs of recovery Investment sales expected to grow 25 to 30 percent Leasing activity expected to rise 10 to 15 percent Corporate outsourcing trend will continue as companies look to reduce costs GBE revenue growth expected to ramp up in second half of 2010 |

| 16 Grubb & Ellis Advantage Top-tier commercial real estate services and investment management firm Leading sponsor of public non-traded REITs Powerful distribution partner to leading financial services firms Highly recognized and well-regarded brand and broad market presence Strong business model with diversified revenue streams and growth opportunities Opportunity to capitalize on highly fragmented industry dynamics Strong client retention and growing client base Revitalized balance sheet and experienced leadership team |

| 17 Appendix |
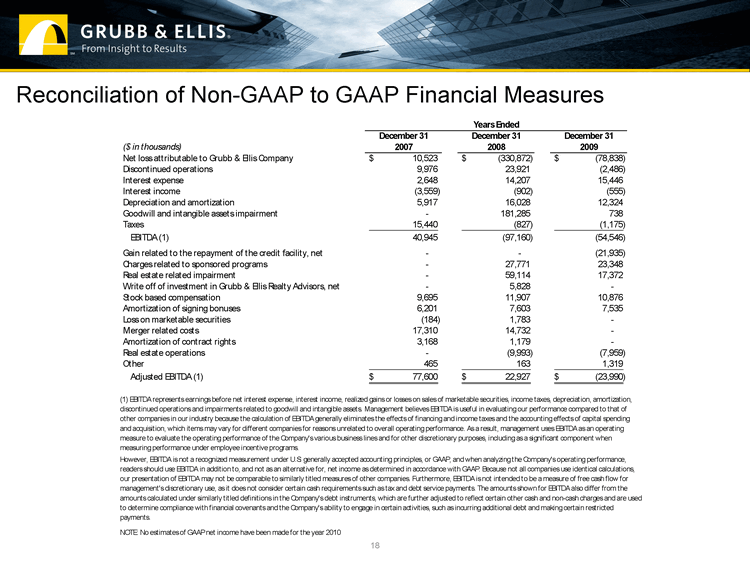
| 18 Reconciliation of Non-GAAP to GAAP Financial Measures December 31 December 31 December 31 ($ in thousands) 2007 2008 2009 Net loss attributable to Grubb & Ellis Company 10,523 $ (330,872) $ (78,838) $ Discontinued operations 9,976 23,921 (2,486) Interest expense 2,648 14,207 15,446 Interest income (3,559) (902) (555) Depreciation and amortization 5,917 16,028 12,324 Goodwill and intangible assets impairment - 181,285 738 Taxes 15,440 (827) (1,175) EBITDA (1) 40,945 (97,160) (54,546) Gain related to the repayment of the credit facility, net - - (21,935) Charges related to sponsored programs - 27,771 23,348 Real estate related impairment - 59,114 17,372 Write off of investment in Grubb & Ellis Realty Advisors, net - 5,828 - Stock based compensation 9,695 11,907 10,876 Amortization of signing bonuses 6,201 7,603 7,535 Loss on marketable securities (184) 1,783 - Merger related costs 17,310 14,732 - Amortization of contract rights 3,168 1,179 - Real estate operations - (9,993) (7,959) Other 465 163 1,319 Adjusted EBITDA (1) 77,600 $ 22,927 $ (23,990) $ NOTE: No estimates of GAAP net income have been made for the year 2010 Years Ended (1) EBITDA represents earnings before net interest expense, interest income, realized gains or losses on sales of marketable securities, income taxes, depreciation, amortization, discontinued operations and impairments related to goodwill and intangible assets. Management believes EBITDA is useful in evaluating our performance compared to that of other companies in our industry because the calculation of EBITDA generally eliminates the effects of financing and income taxes and the accounting effects of capital spending and acquisition, which items may vary for different companies for reasons unrelated to overall operating performance. As a result, management uses EBITDA as an operating measure to evaluate the operating performance of the Company's various business lines and for other discretionary purposes, including as a significant component when measuring performance under employee incentive programs. However, EBITDA is not a recognized measurement under U.S. generally accepted accounting principles, or GAAP, and when analyzing the Company's operating performance, readers should use EBITDA in addition to, and not as an alternative for, net income as determined in accordance with GAAP. Because not all companies use identical calculations, our presentation of EBITDA may not be comparable to similarly titled measures of other companies. Furthermore, EBITDA is not intended to be a measure of free cash flow for management's discretionary use, as it does not consider certain cash requirements such as tax and debt service payments. The amounts shown for EBITDA also differ from the amounts calculated under similarly titled definitions in the Company's debt instruments, which are further adjusted to reflect certain other cash and non-cash charges and are used to determine compliance with financial covenants and the Company's ability to engage in certain activities, such as incurring additional debt and making certain restricted payments. |
