Attached files
| file | filename |
|---|---|
| EX-21 - EX-21 - FNBH BANCORP INC | k48997exv21.htm |
| EX-3.4 - EX-3.4 - FNBH BANCORP INC | k48997exv3w4.htm |
| EX-31.2 - EX-31.2 - FNBH BANCORP INC | k48997exv31w2.htm |
| EX-32.1 - EX-32.1 - FNBH BANCORP INC | k48997exv32w1.htm |
| EX-31.1 - EX-31.1 - FNBH BANCORP INC | k48997exv31w1.htm |
| EX-32.2 - EX-32.2 - FNBH BANCORP INC | k48997exv32w2.htm |
| EX-23.1 - EX-23.1 - FNBH BANCORP INC | k48997exv23w1.htm |
| EX-10.10 - EX-10.10 - FNBH BANCORP INC | k48997exv10w10.htm |
Table of Contents
UNITED STATES
SECURITIES AND EXCHANGE COMMISSION
SECURITIES AND EXCHANGE COMMISSION
Washington, D.C. 20549
Form 10-K
| þ | ANNUAL REPORT PURSUANT TO SECTION 13 OR 15(d) OF THE SECURITIES EXCHANGE ACT OF 1934 |
| for the fiscal year ended December 31, 2009 |
Commission file number 0-25752
FNBH BANCORP, INC.
(Exact name of Registrant as specified in its charter)
| MICHIGAN (State or other jurisdiction of incorporation or organization) |
No. 38-2869722 (I.R.S. Employer Identification No.) |
101 East Grand River, Howell, Michigan 48843
(Address of principal executive offices) (Zip Code)
(Address of principal executive offices) (Zip Code)
Registrant’s telephone number, including area code: (517) 546-3150
Securities registered pursuant to Section 12(b) of the Act: None
Securities registered pursuant to Section 12(g) of the Act:
Common Stock, no par value
(Title of Class)
Common Stock, no par value
(Title of Class)
Indicate by check mark if the registrant is a well-known seasoned issuer, as defined in Rule
405 of the Securities Act. Yes o No þ
Indicate by check mark if the registrant is not required to file reports pursuant to Section 13 or
Section 15(d) of the Act. Yes o No þ
Indicate by check mark whether the registrant (1) has filed all reports required to be filed by
Section 13 or 15(d) of the Securities Exchange Act of 1934 during the preceding 12 months (or for
such shorter period that the registrant was required to file such reports), and (2) has been
subject to such filing requirements for the past 90 days. Yes þ No o
Indicate by check mark whether registrant has submitted electronically and posted on its corporate
web site, if any, every Interactive Data File required to be submitted and posted pursuant to Rule
405 of Regulation S-T (§232.405 of this chapter) during the preceding 12 months (or for such
shorter period that the registrant was required to submit and post such files). Yes o No o
Indicate by check mark if disclosure of delinquent filers pursuant to Item 405 of Regulation S-K
(§229.405 of this chapter) is not contained herein, and will not be contained, to the best of
Registrant’s knowledge, in definitive proxy or information statements incorporated by reference in
Part III of this Form 10-K or any amendments to this Form 10-K.
o
Indicate by check mark whether the registrant is a large accelerated filer, an accelerated filer, a
non-accelerated filer, or a smaller reporting company (as defined in Exchange Act Rule 12b-2).
| Large accelerated filer o | Accelerated filer o | Non-accelerated filer o | Smaller Reporting Company þ | |||
| (Do not check if a smaller reporting company) |
Indicate by check mark whether the registrant is a shell company (as defined in Rule 12b-2 of the
Act). Yes o No þ
State the aggregate market value of the voting and non-voting common equity held by non-affiliates
computed by reference to the price at which the common equity was last sold, or the average bid and
asked price of such common equity, as of the last business day of the registrant’s most recently
completed second fiscal quarter. The aggregate market value of common stock held by non-affiliates
as of June 30, 2009, was $6,276,380.
The number of outstanding shares of common stock (no par value) as of March 30, 2010 was 3,157,938.
Documents Incorporated by Reference:
Portions of the Corporation’s Proxy Statement for the Annual Meeting of Shareholders to be held May
20, 2010, are incorporated by reference into Part III of this report.
TABLE OF CONTENTS
| Page | ||||||||
| 3 | ||||||||
| 10 | ||||||||
| 15 | ||||||||
| 15 | ||||||||
| 15 | ||||||||
| 15 | ||||||||
| 16 | ||||||||
| 18 | ||||||||
| 18 | ||||||||
| 37 | ||||||||
| 37 | ||||||||
| 65 | ||||||||
| 65 | ||||||||
| 65 | ||||||||
| 65 | ||||||||
| 66 | ||||||||
| 66 | ||||||||
| 66 | ||||||||
| 66 | ||||||||
| 66 | ||||||||
| 67 | ||||||||
| 68 | ||||||||
| 70 | ||||||||
| 71 | ||||||||
| 72 | ||||||||
| 73 | ||||||||
| 74 | ||||||||
| 75 | ||||||||
| EX-3.4 | ||||||||
| EX-10.10 | ||||||||
| EX-21 | ||||||||
| EX-23.1 | ||||||||
| EX-31.1 | ||||||||
| EX-31.2 | ||||||||
| EX-32.1 | ||||||||
| EX-32.2 | ||||||||
Table of Contents
PART I
Item 1. Business.
FNBH Bancorp, Inc. (“FNBH”), a Michigan business corporation, is a one-bank holding company, which
owns all of the outstanding capital stock of First National Bank in Howell (the “Bank”). FNBH and
the Bank are collectively herein referred to as the “Corporation”. FNBH was formed in 1988 for the
purpose of acquiring all of the stock of the Bank in a shareholder approved reorganization, which
became effective in May 1989. The Corporation’s Internet address is www.fnbh.com. Through our
Internet Website, we make available free of charge, as soon as reasonably practical after such
information has been filed with the Securities and Exchange Commission, our Annual Report on Form
10-K, quarterly reports on Form 10-Q, current reports on Form 8-K, and amendments to those reports
filed with the Securities and Exchange Commission. Also available on our website are the respective
Charters of the Board’s Audit Committee, Compensation Committee, and Nominating and Corporate
Governance Committee, as well as the Corporation’s Code of Ethics for its Chief Executive Officer
and other senior financial officers.
The Bank was originally organized in 1934 as a national banking association. As of January 31,
2010, the Bank had approximately 93 full-time and part-time employees. None of the Bank’s employees
are subject to collective bargaining agreements. FNBH does not directly employ any personnel. The
Bank serves primarily five communities, Howell, Brighton, Green Oak Township, Hartland, and
Fowlerville, all of which are located in Livingston County. The county has historically been rural
in character but has a growing suburban population.
On November 26, 1997, H.B. Realty Co., a subsidiary of FNBH, was established to purchase land for a
future branch site of the Bank and to hold title to other Bank real estate when it is considered
prudent to do so.
Bank Services
The Bank is a full-service bank offering a wide range of commercial and personal banking services.
These services include checking accounts, savings accounts, certificates of deposit, commercial
loans, real estate loans, installment loans, trust and investment services, collections, night
depository, safe deposit box, telephone banking, Internet banking, online bill pay and U.S. Savings
Bonds. The Bank maintains correspondent relationships with major banks, pursuant to which the Bank
engages in federal funds sale transactions, the clearance of checks and certain
foreign currency transactions. The Bank also has a relationship with the Federal Home Loan Bank of
Indianapolis where it makes short term investments and where it has a line of credit of $10,100,000
of which $9,686,000 is available, and $414,000 is funded as of year end. The Bank also has a
relationship with the Federal Reserve Bank of Chicago, the Fed Discount Window, where it has a line
of credit of $16,100,000 of which all is available as of year end. In addition, the Bank
participates with other financial institutions to fund certain large loans which would exceed the
Bank’s legal lending limit if made solely by the Bank.
The Bank’s deposits are generated in the normal course of business, and the loss of any one
depositor would not have a materially adverse effect on the business of the Bank. As of December
31, 2009 and 2008, the Bank’s certificates of deposit of $100,000 or more constituted approximately
15% and 18%, respectively, of total deposit liabilities. The Bank’s deposits are primarily from its
service areas, and the Bank does not traditionally seek or encourage large deposits from outside
the area.
FNBH’s cash revenues are primarily limited to dividends paid by the Bank. The Bank’s principal
sources of revenue are interest and fees on loans and interest on investment securities. Interest
and fees on loans constituted approximately 74% of total revenues for the year ended December 31,
2009, and 89% for the year ended December 31, 2008. Interest and dividends on investment
securities, including short-term investments and certificates of deposit, constituted approximately
9% of total revenues in 2009 and 11% of total revenues in 2008. Revenues were also generated from
deposit service charges and other financial service fees.
The Bank provides real estate, consumer and commercial loans to customers in its market. As of
December 31, 2009, 28% of outstanding loans were secured by construction, land development and
residential mortgages or residential construction. As of December 31, 2009, 62% of outstanding
loans were secured by nonfarm, nonresidential properties, 39% of which were owner occupied.
Seventy percent of the Bank’s loan portfolio is in fixed rate loans. Most of these loans,
approximately 90%, mature within five years of issuance. Approximately $19,583,000 of loans with
fixed rates (or about 7% of the Bank’s total loan portfolio) have remaining balances that mature
after five years. Forty-nine percent of the Bank’s interest-bearing deposits are in savings, NOW,
and MMDAs, all of which are variable rate products. As of December 31, 2009, certificates of
deposits totaled approximately $127,000,000 with $95,000,000 maturing within a year, and the
majority of the balance maturing within a five year period.
Requests to the Bank for credit are considered on the basis of credit worthiness of each applicant,
without consideration to race, color, religion, national origin, sex, marital status, physical
handicap, age, or the receipt of income from public assistance programs. Consideration is also
given to the applicant’s capacity for repayment, collateral, capital and alternative sources of
repayment. Loan applications are accepted at all the Bank’s offices and are approved under each
lending officer’s authority. Request for loans from borrowers with aggregate indebtedness in excess
of $1,500,000 are required to be presented to the Board of Directors or the Executive Committee of
the Board for its review and approval.
3
Table of Contents
As described in more detail below, the Corporation’s cumulative one year gap ratio of rate
sensitive assets to rate sensitive liabilities at December 31, 2009, was 151% asset sensitive at
December 31, 2009 and 16% liability sensitive at December 31, 2008. See discussion and table under
“Quantitative and Qualitative Disclosures about Market Risk” in Item 7A below.
The Bank sells participations in commercial loans to other financial institutions approved by the
Bank for the purpose of meeting legal lending limit requirements or loan concentration
considerations. Loans are classified as held for investment unless management does not have the
intent or ability to hold the loans for the foreseeable future, or until maturity or payoff. The
Bank has entered into an arrangement with a third party provider to take residential mortgage loan
applications which are then underwritten and closed by the third party provider. The Bank receives
fee income for loans referred in this way that is recorded as part of noninterest income. Those
residential real estate mortgage loan requests that do not meet the third party provider’s criteria
are reviewed by the Bank for approval and, if approved, are retained in the Bank’s loan portfolio.
The Bank also may purchase loans which meet its normal credit standards.
The Bank’s investment policy is designed to provide a framework within which the Bank may maximize
earnings potential by acquiring assets designed to enhance profitability, absorb excess funds,
provide liquidity, maintain a high credit quality, implement interest rate risk measures, provide
collateral for pledging, generate a favorable return on investments, and provide tax-exempt income
as appropriate. Safety, liquidity, and interest rate risk standards are not compromised in favor of
increased return. When making investment decisions, the Bank considers investment type, credit
quality (including maximum credit exposure to one obligor at any one time) and maturity of
investments. Consideration is also given to each investment’s risk-weight as determined by
regulatory Risk-Based Capital Guidelines.
The investment portfolio is coordinated with the overall asset/liability management of the balance
sheet. The use of the investment portfolio for market oriented trading activities or speculative
purposes is expressly prohibited unless otherwise approved by the Board of Directors. Investments
are acquired for which the Bank has both the ability and intent to hold to maturity. Specific
limits determine the types, maturities, and amounts of securities the Bank intends to hold.
Guidelines on liquidity requirements, as well as an acknowledgement of the Bank’s credit profile
and capital position may affect the Bank’s ability to hold securities to maturity. It is not the
intention of management to profit from short-term securities price movements. Business reasons for
securities purchases and sales are noted at the time of the transaction. All securities dealers
effecting transactions in securities held or purchased by the Bank must be approved by the Board of
Directors.
Bank Competition
The Bank has eight offices within the five communities it serves, all of which are located in
Livingston County, Michigan. Three of the offices, including the main office, are located in
Howell. There are two facilities in Brighton, and one each in Green Oak Township, Hartland, and
Fowlerville. See “Properties” below for more detail on these facilities. Within these communities,
the Bank’s principal competitors are National City, Fifth Third Bank, Citizens Bank, Comerica Bank,
JP Morgan Chase, and Bank of America. Each of these financial institutions, which are headquartered
in larger metropolitan areas, has significantly greater assets and financial resources than the
Corporation. Among the principal competitors in the communities in which the Bank operates, the
Bank is the only financial institution with a local community headquarters. Based on deposit
information as of June 30, 2009, the Bank holds approximately 16.7% of local deposits, compared to
approximately 13.4% held by National City, approximately 12.6% held by held by Fifth Third Bank,
approximately 9.6% held by Citizens Bank, approximately 9.6% held by Comerica Bank, approximately
8.7% held by JP Morgan Chase, and approximately 7.8% held by Bank of America. Information as to
asset size of competitor financial institutions is derived from publicly available reports filed by
and with regulatory agencies. Within the Bank’s markets, National City operates six branch offices,
Fifth Third Bank maintains five branch offices, Citizens Bank has five branch offices, Comerica
Bank has five branch offices, JP Morgan Chase operates six branch offices and Bank of America has
two branch offices. Management is not aware of any plans by these financial institutions to expand
their presence in the Bank’s market.
The Bank competes with other commercial banks, savings banks, credit unions, mortgage banking
companies, securities brokerage companies, insurance companies, and money market mutual funds. Many
of these competitors have substantially greater resources than we do and offer certain services
that we do not generally provide. Such competitors may also have greater lending limits than our
Bank. In addition, non-bank competitors are generally not subject to the extensive regulations
applicable to us.
4
Table of Contents
Condition of Corporation
The following table sets forth certain information regarding the condition of the Corporation:
| Balances as of December 31, | ||||||||||||||||||||
| (in thousands) | ||||||||||||||||||||
| 2009 | 2008 | 2007 | 2006 | 2005 | ||||||||||||||||
Total Assets |
$ | 332,390 | $ | 388,783 | $ | 432,894 | $ | 473,896 | $ | 477,225 | ||||||||||
Loans |
274,046 | 315,817 | 347,876 | 384,581 | 372,855 | |||||||||||||||
Securities |
23,701 | 42,516 | 38,632 | 54,214 | 62,373 | |||||||||||||||
Noninterest-Bearing Deposits |
65,644 | 56,405 | 56,506 | 62,681 | 71,415 | |||||||||||||||
Interest-Bearing Deposits |
249,552 | 293,122 | 323,072 | 342,863 | 350,670 | |||||||||||||||
Total Deposits |
315,196 | 349,527 | 379,578 | 405,544 | 422,085 | |||||||||||||||
Shareholders’ Equity |
14,376 | 27,525 | 40,627 | 49,992 | 49,446 | |||||||||||||||
In May 2009, to realize efficiencies and cost savings, the Bank closed its Lake Chemung retail
branch facility, located five miles east of downtown Howell. Affected customers and deposits were
assimilated primarily into the Bank’s Genoa Township branch. Throughout 2009, the Bank operated
eight other branch facilities: one in downtown Howell, one in a grocery store located west of
downtown Howell, two in Brighton (one on the east side and one on the west side), one in Hartland,
one in the village of Fowlerville, one in Genoa Township, and one in Green Oak Township, which is
11 miles southwest of downtown Howell. In 2009, loans decreased due to lower loan demand resulting
from the decline in local
economic conditions and a focus on reducing the Bank’s size to enhance capital ratios. Deposits in 2009
were also lower due to
continued increased competition for deposits in our local markets. Shareholders’ equity has
decreased primarily due to net losses of $13,696,000 and $13,413,000 in 2009 and 2008,
respectively.
Supervision and Regulation
The following is a summary of certain statutes and regulations affecting the Corporation and the
Bank. This summary is qualified in its entirety by such statutes and regulations. A change in
applicable laws or regulations may have a material effect on the Corporation, the Bank and the
business of the Corporation and the Bank.
General
Financial institutions and their holding companies are extensively regulated under federal and
state law. Consequently, the growth and earnings performance of the Corporation and the Bank can be
affected not only by management decisions and general economic conditions, but also by the statutes
administered by, and the regulations and policies of, various governmental regulatory authorities.
Those authorities include, but are not limited to, the Board of Governors of the Federal Reserve
System (the “Federal Reserve”), the Federal Deposit Insurance Corporation (the “FDIC”), the Office
of the Comptroller of the Currency (“OCC”), the Internal Revenue Service, and state taxing
authorities. The effect of such statutes, regulations and policies can be significant, and cannot
be predicted with a high degree of certainty.
Federal and state laws and regulations generally applicable to financial institutions and their
holding companies regulate, among other things, the scope of business, investments, reserves
against deposits, capital levels relative to operations, lending activities and practices, the
nature and amount of collateral for loans, the establishment of branches, mergers, consolidations
and dividends. The system of supervision and regulation applicable to the Corporation and the Bank
establishes a comprehensive framework for their respective operations and is intended primarily for
the protection of the FDIC’s deposit insurance funds, the depositors of the Bank, and the public,
rather than shareholders of the Corporation.
Federal law and regulations establish supervisory standards applicable to the lending activities of
the Bank, including internal controls, credit underwriting, loan documentation and loan-to-value
ratios for loans secured by real property.
Regulatory Developments
Emergency Economic Stabilization Act of 2008. On October 3, 2008, Congress enacted the
Emergency Economic Stabilization Act of 2008 (“EESA”). EESA enables the federal government, under
terms and conditions developed by the Secretary of the United States Department of the Treasury
(“UST”), to insure troubled assets, including mortgage-backed securities, and collect premiums from
participating financial institutions. EESA includes, among other provisions: (a) the $700 billion
Troubled Assets Relief Program (“TARP”), under which the Secretary of the UST is authorized to
purchase, insure, hold, and sell a wide variety of financial instruments, particularly those that
are based on or related to residential or commercial mortgages originated or issued on or before
March 14, 2008; and (b) an increase in the amount of deposit insurance provided by the FDIC. Both
of these specific provisions are discussed in the below sections.
Troubled Assets Relief Program (TARP). Under TARP, the UST authorized a voluntary capital
purchase program (“CPP”) to purchase senior preferred shares of qualifying financial institutions
that elect to participate. Participating companies must adopt certain standards for executive
compensation, including (a) prohibiting “golden parachute” payments as defined in EESA to senior
executive officers;
(b) requiring recovery of any compensation paid to senior executive officers based on criteria that
is later proven to be materially inaccurate; and (c) prohibiting
5
Table of Contents
incentive compensation that
encourages unnecessary and excessive risks that threaten the value of the financial institution.
The terms of the CPP also limit certain uses of capital by the issuer, including repurchases of
company stock and increases in dividends. The Corporation did not participate in the CPP.
Federal Deposit Insurance Coverage. EESA temporarily raised the limit on federal deposit
insurance coverage from $100,000 to $250,000 per depositor on May 20, 2009, this temporary increase
in the insurance limit was extended until December 31, 2013. Separate from EESA, in October 2008,
the FDIC also announced the Temporary Liquidity Guarantee Program (“TLGP”). Under one component of
this program, the FDIC temporarily provides unlimited coverage for noninterest bearing transaction
deposit accounts through June 30, 2010. The Corporation did elect to participate in the deposit
portion of the TLGP.
Financial Stability Plan. On February 10, 2009, the UST announced the Financial Stability
Plan (“FSP”), which is a comprehensive set of measures intended to shore up the U.S. financial
system and earmarks the balance of the unused funds originally authorized under EESA. The major
elements of the FSP include: (a) a capital assistance program that will invest in convertible
preferred stock of certain qualifying institutions, (b) a consumer and business lending initiative
to fund new consumer loans, small business loans and commercial mortgage-asset-backed securities
issuances, (c) a new public-private investment fund that will leverage public and private capital
with public financing to purchase up to $500 billion to $1 trillion of legacy “toxic assets” from
financial institutions, and (d) assistance for homeowners by providing up to $75 billion to reduce
mortgage payments and interest rates and establishing loan modification guidelines for government
and private programs.
Financial institutions receiving assistance under the FSP going forward will be subject to higher
transparency and accountability standards, including restrictions on dividends, acquisitions and
executive compensation and additional disclosure requirements. We cannot predict at this time the
effect that the FSP may have on the Corporation or its business, financial condition or results of
operations.
American Recovery and Reinvestment Act of 2009. On February 17, 2009, Congress enacted the
American Recovery and Reinvestment Act of 2009 (“ARRA”). In enacting ARRA, Congress intended to
provide a stimulus to the U.S. economy in light of the significant economic downturn. The AARA
includes federal tax cuts, expansion of unemployment benefits and other social welfare provisions,
and numerous domestic spending efforts in education, healthcare and infrastructure. The ARRA also
includes numerous non-economic recovery related items, including a limitation on executive
compensation in federally-aided financial institutions, including banks that have received or will
receive assistance under TARP. The Corporation has received no assistance under TARP.
Homeowner Affordability and Stability Plan. On February 18, 2009, President Obama
announced the Homeowner Affordability and Stability Plan (“HASP”). HASP is intended to support a
recovery in the housing market and ensure that workers can continue to pay off their mortgages
through the following elements: access to low-cost refinancing for responsible homeowners suffering
from falling home prices, a $75 billion homeowner stability initiative to prevent foreclosure and
help responsible families stay in their homes, and support for low mortgage rates by strengthening
confidence in Fannie Mae and Freddie Mac.
In addition, the U.S. Government, the Federal Reserve, the UST, the FDIC and other governmental and
regulatory bodies have taken, or may be considering taking, other actions to address the financial
crisis. There can be no assurance, however, as to the actual impact of these actions on the
financial markets and their potential impact on our business.
The Corporation
General. FNBH is a bank holding company and, as such, is registered with, and subject to
regulation by, the Federal Reserve under the Bank Holding Company Act, as amended (the “BHCA”).
Under the BHCA, FNBH is subject to periodic examination by the Federal Reserve, and is required to
file periodic reports of its operations and such additional information as the Federal Reserve may
require.
In accordance with Federal Reserve policy, FNBH is expected to act as a source of financial
strength to the Bank and to commit resources to support the Bank in circumstances where FNBH might
not do so absent such policy.
In addition, if the Bank’s capital becomes impaired, the OCC may require the Bank to restore its
capital by a special assessment upon FNBH as the Bank’s sole shareholder. If FNBH were to fail to
pay any such assessment, the directors of the Bank would be required, under federal law, to sell
the shares of the Bank’s stock owned by FNBH at public auction and use the proceeds of the sale to
restore the Bank’s capital. Given current market conditions, it would likely be difficult for FNBH
to raise significant amounts of additional capital on reasonable terms.
Pursuant to the results of an examination of FNBH by the Federal Reserve in November 2009, FNBH is
considered a troubled institution due to the critically deficient condition of its subsidiary Bank.
As such, the Federal Reserve has required FNBH to take action to support the Bank, which
principally involves a capital infusion sufficient to satisfy minimum capital ratios imposed on the
Bank. In addition, FNBH must receive prior approval from the Federal Reserve before the payment of
dividends, issuance of debt, or redemption of stock. Additional restrictions imposed on FNBH by
the Federal Reserve relate to changes in the composition of board members, the employment of senior
executive officers or changes in the responsibilities of senior executive officers, and limitations
on indemnification and severance payments.
6
Table of Contents
Investments and Activities. In general, any direct or indirect acquisition by FNBH of any
voting shares of any bank which would result in FNBH’s direct or indirect ownership or control of
more than 5% of any class of voting shares of such bank, and any merger or consolidation of FNBH
with another bank holding company, will require the prior written approval of the Federal Reserve
under the BHCA. In acting on such applications, the Federal Reserve must consider various
statutory factors including the effect of the proposed transaction on competition in relevant
geographic and product markets, and each party’s financial condition, managerial resources, and
record of performance under the Community Reinvestment Act.
In addition and subject to certain exceptions, the Change in the Bank Control Act (“Control Act”)
and regulations promulgated thereunder by the Federal Reserve, require any person acting directly
or indirectly, or through or in concert with one or more persons, to give the Federal Reserve 60
days’ written notice before acquiring control of a bank holding company. Transactions which are
presumed to constitute the acquisition of control include the acquisition of any voting securities
of a bank holding company having securities registered under Section 12 of the Securities Exchange
Act of 1934, as amended, if, after the transaction, the acquiring person (or persons acting in
concert) owns, controls or holds with power to vote 10% or more of any class of voting securities
of the institution. The acquisition may not be consummated subsequent to such notice if the
Federal Reserve issues a notice within 60 days, or within certain extensions of such period,
disapproving the acquisition.
The merger or consolidation of an existing bank subsidiary of the Corporation with another bank, or
the acquisition by such a subsidiary of assets of another bank, or the assumption of liability by
such a subsidiary to pay any deposits in another bank, will require the prior written approval of
the responsible federal depository institution regulatory agency under the Bank Merger Act. In
addition, in certain such cases an application to, and the prior approval of, the Federal Reserve
under the BHCA and/or the OCC, may be required.
With certain limited exceptions, the BHCA prohibits any bank holding company from engaging, either
directly or indirectly through a subsidiary, in any activity other than managing or controlling a
bank unless the proposed non-banking activity is one that the Federal Reserve has determined to be
so closely related to banking or managing or controlling a bank as to be a proper incident thereto.
Under current Federal Reserve regulations, such permissible non-banking activities include such
things as mortgage banking, equipment leasing, securities brokerage, and consumer and commercial
finance company operations. Well-capitalized and well-managed bank holding companies may engage de
novo in certain types of non-banking activities without prior notice to, or approval of, the
Federal Reserve, provided that written notice of the new activity is given to the Federal Reserve
within 10 business days after the activity is commenced. If a bank holding company wishes to engage
in a non-banking activity by acquiring a going concern, prior notice and/or prior approval will be
required, depending upon the activities in which the company to be acquired is engaged, the size of
the company to be acquired and the financial and managerial condition of the acquiring bank holding
company.
Eligible bank holding companies that elect to operate as financial holding companies may engage in,
or own shares in companies engaged in, a wider range of non-banking activities, including
securities and insurance activities and any other activity that the Federal Reserve, in
consultation with the Secretary of the Treasury, determines by regulation or order is financial in
nature, incidental to any such financial activity or complementary to any such financial activity
and does not pose a substantial risk to the safety or soundness of depository institutions or the
financial system generally. The BHCA generally does not place territorial restrictions on the
domestic activities of non-bank subsidiaries of bank or financial holding companies. As of this
filing date, FNBH has not applied for approval to operate as a financial holding company and has no
current intention to do so.
Capital Requirements. The Federal Reserve uses capital adequacy guidelines in its
examination and regulation of bank holding companies. If capital falls below minimum guidelines, a
bank holding company may, among other things, be denied approval to acquire or establish additional
bank or non-bank businesses.
The Federal Reserve’s capital guidelines establish the following minimum regulatory capital
requirements for bank holding companies: (i) a leverage capital requirement expressed as a
percentage of total average assets, and (ii) a risk-based requirement expressed as a percentage of
total risk-weighted assets. The leverage capital requirement consists of a minimum ratio of Tier 1
capital (which consists principally of shareholders’ equity) to total average assets of 3% for the
most highly rated companies, with minimum requirements of 4% to 5% for all others. The risk-based
requirement consists of a minimum ratio of total capital to total risk-weighted assets of 8%, of
which at least one-half must be Tier 1 capital.
The risk-based and leverage standards presently used by the Federal Reserve are minimum
requirements, and higher capital levels may be required if warranted by the particular
circumstances or risk profiles of individual banking organizations. The Federal Reserve has not
advised FNBH of any specific capital ratios applicable to it; however, the Bank is currently not in
compliance with minimum capital ratios to which it is subject, as described below.
Dividends. FNBH is an entity separate and distinct from the Bank. The primary source of
FNBH’s revenues are from dividends paid by the Bank. Thus, FNBH’s ability to pay dividends to its
shareholders is limited by statutory restrictions on the Bank’s ability to pay dividends as
described below. Further, in a policy statement, the Federal Reserve has expressed its view that a
bank holding company experiencing earnings weaknesses should not pay cash dividends exceeding its
net income or which can only be funded in ways that weaken the bank holding company’s financial
health, such as by borrowing. Additionally, the Federal Reserve possesses enforcement powers over
bank holding companies and their non-bank subsidiaries to prevent or remedy actions that represent
unsafe or unsound practices or violations of applicable statutes and regulations. Among these
powers is the ability to proscribe the payment of dividends
7
Table of Contents
by bank and bank holding companies.
Similar enforcement powers over the Bank are possessed by the OCC. The “prompt corrective
action” provisions of federal law and regulation authorizes the Federal Reserve to restrict the
payment of dividends by FNBH for an insured bank which fails to meet specified capital levels. Due
to the current financial condition of the Bank, FNBH is currently prohibited from paying any
dividends on its common stock without prior approval from the Federal Reserve. FNBH does not
foresee being able to pay dividends in the near future.
In addition to the restrictions on dividends imposed by the Federal Reserve, the Michigan Business
Corporation Act provides that dividends may be legally declared or paid only if after the
distribution a corporation, such as the Corporation, can pay its debts as they come due in the
usual course of business and its total assets equal or exceed the sum of its liabilities plus the
amount that would be needed to satisfy the preferential rights upon dissolution of any holders of
preferred stock whose preferential rights are superior to those receiving the distribution. The
Corporation’s Articles of Incorporation were amended in February 2009 to authorize the issuance of
up to 30,000 shares of preferred stock, with no par value. As of March 30, 2010, no preferred
shares have been issued.
Federal Securities Regulation. The Corporation’s common stock is registered with the
Securities and Exchange Commission (“SEC”) under the Securities Act of 1933, as amended (the
“Securities Act”), and the Securities Exchange Act of 1934, as amended (the “Exchange Act”). As a
result, the Corporation is subject to the information, proxy solicitation, insider trading and
other restrictions and requirements of the SEC under the Exchange Act. The Sarbanes-Oxley Act of
2002 provides for numerous changes to the reporting, accounting, corporate governance and business
practices of companies as well as financial and other professionals who have involvement with the
U.S. public securities markets. The Corporation’s securities are not listed for trading on any
national or regional securities exchange.
The Bank
General. The Bank is organized as a national banking association and is, therefore,
regulated and supervised by the OCC. The deposit accounts of the Bank are insured by the Deposit
Insurance Fund (the “DIF”) of the FDIC. Consequently, the Bank is also subject to the provisions of
the Federal Deposit Insurance Act. The Bank is subject to the examination, supervision, reporting
and enforcement requirements of the OCC as its primary federal regulator. The OCC and the federal
and state laws applicable to the Bank and its operations, extensively regulate various aspects of
the banking business including, among other things, permissible types and amounts of loans,
investments and other activities, capital adequacy, branching, interest rates on loans and on
deposits, the maintenance of noninterest bearing reserves on deposit accounts, and the safety and
soundness of banking practices.
Deposit Insurance. As an FDIC-insured institution, the Bank is required to pay deposit
insurance premium assessments to the FDIC. Under the FDIC’s risk-based assessment system for
deposit insurance premiums, all insured depository institutions are placed into one of four
categories and assessed insurance premiums based primarily on their level of capital and
supervisory evaluations.
The FDIC is required to establish assessment rates for insured depository institutions at levels
that will maintain the DIF at a Designated Reserve Ratio (DRR) selected by the FDIC within a range
of 1.15% to 1.50%. The FDIC is allowed to manage the pace at which the reserve ratio varies within
this range. The DRR is currently established at 1.25%.
Under the FDIC’s prevailing rate schedule, assessments are made and adjusted based on risk.
Beginning as of the second quarter of 2009, banks in the lowest risk category paid an initial base
rate ranging from 12-16 basis points (calculated as an annual rate against the bank’s deposit base)
for insurance premiums, with certain potential adjustments based on certain risk factors affecting
the bank. That base rate is subject to increase to 45 basis points for banks that pose significant
supervisory concerns, with certain adjustments based on certain risk factors affecting the bank.
For more information about the deposit insurance premiums payable by the Bank, see “Noninterest
Expense” under Item 7, “Management’s Discussion and Analysis of Financial Condition and Results of
Operations” below.
On May 22, 2009, the FDIC adopted a final rule imposing a 5 basis point special assessment on each
insured depository institution’s assets minus Tier 1 capital as of June 30, 2009. This special
assessment (which totaled $173,000 for our Bank) was paid on September 30, 2009. The FDIC may
impose additional special assessments under certain circumstances.
On November 12, 2009, the FDIC enacted assessment regulations requiring insured depository
institutions to prepay their estimated quarterly risk-based deposit insurance assessments for the
fourth quarter of 2009, as well as for all of 2010, 2011 and 2012, by December 30, 2009. The
pre-payment of these assessments is mandatory for all insured depository institutions; however, the
FDIC retained the discretion to exempt certain institutions from the prepayment requirements.
Under these regulations, the FDIC exempted the Bank from prepaying its assessment for the fourth
quarter of 2009, as well as all of 2010, 2011 and 2012. Consequently, the Bank’s premiums continue
to be assessed and collected quarterly by the FDIC.
FDIC insurance assessments could continue to increase in the future due to continued depletion of
the DIF.
In addition, the Bank has also elected to participate in the FDIC’s Transaction Account Guarantee
Program (TAGP). Under the TAGP, funds in noninterest bearing transaction accounts, in interest
bearing transaction accounts with an interest rate of 0.50% or less, and in Interest on Lawyers
Trust Accounts (IOLTA) receive a temporary (until June 30, 2010) unlimited guarantee from the FDIC.
The coverage under the TAGP is in addition to and separate from the coverage available under the
FDIC’s general deposit
8
Table of Contents
insurance rules which insure accounts up to $250,000. Participation in the
TAGP requires the payment of additional premiums by the Bank to the FDIC.
FICO Assessments. The Bank, as a member of the DIF, is subject to assessments to cover the
payments on outstanding obligations of the Financing Corporation (“FICO”). FICO was created to
finance the recapitalization of the Federal Savings and Loan Insurance Corporation, the predecessor
to the FDIC’s Savings Association Insurance Fund (the “SAIF”) which was created to insure the
deposits of thrift institutions and was merged with the Bank Insurance Fund into the DIF in 2006.
From now until the maturity of the outstanding FICO obligations in 2019, DIF members will share the
cost of the interest on the FICO bonds on a pro rata basis. Currently on an annualized basis, FICO
assessments are 0.011% of deposits.
OCC Assessments. National banks are required to pay supervisory fees to the OCC to fund the
operations of the OCC. The amount of supervisory fees paid by a national bank is primarily based
upon the bank’s total assets, as reported to the OCC. Based on current conditions, the Bank is
also subject to a surcharge by the OCC due to the Bank’s need for increased regulatory supervision.
Capital Requirements. The OCC has established the following minimum capital standards for
national banks: a leverage requirement consisting of a minimum ratio of Tier 1 capital to total
average assets of 3% for the most highly-rated banks, with minimum requirements of 4% to 5% for all
others, and a risk-based capital requirement consisting of a minimum ratio of total capital to
total risk-weighted assets of 8%, at least one-half of which must be Tier 1 capital. Tier 1 capital
consists principally of shareholders’ equity. These capital requirements are minimum requirements.
Higher capital levels will be required if warranted by the particular circumstances or risk
profiles of individual institutions. As described below, the OCC has imposed higher capital levels
on the Bank.
Federal law provides the federal banking regulators with broad power to take prompt corrective
action to resolve the problems of undercapitalized institutions. The extent of the regulators’
powers depends on whether the institution in question is “well capitalized”, “adequately
capitalized”, “undercapitalized”, “significantly undercapitalized”, or “critically
undercapitalized”. Federal regulations define these capital categories as follows:
| Total | Tier 1 | |||||
| Risk-Based | Risk-Based | |||||
| Capital Ratio | Capital Ratio | Leverage Ratio | ||||
Well capitalized |
10% or above | 6% or above | 5% or above | |||
Adequately capitalized |
8% or above | 4% or above | 4% or above | |||
Undercapitalized |
Less than 8% | Less than 4% | Less than 4% | |||
Significantly undercapitalized |
Less than 6% | Less than 3% | Less than 3% | |||
Critically undercapitalized |
— | — | A ratio of tangible equity to total assets of 2% or less |
In general, a depository institution may be reclassified to a lower category than is indicated by
its capital levels if the appropriate federal depository institution regulatory agency determines
the institution to be otherwise in an unsafe or unsound condition, be engaged in an unsafe or
unsound practice, or have received an unsatisfactory examination rating with respect to certain
matters.
The Bank is subject to a Consent Order imposed by the OCC on September 24, 2009. Among other
things, the Consent Order requires the Bank to maintain capital ratios higher than the minimum
ratios set forth above. The Consent Order requires the Bank to maintain a minimum Total Risk-Based
Capital Ratio of at least 11% and a Leverage Ratio of at least 8.5%. The Bank is not currently in
compliance with the minimum capital ratios imposed by the Consent Order.
At December 31, 2009, the Bank’s ratios are classified as “undercapitalized” according to the table
set forth above. However, because the capital restoration plan the Bank submitted to the OCC was
not accepted by the OCC, the Bank is now treated as if it were “significantly undercapitalized.”
Depending upon the capital category to which an institution is assigned, the regulators’ corrective
powers include: requiring the submission of a capital restoration plan; placing limits on asset
growth and restrictions on activities; requiring the institution to issue additional capital stock
(including additional voting stock) or to be acquired; restricting transactions with affiliates;
restricting the interest rate the institution may pay on deposits; ordering a new election of
directors of the institution; requiring that senior executive officers or directors be dismissed;
prohibiting the institution from accepting deposits from correspondent Banks; requiring the
institution to divest certain subsidiaries; prohibiting the payment of principal or interest on
subordinated debt; and ultimately, appointing a receiver for the institution. The Bank is subject
to many of these restrictions pursuant to the Consent Order entered on September 24, 2009 and as a
result of the OCC’s rejection of the capital restoration plan submitted by the Bank pursuant to the
requirements of the Consent Order.
Dividends. Under federal law, the Bank is restricted as to the maximum amount of dividends
it may pay on its common stock to the Corporation. The Bank may not pay dividends except out of
undivided net profits then on hand after deducting its losses and bad debts. In addition, the Bank
is required by federal law to obtain the prior approval of the OCC for the declaration or payment
of a dividend, if the total of all dividends declared by the Bank’s Board of Directors in any year
will exceed the total of (i) the Bank’s retained net income (as defined and
9
Table of Contents
interpreted by
regulation) for that year plus (ii) the retained net income for the preceding two years, less any
required transfers to surplus. Federal law generally prohibits a depository institution from making
any capital distribution (including payment of a dividend) or paying any management fee to its
holding company if the depository institution would thereafter be undercapitalized. Further,
federal regulatory agencies can prohibit a banking institution or bank holding company from
engaging in
unsafe and unsound business practices and could prohibit payment of dividends if such payment could
be currently deemed an unsafe and unsound business practice. Due to these requirements and based
upon current conditions, the Bank cannot pay a dividend to the Corporation without the prior
approval of the OCC.
Insider Transactions. The Bank is subject to certain restrictions imposed by the Federal
Reserve Act on any extensions of credit to the Corporation or its subsidiaries, on investments in
the stock or other securities of the Corporation or its subsidiaries and the acceptance of the
stock or other securities of the Corporation or its subsidiaries as collateral for loans. Certain
limitations and reporting requirements are also placed on extensions of credit by the Bank to its
directors and officers, to directors and officers of the Corporation and its subsidiaries, to
principal shareholders of the Corporation, and to “related interests” of such directors, officers
and principal shareholders. In addition, federal law and regulations may affect the terms upon
which any person becoming a director or officer of the Corporation or one of its subsidiaries or a
principal shareholder of the Corporation may obtain credit from a bank with which the Bank
maintains a correspondent relationship.
Safety and Soundness Standards. The federal banking agencies have adopted guidelines to
promote the safety and soundness of federally insured depository institutions. These guidelines
establish standards for internal controls, information systems, internal audit systems, loan
documentation, credit underwriting, interest rate exposure, asset growth, compensation, fees and
benefits, asset quality and earnings.
Consumer Protection Laws. The Bank’s businesses include making a variety of types of loans
to individuals. In making these loans, the Bank is subject to State usury and regulatory laws and
to various federal statutes, including the privacy of consumer financial information provisions of
the Gramm-Leach-Bliley Act and regulations promulgated thereunder, the Equal Credit Opportunity
Act, the Fair Credit Reporting Act, the Truth in Lending Act, the Real Estate Settlement Procedures
Act, and the Home Mortgage Disclosure Act, and the regulations promulgated thereunder, which
prohibit discrimination, specify disclosures to be made to borrowers regarding credit and
settlement costs, and regulate the mortgage loan servicing activities of the Bank, including the
maintenance and operation of escrow accounts and the transfer of mortgage loan servicing. In
receiving deposits, the Bank is subject to extensive regulation under State and federal law and
regulations, including the Truth in Savings Act, the Expedited Funds Availability Act, the Bank
Secrecy Act, the Electronic Funds Transfer Act, and the Federal Deposit Insurance Act. Violation of
these laws could result in the imposition of significant damages and fines upon the Bank and its
directors and officers.
Item 1A. Risk Factors.
Significant uncertainty
regarding the impact of possible further regulatory enforcement action against the Bank
threatens our ability to continue as a going concern. As described elsewhere in this Form 10-K, the Bank is subject
to a Consent Order imposed by the Office of the Comptroller of the Currency (OCC) that requires management to take a
number of actions, including
increasing and maintaining the Bank’s capital levels at amounts in excess of the Bank’s current capital
levels. The Bank has failed to increase its capital levels as required by the Consent Order. As of
the date of this Form 10-K, the Corporation has not entered into any definitive agreement regarding the raising
of additional capital or a potential sale of the Corporation or the Bank, and it is not certain whether the
Corporation will ultimately be able to enter into any such agreement. This failure to comply with the Consent Order
results in the Bank being deemed “significantly
undercapitalized” for purposes of the federal regulators’ Prompt
Corrective Action (PCA) powers and may result in additional regulatory enforcement action. If we are unable to successfully
raise capital or sell the Bank and if our financial condition otherwise fails to improve significantly,
additional regulatory enforcement action against the Bank may result. In its report dated March 30, 2010 (included
in this Form 10-K, below), our independent registered public accounting firm stated that these matters raise
substantial doubt about the Corporation’s ability to continue as a going concern. If we are unable to continue as
a going concern, our shareholders will likely lose all of their
investment in the Corporation.
The consolidated financial statements included in this Form 10-K have
been prepared assuming the Bank continues to operate in the normal
course of business for the foreseeable future, and do not include any
adjustments to recorded assets or liabilities should we be unable to
continue as a going concern.
See “Management’s
Discussion and Analysis of Financial Condition and Results of
Operations” for management’s discussion of our financial condition at December 31, 2009.
The Corporation may not be able to meet federal regulatory requirements regarding the
restoration of capital at the Bank. Since June 30, 2009, the Bank has been undercapitalized by
regulatory capital standards. As a result, the Bank was required to submit a capital restoration
plan to the OCC to demonstrate how the Bank will improve its capital position such that it meets
the minimum capital requirements imposed by the OCC. The Bank submitted a capital restoration plan
to the OCC in September 2009, which as explained below, was not deemed acceptable by the OCC. As
the sole shareholder of the Bank, the Corporation was required to guarantee the Bank’s compliance
with such plan until such time that the Bank becomes adequately capitalized on average during each
of four consecutive calendar quarters. The Corporation’s guarantee was secured by a pledge of the
Corporation’s assets.
By letter dated October 28, 2009, the OCC notified the Bank that its Capital Restoration Plan and
Capital Plan (collectively, the “Plan”) were not acceptable due to an inability to determine that
the Plan was realistic and the uncertainty surrounding whether it would succeed in restoring the
Bank’s capital. The OCC also noted that the Plan failed to identify specific, reliable sources of
additional capital and lacked a detailed strategy for a proposed sale of problem loans.
Consequently, the Corporation remains responsible for preparation and submission of a revised
10
Table of Contents
capital restoration plan that is acceptable to the OCC. As a result of the Bank’s failure to
submit an acceptable capital plan within an acceptable time, for purposes of Prompt Correction
Action, the Bank is now considered “significantly undercapitalized” by regulatory standards.
While the Bank intends to submit a revised Plan to the OCC, the Bank does not believe any Plan will
be deemed acceptable to the OCC unless it contains a firm commitment by one or more
investors to make the additional capital contributions necessary for the Bank to meet its minimum
capital ratios or to otherwise acquire the Bank. The Bank’s classification as “significantly
undercapitalized” results in a number of additional restrictions on its operations as described
below in “Management’s Discussion and Analysis of Financial Condition and Results of Operation”.
The Bank’s ability to comply with the capital restoration plan will be very challenging. Although
the Corporation is actively pursuing additional investment from potential investors, the
Corporation currently does not have any formal commitment from any investor. As described under
“Management’s Discussion and Analysis of Financial Condition and Results of Operations — Capital”
below, the Corporation’s ability to raise additional capital is significantly restricted by several
factors, and there is a meaningful possibility the Corporation will not be successful in raising
additional capital. In addition, the Corporation’s management believes the likelihood of a third
party acquiring the Corporation or the Bank is relatively low. As a result, the Bank may not be
able to comply with the capital restoration plan submitted to the OCC.
If the Bank and the Corporation are unable to resubmit and comply with a revised capital
restoration plan that is acceptable to the OCC, it is likely the OCC would take increasingly severe
actions against the Bank which could lead to the Bank being placed into receivership by federal
regulators. In such a scenario, it is unlikely the holders of the Corporation’s common stock would
realize any value for their common stock.
The Bank’s capital may not be sufficient to support the risk inherent in its loan
portfolio. The Bank maintains capital as a means of absorbing losses resulting from the Bank’s
operations. The Bank has incurred significant losses in each of the last three years, which losses
have significantly depleted the Bank’s capital and resulted in the Bank being considered
“undercapitalized” pursuant to regulatory capital standards. A continuing decline in the
collectibility of the Bank’s loans, a continuing decline in the value of the collateral supporting
those loans, or both, may require the Bank to increase its allowance for loan losses, which would
further deplete existing capital. Due to the economic conditions in the areas where the Bank
operates, the Bank expects to continue to incur operating losses in the near-term, including
through 2010. The Bank’s current capital may be insufficient to absorb future operating losses
and, unless the Bank is successful in raising additional capital or taking other steps to
meaningfully reduce the risk in its loan portfolio, this lack of capital is likely to have a
material adverse effect on the Corporation’s business, results of operations, and financial
condition and, in extreme circumstances, could result in the insolvency and liquidation of the
Bank.
There are other consequences of the Bank’s current financial condition that will present
additional challenges to the Bank and could, individually or collectively, result in material
adverse effects on the Corporation’s financial condition. The amount of FDIC deposit insurance
premiums required to be paid by financial institutions depends in part on the institution’s risk
rating and capital position. As a result of the Bank’s current capital position, the assessment
rate to be paid by the Bank for FDIC deposit insurance has increased significantly. This rate
increase is in addition to any industry-wide rate increases for all insured depository institutions
and is in addition to any special assessments imposed by the FDIC. These higher assessment rates
charged against the Bank are expected to continue into 2010.
In addition, as a result of the Bank’s failure to meet minimum capital requirements, it is
prohibited from accepting, renewing, or rolling over any brokered deposits, and the effective yield
on deposits solicited by the Bank cannot be more than 75 basis points over national market yields
for comparable size and maturity deposits. These restrictions could serve to limit the Bank’s
flexibility should conditions deteriorate or in the event of unexpected problems with the Bank’s
liquidity position.
We are in the business of lending, which involves substantial credit risk, and our allowance
for loan losses may not be sufficient to cover actual loan losses. If our loan customers do
not repay their loans according to their respective terms, and if we are unable to collect on the
loans through foreclosure of any collateral securing repayment, we may experience significant
credit losses, which could have a material adverse effect on our operating results. We have
established an allowance for loan losses that is intended to approximate credit losses inherent in
our current loan portfolio and prevent negative effects on our operating results as a result of
loan losses. In determining the size of the allowance, we make various assumptions and judgments
about the collectability of our loan portfolio, including the creditworthiness of our borrowers and
the value of the real estate and other assets serving as collateral for the repayment of many of
our loans. In doing so, we rely primarily on our experience and our evaluation of current economic
conditions, including use of current appraisals and valuations performed by licensed appraisers. If
our assumptions or judgments prove to be incorrect, our current allowance for loan losses may not
be sufficient to cover certain loan losses inherent in our loan portfolio, and adjustments may be
necessary to allow for different economic conditions or adverse developments in our loan portfolio.
Material additions to our allowance would materially decrease our net income.
As of December 31, 2009, approximately 86% of the Bank’s loan portfolio is commercial loans. Of
these, approximately 70% are loans made for land development, single family home construction and
leasing of commercial properties. Commercial loans are generally viewed as having more inherent
risk of default than residential mortgages or consumer loans. Also, the commercial loan balance
per borrower is generally greater then that of a residential mortgage loan or consumer loan,
inferring higher potential losses on an individual loan basis.
11
Table of Contents
In addition, federal regulators periodically review our allowance for loan losses and, if
warranted, may require us to increase our provision for loan losses or recognize additional loan
charge offs. Any increase in our allowance for loan losses or loan charge offs required by these
regulatory agencies could have a material adverse effect on our results of operations and financial
condition.
Current market developments, particularly in real estate markets, may adversely affect our
industry, business and results of operations. Dramatic declines in the real estate market in
recent years, with falling home prices and increasing foreclosures and unemployment, have resulted
in, and may continue to result in, significant write-downs of asset values by us and other
financial institutions. These write-downs have caused many financial institutions to seek
additional capital, to merge with larger and stronger institutions and, in some cases, to fail. As
a result of these conditions, many lenders and institutional investors have reduced, and in some
cases, ceased to provide funding to borrowers including financial institutions.
This market turmoil and tightening of credit have led to an increased level of commercial and
consumer delinquencies, lack of consumer confidence, increased market volatility and widespread
reduction of business activity generally. The resulting lack of available credit, lack of
confidence in the financial sector, increased volatility in the financial markets and reduced
business activity could materially and adversely affect our business, financial condition and
results of operations.
Further negative market developments may continue to negatively affect consumer confidence levels
and may continue to contribute to increases in delinquencies and default rates, which may impact
our charge-offs and provisions for credit losses. A worsening of these conditions would likely
exacerbate the adverse effects of these difficult market conditions on us and others in the
financial services industry.
We are heavily weighted with loans secured by real estate and further declines in the real
estate market and the overall economy may result in higher loan losses. A large majority of
our loans are secured by residential and commercial real estate. While cash flows from our
commercial customers’ business operations are intended to provide for repayment of their loans,
further declines in the economy may impact their ability to do so. The Bank relies on the
underlying collateral of a loan as the secondary source of repayment. If collateral values
continue to decline because of further declines in the overall real estate market, the Bank may
incur increased loan losses.
Fluctuations in interest rates could reduce our profitability. We realize income primarily
from the difference between interest earned on loans and investments and the interest paid on
deposits and borrowings. Our interest income and interest expense are affected by general economic
conditions and by the policies of regulatory authorities. While we have taken measures intended to
manage the risks of operating in a changing interest rate environment, there can be no assurance
that these measures will be effective in avoiding undue interest rate risk. We expect that we will
periodically experience “gaps” in the interest rate sensitivities of our assets and liabilities,
meaning that either our interest-bearing liabilities will be more sensitive to changes in market
interest rates than our interest-earning assets, or vice versa. In either event, if market interest
rates should move contrary to our position, this “gap” will work against us, and our earnings may
be negatively affected.
Moreover, we are unable to predict fluctuations of market interest rates, and among other factors,
changes in the following:
| • | Inflation or deflation rates; | ||
| • | Levels of business activity; | ||
| • | Recession; | ||
| • | Unemployment levels; | ||
| • | Money supply; | ||
| • | Domestic or foreign events; and | ||
| • | Instability in domestic and foreign financial markets |
Competition with other financial institutions and financial service providers could adversely
affect our profitability. We face vigorous competition from banks and other financial
institutions, including savings and loan associations, savings banks, finance companies, and credit
unions. Many of these banks and other financial institutions have substantially greater resources
and lending limits, larger branch systems, and a wider array of banking services. To a limited
extent, we also compete with other providers of financial services, such as money market mutual
funds, brokerage firms, consumer finance companies, and insurance companies, which are not subject
to the same degree of regulation as that imposed on bank holding companies. As a result, these
non-bank competitors may have an advantage over us in providing certain services, and this
competition may reduce or limit our margins on banking services, reduce our market share, and
adversely affect our results of operations and financial condition.
As a community bank, our financial condition is dependent, in part, on the general economic
condition of the communities we serve. Our operations are primarily limited to Livingston
County and surrounding areas; and, therefore, our success depends to a great extent upon the
general economic conditions of such region. In general, the economy of the State of Michigan has
suffered in recent years as a result of the struggling automotive industry and other factors.
Unlike larger banks that are more geographically diversified, our loan portfolio, the ability of
the borrowers to repay these loans and the value of the collateral securing these loans will be
impacted, to a greater extent, by local economic conditions. A continued economic slowdown could
have many adverse consequences, including the following: loan delinquencies may increase, problem
assets and foreclosures may increase, demand for our products and services may decline, and
collateral for our loans may decline in value, in turn reducing customers’ borrowing power and
reducing the value of assets and collateral associated with existing loans. In particular during
2009, 2008 and 2007 our level of nonperforming loans, net
12
Table of Contents
loan charge offs, loan delinquencies and
provision for loan losses either increased over the prior year or remained elevated from prior
historical levels.
Additionally, the overall capital and credit markets have been experiencing unprecedented levels of
volatility and disruption for more than a year. In some cases, the markets have produced downward
pressure on stock prices and credit availability for certain issuers
without regard to those issuers’ underlying financial strength. As a consequence of the U.S.
recession, business activity across a wide range of industries faces serious difficulties due to
the lack of consumer spending and the extreme lack of liquidity in the global credit markets. In
addition, unemployment has increased to historically high levels and is expected to remain elevated
for some time. In particular, according to data published by the federal Bureau of Labor
Statistics, Michigan’s unemployment rate in December 2009 of 14.6% was the worst among all states.
During the past year, the general business environment has had an overall adverse effect on our
business, and this environment is not expected to improve materially in the near term. Until
conditions improve, we expect our businesses, financial condition and results of operations to
continue to be adversely affected. In addition, a continued downturn in the national economy may
impact our operations.
We operate in a highly regulated environment and may be adversely affected by changes in laws
and regulations. We are subject to extensive regulation, supervision, and examination by
federal banking authorities. Any change in applicable legislation could have a substantial impact
on us and our Bank and its operations. Additional legislation may be enacted or adopted in the
future that could significantly affect our powers, authority, and operations, which could increase
our costs of doing business and, as a result, give an advantage to our competitors who may not be
subject to similar legislative and regulatory requirements. Further, regulators have significant
discretion and power to prevent or remedy unsafe or unsound practices or violations of laws by
banks and bank holding companies in the performance of their supervisory and enforcement duties.
The exercise of regulatory power may have a negative impact on our results of operations and
financial condition.
We may face challenges in managing our operational risk. Like other financial services
companies, we face a number of operational risks, including the potential for processing errors,
internal or external fraud, failure of computer systems, and external events beyond our control
such as natural disasters. Acts of fraud are difficult to detect and deter, and we cannot assure
investors that our risk management procedures and controls will prevent losses from fraudulent
activity.
Difficult market conditions have adversely affected our industry. Dramatic declines in the
housing market over the past year, with falling home prices and increasing foreclosures,
unemployment and under-employment, have negatively impacted the credit performance of real estate
related loans and resulted in significant write-downs of asset values by financial institutions.
This has also resulted in the write-downs of asset-backed securities and other securities and
loans. Reflecting concern about the stability of the financial markets generally and the strength
of counterparties, many lenders and institutional investors have reduced or ceased providing
funding to borrowers, including to other financial institutions. This market turmoil and
tightening of credit have led to an increased level of commercial and consumer delinquencies, lack
of consumer confidence, increased market volatility and widespread reduction of business activity
generally. Further negative market developments may affect consumer confidence levels and may cause
adverse changes in payment patterns, causing increases in delinquencies and default rates, which
may impact our charge offs and provision for credit losses. A worsening of these conditions would
likely exacerbate the adverse effects of these difficult market conditions on us and others in the
financial institutions industry.
Current levels of market volatility are unprecedented. The capital and credit markets have
been experiencing volatility and disruption for a significant portion of the last two years. During
2009, the volatility and disruption reached unprecedented levels. In some cases, the markets have
produced downward pressure on stock prices and credit availability for certain issuers without
regard to those issuers’ underlying financial strength. If market disruption and volatility
continue or worsen, there can be no assurance that we will not experience an adverse effect, which
may be material, on our ability to access capital and on our business, financial condition and
results of operations.
There can be no assurance that recently enacted legislation will stabilize the U.S. financial
system. Beginning in the fourth quarter of 2008 and continuing into 2009, the federal
government has enacted new laws intended to strengthen and restore confidence in the U.S. financial
system. See Item 1 “Regulatory Developments” above for additional information regarding these
developments. There can be no assurance, however, as to the actual impact that such programs will
have on the financial markets, including the extreme levels of volatility and limited credit
availability currently being experienced. The failure of these and other programs to stabilize the
financial markets and a continuation of worsening of current financial market conditions could
materially and adversely affect our business, financial condition, results of operations, access to
credit or the trading price of our common stock.
In addition, these statutes are relatively new initiatives and, as such, are subject to change and
evolving interpretation. There can be no assurances as to the effects that any such changes will
have on the effectiveness of the federal government’s efforts to stabilize the credit markets or on
our business, financial condition or results of operations.
The impact on us of recently enacted legislation, in particular the Emergency Economic
Stabilization Act of 2008 and its implementing regulations, and actions by the FDIC, cannot be
predicted at this time. The programs established or to be established under the EESA and TARP
Program may have adverse effects upon us. We may face increased regulation of our industry.
Compliance with such regulation may increase our costs and limit our ability to pursue business
opportunities. Also, participation in
13
Table of Contents
specific programs may subject us to additional restrictions.
Similarly, programs established by the FDIC under the systemic risk exception of the FDA, whether
we participate or not, may have an adverse effect on us. Participation in the FDIC Temporary
Liquidity Guarantee Program will require the payment of additional insurance premiums to the FDIC.
We may be required to pay significantly higher FDIC premiums even if we do not participate in all
aspects of the FDIC Temporary Liquidity Guarantee Program because market developments have
significantly depleted the insurance fund of the FDIC and reduced the ratio of reserves to insured
deposits.
We have credit risk inherent in our securities portfolio. We maintain diversified
securities portfolios, which include obligations of the U.S. Treasury and government-sponsored
agencies as well as securities issued by states and political subdivisions, mortgage-backed
securities, and asset-backed securities. We also invest in capital securities which includes
preferred stocks. We seek to limit credit losses in our securities portfolios by generally
purchasing only highly rated securities (rated “AA” or higher by a major debt rating agency) or by
conducting significant due diligence on the issuer for unrated securities. However, we may, in the
future, experience additional losses in our securities portfolio which may result in charges that
could materially adversely affect our results of operations.
Changes in accounting standards could impact our reported earnings. Financial accounting
and reporting standards are periodically changed by the Financial Accounting Standards Board
(FASB), the SEC, and other regulatory authorities. Such changes affect how we are required to
prepare and report our consolidated financial statements. These changes are often hard to predict
and may materially impact our reported financial condition and results of operations. In some
cases, we may be required to apply a new or revised standard retroactively, resulting in the
restatement of prior period financial statements.
We may not pay dividends on our common stock. Holders of shares of our common stock are
only entitled to receive such dividends as our Board of Directors may declare out of funds legally
available for such payments. Our inability to pay dividends to our common stock shareholders could
adversely affect the market price of our stock.
There have been numerous media reports about bank failures, which we expect will continue as
additional banks fail. These reports have created concerns among certain of our customers,
particularly those with deposit balances in excess of deposit insurance limits. We have proactively
sought to provide appropriate information to our deposit customers about our organization in order
to retain our business and deposit relationships. The outflow of significant amounts of deposits
could have an adverse impact on our liquidity and results of operations.
If successful, our efforts to raise additional capital as set forth in our Capital Plan will be
highly dilutive to our common shareholders. Our Capital Plan contemplates the issuance of a
significant number of shares of our preferred stock to recapitalize the Corporation. The completion
of such capital raise is likely to be highly dilutive to our common shareholders. There can be no
assurances provided regarding the market price of our common stock relative to the effect of a
successful capital raising transaction or the perception that such transaction could occur.
The capital raise initiative we are pursuing could result in one or more private investors
owning a significant percentage of our stock and having the ability to exert significant influence
over our management and operations. The capital raise initiative set forth in our Capital Plan
may result in one or more large investors owning a significant portion of our common stock. This
could occur if one or more large investors makes a significant investment in our preferred stock.
Any such significant shareholder could exercise significant influence on matters submitted to our
shareholders for approval, including the election of directors. In addition, having a significant
shareholder could make future transactions more difficult or even impossible to complete without
the support of such shareholder, whose interests may not coincide with interests of smaller
shareholders. These possibilities could have an adverse effect on the market price of our common
stock.
It is possible that a successful capital raise initiative as set forth in our Capital Plan
could trigger an ownership change that will negatively affect our ability to utilize net operating
loss carryforwards and other deferred tax assets in the future. As of December 31, 2009, we had
federal net operating loss carryforwards of approximately $9.4 million, and such amount may grow
significantly in the future. Under federal tax law, our ability to utilize these carryforwards and
other deferred tax assets is limited if we are deemed to experience a change of ownership. This
would result in our loss of the benefit of these deferred tax assets. The capital raise
transaction contemplated by our Capital Plan could cause a change of ownership under these rules,
which would likely materially limit our ability to utilize these significant deferred tax assets.
The trading price of our common stock may be subject to continued significant fluctuations and
volatility. The market price of our common stock could be subject to significant fluctuations
due to, among other things:
| • | announcements regarding significant transactions in which we may engage, including the capital raise initiative included in our Capital Plan; | ||
| • | market assessments regarding such transactions, including the timing, terms, and likelihood of success of our capital raise initiative(s); | ||
| • | operating results that vary from the expectations of management, securities analysts, and investors, including with respect to further loan losses we may incur; | ||
| • | changes or perceived changes in our operations or business prospects; | ||
| • | legislative or regulatory changes affecting our industry generally or our businesses and operations; |
14
Table of Contents
| • | the failure of general market and economic conditions to stabilize and recover, particularly with respect to economic conditions in Michigan, and the pace of any such stabilization and recovery; | ||
| • | the operating and share price performance of companies that investors consider to be comparable to us; | ||
| • | other changes in global financial markets, economies, and market conditions, such as interest or foreign exchange rates, stock, commodity, credit or asset valuations or volatility. |
Stock markets in general, and our common stock in particular, have experienced significant
volatility over approximately the past two years, and continue to experience significant price and
volume volatility. As a result, the market price of our common stock may
continue to be subject to similar market fluctuations that may or may not be related to our
operating performance or prospects. Increased volatility could continue to adversely impact the
market price of our common stock.
We rely heavily on our management team, including our loan officers, and the unexpected loss of
key employees may adversely affect our operations. As a community bank, our success depends
largely on our ability to attract and to retain key employees who are experienced in banking and
financial services and who have developed relationships within the communities served by our Bank.
Our ability to retain these key employees will continue to be important to our business and
financial results. The unexpected loss of services of key personnel, or the inability to recruit
and retain qualified personnel in the future, could have an adverse effect on our business and
financial results.
Item 1B. Unresolved Staff Comments.
None.
Item 2. Properties.
The Bank operates from eight facilities, located in five communities, in Livingston County,
Michigan. The executive offices of the Corporation are located at the Bank’s main office, 101 East
Grand River, Howell, Michigan. The Bank maintains two branches in Howell at 4299 East Grand River
and 2400 West Grand River. The Bank also maintains branch offices at 9911 East Grand River,
Brighton, Michigan; 8080 Challis Road, Brighton, Michigan; 760 South Grand Avenue, Fowlerville,
Michigan; 10700 Highland Road, Hartland, Michigan; and 9775 M-36, Whitmore Lake, Michigan. All of
the offices have ATM machines and all except the West Grand River branch, which is in a grocery
store, have drive up services. All of the properties are owned by the Bank except for the West
Grand River branch which is leased. The lease is for 5 years with two 5 year renewal options,
expiring September 2022. The average lease payment over the remaining life of the lease is $4,000
monthly.
Item 3. Legal Proceedings.
The Corporation is not involved in any material legal proceedings. The Bank is involved in ordinary
routine litigation incident to its business; however, no such proceedings are expected to result in
any material adverse effect on the operations or earnings of the Bank. Neither the Bank nor the
Corporation is involved in any proceedings to which any director, principal officer, affiliate
thereof, or person who owns of record or beneficially more than five percent (5%) of the
outstanding stock of either the Corporation or the Bank, or any associate of the foregoing, is a
party or has a material interest adverse to the Corporation or the Bank.
Item 4. Reserved.
Additional Item –Executive Officers of Registrant
Executive officers of the Corporation are appointed annually by the Board of Directors. There are
no family relationships among these officers and/or the directors of the Corporation, or any
arrangement or understanding between any officer and any other person pursuant to which the officer
was elected.
The Corporation’s executive officers as of March 15, 2010 are as follows:
Ronald L. Long (Age 50), President, Chief Executive Officer, since May 12, 2008; Senior Vice
President and Senior Business Development Officer, Independent Bank from October 2007 through
January 2008; President and Chief Executive Officer, Independent Bank East Michigan from 1993
through September 2007.
Nancy Morgan (Age 59), Senior Vice President, Human Resources, since October 2001; and Vice
President, Human Resources, of the Bank from June 1999 to October 2001.
Mark J. Huber (Age 41), Senior Vice President, Chief Financial Officer, since June 4, 2009; Senior
Manager, specializing in financial institutions, with Plante & Moran, PLLC from 1993 – 2009.
Paul Stark (Age 51), Senior Vice President, Chief Credit Officer since April 13, 2009. Senior Vice
President, Director of Credit Risk Management with First Merit Corporation from 2003 – 2009.
15
Table of Contents
Gerald Moyer (Age 56), Senior Vice President, Commercial Loan Officer since April 13, 2009, Chief
Work Out Officer August 16, 2008 – April 12, 2009, Vice President, Commercial Loan Officer April
21, 2008 – August 15, 2008. Vice President and Senior Relationship Manager, Private Financial
Group, with Huntington National Bank from June 2001 – March 2008.
PART II
Item 5. Market for Registrant’s Common Equity, Related Shareholder Matters and Issuer Purchases of
Equity Securities.
There is not an established trading market for the Corporation’s Common Stock. Information
regarding its market price can be obtained on the Internet at nasdaq.com, symbol FNHM. There are
occasional direct sales by shareholders of which the Corporation’s management is generally aware.
From January 1, 2008, through December 31, 2009, there were, so far as the Corporation’s management
knows, a total of 553,407 shares of the Corporation’s Common Stock sold. The price was reported to
management in some of these transactions; however, there may have been other transactions involving
the Corporation’s stock at prices not reported to management. During 2009, the highest and lowest
prices known to management involving sales of more than 200 shares were $4.40 and $0.05 per share,
respectively. To the knowledge of management, the last sale of Common Stock occurred on March 29,
2010 at a price of $0.38 per share.
As of March 1, 2010, there were approximately 800 holders of record of the Corporation’s stock. The
following table sets forth the range of high and low sales prices of the Corporation’s Common Stock
during 2008 and 2009, based on information made available to the Corporation, as well as per share
cash dividends declared during those periods. Although management is not aware of any transactions
exceeding 200 shares at higher or lower prices, there may have been transactions at prices outside
the ranges listed in the table.
Sales prices, for sales involving more than 200 shares, and dividend information for the years 2008
and 2009 are as follows:
| Sale Prices | ||||||||||||
| 2008 | High | Low | Cash Dividends Declared | |||||||||
First Quarter |
$ | 13.60 | $ | 12.00 | $ | 0.08 | ||||||
Second Quarter |
$ | 13.40 | $ | 9.07 | $ | 0.08 | ||||||
Third Quarter |
$ | 9.07 | $ | 4.50 | $ | 0.00 | ||||||
Fourth Quarter |
$ | 4.85 | $ | 4.00 | $ | 0.00 | ||||||
| Sale Prices | ||||||||||||
| 2009 | High | Low | Cash Dividends Declared | |||||||||
First Quarter |
$ | 4.40 | $ | 1.20 | $ | 0.00 | ||||||
Second Quarter |
$ | 2.52 | $ | 2.00 | $ | 0.00 | ||||||
Third Quarter |
$ | 2.00 | $ | 0.98 | $ | 0.00 | ||||||
Fourth Quarter |
$ | 0.98 | $ | 0.05 | $ | 0.00 | ||||||
The holders of the Corporation’s common stock are entitled to dividends when, as, and if declared
by the Board of Directors of the Corporation out of funds legally available for that purpose.
Dividends were paid on a quarterly basis until the third quarter of 2008 at which time dividends
were indefinitely suspended. In determining dividends, the Board of Directors considers the
earnings, capital requirements and financial condition of the Corporation and the Bank, along with
other relevant factors. The Corporation’s principal source of funds for cash dividends is the
dividends paid by the Bank. The ability of the Corporation and Bank to pay dividends is subject to
statutory and regulatory restrictions and requirements. The Bank cannot currently, under these
requirements, pay a dividend to the Corporation without the prior approval of the OCC.
The Corporation did not repurchase any of its stock during the fourth quarter of 2009, nor has the
Corporation’s Board adopted or approved a stock repurchase program.
16
Table of Contents
SHAREHOLDER RETURN PERFORMANCE GRAPH
Set forth below is a line graph comparing the yearly percentage change in the cumulative total
shareholder return on the Corporation’s common stock with that of the cumulative total return on
the NASDAQ Stock Market Index and the NASDAQ Bank Stocks Index for the five year period ended
December 31, 2009. The following information is based on an investment of $100, on January 1, 2005,
in the Corporation’s common stock, the NASDAQ Bank Stocks Index and the NASDAQ Stock Market Index,
with dividends reinvested. There has been only limited trading in the Corporation’s common stock,
and the Corporation’s stock does not trade on any stock exchange or the NASDAQ market. Accordingly,
the returns reflected in the following graph and tables are based on sale prices of the
Corporation’s stock of which management is aware. There may have been sales at higher or lower
prices of which management is not aware.
COMPARISON OF FIVE YEAR CUMULATIVE TOTAL RETURN
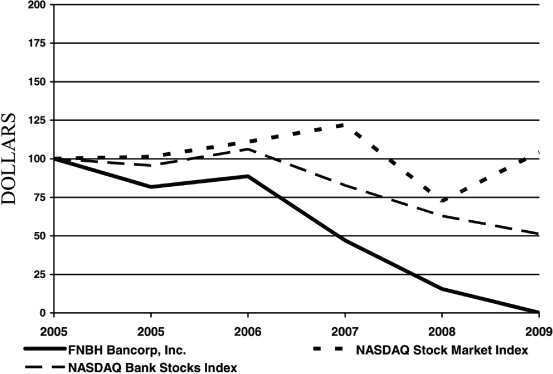
| January 1 | December 31 | |||||||||||||||||||||||
| 2005 | 2005 | 2006 | 2007 | 2008 | 2009 | |||||||||||||||||||
FNBH Bancorp, Inc. |
100 | 81.8 | 88.65 | 47.04 | 15.54 | 0.21 | ||||||||||||||||||
NASDAQ Stock Market Index |
100 | 101.37 | 111.03 | 121.92 | 72.49 | 104.31 | ||||||||||||||||||
NASDAQ Bank Stocks Index |
100 | 95.67 | 106.20 | 82.76 | 62.96 | 51.31 | ||||||||||||||||||
17
Table of Contents
Item 6. Selected Financial Data.
SUMMARY FINANCIAL DATA
(in thousands, except per share data)
(in thousands, except per share data)
| 2009 | 2008 | 2007 | 2006 | 2005 | ||||||||||||||||
Statement of Operations Data: |
||||||||||||||||||||
Interest income |
$ | 17,870 | $ | 24,307 | $ | 30,173 | $ | 31,818 | $ | 29,315 | ||||||||||
Interest expense |
4,632 | 8,118 | 11,884 | 10,295 | 7,054 | |||||||||||||||
Net interest income |
13,238 | 16,189 | 18,289 | 21,523 | 22,261 | |||||||||||||||
Provision for loan losses |
15,847 | 14,855 | 14,030 | 2,639 | 3,037 | |||||||||||||||
Noninterest income (1) |
3,569 | 3,341 | 3,755 | 4,031 | 3,820 | |||||||||||||||
Gain (loss) on available for sale securities (1) |
199 | (3,237 | ) | (548 | ) | — | — | |||||||||||||
Noninterest expense (2) |
15,939 | 14,979 | 13,493 | 14,939 | 13,653 | |||||||||||||||
Loss on sale/writedown of commercial loans
held for sale (2) |
— | — | 4,312 | — | — | |||||||||||||||
Income (loss) before tax |
(14,780 | ) | (13,541 | ) | (10,339 | ) | 7,976 | 9,391 | ||||||||||||
Net income (loss) |
(13,696 | ) | (13,414 | ) | (6,556 | ) | 5,586 | 6,507 | ||||||||||||
Per Share Data: |
||||||||||||||||||||
Basic net income (loss) per share |
$ | (4.32 | ) | $ | (4.33 | ) | $ | (2.13 | ) | $ | 1.76 | $ | 2.03 | |||||||
Diluted net income (loss) per share |
(4.32 | ) | (4.33 | ) | (2.13 | ) | 1.76 | 2.03 | ||||||||||||
Dividends paid |
— | 0.16 | 0.84 | 0.84 | 0.80 | |||||||||||||||
Weighted average basic shares outstanding |
3,167,918 | 3,096,332 | 3,074,732 | 3,177,093 | 3,200,146 | |||||||||||||||
Weighted average diluted shares outstanding |
3,167,918 | 3,096,332 | 3,074,732 | 3,177,146 | 3,200,518 | |||||||||||||||
Balance Sheet Data: |
||||||||||||||||||||
Total assets |
$ | 332,390 | $ | 388,783 | $ | 432,894 | $ | 473,896 | $ | 477,225 | ||||||||||
Loans, gross |
274,046 | 315,817 | 347,876 | 384,581 | 372,855 | |||||||||||||||
Allowance for loan losses |
18,665 | 14,122 | 10,314 | 7,598 | 6,991 | |||||||||||||||
Deposits |
315,196 | 349,527 | 379,578 | 405,544 | 422,086 | |||||||||||||||
Shareholders’ equity |
14,376 | 27,525 | 40,627 | 49,992 | 49,446 | |||||||||||||||
Ratios: |
||||||||||||||||||||
Dividend payout ratio |
N/A | N/A | N/A | 47.55 | % | 39.15 | % | |||||||||||||
Average equity to average asset ratio |
5.80 | % | 9.24 | % | 10.47 | % | 10.86 | % | 10.18 | % | ||||||||||
| (1) | Included in noninterest income in the “Consolidated Statements of Operations” and discussed under the caption “Noninterest Income” under Item 7 “Management’s Discussion and Analysis of Financial Condition and Results of Operations”. | |
| (2) | Included in noninterest expense in the “Consolidated Statements of Operations” and discussed under the caption “Noninterest Expense” under Item 7 “Management’s Discussion and Analysis of Financial Condition and Results of Operations”. |
Item 7. Management’s Discussion and Analysis of Financial Condition and Results of Operations.
This discussion provides additional information to assess the consolidated financial condition and
results of operations of FNBH Bancorp, Inc. (“Corporation”) and its subsidiaries. This section
should be read in conjunction with the consolidated financial statements and the supplemental
financial data contained elsewhere in this annual report.
Included or incorporated by reference in this document are certain forward-looking statements
within the meaning of Section 27A of the Securities Act of 1933, as amended, and Section 21E of the
Securities Exchange Act of 1934, as amended. Such forward-looking statements are based on the
beliefs of the Corporation’s management as well as on assumptions made by, and information
currently available to, the Corporation at the times such statements were made. Actual results
could differ materially from those included in such forward-looking statements as a result of,
among other things, factors set forth below in this Report generally, and certain economic and
business factors, some of which may be beyond the control of the Corporation. Investors are
cautioned that all forward-looking statements involve risks and uncertainty.
During
2009, the level of regulatory enforcement action taken against the Bank by the Office of the
Comptroller of the Currency (OCC) heightened from a formal agreement entered into on October 16,
2008 to the issuance of a Consent Order (the “Order”) dated September 24, 2009. Pursuant to the
Order, the Bank was required to achieve and maintain total capital equal to 11% of risk weighted
assets and Tier 1 capital equal to at least 8.5% of adjusted total assets by January 22, 2010. The
Bank failed to meet these required minimum ratios by such deadline and is currently out of
compliance with these required minimum capital ratios.
Under the terms of the Consent Order with the OCC, referenced above, the Bank submitted to the OCC
a capital restoration plan and capital plan (collectively, the “Plan”). The OCC has determined
that the Plan is not acceptable, principally due to the fact that the OCC is unable to determine
that the Plan is realistic and likely to succeed in restoring the Bank’s capital, based upon the
information provided in the Plan.
18
Table of Contents
As noted below, the Bank intends to update the Plan and continue
to pursue its capital raising efforts as well as resubmit the Plan to the OCC.
As a result of its failure to submit an acceptable plan to the OCC within the permitted time, for
purposes of Prompt Corrective Action (“PCA”) the Bank is now treated as if it were “significantly
undercapitalized”. As a result of this classification, for purposes of PCA, the Bank is subject to
a number of additional restrictions. These include, among other things, (1) the requirement that
the Bank obtain prior written approval of the OCC before paying any bonus or increase in the
compensation of any senior executive officer of the Bank, (2) prohibitions on the acceptance of
employee benefit plan deposits, and (3) restrictions on interest rates paid on deposits. As of
December 31, 2009, the Bank’s capital ratios are significantly below the increased minimum
requirements imposed by the OCC. In light of the Bank’s continued losses and capital position at
December 31, 2009 and the lack of any commitments for the investment of additional capital as of
the current date, it is reasonable to anticipate further regulatory enforcement action by the OCC.
The success of the Corporation depends to a great extent upon the economic conditions in Livingston
County and the surrounding area. The Corporation has in general experienced a slowing economy in
Michigan since 2001. In particular, Michigan’s current unemployment rate of nearly 15% is the
worst among all states. Unlike larger banks that are more geographically diversified, we provide
banking services to customers primarily in Livingston County. Our loan portfolio, the ability to
of the borrowers to repay these loans, and the value of the collateral securing these loans is
impacted by local economic conditions. The continued economic difficulties in Michigan have had
and may continue to have many adverse consequences as described below in “Loans”.
Dramatic declines in the housing market in recent years, with falling home prices and elevated
levels of foreclosures and unemployment have resulted in and may continue to result in significant
write-downs of asset values by us and other financial institutions. These write-downs have caused
many financial institutions to seek additional capital, to merge with larger and stronger
institutions and, in some cases, to fail. Additionally, capital and credit markets have continued
to experience elevated levels of volatility and disruption over the past two years. This market
turmoil and tightening of credit have led to a lack of general consumer confidence and reduction in
business activity.
Due to the conditions and events discussed above and elsewhere in this Form 10-K, there is
significant uncertainty regarding the impact of potential future regulatory action against the
Bank. The extent of such regulatory action may threaten the ability of the Bank to continue
operating as a going concern. Notwithstanding the above, the consolidated financial statements
included in this Form 10-K have been prepared assuming the Bank continues to operate in the normal
course of business for the foreseeable future, and do not include any adjustments to recorded
assets or liabilities should we be unable to continue as a going concern.
As noted below and fully described in Note 2 “Management’s Plan” to the consolidated financial
statements, management has undertaken various initiatives to address the current challenges facing
the Bank. The successful implementation of the various actions being undertaken by management will
be difficult in the current economic environment. Even if such actions are successfully
implemented, such strategy may not be sufficient to increase the Bank’s capital levels to
satisfactory levels, return the Bank to profitability, or otherwise avoid further regulatory
enforcement action.
In response to these regulatory challenges, difficult market conditions and significant losses
incurred in the past three years that have depleted a substantial portion our capital, we have
taken steps or initiated actions in an attempt to restore our capital levels and improve our
operations, including:
| • | On February 19, 2009, we held a special shareholders’ meeting at which our shareholders approved an amendment to the Corporation’s Articles of Incorporation to authorize the Board of Directors to issue up to 30,000 shares of preferred stock. Additionally, at the annual meeting on May 28, 2009 our shareholders approved a 2,800,000 increase in the number of authorized shares of common stock. We requested the authorization to issue preferred shares and additional shares of common stock in order to be able to raise additional capital required by our current capital position and the Consent Order imposed by the OCC. | ||
| • | In September 2009, we prepared a Capital Plan followed by a Confidential Offering Memorandum in November 2009 for the offering and sale of shares of our preferred stock. Although the Capital Plan was deemed unacceptable by the OCC for purposes of its PCA enforcement powers, we continue to work to raise the necessary capital. To date, we have not received any firm commitments for new capital, but we continue to hold negotiations with potentially interested investors. | ||
| • | The Bank has taken many steps to address other requirements of the Consent Order, including making improvements to its liquidity risk management program and its loan portfolio management. | ||
| • | The Bank believes it has increased the strength of its executive management team through new hires in 2008 and 2009, including CEO Ron Long, CFO Mark Huber, Chief Credit Officer Paul Stark, and Sr. VP – Commercial Loan Officer Gerald Moyer. | ||
| • | Management intends to support the Bank’s regulatory capital levels and ratios via strategic balance sheet reductions in 2010 achieved primarily through non-renewal of high cost certificates of deposits while managing normal loan runoff (i.e., |
19
Table of Contents
| scheduled payments) with limited new money loan originations. The execution of this strategy is expected to sustain the Bank’s net interest margin via lower deposit pricing in the current rate environment coupled with greater reliance on lower cost core deposits. The strategy will entail close monitoring of the Bank’s liquidity position and attention to significant customer relationships. |
| • | Management continues to maintain significant borrowing availability as a source of contingency funding at the Federal Home Loan Bank and Federal Reserve as secured by eligible loans pledged as collateral. At December 31, 2009, the Bank has approximately $27.6 million of unused availability under established lines of credit at the FHLB and Federal Reserve Discount Window. Management conducts on-going reviews of the Bank’s portfolio loans to identify additional eligible collateral to further increase the Bank’s borrowing capacity. | ||
| • | Asset quality improvements are critical to the Bank’s future financial results and performance. The active management and targeted reduction in the current level of criticized loans will be pursued through continued quarterly loan portfolio credit quality reviews emphasizing timely monitoring of borrower relationships, timely identification of credit weaknesses, and heightened accountability of loan officers. | ||
| • | The Bank’s 2010 budget includes plans for continued emphasis on expense reductions, revenue enhancements, and operational efficiency enhancements. | ||
| • | Plans for noninterest income revenue enhancements include partnering with a local established residential mortgage origination company to enhance mortgage loan referral income. Management also intends to originate and sell commercial loans under the federal government’s SBA loan guarantee program to generate additional noninterest income. Finally, the sale of certain non-essential assets and select Bank branches are periodically evaluated to support capital levels. | ||
| • | Discretionary, noncritical capital expenditures for facility and technology improvements not otherwise providing a net cost savings or net revenue enhancement have been deferred indefinitely until the Bank’s financial condition improves. | ||
| • | In considering alternatives to effect potential cost savings and cost reductions, management remains committed to ensuring that all appropriate and necessary resources available at reasonable costs are utilized to operate the Bank in a manner consistent with safe and sound banking practices. |
There can be no assurance these efforts will improve the Bank’s financial condition. Further
deterioration of the Bank’s capital position is possible. The current economic environment in
southeast Michigan and local real estate market conditions will continue to impose significant
challenges on the Bank and are expected to adversely impact financial results. Any further
declines in the Bank’s capital levels may likely result in more severe regulatory enforcement
action by either the OCC or FDIC.
It is against this backdrop that we discuss our financial condition and results of operations in
2009 as compared to earlier periods.
FINANCIAL CONDITION
At year end 2009, total assets were $332,390,000 representing a 14.5% decrease from the prior year
total assets of $388,783,000. Investment securities decreased $18,815,000 (44.3%) to $23,701,000
and gross loans decreased $41,771,000 (13.2%) to $274,046,000. Deposits decreased $34,331,000
(9.8%) to $315,196,000. Other borrowings decreased $8,500,000 to $414,000. Shareholders’ equity
decreased $13,149,000 (47.8%) to $14,376,000.
Securities
During 2009, investments securities decreased $18,815,000 due to scheduled maturities, calls and
sales of certain municipal securities based on management’s evaluation of the issuers’ credit
rating. Purchased certificates of deposit decreased $4,319,000 due to scheduled maturities and
management’s decision to sell the remaining portfolio in November 2009 to recognize immediate gains
resulting from the favorable interest rate environment. There were no purchases of investment
securities classified as available for sale in 2009. At year end, the Bank had $36,943,000 in cash
and due from banks and $101,000 in short term investments, an increase of $26,767,000 and decrease
of $11,803,000 from the respective December 31, 2008 balances.
20
Table of Contents
The following table sets forth the book value of held to maturity securities, the fair value of
available for sale securities and the book value of other securities at December 31:
| (in thousands) | ||||||||||||
| 2009 | 2008 | 2007 | ||||||||||
Held to maturity: |
||||||||||||
States and political subdivisions |
$ | — | $ | — | $ | 15,394 | ||||||
Available for sale: |
||||||||||||
States and political subdivisions |
$ | 7,156 | $ | 14,704 | $ | — | ||||||
U.S. agencies |
1,527 | 9,693 | 14,005 | |||||||||
Preferred stock |
87 | 49 | — | |||||||||
Mortgage-backed/CMO securities |
13,936 | 17,074 | 8,238 | |||||||||
Total available for sale |
$ | 22,706 | $ | 41,520 | $ | 22,243 | ||||||
Other securities: |
||||||||||||
FRB stock |
$ | 44 | $ | 44 | $ | 44 | ||||||
FHLBI stock |
951 | 951 | 951 | |||||||||
Total other securities |
$ | 995 | $ | 995 | $ | 995 | ||||||
The following table sets forth contractual maturities of securities at December 31, 2009 and
the weighted average yield of such securities:
| (in thousands) | ||||||||||||||||||||||||||||||||
| Maturing After | Maturing After | |||||||||||||||||||||||||||||||
| Maturing Within | One but Within | Five but Within | Maturing After | |||||||||||||||||||||||||||||
| One Year | Five Years | Ten Years | Ten Years | |||||||||||||||||||||||||||||
| Amount | Yield | Amount | Yield | Amount | Yield | Amount | Yield | |||||||||||||||||||||||||
States and political subdivisions |
$ | 397 | 5.88 | % | $ | 239 | 3.85 | % | $ | 1,844 | 4.04 | % | $ | 4,676 | 4.28 | % | ||||||||||||||||
U.S. agencies |
1,032 | 3.88 | % | — | 495 | 5.25 | % | |||||||||||||||||||||||||
Mortgage-backed/CMO securities |
— | — | — | 13,936 | 5.74 | % | ||||||||||||||||||||||||||
Preferred stock |
— | — | — | 87 | 0.00 | % | ||||||||||||||||||||||||||
FRB stock |
— | — | — | 44 | 6.03 | % | ||||||||||||||||||||||||||
FHLBI stock |
— | — | — | 951 | 2.87 | % | ||||||||||||||||||||||||||
Total |
$ | 1,429 | 4.44 | % | $ | 239 | 3.85 | % | $ | 1,844 | 4.04 | % | $ | 20,189 | 5.24 | % | ||||||||||||||||
Tax equivalent adjustment for calculations of yield |
$ | 11 | $ | 6 | $ | 51 | $ | 132 | ||||||||||||||||||||||||
The rates set forth in the tables above for obligations of state and political subdivisions
have been restated on a fully tax equivalent basis assuming a 34% marginal tax rate. The amount of
the adjustment is as follows:
| Tax-Exempt | Equivalent | |||||||||||
| Rate | Adjustment | Basis | ||||||||||
Under 1 year |
5.88 | % | 2.82 | % | 8.70 | % | ||||||
1-5 years |
3.85 | % | 2.82 | % | 6.67 | % | ||||||
5-10 years |
4.04 | % | 2.82 | % | 6.86 | % | ||||||
10 years or more |
4.28 | % | 2.82 | % | 7.10 | % | ||||||
The following table shows the percentage composition of the securities portfolio as of December 31:
| 2009 | 2008 | 2007 | ||||||||||
U.S. Treasury & agency securities |
6.4 | % | 22.8 | % | 36.3 | % | ||||||
Agency mortgage backed/CMO securities |
58.8 | % | 40.2 | % | 21.3 | % | ||||||
Tax exempt obligations of states and political subdivisions |
30.2 | % | 34.6 | % | 39.8 | % | ||||||
Preferred stock |
0.4 | % | 0.1 | % | 0.0 | % | ||||||
Other |
4.2 | % | 2.3 | % | 2.6 | % | ||||||
Total securities |
100.0 | % | 100.0 | % | 100.0 | % | ||||||
Loans
The senior management and board of directors of the Bank retain the authority and responsibility
for credit decisions. We have adopted uniform loan policy documenting required underwriting
standards. Our delegated loan authorities and loan committee structure attempt to provide
requisite controls and promote compliance with such established underwriting standards. Loans to a
borrower with aggregate indebtedness in excess of $1,500,000 are approved by a committee of the
board or the entire board. There can be no assurance that the aforementioned lending procedures
and the use of uniform underwriting standards will prevent us from the possibility of incurring
significant credit losses in our lending activities and, in fact, the provision for loan losses was
elevated in 2009, 2008 and 2007 from prior historical levels.
21
Table of Contents
During 2009, the overall loan portfolio decreased $41,771,000 (13.2%). The decrease was
attributable in part to the deliberate run-off of existing loans to shrink the Bank’s asset size
and manage capital ratios and to diversify risk within the loan portfolio (i.e., reduce
concentrations in real estate secured loans). Further deceases in loans resulted from $11.9
million of charge offs and $4.5 million of loans transferred to other real estate owned during
2009. In addition, fewer lending opportunities and credit worthy borrowers limited loan growth in
2009.
The following table reflects the composition of the commercial and consumer loans in the
Consolidated Financial Statements. Included in the residential first mortgage totals below are the
“real estate mortgage” loans listed in the Consolidated Financial Statements and other loans to
customers who pledge their homes as collateral for their borrowings. A portion of the loans listed
in residential first mortgages represent commercial loans where the borrower has pledged his/her
residence as collateral. In the majority of the loans to commercial customers, the Bank is relying
on the borrower’s cash flow to service the loans.
The following table shows the balance and percentage composition of loans as of December 31:
| (in thousands) | ||||||||||||||||||||||||||||||||||||||||
| 2009 | 2008 | 2007 | 2006 | 2005 | ||||||||||||||||||||||||||||||||||||
| Balances | Percent | Balances | Percent | Balances | Percent | Balances | Percent | Balances | Percent | |||||||||||||||||||||||||||||||
Secured by real estate: |
||||||||||||||||||||||||||||||||||||||||
Residential first mortgage |
$ | 29,719 | 10.8 | % | $ | 31,332 | 9.9 | % | $ | 35,545 | 10.2 | % | $ | 39,768 | 10.3 | % | $ | 46,391 | 12.4 | % | ||||||||||||||||||||
Residential home equity/other junior liens |
17,606 | 6.4 | % | 20,511 | 6.5 | % | 19,353 | 5.6 | % | 20,983 | 5.4 | % | 19,750 | 5.3 | % | |||||||||||||||||||||||||
Construction, land development and
other land |
29,119 | 10.6 | % | 42,712 | 13.5 | % | 52,383 | 15.0 | % | 67,376 | 17.5 | % | 72,572 | 19.4 | % | |||||||||||||||||||||||||
Commercial (nonfarm, nonresidential) |
170,364 | 62.2 | % | 179,674 | 56.9 | % | 192,784 | 55.3 | % | 203,219 | 52.8 | % | 177,417 | 47.5 | % | |||||||||||||||||||||||||
Commercial |
20,015 | 7.3 | % | 31,628 | 10.0 | % | 33,677 | 9.7 | % | 31,710 | 8.2 | % | 29,230 | 7.8 | % | |||||||||||||||||||||||||
Consumer |
5,793 | 2.1 | % | 7,627 | 2.4 | % | 11,113 | 3.2 | % | 15,852 | 4.1 | % | 22,247 | 6.0 | % | |||||||||||||||||||||||||
Other |
1,674 | 0.6 | % | 2,629 | 0.8 | % | 3,510 | 1.0 | % | 6,343 | 1.7 | % | 6,104 | 1.6 | % | |||||||||||||||||||||||||
Total gross loans |
274,290 | 100.0 | % | 316,113 | 100.0 | % | 348,365 | 100.0 | % | 385,251 | 100.0 | % | 373,711 | 100.0 | % | |||||||||||||||||||||||||
Net unearned fees |
(244 | ) | (296 | ) | (489 | ) | (670 | ) | (856 | ) | ||||||||||||||||||||||||||||||
Total Loans |
$ | 274,046 | $ | 315,817 | $ | 347,876 | $ | 384,581 | $ | 372,855 | ||||||||||||||||||||||||||||||
Loans secured by residential first mortgages decreased $1,613,000 (5.1%) as the mortgage loan
portfolio experienced runoff in 2009. Demand for these loan products was weak in 2009 due to
declining real estate values, historically high unemployment, and beleaguered state of the
residential housing market. At December 31, 2009, the Bank had $8,199,000 of home equity
interest-only loans; none of these loans are at low promotional rates.
Construction, land development and other land loans at December 31, 2009 totaled $29,119,000; of
this, $5,453,000 was secured by 1-4 family residential construction loans and $23,666,000 was
secured by non 1-4 family residential properties. These loans experienced a decline of $13,593,000
(31.8%) partially due to a desire to diversify the Corporation’s loan portfolio away from these
higher risk loans given the poor economic conditions for real estate development, particularly
residential real estate. This portfolio was further reduced by charge offs and loans transferred
into other real estate in 2009.
Commercial real estate loans (nonfarm and nonresidential) declined to $170,364,000 at December 31,
2009 from $179,674,000 at December 31, 2008, a decrease of $9,310,000 (5.2%). The decrease in this
portfolio resulted from loan run-off to further reduce concentrations in real estate secured loans
along with charge offs and transfers of loans into other real estate. At December 31, 2009,
$66,077,000 of these loans were secured by owner occupied properties, while $101,730,000 were
secured by nonowner occupied properties and $2,557,000 were secured by multifamily housing.
Consumer loans decreased $1,834,000 (24%) in 2009 primarily due to the continued runoff in indirect
auto loans.
Commercial loans experienced a decrease of $11,613,000 (36.7%) in 2009 due to the overall decline
in the current economic environment.
Other loans decreased $955,000 (36.3%) in 2009 due to maturities and pay downs on tax exempt loans.
22
Table of Contents
The following table shows the amount of commercial, financial, and agricultural loans outstanding
as of December 31, 2009, which based on remaining scheduled repayments of principal, mature in the
periods indicated:
| Maturing | ||||||||||||||||
| (in thousands) | ||||||||||||||||
| After One | ||||||||||||||||
| Within One | but Within | After Five | ||||||||||||||
| Year | Five Years | Years | Total | |||||||||||||
Real estate construction, land development and other land loans |
$ | 16,638 | $ | 12,481 | $ | — | $ | 29,119 | ||||||||
Real estate other (secured by commercial and multi-family) |
30,498 | 125,486 | 14,380 | 170,364 | ||||||||||||
Commercial (secured by business assets or unsecured) |
12,051 | 7,534 | 430 | 20,015 | ||||||||||||
Other (loans to farmers, political subdivisions, and overdrafts) |
308 | 1,035 | 331 | 1,674 | ||||||||||||
Totals |
$ | 59,495 | $ | 146,536 | $ | 15,141 | $ | 221,172 | ||||||||
Below is a schedule of amounts due after one year which are classified according to their
sensitivity to changes in interest rates:
| Interest Sensitivity | ||||||||
| (in thousands) | ||||||||
| Fixed Rate | Variable Rate | |||||||
Due after one but within five years |
$ | 127,675 | $ | 18,861 | ||||
Due after five years |
14,722 | 419 | ||||||
At December 31, 2009 and 2008, the Bank’s loan portfolio included significant industry
concentrations for: non-residential building operators, single family home builders, lessors of
residential buildings, and hotels and motels. Management determines such concentrations using
NAICS codes and regulatory standards that define significant concentrations as greater than 25
percent of the Bank’s capital, inclusive of the allowance for loan losses. In addition, management
believes the Bank’s most significant loan portfolio concentration and exposure relates to loans
secured by real estate. There were no foreign loans outstanding at December 31, 2009.
The future size of the loan portfolio is dependent upon a number of economic, competitive and
regulatory factors faced by the Bank. Overall loan balances have decreased during each of the past
three years primarily resulting from weak economic conditions and depressed real estate values in
Michigan. Further declines in loans, restrictions on the Bank’s ability to make new loans or
competition that leads to lower relative pricing on new loans could adversely impact our future
operating results.
Nonperforming assets consist of loans accounted for on a nonaccrual basis, loans contractually past
due 90 days or more as to interest or principal payments (but not included in nonaccrual loans),
and other real estate which has been acquired primarily through foreclosure and is actively managed
through the time of disposition to minimize loss. The aggregate amount of nonperforming loans and
other nonperforming assets are presented below:
| (in thousands) | ||||||||||||||||||||
| 2009 | 2008 | 2007 | 2006 | 2005 | ||||||||||||||||
Nonperforming Loans and Assets: |
||||||||||||||||||||
Nonaccrual loans |
$ | 43,724 | $ | 37,096 | $ | 14,459 | $ | 12,199 | $ | 5,234 | ||||||||||
Loans past due 90 days and still accruing |
— | 1,560 | 114 | 288 | 391 | |||||||||||||||
Total nonperforming loans |
43,724 | 38,656 | 14,573 | 12,487 | 5,625 | |||||||||||||||
Other real estate |
3,777 | 2,678 | 1,523 | 1,629 | 680 | |||||||||||||||
Total nonperforming assets |
$ | 47,501 | $ | 41,334 | $ | 16,096 | $ | 14,116 | $ | 6,305 | ||||||||||
Nonperforming loans as a percent of total loans |
15.95 | % | 12.24 | % | 4.19 | % | 3.25 | % | 1.51 | % | ||||||||||
Allowance for loan losses as a percent of
nonperforming loans |
43 | % | 37 | % | 71 | % | 61 | % | 124 | % | ||||||||||
There were no other interest bearing assets at December 31, 2009 that would be required to be
disclosed under Item III(C) of Guide 3 of the Securities Act Industry Guide, if such assets were
loans.
23
Table of Contents
The following table shows nonperforming loans by type of loan collateral and percentage composition
of nonperforming loans as of December 31:
| (in thousands) | ||||||||||||||||||||||||
| 2009 | 2008 | 2007 | ||||||||||||||||||||||
| Nonperforming Loans | Amount | Percent | Amount | Percent | Amount | Percent | ||||||||||||||||||
Secured by real estate: |
||||||||||||||||||||||||
Residential first mortgage |
$ | 4,503 | 10.3 | % | $ | 2,994 | 7.7 | % | $ | 1,565 | 10.8 | % | ||||||||||||
| Residential home equity/other junior liens |
1,043 | 2.4 | % | 2,486 | 6.4 | % | 736 | 5.0 | % | |||||||||||||||
Construction and land development and farmland |
15,737 | 36.0 | % | 18,904 | 48.9 | % | 6,227 | 42.7 | % | |||||||||||||||
Commercial real estate |
19,802 | 45.3 | % | 12,053 | 31.2 | % | 5,831 | 40.0 | % | |||||||||||||||
Consumer |
53 | 0.1 | % | 22 | 0.1 | % | 38 | 0.3 | % | |||||||||||||||
Commercial |
2,586 | 5.9 | % | 2,197 | 5.7 | % | 176 | 1.2 | % | |||||||||||||||
Total nonperforming loans |
$ | 43,724 | 100.0 | % | $ | 38,656 | 100.0 | % | $ | 14,573 | 100.0 | % | ||||||||||||
Management regularly evaluates the condition of problem credits and when reduced cash flows
coupled with collateral shortfalls are evident, the loans are placed in nonaccrual. In addition,
loans are placed on nonaccrual when principal or interest is past due ninety days or more. If
management believes there is significant risk of not collecting full principal and interest, we may
elect to place the loan in nonaccrual even if the borrower is current. As of December 31, 2009,
approximately $17,050,000 (39.0%) of nonperforming loans are making scheduled payments on their
loans. Loans categorized as 90 days past due and still accruing are well secured and in the
process of collection. Nonperforming loans are reviewed regularly for collectibility and
uncollectible balances are promptly charged off.
Other real estate owned (“OREO”) is comprised primarily of commercial real estate properties and
totaled $3,777,000 at December 31, 2009 compared to $2,678,000 at December 31, 2008. This increase
results from the transfer of nonperforming loans secured by real estate into OREO as the
foreclosure process is completed and any redemption period expires and from the Bank’s receipt of
deeds in lieu of foreclosure.
Since December 31, 2006, the Michigan economy in general and more specifically, the decline in real
estate sales and valuations in southeast Michigan, has significantly and adversely impacted the
quality of the Corporation’s portfolio of loans secured by real estate. In addition, the local
economies served by the Corporation have been adversely impacted by the continued downturn in the
automotive market and related industries which, in turn, has caused a significant increase in loan
delinquencies. Due to the prolonged troubled economy, the continued decline in real estate values
during 2009 and the high concentration of the Corporation’s loans that are secured by real estate,
the Corporation has continued to experience an increase in nonperforming loans and impaired loans.
Nonperforming loans increased $5,068,000 from December 31, 2008 primarily due to deteriorating
economic conditions that have impacted customers’ cash flows and lowered collateral values of real
estate. (Nonperforming loans at December 31, 2007 would have been significantly greater without
approximately $25 million of nonperforming loans (before charge offs or fair market value
adjustments) being either transferred to held for sale and sold or transferred back into the loan
portfolio at bid prices in the third quarter of 2007).
Management expects the work out of these nonperforming loans to take some time, especially given
the economic outlook for the state and the Bank’s relatively high balances of loans secured by real
estate. These conditions are expected to result in the Bank maintaining high balances of
nonperforming loans and are expected to continue to impact the provision for loan losses for the
foreseeable future. Management continues to make oversight of these loans a priority. In
addition, based on the existing level of problem loans, we anticipate that other real estate owned
will continue to increase during 2010 and remain at elevated levels for some period of time as the
Bank manages through the problem loan portfolio and borrowers continue to face financial
difficulties and tight credit markets.
Impaired loans totaled approximately $41,449,000 at December 31, 2009, and include specifically
identified commercial loans included in non-accrual loans, other than homogenous small commercial,
residential and consumer loans, and $12,154,000 of commercial loans identified as troubled debt
restructurings. Included in impaired loans is $7,898,000 of commercial and commercial real estate
loans with no specific reserve allocation which indicates the loan is well collateralized at this
time. A loan is considered impaired when it is probable that all or part of amounts due according
to the contractual terms of the loan agreement will not be collected on a timely basis or the loan
has been restructured and is classified as a trouble debt restructuring. Impaired loans totaled
$27,867,000 at December 31, 2008, and $17,000,000 at December 31, 2007. Impaired commercial loans
had specific reserves of $7,439,000 at December 31, 2009, $4,289,000 at December 31, 2008 and
$1,781,000 at December 31, 2007.
During 2009, the Bank charged off loans totaling $11,930,000 and recovered $610,000 for a net
charge off amount of $11,320,000. The Bank had net charge offs totaling $11,470,000 in 2008 and
$10,906,000 in 2007.
If the economy continues to weaken and/or real estate values decline further, the provision for
loan losses may continue to be impacted by the Bank’s concentration in real estate secured loans.
While we have carefully considered these factors when determining the level of reserves, it is
difficult to accurately predict future economic events, especially in the current environment.
24
Table of Contents
The loan portfolio is periodically reviewed by internal and external parties and the results of
these reviews are reported to the Bank’s Board of Directors. The purpose of these reviews is to
verify proper loan documentation, to provide for the early identification of potential problem
loans, to challenge and validate internal risk grades assigned by management, to monitor collateral
values and to assist the Bank in evaluating the adequacy of the allowance for loan losses.
The following table sets forth loan balances and summarizes the changes in the allowance for loan
losses and reserve for unfunded credit commitments, which is part of the Corporation’s critical
accounting policies, for each of the years ended December 31:
| (in thousands) | ||||||||||||||||||||
| 2009 | 2008 | 2007 | 2006 | 2005 | ||||||||||||||||
Loans: |
||||||||||||||||||||
Average daily balance of loans for the year |
$ | 297,609 | $ | 336,637 | $ | 375,037 | $ | 374,634 | $ | 366,877 | ||||||||||
Amount of loans outstanding at end of year |
274,046 | 315,817 | 347,876 | 384,581 | 372,855 | |||||||||||||||
Components: |
||||||||||||||||||||
Allowance for loan losses |
||||||||||||||||||||
Balance, beginning of year |
$ | 14,122 | $ | 10,314 | $ | 7,598 | $ | 6,991 | $ | 6,093 | ||||||||||
Loans charged off: |
||||||||||||||||||||
Real estate mortgage |
619 | 261 | 243 | 260 | 26 | |||||||||||||||
Commercial (1) |
10,730 | 11,170 | 5,519 | 1,785 | 1,436 | |||||||||||||||
Consumer |
581 | 674 | 860 | 619 | 792 | |||||||||||||||
Subtotal |
11,930 | 12,105 | 6,622 | 2,664 | 2,254 | |||||||||||||||
Charge offs on loans transferred to held for sale (2) |
— | — | 4,669 | — | — | |||||||||||||||
Total charge offs |
11,930 | 12,105 | 11,291 | 2,664 | 2,254 | |||||||||||||||
Recoveries to loans previously charged off: |
||||||||||||||||||||
Real estate mortgage |
7 | 14 | — | — | — | |||||||||||||||
Commercial |
462 | 370 | 146 | 283 | 120 | |||||||||||||||
Consumer |
141 | 251 | 239 | 226 | 142 | |||||||||||||||
Total recoveries |
610 | 635 | 385 | 509 | 262 | |||||||||||||||
Net loans charged off |
11,320 | 11,470 | 10,906 | 2,155 | 1,992 | |||||||||||||||
Additions to allowance charged to operations |
15,863 | 15,278 | 13,622 | 2,762 | 2,890 | |||||||||||||||
Balance, end of year |
18,665 | 14,122 | 10,314 | 7,598 | 6,991 | |||||||||||||||
Reserve for unfunded credit commitments |
||||||||||||||||||||
Balance, beginning of year |
316 | 739 | 331 | 454 | 307 | |||||||||||||||
Additions (reductions) to reserve
charged to operations |
(16 | ) | (423 | ) | 408 | (123 | ) | 147 | ||||||||||||
Balance, end of year |
300 | 316 | 739 | 331 | 454 | |||||||||||||||
Total allowance for loan losses and
reserve for unfunded credit commitments |
$ | 18,965 | $ | 14,438 | $ | 11,053 | $ | 7,929 | $ | 7,445 | ||||||||||
Ratios: |
||||||||||||||||||||
Net loans charged off to average loans outstanding |
3.80 | % | 3.41 | % | 2.91 | % | 0.58 | % | 0.54 | % | ||||||||||
Allowance for loan losses to loans outstanding |
6.81 | % | 4.47 | % | 2.96 | % | 1.98 | % | 1.88 | % | ||||||||||
| (1) | Partial charge offs of $2,934,831 are included in commercial charge offs to reduce the loans transferred to held for sale to their impaired value prior to consideration of bid amounts in 2007 | |
| (2) | Represents charges to the allowance to reduce the investment in the loans to the estimated fair values when the loans were transferred to held for sale in 2007. |
25
Table of Contents
The following table shows charge offs by the type of loan collateral and percentage
composition as of December 31:
| (in thousands) | ||||||||||||||||||||||||
| 2009 | 2008 | 2007 | ||||||||||||||||||||||
| Charge offs | Amount | Percent | Amount | Percent | Amount | Percent | ||||||||||||||||||
Secured by real estate |
||||||||||||||||||||||||
Residential first mortgage |
$ | 1,145 | 9.6 | % | $ | 775 | 6.4 | % | $ | 1,150 | 10.2 | % | ||||||||||||
Residential home equity/other junior liens |
1,280 | 10.7 | % | 413 | 3.4 | % | 338 | 3.0 | % | |||||||||||||||
Construction and land development and farmland |
3,573 | 30.0 | % | 7,647 | 63.2 | % | 4,709 | 41.7 | % | |||||||||||||||
Commercial real estate |
3,889 | 32.6 | % | 1,357 | 11.2 | % | 2,533 | 22.4 | % | |||||||||||||||
Consumer |
444 | 3.7 | % | 450 | 3.7 | % | 881 | 7.8 | % | |||||||||||||||
Commercial |
1,599 | 13.4 | % | 1,463 | 12.1 | % | 1,680 | 14.9 | % | |||||||||||||||
Total charge offs |
$ | 11,930 | 100.0 | % | $ | 12,105 | 100.0 | % | $ | 11,291 | 100.0 | % | ||||||||||||
The following table presents the portion of the allowance for loan losses applicable to each loan
category and the percent of loans in each category to total loans, as of December 31:
| (in thousands) | ||||||||||||||||||||||||||||||||||||||||
| 2009 | 2008 | 2007 | 2006 | 2005 | ||||||||||||||||||||||||||||||||||||
| Amount | Percent | Amount | Percent | Amount | Percent | Amount | Percent | Amount | Percent | |||||||||||||||||||||||||||||||
Commercial |
$ | 16,520 | 86.1 | % | $ | 13,064 | 86.4 | % | $ | 9,274 | 86.5 | % | $ | 6,675 | 85.5 | % | $ | 5,864 | 81.9 | % | ||||||||||||||||||||
Consumer |
1,138 | 6.9 | % | 613 | 6.9 | % | 609 | 6.3 | % | 442 | 7.2 | % | 850 | 9.7 | % | |||||||||||||||||||||||||
Real estate mortgage |
1,007 | 7.0 | % | 445 | 6.7 | % | 431 | 7.2 | % | 481 | 7.3 | % | 277 | 8.4 | % | |||||||||||||||||||||||||
Total |
$ | 18,665 | 100.0 | % | $ | 14,122 | 100.0 | % | $ | 10,314 | 100.0 | % | $ | 7,598 | 100.0 | % | $ | 6,991 | 100.0 | % | ||||||||||||||||||||
The following table presents the portion of the reserve for unfunded credit commitments applicable
to each loan category and the percent of the credit commitments in each category to total credit
commitments, as of December 31:
| (in thousands) | ||||||||||||||||||||||||||||||||||||||||
| 2009 | 2008 | 2007 | 2006 | 2005 | ||||||||||||||||||||||||||||||||||||
| Amount | Percent | Amount | Percent | Amount | Percent | Amount | Percent | Amount | Percent | |||||||||||||||||||||||||||||||
Commercial |
$ | 136 | 58.8 | % | $ | 76 | 62.5 | % | $ | 488 | 79.6 | % | $ | 207 | 80.1 | % | $ | 199 | 81.9 | % | ||||||||||||||||||||
Consumer |
164 | 41.2 | % | 240 | 37.5 | % | 251 | 20.4 | % | 124 | 19.9 | % | 255 | 9.7 | % | |||||||||||||||||||||||||
Real estate mortgage |
— | — | — | — | — | — | — | — | — | 8.4 | % | |||||||||||||||||||||||||||||
Total |
$ | 300 | 100.0 | % | $ | 316 | 100.0 | % | $ | 739 | 100.0 | % | $ | 331 | 100.0 | % | $ | 454 | 100.0 | % | ||||||||||||||||||||
The allowance for loan losses totaled $18,665,000 at year end which was 6.81% of total loans,
compared to $14,122,000 (4.47%) in 2008, and $10,314,000 (2.96%) in 2007.
Management estimates the required allowance balance using past loan loss experience, the nature and
volume of the portfolio segments and concentrations, information about specific borrower
situations, estimated collateral values, economic conditions and trends, and other factors.
Allocations of the allowance are made for specific loans, but the entire allowance is available for
any loan that, in management’s judgment, should be charged off. Management continually analyzes
portfolio risk to refine the process of effective risk identification and measurement for
determination of the required allowance balance. When all of these factors were considered,
management determined that the $15,847,000 provision for loan losses and resulting $18,665,000
allowance were appropriate as of and for the year ended December 31, 2009.
Due to current economic conditions and the decline in real estate values, the provision for loan
losses in 2009 continued to be impacted by the Bank’s concentration in real estate secured lending.
The level of loan loss provision in 2010 is expected to be dependent on stabilization in local
real estate values and the overall economy. Although management evaluates the adequacy of the
allowance for loan losses based on information known at a given time, as facts and circumstances
change, the provision and resulting allowance may also change.
Deposits
Deposit balances of $315,196,000 at December 31, 2009 were $34,331,000 lower than the previous
year end. Because year end deposit balances may fluctuate, it is often more meaningful to analyze
changes in average balances. Average deposits decreased 6.8% in 2009 compared to 2008. Average
demand deposits remained the same while average NOW, savings and money market deposit account
(MMDA) balances as a group decreased $8.7 million (6.0%). Average certificates of deposit decreased
$15.9 million (9.8%).
26
Table of Contents
Average demand deposits decreased 7.8% from 2007 to 2008, average NOW,
savings, and MMDA balances fell 2.6% from 2007 to 2008, and average certificates of deposit fell
11.8% from 2007 to 2008.
The following table sets forth average deposit balances and the weighted average rates paid thereon
for the years ended December 31:
| (in thousands) | ||||||||||||||||||||||||
| 2009 | 2008 | 2007 | ||||||||||||||||||||||
| Average | Average | Average | ||||||||||||||||||||||
| Balance | Rate | Balance | Rate | Balance | Rate | |||||||||||||||||||
Non-interest bearing demand |
$ | 55,102 | 0.00 | % | $ | 55,077 | 0.00 | % | $ | 59,734 | 0.00 | % | ||||||||||||
NOW |
47,497 | 0.19 | % | 35,845 | 0.24 | % | 36,748 | 0.49 | % | |||||||||||||||
Savings |
41,211 | 0.28 | % | 38,033 | 0.49 | % | 38,656 | 0.50 | % | |||||||||||||||
MMDA |
49,160 | 0.95 | % | 72,762 | 2.01 | % | 67,473 | 3.09 | % | |||||||||||||||
Time deposits |
147,271 | 2.64 | % | 163,211 | 3.64 | % | 184,938 | 4.82 | % | |||||||||||||||
Total |
$ | 340,241 | 1.34 | % | $ | 364,928 | 2.10 | % | $ | 387,549 | 2.93 | % | ||||||||||||
See Note 8, “Time Certificates of Deposits” in Notes to Consolidated Financial Statements for the
maturities of negotiated rate time deposits of $100,000 or more outstanding at December 31, 2009.
There was an increase in NOW and savings deposits of 32.5% and 8.4%, respectively, on average from
2008 to 2009. NOW deposits increased due to the Bank’s participation in the FDIC’s Temporary
Liquidity Guarantee Program which provided unlimited deposit insurance on these balances in 2009.
MMDA deposits decreased 32.4% on average from 2008 to 2009 primarily due to consumers transferring
their deposits to NOW accounts to take advantage of the FDIC’s unlimited deposit insurance
coverage.
The majority of the Bank’s deposits are from core customer sources, representing long term
relationships with local personal, business, and public customers. In some financial institutions,
the presence of interest bearing certificates greater than $100,000 indicates reliance upon
purchased funds. However, large certificates in the Bank’s portfolio consist primarily of core
deposits of local customers. On occasion, the Bank has issued brokered certificates of deposits to
match certain funding and liquidity needs. In early 2009, the Bank issued and then carried higher
levels of average brokered deposits to ensure adequate levels of on-balance sheet liquidity. The
average balance of brokered certificates was $14.4 million and $8.5 million in 2009 and 2008,
respectively. At year-end 2009, brokered deposits totaled $5.4 million compared to $13.9 million
at December 31, 2008. Only $275,000 of these brokered certificates were over $100,000 at December
31, 2009 as compared to $372,000 as of December 31, 2008.
Capital
The Corporation’s capital at year end totaled $14,376,000, a $13,149,000 (47.8%) decrease compared
to capital of $27,525,000 at December 31, 2008, and $40,627,000 at December 31, 2007. Included in
capital at December 31, 2009 is an $111,000 net of tax unrealized gain on investment securities
available for sale.
Banking regulators have established various ratios of capital to assets to assess a financial
institution’s soundness. Tier 1 capital is equal to shareholders’ equity adjusted for unrealized
gains or losses accumulated in other comprehensive income while Tier 2 capital also includes a
portion of the allowance for loan losses. The regulatory agencies have set capital standards for
institutions. The leverage ratio, which divides Tier 1 capital by quarterly average assets, must be
4% for an institution to be considered adequately capitalized. The Bank’s leverage ratio was 4.25%
at year end 2009. Tier 1 risk-based capital, which includes some off balance sheet items in assets
and weights assets by risk, must be 4% for an institution to be considered adequately capitalized.
The Bank’s Tier 1 risk-based capital ratio was 5.15% at year end 2009. Total risk-based capital,
which includes Tier 1 and Tier 2 capital, must be 8% for an institution to be considered adequately
capitalized. The Bank’s total risk-based capital ratio was 6.46% at year end 2009.
The following table lists various Bank capital ratios at December 31:
| Minimum | Minimum | |||||||||||||||||||
| Regulatory | Regulatory Ratio | |||||||||||||||||||
| Ratio for Well | for Adequately | Bank Ratios | ||||||||||||||||||
| Capitalized | Capitalized | 2009 | 2008 | 2007 | ||||||||||||||||
Average equity to average asset ratio |
— | — | 5.80 | % | 9.24 | % | 10.42 | % | ||||||||||||
Tier 1 leverage ratio |
5.00 | % | 4.00 | % | 4.25 | % | 6.89 | % | 9.60 | % | ||||||||||
Tier 1 risk-based capital |
6.00 | % | 4.00 | % | 5.15 | % | 8.27 | % | 10.61 | % | ||||||||||
Total risk-based capital |
10.00 | % | 8.00 | % | 6.46 | % | 9.56 | % | 11.88 | % | ||||||||||
As a result of the Consent Order issued to the Bank by the OCC on September 24, 2009, the Bank is
subject to higher minimum capital ratios than those shown above. The Bank is required to maintain
a Total risk-based capital ratio of 11% and a Tier 1 leverage ratio of 8.5%. As shown above, the
Bank was not in compliance with these minimum ratios as of December 31, 2009. In addition, the
Capital Plan submitted by the Bank to the OCC was deemed not acceptable by the OCC. As a result,
the Bank is currently
27
Table of Contents
deemed to be “significantly undercapitalized” for purposes of the OCC’s
prompt corrective action (PCA) enforcement powers. See Item 1, Business, Supervision and
Regulation above for additional details.
The Corporation’s ability to pay dividends is subject to various regulatory and state law
requirements. In the third quarter of 2008 the Corporation suspended, indefinitely, the payment of
dividends due to the Bank’s inability to pay dividends to the holding company and insufficient cash
at the holding company to pay the dividends.
Liquidity and Funds Management
Liquidity risk is the risk of the Corporation being unable to meet current and future financial
obligations in a timely manner. Liquidity is managed to ensure stable, reliable and cost-effective
sources of funds to satisfy demand for credit, deposit withdrawals and investment opportunities.
The Corporation relies on a large, stable core deposit base and a diversified base of wholesale
funding sources to manage liquidity risk.
The Corporation identifies, measures and monitors its liquidity profile. The profile is evaluated
daily, weekly and monthly by analyzing the composition of all funding sources, reviewing projected
liquidity commitments by future month and identifying sources and uses of funds. A contingency
funding plan is also prepared that details the potential erosion of funds in the event of a
systemic financial market crisis or institution-specific stress. In addition, the overall
management of the Corporation’s liquidity position is integrated into retail deposit pricing
policies to ensure a stable core deposit base.
Asset liquidity for financial institutions typically consists of cash and cash equivalents,
certificates of deposits and investment securities available for sale. These categories totaled
$59.7 million at year end 2009 or about 18.0% of total assets. This compares to $67.9 million or
about 17.5% of total assets at year end 2008. Liquidity is important for financial institutions
because of their need to meet loan funding commitments and depositor withdrawal requests.
Liquidity can vary significantly on a daily basis based on customer activity.
Of the Corporation’s available liquidity at December 31, 2009 and 2008 noted above, investment
securities with a fair value of approximately $12,567,000 and $18,011,000, respectively, were
pledged to secure public deposits and for other purposes as required or permitted by law.
The core deposit base is the primary source of the Corporation’s liquidity. The Corporation also
has available unused wholesale sources of liquidity, including
advances from the Federal Home Loan
Bank of Indianapolis (FHLBI), borrowings through the discount window of the Federal Reserve Bank of
Chicago and in the past has issued certificates of deposit through brokers.
The Corporation’s liquidity could be adversely affected by both direct and indirect circumstances.
An example of a direct event would be restrictions imposed by regulators due to factors such as
deterioration in asset quality, a large charge to earnings, a decline in profitability or other
financial measures. In addition, the expiration of the FDIC’s Transaction Account Guarantee
Program (TAGP) on June 30, 2010 presents a potential liquidity risk for the Corporation. At
December 31, 2009 the Bank had approximately $43.5 million of customer deposits receiving unlimited
FDIC insurance under TAGP. The expiration or non-renewal of the TAGP by the FDIC, may result in
the outflow of significant amounts of deposits from the Bank which could have an adverse impact on
our liquidity.
Examples of indirect events unrelated to the Corporation that could have an effect on the
Corporation’s access to liquidity would be terrorism or war, natural disasters, political events,
or the default or bankruptcy of a major corporation, mutual fund or hedge fund. Similarly, market
speculation or rumors about the Corporation or the banking industry in general may adversely affect
the cost and availability of normal funding sources.
The Corporation maintains a liquidity contingency plan that outlines the process for addressing a
potential liquidity crisis. The plan provides for an evaluation of funding sources under various
market conditions. It also assigns specific roles and responsibilities for effectively managing
liquidity though a problem period.
It is the intention of the Bank’s management to handle unexpected liquidity needs through its cash
and cash equivalents, FHLBI Borrowings, or Federal Reserve discount borrowings. The Bank has a
$10,100,000 line of credit available at the FHLBI and the Bank has pledged certain commercial and
consumer loans secured by residential real estate as collateral for this borrowing. At
December 31, 2009, the Bank had $414,000 in borrowings against the line. The Bank has a $16,100,000
line of credit available at the Federal Reserve and the Bank has pledged certain commercial loans
as collateral for this available borrowing. At December 31, 2009, the Bank did not have any
borrowings against the line. The Bank could also utilize repurchase agreements to obtain funding
which enable borrowing from a broker while pledging certain investment securities as collateral.
In
addition, no short-term borrowings were made by the Bank during 2009, other than for isolated routine testing
of its FHLBI and Federal Reserve lines of credit.
28
Table of Contents
Contractual Obligations and Commitments
The following table lists significant fixed and determinable contractual obligations to third
parties as of December 31, 2009:
| (in thousands) | ||||||||||||||||||||
| Within | One to | Three to | Over | |||||||||||||||||
| One Year | Three Years | Five Years | Five Years | Total | ||||||||||||||||
Deposits without a stated maturity (1) |
$ | 188,585 | $ | — | $ | — | $ | — | $ | 188,585 | ||||||||||
Consumer and brokered certificates of deposits(2) |
96,911 | 26,597 | 5,606 | 28 | 129,142 | |||||||||||||||
Long term advances(3) (4) |
415 | — | — | — | 415 | |||||||||||||||
Operating leases (5) |
42 | 74 | — | — | 116 | |||||||||||||||
Purchase obligations (6) |
504 | 722 | 475 | 36 | 1,737 | |||||||||||||||
| (1) | Excludes interest. | |
| (2) | Includes interest on both fixed and variable rate obligations. The interest rate for variable rate obligations is based upon interest rates in effect at December 31, 2009. Future changes in market interest rates could materially affect the contractual amounts to be paid for variable rate obligations; there were no variable rate obligations outstanding at December 31, 2009. | |
| (3) | Includes interest on fixed rate obligations. | |
| (4) | See Note 9, “Other Borrowings,” in Notes to Consolidated Financial Statements. | |
| (5) | See Note 12, “Leases,” in Notes to Consolidated Financial Statements. | |
| (6) | Purchase obligations relate to certain contractual payments for services provided for information technology and data processing. |
The following table lists significant commitments by maturity date as of December 31, 2009:
| (in thousands) | ||||||||||||||||||||
| Within | One to | Three to | Over | |||||||||||||||||
| One Year | Three Years | Five Years | Five Years | Total | ||||||||||||||||
Commercial loans |
$ | 10,459 | $ | 1,622 | $ | — | $ | — | $ | 12,081 | ||||||||||
Commercial construction loans |
322 | — | — | — | 322 | |||||||||||||||
Consumer loans |
118 | 132 | 48 | 8,451 | 8,749 | |||||||||||||||
Standby letters of credit |
200 | — | — | — | 200 | |||||||||||||||
Commitments to extend credit, including loan commitments, standby letters of credit, and commercial
letters of credit do not necessarily represent future cash requirements, in that these commitments
often expire without being drawn upon.
Quantitative and Qualitative Disclosures about Market Risk
The current economic outlook and its potential impact on the Bank and current interest rate
forecasts are reviewed monthly to determine the potential impact on the Corporation’s performance.
Actual results are compared to budget in terms of growth and income. A yield and cost analysis is
done to monitor interest margin. Various ratios are monitored including capital ratios and
liquidity. Also, the quality of the loan portfolio is reviewed in light of the current allowance
for loan losses, and the Bank’s exposure to market risk is reviewed.
Interest rate risk is the potential for economic losses due to future rate changes and can be
reflected as a loss of future net interest income and/or a loss of current market values. The
Corporation’s Asset/Liability Management Committee’s (ALCO) objective is to measure the effect on
net interest income and to adjust the balance sheet to minimize the inherent risk while at the same
time maximizing income. Tools used by management include the standard GAP report which reflects the
repricing schedule for various asset and liability categories and an interest rate shock simulation
report. The Bank has no market risk sensitive instruments held for
trading purposes. However, the Bank is party to financial instruments with off-balance sheet risk
in the normal course of business to meet the financing needs of its customers including commitments
to extend credit and letters of credit. A commitment or letter of credit is not recorded as an
asset until the instrument is exercised (see Note 17, “Financial Instruments with Off-Balance-Sheet
Risk” in Notes to Consolidated Financial Statements).
29
Table of Contents
The table below shows the scheduled maturity and repricing of the Corporation’s interest sensitive
assets and liabilities as of December 31, 2009:
| (in thousands) | ||||||||||||||||||||
| 0-3 | 4-12 | 1-5 | 5+ | |||||||||||||||||
| Months | Months | Years | Years | Total | ||||||||||||||||
Assets: |
||||||||||||||||||||
Loans |
$ | 118,686 | $ | 69,355 | $ | 79,864 | $ | 6,141 | $ | 274,046 | ||||||||||
Securities |
1,538 | 3,998 | 10,648 | 7,517 | 23,701 | |||||||||||||||
Short term investments |
101 | — | — | — | 101 | |||||||||||||||
Total assets |
$ | 120,325 | $ | 73,353 | $ | 90,512 | $ | 13,658 | $ | 297,848 | ||||||||||
Liabilities: |
||||||||||||||||||||
NOW, savings, and MMDA |
$ | 32,585 | $ | — | $ | — | $ | 90,356 | $ | 122,941 | ||||||||||
Time deposits |
41,175 | 54,093 | 31,317 | 26 | 126,611 | |||||||||||||||
FHLBI advances & other borrowings |
414 | — | — | — | 414 | |||||||||||||||
Total liabilities |
$ | 74,174 | $ | 54,093 | $ | 31,317 | $ | 90,382 | $ | 249,966 | ||||||||||
Rate sensitivity GAP: |
||||||||||||||||||||
GAP for period |
$ | 46,151 | $ | 19,260 | $ | 59,195 | $ | (76,724 | ) | |||||||||||
Cumulative GAP |
46,151 | 65,411 | 124,606 | 47,882 | ||||||||||||||||
December 31, 2009 cumulative sensitive ratio |
1.62 | 1.51 | 1.78 | 1.19 | ||||||||||||||||
December 31, 2008 cumulative sensitive ratio |
0.98 | 0.84 | 1.40 | 1.19 | ||||||||||||||||
The preceding table sets forth the time periods in which earning assets and interest bearing
liabilities will mature or may re-price in accordance with their contractual terms. The entire
balance of NOW, savings, and MMDA are not categorized as 0-3 months, although they are variable
rate products. Some of these balances are core deposits and are not considered rate sensitive.
Allocations are made to time periods based on the Bank’s historical experience and management’s
analysis of industry trends.
In the GAP table above, the short term (one year and less) cumulative interest rate sensitivity is
151% asset sensitive at year end and was 16% liability sensitive for the previous year.
Because of the Bank’s asset sensitive position, if market interest rates increase, this positive
GAP position indicates that the interest margin would be positively affected. However, GAP analysis
is limited and may not provide an accurate indication of the impact of general interest rate
movements on the net interest margin since repricing of various categories of assets and
liabilities is subject to the Bank’s needs, competitive pressures, and the needs of the Bank’s
customers. In addition, various assets and liabilities indicated as repricing within the same
period may in fact reprice at different times within the period and at different rate indices. Due
to these inherent limitations in the GAP analysis, the Corporation also utilizes simulation
modeling, which measures the impact of upward and downward movements of interest rates on interest
margin and indicates that a 100 basis point decrease in interest rates would reduce net interest
income by approximately 2.52% in the first year, while a 200 basis point increase in interest rates
would decrease net interest income by approximately .86% in the first year. This is influenced by
the assumptions regarding how quickly and to what extent liabilities will reprice with a change in
interest rates.
Fair Value of Financial Instruments
We use fair value measurements to record adjustments to certain financial instruments and to
determine fair value disclosures. Investment securities available for sale are recorded at fair
value on a recurring basis. Additionally, from time to time, we may be required to record other
assets at fair value on a nonrecurring basis, such as loans held for investment. These
nonrecurring fair value adjustments typically involve application of lower of cost or market
accounting or write-downs of individual assets. See Note 21,
“Fair Value Measurements”, in Notes to Consolidated Financial Statements for further information
about the extent to which fair value is used to measure assets, the valuation methodologies used,
and its impact on earnings.
Fair value represents the price that would be received to sell an asset or paid to transfer a
liability in an orderly transaction between market participants at the measurement date. A
three-level hierarchy exists for disclosures of assets or liabilities recorded at fair value. The
classification of assets within the hierarchy is based on whether the inputs to the valuation
methodology used for measurement are observable or unobservable. Observable inputs reflect
market-derived data or market-based information obtained form independent sources, while
unobservable inputs reflect our estimates about market data. The three levels of the fair value
hierarchy are as follows:
Level 1 — Valuation is based upon quoted prices for identical instruments traded in active
markets. Level 1 instruments include securities traded in active markets, such as the New York
Stock Exchange, as well as U.S. Treasury securities that are traded by dealers or brokers in active
over-the-counter markets.
Level 2 — Valuation is based upon quoted prices for similar instruments in active markets, quoted
prices for identical or similar instruments in markets that are not active, and model-based
valuation techniques, such as matrix pricing, for which all significant
30
Table of Contents
assumptions are observable
in the market. Level 2 instruments generally include U.S. government and agency securities, U.S.
government and agency mortgage-backed securities, municipal bonds and preferred stocks.
Level 3 — Valuation is generated from model-based techniques that use significant assumptions not
observable in the market. These unobservable assumptions reflect our own estimates of assumptions
market participants would use in pricing the asset or liability. Valuation techniques include use
of discounted cash flow models and similar techniques.
For assets recorded at fair value, it is management’s intention to maximize the use of observable
inputs and minimize the use of unobservable inputs when developing fair value measurements. When
available, quoted market prices are used to measure fair value. If market prices are not
available, fair value measurement is based on models that use primarily market-based or
independently-sourced market parameters, including interest rate yield curves, prepayment speeds,
and option volatilities. Substantially all of our asset valuations use either of the foregoing
methodologies, collectively Level 1 and Level 2 measurements, to determine fair value adjustments
recorded to our financial statements. However, in certain cases, when market observable inputs for
model-based valuation techniques may not be available, we are required to make judgments about
assumptions market participants would use in estimating the fair value of the asset or liability.
The degree of management judgment involved in determining the fair value of a financial instrument
is dependent upon the availability of quoted market prices or observable market parameters. For
assets that trade actively and have quoted market prices or observable market parameters, there is
minimal subjectivity involved in measuring fair value. When observable market prices and
parameters are not fully available, management judgment is necessary to estimate fair value. In
addition, changes in market conditions may reduce the availability of quoted prices or observable
data. For example, reduced liquidity in the capital markets or changes in secondary market
activities could result in observable market inputs becoming unavailable. When significant
adjustments are required to available observable inputs, it may be appropriate to utilize an
estimate based primarily on unobservable inputs. When an active market for a security does not
exist, the use of management estimates that incorporate current market participant expectations of
future cash flows, and include appropriate risk premiums, is acceptable.
At December 31, 2009, $22.7 million, or 6.8% of total assets, consisted of assets recorded at fair
value on a recurring basis. Assets for which fair values were measured using significant Level 3
inputs represented 12.0% of these assets (0.8% of total assets). The remaining assets measured at
fair value on a recurring basis were measured using valuation methodologies involving market-based
or market-derived information, which are Level 2 measurements, determined mainly with the
assistance of independent pricing services.
Our asset valued on a recurring basis using Level 3 measurements was a non-agency collateralized
mortgage obligation (CMO). This asset has underlying collateral which consists of jumbo, interest
only, adjustable rate mortgages with a 10 year fixed interest rate and a 30 to 40 year amortization
schedule. The vast majority of the mortgages were originated in 2007, are concentrated in
California, and are limited documentation loans. This asset was reclassified from a Level 2 to a
Level 3 measurement in the fourth quarter of 2008 because significant inputs to the valuation
became unobservable, largely due to reduced levels of market liquidity. As discussed further in
Note 3, “Investment Securities” in Notes to Consolidated Financial Statements, an
other-than-temporary impairment charge of $1,338,938 was recorded in 2008 related to this asset.
RESULTS OF OPERATIONS
Net loss was $13,696,000 in 2009, a $283,000 decrease in profitability compared to net loss of
$13,413,000 in 2008. In 2008, our net loss was a decrease of $6,857,000 in profitability compared
to our net loss of $6,556,000 reported in 2007.
The ratio of net income (loss) to average shareholders’ equity and to average total assets, for the
years ended December 31 follows:
| 2009 | 2008 | 2007 | 2006 | 2005 | ||||||||||||||||
Net income (loss) as a percent of: |
||||||||||||||||||||
Average common equity |
-64.62 | % | -34.92 | % | -13.98 | % | 11.06 | % | 13.63 | % | ||||||||||
Average total assets |
-3.78 | % | -3.23 | % | -1.46 | % | 1.20 | % | 1.39 | % | ||||||||||
Net Interest Income
Net interest income is the difference between interest earned on loans, securities and other
earning assets and interest paid on deposits and borrowed funds. In the following tables, the
interest earned on investments and loans is expressed on a fully taxable equivalent (FTE) basis.
Tax exempt interest is increased to an amount comparable to interest subject to federal income
taxes in order to properly evaluate the effective yields earned on earning assets. The tax
equivalent adjustment is based on a federal income tax rate of 34%.
From September 2007 to December 2008 the Federal Reserve Bank reduced the target federal funds rate
from 5.25% to 0.25%, where it has since remained. In addition, the yield curve has steepened
considerably. The current rate environment (lower short term interest rates and steeper yield
curve) has had a favorable impact on our net interest margin during 2009 and 2008 which partially
offset the adverse impact of declining levels of average interest earning assets, as described
below.
The following yield analysis shows that the Corporation’s interest margin decreased 15 basis points
in 2009 as a result of a decrease of 81 basis points in yield on earning assets combined with a
decrease of 93 basis points in the interest cost on deposits and
31
Table of Contents
borrowings. In 2008, the interest
margin decreased 22 basis points as a result of a decrease of 96 basis points in yield on earning
assets combined with a decrease of 97 basis points in the interest cost on deposits and borrowings.
The following table shows the daily average balances for major categories of interest earning
assets and interest bearing liabilities, interest earned (on a taxable equivalent basis) or paid,
and the effective rate or yield, for the three years ended December 31, 2009, 2008, and 2007.
Yield Analysis of Consolidated Average Assets and Liabilities
| (in thousands) | ||||||||||||||||||||||||||||||||||||
| 2009 | 2008 | 2007 | ||||||||||||||||||||||||||||||||||
| Average | Yield/ | Average | Yield/ | Average | Yield/ | |||||||||||||||||||||||||||||||
| Balance | Interest | Rate | Balance | Interest | Rate | Balance | Interest | Rate | ||||||||||||||||||||||||||||
Assets |
||||||||||||||||||||||||||||||||||||
Interest earning assets: |
||||||||||||||||||||||||||||||||||||
Short term investments |
$ | 4,566 | $ | 11.4 | 0.25 | % | $ | 18,186 | $ | 382.3 | 2.10 | % | $ | 3,091 | $ | 150.6 | 4.87 | % | ||||||||||||||||||
Certificates of deposit |
3,386 | 162.8 | 4.81 | % | 4,503 | 219.5 | 4.87 | % | 3,998 | 189.2 | 4.73 | % | ||||||||||||||||||||||||
Securities: Taxable |
21,963 | 1,235.9 | 5.63 | % | 24,714 | 1,397.0 | 5.65 | % | 29,795 | 1,324.8 | 4.45 | % | ||||||||||||||||||||||||
Tax-exempt (1) |
10,747 | 646.9 | 6.02 | % | 15,412 | 912.7 | 5.92 | % | 16,021 | 941.5 | 5.88 | % | ||||||||||||||||||||||||
Commercial loans (2)(3) |
256,848 | 13,710.3 | 5.34 | % | 292,103 | 18,632.6 | 6.38 | % | 324,097 | 23,988.5 | 7.40 | % | ||||||||||||||||||||||||
Consumer loans (2)(3) |
20,232 | 1,217.3 | 6.02 | % | 21,671 | 1,620.3 | 7.48 | % | 24,522 | 2,160.4 | 8.81 | % | ||||||||||||||||||||||||
Mortgage loans (2)(3) |
20,354 | 1,136.3 | 5.58 | % | 22,863 | 1,488.9 | 6.51 | % | 26,418 | 1,774.0 | 6.72 | % | ||||||||||||||||||||||||
Total earning assets and total
interest income |
338,096 | $ | 18,120.9 | 5.36 | % | 399,452 | $ | 24,653.3 | 6.17 | % | 427,942 | $ | 30,529.0 | 7.13 | % | |||||||||||||||||||||
Cash and due from banks |
27,798 | 7,959 | 8,914 | |||||||||||||||||||||||||||||||||
All other assets |
16,306 | 20,869 | 19,845 | |||||||||||||||||||||||||||||||||
Allowance for loan losses |
(16,897 | ) | (12,751 | ) | (8,940 | ) | ||||||||||||||||||||||||||||||
Total assets |
$ | 365,303 | $ | 415,529 | $ | 447,761 | ||||||||||||||||||||||||||||||
Liabilities and Shareholders’ Equity |
||||||||||||||||||||||||||||||||||||
Interest bearing deposits: |
||||||||||||||||||||||||||||||||||||
NOW |
$ | 47,496 | $ | 91.7 | 0.19 | % | $ | 35,845 | $ | 87.7 | 0.24 | % | $ | 36,748 | $ | 181.5 | 0.49 | % | ||||||||||||||||||
Savings |
41,211 | 115.0 | 0.28 | % | 38,033 | 185.9 | 0.49 | % | 38,656 | 192.7 | 0.50 | % | ||||||||||||||||||||||||
MMDA |
49,160 | 465.5 | 0.95 | % | 72,762 | 1,465.3 | 2.01 | % | 67,473 | 2,081.7 | 3.09 | % | ||||||||||||||||||||||||
Time deposits |
147,272 | 3,894.7 | 2.64 | % | 163,211 | 5,941.2 | 3.64 | % | 184,938 | 8,910.4 | 4.82 | % | ||||||||||||||||||||||||
Short term borrowings |
29 | 1.3 | 4.48 | % | 273 | 13.8 | 5.05 | % | 6,918 | 371.3 | 5.37 | % | ||||||||||||||||||||||||
FHLBI long term advances |
1,212 | 64.2 | 5.30 | % | 8,812 | 424.5 | 4.82 | % | 2,504 | 147.1 | 5.87 | % | ||||||||||||||||||||||||
Total interest bearing liabilities and total interest expense |
286,380 | 4,632.4 | 1.62 | % | 318,936 | 8,118.4 | 2.55 | % | 337,237 | 11,884.7 | 3.52 | % | ||||||||||||||||||||||||
Noninterest bearing deposits |
55,102 | 55,077 | 59,734 | |||||||||||||||||||||||||||||||||
All other liabilities |
2,625 | 3,104 | 3,905 | |||||||||||||||||||||||||||||||||
Shareholders’ equity |
21,196 | 38,412 | 46,885 | |||||||||||||||||||||||||||||||||
Total
liabilities and shareholders’ equity |
$ | 365,303 | $ | 415,529 | $ | 447,761 | ||||||||||||||||||||||||||||||
Interest spread |
3.74 | % | 3.63 | % | 3.61 | % | ||||||||||||||||||||||||||||||
Net interest income-FTE |
$ | 13,488.5 | $ | 16,534.9 | $ | 18,644.3 | ||||||||||||||||||||||||||||||
Net interest margin |
3.99 | % | 4.14 | % | 4.36 | % | ||||||||||||||||||||||||||||||
| (1) | Average yields in the above table have been adjusted to a tax-equivalent basis using a 34% tax rate and exclude the effect of any unrealized market value adjustments included in other comprehensive income recorded under ASC Topic 320, Investments — Debt and Equity Securities. | |
| (2) | For purposes of the computation above, average non-accruing loans of $42,362,000 in 2009, $27,823,000 in 2008 and $13,691,000 in 2007 are included in the average daily balance. | |
| (3) | Interest on loans includes origination fees totaling $97,000 in 2009, $243,000 in 2008, and $328,000 in 2007. |
Tax equivalent interest income in each of the three years includes loan origination fees. A
substantial portion of such fees is deferred for recognition in future periods.
32
Table of Contents
The following table sets forth the effects of volume and rate changes on net interest income
on a taxable equivalent basis. The change in interest due to changes in both volume and rate has
been allocated to the change due to volume and the change due to rate in proportion to the
relationship of the absolute dollar amounts of the change in each:
| (in thousands) | ||||||||||||||||||||||||
| Year ended December 31, 2009 | Year ended December 31, 2008 | |||||||||||||||||||||||
| compared to | compared to | |||||||||||||||||||||||
| Year ended December 31, 2008 | Year ended December 31, 2007 | |||||||||||||||||||||||
| Amount of Increase (Decrease) Due to Change in | ||||||||||||||||||||||||
| Total | Total | |||||||||||||||||||||||
| Amount | Amount | |||||||||||||||||||||||
| Average | of Increase/ | Average | of Increase/ | |||||||||||||||||||||
| Volume | Rate | (Decrease) | Volume | Rate | (Decrease) | |||||||||||||||||||
Interest Income: |
||||||||||||||||||||||||
Short term investments |
$ | (286 | ) | $ | (84 | ) | $ | (370 | ) | $ | 736 | $ | (503 | ) | $ | 233 | ||||||||
Certificates of deposit |
(54 | ) | (2 | ) | (56 | ) | 24 | 6 | 30 | |||||||||||||||
Securities: |
||||||||||||||||||||||||
Taxable |
(156 | ) | (6 | ) | (162 | ) | (226 | ) | 298 | 72 | ||||||||||||||
Tax exempt |
(276 | ) | 10 | (266 | ) | (36 | ) | 7 | (29 | ) | ||||||||||||||
Loans |
(2,520 | ) | (3,158 | ) | (5,678 | ) | (2,859 | ) | (3,322 | ) | (6,181 | ) | ||||||||||||
Total interest income |
$ | (3,292 | ) | $ | (3,240 | ) | $ | (6,532 | ) | $ | (2,361 | ) | $ | (3,514 | ) | $ | (5,875 | ) | ||||||
Interest Expense: |
||||||||||||||||||||||||
Interest bearing deposits: |
||||||||||||||||||||||||
NOW, savings & MMDA |
$ | (104 | ) | $ | (963 | ) | $ | (1,067 | ) | $ | 65 | $ | (782 | ) | $ | (717 | ) | |||||||
Time deposits |
(580 | ) | (1,466 | ) | (2,046 | ) | (1,047 | ) | (1,922 | ) | (2,969 | ) | ||||||||||||
Short term borrowings |
(12 | ) | 0 | (12 | ) | (357 | ) | (1 | ) | (358 | ) | |||||||||||||
FHLBI advances |
(366 | ) | 6 | (360 | ) | 371 | (93 | ) | 278 | |||||||||||||||
Total interest expense |
$ | (1,062 | ) | $ | (2,423 | ) | $ | (3,485 | ) | $ | (968 | ) | $ | (2,798 | ) | $ | (3,766 | ) | ||||||
Net interest income (FTE) |
$ | (2,230 | ) | $ | (817 | ) | $ | (3,047 | ) | $ | (1,393 | ) | $ | (716 | ) | $ | (2,109 | ) | ||||||
Tax equivalent net interest income decreased $3,047,000 in 2009. The decrease was the result of a
$3,485,000 decrease in interest expense and a $6,532,000 decrease in interest income. The decrease
in interest income is attributable to a decrease in average earning assets of $61,356,000 during
the year and a decrease of 81 basis points in the interest rate earned on assets. The decrease in
interest expense is due to the decrease in average interest bearing liabilities of $32,556,000
combined with a decrease in rates paid of 93 basis points.
Tax equivalent loan interest income was $5,678,000 lower in 2009 than the previous year. The
decrease was due to a decrease of 106 basis points in the rate of interest earned on loans combined
with a decrease in average balances of $39,202,000 in 2009. In addition, the increasing level of
nonperforming loans during 2009 negatively impacted loan interest income. If the average balance
of nonperforming loans continues to increase in 2010, average loan rates and net interest income
will continue to be adversely impacted. In 2008, tax equivalent loan interest was $6,181,000 lower
than 2007 due to a decrease of 99 basis points in the rate of interest earned on loans combined
with a decrease in average balances of $38,400,000 in 2008. The Bank’s net interest income may also
be adversely impacted by the Bank’s inability to support loan growth due to declines in its
capital.
Income on taxable securities decreased $162,000 in 2009 due to a decrease in average balances of
$2,751,000. Tax equivalent income on tax-exempt bonds decreased $266,000 in 2009 due to a decrease
of $4,665,000 in average balances partially offset by an increase of 10 basis points in yield.
Interest income on short term investments decreased $370,000 due to a decrease of $13,620,000 in
average balances and a decrease in yield of 185 basis points. The average balance of purchased
certificates decreased $1,117,000 and the interest yield on these certificates decreased 6 basis
points.
The interest cost for NOW, savings and MMDA accounts decreased $1,067,000 because the interest rate
paid was 70 basis points lower and average balances decreased $8,773,000. Interest on time deposits
decreased $2,046,000 as a result of a decrease in average balances of $15,939,000 combined with a
decrease in interest rate of 100 basis points. Interest incurred on outstanding FHLBI advances
decreased $360,000 primarily as a result of the Bank’s repayment of $8,483,000 of long-term
advances in March 2009.
During 2009, net interest margin (tax equivalent basis) rose from 3.90% reported for the quarter
ended March 31, 2009 to 3.99% for the quarter ended December 31, 2009.
33
Table of Contents
In 2008, tax equivalent net interest income had decreased $2,109,000. The decrease was the result
of a $3,766,000 decrease in interest expense and a $5,875,000 decrease in interest income. The
decrease in interest income is attributable to a decrease in average earning assets of $28,490,000
during the year and a decrease of 96 basis points in the interest rate earned on assets. The
decrease in interest expense is due to the decrease in interest bearing funds of $18,301,000
combined with a decrease in rates paid of 97 basis points.
The following table shows the composition of average earning assets and interest paying liabilities
for the years ended December 31:
| 2009 | 2008 | 2007 | ||||||||||
As a percent of average earning assets: |
||||||||||||
Loans |
87.98 | % | 84.27 | % | 87.64 | % | ||||||
Securities |
9.67 | % | 10.05 | % | 10.71 | % | ||||||
Certificates of deposit |
1.00 | % | 1.13 | % | 0.93 | % | ||||||
Short term investments |
1.35 | % | 4.55 | % | 0.72 | % | ||||||
Average earning assets |
100.00 | % | 100.00 | % | 100.00 | % | ||||||
NOW, savings, & MMDA |
40.78 | % | 36.71 | % | 33.38 | % | ||||||
Time deposits |
43.55 | % | 40.86 | % | 43.21 | % | ||||||
Short term borrowing |
0.01 | % | 0.07 | % | 1.62 | % | ||||||
FHLBI advances |
0.36 | % | 2.21 | % | 0.59 | % | ||||||
Average interest bearing liabilities |
84.70 | % | 79.85 | % | 78.80 | % | ||||||
Earning asset ratio |
92.55 | % | 96.13 | % | 95.57 | % | ||||||
Free-funds ratio |
15.30 | % | 20.16 | % | 21.20 | % | ||||||
Provision for Loan Losses
The provision for loan losses increased to $15,847,000 in 2009 compared to $14,855,000 in 2008 and
$14,030,000 in 2007. At year end, the ratio of the allowance for loan loss to loans was 6.81%,
compared to 4.47% in 2008 and 2.96% in 2007. Additional discussion regarding the provision for loan
losses and the related allowance can be found under “Loans” in this Item 7.
Noninterest Income
Non-interest income represents 17.4% of total revenue in 2009, 0.4% in 2008, and 9.6% in 2007.
Non-interest income includes service charges and other fee income, trust income, gain (loss) on
available for sale securities, gain on sale of mortgage loans, and other miscellaneous income.
Total service charges and other fee income was $3,224,000 in 2009 compared to $2,957,000 in 2008
and $3,308,000 in 2007. In 2009 there was an increase of $267,000 (9.0%) from 2008 due to higher
non sufficient fund fees relating to the Bank’s implementation of an overdraft protection program
in May 2009, higher ATM network income, and lower service charge reversals. These favorable
variances were partially offset by lower service charges on deposit accounts and lower mortgage fee
income. In 2008 there was a decrease of $351,000 (10.6%) from 2007 due to lower non sufficient
fund fees, lower commercial and consumer loan late fees and loan service charges partially offset
by higher ATM network income, higher mortgage application fees and higher check printing fees.
Trust income was $336,000 in 2009 compared to $375,000 in 2008 and $402,000 in 2007. In 2009 there
was a decrease of $39,000 (10.3%) compared to 2008 due to lower asset values and a greater
percentage of investments in fixed income products partially offset by higher nonrecurring trust
consulting income. In 2008 there was a decrease of $27,000 (6.7%) compared to 2007 due to change
in customer investment preference from equity securities to fixed income products.
The Bank uses a third party to underwrite, fund, and close residential mortgage loans. In return,
the Bank earns a commission for taking the application and performing related services for the
third party. The Bank received $17,000 and $42,000 in commissions for 2009 and 2008, respectively
which are included in other fee income. During 2007, the last year in which the Bank originated
and sold residential mortgages on the secondary market, the Bank recognized gain on sale of mortgage loans
of $39,000 which is reported in other noninterest income. No gain on sale of mortgages was
recorded in 2009 and 2008.
Gain on sale of securities totaled $199,000 in 2009 from management’s decision to sell twenty five
municipal securities based on an evaluation of the issuers’ credit ratings. Gain also resulted
from sale of the purchased brokered certificates in 2009 based on management’s action to realize
immediate gains caused by the favorable interest rate environment. In 2008, impairment losses
totaling $3,237,000 were recognized on the Corporation’s Freddie Mac and Fannie Mae preferred stock
and CMO security. In 2007, net loss of $548,000 resulted from the sale of investment securities.
Noninterest Expense
Noninterest expense totaled $15,939,000, $14,979,000 and $17,805,000 in 2009, 2008 and 2007,
respectively. The increase in 2009 is primarily due to an increase in FDIC insurance, insurance
expense, and net losses on sale/writedown of ORE property. Reported noninterest expense for 2007
includes loss on sale/writedown of commercial loans held for sale of $4,300,000. Due to the
current challenging economic environment, management is focused on initiatives to reduce and
contain noninterest expense.
The most significant component of noninterest expense is salaries and employee benefits. In 2009,
salaries and employee benefits decreased $256,000 (3.8%) from $6,788,000 in 2008 to $6,532,000 in
2009. The decrease primarily results from reduced salary
34
Table of Contents
expense of $245,000 (4.5%) and reduced
group medical insurance costs of $68,000 (20.8%). These decreases relate to fewer employees in 2009
than 2008 and changes in the Bank’s health insurance plans. These favorable variances were
partially offset by an increase in contracted payroll of $169,000 which was elevated due to the
Bank’s need for additional temporary help in the commercial loan workout area. In 2008, salaries
and employee benefits totaled $6,800,000, an increase of $144,000 (2.2%) over 2007. Salaries
increased $241,000 (4.5%) in 2008 from 2007 and profit sharing expense decreased by $138,000
(97.3%) due to elimination of profit sharing based on the Corporation’s results.
Occupancy expense decreased $55,000 (4.6%) in 2009 due to lower building services, repairs and
maintenance and reduced depreciation resulting in part from closure of the Bank’s Lake Chemung
branch in May 2009. These were partially offset by higher utilities and property taxes. In 2008
occupancy expense decreased $26,000 (2.1%) due to lower property taxes, partially offset by higher
building service costs.
Equipment expenses decreased $89,000 (18.8%) in 2009 due primarily to lower equipment maintenance
charges, other equipment expense and depreciation expense. In 2008, equipment expense decreased
$16,000 (3.3%) due to reduced depreciation expense resulting from the Bank’s phone system becoming
fully depreciated.
Professional and service fees decreased $206,000 (9.1%) in 2009 primarily due to lower accounting,
consulting and legal fees, partially offset by higher OCC assessments. Legal fees, although
slightly lower in 2009 from 2008, are expected to remain elevated as the Bank continues to require
increased legal services for the work out of nonperforming loans. In 2008, professional and
service fees increased $230,000 (11.3%) due primarily to higher legal fees. The Bank’s annual fee
paid to the OCC was $208,000 and $112,000 in 2009 and 2008, respectively. The 2009 fee included a
surcharge resulting from the Bank’s need for increased regulatory supervision. In light of the
Bank’s current condition, the annual OCC assessment for 2010 is expected to remain elevated and
approximate the 2009 expense, adjusted slightly for the Bank’s 2010 decreased asset levels.
Computer service fees decreased $35,000 (6.9%) in 2009 compared to 2008 due to lower costs for our
on-line bill pay, trust department software, and internal monitoring and testing of our firewall
security. Computer service fees decreased $77,000 (13.3%) in 2008 due to higher 2007 costs
associated with a core processing conversion.
FDIC assessment fees increased $1,039,000 (173.2%) in 2009 due to an increase in FDIC rates and a
special assessment fee impacting all insured depository institutions designed to restore reserve
balances in the FDIC’s Deposit Insurance Fund. The special assessment enacted by the FDIC in June
2009 resulted in additional expense to the Bank of $173,000. In addition, due the Bank’s
undercapitalized regulatory classification and increased risk profile determined pursuant to a
regulatory examination completed in July 2009, the Bank’s FDIC assessment rate was increased
retroactive to March 2009 further contributing to the higher 2009 expense.
On November 12, 2009, the FDIC enacted assessment regulations requiring insured depository
institutions to prepay their estimated quarterly risk-based deposit insurance assessments for the
fourth quarter of 2009, as well as for all of 2010, 2011, and 2012, by December 30, 2009. The
pre-payment of these assessments is mandatory for all insured depository institutions; however, the
FDIC retained the discretion to exempt certain institutions from the prepayment requirements.
Under these regulations, the FDIC did exempt the Bank from prepaying its assessment for the fourth
quarter of 2009, as well as all of 2010, 2011, and 2012. FDIC assessment fees increased $553,000 in
2008 compared to 2007 due to higher assessments, partially reduced by a one-time credit being fully
utilized in the first half of 2008.
Based on the existing number of troubled banks and expected bank failures projected by the FDIC and
the current condition and risk profile of our Bank, the FDIC rates and assessment expense are
expected to remain elevated in 2010, with assessment expense adjusted slightly for expected
decreases in the Bank’s deposit base.
Computer software amortization expense decreased $18,000 (6.3%) in 2009 compared to 2008. In 2008,
computer software amortization expense increased $21,000 (7.8%) compared to 2007.
Printing and supplies decreased $92,000 (33.3%) in 2009 due to outsourcing of our statement
printing to a third party in early 2009 and savings realized from improved control of inventory
levels at all locations. Printing and supplies decreased $36,000 (11.7%) in 2008 primarily due to
higher supplies costs in 2007 related to the core system conversion.
Director fees decreased $146,000 (66.4%) in 2009 due to a reduction in the number of directors and
an overall reduction in the level of director compensation. Director fees decreased $81,000
(27.0%) in 2008 compared to 2007 due to no profit sharing bonus accrual for directors in 2008,
changes in director compensation and fewer committee meetings in 2008.
Loan collection and foreclosed property expenses primarily include collection costs related to
non-performing or delinquent loans and other real estate. Total expense decreased $6,000 (0.5%)
from 2008 due to lower ORE and appraisal expense partially offset by higher loan and collection
expense. Although the nature and amount of these expenses correlate directly with specific problem
loans and ORE properties, the level of these costs is expected to remain elevated in the near term
future due to the Bank’s high level of non-performing loans. In 2008, loan collection and
foreclosed property expenses increased $871,000 compared to 2007 also due to higher levels of
nonperforming loans and foreclosed assets.
35
Table of Contents
Net loss on the sale/writedown of ORE increased $556,000 in 2009 compared to 2008. This was
primarily due to net losses incurred on sale of 17 commercial properties in 2009 and fair value
adjustments (i.e. write-downs) to commercial properties totaling $1,083,000. In 2008, net loss on
the sale of ORE increased $44,000 compared to 2007 due to loss on sale of ORE mortgage properties.
Other expense increased $267,000 (26.5%) in 2009 compared to 2008 primarily due to increased
business insurance expense of $435,000 caused by a combination of the overall instability in the
banking industry and financial markets and the Corporation’s financial condition. This unfavorable
variance was partially offset by management’s continued efforts to control and decrease expenses in
advertising, business development, charitable contributions, education and membership and dues
expense. Other expense decreased $141,000 (12.3%) in 2008 compared to 2007 due to lower
advertising, meals and entertainment expense, community business development activities and lower
charitable contributions in 2008.
Federal Income Tax Expense (Benefit)
Income tax benefit was $(1,085,000), $(127,000), and $(3,783,000) in 2009, 2008 and 2007,
respectively. We recorded a valuation allowance of $4,120,000 and $4,750,000 in 2009 and 2008,
respectively, due to the uncertainty of future taxable income necessary to fully realize the
recorded net deferred tax asset. The 2009 income tax benefit increased $958,000 from 2008 due to
recognition of a $1,694,000 tax benefit resulting from tax legislation which provides for a refund
of taxes paid in prior years, partially offset by tax expense related to an additional valuation
allowance on previously recorded deferred tax assets. The effective tax rate was 7.34%, 0.9%, and
36.6% in 2009, 2008 and 2007, respectively. For further information, see Note 10, “Federal Income
Taxes,” in Notes to Consolidated Financial Statements.
Critical Accounting Policies
Our accounting and reporting policies are in accordance with accounting principles generally
accepted within the United States of America and conform to general practices within the banking
industry. The preparation of our consolidated financial statements requires us to make estimates
and judgments that affect the reported amounts of assets, liabilities, revenues and expenses.
Material estimates that are particularly susceptible to significant change in the near term relate
to the valuation of investment securities, determination of the allowance for loan losses and
accounting for income taxes, and actual results could differ from those estimates. Management has
reviewed these critical accounting policies with the Audit Committee of our Board of Directors.
Valuation of Investment Securities
See Notes 1(b) and 21 in Notes to Consolidated Financial Statements for a discussion of our
policies for valuing investment securities. Other-than-temporary impairment (OTTI) analyses are
conducted on a quarterly basis or more frequently if a potential loss-triggering event occurs. Our
evaluation considers various qualitative and quantitative factors regarding each investment
category, including if investment securities were U.S. Government issued, the credit rating on the
securities, credit outlook, payment status and financial condition, the length of time a security
has been in a loss position, the size of the loss position and other meaningful information. In
addition, with respect to our non-government agency CMO security, management regularly
completes a cash flow analysis with the assistance of a third party specialist. The analysis
considers assumptions regarding voluntary prepayment speed, default rate, and loss severity using
the CMO’s original yield as the discount rate.
For debt securities, we distinguish between the credit and noncredit components of an OTTI event.
The credit component of an OTTI charge is the difference between the present value of the cash
flows expected to be collected and the amortized cost basis of the debt security. If we do not
intend to sell the security and it is more likely than not that we will not have to sell the
security before the anticipated recovery of the remaining amortized cost basis, the credit
component of the OTTI charge is recognized in earnings and the remaining portion in other
comprehensive income. If either of the above criteria is met, the entire difference between the
amortized cost and fair value is recognized in earnings.
Allowance for Loan Losses
Our methodology for determining the allowance and related provision for loan losses and reserve for
unfunded credit commitments is described above in “Financial Condition — Loans.” In particular,
this area of accounting requires a significant amount of judgment because a multitude of factors
can influence the ultimate collection of a loan or other type of credit. Should the factors noted
above and as described in Note 1, “Summary of Significant Accounting Policies,” in Notes to
Consolidated Financial Statements, differ from our assumptions (for example, an increase in past due loans, deterioration of the economy), our
allowance for loan losses would likely be adversely impacted. It is extremely difficult to
precisely measure the amount of losses that may be inherent in our loan portfolio. We attempt to
accurately quantify the necessary allowance and related provision for loan losses, but there can be
no assurance that our modeling process will successfully identify all of the losses inherent in our
loan portfolio. As a result, we could record future provisions for loan losses that may be
significantly different from the levels that we have recorded.
Accounting for Income Taxes
We account for income taxes using the asset and liability method which results in two components of
income tax expense, current and deferred. (Income taxes are also discussed in more detail in Note
10, “Income Taxes,” in Notes to Consolidated Financial Statements). Accrued income taxes represent
the net estimated amount currently due to or to be received from taxing authorities. In estimating
accrued income taxes, management assesses the relative merits and risks of the appropriate tax
treatment of transactions taking into account statutory, judicial and regulatory guidance in the
context of our tax position. Deferred tax assets and liabilities represent differences between
when a tax benefit or expense is recognized for financial reporting purposes and on our tax return.
Deferred tax assets are periodically assessed for recoverability. We record a valuation allowance
if we believe, based on available
36
Table of Contents
evidence, that it is “more likely than not” that the future tax
assets recognized will not be realized before their expiration. The amount of the deferred tax
asset recognized and considered realizable could be reduced if projected taxable income is not
achieved due to various factors such as unfavorable business conditions. If projected taxable
income is not expected to be achieved, we record a valuation allowance to reduce our future tax
assets to the amount that we believe can be realized in our future tax returns.
It is our policy to evaluate the realizability of deferred tax assets related to unrealized losses
on available for sale debt securities separately from our other deferred tax assets when we have
the intent and ability to hold the security to recovery (maturity, if necessary). Because the
future taxable income implicit in the recovery of the basis of available for sale debt securities
for financial reporting purposes will offset the deductions underlying the deferred tax asset, a
valuation allowance would generally not be necessary, even in cases where a valuation allowance
might be necessary related to our other deferred tax assets.
Deferred tax assets and liabilities are calculated based on tax rates expected to be in effect in
future periods. Previously recorded tax assets and liabilities are adjusted when the expected date
of the future event is revised based upon current information. We may record a liability for
unrecognized tax benefits related to uncertain tax positions taken on our tax returns for which
there is less than a 50% likelihood of being recognized upon a tax examination. Interest and
penalties, to the extent applicable, are recorded in income tax expense.
Impact of New Accounting Standards
See Note 26, “Impact of New Accounting Standards,” in Notes to Consolidated Financial Statements
for discussion of new accounting standards and their impact.
Item 7A. Quantitative and Qualitative Disclosures About Market Risk.
Included in Management’s Discussion and Analysis of Financial Condition and Results of Operations.
Item 8. Financial Statements and Supplementary Data.
| Page | ||||
Index to Consolidated Financial Statements: |
||||
| 38 | ||||
| 40 | ||||
| 41 | ||||
| 42 | ||||
| 43 | ||||
| 44 |
37
Table of Contents

|
BDO Seidman, LLP Accountants and Consultants |
99 Monroe Avenue N.W., Suite 800 Grand Rapids, Michigan 49503-2654 Telephone: (616) 774-7000 Fax: (616) 776-3680 |
Report of Independent Registered Public Accounting Firm
Board of Directors and Shareholders
FNBH Bancorp, Inc.
Howell, Michigan
FNBH Bancorp, Inc.
Howell, Michigan
We have audited the accompanying consolidated balance sheets of FNBH Bancorp, Inc. as of December
31, 2009 and 2008, and the related consolidated statements of income, shareholders’ equity and
comprehensive income, and cash flows for each of the three years in the period ended December 31,
2009. These financial statements are the responsibility of the Corporation’s management. Our
responsibility is to express an opinion on these financial statements based on our audits.
We conducted our audits in accordance with the standards of the Public Company Accounting Oversight
Board (United States). Those standards require that we plan and perform the audit to obtain
reasonable assurance about whether the financial statements are free of material misstatement. An
audit includes examining, on a test basis, evidence supporting the amounts and disclosures in the
financial statements, assessing the accounting principles used and significant estimates made by
management, as well as evaluating the overall financial statement presentation. We believe that our
audits provide a reasonable basis for our opinion.
In our opinion, the consolidated financial statements referred to above present fairly, in all
material respects, the financial position of FNBH Bancorp, Inc. at December 31, 2009 and 2008, and
the results of its operations and its cash flows for each of the three years in the period ended
December 31, 2009, in conformity with accounting principles generally accepted in the United States
of America.
The Corporation’s subsidiary bank (“Bank”) is undercapitalized under regulatory capital guidelines
and, during 2009, the Bank entered into a consent order regulatory enforcement action (“consent
order”) with its primary regulator, the Office of the Comptroller of the Currency. The consent
order requires management to take a number of actions, including, among other things, increasing
and maintaining its capital levels at amounts in excess of the Bank’s current capital levels. As
discussed in Note 18, the Bank has not yet met the higher capital requirements and is therefore not
in compliance with the consent order. As a result of the uncertain potential impact of future
regulatory actions, circumstances exist that raise substantial doubt about the Corporation’s
ability to continue as a going concern. Management’s plans in regard to these matters are described
in Note 2. The financial statements do not include any adjustments that might result from the
outcome of this uncertainty.
We also have audited, in accordance with the standards of the Public Company Accounting Oversight
Board (United States), FNBH Bancorp, Inc.’s internal control over financial reporting as of
December 31, 2009, based on criteria established in Internal Control — Integrated Framework issued
by the Committee of Sponsoring Organizations of the Treadway Commission (COSO) and our report dated
March 30, 2010 expressed an unqualified opinion thereon.

Grand Rapids, Michigan
March 30, 2010
March 30, 2010
38
Table of Contents
|
|
BDO Seidman, LLP Accountants and Consultants |
99 Monroe Avenue N.W., Suite 800 Grand Rapids, Michigan 49503-2654 Telephone: (616) 774-7000 Fax: (616) 776-3680 |
Report of Independent Registered Public Accounting Firm
Board of Directors and Shareholders
FNBH Bancorp, Inc.
Howell, Michigan
FNBH Bancorp, Inc.
Howell, Michigan
We have audited FNBH Bancorp, Inc.’s internal control over financial reporting as of December 31,
2009, based on criteria established in Internal Control — Integrated Framework issued by the
Committee of Sponsoring Organizations of the Treadway Commission (the COSO criteria). FNBH Bancorp,
Inc.’s management is responsible for maintaining effective internal control over financial
reporting and for its assessment of the effectiveness of internal control over financial reporting,
included in Management’s Annual Report on Internal Control Over Financial Reporting, in Item 9A.
Our responsibility is to express an opinion on the Corporation’s internal control over financial
reporting based on our audit.
We conducted our audit in accordance with the standards of the Public Company Accounting Oversight
Board (United States). Those standards require that we plan and perform the audit to obtain
reasonable assurance about whether effective internal control over financial reporting was
maintained in all material respects. Our audit included obtaining an understanding of internal
control over financial reporting, assessing the risk that a material weakness exists, and testing
and evaluating the design and operating effectiveness of internal control based on the assessed
risk. Our audit also included performing such other procedures as we considered necessary in the
circumstances. We believe that our audit provides a reasonable basis for our opinion.
A company’s internal control over financial reporting is a process designed to provide reasonable
assurance regarding the reliability of financial reporting and the preparation of financial
statements for external purposes in accordance with generally accepted accounting principles. A
company’s internal control over financial reporting includes those policies and procedures that (1)
pertain to the maintenance of records that, in reasonable detail, accurately and fairly reflect the
transactions and dispositions of the assets of the company; (2) provide reasonable assurance that
transactions are recorded as necessary to permit preparation of financial statements in accordance
with generally accepted accounting principles, and that receipts and expenditures of the company
are being made only in accordance with authorizations of management and directors of the company;
and (3) provide reasonable assurance regarding prevention or timely detection of unauthorized
acquisition, use, or disposition of the company’s assets that could have a material effect on the
financial statements.
Because of its inherent limitations, internal control over financial reporting may not prevent or
detect misstatements. Also, projections of any evaluation of effectiveness to future periods are
subject to the risk that controls may become inadequate because of changes in conditions, or that
the degree of compliance with the policies or procedures may deteriorate.
In our opinion, FNBH Bancorp, Inc. maintained, in all material respects, effective internal control
over financial reporting as of December 31, 2009, based on the COSO criteria.
We have also audited, in accordance with the standards of the Public Company Accounting Oversight
Board (United States), the consolidated balance sheets of FNBH Bancorp, Inc. as of December 31,
2009 and 2008, and the related consolidated statements of income, shareholders’ equity and
comprehensive income, and cash flows for each of the three years in the period ended December 31,
2009, and our report dated March 30, 2010 expressed an unqualified opinion thereon.
Grand Rapids, Michigan
March 30, 2010
March 30, 2010
39
Table of Contents
FNBH BANCORP, INC. AND SUBSIDIARIES
Consolidated Balance Sheets
December 31, 2009 and 2008
December 31, 2009 and 2008
| 2009 | 2008 | |||||||
Assets |
||||||||
Cash and due from banks |
$ | 36,942,636 | $ | 10,175,999 | ||||
Short term investments |
101,029 | 11,904,019 | ||||||
Total cash and cash equivalents |
37,043,665 | 22,080,018 | ||||||
Certificates of deposit |
— | 4,319,000 | ||||||
Investment securities: |
||||||||
Investment securities available for sale, at fair value |
22,705,612 | 41,520,572 | ||||||
FHLBI and FRB stock, at cost |
994,950 | 994,950 | ||||||
Total investment securities |
23,700,562 | 42,515,522 | ||||||
Loans held for investment: |
||||||||
Commercial |
235,937,243 | 272,945,793 | ||||||
Consumer |
18,777,849 | 21,711,696 | ||||||
Real estate mortgage |
19,330,658 | 21,159,504 | ||||||
Total loans held for investment |
274,045,750 | 315,816,993 | ||||||
Less allowance for loan losses |
(18,665,173 | ) | (14,122,291 | ) | ||||
Net loans held for investment |
255,380,577 | 301,694,702 | ||||||
Premises and equipment, net |
8,091,463 | 8,626,526 | ||||||
Other real estate owned, held for sale |
3,777,119 | 2,678,444 | ||||||
Facilities held for sale, net |
60,453 | — | ||||||
Deferred tax assets, net |
— | 819,557 | ||||||
Accrued interest and other assets |
4,336,526 | 6,048,757 | ||||||
Total assets |
$ | 332,390,365 | $ | 388,782,526 | ||||
Liabilities and Shareholders’ Equity |
||||||||
Liabilities |
||||||||
Deposits: |
||||||||
Demand (non-interest bearing) |
$ | 65,643,739 | $ | 56,404,701 | ||||
NOW |
50,642,881 | 35,539,239 | ||||||
Savings and money market |
72,297,919 | 101,422,737 | ||||||
Time deposits |
121,200,201 | 142,286,835 | ||||||
Brokered certificates of deposit |
5,410,951 | 13,873,571 | ||||||
Total deposits |
315,195,691 | 349,527,083 | ||||||
Other borrowings |
413,970 | 8,897,277 | ||||||
Accrued interest, taxes, and other liabilities |
2,404,440 | 2,833,064 | ||||||
Total liabilities |
318,014,101 | 361,257,424 | ||||||
Shareholders’ Equity |
||||||||
Preferred stock, no par value. Authorized 30,000 shares; no shares
issued and outstanding at December 31, 2009 |
— | — | ||||||
Common stock, no par value. Authorized 7,000,000 shares at December
31, 2009
and 4,200,000 at December 31, 2008; 3,149,850 shares issued and
outstanding
at December 31, 2009 and 3,119,620 shares issued and outstanding at
December 31, 2008 |
6,738,128 | 6,583,158 | ||||||
Retained earnings |
6,641,060 | 19,643,976 | ||||||
Deferred directors’ compensation |
885,919 | 902,333 | ||||||
Accumulated other comprehensive income, net |
111,157 | 395,635 | ||||||
Total shareholders’ equity |
14,376,264 | 27,525,102 | ||||||
Total liabilities and shareholders’ equity |
$ | 332,390,365 | $ | 388,782,526 | ||||
See accompanying notes to consolidated financial statements.
40
Table of Contents
FNBH BANCORP, INC. AND SUBSIDIARIES
Consolidated Statements of Operations
December 31, 2009, 2008, and 2007
December 31, 2009, 2008, and 2007
| 2009 | 2008 | 2007 | ||||||||||
Interest and dividend income: |
||||||||||||
Interest and fees on loans |
$ | 16,009,172 | $ | 21,662,130 | $ | 27,819,663 | ||||||
Interest and dividends on investment securities: |
||||||||||||
U.S. Treasury, agency securities and CMOs |
1,205,935 | 1,276,017 | 1,277,759 | |||||||||
Obligations of states and political subdivisions |
446,827 | 644,588 | 680,515 | |||||||||
Other securities |
29,984 | 120,935 | 47,070 | |||||||||
Interest on certificates of deposit |
162,812 | 219,489 | 189,233 | |||||||||
Interest on short term investments |
14,813 | 384,077 | 159,074 | |||||||||
Total interest and dividend income |
17,869,543 | 24,307,236 | 30,173,314 | |||||||||
Interest expense: |
||||||||||||
Interest on deposits |
4,566,956 | 7,680,058 | 11,366,317 | |||||||||
Interest on other borrowings |
65,399 | 438,307 | 518,395 | |||||||||
Total interest expense |
4,632,355 | 8,118,365 | 11,884,712 | |||||||||
Net interest income |
13,237,188 | 16,188,871 | 18,288,602 | |||||||||
Provision for loan losses |
15,846,853 | 14,854,900 | 14,029,666 | |||||||||
Net interest income (deficiency) after provision for loan losses |
(2,609,665 | ) | 1,333,971 | 4,258,936 | ||||||||
Noninterest income: |
||||||||||||
Service charges and other fee income |
3,223,857 | 2,957,150 | 3,308,113 | |||||||||
Trust income |
336,258 | 374,886 | 401,768 | |||||||||
Gain (loss) on securities |
198,651 | (3,236,635 | ) | (547,571 | ) | |||||||
Other |
9,129 | 8,694 | 44,767 | |||||||||
Total noninterest income |
3,767,895 | 104,095 | 3,207,077 | |||||||||
Noninterest expense: |
||||||||||||
Loss on sale/writedown of commercial loans held for sale |
— | — | 4,311,528 | |||||||||
Salaries and employee benefits |
6,532,037 | 6,788,477 | 6,644,273 | |||||||||
Net occupancy expense |
1,138,208 | 1,192,987 | 1,218,720 | |||||||||
Equipment expense |
382,701 | 471,309 | 487,532 | |||||||||
Professional and service fees |
2,058,513 | 2,264,882 | 2,035,141 | |||||||||
Loan collection and foreclosed property expenses |
1,099,083 | 1,104,654 | 233,768 | |||||||||
Computer service fees |
464,224 | 498,878 | 575,452 | |||||||||
Computer software amortization expense |
267,852 | 285,911 | 265,343 | |||||||||
FDIC assessment fees |
1,639,183 | 600,058 | 47,197 | |||||||||
Printing and supplies |
184,058 | 275,840 | 312,256 | |||||||||
Director fees |
73,742 | 219,357 | 300,428 | |||||||||
Net loss on sale of OREO/repossessions |
827,324 | 271,166 | 227,557 | |||||||||
Other |
1,271,756 | 1,005,063 | 1,145,915 | |||||||||
Total noninterest expense |
15,938,681 | 14,978,582 | 17,805,110 | |||||||||
Loss before federal income tax |
(14,780,451 | ) | (13,540,516 | ) | (10,339,097 | ) | ||||||
Federal income tax benefit |
(1,084,568 | ) | (127,276 | ) | (3,782,909 | ) | ||||||
Net loss |
$ | (13,695,883 | ) | $ | (13,413,240 | ) | $ | (6,556,188 | ) | |||
Per share statistics: |
||||||||||||
Basic and diluted EPS |
$ | (4.32 | ) | $ | (4.33 | ) | $ | (2.13 | ) | |||
Dividends |
$ | — | $ | 0.16 | $ | 0.84 | ||||||
Basic average shares outstanding |
3,167,918 | 3,096,332 | 3,074,732 | |||||||||
Diluted average shares outstanding |
3,167,918 | 3,096,332 | 3,074,732 | |||||||||
See accompanying notes to consolidated financial statements.
41
Table of Contents
FNBH BANCORP, INC. AND SUBSIDIARIES
Consolidated Statements of Shareholders’ Equity and Comprehensive Income
December 31, 2009, 2008, and 2007
Consolidated Statements of Shareholders’ Equity and Comprehensive Income
December 31, 2009, 2008, and 2007
| Accumulated | ||||||||||||||||||||
| Deferred | Other | |||||||||||||||||||
| Directors’ | Comprehensive | |||||||||||||||||||
| Common Stock | Retained Earnings | Compensation | Income (Loss) | Total | ||||||||||||||||
Balances at December 31, 2006 |
$ | 6,005,835 | $ | 43,625,997 | $ | 725,186 | $ | (364,544 | ) | $ | 49,992,474 | |||||||||
Earned portion of long term incentive plan, net |
130,832 | 130,832 | ||||||||||||||||||
Issued 1,186 shares for employee stock purchase plan |
25,211 | 25,211 | ||||||||||||||||||
Issued 653 shares for current directors’ fees |
12,998 | 12,998 | ||||||||||||||||||
Issued 1,141 shares for directors’ variable fee plan |
30,020 | 30,020 | ||||||||||||||||||
Issued 685 shares for deferred directors’ fees |
14,549 | (14,549 | ) | — | ||||||||||||||||
Directors’ deferred compensation (6,560 stock units) |
148,972 | 148,972 | ||||||||||||||||||
Comprehensive income: |
||||||||||||||||||||
Net loss |
(6,556,188 | ) | (6,556,188 | ) | ||||||||||||||||
Change in unrealized gain (loss) on investment
securities available for sale, net of tax effect |
83,489 | 83,489 | ||||||||||||||||||
Less reclassification adjustment for realized
securities net loss included in net loss, net of
tax effect |
361,397 | 361,397 | ||||||||||||||||||
Total comprehensive loss |
(6,111,302 | ) | ||||||||||||||||||
Repurchase of common stock (39,000 shares) |
(77,610 | ) | (960,995 | ) | (1,038,605 | ) | ||||||||||||||
Cash dividends ($0.84 per share) |
(2,563,418 | ) | (2,563,418 | ) | ||||||||||||||||
Balances at December 31, 2007 |
6,141,835 | 33,545,396 | 859,609 | 80,342 | 40,627,182 | |||||||||||||||
Earned portion of long term incentive plan, net |
139,652 | 139,652 | ||||||||||||||||||
Issued 1,356 shares for employee stock purchase plan |
10,367 | 10,367 | ||||||||||||||||||
Issued 57,556 shares for a stock subscription |
259,000 | 259,000 | ||||||||||||||||||
Issued 2,242 shares for current directors’ fees |
17,196 | 17,196 | ||||||||||||||||||
Issued 712 shares for deferred directors’ fees |
15,108 | (15,108 | ) | — | ||||||||||||||||
Directors’ deferred compensation (7,287 stock units) |
57,832 | 57,832 | ||||||||||||||||||
Comprehensive income: |
||||||||||||||||||||
Net loss |
(13,413,240 | ) | (13,413,240 | ) | ||||||||||||||||
Change in unrealized gain on investment
securities available for sale, net of tax effect |
(2,572,071 | ) | (2,572,071 | ) | ||||||||||||||||
Less reclassification adjustment for
other-than-temporary impairment charge on
securities included in net loss, net of tax
effect |
2,887,364 | 2,887,364 | ||||||||||||||||||
Total comprehensive loss |
(13,097,947 | ) | ||||||||||||||||||
Cash dividends ($0.16 per share) |
(488,180 | ) | (488,180 | ) | ||||||||||||||||
Balances at December 31, 2008 |
6,583,158 | 19,643,976 | 902,333 | 395,635 | 27,525,102 | |||||||||||||||
Cumulative effect of change in accounting
principle, adoption of ASC Topic 320, net of tax |
692,967 | (692,967 | ) | — | ||||||||||||||||
Earned portion of long term incentive plan, net |
88,155 | 88,155 | ||||||||||||||||||
Issued 4,609 shares for employee stock purchase plan |
4,992 | 4,992 | ||||||||||||||||||
Issued 26,410 shares for current directors’ fees |
45,409 | 45,409 | ||||||||||||||||||
Issued 823 shares for deferred directors’ fees |
16,414 | (16,414 | ) | — | ||||||||||||||||
Comprehensive income: |
||||||||||||||||||||
Net loss |
(13,695,883 | ) | (13,695,883 | ) | ||||||||||||||||
Change in unrealized gain on investment
securities available for sale, net of tax effect |
510,303 | 510,303 | ||||||||||||||||||
Less reclassification adjustment for realized
securities net gain included in net loss, net of
tax effect |
(101,814 | ) | (101,814 | ) | ||||||||||||||||
Total comprehensive loss |
(13,287,394 | ) | ||||||||||||||||||
Balances at December 31, 2009 |
$ | 6,738,128 | $ | 6,641,060 | $ | 885,919 | $ | 111,157 | $ | 14,376,264 | ||||||||||
See accompanying notes to consolidated financial statements.
42
Table of Contents
FNBH BANCORP, INC. AND SUBSIDIARIES
Consolidated Statements of Cash Flows
December 31, 2009, 2008, and 2007
Consolidated Statements of Cash Flows
December 31, 2009, 2008, and 2007
| 2009 | 2008 | 2007 | ||||||||||
Cash flows from operating activities: |
||||||||||||
Net loss |
$ | (13,695,883 | ) | $ | (13,413,240 | ) | $ | (6,556,188 | ) | |||
Adjustments to reconcile net loss to net cash provided by operating activities: |
||||||||||||
Provision for loan losses |
15,846,853 | 14,854,900 | 14,029,666 | |||||||||
Depreciation and amortization |
842,194 | 906,363 | 935,722 | |||||||||
Deferred income tax benefit |
(966,107 | ) | (1,508,577 | ) | (192,769 | ) | ||||||
Net amortization on investment securities |
13,749 | 26,725 | 13,806 | |||||||||
Earned portion of long-term incentive plan, net |
88,155 | 139,652 | 130,832 | |||||||||
Shares issued for current and variable directors’ compensation |
45,409 | 17,196 | 43,018 | |||||||||
Shares earned for deferred directors’ compensation |
— | 57,832 | 148,972 | |||||||||
(Gain) loss on sale/disposal of equipment |
24,190 | (3,972 | ) | 18,951 | ||||||||
(Gain) loss on available for sale securities |
(101,814 | ) | 3,236,635 | 547,571 | ||||||||
Gain on sale of brokered certificates of deposit |
(96,837 | ) | — | — | ||||||||
Gain on sale of loans originated for sale |
— | — | (39,345 | ) | ||||||||
Loss on sale/writedown of commercial loans held for sale |
— | — | 4,311,528 | |||||||||
Proceeds from sale of loans originated for sale |
— | — | 2,712,725 | |||||||||
Origination of loans held for sale |
— | — | (2,673,380 | ) | ||||||||
Loss on the sale of other real estate owned, held for sale |
843,412 | 264,226 | 201,390 | |||||||||
Decrease (increase) in accrued interest income and other assets |
3,067,500 | 6,349,621 | (3,998,342 | ) | ||||||||
Decrease in accrued interest, taxes, and other liabilities |
(412,624 | ) | (280,536 | ) | (1,749,526 | ) | ||||||
Net cash provided by operating activities |
5,498,197 | 10,646,825 | 7,884,631 | |||||||||
Cash flows from investing activities: |
||||||||||||
Purchases of available for sale securities |
— | (16,507,770 | ) | (16,412,592 | ) | |||||||
Purchases of held to maturity securities |
— | (1,574,840 | ) | (505,500 | ) | |||||||
Proceeds from sales of available for sale securities |
5,404,554 | — | 15,995,814 | |||||||||
Proceeds from maturities and at-par calls of available for sale securities |
10,230,000 | 7,890,000 | 13,532,844 | |||||||||
Proceeds from mortgage-backed securities paydowns-available for sale |
3,887,393 | 1,218,672 | 1,189,383 | |||||||||
Proceeds from maturities and calls of held to maturity securities |
— | 2,305,000 | 1,895,000 | |||||||||
Proceeds from sale of brokered certificates of deposit |
3,432,837 | — | — | |||||||||
Proceeds from sale of equipment |
— | 15,000 | — | |||||||||
Proceeds from sale of loans originated for investment, held for sale |
— | — | 8,763,632 | |||||||||
Purchases of certificates of deposit |
— | (1,373,000 | ) | (2,651,000 | ) | |||||||
Maturity of certificates of deposit |
983,000 | 1,079,000 | 3,337,000 | |||||||||
Proceeds from sale of other real estate owned, held for sale |
2,596,559 | 2,100,236 | 2,107,838 | |||||||||
Net decrease in loans |
25,912,626 | 17,069,279 | 10,521,671 | |||||||||
Capital expenditures |
(171,812 | ) | (173,872 | ) | (998,351 | ) | ||||||
Net cash provided by investing activities |
52,275,157 | 12,047,705 | 36,775,739 | |||||||||
Cash flows from financing activities: |
||||||||||||
Net decrease in deposits |
(34,331,392 | ) | (30,051,413 | ) | (25,965,795 | ) | ||||||
Repayment of FHLBI advances |
(10,383,307 | ) | (354,913 | ) | (328,623 | ) | ||||||
Proceeds from FHLBI advances |
2,000,000 | — | 8,000,000 | |||||||||
Proceeds from issuance of short term debt |
— | 1,445,000 | 53,000,000 | |||||||||
Repayment of short term debt |
(100,000 | ) | (1,345,000 | ) | (65,000,000 | ) | ||||||
Repurchase of common stock |
— | — | (1,038,605 | ) | ||||||||
Dividends paid |
— | (488,180 | ) | (2,563,418 | ) | |||||||
Shares issued for stock subscription |
— | 259,000 | — | |||||||||
Shares issued for employee stock purchase plan |
4,992 | 10,367 | 25,211 | |||||||||
Net cash used in financing activities |
(42,809,707 | ) | (30,525,139 | ) | (33,871,230 | ) | ||||||
Net increase (decrease) in cash and cash equivalents |
14,963,647 | (7,830,609 | ) | 10,789,140 | ||||||||
Cash and cash equivalents at beginning of year |
22,080,018 | 29,910,627 | 19,121,487 | |||||||||
Cash and cash equivalents at end of year |
$ | 37,043,665 | $ | 22,080,018 | $ | 29,910,627 | ||||||
Supplemental disclosures: |
||||||||||||
Interest paid |
$ | 4,976,605 | $ | 8,662,730 | $ | 11,736,225 | ||||||
Federal income taxes (refunded) paid |
(2,119,770 | ) | (559,000 | ) | 1,672,230 | |||||||
Transfer of held to maturity securities to available for sale securities, at amortized cost |
— | 14,639,423 | — | |||||||||
Loans transferred to other real estate |
4,538,646 | 3,519,827 | 2,203,057 | |||||||||
Loans charged off |
11,929,963 | 12,105,101 | 11,290,640 | |||||||||
Loans, net of reserves, transferred to held for investment from held for sale |
— | — | 3,689,159 | |||||||||
Loans, net of reserves, transferred to held for sale |
— | — | 17,194,017 | |||||||||
See accompanying notes to consolidated financial statements.
43
Table of Contents
Notes to Consolidated Financial Statements
(1) Summary of Significant Accounting Policies
Principles of Consolidation
The consolidated financial statements include the accounts of FNBH Bancorp, Inc. and its wholly
owned subsidiaries, First National Bank in Howell (“the Bank”) and H.B. Realty Co. herein
collectively the “Corporation”. All significant intercompany balances and transactions have been
eliminated. FNBH Mortgage Company, formerly a wholly owned subsidiary of First National Bank in
Howell was dissolved effective December 31, 2007.
The Bank is a full-service bank offering a wide range of commercial and personal banking services.
These services include checking accounts, savings accounts, certificates of deposit, commercial
loans, real estate loans, installment loans, collections, night depository, safe deposit box, U.S.
Savings Bonds, and trust services. The Bank serves primarily five communities — Howell, Brighton,
Green Oak Township, Hartland, and Fowlerville — all of which are located in Livingston County,
Michigan. The Bank is not dependent upon any single industry or business for its banking
opportunities.
H.B. Realty Co. was established on November 26, 1997 to purchase land for a future branch site of
the Bank and to hold title to other Bank real estate when it is considered prudent to do so.
The preparation of financial statements in conformity with accounting principles generally accepted
in the United States of America requires management to make estimates and assumptions that affect
the reported amounts of assets and liabilities and disclosure of contingent assets and liabilities
at the date of the financial statements and the reported amounts of revenues and expenses during
the reporting period. These estimates are based on information available to management at the time
the estimates are made. Actual results could differ from those estimates. Management has evaluated
subsequent events for disclosure or recognition up to the time of filing of theses financial
statements with the Securities and Exchange Commission on March 30, 2010.
The accounting and reporting policies of FNBH Bancorp, Inc. and subsidiaries (Corporation) conform
to accounting principles generally accepted in the United States of America and to general practice
within the banking industry. The following is a description of the more significant of these
policies.
| (a) | Brokered Certificates of Deposit | |
| Brokered certificates of deposit are purchased periodically from other financial institutions in denominations of less than $100,000 and carried at cost. These investments are fully insured by the FDIC. Brokered CD’s are not marketable, and there is a penalty for early withdrawal. Management sold the Bank’s CD portfolio in 2009 to realize gains resulting from the favorable interest rate environment. |
| (b) | Investment Securities | |
| The Bank classifies debt and equity investments as follows: | ||
| Investment securities the Bank may not hold until maturity are accounted for as securities available for sale and are stated at fair value, with unrealized gains and losses, net of income taxes, reported as a separate component of other comprehensive income until realized. Fair value measurement is based upon quoted prices, if available. If quoted prices are not available, fair values are measured using independent pricing models or other model-based valuation techniques such as present value of future cash flows, adjusted for the security’s credit rating, prepayment assumptions and other factors such as credit loss assumptions. | ||
| Investment securities are reviewed quarterly for possible other-than-temporary impairment (OTTI). Management’s evaluation considers various qualitative and quantitative factors regarding each investment category, including if investment securities were U.S. Government issued, the credit rating on the securities, credit outlook, payment status and financial condition, the length of time a security has been in a loss position, the size of the loss position and other meaningful information. In addition, with respect to the Corporation’s non-government agency CMO security, management regularly completes a cash flow analysis with the assistance of a third party specialist. The analysis considers assumptions regarding voluntary prepayment speed, default rate, and loss severity using the CMO’s original yield as the discount rate. | ||
| For debt securities, the Corporation distinguishes between the credit and noncredit components of an OTTI event. The credit component of an OTTI charge is the difference between the present value of the cash flows expected to be collected and the amortized cost basis of the debt security. If the Corporation does not intend to sell the security and it is more likely than not that the Corporation will not have to sell the security before the anticipated recovery of the remaining amortized cost basis, the credit component of the OTTI charge is recognized in earnings and the remaining portion in other comprehensive income. If either of the above criteria is met, the entire difference between the amortized cost and fair value is recognized in earnings. | ||
| Gains or losses on the sale of securities are computed based on the adjusted cost of the specific security. |
44
Table of Contents
| (c) | Loans | |
| Loans are classified within loans held for investment when management has the intent and ability to hold the loan for the foreseeable future, or until maturity or payoff. The foreseeable future is a management judgment which is determined based upon the type of loan, business strategies, current market conditions, balance sheet management and liquidity needs. Management’s view of the foreseeable future may change based on changes in these conditions. When a decision is made to sell or securitize a loan that was not originated or initially acquired with the intent to sell or securitize, the loan is reclassified from loans held for investment into held for sale. Loans are classified as held for sale when management has the intent and ability to sell or securitize. Due to changing market conditions or other strategic initiatives, management’s intent with respect to the disposition of the loan may change, and accordingly, loans previously classified as held for sale may be reclassified into loans held for investment. Loans transferred between loans held for sale and loans held for investment classifications are recorded at the lower of cost or market at the date of transfer. | ||
| Loans held for investment are carried at the principal amount outstanding net of unearned income, unamortized premiums or discounts, deferred loan origination fees and costs, the allowance for loan losses, and fair value adjustments, if any. | ||
| During the second quarter of 2007, the Bank reclassified certain nonperforming loans originated for investment to the held for sale classification at their then estimated lower of cost or fair value due to its intent, at the time, to package and sell the loans in the secondary market. Certain of these loans were sold in the third quarter of 2007. Due to the prevailing secondary market conditions, which worsened during the third quarter when the final bids were received, the remaining balance of these loans, previously identified as held for sale, were determined by management to no longer be offered for sale. Based on the intent and ability of the Corporation to no longer sell these loans, they were transferred back to loans held for investment at their then estimated fair values based on the bids received. For purposes of reporting cash flows, the proceeds from the sale of the reclassified loans are included in cash flows from investing activities in the consolidated statement of cash flows, such that these cash inflows are categorized consistent with the initial cash outflows related to these loans. | ||
| Interest on loans is accrued daily based on the outstanding principal balance. Loan origination fees and certain direct loan origination costs are deferred and recognized over the lives of the related loans as an adjustment of the yield. Net unamortized deferred loan fees amounted to $244,000 and $296,000 at December 31, 2009 and 2008, respectively. | ||
| (d) | Allowance for Loan Losses and Credit Commitments | |
| The allowance for loan losses is based on management’s periodic evaluation of the loan portfolio and reflects an amount that, in management’s opinion, is adequate to absorb probable losses in the existing portfolio. In evaluating the portfolio, management takes into consideration numerous factors, including current economic conditions, prior loan loss experience, nonperforming loan levels, the composition of the loan portfolio, and management’s evaluation of the collectability of specific loans, which includes analysis of the value of the underlying collateral. Although the Bank evaluates the adequacy of the allowance for loan losses based on information known to management at a given time, various regulatory agencies, based on the timing of their normal examination process, may require future additions to the allowance for loan losses. | ||
| The Bank also maintains a reserve for losses on unfunded credit commitments and letters of credit to provide for the risk of loss inherent in these arrangements. The reserve is computed using the same methodology as that used to determine the allowance for loan losses. This reserve is reported as a liability on the balance sheet within accrued interest, taxes, and other liabilities, while the corresponding provision for these losses is recorded as a component of the provision for loan losses. | ||
| (e) | Nonperforming Assets | |
| The Bank charges off all or part of loans when amounts are deemed to be uncollectible, although collection efforts may continue and future recoveries may occur. | ||
| Nonperforming assets are comprised of loans for which the accrual of interest has been discontinued, loans for which the terms have been renegotiated to less than market rates due to a serious weakening of the borrower’s financial condition, loans 90 days past due and still accruing, and other real estate owned, which has been acquired primarily through foreclosure and is awaiting disposition. | ||
| Loans are generally placed on a nonaccrual status when principal or interest is past due 90 days or more and when, in the opinion of management, full collection of principal and interest is unlikely. At the time a loan is placed on nonaccrual status, interest previously accrued but not yet collected is charged against current interest income. Income on such loans is then recognized only to the extent that cash is received and where future collection of principal is probable. | ||
| The Bank considers a loan to be impaired when it is probable that it will be unable to collect all or part of amounts due according to the contractual terms of the loan agreement. Impaired loans are measured based on the present value of expected cash flows discounted at the loan’s effective interest rate or, as a practical expedient, at a loan’s observable market price, or the fair value of the collateral if the loan is collateral dependent. Interest income on impaired loans is accrued based on the principal amounts outstanding. The accrual of interest is generally discontinued when an impaired loan becomes 90 days past due. |
45
Table of Contents
| (f) | Other Real Estate Owned | |
| Other real estate owned is recorded at the asset’s estimated fair value, net of estimated disposal costs, at the time of foreclosure, establishing a new cost basis. Any write-downs at the time of foreclosure are charged to the allowance for loan losses. Expenses incurred in maintaining assets, adjustments to estimated disposal costs, and subsequent write-downs to reflect declines in value are charged to noninterest expense. | ||
| (g) | Transfer of Financial Assets | |
| Transfers of financial assets are accounted for as sales when control over the assets has been surrendered. Control over transferred assets is deemed to be surrendered when (1) the assets have been isolated from the Bank, (2) the transferee obtains the right (free of conditions that constrain it from taking advantage of that right) to pledge or exchange the transferred assets, and (3) the Bank does not maintain effective control over the transferred assets through an agreement to repurchase them before their maturity. The Bank’s transfers of financial assets are limited to (1) commercial loan participations sold, which were insignificant for 2009, 2008 and 2007, (2) the 2007 sale of loans originated for investment and (3) the 2007 sale of residential mortgage loans in the secondary market. Amounts for the last two described transfers are disclosed in the consolidated statements of cash flows. | ||
| (h) | Premises and Equipment | |
| Premises and equipment are stated at cost less accumulated depreciation and amortization. Depreciation and amortization, computed on the straight-line method, are charged to operations over the estimated useful lives of the assets. Estimated useful lives range up to 40 years for buildings, up to 7 years for furniture and equipment and up to 15 years for land improvements. Leasehold improvements are generally depreciated over the shorter of the respective lease term or estimated useful life. | ||
| Premises and equipment are evaluated periodically for impairment when events or changes in circumstances indicate the carrying amount may not be recoverable. Impairment exists when the expected undiscounted future cash flows of a long-lived asset are less than its carrying value. In that event, the Bank recognizes a loss for the difference between the carrying amount and the estimated fair value of the asset based on a quoted market price, if applicable, or a discounted cash flow analysis. Impairment losses are recorded in other noninterest expense on the income statement. | ||
| (i) | Advertising Costs | |
| Advertising costs are generally expensed as incurred and approximated $53,000, $89,000 and $161,000 in 2009, 2008 and 2007, respectively. | ||
| (j) | Federal Income Taxes | |
| Deferred tax assets and liabilities are recognized for the future tax consequences attributable to differences between the financial statement carrying amounts of existing assets and liabilities and their respective tax bases. Deferred tax assets and liabilities are measured using enacted tax rates expected to apply to taxable income in the years in which those temporary differences are expected to be recovered or settled. The effect on deferred tax assets and liabilities of a change in tax rates is recognized in income in the period that includes the enactment date. | ||
| A valuation allowance, if needed, reduces deferred tax assets to the expected amount more likely than not that is to be realized. Realization of the Corporation’s deferred tax assets is primarily dependent upon the generation of a sufficient level of future taxable income. At December 31, 2009 and 2008, management did not believe it was more likely than not that all of the deferred tax assets would be realized and, accordingly, recorded valuation allowances of $8,870,413 and $4,750,000, respectively. | ||
| In preparation of income tax returns, tax positions are taken based on interpretation of federal and state income tax laws for which the outcome is uncertain. Management reviews and evaluates the status of tax positions. There were no unrecognized tax benefits during 2009 or 2008. Interest or penalties related to unrecognized tax benefits would be recorded in income tax expense. The Corporation files U.S. federal income tax returns which are subject to final examination for all years after 2005. | ||
| (k) | Stock-Based Compensation | |
| At December 31, 2009 and 2008, the Corporation had two stock-based compensation plans, which are described more fully in notes 14 and 15. | ||
| (l) | Common Stock Repurchases | |
| The Corporation records common stock repurchases at cost. A portion of the repurchase is charged to common stock based on the average per share dollar amount of stock outstanding, multiplied by the number of shares repurchased, with the remainder charged to retained earnings. Shares repurchased are retired. During the year ended December 31, 2007, 39,000 shares were repurchased under share repurchase programs authorized by the Board of Directors. The cost of the repurchased shares approximated $1,039,000 at monthly weighted average prices ranging from $26.55 to $26.70 per share. No shares were repurchased in 2008 under the authorized one-year program that expired on August 17, 2008 and there were no authorized repurchase programs in 2009. |
46
Table of Contents
| (m) | Statements of Cash Flows | |
| For purposes of reporting cash flows, cash equivalents include amounts due from banks, federal funds sold and other short term investments with original maturities of 90 days or less. | ||
| (n) | Comprehensive Income | |
| ASC Topic 220 Comprehensive Income, establishes standards for the reporting and display of comprehensive income and its components (such as changes in unrealized gains and losses on securities available for sale) in a financial statement that is displayed with the same prominence as other financial statements. The Corporation reports comprehensive income within the statement of shareholders’ equity and comprehensive income. Comprehensive income includes net income and any changes in equity from nonowner sources that are not recorded in the income statement. | ||
| (o) | Earnings Per Share | |
| Basic earnings per common share is calculated by dividing net income by the weighted average number of common shares and participating securities outstanding during the period. Diluted earnings per share are the same as basic earnings per share because any additional potential common shares issuable are included in the basic earnings per share calculation. The Corporation’s restricted stock awards, which provide non-forfeitable rights to dividends or dividend equivalents, are considered a participating security and are included in the number of shares outstanding for both basic and diluted earnings per share calculations. | ||
| (p) | Reclassifications | |
| Certain reclassifications in the prior years’ financial statements have been made to conform to the current year presentation. | ||
| (q) | Operating Segment | |
| While the Corporation monitors revenue streams of the various products and services offered, the Corporation manages its business on the basis of one operating segment, banking, in accordance with the qualitative and quantitative criteria established by ASC Topic 280, Segment Reporting. |
(2) Management’s Plan
During 2009 the Bank continued to experience the prolonged challenges of the Michigan economy
evidenced by borrowers’ weakening operating results, deteriorating cash flows, and decreased
liquidity levels. These factors, against the backdrop of significant declines in real estate
values and historically high unemployment levels, continued to adversely impact credit quality in
the loan portfolio and resulted in further deterioration of the Bank’s financial condition.
The Corporation reported its third successive year of net loss. The 2009 pretax loss of $14.8
million followed pretax losses of $13.5 million and $10.3 million in 2008 and 2007, respectively.
During 2009, the Bank provided $15.8 million in provision for loan losses, incurred $11.3 million
of net loan charge-offs, and recorded $2.6 million in costs related to management of problem loans
and other real estate, including ORE losses. The impact of the above events and financial results
has caused the Bank’s capital position to deteriorate to a level classified as undercapitalized by
regulatory standards at December 31, 2009.
Additionally, during 2009, further regulatory action was taken against the Bank due to its weakened
financial condition and performance issues. On September 24, 2009, the Bank consented to issuance
of a Consent Order (the “Order”) by the Office of the Comptroller of the Currency (“OCC”). The
Order requires management and the board of directors to take certain actions to improve the
financial condition of the Bank, including achieving and maintaining total capital equal to 11% of
risk-weighted assets and Tier 1 capital equal to at least 8.5% of adjusted total assets by January
22, 2010. To date, the Corporation has not been successful in raising the capital necessary to
satisfy the requirements of the Order. In addition and as fully explained in Note 18, for purposes
of Prompt Corrective Action (“PCA”), the Bank is now treated as if it were significantly
undercapitalized.
In light of the Bank’s continued losses, its capital position at December 31, 2009 and
noncompliance with certain requirements of the Order, management believes that it is reasonable to
anticipate further regulatory enforcement action by the OCC and FDIC. In addition, management does
not anticipate a dramatic recovery in the Michigan economy or local real estate market in the
near-term. As a result, the current economic factors will likely continue to negatively impact the
Bank’s overall performance and profitability. In response, management is working to mitigate the
impact of these regulatory and economic challenges facing the Bank by pursuing the initiatives
described below. However, even if successful, implementation of all components of management’s
plan is not expected to produce profitable results in 2010 and may not be successful in maintaining
the Bank or the Corporation as a going concern.
The consolidated financial statements included in this Form 10-K
have been prepared assuming the Bank continues to operate in the
normal course of business for the foreseeable future, and do not include any adjustments to recorded assets or liabilities should we be unable
to continue as a going concern.
Management intends to support the Bank’s regulatory capital levels and ratios via strategic balance
sheet reductions in 2010 achieved primarily through non renewal of high cost certificates of
deposits while managing normal loan runoff (i.e., scheduled payments) with limited new money loan
originations. The execution of this strategy is expected to sustain the Bank’s net interest margin
via lower deposit pricing in the current rate environment coupled with greater reliance on lower
cost core deposits. The strategy will entail close monitoring of the Bank’s liquidity position and
attention to significant customer relationships.
Management continues to maintain significant borrowing availability as a source of contingency
funding at the Federal Home Loan Bank and Federal Reserve as secured by eligible loans pledged as
collateral. At December 31, 2009, the Bank has approximately
47
Table of Contents
$27.6 million of unused availability under established lines of credit at the FHLB and Federal
Reserve Discount Window. Management conducts on-going reviews of the Bank’s portfolio loans to
identify additional eligible collateral to further increase the Bank’s borrowing capacity.
Asset quality improvements are critical to the Bank’s future financial results and performance.
The active management and targeted reduction in the current level of criticized loans will be
achieved through continued quarterly loan portfolio credit quality reviews emphasizing timely
monitoring of borrower relationships, timely identification of credit weaknesses, and heightened
accountability of loan officers. Experienced loan work-out personnel continue to enhance the
Bank’s credit position via loan renewals, restructurings and loan modification strategies, where
appropriate, to mitigate potential further losses. Other efforts include the proactive management
and marketing of other real estate properties to minimize carrying costs, disposal losses, and
holding periods. Overall, the continued emphasis on these asset quality initiatives is expected to
gradually decrease the Bank’s level of nonperforming assets while reducing the provision for loan
loss expense, loan charge-offs, and related problem loan expenses.
The Bank’s 2010 budget includes plans for continued emphasis on expense reductions, revenue
enhancements, and operational efficiencies. Planned cost reductions include a 5 percent salary
reduction effective February 2010 for all non-exempt salaried staff and elimination of the Bank’s
401(k) plan match and discretionary profit-sharing contributions. In addition, further staff
eliminations were made in select areas to align staffing levels with the needs of a smaller bank
operation. Other initiatives include negotiation of reduced fee arrangements with attorneys and
other vendors regularly engaged by the Bank for the management of problem loans. Management has
also evaluated the scope and necessity of services provided by professionals and vendors to
identify further cost savings. In addition, significant discretionary costs have been cut or
eliminated.
Plans for noninterest income revenue enhancements include partnering with a local established
residential mortgage origination company to enhance mortgage loan referral income. Management also
intends to originate and sell commercial loans under the federal government’s SBA loan guarantee
program to generate additional noninterest income. Finally, the sale of certain non-essential
assets and select Bank branches are periodically evaluated to support capital levels.
Further, discretionary, noncritical capital expenditures for facility and technology improvements
not otherwise providing a net cost savings or net revenue enhancement have been deferred
indefinitely until the Bank’s financial condition improves.
In considering alternatives to effect potential cost savings and cost reductions, management
remains committed to ensuring that all appropriate and necessary resources available at reasonable
costs are utilized to operate the Bank in a manner consistent with safe and sound banking
practices.
Management’s most important objective for 2010 is to restore the Bank’s capital to a level
sufficient to comply with the OCC’s capital directive and provide sufficient capital resources and
liquidity to meet commitments and business needs. As noted above, the Bank did not raise the
capital necessary to satisfy requirements of the Consent Order by January 22, 2010. However,
management and the Board of Directors have met and continue to meet with accredited potential
investors and are working with an investment banking firm to raise the additional equity believed
necessary to sufficiently recapitalize the Bank. Management and the Board of Directors are
committed to pursuing all potential alternatives and sources of capital to restore the Bank’s
capital levels. Such alternatives include raising capital from existing shareholders, individuals,
institutional capital market investors and private equity funds and the identification of suitors
for a sale or merger transaction.
Management makes no assurances that these efforts will improve the Bank’s financial condition and
further deterioration of the Bank’s capital position is possible. The current economic environment
in southeast Michigan and local real estate market conditions will continue to impose significant
challenges on the Bank and are expected to adversely impact financial results. Any further
declines in the Bank’s capital levels may likely result in more severe regulatory enforcement
action by either the OCC or FDIC.
(3) Investment Securities
A summary of the amortized cost and approximate fair value of investment securities at December 31,
2009 and 2008 follows:
| December 31, 2009 | December 31, 2008 | |||||||||||||||||||||||||||||||
| Unrealized | Unrealized | |||||||||||||||||||||||||||||||
| Amortized | Unrealized | Gross | Amortized | Unrealized | Gross | Fair | ||||||||||||||||||||||||||
| Cost | Gross Gains | Losses | Fair Value | Cost | Gross Gains | Losses | Value | |||||||||||||||||||||||||
Obligations of state and
political subdivisions |
$ | 7,088,573 | $ | 126,321 | $ | (59,093 | ) | $ | 7,155,801 | $ | 14,639,423 | $ | 233,833 | $ | (168,840 | ) | $ | 14,704,416 | ||||||||||||||
Agency securities |
1,504,100 | 26,547 | (3,178 | ) | 1,527,469 | 9,510,468 | 182,546 | — | 9,693,014 | |||||||||||||||||||||||
Mortgage-backed/CMO
securities |
13,895,720 | 606,611 | (566,789 | ) | 13,935,542 | 16,722,434 | 351,908 | — | 17,074,342 | |||||||||||||||||||||||
Preferred stock securities |
48,800 | 38,000 | — | 86,800 | 48,800 | — | — | 48,800 | ||||||||||||||||||||||||
Total securities |
$ | 22,537,193 | $ | 797,479 | $ | (629,060 | ) | $ | 22,705,612 | $ | 40,921,125 | $ | 768,287 | $ | (168,840 | ) | $ | 41,520,572 | ||||||||||||||
48
Table of Contents
The CMO security was the only security in a continuous loss position for 12 months or more at
December 31, 2009. There were no securities in a continuous loss position for 12 months or more at
December 31, 2008.
Investment securities are reviewed quarterly for possible other-than-temporary impairment (OTTI).
In the second quarter of 2009, the Corporation adopted new guidance impacting ASC Topic 320,
Investments — Debt and Equity Instruments, related to the recognition and presentation of
other-than-temporary impairments. This new guidance requires an entity to assess whether it
intends to sell, or it is more likely than not that it will be required to sell a security in an
unrealized loss position before the recovery of its amortized cost basis. If either of these
criteria is met, the entire difference between the amortized cost and fair value is recognized in
earnings. For securities that do not meet the aforementioned criteria, the amount of impairment
recognized in earnings is limited to the amount related to credit losses, while impairment related
to other factors is recognized in other comprehensive income.
Through March 31, 2009, the Corporation had previously recognized a cumulative OTTI charge of
$1,338,938 on a non-government agency CMO security. Based on management’s intent not to sell this
security before recovery and the likelihood that the Corporation will not have to sell the security
before recovery of its cost basis, the Corporation reversed $1,049,951 ($692,967 net of tax) of the
non credit portion of the cumulative OTTI charge. The adoption of this ASC was recognized as a
cumulative effect adjustment that increased retained earnings and decreased accumulated other
comprehensive income as of April 1, 2009. At December 31, 2009, the unrealized (non credit) loss
on the CMO security was determined to be $566,789 using the valuation methodology, inputs and
assumptions described more fully below.
Management regularly reviews the securities portfolio for the existence of OTTI. Management’s
evaluation considers various qualitative and quantitative factors regarding each investment
category, including if the securities were U.S. Government issued, the credit rating on the
securities, credit outlook, payment status and financial condition, the length of time the security
has been in a loss position, the size of the loss position and other meaningful information. Based
on management’s review, no impairment charges were required to be recognized during the year ended
December 31, 2009. With respect to the Corporation’s non-government agency CMO security,
management regularly completes a cash flow analysis of the CMO with the assistance of a third party
vendor. The analysis considers assumptions regarding voluntary prepayment speed, default rate, and
loss severity using the CMO’s original yield as the discount rate. At December 31, 2009, the
estimated fair value of the CMO, based on a combination of Level 2 and Level 3 inputs, including a
market participant discount rate, indicated that the related cash flows continue to support the
amortized cost of the security and no additional other-than-temporary impairment had been incurred.
The following is a summary of the unrealized losses and fair value of securities at December 31,
2009 and 2008, by length of time that individual securities in each category have been in a
continuous loss position:
| December 31, 2009 | ||||||||||||||||||||||||
| Less than 12 months | 12 months or more | Total | ||||||||||||||||||||||
| Unrealized | Unrealized | Unrealized | ||||||||||||||||||||||
| Gross | Fair | Gross | Fair | Gross | Fair | |||||||||||||||||||
| Losses | Value | Losses | Value | Losses | Value | |||||||||||||||||||
Obligations of state and
political subdivisions |
$ | (59,093 | ) | $ | 2,885,936 | $ | — | $ | — | $ | (59,093 | ) | $ | 2,885,936 | ||||||||||
Agency securities |
(3,178 | ) | 495,650 | — | — | (3,178 | ) | 495,650 | ||||||||||||||||
Mortgage-backed/CMO
securities |
— | — | (566,789 | ) | 2,734,709 | (566,789 | ) | 2,734,709 | ||||||||||||||||
Preferred stock securities |
— | — | — | — | — | — | ||||||||||||||||||
Total securities |
$ | (62,271 | ) | $ | 3,381,586 | $ | (566,789 | ) | $ | 2,734,709 | $ | (629,060 | ) | $ | 6,116,295 | |||||||||
| December 31, 2008 | ||||||||||||||||||||||||
| Less than 12 months | 12 months or more | Total | ||||||||||||||||||||||
| Unrealized | Unrealized | Unrealized | ||||||||||||||||||||||
| Gross | Fair | Gross | Fair | Gross | Fair | |||||||||||||||||||
| Losses | Value | Losses | Value | Losses | Value | |||||||||||||||||||
Obligations of state and
political subdivisions |
$ | (168,840 | ) | $ | 4,320,554 | $ | — | $ | — | $ | (168,840 | ) | $ | 4,320,554 | ||||||||||
Agency securities |
— | — | — | — | — | — | ||||||||||||||||||
Mortgage-backed/CMO
securities |
— | — | — | — | — | — | ||||||||||||||||||
Preferred stock securities |
— | — | — | — | — | — | ||||||||||||||||||
Total securities |
$ | (168,840 | ) | $ | 4,320,554 | $ | — | $ | — | $ | (168,840 | ) | $ | 4,320,554 | ||||||||||
49
Table of Contents
The amortized cost and approximate fair value of investment securities at December 31, 2009 and
2008, by contractual maturity, are shown below. Expected maturities may differ from contractual
maturities because borrowers may have the right to call or prepay obligations with or without call
or prepayment penalties.
| December 31, 2009 | December 31, 2008 | |||||||||||||||
| Amortized | Approximate | Amortized | Approximate | |||||||||||||
| Cost | Fair Value | Cost | Fair Value | |||||||||||||
Due in one year or less |
$ | 1,395,800 | $ | 1,428,773 | $ | 2,054,745 | $ | 2,074,256 | ||||||||
Due after one year through five years |
225,000 | 239,281 | 4,207,023 | 4,301,499 | ||||||||||||
Due after
five years through ten years |
1,800,094 | 1,843,489 | 9,303,504 | 9,469,427 | ||||||||||||
Due after ten years |
5,220,579 | 5,258,527 | 8,633,420 | 8,601,048 | ||||||||||||
| 8,641,473 | 8,770,070 | 24,198,692 | 24,446,230 | |||||||||||||
Mortgage-backed serurites/CMO |
13,895,720 | 13,935,542 | 16,722,433 | 17,074,342 | ||||||||||||
Totals |
$ | 22,537,193 | $ | 22,705,612 | $ | 40,921,125 | $ | 41,520,572 | ||||||||
Proceeds from at-par calls on securities totaled $8,525,000 and $3,000,000 in 2009 and 2008,
respectively. There were no at-par calls of securities in 2007.
The amortized cost and approximate fair value of investment securities of states (including all
their political subdivisions) that individually exceeded 10% of shareholders’ equity at December
31, 2009 and 2008 are as follows:
| 2009 | 2008 | |||||||||||||||
| Amortized | Approximate | Amortized | Approximate | |||||||||||||
| Cost | Fair Value | Cost | Fair Value | |||||||||||||
State of Michigan |
$ | 4,742,851 | $ | 4,791,474 | $ | 10,570,123 | $ | 10,614,209 | ||||||||
Investment securities, with an amortized cost of approximately $12,241,000 at December 31,
2009 and $17,871,000 at December 31, 2008, were pledged to secure public deposits and for other
purposes as required or permitted by law.
The Bank owns stock in both the Federal Home Loan Bank of Indianapolis (FHLBI) and the Federal
Reserve Bank (FRB), both of which are recorded at cost. The Bank is required to hold stock in the
FHLBI equal to 5% of the institution’s borrowing capacity with the FHLBI. The Bank’s investment in
FHLBI stock amounted to $950,700 at December 31, 2009 and 2008. The Bank’s investment in FRB stock,
which totaled $44,250 at December 31, 2009 and 2008, is a requirement for the Bank’s membership in
the Federal Reserve System. These investments can only be resold to, or redeemed, by the issuer.
(4) Loans
Loans on nonaccrual status amounted to approximately $43,724,000, $37,096,000 and $14,459,000, at
December 31, 2009, 2008, and 2007, respectively. If these loans had continued to accrue interest in
accordance with their original terms, approximately $2,392,000, $1,800,000 and $714,000 of interest
income would have been recognized in 2009, 2008 and 2007, respectively. The Bank had $14,044,000 of
troubled-debt restructured loans at December 31, 2009 of which $10,018,000 are included in
nonaccrual loans. The Bank had no troubled-debt restructured loans at December 31, 2008 or 2007.
Details of past-due and nonperforming loans follow:
| 90 days past due | ||||||||||||||||||||||||
| and still accruing interest | Nonaccrual | |||||||||||||||||||||||
| 2009 | 2008 | 2007 | 2009 | 2008 | 2007 | |||||||||||||||||||
Commercial and mortgage
loans secured by real
estate |
$ | — | $ | 1,343,647 | $ | 86,484 | $ | 41,084,429 | $ | 35,093,010 | $ | 14,271,517 | ||||||||||||
Consumer loans |
— | — | — | 53,248 | 22,117 | 38,389 | ||||||||||||||||||
Commercial and other loans |
— | 216,310 | 27,451 | 2,586,292 | 1,980,890 | 149,307 | ||||||||||||||||||
Total |
$ | — | $ | 1,559,957 | $ | 113,935 | $ | 43,723,969 | $ | 37,096,017 | $ | 14,459,213 | ||||||||||||
Impaired loans totaled $41.4 million, $27.9 million and $17.0 million at December 31, 2009, 2008,
and 2007, respectively. Specific reserves relating to these loans were $7.4 million, $4.3
million and $1.7 million at December 31, 2009, 2008, and 2007, respectively. Average impaired
loans during 2009, 2008, and 2007 were approximately $36.1 million, $27.1 million and $15.7
million, respectively. Interest recognized under the cash basis as income on impaired loans
during 2009, 2008 and 2007, while they were considered to be impaired, was not significant.
50
Table of Contents
Loans serviced for others including commercial participations sold, were approximately $30.1
million, $34.7 million and $45.7 million at December 31, 2009, 2008 and 2007, respectively.
Loans also include the reclassification of demand deposit overdrafts, which amounted to $128,000
and $122,000 at December 31, 2009 and 2008, respectively.
Effective February 16, 2010, the Bank’s ability to sell mortgage loans to and service mortgage
loans for the Federal Home Loan Mortgage Corporation was discontinued. As a result, the Bank’s
$24.3 million mortgage loan servicing portfolio was transferred to another Freddie Mac servicing
provider on February 26, 2010. No gain or loss was incurred upon transfer of the Bank’s servicing
portfolio as all previously capitalized mortgage servicing rights had been fully amortized at
December 31, 2009. Amounts previously capitalized for mortgage servicing rights and the related
amortization expense incurred in 2009, 2008, and 2007 were not material.
(5) Allowance for Loan Losses and Reserve for Unfunded Credit Commitments
The following represents a summary of the activity in the allowance for loan losses and the reserve
for unfunded credit commitments for the years ended December 31, 2009, 2008 and 2007:
Components: |
2009 | 2008 | 2007 | |||||||||
Allowance for loan losses |
||||||||||||
Balance, beginning of year |
$ | 14,122,291 | $ | 10,314,161 | $ | 7,597,900 | ||||||
Loans charged off: |
||||||||||||
Real estate mortgage |
619,008 | 260,710 | 242,727 | |||||||||
Commercial |
10,729,989 | 11,170,028 | 5,519,109 | (1) | ||||||||
Consumer |
580,966 | 674,363 | 859,754 | |||||||||
Subtotal |
11,929,963 | 12,105,101 | 6,621,590 | |||||||||
Charge offs on loans transferred to held for sale |
— | — | 4,669,050 | (2) | ||||||||
Total charge offs |
11,929,963 | 12,105,101 | 11,290,640 | |||||||||
Recoveries to loans previously charged off: |
||||||||||||
Real estate mortgage |
7,073 | 14,545 | — | |||||||||
Commercial |
461,823 | 369,863 | 146,100 | |||||||||
Consumer |
141,096 | 250,923 | 239,135 | |||||||||
Total recoveries |
609,992 | 635,331 | 385,235 | |||||||||
Net loans charged off |
11,319,971 | 11,469,770 | 10,905,405 | |||||||||
Additions to allowance charged to operations |
15,862,853 | 15,277,900 | 13,621,666 | |||||||||
Balance, end of year |
18,665,173 | 14,122,291 | 10,314,161 | |||||||||
Reserve for unfunded credit commitments |
||||||||||||
Balance, beginning of year |
316,000 | 739,000 | 331,000 | |||||||||
Additions (reductions) to reserve charged (credited)
to operations |
(16,000 | ) | (423,000 | ) | 408,000 | |||||||
Balance, end of year |
300,000 | 316,000 | 739,000 | |||||||||
Total allowance for loan losses and reserve
for unfunded credit commitments |
$ | 18,965,173 | $ | 14,438,291 | $ | 11,053,161 | ||||||
| (1) | Partial charge offs of $2,934,831 are included in commercial charge offs to reduce the loans transferred to held for sale to their impaired value prior to consideration of bid amounts in 2007. | |
| (2) | Represents charges to the allowance to reduce the investment in the loans to the estimated fair values when the loans were transferred to held for sale in 2007. |
51
Table of Contents
(6) Premises and Equipment
A summary of premises and equipment, and related accumulated depreciation and amortization, at
December 31, 2009 and 2008 follows:
| 2009 | 2008 | |||||||
Land and land improvements |
$ | 2,874,212 | $ | 2,937,115 | ||||
Premises |
9,894,218 | 10,058,300 | ||||||
Furniture and equipment |
4,032,879 | 4,117,607 | ||||||
| 16,801,309 | 17,113,022 | |||||||
Less accumulated depreciation and amortization |
(8,709,846 | ) | (8,486,496 | ) | ||||
Premises and equipment, net |
$ | 8,091,463 | $ | 8,626,526 | ||||
(7) Other Real Estate Owned
At December 31, 2009, the Bank owned 20 foreclosed properties with a carrying value of $3,777,119.
As of December 31, 2008, the Bank owned 12 foreclosed properties with a carrying value of
$2,678,444. During 2009, net loss incurred on sale/write-down
of other real estate totaled $827,324 and included $1,083,216 of valuation write-downs taken subsequent to property
acquisitions and $255,892 of net gain recognized upon sale of other real estate. The net loss on sale/write-down of other real estate is included in noninterest expense.
(8) Time Certificates of Deposit
A gain or loss will be recognized upon the sale of the properties, which will be
included as a component of noninterest income or expense. At December 31, 2009, the scheduled maturities of time deposits, including brokered certificates of
deposit, with a remaining term of more than one year were:
| Year of maturity: | ||||
2011 |
$ | 21,480,384 | ||
2012 |
4,442,183 | |||
2013 |
893,794 | |||
2014 |
4,500,608 | |||
2015 and thereafter |
26,381 | |||
Total |
$ | 31,343,350 | ||
Included in time deposits are certificates of deposit and brokered certificates of deposit in
amounts of $100,000 or more. These certificates and their remaining maturities at December 31, 2009
and 2008 are as follows:
| 2009 | 2008 | |||||||
Three months or less |
$ | 18,484,354 | $ | 18,450,699 | ||||
Three through six months |
3,369,267 | 14,859,648 | ||||||
Six through twelve months |
14,052,837 | 19,162,264 | ||||||
Over twelve months |
10,024,712 | 8,971,885 | ||||||
Total |
$ | 45,931,170 | $ | 61,444,496 | ||||
Interest expense attributable to the above deposits amounted to approximately $1,386,000,
$2,541,000, and $4,095,000 in 2009, 2008, and 2007, respectively.
(9) Other Borrowings
Advances from the Federal Home Loan Bank of Indianapolis (“FHLBI”) are secured by unencumbered
qualified mortgage and home equity loans which provide maximum borrowing capacity of $10,100,000 at
December 31, 2009. The Bank had one advance outstanding for $413,970 at December 31, 2009 which
bore interest at 7.29% and was repaid in the first quarter of 2010. As of December 31, 2009, the
Bank also had unused borrowing capacity with the Federal Reserve of $16,100,000 secured by
commercial loans. No amounts were outstanding to the Federal Reserve at December 31, 2009 or 2008.
Interest expense on FHLBI advances amounted to approximately $64,000, $425,000, and $406,000, for
the years ended December 31, 2009, 2008 and 2007, respectively.
52
Table of Contents
(10) Federal Income Taxes
Federal income tax expense (benefit) consists of:
| 2009 | 2008 | 2007 | ||||||||||
Current |
$ | (2,050,675 | ) | $ | (1,635,853 | ) | $ | (3,975,678 | ) | |||
Deferred |
966,107 | 1,508,577 | 192,769 | |||||||||
Total federal income tax (benefit) |
$ | (1,084,568 | ) | $ | (127,276 | ) | $ | (3,782,909 | ) | |||
Federal income tax expense (benefit) differed from the amounts computed by applying the U.S.
Federal income tax rate of 34% to pretax income as a result of the following:
| 2009 | 2008 | 2007 | ||||||||||
Computed “expected” tax expense (benefit) |
$ | (5,025,353 | ) | $ | (4,603,775 | ) | $ | (3,515,293 | ) | |||
Increase (reduction) in tax resulting from: |
||||||||||||
Tax-exempt interest and dividends, net |
(179,149 | ) | (253,841 | ) | (275,995 | ) | ||||||
Change in valuation allowance |
4,120,413 | 4,750,000 | — | |||||||||
Other, net |
(479 | ) | (19,660 | ) | 8,379 | |||||||
Total federal income tax |
$ | (1,084,568 | ) | $ | (127,276 | ) | $ | (3,782,909 | ) | |||
The tax effects of temporary differences that give rise to significant portions of the deferred tax
assets and deferred tax liabilities at December 31, 2009 and 2008 are presented below:
| 2009 | 2008 | |||||||
Deferred tax assets: |
||||||||
Allowance for loan losses |
$ | 3,888,065 | $ | 2,531,562 | ||||
Net operating loss carryforward |
3,183,570 | 1,000,244 | ||||||
Other-than-temporary impairment on securities available for sale |
743,472 | 1,100,456 | ||||||
Alternative minimum tax credit carryforward |
— | 387,350 | ||||||
Premises and equipment |
330,517 | 281,624 | ||||||
Deferred directors’ fees |
301,212 | 306,813 | ||||||
Reserve for Other Real Estate Owned |
300,863 | — | ||||||
Supplemental retirement plan |
208,870 | 257,769 | ||||||
Other |
96,540 | 80,358 | ||||||
Total gross deferred tax assets |
9,053,109 | 5,946,176 | ||||||
Deferred tax liabilities: |
||||||||
Deferred loan fees |
(57,815 | ) | (61,113 | ) | ||||
Unrealized gain on securites available for sale |
(57,262 | ) | (203,812 | ) | ||||
Other |
(67,619 | ) | (111,694 | ) | ||||
Total gross deferred tax liabilities |
(182,696 | ) | (376,619 | ) | ||||
Net deferred tax asset before valuation allowance |
8,870,413 | 5,569,557 | ||||||
Valuation allowance |
(8,870,413 | ) | (4,750,000 | ) | ||||
Net deferred tax asset |
$ | — | $ | 819,557 | ||||
Deferred tax assets are subject to periodic asset realization tests. Management believes the above
valuation allowances are required at December 31, 2009 and 2008, due to the uncertainty of future
taxable income necessary to fully realize the recorded net deferred tax asset.
It is the Corporation’s policy to evaluate the realizability of deferred tax assets related to
unrealized losses on available for sale debt securities separately from its other deferred tax
assets when it has the intent and ability to hold the security to recovery (maturity, if
necessary). Because the future taxable income implicit in the recovery of the basis of available
for sale debt securities for financial reporting purposes will offset the deductions underlying the
deferred tax asset, a valuation allowance would generally not be necessary, even in cases where a
valuation allowance might be necessary related to the Corporation’s other deferred tax assets.
Accordingly, at December 31, 2008 a valuation allowance was not established against the tax effect
of a noncredit impairment loss related to the Corporation’s CMO security recognized in 2008.
Due to the Corporation’s adoption of new guidance impacting ASC Topic 320, Investments — Debt and
Equity Instruments, on April 1, 2009 (See Note 3), the tax effect of the unrealized (noncredit)
loss on the CMO security is included in the deferred tax liability related to unrealized net gains
on securities available for sale at December 31, 2009.
At December 31, 2009, the Corporation had a net operating loss carryforward of approximately
$9,363,000 that expires beginning in 2028 if not previously utilized.
53
Table of Contents
(11) Related Party Transactions
Certain directors and executive officers, including their immediate families and companies in which
they are principal owners, were loan customers of the Bank during 2009 and 2008. Deposits from such
individuals and their related interests totaled approximately $1.4 million at December 31, 2009 and
$2.6 million at December 31, 2008. Loans were made to such individuals in the ordinary course of
business, in accordance with the Bank’s normal lending policies, including the interest rate
charged and collateralization, and do not represent more than a normal credit risk. Loans to
related parties are summarized below for the periods indicated:
| 2009 | 2008 | |||||||
Balance at beginning of year |
$ | 3,499,732 | $ | 4,903,250 | ||||
New loans and related parties |
477,339 | 222,900 | ||||||
Loan repayments |
(32,320 | ) | (1,626,418 | ) | ||||
Loans no longer related-party |
(2,326,113 | ) | — | |||||
Balance at end of year |
$ | 1,618,638 | $ | 3,499,732 | ||||
(12) Leases
The Bank has a noncancelable operating lease that provides for renewal options. Future minimum
lease payments under the noncancelable lease as of December 31, 2009, are as follows:
Year ending December 31: |
||||
2010 |
$ | 42,000 | ||
2011 |
42,000 | |||
2012 |
31,500 | |||
Total lease payments |
$ | 115,500 | ||
Rental expense charged to operations in 2009, 2008 and 2007 amounted to approximately $55,000,
$55,000 and $58,000, respectively, including amounts paid under short term, cancelable leases.
(13) Retirement Plan
The Bank sponsors a defined contribution money purchase thrift plan covering all employees 21 years
of age or older who have completed one year of service as defined in the plan agreement. During
2009, contributions were equal to 3% of total employee earnings plus 50% of employee contributions
(limited to 10% of their earnings) or the maximum amount permitted by the Internal Revenue Code.
Effective January 1, 2010, the Bank eliminated the match contribution. The plan expense of the Bank
for 2009, 2008 and 2007 was approximately $302,000, $333,000 and $365,000, respectively.
(14) Long Term Incentive Plan
Under its Long-Term Incentive Plan (the “Plan”) the Corporation grants stock options and restricted
stock as compensation to key employees. The Corporation has not awarded any stock options under
the Plan to date. The restricted stock awards have a five year vesting period. The awards are
recorded at fair market value on the grant date and are amortized into salary expense over the
vesting period. The number of shares available for issuance under the Plan cannot exceed 200,000.
No stock awards were granted during 2009, as the Corporation’s authority to grant awards expired
April 22, 2008.
A summary of the activity under the Plan for the year ended December 31, 2009 is presented below:
| 2009 | ||||||||
| Weighted-Average | ||||||||
| Grant Date | ||||||||
| Restricted Stock Awards | Shares | Fair Value | ||||||
Outstanding at January 1, |
8,327 | $ | 17.90 | |||||
Granted |
— | — | ||||||
Vested |
(4,684 | ) | 18.82 | |||||
Forfeited |
(1,610 | ) | 15.76 | |||||
Outstanding at December 31, |
2,033 | $ | 17.47 | |||||
The total fair value of awards granted during the years ended December 31, 2008 and 2007 was
$177,000, and $190,800, respectively. The total fair value of the awards vested during the years
ended December 31, 2009, 2008 and 2007 was $88,139,
54
Table of Contents
$139,700, and $130,800, respectively. As of December 31, 2009, there was $36,000 of total unrecognized compensation cost related to non-vested
stock awards under the Plan. That cost is expected to be recognized over a weighted-average period
of 2.6 years.
(15) Directors’ Stock Fee Plan
Each director of the Corporation who is not an officer or employee of any subsidiary of the
Corporation is eligible to participate in the Compensation Plan for Nonemployee Directors.
Nonemployee directors may elect to participate in this plan in lieu of all or a portion of fees
payable to them as directors (“plan fees”). The plan fees consist of both a fixed and variable
component. The fixed component equals the per-meeting fee paid for attendance at board meetings of
both the Bank and the Corporation and any committees of their respective boards. The variable
component of the plan is equal to the total fixed fees paid to a specific director for services
performed during the preceding calendar year, multiplied by bonus amounts, (expressed as the
percentage of base compensation payable to officers of the Bank for the preceding calendar year
under the Bank’s Incentive Bonus Plan). Expenses related to both fixed and variable fees are
recorded as noninterest expense in the year incurred regardless of payment method. Compensation
costs related to both fixed and variable stock directors’ fees included in noninterest expense in
2009, 2008 and 2007 amounted to $45,000, $75,000 and $134,000, respectively. No payments were made
under the variable plan in 2009, 2008, and 2007 due to the loss the Corporation incurred in 2009,
2008, and 2007. No payments are anticipated at this time under the variable component in 2010.
Fixed directors’ fees may be paid in cash, to a current stock purchase account, to a deferred cash
investment account, or to a deferred stock account according to each eligible director’s payment
election. Current stock is issued quarterly based on the average fair market value of the stock for
the preceding quarter. When deferred stock is elected, payments are credited to a deferred stock
account for each participating director, and stock units are computed quarterly based on the
average fair market value of the stock for the preceding quarter. When dividends are declared, they
are computed based on the stock units available in each director’s deferred account, are reinvested
in stock units and charged to expense. The units are converted to shares and issued to
participating directors upon retirement. As of December 31, 2009, there were approximately 33,500
shares earned and available for distribution in the fixed-fee deferred stock accounts.
Variable directors’ fees may be paid to a current stock purchase account or to a deferred stock
account. Current stock is issued based on the average fair market value of the stock for the
preceding quarter. Deferred stock units are computed for directors electing to use a deferred stock
account, and dividends are reinvested throughout the year as declared. As of December 31, 2009,
there were approximately 7,900 shares earned and available for distribution in the variable-fee
deferred stock accounts.
(16) Employees’ Stock Purchase Plan
The Employees’ Stock Purchase Plan allows eligible employees to purchase shares of common stock, no
par value, of FNBH Bancorp, Inc. at a price less than market price under Section 423 of the
Internal Revenue Code of 1986 as amended. Eligible employees must have been continuously employed
for one year, must work at least 20 hours per week, and must work at least five months in a
calendar year. The purchase price for each share of stock is 95% of the fair market value of a
share of stock determined by the previous three month average stock price.
(17) Financial Instruments with Off-Balance-Sheet Risk
The Bank is a party to financial instruments with off-balance-sheet risk in the normal course of
business to meet the financing needs of its customers. These financial instruments are loan
commitments to extend credit and letters of credit. These instruments involve, to varying degrees,
elements of credit risk in excess of the amounts recognized in the consolidated balance sheets.
The Bank’s exposure to credit loss in the event of the nonperformance by the other party to the
financial instruments for loan commitments to extend credit and letters of credit is represented by
the contractual amounts of these instruments. The Bank uses the same credit policies in making
credit commitments as it does for on-balance-sheet loans.
Financial instruments whose contract amounts represent credit risk at December 31, 2009 and 2008
are as follows:
| 2009 | 2008 | |||||||
Consumer |
$ | 8,749,623 | $ | 10,558,208 | ||||
Commercial construction |
321,507 | 557,917 | ||||||
Commercial |
12,080,918 | 16,677,245 | ||||||
Total credit commitments |
$ | 21,152,048 | $ | 27,793,370 | ||||
Loan commitments to extend credit are agreements to lend to a customer as long as there is no
violation of any condition established in the contract. Commitments generally have fixed expiration
dates or other termination clauses and may require payment of a fee. Since many of the commitments
are expected to expire without being drawn upon, the total commitment amounts do not necessarily
represent future cash requirements. The Bank evaluates each customer’s creditworthiness on a
case-by-case basis. The amount of collateral obtained, if deemed necessary by the Bank upon
extension of credit, is based on management’s credit evaluation of the counterparty. Collateral
held varies but may include accounts receivable; inventory; property, plant, and equipment;
residential real
55
Table of Contents
estate; and income-producing commercial properties. Market risk may arise if
interest rates move adversely subsequent to the extension of commitments.
As of December 31, 2009 and 2008, the Bank had outstanding irrevocable standby letters of credit,
which carry a maximum potential commitment of approximately $200,000 and $332,000, respectively.
These letters of credit are conditional commitments issued by the Bank to guarantee the performance
of a customer to a third party. The majority of these letters of credit are short term guarantees
of one year or less, although some have maturities which extend as long as two years. The credit
risk involved in issuing letters of credit is essentially the same as that involved in extending
loans to customers. The Bank primarily holds real estate as collateral supporting those commitments
for which collateral is deemed necessary. The extent of collateral held on those commitments at
December 31, 2009 and 2008, where there is collateral, is in excess of the committed amount. A
letter of credit is not recorded on the balance sheet until a customer fails to perform.
(18) Capital
The Corporation and the Bank are subject to various regulatory capital requirements administered by
the federal banking agencies. Failure to meet minimum capital requirements can initiate certain
mandatory and possibly additional discretionary actions by regulators that, if undertaken, could
have a direct, material effect on the Corporation’s financial statements. Under capital adequacy
guidelines and the regulatory framework for prompt corrective action, the Corporation and the Bank
must meet specific capital guidelines that involve quantitative measures of assets, liabilities,
and certain off-balance-sheet items as calculated under regulatory accounting practices. The
Corporation’s and the Bank’s capital classification are also subject to qualitative judgments by
regulators with regard to components, risk weightings, and other factors.
The Federal Deposit Insurance Corporation Improvement Act of 1991 (FDICIA) required that the
federal regulatory agencies adopt regulations defining five capital tiers for banks:
| Total | Tier 1 | |||||
| Risk-Based | Risk-Based | |||||
| Capital Ratio | Capital Ratio | Leverage Ratio | ||||
Well capitalized
|
10% or above | 6% or above | 5% or above | |||
Adequately capitalized
|
8% or above | 4% or above | 4% or above | |||
Undercapitalized
|
Less than 8% | Less than 4% | Less than 4% | |||
Significantly undercapitalized
|
Less than 6% | Less than 3% | Less than 3% | |||
Critically undercapitalized
|
— | — | A ratio of tangible equity to total assets of 2% or less |
Quantitative measures established by regulation to ensure capital adequacy require the Corporation
and the Bank to maintain minimum amounts and ratios of total and Tier 1 capital (as defined in the
regulations) to risk-weighted assets (as defined), and Tier 1 capital (as defined) to average
assets (as defined).
56
Table of Contents
The Corporation’s and the Bank’s actual capital amounts and ratios are presented in the
following table as of December 31, 2009 and 2008:
| Minimum for | To be Well Capitalized | |||||||||||||||||||||||
| Capital Adequacy | Under Prompt Corrective | |||||||||||||||||||||||
| Actual | Purposes | Action Provision | ||||||||||||||||||||||
| As of December 31, 2009 | Amount | Ratio | Amount | Ratio | Amount | Ratio | ||||||||||||||||||
Total Capital (to risk weighted assets) |
||||||||||||||||||||||||
Bank |
$ | 17,934,000 | 6.46 | % | $ | 22,195,000 | 8 | % | $ | 27,743,000 | 10 | % | ||||||||||||
FNBH Bancorp |
17,924,000 | 6.46 | % | 22,195,000 | 8 | % | N/A | N/A | ||||||||||||||||
Tier 1 Capital (to risk weighted assets) |
||||||||||||||||||||||||
Bank |
14,275,000 | 5.15 | % | 11,097,000 | 4 | % | 16,646,000 | 6 | % | |||||||||||||||
FNBH Bancorp |
14,265,000 | 5.14 | % | 11,097,000 | 4 | % | N/A | N/A | ||||||||||||||||
Tier 1 Capital (to average assets) |
||||||||||||||||||||||||
Bank |
14,275,000 | 4.25 | % | 13,435,000 | 4 | % | 16,794,000 | 5 | % | |||||||||||||||
FNBH Bancorp |
14,265,000 | 4.25 | % | 13,435,000 | 4 | % | N/A | N/A | ||||||||||||||||
| As of December 31, 2008 | Amount | Ratio | Amount | Ratio | Amount | Ratio | ||||||||||||||||||
Total Capital (to risk weighted assets) |
||||||||||||||||||||||||
Bank |
$ | 31,419,000 | 9.56 | % | $ | 26,293,000 | 8 | % | $ | 32,866,000 | 10 | % | ||||||||||||
FNBH Bancorp |
31,365,000 | 9.54 | % | 26,293,000 | 8 | % | N/A | N/A | ||||||||||||||||
Tier 1 Capital (to risk weighted assets) |
||||||||||||||||||||||||
Bank |
27,183,000 | 8.27 | % | 13,146,000 | 4 | % | 19,720,000 | 6 | % | |||||||||||||||
FNBH Bancorp |
27,129,000 | 8.25 | % | 13,146,000 | 4 | % | N/A | N/A | ||||||||||||||||
Tier 1 Capital (to average assets) |
||||||||||||||||||||||||
Bank |
27,183,000 | 6.89 | % | 15,774,000 | 4 | % | 19,717,000 | 5 | % | |||||||||||||||
FNBH Bancorp |
27,129,000 | 6.88 | % | 15,774,000 | 4 | % | N/A | N/A | ||||||||||||||||
The OCC has established the following minimum capital standards for national banks: a leverage
requirement consisting of a minimum ratio of Tier 1 capital to total average assets of 3% for the
most highly-rated banks, with minimum requirements of 4% to 5% for all others, and a risk-based
capital requirement consisting of a minimum ratio of total capital to total risk-weighted assets of
8%, at least one-half of which must be Tier 1 capital. Tier 1 capital consists principally of
shareholders’ equity. These capital requirements are minimum requirements. Higher capital levels
will be required if warranted by the particular circumstances or risk profiles of individual
institutions. Federal law provides the federal banking regulators with broad power to take prompt
corrective action to resolve the problems of undercapitalized institutions.
On September 24, 2009, the Bank consented to the issuance of a Consent Order (the “Order”) with the
OCC. Pursuant to the Order, the Bank must achieve and maintain total capital equal to 11% of risk
weighted assets and Tier 1 capital equal to at least 8.5% of adjusted total assets by January 22,
2010. To date, the Corporation has not received any commitments for the investment of additional
capital.
At December 31, 2009, based on the above minimum capital requirements, the Corporation and its
subsidiary Bank are classified as “undercapitalized”. Under the terms of the Consent Order with
the OCC, referenced above, the Bank submitted to the OCC a capital restoration plan and capital
plan (collectively, the “Plan”). The OCC has determined that the Plan is not acceptable,
principally due to the fact that the OCC is unable to determine that the Plan is realistic and
likely to succeed in restoring the Bank’s capital, based upon the information provided in the Plan.
As noted below, the Bank intends to update the Plan and continue to pursue its capital raising
efforts as well as resubmit the Plan to the OCC.
As a result of its failure to submit an acceptable plan to the OCC within the permitted time, for
purposes of Prompt Corrective Action (“PCA”) the Bank is now treated as if it were “significantly
undercapitalized”. This determination is based solely for purposes of applying PCA, and the Bank’s
resulting capital category may not constitute an accurate representation of the Bank’s overall
financial condition or prospects. As a result of this classification, for purposes of PCA, the
Bank is subject to a number of additional restrictions. These include, among other things, (1) the
requirement that the Bank obtain prior written approval of the OCC before paying any bonus or
increase in the compensation of any senior executive officer of the Bank, (2) prohibitions on the
acceptance of employee benefit plan deposits, and (3) restrictions on interest rates paid on
deposits.
As of December 31, 2009, the Bank’s capital ratios are significantly below the increased minimum
requirements imposed by the OCC. In light of the Bank’s continued losses and capital position at
December 31, 2009, it is reasonable to anticipate further regulatory enforcement action by the OCC.
57
Table of Contents
Based on the Bank’s current financial condition, asset quality issues, and capital ratios,
management estimates that the Bank needs to raise $15 million of additional capital to comply with
the OCC’s capital directive and provide sufficient capital resources and liquidity to meet
commitments and business needs. Accordingly, management has met with potential accredited
investors and is working with an investment banking firm to assist in raising the additional equity
believed necessary to sufficiently recapitalize the Bank. While the Corporation’s common stock is
traded in the public markets, the size of the institution and other factors are likely to limit our
ability to access the public capital markets. As such, the Corporation’s alternatives for
additional capital are somewhat limited. The ongoing liquidity crisis and the loss of confidence
in financial institutions will likely serve to only further increase our cost of funding and
further limit our access to capital. We may not be able to raise the necessary capital on
favorable terms, or at all. An inability to raise capital on acceptable terms is likely to have a
materially adverse effect on our business, financial condition and results of operations.
On February 19, 2009, in anticipation of the need to raise additional capital, the shareholders of
the Corporation approved an amendment to the Corporation’s Articles of Incorporation to authorize
the Board of Directors to issue up to 30,000 shares of preferred stock. The terms and conditions
of these securities, when and if issued, including dividend or interest rates, conversion rates and
rights, voting rights, redemption prices, maturity dates and similar matters will be determined by
the Board of Directors. There were no issued and outstanding shares of preferred stock through the
date of filing of this Form 10-K.
Additionally, at the annual meeting of shareholders on May 28, 2009, our shareholders approved a
2,800,000 increase in the number of authorized shares of common stock.
Management’s future plans in response to the Bank’s undercapitalized regulatory classification and
the need to raise additional capital pursuant to the Consent Order are described in Note 2.
The Corporation’s ability to pay dividends is subject to various regulatory and state law
requirements. Due to the Bank’s financial condition, the Bank cannot pay a dividend to the
Corporation without the prior approval of the OCC. The Corporation suspended, indefinitely, the
payment of dividends in the third quarter of 2008 due to the Bank’s inability to pay dividends to
the holding company and insufficient cash at the holding company to pay the dividends
(19) Net Income per Common Share
Basic earnings per common share is based on the weighted average number of common shares and
participating securities outstanding during the period. Diluted earnings per share are the same as
basic earnings per share because any additional potential common shares issuable are included in
the basic earnings per share calculation. On January 1, 2009, the Corporation adopted new guidance
impacting ASC Topic 260, Earnings Per Share, related to determining whether instruments granted in
a share-based payment transaction are participating securities. This guidance requires that
unvested stock awards which contain non-forfeitable rights to dividends or dividend equivalents,
whether paid or unpaid (referred to as “participating securities”), be included in the number of
shares outstanding for both basic and diluted earnings per share calculations. Our unvested
restricted stock under the Long-Term Incentive Plan is considered a participating security. In the
event of a net loss, the participating securities are excluded from the calculation of both basic
and diluted earnings per share. Due to our net loss for the years ended December 31, 2009, 2008
and 2007, the unvested restricted shares were not included in determining both basic and diluted
earnings per share for the respective periods.
The following table presents basic and diluted net income per share:
| 2009 | 2008 | 2007 | ||||||||||
Weighted average basic shares outstanding |
3,167,918 | 3,096,332 | 3,074,372 | |||||||||
Effect of dilutive restricted stock |
— | — | — | |||||||||
Weighted average diluted shares outstanding |
3,167,918 | 3,096,332 | 3,074,372 | |||||||||
Net loss |
$ | (13,695,883 | ) | $ | (13,413,240 | ) | $ | (6,556,188 | ) | |||
Basic net loss per share |
$ | (4.32 | ) | $ | (4.33 | ) | $ | (2.13 | ) | |||
Diluted net loss per share |
$ | (4.32 | ) | $ | (4.33 | ) | $ | (2.13 | ) | |||
Participating securities excluded from diluted calculation |
2,033 | 8,327 | 5,107 | |||||||||
(20) Contingent Liabilities
The Corporation is subject to various claims and legal proceedings arising out of the normal course
of business, none of which, in the opinion of management, based on the advice of legal counsel, is
expected to have a material effect on the Corporation’s financial position or results of
operations.
(21) Fair Value Measurements
Effective January 1, 2008, the Corporation adopted ASC 820, Fair Value Measurements and
Disclosures. ASC 820 defines fair value and establishes a consistent framework for measuring fair
value and expands disclosure requirements for fair value measurements.
58
Table of Contents
Fair values represent the estimated price that would be received from selling an asset or
paid to transfer a liability, otherwise known as an “exit price”.
The three levels of inputs that may be used to measure fair value are as follows:
Level 1: Quoted prices (unadjusted) for identical assets or liabilities in active markets that
the entity has the ability to access as of the measurement date.
Level 2: Significant other observable inputs other than Level 1 prices such as quoted prices for
similar assets or liabilities in active markets; quoted prices for identical or similar assets
or liabilities in markets that are not active; or other inputs that are observable or can be
derived from or corroborated by observable market data by correlation or other means.
Level 3: Significant unobservable inputs that reflect a reporting entity’s own assumptions about
the assumptions that market participants would use in pricing an asset or liability.
The following is a description of the Corporation’s valuation methodologies used to measure and
disclose the fair values of its financial assets and liabilities on a recurring basis:
Securities available for sale. Securities available for sale are recorded at fair value on a
recurring basis. Fair value measurement is based on quoted prices, if available. If quoted
prices are not available, fair values are measured using independent pricing models. Level 2
securities include U.S. government and agency securities, other U.S. government and agency
mortgage-backed securities, municipal bonds and preferred stock securities. Level 3 securities
include private collateralized mortgage obligations.
Fair value of assets measured on a recurring basis:
| Fair Value Measurement at December 31, 2009 | ||||||||||||||||
| Quoted Prices in | Significant Other | Significant | ||||||||||||||
| Active Markets for | Observable | Unobservable | ||||||||||||||
| Identical Assets | Inputs | Inputs | ||||||||||||||
| Total | (Level 1) | (Level 2) | (Level 3) | |||||||||||||
Securities available for sale |
$ | 22,705,612 | $ | — | $ | 19,970,903 | $ | 2,734,709 | ||||||||
| Fair Value Measurement at December 31, 2008 | ||||||||||||||||
| Quoted Prices in | Significant Other | Significant | ||||||||||||||
| Active Markets for | Observable | Unobservable | ||||||||||||||
| Identical Assets | Inputs | Inputs | ||||||||||||||
| Total | (Level 1) | (Level 2) | (Level 3) | |||||||||||||
Securities available for sale |
$ | 41,520,572 | $ | — | $ | 38,747,894 | $ | 2,772,678 | ||||||||
The reconciliation of the beginning and ending balances of the asset classified by the Corporation
within Level 3 of the valuation hierarchy is as follows:
| 2009 | 2008 | |||||||
| Fair Value Measurement | Fair Value Measurement | |||||||
| Using Significant | Using Significant | |||||||
| Unobservable Inputs | Unobservable Inputs | |||||||
| (Level 3) | (Level 3) | |||||||
Fair value of CMO, beginning of year(1)(2) |
$ | 2,772,678 | $ | — | ||||
Total gains (losses) realized/unrealized: |
||||||||
Included in earnings(3) |
— | (1,338,938 | ) | |||||
Included in other comprehensive income (3) |
483,162 | 29,796 | ||||||
Purchases, issuances, and other settlements |
(521,131 | ) | (265,174 | ) | ||||
Transfers into Level 3(4) |
— | 4,346,994 | ||||||
Fair value of CMO, end of year |
$ | 2,734,709 | $ | 2,772,678 | ||||
Total amount of losses for the year included
in earnings attributable to the change in
unrealized losses relating to assets still held
at end of year |
$ | — | $ | (1,338,938 | ) | |||
59
Table of Contents
| (1) | Non-agency CMO classified as available for sale is valued using internal valuation models and pricing information from third parties. | |
| (2) | Management had anticipated that the non-agency security would be classified under Level 2 of the valuation hierarchy. However, due to illiquidity in the markets, the fair value of this security is now determined using an internal model based on pricing information from third parties and therefore is classified within Level 3 of the valuation hierarchy. | |
| (3) | Realized gains (losses), including unrealized losses deemed other-than-temporary, are reported in noninterest income. Unrealized gains (losses) are reported in accumulated other comprehensive income (loss). | |
| (4) | Transfers in or out are based on the carrying amount of the security at the beginning of the period. |
Effective January 1, 2009, the Corporation adopted newly applicable guidance within ASC 820 titled
Transition and Open Effective Date Information, which requires the Corporation to apply provisions
of ASC 820, Fair Value Measurements and Disclosures, to non-financial assets and liabilities
measured on a non-recurring basis.
The following is a description of the Corporation’s valuation methodologies used to measure
and disclose the fair values of its financial assets and liabilities on a non-recurring basis:
Loans. The Corporation does not record loans at fair value on a recurring basis. However, from
time to time, the Corporation records nonrecurring fair value adjustments to collateral
dependent loans to reflect partial write-downs or specific reserves that are based on the
observable market price or current appraised value of the collateral. These loans are reported
in the nonrecurring table below at initial recognition of impairment and on an ongoing basis
until recovery or charge off. When the fair value of the collateral is based on an observable
market price or a current appraised value, the Corporation records the impaired loan as
nonrecurring Level 2. When a current appraised value is not available or management determines
the fair value of the collateral is further impaired below the appraised value and there is no
observable market price, the Corporation records the impaired loan as nonrecurring Level 3. We
have historically reported our impaired loans under Level 2; however, in reviewing our current
processes, we now believe that Level 3 categorization is appropriate.
Other real estate owned. Real estate acquired through foreclosure or deed-in-lieu is adjusted
to fair value less costs to sell upon transfer of the loan to other real estate owned, usually
based on an appraisal of the property. Subsequently, other real estate owned is carried at the
lower of carrying value or fair value. A valuation based on a current appraisal or by a broker’s
opinion is considered a Level 2 fair value. If management determines the fair value of the
property is further impaired below the appraised value and there is no observable market price,
the Corporation records the property as nonrecurring Level 3.
Fair value of assets on a non-recurring basis:
| Fair Value Measurements at December 31, 2009 | ||||||||||||||||
| Quoted Prices in | Significant Other | Significant | ||||||||||||||
| Active Markets for | Observable | Unobservable | ||||||||||||||
| Identical Assets | Inputs | Inputs | ||||||||||||||
| Total | (Level 1) | (Level 2) | (Level 3) | |||||||||||||
Impaired loans (1) |
$ | 41,448,626 | $ | — | $ | — | $ | 41,448,626 | ||||||||
Other real estate owned |
$ | 3,777,119 | $ | — | $ | — | $ | 3,777,119 | ||||||||
| Fair Value Measurements at December 31, 2008 | ||||||||||||||||
| Quoted Prices in | Significant Other | Significant | ||||||||||||||
| Active Markets for | Observable | Unobservable | ||||||||||||||
| Identical Assets | Inputs | Inputs | ||||||||||||||
| Total | (Level 1) | (Level 2) | (Level 3) | |||||||||||||
Impaired loans (1) |
$ | 23,578,000 | $ | — | $ | 23,405,000 | $ | 173,000 | ||||||||
| (1) | Represents carrying value and related write-downs and specific reserves pertaining to collateral dependent loans for which adjustments are based on the appraised value of the collateral or by other unobservable inputs. |
(22) Fair Value of Financial Instruments
Fair value disclosures require fair-value information about financial instruments for which it is
practicable to estimate that value. In cases where quoted market prices are not available, fair
values are based on estimates using present value or other valuation techniques. Those techniques
are significantly affected by the assumptions used, including the discount rate and estimates of
future cash flows. In that regard, the derived fair-value estimates cannot be substantiated by
comparison to independent markets and, in many cases, cannot be realized in immediate settlement of
the instrument.
60
Table of Contents
Fair-value methods and assumptions for the Corporation’s financial instruments are as follows:
Cash and cash equivalents – The carrying amounts reported in the consolidated balance sheet
for cash and short term investments reasonably approximate those assets’ fair values.
Certificates of deposit – The carrying amounts reported in the consolidated balance sheet for
certificates of deposit reasonably approximate those assets’ fair values.
Investment securities – Fair values for investment securities are determined as discussed
above.
FHLBI and FRB stock – The carrying amounts reported in the consolidated balance sheet for
FHLBI and FRB stock reasonably approximate those assets’ fair values.
Loans – For variable-rate loans that reprice frequently, fair values are generally based on
carrying values, adjusted for credit risk. The fair value of fixed-rate loans is estimated by
discounting future cash flows using the current rates at which similar loans would be made to
borrowers with similar credit ratings and for the same remaining maturities.
Accrued interest income – The carrying amount of accrued interest income is a reasonable
estimate of fair value.
Deposit liabilities – The fair value of deposits with no stated maturity, such as demand
deposit, NOW, savings, and money market accounts, is equal to the amount payable on demand.
The fair value of certificates of deposit is estimated using rates currently offered for
wholesale funds with similar remaining maturities.
Other borrowings – The fair value of other borrowings is estimated based on quoted market
prices.
Accrued interest payable – The carrying amount of accrued interest payable is a reasonable
estimate of fair value.
Off-balance-sheet instruments – The fair value of commitments to extend credit is estimated
using the fees currently charged to enter into similar agreements, taking into account the
remaining terms of the agreements and the present creditworthiness of the counterparties. For
fixed-rate loan commitments, fair value also considers the difference between current levels
of interest rates and the committed rates. The fair value of commitments to extend credit,
including letters of credit, is estimated to approximate their aggregate book balance and is
not considered material and therefore not included in the following table.
| 2009 | 2008 | |||||||||||||||
| Carrying | Fair | Carrying | Fair | |||||||||||||
| Value | Value | Value | Value | |||||||||||||
Financial assets: |
||||||||||||||||
Cash and cash equivalents |
$ | 37,044,000 | $ | 37,044,000 | $ | 22,080,000 | $ | 22,080,000 | ||||||||
Certificates of deposit |
— | — | 4,319,000 | 4,319,000 | ||||||||||||
Investment and mortgage-backed securities |
22,706,000 | 22,706,000 | 41,521,000 | 41,521,000 | ||||||||||||
FHLBI and FRB stock |
995,000 | 995,000 | 995,000 | 995,000 | ||||||||||||
Loans, net |
255,381,000 | 254,923,000 | 301,695,000 | 306,087,000 | ||||||||||||
Accrued interest income |
1,008,000 | 1,008,000 | 1,584,000 | 1,584,000 | ||||||||||||
Financial liabilities: |
||||||||||||||||
Deposits: |
||||||||||||||||
Demand |
$ | 65,644,000 | $ | 65,644,000 | $ | 56,405,000 | $ | 56,405,000 | ||||||||
NOW |
50,643,000 | 50,643,000 | 35,539,000 | 35,539,000 | ||||||||||||
Savings and money market accounts |
72,298,000 | 72,298,000 | 101,423,000 | 101,423,000 | ||||||||||||
Time deposits |
121,200,000 | 121,011,000 | 142,287,000 | 144,177,000 | ||||||||||||
Brokered certificates |
5,411,000 | 5,516,000 | 13,874,000 | 14,087,000 | ||||||||||||
Other borrowings |
414,000 | 414,000 | 8,897,000 | 8,958,000 | ||||||||||||
Accrued interest expense |
359,000 | 359,000 | 704,000 | 704,000 | ||||||||||||
Limitations
Fair-value estimates are made at a specific point in time based on relevant market information and
information about the financial instrument. These estimates do not reflect any premium or discounts
that could result from offering for sale at one time the Corporation’s entire holdings of a
particular financial instrument. Because no market exists for a significant portion of the
Corporation’s financial instruments, fair-value estimates are based on judgments regarding future
loss experience, current economic conditions, risk characteristics of various financial
instruments, and other factors. These estimates are subjective in nature and involve uncertainties
and matters of significant judgment, and, therefore, cannot be determined with precision. Changes
in assumptions could significantly affect the estimates.
61
Table of Contents
(23) Dividend Restrictions
On a parent company-only basis, the Corporation’s only source of funds is dividends paid by the
Bank. The ability of the Bank to pay dividends is subject to limitations under various laws and
regulations and to prudent and sound banking principles. The Bank may declare a dividend without
the approval of the Office of the Comptroller of the Currency (OCC) unless the total dividends in a
calendar year exceeds the total of its net profits for the year combined with its retained profits
of the two preceding years. Under these provisions, there is no ability to pay dividends at
December 31, 2009, without the prior approval of the OCC.
(24) Condensed
Financial Information — Parent Company Only
The condensed balance sheets at December 31, 2009 and 2008, and the condensed statements of
operations and cash flows for the years ended December 31, 2009, 2008 and 2007, of FNBH Bancorp,
Inc. follow:
Condensed Balance Sheets
| 2009 | 2008 | |||||||
Assets: |
||||||||
Cash |
$ | 1,000 | $ | 31,197 | ||||
Investment in subsidiaries: |
||||||||
First National Bank in Howell |
14,385,904 | 27,579,092 | ||||||
H.B. Realty Co. |
1,000 | 1,000 | ||||||
Other assets |
— | 19,190 | ||||||
Total assets |
$ | 14,387,904 | $ | 27,630,479 | ||||
Liabilities and Shareholders’ Equity: |
||||||||
Other borrowings |
$ | — | $ | 100,000 | ||||
Other liabilities |
11,640 | 5,377 | ||||||
Shareholders’ equity |
14,376,264 | 27,525,102 | ||||||
Total liabilities and shareholders’ equity |
$ | 14,387,904 | $ | 27,630,479 | ||||
Condensed Statements of Operations
| Year ended December 31 | ||||||||||||
| 2009 | 2008 | 2007 | ||||||||||
Operating income: |
||||||||||||
Dividends from subsidiaries |
$ | — | $ | — | $ | 3,144,850 | ||||||
Total operating income |
— | — | 3,144,850 | |||||||||
Operating expenses: |
||||||||||||
Interest expense-other borrowings |
1,252 | 13,771 | — | |||||||||
Administrative and other expenses |
92,954 | 119,874 | 85,759 | |||||||||
Total operating expenses |
94,206 | 133,645 | 85,759 | |||||||||
Income (loss) before equity in
undistributed net income (loss)
of subsidiaries |
(94,206 | ) | (133,645 | ) | 3,059,091 | |||||||
Equity in undistributed net income of
subsidiaries (net loss of subsidiaries and
dividends declared from subsidiaries) |
(13,601,677 | ) | (13,279,595 | ) | (9,615,279 | ) | ||||||
Net loss |
$ | (13,695,883 | ) | $ | (13,413,240 | ) | $ | (6,556,188 | ) | |||
62
Table of Contents
Condensed Statements of Cash Flows
| Year ended December 31 | ||||||||||||
| 2009 | 2008 | 2007 | ||||||||||
Cash flows from operating activities: |
||||||||||||
Net loss |
$ | (13,695,883 | ) | $ | (13,413,240 | ) | $ | (6,556,188 | ) | |||
Adjustments
to reconcile net loss to net cash provided by (used by) operating activities: |
||||||||||||
Decrease in other assets |
19,190 | 10,809 | 225,473 | |||||||||
Increase in other liabilities |
6,263 | 4,595 | 781 | |||||||||
Change in
long term incentive plan and deferred compensation |
97,118 | 214,680 | 322,822 | |||||||||
Equity in
undistributed net income of subsidiaries (net loss of subsidiaries
and dividends declared from subsidiaries) |
13,601,677 | 13,279,595 | 9,615,279 | |||||||||
Net cash provided by operating activities |
28,365 | 96,439 | 3,608,167 | |||||||||
Cash flows from investing activities |
— | — | — | |||||||||
Cash flows from financing activities: |
||||||||||||
Common stock issued |
41,438 | 269,367 | 25,211 | |||||||||
Proceeds from issuance of short-term debt |
— | 445,000 | — | |||||||||
Repayment of short-term debt |
(100,000 | ) | (345,000 | ) | — | |||||||
Repurchases of common stock |
— | — | (1,038,605 | ) | ||||||||
Dividends paid |
— | (488,180 | ) | (2,563,418 | ) | |||||||
Net cash used in financing activities |
(58,562 | ) | (118,813 | ) | (3,576,812 | ) | ||||||
Net increase (decrease) in cash |
(30,197 | ) | (22,374 | ) | 31,355 | |||||||
Cash at beginning of year |
31,197 | 53,571 | 22,216 | |||||||||
Cash at end of year |
$ | 1,000 | $ | 31,197 | $ | 53,571 | ||||||
(25) Quarterly Financial Data — Unaudited
The following table presents summarized quarterly data for each of the two years ended December 31:
| Quarters ended in 2009 | ||||||||||||||||
| March 31 | June 30 | September 30 | December 31 | |||||||||||||
Selected operations data: |
||||||||||||||||
Interest and dividend income |
$ | 4,930,887 | $ | 4,637,143 | $ | 4,349,342 | $ | 3,952,171 | ||||||||
Net interest income |
3,560,957 | 3,366,840 | 3,245,764 | 3,063,627 | ||||||||||||
Provision for loan losses |
1,200,000 | 11,696,853 | 1,750,000 | 1,200,000 | ||||||||||||
Loss before federal income taxes |
(630,865 | ) | (11,608,527 | ) | (1,431,205 | ) | (1,109,854 | ) | ||||||||
Net income (loss) |
(630,865 | ) | (12,076,013 | ) | (1,431,205 | ) | 442,200 | |||||||||
Basic and diluted net income (loss) per share |
$ | (0.20 | ) | $ | (3.82 | ) | $ | (0.45 | ) | $ | 0.14 | |||||
Cash dividends per share |
$ | — | $ | — | $ | — | $ | — | ||||||||
| Quarters ended in 2008 | ||||||||||||||||
| March 31 | June 30 | September 30 | December 31 | |||||||||||||
Selected operations data: |
||||||||||||||||
Interest and dividend income |
$ | 6,695,747 | $ | 6,244,565 | $ | 6,034,546 | $ | 5,332,378 | ||||||||
Net interest income |
4,084,011 | 4,230,175 | 4,145,348 | 3,729,337 | ||||||||||||
Provision for loan losses |
688,900 | 8,211,000 | 1,145,000 | 4,810,000 | ||||||||||||
Income (loss) before federal income taxes |
773,493 | (7,116,624 | ) | (1,649,277 | ) | (5,548,108 | ) | |||||||||
Net income (loss) |
579,871 | (4,623,474 | ) | (1,624,795 | ) | (7,744,842 | ) | |||||||||
Basic and diluted net income (loss) per share |
$ | 0.19 | $ | (1.50 | ) | $ | (0.53 | ) | $ | (2.47 | ) | |||||
Cash dividends per share |
$ | 0.08 | $ | 0.08 | $ | — | $ | — | ||||||||
63
Table of Contents
| (26) | Impact of New Accounting Standards |
In January 2010, the FASB issued ASU 2010-06, Improving Disclosures about Fair Value Measurements.
This standard requires new disclosures on the amount and reason for transfers in and out of Level 1
and 2 recurring fair value measurements. The standard also requires disclosure of activities (i.e.,
on a gross basis), including purchases, sales, issuances, and settlements, in the reconciliation of
Level 3 fair value recurring measurements. The standard clarifies existing disclosure requirements
on levels of disaggregation and disclosures about inputs and valuation techniques. The new
disclosures regarding Level 1 and 2 fair value measurements and clarification of existing
disclosures are effective for periods beginning after December 15, 2009. The disclosures about the
reconciliation of information in Level 3 recurring fair value measurements are required for periods
beginning after December 15, 2010. We are currently evaluating the impact of this standard on our
financial statements.
In December 2009, the FASB issued ASU 2009-16, Accounting for Transfers of Financial Assets
(formerly Statement No. 166, Accounting for Transfers of Financial Assets, an amendment of FASB
Statement No. 140). This standard amends the guidance on accounting for transfers of financial
assets, including securitization transactions, where entities have continued exposure to risks
related to transferred financial assets. This standard also expands the disclosure requirements for
such transactions. It is effective as of the beginning of the first annual reporting period that
begins after November 15, 2009. We are currently evaluating the impact of this standard on our
financial statements.
In June 2009, the Financial Accounting Standards Board (FASB) issued Accounting Standards Update
(“ASU”) No. 2009-01, Topic 105 – Generally Accepted Accounting Principles, “The FASB Accounting
Standards Codification and the Hierarchy of Generally Accepted Accounting Principles,” (SFAS 168).
ASU No. 2009-01 establishes the Financial Accounting Standards Board (FASB) Accounting Standards
Codification (ASC) as the single source of authoritative, nongovernmental GAAP in the preparation
of financial statements. Rules and interpretative releases of the Securities and Exchange
Commission under federal securities laws are also sources of authoritative guidance for SEC
registrants. The Codification is not intended to change GAAP. Effective with the adoption of ASU
No. 2009-01, all existing non-SEC accounting and reporting standards, except for grandfathered
guidance and certain recently-issued standards not yet integrated into the Codification were
superseded and are considered nonauthoritative.
In May 2009, the FASB issued a new standard now codified in ASC Topic 855, Subsequent Events, which
establishes general standards of accounting for disclosure of events that occur after the balance
sheet date but before the financial statements are issued or available to be issued. It requires
the disclosure of the date through which an entity has evaluated subsequent events and the basis
for that date. It is effective for interim periods ending after June 15, 2009. The adoption of
the standard did not have any impact on our results of operations or financial position.
Management has evaluated subsequent events for disclosure or recognition up to the time of filing
of theses financial statements with the Securities and Exchange Commission on March 30, 2010.
In April 2009, the FASB issued new guidance impacting ASC Topic 320, Investments – Debt and Equity
Instruments, related to the recognition and presentation of other-than-temporary impairments. This
new guidance requires an entity to assess whether it intends to sell, or it is more likely than not
that it will be required to sell a security in an unrealized loss position before the recovery of
its amortized cost basis. If either of these criteria is met, the entire difference between the
amortized cost and fair value is recognized in earnings. For securities that do not meet the
aforementioned criteria, the amount of impairment recognized in earnings is limited to the amount
related to credit losses, while impairment related to other factors is recognized in other
comprehensive income. Additionally, this new guidance expands and increases the frequency of
existing disclosures about OTTI for debt and equity securities. The Corporation adopted this
guidance on April 1, 2009 and recognized a cumulative effect adjustment that increased retained
earnings and decreased accumulated other comprehensive income by $692,967, net of tax. See Note 3,
Investment Securities, for further information regarding the adoption of this new guidance.
In April 2009, the FASB issued new guidance impacting ASC Topic 820, Fair Value Measurements and
Disclosures, related to determining fair value when the volume and level of activity for the asset
or liability have significantly decreased and identifying transactions that are not orderly. This
guidance establishes a fair value hierarchy which requires an entity to maximize the use of
observable inputs and minimize the use of unobservable inputs when measuring fair vale. This
guidance requires increased disclosures and is effective for interim and annual reporting periods
ending after June 15, 2009, and is to be applied prospectively. The Corporation adopted this
guidance effective April 1, 2009 which had no impact on our results of operations or financial
position.
In April 2009, the FASB also issued new guidance impacting ASC Topic 825, Financial Instruments,
related to interim disclosures about fair value of financial instruments. This guidance requires
disclosure about fair value of financial instruments for interim reporting periods of publicly
traded companies that were previously only required in annual financial statements. It also
requires disclosure of the method(s) and significant assumptions used to estimate the fair value of
financial instruments and changes in method(s) and significant assumptions, if any, during the
period. The Corporation adopted this guidance effective April 1, 2009 which had no impact on our
results of operations or financial position.
In June 2008, the FASB issued new guidance impacting ASC Topic 260, Earnings Per Share, related to
determining whether instruments granted in share-based payment transactions are participating
securities. This new guidance addresses whether these types of instruments are participating prior
to vesting and, therefore need to be included in the earnings allocation in computing earnings per
share under the two class method described in ASC Topic 260. All prior-period earnings per share
data presented shall
64
Table of Contents
be adjusted
retrospectively. The Corporation adopted this new guidance on January 1, 2009 which had no impact
on our 2009, 2008 or 2007 earnings per share.
Item 9. Changes in and Disagreements with Accountants on Accounting and Financial Disclosure.
None.
Item 9A. Controls and Procedures.
1. Evaluation of Disclosure Controls and Procedures. With the participation of management,
the Corporation’s Chief Executive Officer and Chief Financial Officer, after evaluating the
effectiveness of the Corporation’s disclosure controls and procedures, as defined in Exchange Act
Rules 13a-15(e) and 15d-15(e), as of December 31, 2009, have concluded that, as of such date, the
Corporation’s disclosure controls and procedures were effective.
2. Management’s Annual Report on Internal Control Over Financial Reporting. The
Corporation’s management is responsible for establishing and maintaining adequate internal control
over financial reporting, as defined in Exchange Act Rules 13a-15(f) and 15d-15(f), for the
Corporation. The Corporation’s internal control system was designed to provide reasonable assurance
to the Corporation regarding the preparation and fair presentation of published financial
statements. The Corporation’s management assessed the effectiveness of the Corporation’s internal
control over financial reporting as of December 31, 2009, based on criteria established in Internal
Control – Integrated Framework issued by the Committee of Sponsoring Organizations of the Treadway
Commission (the COSO criteria). Based on this assessment and those criteria, the Corporation’s
management concluded that, as of December 31, 2009, the Corporation’s internal control over
financial reporting was effective to provide reasonable assurance regarding the reliability of
financial reporting and the preparation of financial statements for external purposes in accordance
with generally accepted accounting principles.
A control system, no matter how well conceived and operated, can provide only reasonable, not
absolute, assurance that the objectives of the control system are met. Because of the inherent
limitations in all control systems, no evaluation of controls can provide absolute assurance that
all control issues and instances of fraud, if any, within the Corporation have been detected.
3. Attestation Report of the Registered Independent Public Accounting Firm. BDO Seidman,
LLP, an independent registered public accounting firm that audited the consolidated financial
statements of the Corporation for the year ended December 31, 2009, has issued an attestation
report on the effectiveness of the Corporation’s internal control over financial reporting. The
report is set forth on page 39.
4. Change in Internal Control Over Financial Reporting. During the fourth quarter ended
December 31, 2009, there were no changes in the Corporation’s Internal Control Over Financial
Reporting that have materially affected, or are reasonably likely to materially affect, the
Corporation’s internal control over financial reporting.
Item 9B. Other Information.
None
PART III
Item 10. Directors, Executive Officers and Corporate Governance.
Directors
The information with respect to Directors and Nominees of the Registrant and compliance with
Section 16(a) of the Exchange Act set forth under the captions “Information About Directors and
Director Nominees” and “Section 16(a) Beneficial Ownership Reporting Compliance” in our definitive
proxy statement, to be filed with the Commission relating to the May 20, 2010 Annual Meeting of
Shareholders, is incorporated herein by reference.
Executive Officers
The information called for by this item is contained in Part I of this Form 10-K Report.
We have adopted a Code of Ethics for our chief executive officer and senior financial officers. A
copy of our Code of Ethics is available upon request by writing to the Corporation’s Chief
Financial Officer at 101 East Grand River, Howell, Michigan 48843 and is available on our website
at www.fnbh.com.
Corporate Governance
The information with respect to Corporate Governance set forth under the caption “Corporate
Governance and Board Matters” in our definitive proxy statement, to be filed with the Commission
relating to the May 20, 2010 Annual Meeting of Shareholders, is incorporated herein by reference.
65
Table of Contents
Item 11. Executive Compensation.
The information set forth under the captions “Executive Compensation”, “Director Compensation” and
“Compensation Committee Report” in our definitive proxy statement, to be filed with the Commission
relating to the May 20, 2010 Annual Meeting of Shareholders, is incorporated herein by reference.
Information under the caption “Compensation Committee Report” is not deemed to be filed with the
Commission.
Item 12. Security Ownership of Certain Beneficial Owners and Management and Related Shareholder
Matters.
The information set forth under the caption “Ownership of Common Stock” in the Corporation’s
definitive proxy statement, to be filed with the Commission relating to the May 20, 2010 Annual
Meeting of Shareholders, is incorporated herein by reference.
The following information is provided under Item 201(d):
| Weighted — average | Number of securities | |||||||||
| Number of securities to be | exercise price of | remaining available for future issuance | ||||||||
| issued upon exercise of | outstanding | under equity compensation plans | ||||||||
| outstanding options, warrants, | options, warrants, | (excluding securities reflected in | ||||||||
| Plan Category | and rights | and rights | column (a)) | |||||||
| (a | ) | (b | ) | (c) | ||||||
Equity compensation plans approved by shareholders |
0 | 0 | 194,173 (1) | |||||||
Equity compensation plans not approved by shareholders |
None | None | None | |||||||
| (1) | Includes 148,867 shares available under the Long Term Incentive Plan, 16,053 shares available under the Compensation Plan for Nonemployee Directors and 29,253 shares included under the Employee Stock Purchase Plan. |
Item 13. Certain Relationships, Related Transactions and Director Independence.
The information set forth under the captions “Related Party Transactions” and “Corporate Governance
and Board Matters” in our definitive proxy statement, to be filed with the Commission relating to
the May 20, 2010 Annual Meeting of Shareholders, is incorporated herein by reference.
Item 14. Principal Accountant Fees and Services.
The information set forth under the caption “Disclosure of Fees Paid to Our Independent Auditors”
in our definitive proxy statement, to be filed with the Commission relating to the May 20, 2010
Annual Meeting of Shareholders, is incorporated herein by reference.
PART IV
Item 15. Exhibits and Financial Statement Schedules.
(a) Documents filed as part of this report on Form 10-K.
1. Financial Statements
The financial statements are set forth under Item 8 of this report on 10-K.
2. Financial Statement Schedules
Not applicable.
3. Exhibits (Numbered in accordance with Item 601 of Regulation S-K)
The Exhibit Index is located on the final page of this report on Form 10-K.
66
Table of Contents
SIGNATURES
Pursuant to the requirements of Section 13 or 15(d) of the Securities Exchange Act of 1934, the
Registrant has duly caused this report to be signed on its behalf by the undersigned, thereunto
duly authorized, dated March 30, 2010.
FNBH BANCORP, INC.
/s/
Ronald L. Long
|
Ronald L. Long, President and Chief Executive Officer (Principal Executive Officer) |
|
/s/
Mark J. Huber
|
Mark J. Huber, Chief Financial Officer (Principal Financial and Accounting Officer) |
Pursuant to the requirements of the Securities Exchange Act of 1934, this report has been signed by
the following persons on behalf of the Registrant and in the capacities and on the dates indicated.
Each director of the Registrant, who’s signature appears below, hereby appoints Ronald L. Long and
Mark J. Huber, and each of them severally, as his or her attorney-in-fact, to sign in his or her
name and on his or her behalf, as a director of the Registrant, and to file with the Commission any
and all Amendments to this Report on Form 10-K.
| Signature | Date | |||
Randolph E. Rudisill, Chairman of the Board
|
/s/ Randolph E. Rudisill | March 30, 2010 | ||
Barbara Draper, Vice Chairman of the Board
|
/s/ Barbara Draper | March 30, 2010 | ||
Stanley B. Dickson, Jr., Director
|
/s/ Stanley B. Dickson, Jr. | March 30, 2010 | ||
Ronald L. Long, Director
|
/s/ Ronald L. Long | March 30, 2010 | ||
Philip C. Utter, Director
|
/s/ Philip C. Utter | March 30, 2010 | ||
R. Michael Yost, Director
|
/s/ R. Michael Yost | March 30, 2010 | ||
67
Table of Contents
EXHIBIT INDEX
The following exhibits are filed herewith, indexed according to the applicable assigned
number:
| Exhibit | ||
| Number | ||
(3.4)
|
Amendment to the Corporation’s Articles of Incorporation to Increase Authorized Shares, effective June 3, 2009. | |
(10.10)
|
Stipulation and Consent to the Issuance of a Consent Order, dated September 24, 2009. | |
(21)
|
Subsidiaries of the Registrant | |
(23)
|
Consent of BDO Seidman, LLP | |
(24)
|
Power of Attorney (included in signature section) | |
(31.1)
|
Certificate of the Chief Executive Officer of FNBH Bancorp, Inc. pursuant to Section 302 of the Sarbanes-Oxley Act of 2002. | |
(31.2)
|
Certificate of the Chief Financial Officer of FNBH Bancorp, Inc. pursuant to Section 302 of the Sarbanes-Oxley Act of 2002. | |
(32.1)
|
Certificate of the Chief Executive Officer of FNBH Bancorp, Inc. pursuant to Section 906 of the Sarbanes-Oxley Act of 2002 (18 U.S.C. 1350). | |
(32.2)
|
Certificate of the Chief Financial Officer of FNBH Bancorp, Inc. pursuant to Section 906 of the Sarbanes Oxley Act of 2002 (18 U.S.C. 1350). |
The following exhibits, indexed according to the applicable assigned number, were previously filed
by the Registrant and are incorporated by reference in this Form 10-K Annual Report.
| Exhibit | ||||
| Number | Original Filing Form and Date | |||
(3.1)
|
Restated Articles of Incorporation of the Registrant | Exhibit 3.1 of Form 10, effective June 30, 1995 (“Form 10”) | ||
(3.2)
|
Amendment to the Corporation’s Articles of Incorporation to Increase Authorized Shares | Appendix I of Proxy Statement dated March 17, 1998 | ||
(3.3)
|
Amendment to the Corporation’s Articles of Incorporation to Authorize the Issuance of Preferred Shares | Exhibit to Form 8-K dated February 19, 2009 | ||
(3.5)
|
Bylaws of the Registrant | Exhibit 3.2 of Form 10 | ||
(4)
|
Form of Registrant’s Stock Certificate | Exhibit 4 of Form 10 | ||
| Material Contracts: | ||||
(10.1)
|
Howell Branch Lease Agreement | Exhibit 10.2 to Form 10 | ||
(10.2)
|
Corporation’s Long Term Incentive Plan* | Appendix II of Proxy Statement dated March 17, 1998 | ||
(10.3)
|
Second Amended and Restated Compensation Plan for Nonemployee Directors* | Exhibit 10.2 to Form 8-K dated October 16, 2008 | ||
(10.4)
|
FNBH Bancorp Inc Employees’ Stock Purchase Plan as amended January 20, 2005* | Exhibit 10 to Form 10-K dated March 7, 2006 | ||
(10.5)
|
Management Continuity Agreement for Nancy Morgan * |
Exhibit 10.1 to Form 8-K dated March 3, 2008 | ||
(10.6)
|
Management Continuity Agreement for Janice B. Trouba (Mrs. Trouba is no longer employed by the Registrant)* | Exhibit 10.2 to Form 8-K dated March 3, 2008 |
68
Table of Contents
| Exhibit | ||||
| Number | Original Filing Form and Date | |||
(10.7)
|
Management Continuity Agreement for Ronald L. Long* | Exhibit 10.1 to Form 8-K dated May 6, 2008 | ||
(10.8)
|
Agreement by and between First National Bank in Howell (Howell, Michigan) and The Comptroller of the Currency, dated October 16, 2008 (superseded by Stipulation and Consent to the Issuance of a Consent Order included at Exhibit 10.10) | Exhibit 10.1 to Form 8-K dated October 16, 2008 | ||
(10.9)
|
Separation Agreement and Release of All Claims between First National Bank in Howell and Janice B. Trouba * | Exhibit 10.1 to Form 10-Q filed August 14, 2009 |
| * | Represents a compensation plan |
69