Attached files
Southwest Iowa Renewable Energy, LLC
Annual Meeting - Financial Overview
March 19, 2010
1
Strictly Confidential

• The following information contains, or may be deemed to contain, “forward
-looking statements” within the meaning of Section 27A of the Securities
Act of 1933, as amended. These forward-looking statements include all
statements regarding the current intent, belief or expectations regarding
matters covered and all statements which are not statements of historical
fact. By their nature, forward-looking statements involve risks and
uncertainties because they relate to events and depend on circumstances
that may or may not occur in the future. The future results of the issuer
may vary from the results expressed in, or implied by, forward-looking
statements, possibly to a material degree. Since these factors can cause
results, performance and achievements to differ materially from those
discussed in this presentation, you are cautioned not to place undue
reliance on the forward-looking statements. Southwest Iowa Renewable
Energy, LLC (“SIRE”) will update these forward-looking statements to
reflect any material changes occurring prior to the completion of the
offering. For a discussion of some of the important factors that could
cause results to differ from those expressed in, or implied by, the forward-
looking statements contained herein, please refer to SIRE’s Annual Report
(SEC File No. 083-00131), in particular, the “Risk Factors” section. The
forward-looking statements in this document are excluded from the safe
harbor protection of Section 27A of the Securities Act of 1933.
2

3
P&L Summary
v Gross Margin of $6.22M or $0.65 per gal
v Op Ex of $4.09M or $0.42 per gal
v EBITDA of $2.13M or $0.22 per gal (before hedging gain of $448k)

Operating Summary - January 31, 2010
4
Ethanol
v Denatured production of 8.7 MMGY
v 90.246% of nameplate production based on 352 days/yr
Turnover
v Sold 99.71% of gallons produced and 104.8% of DDGS tons produced
v Ground 96.73% of corn purchased bringing ending inventory to 1,741k bu
Yields
v 2.80 denatured yield was equal to the 6 month average of 2.80
v Energy consumption of 28,406 mmbtu per gal
Co Product Return
v Co Product revenue / corn cost = 26.5% vs. 6 mo avg. = 23.3%
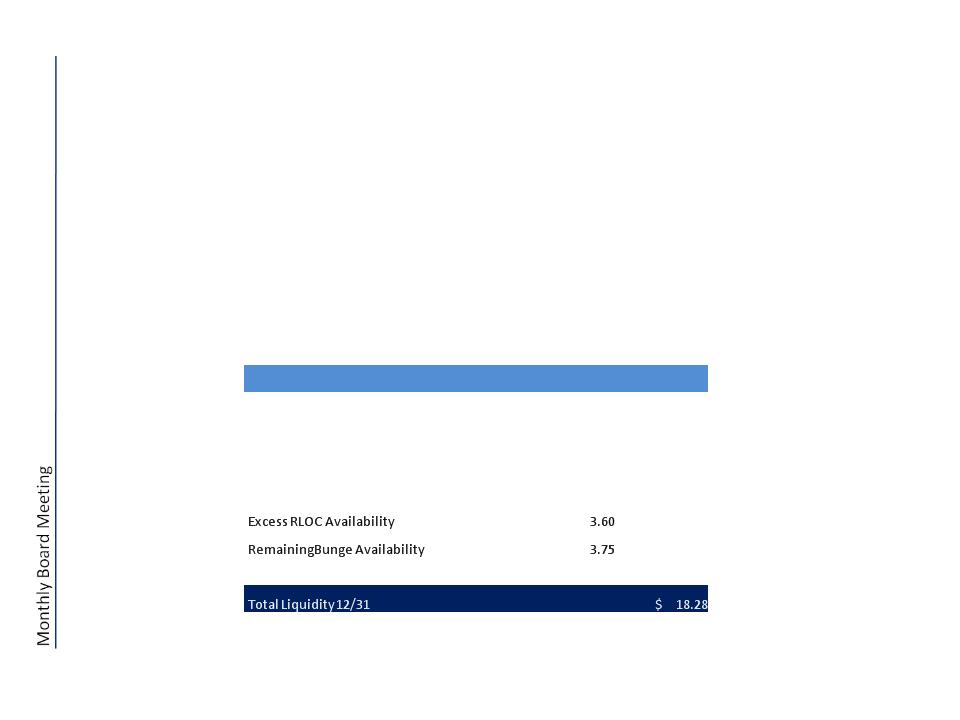
Liquidity Summary
5
v Additional availability on Revolving Line of Credit (RLOC) = $3.60 million
v Total liquidity of $18.28M including $3.75 of remaining availability on Bunge line
|
|
|
|
|
|
|
|
|
|
Borrowing Base on RLOC
|
|
$15.10
|
|
||
|
|
Outstanding RLOC
|
|
9.50
|
|
|
|
|
|
Mid Am LC Reserve
|
|
2.00
|
|
|
|
|
|
Amounts against BB
|
|
|
11.50
|
|
|
|
|
|
|
|
|
|
|
|
|
Excess RLOC Availability 12/31
|
|
$3.60
|
|
||
|
|
|
|
|
|
|
|
|
|
|
|
|
|
|
|
|
|
|
|
|
|
|
|
|
|
Cash
|
|
|
$ 10.93
|
|
|
|
|
|
|
||||
|
|
|
|
||||
|
|
|
|
|
|
|
|
|
|
|
|
||||
|
|
|
|
|
|
|
|

Liquidity Graph - January 31, 2010
6