Attached files
Table of Contents
UNITED STATES SECURITIES AND EXCHANGE COMMISSION
Washington, D.C. 20549
Form 10-K
| þ | ANNUAL REPORT PURSUANT TO SECTION 13 OR 15(d) OF THE SECURITIES EXCHANGE ACT OF 1934 |
| For the fiscal year ended December 31, 2009 |
| ¨ | TRANSITION REPORT PURSUANT TO SECTION 13 OR 15(d) OF THE SECURITIES EXCHANGE ACT OF 1934 |
Commission file number 001-33391
VERAZ NETWORKS, INC.
(Exact Name of Registrant as Specified in Its Charter)
| Delaware | 7373 | 94-3409691 | ||
| (State or Other Jurisdiction of Incorporation or Organization) |
(Primary Standard Industrial Classification Code Number) |
(I.R.S. Employer Identification Number) |
926 Rock Avenue, Suite 20
San Jose, California 95131
(Address of Principal Executive Offices)
(408) 750-9400
(Registrant’s telephone number)
Securities registered pursuant to Section 12(b) of the Exchange Act:
| Title of Each Class |
Name of Each Exchange on Which Registered | |
| Common Stock, $0.001 par value | NASDAQ Global Market |
Indicate by check mark if the registrant is a well-known seasoned issuer, as defined in Rule 405 of the Securities Act. Yes ¨ No þ
Indicate by check mark if the registrant is not required to file reports pursuant to Section 13 or Section 15(d) of the Exchange Act. Yes ¨ No þ
Indicate by check mark whether the registrant (1) has filed all reports required to be filed by Section 13 or 15(d) of the Exchange Act during the preceding 12 months (or for such shorter period that the registrant was required to file such reports), and (2) has been subject to such filing requirements for the past 90 days. Yes þ No ¨
Indicate by check mark whether the registrant has submitted electronically and posted on its corporate Website, if any, every Interactive Data File required to be submitted and posted pursuant to Rule 405 of Regulation S-T during the preceding 12 months (or for such shorter period that the registrant was required to submit and post such files). Yes ¨ No ¨
Indicate by check mark if disclosure of delinquent filers pursuant to Item 405 of Regulation S-K is not contained herein, and will not be contained, to the best of registrant’s knowledge, in definitive proxy or information statements incorporated by reference in Part III of this Form 10-K or any amendment to this Form 10 K. ¨
Indicate by check mark whether the registrant is a large accelerated filer, an accelerated filer, a non-accelerated filer, or a smaller reporting company. See the definitions of “large accelerated filer,” “accelerated filer” and “smaller reporting company” in Rule 12b-2 of the Exchange Act. (Check one):
Large accelerated filer ¨Accelerated filer ¨Non-accelerated filer þSmaller reporting company ¨
(Do not check if a smaller reporting company)
Indicate by check mark whether the registrant is a shell company (as defined in Rule 12b 2 of the Exchange Act). Yes ¨ No þ
The aggregate market value of the registrant’s common stock held by non-affiliates of the registrant at June 30, 2009, based on the closing price of such stock on the NASDAQ Global Market on such date, was approximately $17,113,230. Shares held by executive officers, directors and holders of more than 5% of the outstanding stock have been excluded from this calculation because such persons or institutions may be deemed affiliates. The determination of affiliate status is not a conclusive determination for other purposes.
As of February 26, 2010, 44,180,467 shares of the registrant’s common stock were outstanding.
DOCUMENTS INCORPORATED BY REFERENCE
The information required by Part III of this report, to the extent not set forth herein, is incorporated by reference from the Registrant’s definitive proxy statement relating to the 2010 annual meeting of stockholders, which definitive proxy statement will be filed with the Securities and Exchange Commission within 120 days after the fiscal year to which this Report relates.
Table of Contents
This Annual Report on Form 10-K of Veraz Networks, Inc. and its subsidiaries (“Veraz” or the “Company,” “Us,” “We” or “Our”) contains forward-looking statements. All statements in this Annual Report on Form 10-K, including those made by the management of Veraz, other than statements of historical fact, are forward-looking statements. These forward-looking statements are made pursuant to safe harbor provisions of the Private Securities Litigation Reform Act of 1995. Forward-looking statements are based on management’s estimates, projections and assumptions as of the date hereof and include the assumptions that underlie such statements. Forward-looking statements may contain words such as “may,” “will,” “should,” “could,” “would,” “expect,” “plan,” “anticipate,” “believe,” “estimate,” “predict,” “potential,” and “continue,” the negative of these terms, or other comparable terminology. Any expectations based on these forward-looking statements are subject to risks and uncertainties and other important factors, including those discussed below and in the section titled “Item 1A. Risk Factors.” Other risks and uncertainties are disclosed in Veraz’s prior Securities and Exchange Commission (“SEC”) filings. These and many other factors could affect Veraz’s future financial condition and operating results and could cause actual results to differ materially from expectations based on forward-looking statements made in this document or elsewhere by Veraz or on its behalf. Veraz undertakes no obligation to revise or update any forward-looking statements.
2
Table of Contents
Our Company
We were incorporated in Delaware on October 18, 2001, and are a leading global provider of voice infrastructure solutions for established and emerging wireline and wireless service providers. Service providers use our products to transport, convert and manage data and voice traffic over both legacy Time-Division Multiplexing, or TDM, networks and Internet Protocol, or IP, networks, while enabling Voice over IP, or VoIP, and other multimedia services. Our products consist of our bandwidth optimization products and our Next Generation Network, or NGN, switching products. Our bandwidth optimization products include our I-Gate 4000 family of stand-alone media gateways and session bandwidth optimizers and our DTX family of digital circuit multiplication equipment, or DCME, products. Our NGN solution includes our ControlSwitch product family based on the IP Multimedia Subsystem, or IMS, architecture, our Network-adaptive Border Controller product family, Veraz’s session border controller, or SBC, solution providing security and session management, and our I-Gate 4000 family of media gateways. We also offer services consisting of hardware and software maintenance and support, installation, training and other professional services.
Our early business was based on the sale of DCME products to service providers for use in their legacy TDM networks. DCME optimizes the transmission of voice across existing transmission links through the use of specific voice compression and voice quality enhancement. We have increasingly focused our efforts on our IP products (media gateways and our ControlSwitch product family).
We outsource the manufacturing of our hardware products, and we sell our products primarily through a direct sales force and also through indirect sales channels.
Our Products and Services
Our product portfolio consists of bandwidth optimization and NGN switching solutions. Our bandwidth optimization products consist of our I-Gate 4000 family of media gateways, our Secure Communication software, and our DTX-600 DCME product for voice compression over legacy TDM networks. Our NGN switching solution consists of our ControlSwitch, an IP softswitch and service delivery platform comprised of numerous IMS-compatible software modules, our Network-adaptive Border Controller and our I-Gate 4000 family of media gateways. Our portfolio of products can significantly reduce the cost to build and operate voice services compared to traditional alternatives and other NGN solutions. In addition, our products offer a standards-compliant platform that enables service providers to increase their revenues through the rapid creation and delivery of new services.
The combination of our media gateways and ControlSwitch forms a comprehensive network solution that is capable of converging legacy and IP networks, delivering new revenue generating services on an IP infrastructure while maintaining existing services from legacy infrastructure. The I-Gate 4000 family of media gateways are physically connected to both circuit and packet networks and serves as a bridge between the voice traffic carried over the public switched telephone network, or PSTN or legacy TDM networks and packet-based IP networks. The I-Gate 4000 family of media gateways provides superior voice quality and industry-leading compression to lower operating expense. The ControlSwitch controls the media gateway and provides call control, call policy routing and enables other back office functionality such as billing.
Our ControlSwitch solution offers equal or superior functionality, reliability and voice quality as that offered by legacy voice switches over both legacy and IP networks, and has additional advantages such as flexibility in network design and management, compact size, open and multi-vendor architecture and quick programmability for new service creation and turn-up.
ControlSwitch
Our ControlSwitch is a highly scalable and fully distributed IMS-compliant software solution that provides call control, call policy/routing, signaling gateway, and media device control, in addition to back office functions in support of provisioning, billing, and network operations. Our compliance to the IMS standards ensures all of the building blocks are available for operators to deploy an open solution that best meets the operators’ service needs. Our distributed architecture and centralized control also provides tremendous operating savings to service providers. ControlSwitch software runs on off-the-shelf computing platforms and performs the following broad functions:
| • | Call Control functions instruct media gateways to originate and terminate calls over PSTN and IP networks. |
| • | Call Policy functions enable service providers to define and implement static and dynamic call policies including least cost, time of day and quality of service routing. |
3
Table of Contents
| • | Signaling Gateway allows access and utilization of the resources of the SS7/C7 network for PSTN call signaling and intelligent networking services. SS7/C7 is the global standard for telecommunications procedures and protocol by which network elements in the PSTN exchange information over a digital signaling network to effect wireless and wireline call setup, routing, and control. |
| • | Back office functionality, managed by the Element Management System includes reporting, call information for billing and troubleshooting for our softswitch solution. |
Network-adaptive Border Controller
The Network-adaptive Border Controller, or N-aBC, is a true next generation security and session management platform, designed to address the key shortcomings in current generation SBCs. The N-aBC provides significant additional benefits and delivers graceful network evolution for service providers.
| • | Integrated support for both SIP/H.323 and SS7 services enables service providers to fully leverage their investment in TDM services as they migrate toward an all-IP next generation network. |
| • | Built-in security for web-services based applications enables service providers to protect their call session handling infrastructure as well as their applications. |
| • | Centralized routing and session management provide real-time global optimization of session handling, resulting in lower network costs and higher quality services. |
| • | Centralized local and global security and call-admission control policies significantly simplify the management of security policies while increasing their granularity and effectiveness. |
| • | Industry leading VoIP compression without sacrificing voice quality dramatically lowers network transport costs and minimizes the risks of network congestion or overload. |
| • | Application-independent security and session management simplify the development and management of new applications. |
| • | Centralized, network-wide, operations support lowers the cost to deploy, maintain and manage both TDM and IP services. |
I-Gate 4000 Media Gateways
Our I-Gate 4000 PRO and I-Gate 4000 EDGE media gateways are hardware devices that transport and convert the voice traffic between PSTN and IP networks. Our I-Gate 4000 family of media gateways can also offer superior voice compression, up to 16:1 while maintaining superior voice quality. Media gateways are usually categorized by voice channel capacity. Typically, media gateways supporting less than 1,000 simultaneous voice channels, such as our I-Gate 4000 EDGE are considered low density while media gateways supporting greater than 10,000 simultaneous voice channels, such as our I-Gate 4000 PRO, are considered high density.
| • | The high density I-Gate 4000 PRO is designed for medium and large-scale Central Office or co-location points of presence deployments used by service providers. Our I-Gate 4000 PRO uses hardware redundancy to protect against hardware module failures and ensure network performance and availability. Our I-Gate 4000 PRO supports up to 12,960 redundant compressed voice channels on a single hardware terminal. |
| • | The I-Gate 4000 EDGE, with up to 480 redundant compressed voice channels, is designed for low-density applications to extend the reach of service providers’ networks to low density markets and enterprises. |
Both products support various PSTN interfaces including T1, E1 and IP interfaces such as Fast Ethernet. In addition, the I-Gate 4000 PRO also supports PSTN interfaces including DS3, STM-1, OC-3 and IP interfaces such as Gigabit Ethernet.
DTX-600
Our legacy DTX-600 DCME product can simultaneously compress voice, fax, data and signaling traffic between any two legacy networks. By compressing traffic, our DTX-600 is designed to serve as a bandwidth optimization platform. Our DTX-600 DCME product compresses voice, fax, data, and signaling traffic between any two legacy network transmission or network switch points. DCME terminals can be used in conjunction with international long distance switches, national long distance switches, mobile switching centers and satellite communications stations from various physical points of presence, or POPs, on a service provider’s network. Our DCME products enable diverse network applications such as the transmission of multiple signaling, voice, data and fax traffic types with or without echo cancellation.
4
Table of Contents
Global Customer Services
We provide comprehensive network support solutions consistent with the needs and requirements of our customers in all geographic markets. Our global services organization offers around the clock support services, a range of professional services, and training courses to help our customers design, install, deploy and maintain their networks.
Competition
The market for carrier packet voice infrastructure solutions is intensely competitive, subject to rapidly changing technology and is significantly affected by new product introductions and the market activities of other industry participants. We expect competition to persist and intensify in the future. This market has historically been dominated by established telephony equipment providers, such as Alcatel-Lucent, Ericsson and Nokia-Siemens Networks, all of which are our direct competitors. We also face competition from other telecommunications and networking companies, including Cisco Systems, Sonus Networks, and Huawei, some of which have entered our market by acquiring companies that design competing products. In addition, these competitors have broader product portfolios and more extensive customer bases than we do. Some of our competitors also have significantly greater financial resources than we do and are able to devote greater resources to the development, promotion, sale and support of their products. Other smaller and mostly privately-held companies are also focusing on our target markets.
Manufacturing
We outsource the manufacturing of our hardware products. Our I-Gate 4000 media gateways are manufactured for us by Flextronics. We buy our DCME products from ECI Telecom, Inc, or ECI which subcontracts the manufacturing to Flextronics. We believe that outsourcing our manufacturing enables us to conserve working capital, better adjust manufacturing volumes to meet changes in demand and more quickly deliver products.
We purchase component parts from outside vendors. Although there are multiple sources for most of these component parts, some components are purchased from a single source provider. We regularly monitor the supply of component parts and the availability of alternative sources. We do not have long-term supply contracts with any of our component suppliers.
Intellectual Property
Our business is dependent on the development, maintenance, and protection of our intellectual property. We rely on the full spectrum of intellectual property rights afforded by patent, copyright, trademark, and trade secret laws, as well as confidentiality procedures and licensing arrangements, to establish and protect our rights to our technology and other intellectual property.
In addition to developing technology, we evaluate the acquisition of intellectual property from others in order to identify technology that provides us with a technological or commercial advantage. We have licensed elements of our technology from third parties, such as all intellectual property associated with our DCME product, which we have licensed from ECI and various operating systems and protocol stacks, which we have licensed from other third parties. None of our third party licenses are subject to termination provisions that will prevent us from continuing our operations.
We are the owner of numerous trademarks and service marks and have applied for registration of our trademarks and service marks in the United States and abroad to establish and protect our brand names as part of our intellectual property strategy, including the registered mark Veraz.
We endeavor to protect our internally developed systems and maintain our trademarks and service marks. Typically, we enter into confidentiality or license agreements with our employees, consultants, customers, and vendors in an effort to control access to and distribution of our technology, software, documentation, and other information.
Employees
At December 31, 2009, we had 329 employees, including 130 employees in research and development and engineering, 95 employees in professional services, 63 employees in sales and marketing, and 41 employees in general and administrative and operational functions. None of our employees are represented by labor unions.
Available Information
We maintain a website at www.veraznetworks.com. Our annual report on Form 10-K, quarterly reports on Form 10-Q, current reports on Form 8-K and related amendments are available free of charge through our website as soon as reasonably practicable
5
Table of Contents
after such reports are electronically filed with or furnished to the SEC. Our website and the information contained in it and connected to it shall not be deemed incorporated by reference into this Form 10-K. Further copies of the reports are located at the SEC’s Public Reference Room at 100 F Street, NE, Washington, D.C. 20549. Information on the operation of the Public Reference Room can be obtained by calling the SEC at 1-800-SEC-0330. The SEC maintains a website that contains reports, proxy and information statements, and other information regarding our filings, at www.sec.gov.
Difficult conditions in the domestic and international economies generally may materially adversely affect our business and results of operations and we do not expect these conditions to improve in the near future.
Declining business and consumer confidence and increased unemployment have resulted in an economic slowdown and a global recession. Continuing market upheavals, including specifically the lack of credit currently available in the market, may have an adverse affect on us because we are dependent on capital budgets and confidence of our customers, and some of our customers are dependant on obtaining credit to finance purchases of our products. Our revenues have declined and are likely to continue to decline in such circumstances. Factors such as business investment, and the volatility and strength of the capital markets affect the business and economic environment and, ultimately, the amount and profitability of our business. In an economic slowdown characterized by higher unemployment, lower family income, lower corporate earnings, lower business investment, more volatile capital markets, fewer options to obtain credit and lower consumer spending, the demand for our products could be adversely affected. Adverse changes in the economy and continuing recession, particularly domestically and in Russia, could affect earnings negatively and could have a material adverse effect on our business, results of operations, and financial condition.
If we fail to comply with the listing requirements of NASDAQ, the price of our common stock and our ability to access the capital markets could be negatively impacted, and our business will be harmed.
Our common stock is currently listed on The NASDAQ Global Market, or NASDAQ. Our stock has traded below $1.00 per share over the last 12 months. On September 15, 2009, we received a staff deficiency letter from The NASDAQ Stock Market indicating that, for the last 30 consecutive business days, the bid price for our common stock had closed below the minimum $1.00 per share requirement for continued inclusion on the NASDAQ under Marketplace Rule 5450(a)(1), or the Rule. Further, the Nasdaq notice informed us that in accordance with Marketplace Rule 5810(c)(3)(A), we have been given 180 calendar days, or until March 15, 2010, to regain compliance with the Rule. If we do not regain compliance with the Rule by March 15, 2010, Nasdaq will provide written notification to Veraz that its common stock may be delisted. We expect to receive the written notification from the NASDAQ on March 16, 2010. At that time, Veraz may appeal Nasdaq’s delisting determination to a Nasdaq Listing Qualifications Panel. There can be no assurance that, if Veraz does appeal the Nasdaq Staff’s Determination, such appeal would be successful. If our stock price trades below $1.00 for a sustained period, we may seek to implement a reverse stock split. Reverse stock splits frequently result in a loss in stockholder value as the actual post-split price is often lower than the pre-split price, adjusted for the split. If we fail to comply with the listing standards, our common stock may be delisted and traded on the over-the-counter bulletin board network. Moving our listing off the NASDAQ could adversely affect the liquidity of our common stock and the delisting of our common stock would significantly affect the ability of investors to trade our securities and could significantly negatively affect the value and liquidity of our common stock. In addition, the delisting of our common stock could adversely affect our ability to raise capital on terms acceptable to us or at all. Delisting from NASDAQ could also have other negative results, including the potential loss of confidence by suppliers and employees, the loss of institutional investor interest, and fewer business development opportunities. In addition, we would be subject to a number of restrictions regarding the registration and qualification of our common stock under federal and state securities laws.
Our retention of PageMill Partners to assist the Company in examining strategic alliance, divestitures, and acquisition opportunities may result in the loss of sales to current and new customers, stricter terms with vendors, may be diversion of management’s time and attention, and ultimately may not succeed.
As announced on March 11, 2010 in a press release, PageMill Partners has been retained to assist the Company in examining our strategic alliance, divestitures, and acquisition opportunities. We believe that some of our customers and/or vendors may become concerned about the possible impact of such a transaction on the product strategy and future direction of the Company. If our business relationships are modified, reduced or terminated, with certain customers or vendors, our business will suffer. Further, the continuing review of strategic alliances, divestitures, and acquisition opportunities has caused and may continue to cause, a diversion of our management’s time and attention which could also have a material adverse effect on our financial condition and results of operations. Finally, there can be no assurances that any appropriate strategic alliance, divestitures, and acquisition opportunity will be found.
6
Table of Contents
The demand for our solutions depends in large part on continued capital spending in the telecommunications equipment industry. A decline in demand, or a decrease or delay in capital spending by service providers, could have a material adverse effect on our results of operations.
We are exposed to the risks associated with the volatility of the U.S. and global economies, including specifically the continued volatility in certain global markets, such as Portugal, Italy, Greece and Spain where we have historically successfully sold our products. The difficulty in obtaining credit in these markets and decreased visibility regarding whether or when there will be sustained growth periods for sales of our products in these and other markets and uncertainty regarding the amount of sales, since our customers may rely on lending arrangements and/or have limited resources to finance capital technology expenditures, may have an adverse effect on our business and operations. In addition, it is expected that this recent economic turmoil and the resulting economic uncertainty will result in decreased consumer spending, which will likely reduce the need for our products from customers. Slow or negative growth in the global economy may continue to materially and adversely affect our business, financial condition, and results of operations for the foreseeable future. Our results of operations would be further adversely affected if we were to experience lower-than-anticipated order levels, cancellations of orders in backlog, extended customer delivery requirements, or pricing pressure as a result of the slowdown.
In addition to the potential decline in capital spending resulting from the volatility in the capital markets, capital spending in the telecommunications equipment industry has in the past, and may in the future, fluctuate significantly based on numerous factors, including:
| • | capital spending levels of service providers; |
| • | competition among service providers; |
| • | pricing pressures in the telecommunications equipment market; |
| • | end user demand for new services; |
| • | service providers’ emphasis on generating revenues from traditional infrastructure instead of migrating to emerging networks and technologies; |
| • | lack of or evolving industry standards; |
| • | consolidation in the telecommunications industry; and |
| • | changes in the regulation of communications services. |
We cannot make assurances of the rate or extent to which the telecommunications equipment industry will grow, if at all. Demand for our solutions and our IP products in particular will depend on the magnitude and timing of capital spending by service providers as they extend and migrate their networks. Furthermore, industry growth rates may not be as forecast, resulting in spending on product development well ahead of market requirements. The telecommunications equipment industry from time to time has experienced, and appears to be currently experiencing, a downturn. In response to the current downturn, service providers have slowed their capital expenditures, and may also cancel or delay new developments, reduce their workforces and inventories and take a cautious approach to acquiring new equipment and technologies, which could have a negative impact on our business. A continued downturn in the telecommunications industry may cause our operating results to fluctuate from period to period, which also may increase the volatility of the price of our common stock and harm our business.
Our success depends in large part on continued migration to an IP network architecture for communications. If the migration to IP networks does not occur or if it occurs more slowly than we expect, our operating results would be harmed.
Our IP products are used by service providers to deliver communications over IP networks. Our success depends on the continued migration of service providers’ networks to a single IP network architecture, which depends on a number of factors outside of our control. For example, existing networks include switches and other equipment that may have remaining useful lives of 20 or more years, and therefore may continue to operate reliably for a lengthy period of time. Other factors that may delay or speed the migration to IP networks include service providers’ concerns regarding initial capital outlay requirements, available capacity on legacy networks, competitive and regulatory issues, and the implementation of an enhanced services business model. As a result, service providers may defer investing in products such as ours that are designed to migrate communications to IP networks. If the migration to IP networks does not occur for these or other reasons, or if it occurs more slowly than we expect, our operating results will be harmed.
Although we have undertaken a concerted effort to reduce costs, including restructuring efforts, to streamline our operations and to reduce our overall cash burn rate, we have not had sustained profits and our losses could continue.
For the years ended December 31, 2009, 2008, and 2007, we used $4.5 million, $15.8 million, and $12.7 million, respectively to fund our operating activities and we have never generated sufficient cash to fund our operations. During the third quarter of 2008, we
7
Table of Contents
undertook a significant restructuring initiative involving the elimination of approximately 160 positions through reduction in force affecting all departments throughout our organization, but primarily in the research and development and services organizations, and in our India operations. The objective of the restructuring was to reduce our overall cash burn rate and streamline our operations while maintaining core research and development capability. We have continued to focus significant efforts on reducing costs during 2009. There can be no assurance that we will be able to reduce spending as planned or that unanticipated costs will not occur. Any restructuring efforts to focus on key products may not prove successful due to a variety of factors, including, without limitation, risks that a smaller workforce may have difficulty successfully completing research and development efforts and adequately monitoring our development and commercialization efforts. In addition, we may, in the future, decide to restructure operations and further reduce expenses by taking such measures as additional reductions in our workforce and reductions in other spending. Any restructuring places a substantial strain on remaining management and employees and on operational resources, and there is a risk that our business will be adversely affected by the diversion of management time to the restructuring efforts. There can be no assurance that following this restructuring we will have sufficient cash resources to allow us to fund our operations as planned.
We have not had sustained profits and our losses could continue.
We have experienced significant losses in the past and never sustained profits. For the fiscal years ended December 31, 2005 and 2006, we recorded net losses of approximately $14.3 million and $13.7 million, respectively. For the year ended December 31, 2007, we achieved net income of approximately $3.4 million and for the years ended December 31, 2008 and December 31, 2009, we recorded net losses of approximately $21.0 million and $11.6 million, respectively. As of December 31, 2008 and 2009, our accumulated deficit was $77.2 and $88.8 million, respectively. We have never generated sufficient cash to fund our operations and can give no assurance that we will generate net income.
We received a letter regarding a confidential informal inquiry by the SEC, or SEC Inquiry, and in January 2009 received a subpoena from the SEC as well. Cooperation with such governmental actions has and will continue to cost significant amounts of money and management resources and may result in charges filed against us and in fines or penalties.
On April 3, 2008, we received a letter from the SEC informing us that the SEC is conducting a confidential informal inquiry into the Company. In response to the inquiry, our Board of Directors appointed a special investigation committee composed of independent directors to cooperate with the SEC in connection with such inquiry and to perform our own investigation of the matters surrounding the inquiry. The special investigation committee, in turn, retained independent legal counsel to perform an internal investigation. Further, on January 27, 2009, we received a subpoena from the SEC requesting the production of certain documents relating to the Company’s business practices in Vietnam. In November 2009, the Staff of the SEC contacted the Company concerning some of the transactions described above. In January 2010, the Company and the staff of the SEC reached a tentative resolution of the matters described above. Under the terms of the resolution, the Company, without admitting or denying the allegations, will consent to the entry of an injunction prohibiting violations of the non-fraud provisions of the FCPA and to pay a civil penalty of $300,000. The agreement requires approval by the SEC and is subject to court approval.
We have incurred, and continue to incur, significant costs related to the SEC Inquiry, which had a material adverse effect on our financial condition and results of operations in 2008 and to a lesser degree in 2009 and will, in future quarters, including at least the first quarter of 2010, also have a material adverse effect on our financial condition and results of operations. Further, the SEC Inquiry has caused and may continue to cause, a diversion of our management’s time and attention which could also have a material adverse effect on our financial condition and results of operations.
We face intense competition from the leading telecommunications networking companies in the world as well as from emerging companies. If we are unable to compete effectively, we might not be able to achieve sufficient market penetration, revenue growth, or profitability.
Competition in the market for our products, and especially our IP products is intense. This market has historically been dominated by established telephony equipment providers such as Alcatel-Lucent, Ericsson LM Telephone Co., and Nokia-Siemens Networks, all of which are our direct competitors. We also face competition from other telecommunications and networking companies, including Cisco Systems, Inc., and Sonus Networks, Inc. While some of the established competitors are exiting the market, we are seeing increasingly intense competition from Huawei, which leverages its broad product portfolio and significant financial resources to compete with us for our switching business.
Many of our current and potential competitors have significantly greater selling and marketing, technical, manufacturing, financial, governmental, and other resources available to them, allowing them to offer a more diversified bundle of products and services. In some cases, our competitors have undercut the pricing of our products or provided more favorable financing terms, which has made us uncompetitive or forced us to reduce our average selling prices, negatively impacting our margins. Further, some of our competitors sell significant amounts of other products to our current and prospective customers. In addition, some potential customers when
8
Table of Contents
selecting equipment vendors to provide fundamental infrastructure products prefer to purchase from larger, established vendors. Our competitors’ broad product portfolios, coupled with already existing relationships, may cause our customers or potential customers to buy our competitors’ products or harm our ability to attract new customers.
To compete effectively, we must deliver innovative products that:
| • | provide extremely high reliability, compression rates, and voice quality; |
| • | scale and deploy easily and efficiently; |
| • | interoperate with existing network designs and other vendors’ equipment; |
| • | support existing and emerging industry, national, and international standards; |
| • | provide effective network management; |
| • | are accompanied by comprehensive customer support and professional services; |
| • | provide a cost-effective and space efficient solution for service providers; and |
| • | offer a broad array of services. |
If we are unable to compete successfully against our current and future competitors, we could experience reduced gross profit margins, price reductions, order cancellations, and loss of customers and revenues, each of which would adversely impact our business.
Our quarterly operating results have fluctuated significantly in the past and may continue to fluctuate in the future, which could lead to volatility in the price of our common stock.
Our quarterly revenues and operating results have fluctuated significantly in the past and they may continue to fluctuate in the future due to a number of factors, many of which are outside of our control and any of which may cause our stock price to fluctuate. From our experience, customer purchases of telecommunications equipment have been unpredictable and irregular batch sales as customers build out their networks, rather than regular, recurring sales. The primary factors that may affect our quarterly revenues and results include the following:
| • | fluctuation in demand for our products and the timing and size of customer orders; |
| • | the length and variability of the sales cycle for our products; |
| • | new product introductions and enhancements by our competitors and us; |
| • | our ability to develop, introduce, and ship new products and product enhancements that meet customer requirements in a timely manner; |
| • | the mix of product configurations sold and the mix of sales to new customers and expansion sales to existing customers; |
| • | the mix of products sold such as between NGN sales and sales of bandwidth optimization products; |
| • | our ability to obtain sufficient supplies of sole or limited source components; |
| • | our ability to attain and maintain production volumes and quality levels for our products; |
| • | costs related to acquisitions of complementary products, technologies, or businesses; |
| • | changes in our pricing policies, the pricing policies of our competitors, and the prices of the components of our products; |
| • | the timing of revenue recognition, amount of deferred revenues, and receivables collections; |
| • | difficulties or delays in deployment of customer IP networks that would delay anticipated customer purchases of additional products and services; |
| • | general economic conditions, as well as those specific to the telecommunications, networking, and related industries; |
| • | consolidation within the telecommunications industry, including acquisitions of or by our customers; and |
| • | the failure of certain of our customers to successfully and timely reorganize their operations, including emerging from bankruptcy. |
In addition, as a result of our accounting policies, we may be unable to recognize all of the revenue associated with certain customer contracts in the same period as the costs associated with those contracts are expensed, which could cause our quarterly gross
9
Table of Contents
margins, particularly of IP gross margins, to fluctuate significantly. Further, our accounting policies may require that revenue related to certain customer contracts be delayed for periods of a year or more. This delay may cause spikes in our revenue in quarters when it is recognized and may result in deferred revenue to revenue conversion taking longer than anticipated.
A significant portion of our operating expenses are fixed in the short term. If revenues for a particular quarter are below expectations, we may not be able to reduce operating expenses proportionally for that quarter. Therefore, any such revenue shortfall would likely have a direct negative effect on our operating results for that quarter. For these and other reasons, we believe that quarter-to-quarter comparisons of our operating results are not a good indication of our future performance.
We believe it likely that in some future quarters, our operating results may be below the expectations of public market analysts and investors, which may adversely affect our stock price. A decline in the market price of our common stock could cause our stockholders to lose some or all of their investment and may adversely impact our ability to attract and retain employees and raise capital. In addition, such a decline in our stock price may cause stockholders to initiate securities class action lawsuits. Whether or not meritorious, litigation brought against us could result in substantial costs and diversion of time and attention of our management. Our insurance to cover claims of this sort, if brought, may not be adequate.
We have historically conducted a significant amount of business with ECI Telecom Ltd., or ECI. If our relationship with ECI is adversely affected our business could be harmed and our results of operations could be negatively affected.
ECI may make strategic choices that are not in the best interest of the Company or its stockholders. For example, other than restrictions with respect to ECI’s exploitation of DCME products, nothing prohibits ECI from competing with us in other matters or offering VoIP products which compete with ours. We may not be able to resolve any potential conflicts that may arise between ECI and us, and even if we are able to do so, the resolution may be less favorable than if we were dealing with an unaffiliated third party. ECI also owns the technology underlying our DCME product lines. Pursuant to the DCME Master Manufacturing and Distribution Agreement, or the DCME Agreement, we have secured the right to act as exclusive worldwide distributor of ECI’s DCME line of products. Under the DCME Agreement, ECI provides certain supply, service, and warranty obligations, and manufactures or subcontracts the manufacture of all DCME equipment sold by us. The DCME Agreement may only be terminated by ECI in the event we project DCME revenues of less than $1 million in a calendar year, we breach a material provision of the DCME Agreement and fail to cure such breach within 30 days, or we become insolvent. Upon the occurrence of one of these events and the election by ECI to terminate the DCME Agreement, ECI would be under no obligation to continue to contract with us. In addition, ECI beneficially owns a significant percentage of our common stock. If the value of the shares of our common stock held by ECI declines, either by disposition of the shares or a decline in our stock price, ECI may be less likely to enter into agreements with us on reasonable terms or at all. Accordingly, in light of the potential volatility in our stock price as previously noted we cannot assure you that the DCME Agreement will be extended or renewed at all or on reasonable commercial terms. In the event of the occurrence of one of these termination events. In addition, our relationship with ECI could be adversely affected by a divestment of our common stock or by declining in our stock price. We do not currently have an independent ability to produce DCME products and have not entered into arrangements with any third party that would enable us to obtain DCME or similar products in the event that ECI ceases to provide us with DCME products. Should ECI become unable or unwilling to fulfill its obligations under the DCME Agreement for any reason or if the DCME Agreement is terminated, we will need to take remedial measures to manufacture DCME or similar products, which could be expensive. If such efforts fail, our business may be materially harmed. In the event of the occurrence of one of these termination events, we cannot assure you that the DCME Agreement will be extended or renewed at all or on reasonable commercial terms.
ECI beneficially owns a significant percentage of our common stock, which will allow ECI to significantly influence us and matters requiring stockholder approval and could discourage potential acquisitions of our company.
ECI owns approximately 25% of our outstanding common stock. As a result of its ownership in us, ECI is able to exert significant influence over actions requiring the approval of our stockholders, including change of control transactions and any amendments to our certificate of incorporation. Because of the nature of our business relationship with ECI and the size and nature of ECI’s ownership position in us, the interests of ECI may be different than those of our other stockholders. In addition, the significant ownership percentage of ECI could have the effect of delaying or preventing a change in control of our company or otherwise discouraging a potential acquirer from obtaining control of our company. In 2007, ECI was acquired by affiliates of the Swarth Group and certain other funds that have appointed Ashmore Investment Management Limited as their investment manager which maintains dispositive and/or voting power over the shares of our common stock held by ECI. In addition, ECI is no longer traded on NASDAQ and has requested that we register their shares under a S-3 registration statement. As a result of the change in ownership and the request for registration, the investment objectives of ECI may have changed as compared to the investment objectives when ECI was a publicly-traded company. The possible change in investment objectives may affect whether, or for how long, ECI will continue to hold our shares and any sales may be difficult and may depress the price of our stock.
10
Table of Contents
Our revenue and operating results may be adversely impacted if sales of our IP products and other products are unstable, if revenue from our bandwidth optimization products continues to fluctuate and if the mix between new sales and expansion sales changes substantially.
Our DCME products incorporate mature technologies that we expect to be in lower demand by our customers in the future. While we are actively pursuing new customers for our DCME products and seeking to increase sales of our additional product offerings to these customers, including our IP products, we believe that there are fewer opportunities for new DCME sales, and we expect DCME sales to continue to decrease over the foreseeable future. Further, we have seen increasing fluctuation on an annual basis for our bandwidth optimization products. If the decrease in DCME revenues occurs more rapidly than we anticipate and/or the sales of our other products, including our IP products, do not make up for the decline in revenues, our business and results of operations will be harmed. Additionally, we believe that the mix between new IP product sales and expansion sales in any given quarter may fluctuate and our gross margins could be adversely impacted. Further, if our expected DCME sales decrease below $1 million in a calendar year ECI may terminate the DCME Agreement.
The largest customers in the telecommunications industry have substantial negotiating leverage, which may require that we agree to terms and conditions that are less advantageous to us than the terms and conditions of our existing customer relationships, or risk limiting our ability to sell our products to these large service providers, thereby harming our operating results.
Large telecommunications service providers have substantial purchasing power and leverage negotiating contractual terms and conditions relating to their purchase of our products from them. As we seek to sell more products to these large telecommunications providers, we may be required to agree to less favorable terms and conditions in order to complete such sales, which may result in lower margins, affect the timing of the recognition of the revenue derived from these sales, and the amount of deferred revenues, each of which may have an adverse effect on our business and financial condition.
In addition, our future success depends in part on our ability to sell our products to large service providers operating complex networks that serve large numbers of subscribers and transport high volumes of traffic. The communications industry historically has been dominated by a relatively small number of service providers. While deregulation and other market forces have led to an increasing number of service providers in recent years, large service providers continue to constitute a significant portion of the market for communications equipment. If we fail to sell additional IP products to our large customers or to expand our customer base to include additional customers that deploy our products in large-scale networks serving significant numbers of subscribers, our revenue growth will be limited.
Consolidation or downturns in the telecommunications industry may affect demand for our products and the pricing of our products, which could limit our growth and may harm our business.
The telecommunications industry, which includes all of our customers, has experienced increased consolidation in recent years, and we expect this trend to continue. Consolidation among our customers and prospective customers may cause delays or reductions in capital expenditure plans and/or increased competitive pricing pressures as the number of available customers declines and their relative purchasing power increases in relation to suppliers. The occurrence of any of these factors, separately or in combination, may lead to decreased sales or slower than expected growth in revenues and could harm our business and operations.
The communications industry is cyclical and reactive to general economic conditions. In the recent past, worldwide economic downturns, pricing pressures, and deregulation have led to consolidations and reorganizations. These downturns, pricing pressures and restructurings have been causing delays and reductions in capital and operating expenditures by many service providers. These delays and reductions, in turn, have been reducing demand for communications products like ours. A continuation or subsequent recurrence of these industry patterns, as well as general domestic and foreign economic conditions and other factors that reduce spending by companies in the communications industry, could harm our operating results in the future.
If we fail to anticipate and meet specific customer requirements, or if our products fail to interoperate with our customers’ existing networks or with existing and emerging industry, national, and international standards, we may not be able to retain our current customers or attract new customers.
We must effectively anticipate and adapt our business, products and services in a timely manner to meet customer requirements. We must also meet existing and emerging industry, national and international standards in order to meet changing customer demands. Prospective customers may require product features and capabilities that are not included in our current product offerings. The introduction of new or enhanced products also requires that we carefully manage the transition from our older products in order to minimize disruption in customer ordering patterns and ensure that adequate supplies of our new products can be delivered to meet anticipated customer demand. If we fail to develop products and offer services that satisfy customer requirements, or if we fail to effectively manage the transition from our older products to our new or enhanced products, our ability to create or increase demand for our products would be seriously harmed and we may lose current and prospective customers, thereby harming our business.
11
Table of Contents
Many of our customers will require that our products be designed to interface with their existing networks or with existing or emerging industry, national, and international standards, each of which may have different and unique specifications. Issues caused by a failure to achieve homologation to certain standards or an unanticipated lack of interoperability between our products and these existing networks may result in significant warranty, support, and repair costs, divert the attention of our engineering personnel from our hardware and software development efforts, and cause significant customer relations problems. If our products do not interoperate with our customers’ respective networks or applicable standards, installations could be delayed or orders for our products could be cancelled, which would seriously harm our gross margins and result in the loss of revenues and/or customers.
We expect that a majority of the revenues generated from our products, especially our IP products, including our ControlSwitch, will be generated from a limited number of customers. If we lose customers or are unable to grow and diversify our customer base, our revenues may fluctuate and our growth likely would be limited.
To date, we have sold our IP products to approximately 131 customers. We expect that for the foreseeable future, the majority of the revenues from our IP products will be generated from a limited number of customers in sales transactions that are unpredictable in many key respects, including, but not limited to, the timing of when these transactions close relative to when the related revenue will be recognized, when cash will be received, the mix of hardware and software, the gross margins related to these transactions, and the total amount of payments to be received. We do not expect to have regular, recurring sales to a limited number of customers. Due to the limited number of our customers and the irregular sales cycle in the industry, if we lose customers and/or fail to grow and diversify our customer base, or if they do not purchase our IP products at levels or at the times we anticipate, our ability to maintain and grow our revenues will be adversely affected. The growth of our customer base could also be adversely affected by:
| • | consolidation in the telecommunications industry affecting our customers; |
| • | unwillingness of customers to implement our new products or renew contracts as they expire; |
| • | potential customer concerns about our status as an emerging telecommunications equipment vendor; |
| • | delays or difficulties that we may experience in the development, introduction, and/or delivery of products or product enhancements; |
| • | deterioration in the general financial condition (including bankruptcy filings) of our customers and the potential unavailability to our customers of credit or financing for additional purchases; |
| • | new product introductions by our competitors; |
| • | geopolitical risks and uncertainties in countries where our customers or our own facilities are located; or |
| • | failure of our products to perform as expected. |
If we do not respond rapidly to technological changes or to changes in industry standards, our products could become obsolete.
The market for IP infrastructure products and services is characterized by rapid technological change, frequent new product introductions and evolving standards. We may be unable to respond quickly or effectively to these developments. We may experience difficulties with software development, hardware design, manufacturing, marketing, or certification that could delay or prevent our development, introduction, or marketing of new products and enhancements. The introduction of new products by our competitors, the market acceptance of products based on new or alternative technologies or the emergence of new industry standards could render our existing or future products obsolete. If the standards adopted are different from those that we have chosen to support, market acceptance of our products may be significantly reduced or delayed. If our products become technologically obsolete, we may be unable to sell our products in the marketplace and generate revenues, and our business could be adversely affected. Because our products are sophisticated and designed to be deployed in complex environments and in multiple locations, they may have errors or defects that we find only after full deployment. If these errors lead to customer dissatisfaction or we are unable to establish and maintain a support infrastructure and required support levels to service these complex environments, our business may be seriously harmed.
Our products are sophisticated and are designed to be deployed in large and complex networks. Because of the nature of our products, they can only be fully tested when substantially deployed in very large networks with high volumes of traffic. Some of our customers have only recently begun to commercially deploy our products or deploy our products in larger configurations and they may discover errors or defects in the software or hardware, the products may not operate as expected, or our products may not be able to function in the larger configurations required by certain customers. If we are unable to correct errors or other performance problems that may be identified after full deployment of our products, we could experience:
| • | cancellation of orders or other losses of or delays in revenues; |
| • | loss of customers and market share; |
| • | harm to our reputation; |
12
Table of Contents
| • | a failure to attract new customers or achieve market acceptance for our products; |
| • | increased service, support, and warranty costs and a diversion of development resources; |
| • | increased insurance costs and losses to our business and service provider customers; and |
| • | costly and time-consuming legal actions by our customers. |
If we experience warranty failure that indicates either manufacturing or design deficiencies, we may be required to recall units in the field and/or stop producing and shipping such products until the deficiency is identified and corrected. In the event of such warranty failures, our business could be adversely affected resulting in reduced revenue, increased costs and decreased customer satisfaction. Because customers often delay deployment of a full system until they have tested the products and any defects have been corrected, we expect these revisions may cause delays in orders by our customers for our systems. Because our strategy is to introduce more complex products in the future, this risk will intensify over time. Service provider customers have discovered errors in our products. If the costs of remediating problems experienced by our customers exceed our expected expenses, which historically have not been significant, these costs may adversely affect our operating results.
In addition, because our products are deployed in large and complex networks around the world, our customers expect us to establish a support infrastructure and maintain demanding support standards to ensure that their networks maintain high levels of availability and performance. To support the continued growth of our business, our support organization will need to provide service and support at a high level throughout the world. This will include hiring and training customer support engineers both at our primary corporate locations as well as our smaller offices in new geographies, such as Central and South America and Russia. If we are unable to provide the expected level of support and service to our customers, we could experience:
| • | loss of customers and market share; |
| • | a failure to attract new customers in new geographies; |
| • | increased service, support, and warranty costs and a diversion of development resources; and |
| • | network performance penalties. |
The long and variable sales and deployment cycles for our products may cause our operating results to vary materially, which could result in a significant unexpected revenue shortfall in any given quarter.
Our products, particularly IP switching products, have lengthy sales cycles, which typically extend from three to 12 months and may take up to two years. A customer’s decision to purchase our products often involves a significant commitment of the customer’s resources and a product evaluation and qualification process that can vary significantly in length. The length of our sales cycles also varies depending on the type of customer to which we are selling, the product being sold and the type of network in which our product will be utilized. We may incur substantial sales and marketing expenses and expend significant management effort during this time, regardless of whether we make a sale.
Even after making the decision to purchase our products, our customers may deploy our products slowly. Timing of deployment can vary widely among customers and among product types. The length of a customer’s deployment period will impact our ability to recognize revenue related to such customer’s purchase and may also directly affect the timing of any subsequent purchase of additional products by that customer. As a result of these lengthy and uncertain sales and deployment cycles for our products, it is difficult for us to predict the quarter in which our customers may purchase additional products or features from us, and our operating results may vary significantly from quarter to quarter, which may negatively affect our operating results for any given quarter.
We rely on channel partners for a significant portion of our revenue. Our failure to effectively develop and manage these third party distributors, systems integrators, and resellers specifically and our indirect sales channel generally, or disruptions to the processes and procedures that support, our indirect sales channels, could adversely affect our ability to generate revenues from the sale of our products.
We rely on third party distributors, systems integrators, and resellers for a significant portion of our revenue. Our revenues depend in large part on the performance of these indirect channel partners. Although many aspects of our partner relationships are contractual in nature, our arrangements with our indirect channel partners are not exclusive. Accordingly, important aspects of these relationships depend on the continued cooperation between the parties.
Many factors out of our control could interfere with our ability to market, license, implement or support our products with any of our partners, which in turn could harm our business. These factors include, but are not limited to, a change in the business strategy of one of our partners, the introduction of competitive product offerings by other companies that are sold through one of our partners, potential contract defaults by one of our partners, or changes in ownership or management of one of our distribution partners. Some of
13
Table of Contents
our competitors may have stronger relationships with our distribution partners than we do, and we have limited control, if any, as to whether those partners implement our products rather than our competitors’ products or whether they devote resources to market and support our competitors’ products rather than our offerings. In addition, we recognize a portion of our revenue based on a sell-through model using information provided by our partners. If those partners provide us with inaccurate or untimely information, the amount or timing of our revenues could be adversely impacted and our operating results may be harmed.
Moreover, if we are unable to leverage our sales and support resources through our distribution partner relationships, we may need to hire and train additional qualified sales and engineering personnel. We cannot assure you, however, that we will be able to hire additional qualified sales and engineering personnel in these circumstances, and our failure to do so may restrict our ability to generate revenue or implement our products on a timely basis. Even if we are successful in hiring additional qualified sales and engineering personnel, we will incur additional costs and our operating results, including our gross margin, may be adversely affected. The loss of or reduction in sales by these resellers could reduce our revenues. If we fail to maintain relationships with these third party resellers, fail to develop new relationships with third party resellers in new markets, fail to manage, train, or provide incentives to existing third party resellers effectively or if these third party resellers are not successful in their sales efforts, sales of our products may decrease and our operating results would suffer.
We may face risks associated with our international sales that could impair our ability to grow our revenues.
For the fiscal years ended December 31, 2009, 2008, and 2007 revenues from outside North America were approximately $63.4 million, $77.6 million, and $93.1 million, respectively. We intend to continue selling into our existing international markets and expand into additional international markets where we currently do not do business. If we are unable to continue to sell products effectively in these existing international markets and expand into additional new international markets, our ability to grow our business will be adversely affected. Some factors that may impact our ability to maintain our international operations and sales and/or cause our results from operations in these international markets to differ from expectations include:
| • | difficulty enforcing contracts and collecting accounts receivable in foreign jurisdictions, leading to longer collection periods; |
| • | certification and qualification requirements relating to our products; |
| • | the impact of recessions in economies outside the United States; |
| • | unexpected changes in foreign regulatory requirements, including import and export regulations, and currency exchange rates; |
| • | certification and qualification requirements for doing business in foreign jurisdictions; |
| • | inadequate protection for intellectual property rights in certain countries; |
| • | less stringent adherence to ethical and legal standards by prospective customers in certain foreign countries, including compliance with the Foreign Corrupt Practices Act; |
| • | potentially adverse tax or duty consequences; |
| • | unfavorable foreign exchange movements, particularly the continued devaluation of the U.S. dollar, which could result in decreased revenues and/or increased expenses; and |
| • | political and economic instability. |
Maintaining and improving our financial controls and the requirements of being a public company may strain our resources, divert management’s attention and affect our ability to attract and retain qualified board members.
As a public company, we are subject to the reporting requirements of the Securities Exchange Act of 1934, or the Exchange Act, the Sarbanes-Oxley Act of 2002, or the Sarbanes-Oxley Act, and the NASDAQ Stock Market Rules, or Nasdaq rules. The requirements of these rules and regulations will increase our legal and financial compliance costs, make some activities more difficult, time-consuming or costly and may also place undue strain on our personnel, systems and resources. The Exchange Act will require, among other things, that we file annual, quarterly and current reports with respect to our business and financial condition. The Sarbanes-Oxley Act will require, among other things, that we maintain effective disclosure controls and procedures and internal control over financial reporting. As a public company, our systems of internal controls over financial reporting will be required to be periodically assessed and reported on by management and will be subject to annual audits by our independent auditors. We are presently evaluating our internal controls for compliance and will be required to comply with the Sarbanes-Oxley guidelines beginning with our Annual Report on Form 10-K for the year ending December 31, 2010, to be filed in early 2011. During the course of our evaluation, we may identify areas requiring improvement, and may be required to design enhanced processes and controls to address issues identified through this review. This could result in significant delays and cost to us and require us to divert substantial resources, including management time, from other activities. We have commenced a review of our existing internal control structure. Although our review is not complete, we have taken steps to improve our internal control structure by hiring or transferring dedicated, internal Sarbanes-Oxley Act compliance personnel to analyze and improve our internal controls, to be supplemented periodically with
14
Table of Contents
outside consultants as needed. However, we cannot be certain regarding when we will be able to successfully complete the procedures, certification, and attestation requirements of Section 404 of the Sarbanes-Oxley Act. If we fail to maintain the adequacy of our internal controls, we may not be able to conclude that we have effective internal controls over financial reporting in accordance with the Sarbanes-Oxley Act. Moreover, effective internal controls are necessary for us to produce reliable financial reports and are important to help prevent fraud. As a result, our failure to satisfy the requirements of Section 404 on a timely basis could result in the loss of investor confidence in the reliability of our financial statements, which in turn could harm the market value of our common stock. Any failure to maintain effective internal controls also could impair our ability to manage our business and harm our financial results.
Under the Sarbanes-Oxley Act and Nasdaq rules, we are required to maintain an independent board. We also expect these rules and regulations will make it more difficult and more expensive for us to maintain directors’ and officers’ liability insurance, and we may be required to accept reduced coverage or incur substantially higher costs to maintain coverage. If we are unable to maintain adequate directors’ and officers’ insurance, our ability to recruit and retain qualified directors, especially those directors who may be deemed independent for purposes of Nasdaq rules, and officers will be significantly curtailed.
If we lose the services of one or more members of our current executive management team or other key employees, or if we are unable to attract additional executives or key employees, we may not be able to execute on our business strategy.
Our future success depends in large part upon the continued service of our executive management team and other key employees. In particular, Douglas Sabella, our president and chief executive officer, is critical to the overall management of our company as well as to the development of our culture and our strategic direction. In order to be successful, we must also hire, retain and motivate key employees, including those in managerial, technical, marketing, and sales positions. In particular, our product generation efforts depend on hiring and retaining qualified engineers. Experienced management and technical, sales, marketing and support personnel in the telecommunications and networking industries are in high demand and competition for their talents is intense. This is particularly the case in Silicon Valley, where our headquarters and significant operations are located.
The loss of services of any of our executives, one or more other members of our executive management or sales team or other key employees, none of whom are bound by employment agreements for any specific term, could seriously harm our business.
We have no internal hardware manufacturing capabilities and we depend exclusively upon contract manufacturers to manufacture our hardware products. Our failure to successfully manage our relationships with Flextronics, ECI or other replacement contract manufacturers would impair our ability to deliver our products in a manner consistent with required volumes or delivery schedules, which would likely cause us to fail to meet the demands of our customers and damage our customer relationships.
We outsource the manufacturing of all of our hardware products. Our I-Gate 4000 media gateways are exclusively manufactured for us by Flextronics. We buy our DCME products from ECI, which subcontracts the manufacturing to Flextronics. These contract manufacturers provide comprehensive manufacturing services, including assembly of our products and procurement of materials and components. Each of our contract manufacturers also builds products for other companies and may not always have sufficient quantities of inventory available or may not allocate their internal resources to fill these orders on a timely basis. Further, our contract manufacturers may choose to limit the amount of credit available to us which will impact our ability to timely order and procure products.
We do not have long-term supply contracts with these contract manufacturers and they are not required to manufacture products for any specified period at any specified price. We do not have internal manufacturing capabilities to meet our customers’ demands and cannot assure you that we will be able to develop or contract for additional manufacturing capacity on acceptable terms on a timely basis if it is needed. An inability to manufacture our products at a cost comparable to our historical costs could impact our gross margins or force us to raise prices, affecting customer relationships and our competitive position.
Qualifying a new contract manufacturer and commencing commercial scale production is expensive and time consuming and could result in a significant interruption in the supply of our products. We are in the process of qualifying a second manufacturing facility for Flextronics and there will be additional costs and complexity associated with manufacturing at multiple sites. If our contract manufacturers are not able to maintain our high standards of quality, increase capacity as needed, or are forced to shut down a factory, our ability to deliver quality products to our customers on a timely basis may decline, which would damage our relationships with customers, decrease our revenues and negatively impact our growth.
We and our contract manufacturers rely on single or limited sources for the supply of some components of our products and if we fail to adequately predict our manufacturing requirements or if our supply of any of these components is disrupted, we will be unable to ship our products on a timely basis, which would likely cause us to fail to meet the demands of our customers and damage our customer relationships.
We and our contract manufacturers currently purchase several key components of our products, including commercial digital signal processors, from single or limited sources. We purchase these components on a purchase order basis. If we overestimate our
15
Table of Contents
component requirements, we could have excess inventory, which would increase our costs and result in write-downs harming our operating results. If we underestimate our requirements, we may not have an adequate supply, which could interrupt manufacturing of our products and result in delays in shipments and revenues.
We currently do not have long-term supply contracts with our component suppliers and they are not required to supply us with products for any specified periods, in any specified quantities, or at any set price, except as may be specified in a particular purchase order. Because the key components and assemblies of our products are complex, difficult to manufacture and require long lead times, in the event of a disruption or delay in supply, or inability to obtain products, we may not be able to develop an alternate source in a timely manner, at favorable prices, or at all. In addition, during periods of capacity constraint, we are disadvantaged compared to better capitalized companies, as suppliers may in the future choose not to do business with us or may require higher prices or less advantageous terms. A failure to find acceptable alternative sources could hurt our ability to deliver high-quality products to our customers and negatively affect our operating margins. In addition, reliance on our suppliers exposes us to potential supplier production difficulties or quality variations. Our customers rely upon our ability to meet committed delivery dates, and any disruption in the supply of key components would seriously adversely affect our ability to meet these dates and could result in legal action by our customers, loss of customers, or harm our ability to attract new customers, any of which could decrease our revenues and negatively impact our growth.
Failure to manage expenses and inventory risks associated with meeting the demands of our customers may adversely affect our business or results of operations.
To ensure that we are able to meet customer demand for our products, we place orders with our contract manufacturers and suppliers based on our estimates of future sales. If actual sales differ materially from these estimates because of inaccurate forecasting or as a result of unforeseen events or otherwise, our inventory levels and expenses may be adversely affected and our business and results of operations could suffer. In addition, in order to remain competitive, we must continue to introduce new products and processes into our manufacturing environment. There cannot be any assurance, however, that the introduction of new products will not create obsolete inventories related to older products.
If we are not able to obtain necessary licenses of third party technology at acceptable prices, or at all, our products could become obsolete.
We have incorporated third-party licensed technology into our current products. From time to time, we may be required to license additional technology from third parties to develop new products or product enhancements. Third party licenses may not be available or continue to be available to us on commercially reasonable terms or at all. The inability to maintain or re-license any third party licenses required in our current products, or to obtain any new third-party licenses to develop new products and product enhancements, could require us to obtain substitute technology of lower quality or performance standards or at greater cost, and delay or prevent us from making these products or enhancements, any of which could seriously harm the competitiveness of our products.
Failures by our strategic partners or by us in integrating our products with those provided by our strategic partners could seriously harm our business.
Our solutions include the integration of products supplied by strategic partners, who offer complementary products and services. We expect to further integrate our IP Products with such partner products and services in the future. We rely on these strategic partners in the timely and successful deployment of our solutions to our customers. If the products provided by these partners have defects or do not operate as expected, if we do not effectively integrate and support products supplied by these strategic partners, or if these strategic partners fail to be able to support products, we may have difficulty with the deployment of our solutions, which may result in:
| • | a loss of or delay in recognizing revenues; |
| • | increased service, support, and warranty costs and a diversion of development resources; and |
| • | network performance penalties. |
In addition to cooperating with our strategic partners on specific customer projects, we also may compete in some areas with these same partners. If these strategic partners fail to perform or choose not to cooperate with us on certain projects, in addition to the effects described above, we could experience:
| • | a loss of customers and market share; and |
| • | a failure to attract new customers or achieve market acceptance for our products. |
Our ability to compete and our business could be jeopardized if we are unable to protect our intellectual property.
We rely on a combination of patent, copyright, trademark, and trade secret laws and restrictions on disclosure to protect our intellectual property rights. However, these legal means afford only limited protection and may not adequately protect our rights or
16
Table of Contents
permit us to gain or keep any competitive advantage. Our patent applications may not issue as patents at all or they may not issue as patents in a form that will be advantageous to us. Our issued patents and those that may issue in the future may be challenged, invalidated, or circumvented, which could limit our ability to stop competitors from marketing related products. Although we have taken steps to protect our intellectual property and proprietary technology, there is no assurance that third parties will not be able to invalidate or design around our patents. Furthermore, although we have entered into confidentiality agreements and intellectual property assignment agreements with our employees, consultants, and advisors, such agreements may not be enforceable or may not provide meaningful protection for our trade secrets or other proprietary information in the event of unauthorized use or disclosure or other breaches of the agreements.
Additionally, despite our efforts to protect our proprietary rights, unauthorized parties may attempt to copy or otherwise obtain and use our products or technology. Monitoring unauthorized use of our products is difficult and we cannot be certain that the steps we have taken to do so will prevent unauthorized use of our technology, particularly in foreign countries where the laws may not protect our proprietary rights as comprehensively as in the United States. If competitors are able to use our technology or develop unpatented proprietary technology similar to ours or competing technologies, our ability to compete effectively could be harmed.
Possible third party claims of infringement of proprietary rights against us could have a material adverse effect on our business, results of operation or financial condition.
The telecommunications industry generally and the market for IP telephony products in particular are characterized by a relatively high level of litigation based on allegations of infringement of proprietary rights. We have received in the past and may receive in the future receive inquiries from other patent holders and may become subject to claims that we infringe their intellectual property rights. We cannot assure you that we are not in infringement of third party patents. Any parties claiming that our products infringe upon their proprietary rights, regardless of its merits, could force us to license their patents for substantial royalty payments or to defend ourselves, and possibly our customers or contract manufacturers, in litigation. We may also be required to indemnify our customers and contract manufacturers for damages they suffer as a result of such infringement. These claims and any resulting licensing arrangement or lawsuit, if successful, could subject us to significant royalty payments or liability for damages and invalidation of our proprietary rights. Any potential intellectual property litigation also could force us to do one or more of the following:
| • | stop selling, incorporating, or using our products that use the challenged intellectual property; |
| • | obtain from the owner of the infringed intellectual property right a license to sell or use the relevant technology, which license may not be available on reasonable terms, or at all; or |
| • | redesign those products that use any allegedly infringing technology. |
Any lawsuits regarding intellectual property rights, regardless of their success, would be time consuming, expensive to resolve and would divert our management’s time and attention.
Regulation of the telecommunications industry could harm our operating results and future prospects.
The telecommunications industry is highly regulated and our business and financial condition could be adversely affected by the changes in the regulations relating to the telecommunications industry. Currently, there are few laws or regulations that apply directly to access to, or delivery of, voice services on IP networks. We could be adversely affected by regulation of IP networks and commerce in any country, including the United States, where we operate. Such regulations could include matters such as voice over the Internet or using Internet protocol, encryption technology, and access charges for service providers. The adoption of such regulations could decrease demand for our products, and at the same time increase the cost of selling our products, which could have a material adverse effect on our business, operating result, and financial condition.
Compliance with regulations and standards applicable to our products may be time consuming, difficult and costly, and if we fail to comply, our product sales will decrease.
In order to achieve and maintain market acceptance, our products must continue to meet a significant number of regulations and standards. In the United States, our products must comply with various regulations defined by the Federal Communications Commission and Underwriters Laboratories, including particular standards relating to our DCME products.
As these regulations and standards evolve, and if new regulations or standards are implemented, we will be required to modify our products or develop and support new versions of our products, and this will increase our costs. The failure of our products to comply, or delays in compliance, with the various existing and evolving industry regulations and standards could prevent or delay introduction of our products, which could harm our business. User uncertainty regarding future policies may also affect demand for communications products, including our products. Moreover, distribution partners or customers may require us, or we may otherwise deem it necessary or advisable, to alter our products to address actual or anticipated changes in the regulatory environment. Our inability to alter our products to address these requirements and any regulatory changes could have a material adverse effect on our business, financial condition, and operating results.
17
Table of Contents
Failure of our hardware products to comply with evolving industry standards and complex government regulations may prevent our hardware products from gaining wide acceptance, which may prevent us from growing our sales.
The market for network equipment products is characterized by the need to support industry standards as different standards emerge, evolve, and achieve acceptance. We will not be competitive unless we continually introduce new products and product enhancements that meet these emerging standards. Our products must comply with various domestic regulations and standards defined by agencies such as the Federal Communications Commission, in addition to standards established by governmental authorities in various foreign countries and the recommendations of the International Telecommunication Union. If we do not comply with existing or evolving industry standards or if we fail to obtain timely domestic or foreign regulatory approvals or certificates, we will not be able to sell our products where these standards or regulations apply, which may harm our business.
Production and marketing of products in certain states and countries may subject us to environmental and other regulations including, in some instances, the requirement to provide customers the ability to return product at the end of its useful life and make us responsible for disposing or recycling products in an environmentally safe manner. Additionally, certain states and countries may pass regulations requiring our products to meet certain requirements to use environmentally friendly components, such as the European Union Directive 2002/96/EC Waste Electrical and Electronic Equipment, or WEEE, to mandate funding, collection, treatment, recycling, and recovery of WEEE by producers of electrical or electronic equipment into Europe and similar rules and regulations in other countries. China is in the final approval stage of compliance programs which will harmonize with the European Union WEEE and Recycling of Hazardous Substances directives. In the future, Japan and other countries are expected to adopt environmental compliance programs. If we fail to comply with these regulations, we may not be able to sell our products in jurisdictions where these regulations apply, which would have a material adverse affect on our results of operations.
We have invested substantially in our enhanced access switching solution and we may be unable to achieve and maintain substantial sales.
We have spent considerable effort and time developing our Class 5 solution, and have had limited sales of this product line to date. Although we have scaled back our development efforts with respect to new features and functionalities for our Class 5 solution, we continue to spend effort and time on our solution. We anticipate sales of our access solution as part of our operational plan, but we may not achieve the success rate we currently anticipate or we may not achieve any success at all. The market for our access solution is new and it is unclear whether there will be broad adoption of this solution by our existing and future potential customers. If the market for our Class 5 products does not develop or if we are unable to further develop the required features, we may need to reduce or cancel our development efforts or conclude an agreement with a third party to license the Class 5 solution.
Future interpretations of existing accounting standards could adversely affect our operating results.
Generally accepted accounting principles in the United States are subject to interpretation by the Financial Accounting Standards Board, or FASB, the SEC, and various other bodies formed to promulgate and interpret appropriate accounting principles. A change in these principles or interpretations could have a significant effect on our reported financial results, and could affect the reporting of transactions completed before the announcement of a change.
For example, we recognize our product software license revenue in accordance with Software Revenue Recognition literature. The American Institute of Certified Public Accountants or other accounting standards setters may continue to issue interpretations and guidance for applying the relevant accounting standards to a wide range of sales contract terms and business arrangements that are prevalent in software licensing arrangements. Future interpretations of existing accounting standards or changes in our business practices could result in future changes in our revenue recognition accounting policies that have a material adverse effect on our results of operations. We may be required to delay revenue recognition into future periods, which could adversely affect our operating results. In the past we have had to defer recognition for license fees, and may have to do so again in the future. Such deferral may be as a result of several factors, including whether a transaction involves:
| • | software arrangements that include undelivered elements for which we do not have vendor specific objective evidence, or VSOE, of fair value; |
| • | requirements that we deliver services for significant enhancements and modifications to customize our software for a particular customer; |
| • | material acceptance criteria or other identified product-related issues; or |
| • | payment terms extending beyond our customary terms. |
Because of these factors and other specific requirements under accounting principles generally accepted in the United States for software revenue recognition, we must have very precise terms in our software arrangements in order to recognize revenue when we initially deliver software or perform services. Negotiation of mutually acceptable terms and conditions can extend our sales cycle, and we sometimes accept terms and conditions that do not permit revenue recognition at the time of delivery.
18
Table of Contents
Increased political, economic and social instability in the Middle East may adversely affect our business and operating results.
The continued threat of terrorist activity and other acts of war or hostility, including the war in Iraq, threats against Israel and the recent Israeli conflict in Gaza, have created uncertainty throughout the Middle East and have significantly increased the political, economic, and social instability in Israel, where substantially all of our products are manufactured. Acts of terrorism, either domestically or abroad and particularly in Israel, or a resumption of the confrontation along the northern border of Israel, would likely create further uncertainties and instability. To the extent terrorism, or the political, economic or social instability results in a disruption of our operations or delays in our manufacturing or shipment of our products, then our business, operating results and financial condition could be adversely affected.
Our I-Gate 4000 media gateways and our DCME products are exclusively manufactured for us by Flextronics, with the DCME products being manufactured by Flextronics through our relationship with ECI. The Flextronics manufacturing facility is located in Migdal-Haemek, Israel, which is located in northern Israel. While Flextronics has other locations across the world at which our manufacturing requirements may be fulfilled and we are in the process of diversifying our manufacturing capabilities to locations outside of the Middle East, any disruption to its Israeli manufacturing capabilities in Migdal-Haemek would likely cause a material delay in our manufacturing process. If we are forced or if we decide to switch the manufacture of our products to a different Flextronics facility, the time and expense of such switch along with the increased costs, if any, of operating in another location, would adversely affect our operations. In addition, while we expect that Flextronics will have the capacity to manufacture our products at facilities outside of Israel, there can be no assurance that such capacity will be available when we require it or upon terms favorable or acceptable to us. To the extent terrorism or political, economic or social instability results in a disruption of Flextronics’ manufacturing facilities in Israel or ECI operations in Israel as they relate to our business, then our business, operating results and financial condition could be adversely affected.
In addition, any hostilities involving Israel or the interruption or curtailment of trade between Israel and its present trading partners, or a significant downturn in the economic or financial condition of Israel, could adversely affect our operations and product development, cause our revenues to decrease, and adversely affect the price of our shares. Furthermore, several countries, principally in the Middle East, still restrict doing business with Israel, Israeli companies or companies with operations in Israel. Should additional countries impose restrictions on doing business with Israel, our business, operating results and financial condition could be adversely affected.
Our operations may be disrupted by the obligations of our personnel to perform military service.
Many of our 156 employees in Israel, including certain key employees, are obligated to perform up to one month (in some cases more) of annual military reserve duty until they reach age 45 and, in emergency circumstances, could be called to active duty. Recently, there have been call-ups of military reservists, including several of our employees, and it is possible that there will be additional call-ups in the future. Our operations could be disrupted by the absence of a significant number of our employees due to military service or the absence for extended periods of one or more of our key employees for military service. Such disruption could adversely affect our business and results of operations.
The grants we have received from the Israeli government for certain research and development expenditures restrict our ability to manufacture products and transfer technologies outside of Israel, and require us to satisfy specified conditions. If we fail to satisfy these conditions, we may be required to refund grants previously received together with interest and penalties.
Our research and development efforts have been financed, in part, through grants that we have received from the Office of the Chief Scientist of the Israeli Ministry of Industry, Trade, and Labor, or the OCS. Therefore, we must comply with the requirements of the Israeli Law for the Encouragement of Industrial Research and Development, 1984 and related regulations, or the Research Law.
Under the Research Law, the discretionary approval of an OCS committee is required for any transfer of technology or manufacturing of products developed with OCS funding. OCS approval is not required for the export of any products resulting from the research or development. There is no assurance that we would receive the required approvals for any proposed transfer. Such approvals, if granted, may be subject to the following additional restrictions:
| • | we could be required to pay the OCS a portion of the consideration we receive upon any transfer of such technology or upon an acquisition of our Israeli subsidiary by an entity that is not Israeli. Among the factors that may be taken into account by the OCS in calculating the payment amount are the scope of the support received, the royalties that were paid by us, the amount of time that elapsed between the date on which the know-how was transferred and the date on which the grants were received, as well as the sale price; and |
| • | the transfer of manufacturing rights could be conditioned upon an increase in the royalty rate and payment of increased aggregate royalties and payment of interest on the grant amount. |
19
Table of Contents
These restrictions may impair our ability to sell our company or technology assets or to outsource manufacturing outside of Israel. The restrictions will continue to apply even after we have repaid the full amount of royalties payable for the grants.
Item 1B. Unresolved Staff Comments
None.
We have renewed the lease for six months from November 1, 2009 until April 30, 2010 of our 24,747 square-foot facility for our corporate headquarters in San Jose, California. We also lease small sales office facilities in each of Fort Lauderdale, Florida; Herndon, Virginia; Brazil, Russia, France, Singapore, India, and the United Kingdom. In addition, we lease approximately 46,400 square feet in Petach Tikva, Israel for sales, development, support and general and administrative functions. We do not own any real estate. We believe that our properties, taken as a whole, are in good operating condition and are suitable for our business operations. As we expand our business into new markets, we expect to lease additional facilities.
We are not a party to any material legal proceeding. From time to time, we may be subject to various claims and legal actions arising in the ordinary course of business.
None.
20
Table of Contents
Item 5. Market for Registrant’s Common Equity, Related Stockholder Matters and Issuer Purchases of Equity Securities
Market For Our Common Stock and Related Shareholder Matters
Our common stock is traded on the NASDAQ Global Select Market under the symbol “VRAZ”. The following table summarizes the high and low sales prices for our common stock as reported by the NASDAQ Global Market for the periods indicated.
| High | Low | |||||
| Fiscal Year 2009 |
||||||
| First quarter |
$ | 1.33 | $ | 0.36 | ||
| Second quarter |
$ | 0.95 | $ | 0.48 | ||
| Third quarter |
$ | 1.20 | $ | 0.64 | ||
| Fourth quarter |
$ | 1.11 | $ | 0.81 | ||
| Fiscal Year 2008 |
||||||
| First quarter |
$ | 5.38 | $ | 2.32 | ||
| Second quarter |
$ | 2.92 | $ | 1.63 | ||
| Third quarter |
$ | 1.81 | $ | 0.01 | ||
| Fourth quarter |
$ | 1.19 | $ | 0.28 | ||
As of February 26, 2010, we had approximately 82 shareholders of record. The number of stockholders of record does not include individuals whose stock is in nominee or “street name” accounts through brokers.
Dividend Policy
We have never declared or paid any cash dividends on our common stock. We currently intend to retain earnings to finance future growth, and therefore do not expect to pay cash dividends on our common stock in the foreseeable future.
21
Table of Contents
Stock Performance Graph
The following performance graph compares the cumulative total return to stockholders on our common stock for the period from April 5, 2007 (the date our shares of common stock first traded) through December 31, 2009 with the cumulative total return over the same period on the NASDAQ Composite Index and the NASDAQ Telecommunications Index. The graph reflects an investment of $100 on April 5, 2007 in our common stock and in each of the indices, and, in each case, assumes reinvestment of dividends, if any. The performance shown is not necessarily indicative of future performance.
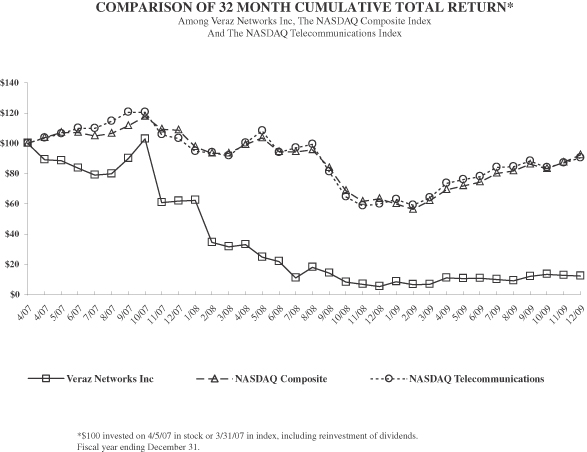
| 2008 |
1/08 | 2/08 | 3/08 | 4/08 | 5/08 | 6/08 | 7/08 | 8/08 | 9/08 | 10/08 | 11/08 | 12/08 | ||||||||||||
| Veraz Networks Inc |
62.31 | 34.36 | 31.54 | 32.95 | 24.62 | 21.79 | 10.90 | 17.95 | 14.10 | 8.08 | 6.79 | 5.26 | ||||||||||||
| NASDAQ Composite |
97.70 | 93.43 | 93.41 | 99.05 | 103.53 | 94.36 | 94.31 | 95.60 | 83.74 | 68.66 | 61.47 | 63.32 | ||||||||||||
| NASDAQ Telecommunications |
94.59 | 93.84 | 91.75 | 100.14 | 108.19 | 93.91 | 96.86 | 99.30 | 81.15 | 64.59 | 58.61 | 59.81 | ||||||||||||
| 2009 |
1/09 | 2/09 | 3/09 | 4/09 | 5/09 | 6/09 | 7/09 | 8/09 | 9/09 | 10/09 | 11/09 | 12/09 | ||||||||||||
| Veraz Networks Inc |
8.46 | 6.54 | 6.67 | 10.90 | 10.51 | 10.64 | 9.87 | 9.10 | 11.92 | 13.33 | 12.64 | 12.18 | ||||||||||||
| NASDAQ Composite |
59.94 | 56.18 | 61.92 | 69.23 | 71.79 | 74.35 | 80.11 | 81.62 | 86.09 | 83.21 | 87.38 | 92.28 | ||||||||||||
| NASDAQ Telecommunications |
62.81 | 59.05 | 63.93 | 73.53 | 75.94 | 77.94 | 84.04 | 84.41 | 88.19 | 83.92 | 87.02 | 90.36 | ||||||||||||
The stock price performance included in this graph is not necessarily indicative of future stock price performance.
Recent Sales of Unregistered Securities
There were no sales of unregistered securities by us that were not previously included in a quarterly report on a Form 10-Q or in a current report on Form 8-K.
Item 6. Selected Financial Data
The following selected consolidated financial data should be read in conjunction with “Management’s Discussion and Analysis of Financial Condition and Results of Operations” and the consolidated financial statements and the notes thereto included elsewhere in this Annual Report on Form 10-K to fully understand factors that may affect the comparability of the information presented below.
22
Table of Contents
We derived the selected consolidated balance sheet data as of December 31, 2009 and 2008 and the consolidated statements of operations data for the years ended December 31, 2009, 2008, and 2007 from our audited consolidated financial statements and accompanying notes in this Annual Report on Form 10-K. The consolidated statements of operations data for each of the years ended December 31, 2006 and 2005 and the consolidated balance sheet data as of December 31, 2007, 2006 and 2005 are derived from our consolidated financial statements which are not included in this report. Our historical results are not necessarily indicative of results for any future period.
The Consolidated Statements of Operations Data is as follows (in thousands, except for per share data):
| Years Ended December 31, | ||||||||||||||||||||
| 2009 | 2008 | 2007 | 2006 | 2005 | ||||||||||||||||
| Revenues: |
||||||||||||||||||||
| IP Products |
$ | 44,303 | $ | 62,467 | $ | 79,369 | $ | 47,314 | $ | 24,474 | ||||||||||
| DCME Products |
3,333 | 8,515 | 24,360 | 38,563 | 41,681 | |||||||||||||||
| Services |
27,455 | 22,453 | 22,025 | 13,769 | 10,089 | |||||||||||||||
| Total revenues |
75,091 | 93,435 | 125,754 | 99,646 | 76,244 | |||||||||||||||
| Costs of revenues |
31,223 | 41,973 | 53,557 | 45,714 | 33,146 | |||||||||||||||
| Gross profit |
43,868 | 51,462 | 72,197 | 53,932 | 43,098 | |||||||||||||||
| Operating Expenses: |
||||||||||||||||||||
| Research and development, net |
18,842 | 25,840 | 31,004 | 32,555 | 26,527 | |||||||||||||||
| Sales and marketing |
23,139 | 30,753 | 28,583 | 26,497 | 25,798 | |||||||||||||||
| General and administrative |
11,501 | 15,309 | 9,671 | 8,793 | 5,802 | |||||||||||||||
| Restructuring charges |
— | 834 | — | — | — | |||||||||||||||
| Total operating expenses |
53,482 | 72,736 | 69,258 | 67,845 | 58,127 | |||||||||||||||
| Income (loss) from operations |
(9,614 | ) | (21,274 | ) | 2,939 | (13,913 | ) | (15,029 | ) | |||||||||||
| Other income (expense), net |
163 | (98 | ) | 996 | 647 | 753 | ||||||||||||||
| Income (loss) before income taxes |
(9,451 | ) | (21,372 | ) | 3,935 | (13,266 | ) | (14,276 | ) | |||||||||||
| Income taxes provision (benefit) |
2,170 | (412 | ) | 559 | 404 | 35 | ||||||||||||||
| Net income (loss) |
(11,621 | ) | (20,960 | ) | 3,376 | (13,670 | ) | (14,311 | ) | |||||||||||
| Deemed dividend on Series D convertible preferred stock |
— | — | (5,980 | ) | — | — | ||||||||||||||
| Net loss allocable to common stockholders |
$ | (11,621 | ) | $ | (20,960 | ) | $ | (2,604 | ) | $ | (13,670 | ) | $ | (14,311 | ) | |||||
| Net loss allocable to common stockholder per share — basic and diluted |
$ | (0.27 | ) | $ | (0.50 | ) | $ | (0.08 | ) | $ | (1.02 | ) | $ | (1.18 | ) | |||||
| Weighted average common shares outstanding — basic and diluted |
43,424 | 42,034 | 33,917 | 13,396 | 12,119 | |||||||||||||||
Related Party Transactions
The Consolidated Statements of Operations data shown above include the following related party transactions (in thousands):
| Years Ended December 31, | |||||||||||||||
| 2009 | 2008 | 2007 | 2006 | 2005 | |||||||||||
| Revenues: |
|||||||||||||||
| IP Products, related party sales |
$ | 1,027 | $ | 66 | $ | 289 | $ | 977 | $ | 1,857 | |||||
| DCME Products, related party sales |
— | — | 468 | 3,274 | 14,636 | ||||||||||
| Cost of Revenues: |
|||||||||||||||
| IP Products, costs arising from related party purchases |
2 | 184 | 175 | 2,508 | 5,737 | ||||||||||
| DCME Products, costs arising from related party purchases |
1,188 | 3,088 | 7,895 | 13,723 | 15,511 | ||||||||||
| Services, costs arising from related party purchases |
22 | 180 | — | — | — | ||||||||||
| Operating Expenses: |
|||||||||||||||
| Research and development |
130 | 897 | 2,166 | 4,525 | 1,501 | ||||||||||
| Sales and marketing |
934 | 3,803 | 4,413 | 3,942 | 3,839 | ||||||||||
| General and administrative |
246 | 305 | 354 | 535 | 576 | ||||||||||
| Other income, related party |
— | — | 113 | 240 | 228 | ||||||||||
23
Table of Contents
The Consolidated Balance Sheets is as follows (in thousands):
| December 31, | |||||||||||||||||
| 2009 | 2008 | 2007 | 2006 | 2005 | |||||||||||||
| Cash and cash equivalents |
$ | 25,095 | $ | 35,388 | $ | 52,232 | $ | 23,189 | $ | 20,437 | |||||||
| Working capital |
$ | 43,172 | $ | 47,144 | $ | 60,677 | $ | 7,561 | $ | 10,116 | |||||||
| Total assets |
$ | 80,711 | $ | 95,200 | $ | 123,747 | $ | 75,536 | $ | 64,669 | |||||||
| Redeemable and convertible preferred stock |
$ | — | $ | — | $ | — | $ | 64,541 | $ | 57,993 | |||||||
| Total stockholders’ equity (deficit) |
$ | 46,441 | $ | 52,124 | $ | 67,540 | $ | (53,307 | ) | $ | (41,555 | ) | |||||
Item 7. Management’s Discussion and Analysis of Financial Condition and Results of Operations
The following discussion and analysis of our financial condition and results of our operation should be read in conjunction with the consolidated financial statements and the notes to those statements included elsewhere in this Annual Report on Form 10-K. This discussion contains forward-looking statements that involve risks and uncertainties. Our actual results could differ materially from those contained in these forward-looking statements due to a number of factors, including those discussed in Part I, Item 1A “Risk Factors” and elsewhere in this report.
Overview
We are a leading global provider of voice infrastructure solutions for established and emerging wireline and wireless service providers. Service providers use our products to transport, convert and manage data and voice traffic both over legacy TDM networks and IP networks, while enabling VoIP and other multimedia services. Our product portfolio consists of bandwidth optimization and NGN switching solutions. Our bandwidth optimization products consist of our I-Gate 4000 family of media gateways, our Secure Communication software, and our DTX-600 DCME product for voice compression over legacy TDM networks. Our NGN switching solution consists of our ControlSwitch, an IP softswitch and service delivery platform comprised of numerous IMS-compatible software modules, our Network-adaptive Border Controller and our I-Gate 4000 family of media gateways. Our portfolio of products can significantly reduce the cost to build and operate voice services compared to traditional alternatives and other NGN solutions. In addition, our products offer a standards-compliant platform that enables service providers to increase their revenues through the rapid creation and delivery of new services. We also offer services consisting of hardware and software maintenance and support, installation, training and other professional services.
Our business initially focused on the sale of DCME products and services. We expect DCME revenue to continue to decline over time, and we have increasingly focused our efforts on our IP products. Our IP product revenues were $44.3 million, $62.5 million, and $79.4 million in 2009, 2008, and 2007, respectively while our DCME product revenues were $3.3 million, $8.5 million, and $24.4 million in 2009, 2008, and 2007, respectively.
We outsource the manufacturing of our hardware products. Our I-Gate 4000 media gateways are manufactured for us by Flextronics. We buy our DCME products from ECI Telecom Ltd. which subcontracts the manufacturing to Flextronics. This enables us to focus mainly on the design, development, sales and marketing of our products and lowers our capital requirements. However, our ability to bring new products to market, fulfill customer orders and achieve long-term growth depends on our ability to maintain sufficient technical personnel and obtain necessary external subcontractor capacity.
We sell our products primarily through a direct sales force and also through indirect sales channels.
In April 2007, we completed our Initial Public Offering, or IPO, of common stock in which we sold and issued 6,750,000 shares of our common stock at an issue price of $8.00 per share. In addition, ECI Telecom Ltd. sold 2,250,000 shares of its common stock in the Company in the offering, after which ECI Telecom Ltd.’s ownership in the Company decreased to approximately 27%. We raised a total of $54.0 million in gross proceeds from the IPO, or $46.6 million in net proceeds after deducting underwriting discounts and commissions of $3.8 million and other offering costs of $3.6 million.
In 2008, we completed a plan of restructuring to reduce our workforce by approximately 160 employees and contractors and consolidate certain operations across all organizations, primarily in the areas of research and development and services. The details of the plan and the expenses are discussed below.
On April 3, 2008, we received a letter from the SEC informing us that the SEC was conducting a confidential informal inquiry into the Company. In response to the inquiry, our Board of Directors appointed a special investigation committee composed of independent directors to cooperate with the SEC in connection with such inquiry and to perform our own investigation of the matters
24
Table of Contents
surrounding the inquiry. The special investigation committee, in turn, retained independent counsel to perform an internal investigation. On July 17, 2008, the Independent Counsel reported its findings to representatives of the SEC and subsequently provided all the requested documents to the SEC. On January 27, 2009, we received a subpoena from the SEC indicating that it had commenced a formal investigation into matters related to our business practices in Vietnam. In connection with such subpoena, we produced documents and provided testimony relevant to the SEC’s investigation. In January 2010, we reached a tentative resolution with the staff of the SEC regarding the matters described above. Under the terms of the resolution, we will consent, without admitting or denying the allegations, to the entry of an injunction prohibiting violations of the non-fraud provisions of the FCPA and to pay a civil penalty of $300,000. The agreement requires approval by the SEC and is subject to court approval.
Critical Accounting Policies and Estimates
Management’s discussion and analysis of our financial position and results of operations is based upon the consolidated financial statements, which have been prepared in accordance with accounting principles generally accepted in the United States pursuant to the rules and regulations of the Securities and Exchange Commission. The preparation of these consolidated financial statements requires us to make estimates and judgments that affect the reported amounts of assets and liabilities and disclosure of contingent assets and liabilities at the date of the financial statements and the reported amounts of revenue and expenses during the reporting period. We base our estimates on historical experience, knowledge of current conditions and beliefs of what could occur in the future given available information. If actual results differ significantly from management’s estimates and projections, there could be a material effect on our financial statements. The accounting policies that we believe are the most critical to aid in fully understanding and evaluating our reported financial results, and which required the most subjective judgment by us, are the following:
| • | revenue recognition; |
| • | stock-based compensation; and |
| • | accounting for income taxes. |
Revenue recognition. DCME product revenues consist of revenues from the sale of our DCME hardware products. IP product revenues consist of revenues from the sale of the I-Gate 4000 family of media gateway hardware products, our ControlSwitch family of softswitch modules, a license of our source code, and our Secure Communications Software. Services revenues consist of revenues from separately-priced maintenance and extended warranty contracts, post-contract customer support, or PCS, installation, training and other professional services.
All of our IP products may be sold in a bundled arrangement that includes PCS, installation, training and other professional services. When sold in a bundled arrangement, our media gateway hardware is referred to as a static trunking solution and when sold in a bundled arrangement that includes our softswitch module software is referred to as a VoIP solution. When our Secure Communications Software is sold in a bundled arrangement with DCME hardware we refer to this sale as a Secure Communications solution and in sales of static trunking solutions, VoIP solutions or Secure Communications solutions, the software is considered more than incidental to the arrangement and essential to the functionality of the hardware.
We recognize revenue when all of the following criteria are met: (i) persuasive evidence of an arrangement exists, (ii) delivery has occurred, (iii) the fee is fixed or determinable, and (iv) collectibility is probable.
The primary estimates and assumptions in our revenue recognition polices are as follows:
| • | Vendor-specific objective evidence, or VSOE, of fair value for IP services: We limit our assessment of VSOE of fair value to the price charged when the same element is sold separately. Accordingly, assuming all other revenue recognition criteria are met, revenue is recognized upon delivery of the hardware and software using the residual method. We expect that our estimates and assumptions used to determine the timing and amount of revenue recognized for IP services will be more consistent. We are not likely to materially change our pricing practices in the future. |
| • | VSOE for PCS based on renewal rates: VSOE for PCS in IP solutions is based on the premise that the stated renewal rates in the contractual arrangements will be enforced when the customer renews their PCS after the initial term. Historically, 100% of the customers that have chosen to renew have renewed at the stated renewal rate. We have no reason to believe that our customers will not renew the PCS at the stated renewal rate. |
| • | Extended payment terms: Our arrangement fees are generally due within one year or less from the later of the date of delivery or acceptance. Some arrangements may have payment terms extending beyond these customary terms. We have experienced collectibility issues on arrangements where payment terms have extended beyond one year. Therefore, on arrangements with these terms, the fees are considered not to be fixed or determinable. Our collection history supports that we recognize revenue based on the assumption that collection is probable when our fees are negotiated under our customary terms. |
25
Table of Contents
In the fourth quarter of 2009, we licensed our Class 5 software source code to a customer for their use to integrate with their product family. The critical accounting estimate for this arrangement was that the fee was fixed and determinable and not subject to concession in the event the customer did not successfully integrate the source code. We believe that collectibility was probable due to the credit worthiness of the customer, our intent to enforce rights of payment, and our history of not providing concessions in our other revenue arrangements. As such, we recognized $1.9 million of revenue in the fourth quarter 2009 as all other revenue recognition criteria had been met. As of the date of this filing, we have received the first two of the three payments per the terms of the arrangement which represents 52% of the total payments.
Stock-based compensation. We estimate the fair value of the stock options granted using the Black-Scholes option-pricing model which require the input of highly subjective assumptions, which represents our best estimate. This fair value is then amortized on a straight line basis over the requisite service periods of the awards, which is generally the vesting period. The following are the key assumptions used to determine the stock based compensation expense:
Expected Stock Price Volatility — The computation of expected volatility is based on the historical and implied volatility of comparable companies from a representative peer group based on industry and market capitalization data.
Expected Term of Option — The expected term represents the period that stock-based awards are expected to be outstanding, giving consideration to the contractual terms of the stock-based awards, vesting schedules, and expectations of future employee behavior as influenced by changes to the terms of our stock-based awards. We determined the expected term in accordance with the “simplified method” for a plain vanilla employee stock option for which the value was estimated using a Black-Scholes formula. Under this approach, the expected term would be presumed to be the mid-point between the vesting date and the end of the contractual term. The use of this approach was permitted as we did not have sufficient historical exercise data to provide a reasonable basis upon which to estimate expected term due to the limited period of time our equity shares have been publicly traded.
Expected Dividend Yield — The dividend yield assumption is based on our history and expectation of dividend payouts. We use a dividend yield of zero, as we have never paid cash dividends and do not expect to pay dividends in the future.
Expected Risk Free Interest Rate — The risk-free interest rate is based on the U.S. Treasury yield curve in effect at the time of grant for the expected term of the option.
Forfeiture Rate — The forfeiture rate is based on a review of recent forfeiture activity and expected future employee turnover.
In 2009, the primary key factors in determining stock based compensation expense were the underlying value of the common stock as of the date of grant and the related expected forfeiture rate for those grants. The use of the Black Scholes valuation method has been limited in 2009 due to predominant use of restricted stock units instead of common stock options for purposes of employee incentive.
Accounting for income taxes. Income taxes are accounted for under the asset and liability method. Deferred tax assets and liabilities are recognized for future tax consequences attributable to differences between the financial statement carrying amounts of existing assets and liabilities and their respective tax bases, as well as operating losses and tax credit carry forwards. Deferred tax assets and liabilities are measured using enacted tax rates expected to apply to taxable income in years in which those temporary differences are expected to be recovered or settled. The effect on deferred tax assets and liabilities of a change in tax rates is recognized in income in the period that includes the enactment date. Valuation allowances are established when necessary in order to reduce deferred tax assets to the amounts expected to be recovered.
We account for uncertainty in income taxes using a two-step approach to recognizing and measuring uncertain tax positions. The first step is to evaluate the tax position for recognition by determining if the weight of available evidence indicates it is more likely than not that the position will be sustained on audit, including resolution of related appeals or litigation processes, if any. The second step is to measure the tax benefit as the largest amount which is more than 50% likely to be realized upon ultimate settlement. An uncertain tax position is considered effectively settled on completion of an examination by a taxing authority if certain other conditions are satisfied. The adoption did not have a material impact on our financial position or results of operations.
26
Table of Contents
Results of Operations
Comparison of Years ended December 31, 2009 and 2008
Revenues (amounts in thousands).
| Years Ended December 31, | |||||||||||||||||||
| 2009 | 2008 | Period-to-Period Change |
|||||||||||||||||
| Amount | Percentage of Total Revenue |
Amount | Percentage of Total Revenue |
Amount | Percentage | ||||||||||||||
| Revenues: |
|||||||||||||||||||
| IP Products |
$ | 44,303 | 59 | % | $ | 62,467 | 67 | % | $ | (18,164 | ) | (29 | )% | ||||||
| DCME Products |
3,333 | 4 | 8,515 | 9 | (5,182 | ) | (61 | ) | |||||||||||
| Services |
27,455 | 37 | 22,453 | 24 | 5,002 | 22 | |||||||||||||
| Total revenues |
$ | 75,091 | 100 | % | $ | 93,435 | 100 | % | $ | (18,344 | ) | (20 | )% | ||||||
| Revenue by Geography: |
|||||||||||||||||||
| Europe, Middle East and Africa |
$ | 38,935 | 52 | % | $ | 53,763 | 57 | % | $ | (14,828 | ) | (28 | )% | ||||||
| North America |
11,701 | 16 | 15,802 | 17 | (4,101 | ) | (26 | ) | |||||||||||
| Asia Pacific and India |
13,024 | 17 | 11,913 | 13 | 1,111 | 9 | |||||||||||||
| Caribbean and Latin America |
11,431 | 15 | 11,957 | 13 | (526 | ) | (4 | ) | |||||||||||
| Total revenues |
$ | 75,091 | 100 | % | $ | 93,435 | 100 | % | $ | (18,344 | ) | (20 | )% | ||||||
IP product revenues decreased 29% in 2009 as compared with 2008 primarily resulting from lower sales in 2009 as compared to 2008. During 2009, we recognized more revenue from our opening deferred revenue balance of approximately $2.8 million than we did in 2008, partially offsetting the impact of the decreased orders in 2009. IP revenues decreased year over year as fewer projects were completed and accepted in 2009 than in 2008. Included in our revenues for 2009, is approximately $1.9 million of revenues recognized from a customer for the licensing of software source code, the first time we have had such an arrangement. The timing and amount of orders and subsequent acceptance is affected by a number of factors, including a continued tightening of customer budgets, the slowdown in capital spending in some regions in which we operate and increased competition, particularly in the North America region and the Europe, Middle East and Africa region. As the market continues to demand more sophisticated communications products, we expect that IP revenues as a percentage of total revenue will continue to increase while concurrently DCME product revenues will continue to decline.
The decrease in DCME product revenues of $5.2 million was the result of the expected decline in the size of the overall DCME market and we expect the decline to continue over the foreseeable future as customers migrate from traditional voice networks, including DCME products, to IP products. At this late stage of the product life cycle of this legacy product, the rate of decline of DCME product revenues will vary from quarter to quarter. We still expect our DCME product sales to continue to decline over time, while there will be some periods where the DCME sales could be higher or lower than our expectations.
Services revenues increased 22% year over year. Our IP services revenues increased to $24.3 million in 2009 from $17.9 million in 2008 due to an increase primarily in IP maintenance revenue for previous deployments to $15.1 million in 2009 from $12.4 million in 2008, and installation and consultation services to $9.2 million in 2009 from $5.5 million in 2008. This increase in IP services revenue was offset by a decrease in DCME services revenues to $3.1 million from $4.5 million in 2009 and 2008, respectively. Over time we expect DCME services revenues to decrease as new DCME implementations continue to decrease, customers migrate to IP products and customers remove DCME equipment from their networks and terminate maintenance and support.
Revenue by Geography
The decrease in revenues of $18.3 million resulted from a decrease in sales in the following regions: North America by $4.1 million, Europe, Middle East and Africa by $14.8 million, Caribbean and Latin America region by $0.5 million, offset by a slight increase in revenues in Asia Pacific and India by $1.1 million. Contributing to the revenue decline in the North America region were fewer revenue arrangements recognized for smaller initial ControlSwitch implementations as compared to 2008. In Europe, Middle East and Africa region, we recognized lower revenue from DCME related revenues of $6.2 million, as well as fewer IP orders received and recognizable in the period of $8.6 million. In 2009, revenues were 16% from North America and 84% international as compared to 17% from North America and 83% international in 2008. The geographic mix of revenues will vary significantly on a quarterly basis, primarily depending on the timing of the completion of projects.
27
Table of Contents
Cost of Revenues and Gross Profit (amounts in thousands).
| Years Ended December 31, | |||||||||||||||||||
| 2009 | 2008 | Period-to-Period Change |
|||||||||||||||||
| Amount | Percentage of Total Revenue |
Amount | Percentage of Total Revenue |
Amount | Percentage | ||||||||||||||
| Cost of Revenues: |
|||||||||||||||||||
| IP Products |
$ | 17,751 | 40 | % | $ | 24,485 | 39 | % | $ | (6,734 | ) | (28 | )% | ||||||
| DCME Products |
1,331 | 40 | 3,390 | 40 | (2,059 | ) | (61 | ) | |||||||||||
| Services |
12,141 | 44 | 14,098 | 63 | (1,957 | ) | (14 | ) | |||||||||||
| Total cost of revenues |
$ | 31,223 | 42 | % | $ | 41,973 | 45 | % | $ | (10,750 | ) | (26 | )% | ||||||
| Gross Profit: |
|||||||||||||||||||
| IP Products |
$ | 26,552 | 60 | % | $ | 37,982 | 61 | % | $ | (11,430 | ) | (30 | )% | ||||||
| DCME Products |
2,002 | 60 | 5,125 | 60 | (3,123 | ) | (61 | ) | |||||||||||
| Services |
15,314 | 56 | 8,355 | 37 | 6,959 | 83 | |||||||||||||
| Total gross profit |
$ | 43,868 | 58 | % | $ | 51,462 | 55 | % | $ | (7,594 | ) | (15 | )% | ||||||
Cost of Revenues. Cost of revenues includes both product and services costs. The decrease in sales of IP and DCME products resulted in a commensurate decrease in related cost of revenues. The overall decrease in cost of revenues includes the benefit from a correction of an error of $0.2 million made in 2009 that related to 2008. We do not believe that the correction of the error in 2009 is material to the year ended December 31, 2009 results.
Cost of IP product revenues decreased 28%, resulting from a 29% decrease in IP product revenues. Cost of DCME product revenues decreased by 61%, which corresponds to a 61% decrease in DCME product revenues.
The cost of services revenues decreased 14% from 2008. The decrease in services costs in 2009 resulted from our reduction of fixed services costs as well as minimizing consulting and other variable costs. The cost of services revenues will vary from period to period depending on the timing of projects being implemented, which may not be in the same period in which the corresponding revenue is recognized. We expect cost of service revenues to relatively remain constant and services revenues to increase in the next year.
Gross Profit. Gross profit decreased by $7.6 million, to $43.9 million in 2009. The decrease primarily reflects a decline in IP product gross profit to $26.6 million in 2009 from $38.0 million in 2008. This decrease of $11.4 million or 30%, which corresponds to a 29% decrease in IP product revenues. DCME gross profit gross profit decreased to $2.0 million in 2009 from $5.1 million in 2008, reflecting a decrease of $3.1 million or 61%, which corresponds to a 61% decrease in DCME product revenues. The decreases in IP and DCME gross profit were partially offset by an increase in services gross profit to $15.3 million in 2009 from $8.4 million in 2008, representing an increase of $7.0 million or 83%. The increase in services gross profit is due to higher services revenues and lower services costs.
Gross Margin. Gross margin, which is gross profit as a percentage of revenue, increased to 58% in 2009 from 55% in 2008. This increase was primarily attributable to the decrease in service costs and an increase in services revenues of 22%. Additionally, the gross margin increased by approximately 1% as a result of our licensing of source code to a customer for $1.9 million with no associated direct costs. The decrease in IP revenues of 29% corresponded to a decrease of 30% in IP product gross margin. Overall IP product gross margin may fluctuate on a quarterly and yearly basis due to changes in the IP product mix, the timing of the recognition of revenue and the associated costs. Typically, IP product revenues from expansion sales will have higher gross margins than revenues from initial VoIP solution deployments.
DCME product gross margins were the same in 2009 as compared to 2008. DCME product margins will fluctuate within a fairly narrow band from quarter to quarter due to our pricing arrangements for the DCME product.
The increase in services gross margin in 2009 compared to 2008 was due to reducing fixed services costs in higher cost regions and increasing services headcount in lower cost regions, as well as minimizing consulting and other variable costs, while growing the services revenues from both higher IP maintenance revenue for previous deployments and installation and consultation revenues. The timing of the services expenses may not be in the same period as when the services revenues are recognized.
28
Table of Contents
Operating Expenses (amounts in thousands).
| Years Ended December 31, | |||||||||||||||||||
| 2009 | 2008 | Period-to-Period Change |
|||||||||||||||||
| Amount | Percentage of Total Revenue |
Amount | Percentage of Total Revenue |
Amount | Percentage | ||||||||||||||
| Research and development, net |
$ | 18,842 | 25 | % | $ | 25,840 | 28 | % | $ | (6,998 | ) | (27 | )% | ||||||
| Sales and marketing |
23,139 | 31 | 30,753 | 33 | (7,614 | ) | (25 | ) | |||||||||||
| General and administrative |
11,501 | 15 | 15,309 | 16 | (3,808 | ) | (25 | ) | |||||||||||
| Restructuring charges |
— | — | 834 | 1 | (834 | ) | (100 | ) | |||||||||||
| Total operating expenses |
$ | 53,482 | 71 | % | $ | 72,736 | 78 | % | $ | (19,254 | ) | (26 | )% | ||||||
Research and development expenses, net. Research and development expenses consist primarily of salaries and related compensation for our engineering personnel responsible for design, development, testing and certification of our products. Our research and development efforts have been partially financed through grants from the OCS. We record grants received from the OCS as a reduction of research and development expenses. Research and development expenses decreased to $18.8 million in 2009 from $25.8 million in 2008. Grants received from the OCS were $2.2 million in 2009 and $2.4 million in 2008. The decrease in research and development expenses was primarily due to a $3.2 million decrease in salary and related costs, a $1.6 million decrease in outside professional services, $1.2 million decrease in equipment purchases and depreciation, as we reduced our asset purchases, and a $0.3 million decrease in travel expenses as we continued efforts to reduce costs. The decreases were partly offset by a decrease in grants received from the OCS of $0.2 million. A large portion of the decrease in salary and related costs can be attributed to the restructuring which occurred early in the third quarter of 2008.
Research and development expenses decreased to 25% of total revenues in 2009 from 28% of total revenues in 2008. We expect research and development expenses to slightly increase in 2010 on an absolute dollar.
Sales and marketing expenses. Sales and marketing expenses consist primarily of salaries and related compensation for our personnel, as well as marketing expenses, which include attendance at trade shows, participation in trade associations, and promotional activities. Sales and marketing expenses decreased to $23.1 million in 2009 from $30.8 million in 2008. Of the $7.6 million decrease in sales and marketing expenses $1.2 million is attributable to a decrease in salary and related costs, including stock-based compensation, $1.8 million is attributable to a decrease in agent commissions, $1.5 million is attributable to a decrease in outside services and $0.8 million is attributable to a decrease in commission expense. Our sales and marketing headcount decreased 17% from 76 in 2008 to 63 in 2009. Agent commissions were lower in 2009 as we both reduced the use of outside consultants generally, and effective April 30, 2009 we terminated our agreement with ECI Telecom as a sales agent in Russia. Commission expense decreased due to lower sales in 2009 as compared to 2008. We decreased costs for travel by $1.0 million, marketing programs by $0.6 million, overhead costs by $0.3 million, and recruiting expenses by $0.2 million. These decreases were partly offset by an increase in equipment purchases of $0.2 million.
Sales and marketing expenses were 31% and 33% of total revenues in 2009 and 2008, respectively. In 2010, we expect sales and marketing expenses to remain approximately the same on an absolute basis.
General and administrative expenses. General and administrative expenses consist primarily of salaries and related compensation costs for our executive management, finance personnel, legal and professional services, travel and related expenses, insurance, provisions for doubtful accounts and other overhead costs. General and administrative expenses decreased 25% to $11.5 million in 2009 from $15.3 million in 2008. The decrease in general and administrative expenses primarily resulted from a decrease in SEC related costs to $0.5 million in 2009 as compared to $2.5 million in 2008 and a decrease of $2.0 million in expenses related to allowance for doubtful accounts in 2009 as compared to 2008 for certain customers in the Russia and the Asia Pacific regions. During 2009, we collected $0.7 million of the write-offs in the Asia Pacific region which had been reserved as an allowance for doubtful accounts in previous periods.
General and administrative expenses were 15% and 16% of total revenues in 2009 and 2008, respectively. For 2010, we expect expenses and costs associated with our general and administrative functions to remain the same on an absolute basis.
29
Table of Contents
Restructuring charges. On July 31, 2008, we announced that we planned to reduce our workforce by approximately 160 employees and contractors and consolidate certain operations across all organizations, primarily in the areas of research and development and services. These activities consisted of severance costs, equipment write-downs and facilities consolidation. During the three months ended September 30, 2008, we incurred total restructuring charges of $0.8 million. During the year ended December 31, 2009, we released an accrual of $40,000 related to the restructuring charges, offset by an additional expenses of $39,000. All the balances were paid in full as of December 31, 2009.
Other income (expense), net. Other income (expense), net consists primarily of interest income earned on cash and cash equivalents and short-term investments and foreign currency exchange gains (losses) offset by interest expense and bank charges. Other income (expense), net, was $0.2 million in 2009 as compared with other expense, net, of $(0.1) million in 2008. In 2009, foreign exchanges gains were $0.2 million as compared to foreign exchanges losses of $(0.9) million in 2008. The foreign exchange balances related to certain balance sheet items that are denominated in foreign currency. Interest income decreased to $0.2 million in 2009 from $1.0 million in 2008 due to lower interest earned on the cash, cash equivalents and short-term investment balances for significant use of cash for normal operating activities in 2009.
Income taxes provision (benefit). The income tax provision was $2.2 million in 2009 and a benefit of $0.4 million in 2008. The 2009 provision is principally comprised of a settlement of income taxes of $0.4 million for the years 2003 through 2007 for our Israel subsidiary, current year tax expense related to our profitable subsidiaries of $0.6 million and the recording of a net valuation allowance of $1.2 million against all of the net deferred tax assets in Israel, offset by other credits. The benefit provision of $0.4 million recorded in 2008 is principally due to the recognition of the deferred tax assets on the loss on operations in Israel as we had determined at that time that it was more likely than not that the deferred tax assets could be realized.
Net loss. Net loss was $11.6 million in 2009 as compared to $21.0 million in 2008. The decrease in net loss was mainly attributable to the decrease in operating expenses of $19.2 million offset by lower gross profit of $7.6 million, and increases in income tax provision of $2.6 million as compared to 2008.
Comparison of Years ended December 31, 2008 and 2007
Revenues (amounts in thousands).
| Years Ended December 31, | |||||||||||||||||||
| 2008 | 2007 | Period-to-Period Change |
|||||||||||||||||
| Amount | Percentage of Total Revenue |
Amount | Percentage of Total Revenue |
Amount | Percentage | ||||||||||||||
| Revenues: |
|||||||||||||||||||
| IP Products |
$ | 62,467 | 67 | % | $ | 79,369 | 63 | % | $ | (16,902 | ) | (21 | )% | ||||||
| DCME Products |
8,515 | 9 | 24,360 | 19 | (15,845 | ) | (65 | ) | |||||||||||
| Services |
22,453 | 24 | 22,025 | 18 | 428 | 2 | |||||||||||||
| Total revenues |
$ | 93,435 | 100 | % | $ | 125,754 | 100 | % | $ | (32,319 | ) | (26 | )% | ||||||
| Revenue by Geography: |
|||||||||||||||||||
| Europe, Middle East and Africa |
$ | 53,763 | 57 | % | $ | 64,675 | 52 | % | $ | (10,912 | ) | (17 | )% | ||||||
| North America |
15,802 | 17 | 32,678 | 26 | (16,876 | ) | (52 | ) | |||||||||||
| Asia Pacific and India |
11,913 | 13 | 17,917 | 14 | (6,004 | ) | (34 | ) | |||||||||||
| Caribbean and Latin America |
11,957 | 13 | 10,484 | 8 | 1,473 | 14 | |||||||||||||
| Total revenues |
$ | 93,435 | 100 | % | $ | 125,754 | 100 | % | $ | (32,319 | ) | (26 | )% | ||||||
The decrease in revenues resulted from an anticipated decrease in DCME product revenues of $15.8 million and a decrease in IP product revenue of $16.9 million, offset by a marginal increase in services revenue.
IP product revenues decreased 21% in 2008 as compared with 2007 primarily as a result lower sales in 2008 as compared to 2007. During 2008, we recognized more revenue from our opening deferred revenue balance than we did in 2008, partially offsetting the impact of the decreased orders in 2007. Other contributing factors to the reduction in IP product revenue year over year included project delays in the APAC region due to headcount turnover associated with the SEC Inquiry and a general economic slowdown in the latter half of the year resulting in decreased capital spending in North America and Europe, Middle East and Africa regions.
The decrease in DCME product revenues was the result of the expected decline in the size of the overall DCME market and we expect the decline to continue over the foreseeable future as customers migrate from traditional voice networks, including DCME
30
Table of Contents
products, to IP products. At this late stage of the product life cycle of this legacy product, the rate of decline of DCME product revenues will vary from quarter to quarter. We still expect our DCME product sales to continue to decline over time, while there will be some periods where the DCME sales could be higher or lower than our expectations.
Services revenues increased 2% year over year. Our IP services revenues increased to $17.9 million in 2008 from $16.1 million in 2007 due to an increase primarily in IP maintenance revenue for previous deployments to $12.4 million in 2008 from $9.2 million in 2007. This increase in IP services revenue was offset by installation and consultation services to $5.5 million in 2008 from $6.9 million in 2007, as well as a decrease in DCME services revenues to $4.5 million in 2008 from $5.9 million in 2007.
Revenue by Geography
The decrease in revenues of $32.3 million resulted from a decrease in sales in the following regions: North America by $16.9 million, Europe, Middle East and Africa by $10.9 million, Asia Pacific and India by $6.0 million, offset by an increase of $1.5 million in revenues resulting from an increase in sales to the Caribbean and Latin America region. The primary causes of revenues decline differs by region. In the North America region, revenue recognized included in 2008 included more revenue arrangements recognized for smaller initial ControlSwitch implementations compared to 2007 and decreased expansion orders, in Asia Pacific region, we had significant turnover of our sales employees in the in the third quarter of 2008 that resulted in lower revenues in the region, and in Europe, Middle East and Africa region, we recognized a lower revenue from Russia than in 2007 due to growing economic downturn in Russia. In 2008, revenues were 17% from North America and 83% international as compared to 26% from North America and 74% international in 2007 reflecting strengthening sales in our Latin America region and softening in the North America and Europe, Middle East and Africa markets due to the overall deteriorating economic environment. The geographic mix of revenues will vary significantly on a quarterly basis, primarily depending on the timing of the completion of projects.
Cost of Revenues and Gross Profit (amounts in thousands).
| Years Ended December 31, | |||||||||||||||||||
| 2008 | 2007 | Period-to-Period Change |
|||||||||||||||||
| Amount | Percentage of Total Revenue |
Amount | Percentage of Total Revenue |
Amount | Percentage | ||||||||||||||
| Cost of Revenues: | |||||||||||||||||||
| IP Products |
$ | 24,485 | 39 | % | $ | 32,198 | 41 | % | $ | (7,713 | ) | (24 | )% | ||||||
| DCME Products |
3,390 | 40 | 8,566 | 35 | (5,176 | ) | (60 | ) | |||||||||||
| Services |
14,098 | 63 | 12,793 | 58 | 1,305 | 10 | |||||||||||||
| Total cost of revenues |
$ | 41,973 | 45 | % | $ | 53,557 | 43 | % | $ | (11,584 | ) | (22 | )% | ||||||
| Gross Profit: | |||||||||||||||||||
| IP Products |
$ | 37,982 | 61 | % | $ | 47,171 | 59 | % | $ | (9,189 | ) | (19 | )% | ||||||
| DCME Products |
5,125 | 60 | 15,794 | 65 | (10,669 | ) | (68 | ) | |||||||||||
| Services |
8,355 | 37 | 9,232 | 42 | (877 | ) | (9 | ) | |||||||||||
| Total gross profit |
$ | 51,462 | 55 | % | $ | 72,197 | 57 | % | $ | (20,735 | ) | (29 | )% | ||||||
Cost of Revenues. The decrease in sales of IP and DCME products resulted in a commensurate decrease in related cost of revenues. Although overall cost of revenues decreased as a result of the decrease in revenues, we continued to incur the same fixed overhead costs.
Cost of IP product revenues decreased 24%, resulting from a 21% decrease in IP product revenues. Cost of DCME product revenues decreased by 60%, which corresponds to a 65% decrease in DCME product revenues.
The cost of services revenues increased 10% from 2007. This was a result of the increase in services costs associated with the growth in the IP business relative to the DCME business. IP installation and service costs tend to be greater than that associated with the DCME product.
Gross Profit. Gross profit decreased by $20.7 million, to $51.5 million in 2008. The decrease was primarily due to decreased revenue from the DCME product as the gross profit decreased to $5.1 million in 2008 from $15.8 million in 2007, a decrease of $10.7 million or 68%, which corresponds to a 65% decrease in DCME product revenues. IP product gross profit also decreased to $38.0 million in 2008 from $47.2 million in 2007, resulting in a decrease of $9.2 million or 19%. Services gross profit decreased to $8.4 million in 2008 from $9.2 million in 2007, a decrease of $0.9 million or 9%, which was due to lower services margins owing to a greater mix of IP product installations as compared to DCME installations in 2008.
31
Table of Contents
Gross Margin. Gross margin, which is gross profit as a percentage of revenue, decreased to 55% in 2008 from 57% in 2007. This decrease is primarily attributable to the increase in service costs compared to increase in services revenues of 2%, decline in services revenues which resulted in lower services margin, decreased DCME product revenues which also represented in a lower DCME product margin, partly offset by increased IP product margin.
The decrease in services gross margin in 2008 compared to 2007, was attributable to an increase in services headcount and related costs in 2008 and few individual service engagement requirements. The timing of the services expenses may not be in the same period as when the services revenues are recognized.
DCME product gross margins declined in 2008 compared to 2007 as the revenue decreased and certain DCME product costs remain fixed. In addition, DCME product margins will fluctuate within a fairly narrow band from quarter to quarter due to pricing.
The marginal increase in IP revenues in 2008 from 2007 was due to better pricing on certain revenue arrangements and reduction in certain costs. Overall IP product gross margin may fluctuate on a sequential quarter over quarter and year over year basis due to changes in the IP product mix, the timing of the recognition of revenue and the associated costs. Typically, IP product revenues from expansion sales will have higher gross margins than revenues from initial VoIP solution deployments.
Operating Expenses (amounts in thousands).
| Years Ended December 31, | |||||||||||||||||||
| 2008 | 2007 | Period-to-Period Change |
|||||||||||||||||
| Amount | Percentage of Total Revenue |
Amount | Percentage of Total Revenue |
Amount | Percentage | ||||||||||||||
| Research and development, net |
$ | 25,840 | 28 | % | $ | 31,004 | 25 | % | $ | (5,164 | ) | (17 | )% | ||||||
| Sales and marketing |
30,753 | 33 | 28,583 | 23 | 2,170 | 8 | |||||||||||||
| General and administrative |
15,309 | 16 | 9,671 | 8 | 5,638 | 58 | |||||||||||||
| Restructuring charges |
834 | 1 | — | — | 834 | — | |||||||||||||
| Total operating expenses |
$ | 72,736 | 78 | % | $ | 69,258 | 55 | % | $ | 3,478 | 5 | % | |||||||
Research and development expenses, net. Research and development expenses consist primarily of salaries and related compensation for our engineering personnel responsible for design, development, testing and certification of our products. Our research and development efforts have been partially financed through grants from OCS. We record grants received from the OCS as a reduction of research and development expenses. Research and development expenses decreased to $25.8 million in 2008 from $31.0 million in 2007. Grants received from the OCS were $2.4 million in 2008 and $1.5 million in 2007. The decrease in research and development expenses was primarily due to a $1.7 million decrease in salary and related costs, a decrease in outside professional services of $2.1 million, decrease in bonuses of $0.7 million, decreased equipment purchases of $0.2 million, facilities and overhead costs of $0.2 million and an increase in grants received from the OCS of $0.9 million, offset by an increase in stock based compensation of $0.8 million. A large portion of the decrease in salary and related costs can be attributed to the restructuring which occurred early in the third quarter of 2008.
Research and development expenses increased 3%, from 25% in 2007 to 28% of total revenues in 2008.
Sales and marketing expenses. Sales and marketing expenses consist primarily of salaries and related compensation for our personnel, as well as marketing expenses, including attendance at trade shows, participation in trade associations, and promotional activities. Sales and marketing expenses increased to $30.8 million in 2008 from $28.6 million in 2007. Within sales and marketing expenses, we saw an increase in salaries and related compensation, including foreign exchange fluctuations and headcount increases in the Caribbean and Latin America and Europe, Middle East and Africa regions, of $1.9 million, including expense of $0.3 million for employment related taxes. In addition, we had increased costs for consultants and other third party services of $1.0 million, commission expense of $0.3 million, recruiting expense of $0.2 million, travel expense of $0.3 million, equipment purchases of $0.2 million, IT costs of $0.7 million, and stock based compensation of $0.5 million, offset by a $2.9 million decrease in agent commissions as we increased our efforts to use direct sales force to sell our products and a reduction in our sales in Russia.
Sales and marketing expenses were 33% and 23% of total revenues in 2008 and 2007, respectively.
General and administrative expenses. General and administrative expenses consist primarily of salaries and related compensation costs for our executive management, finance personnel, legal and professional services, travel and related expenses, insurance, provisions for doubtful accounts and other overhead costs. General and administrative expenses increased to $15.3 million in 2008 from $9.7 million in 2007. The increase in general and administrative expenses was primarily related SEC inquiry related costs of
32
Table of Contents
$2.5 million, an additional allowance for doubtful accounts of $1.6 million in 2008 for certain customers in Russia and the Asia Pacific region, and a $1.3 million increase in salaries and related compensation, including stock based compensation.
General and administrative expenses were 16% and 8% of total revenues in 2008 and 2007, respectively.
Restructuring charges. On July 31, 2008, we announced that we planned to reduce our workforce by approximately 160 employees and contractors and consolidate certain operations across all organizations, primarily in the areas of research and development and services. These activities consist of severance costs, equipment write-downs and facilities consolidation. Costs associated with restructuring activities, other than those activities related to business combinations.
Restructuring activity for the twelve months ended December 31, 2008 was as follows (in thousands):
| Employee Termination/ Severance and Related Costs |
Facility Shutdown and Consolidation |
Impairment of Fixed Assets or Loss on disposal of Assets |
Total | |||||||||||||
| Balance at January 1, 2008 |
$ | — | $ | — | $ | — | $ | — | ||||||||
| Charges to operations |
499 | 142 | 193 | 834 | ||||||||||||
| Payments made during the year |
(499 | ) | (102 | ) | — | (601 | ) | |||||||||
| Impairment of assets |
— | — | (193 | ) | (193 | ) | ||||||||||
| Balance at December 31, 2008 |
$ | — | $ | 40 | $ | — | $ | 40 | ||||||||
The $40,000 restructuring accrual as of December 31, 2008, is included as a component of our current accrued expenses on the Consolidated Balance Sheets.
Other income (expense), net. Other income (expense), net consists primarily of interest income earned on cash and cash equivalents and short-term investments and foreign currency exchange gains (losses) offset by interest expense and bank charges. Other income (expense), net, was a net expense of $0.1 million in 2008, as compared with an other income, net of $1.0 million in 2007. The decrease was primarily due to an increase in foreign currency exchange losses on certain balance sheet items that are denominated in foreign currency, as well as by a decrease in interest income due to lower interest earned on the balances, resulting from lower cash and cash equivalents balances due to significant use of cash for normal operating activities in 2008.
Income taxes. Income taxes provided a benefit of $0.4 million in 2008 compared to a provision of $0.6 million in 2007. The income tax benefit in 2008, was primarily attributable to our loss on operations in Israel. We believe that the related deferred tax asset will be realized. The income tax provision in 2007 was attributable to our profitable foreign operations, primarily in Israel, for income generated on sales of products not covered under the Approved Enterprise status in Israel.
Net income (loss). Net loss was $21.0 million in 2008 as compared to a net income of $3.4 million in 2007. The increase in net loss was mainly attributable to the decrease in gross profit of $20.7 million as compared to 2007, and an increase in operating expenses by $3.5 million mostly related to the SEC inquiry and restructuring charges.
Deemed dividend on Series D convertible preferred stock. Upon the closing of the initial public offering of our common stock, all shares of convertible preferred stock outstanding automatically converted into shares of common stock. The beneficial conversion feature of the Series D convertible preferred stock resulted in a deemed dividend in the aggregate amount of approximately $6.0 million. The amount of deemed dividend decreased the net income attributable to common stockholders in the year ended December 31, 2007.
Liquidity and Capital Resources
As of December 31, 2009, we had unrestricted cash and cash equivalents and short-term investments of $33.0 million, a decrease from $38.0 million from December 31, 2008.
We anticipate our cash and related balances will increase in aggregate over the next 12 months as we continue to monitor operating expense. We believe that our existing cash, cash equivalents and short-term investments will meet our normal operating and capital expenditure needs for at least the next 12 months. We do not currently and did not as of December 31, 2009 maintain any auction rate securities as of December 31, 2009.
Operating Activities
Net cash used in our operating activities was $4.5 million, $15.8 million, and $12.7 million during 2009, 2008, and 2007 respectively.
33
Table of Contents
Net cash used in our operating activities in 2009 was primarily attributable to a decrease in our operating liabilities, offset by a greater decrease in operating assets. Our net loss adjusted for non-cash items such as depreciation, stock compensation and deferred taxes, accounted for $4.4 million of the cash used in operations. The decrease in operating assets was driven by lower accounts receivable, mainly from our overall revenue decrease in 2009 as well as from our cash collection efforts, decreases in inventory balances and reductions in prepaid expenses. Our decrease in operating liabilities is primarily attributable to decreases in related party liabilities, due to the termination of the sales agent agreement with ECI and partial payment of amounts outstanding as of the end of 2008, decreases in deferred revenue from lower revenue and lower accrued expenses. Our working capital decreased to $43.2 million as of December 31, 2009, from $47.1 million as of December 31, 2008.
Net cash used in our operating activities in 2008 was primarily attributable to our net loss of $21.0 million. We also had an increase in inventories of $2.8 million resulting from purchases for anticipated orders at year end and related party transactions, net of $4.0 million, and decreases in accounts payable, accrued payroll and expenses in the aggregate amount of $9.3 million related to the timing of payments as well as reduced operating expenses. The amount of cash used was offset by a decrease in accounts receivable of $7.7 million and prepaid expenses and other current assets of $1.5 million. The net cash used in our operating activities were related to our decrease in revenues and the increase in operating expenses. Further, we incurred non-cash expenses of $3.4 million and $4.5 million of depreciation and stock-based compensation, respectively. Our working capital decreased to $47.1 million as of December 31, 2008, from $60.7 million as of December 31, 2007.
Investing Activities
Net cash provided by (used in) our investing activities was $(6.2) million, $1.2 million, $(8.6) million in 2009, 2008, and 2007, respectively.
Investing activities in 2009 consisted primarily of purchases of net short-term investments of $5.3 million, as well as purchases of property and equipment of $1.0 million.
Investing activities in 2008 consisted primarily of net purchases of short-term investments of $9.6 million as well as purchases of property and equipment of $1.5 million, offset by sales and maturities of short-term investments of $12.3 million.
Financing Activities
Net cash provided by (used in) our financing activities was $0.1 million, $(2.6) million, and $50.4 million during 2009, 2008, and 2007, respectively.
Net cash provided by our financing activities was $76,000 for 2009 for proceeds received from the exercise of stock options.
Net cash used in our financing activities in 2008 was due to repayments of a loan in the amount of $3.3 million offset by proceeds received from the exercise of stock options in the amount of $0.7 million.
Net cash provided by our financing activities in 2007 primarily consisted of proceeds from the initial public offering of our common stock in the amount of $54.0 million, offset by cash paid related to offering costs in the amount of $5.9 million, and to a lesser extent of net proceeds from the second closing of our Series D convertible preferred stock financing in the amount of $3.4 million and of proceeds received from the exercise of stock options in the amount of $0.6 million. In addition, during the period we repaid our loan payable in the amount of $1.7 million.
Contractual Obligations and Commitments
As of December 31, 2009, the following summarizes our future contractual obligations for the periods presented (in thousands):
| Payments Due in Years Ending | ||||||||||||||||||
| Total | 2010 | 2011 | 2012 | 2013 | Thereafter | |||||||||||||
| Contractual Obligations: |
||||||||||||||||||
| Operating lease obligations |
$ | 4,413 | $ | 2,231 | $ | 1,463 | $ | 304 | $ | 164 | $ | 251 | ||||||
| Purchase obligations* |
1,282 | 1,282 | — | — | — | — | ||||||||||||
| Total |
$ | 5,695 | $ | 3,513 | $ | 1,463 | $ | 304 | $ | 164 | $ | 251 | ||||||
| * | Purchase obligations primarily relating to inventory purchases. These obligations do not include agreements that are cancelable without penalty. |
34
Table of Contents
Off-Balance Sheet Arrangements
At December 31, 2009, we did not have any relationships with unconsolidated entities or financial partnerships, such as entities often referred to as structured finance, special purpose or variable interest entities, which would have been established for the purpose of facilitating off-balance sheet arrangements or other contractually narrow or limited purposes. We do not have any off-balance sheet arrangements that are currently material or reasonably likely to be material to our consolidated financial position or results of operations.
Recent Accounting Pronouncements
See Note 2(w) of the Consolidated Financial Statements for a full description of the recent accounting pronouncement including the expected date of adoption and effect on results of operations and financial condition.
Item 7A. Quantitative and Qualitative Disclosures About Market Risk
Foreign Currency Risk
The majority of our revenues, costs of sales and expenses, including subcontractor manufacturing expenses, are denominated in U.S. dollars. However, we do maintain sales and business operations in foreign countries, and part of our revenue is derived from customers in foreign countries. As such, we have exposure to adverse changes in exchange rates associated with operating expenses, including personnel, facilities and other expenses, of our foreign operations and sales to our customers. If the exchange rate between the U.S. dollar and the New Israeli Shekel and Brazilian Real had increased or decreased by 10%, the effect of our local currency expenses, excluding the impact of any foreign currency forward contracts, would have increased or decreased by $1.9 million in 2009.
We also had foreign currency risk related to cash, accounts receivable and accounts payable that are denominated in local currency for subsidiaries with U.S. dollar functional currencies. At December 31, 2009 and 2008, we had in cash and accounts receivable in the following currencies: Russian Rubles, Euros, Indian Rupees and New Israeli Shekel. Due to the impact of changes in foreign currency exchange rates between the U.S. Dollar and these other currencies, we recorded in other income (expense), net of $(0.2) million and $0.1 million in 2009 and 2008, respectively.
We are also impacted by assets or liabilities that are denominated in a currency other than a subsidiary’s functional currency. Our intercompany short-term balances with our Brazilian subsidiary are denominated in U.S. dollars, while the Brazilian subsidiary’s functional currency is the Brazilian Real. The impact of a change in the foreign exchange rate for the intercompany short-term balances between the U.S. dollar and the Brazilian Real during 2009 and 2008 resulted in the increase and decrease, respectively in the amounts payable in Brazilian Real. Therefore, at December 31, 2009 and 2008, a gain of $0.4 million and a loss of $1.1 million were recorded in other income (expense), net.
Interest Rate Sensitivity
We had cash, cash equivalents, restricted cash, and short-term investments totaling $33.6 million at December 31, 2009. These amounts were invested primarily in money market funds and treasury securities. The unrestricted cash and cash equivalents are held for working capital purposes. We do not enter into investments for trading or speculative purposes. Due to the short-term nature of these investments, we do not believe that a 10% change in interest rates would have a material impact on our financial position and results of operations. However, declines in interest rates and cash balances will reduce future investment income.
Forward Contracts
In general, we incur operating expenses in foreign currencies and the changes in exchange rates, and in particular a strengthening or weakening of the U.S. dollar will affect our operating expenses as expressed in U.S. dollars when there has been significant volatility in foreign currency exchange rates.
We may enter into foreign currency forward contracts with financial institutions to protect against foreign exchange risks associated with certain expenses in New Israeli Shekels. Generally, our practice is to hedge a majority of our material foreign exchange exposures, typically for 30 days. A majority of our revenue, expense, and capital purchasing activities are transacted in U.S. dollars. However, we may choose not to hedge certain foreign exchange exposures for a variety of reasons, including but not limited to immateriality, accounting considerations, and the prohibitive economic cost of hedging particular exposures. Our forward contracts reduce, but do not always entirely eliminate, the impact of currency exchange rate movements. Beginning second quarter of 2009, we purchased forward foreign exchange contracts to mitigate the risk of changes in foreign exchange rates on 75% of the identified New Israeli Shekel expenses. As of December 31, 2009, there were no outstanding forward contracts for the purchase of new Israeli shekels. During 2009, the benefit of the forward contracts recorded in other income (expense), net was $0.6 million.
35
Table of Contents
Item 8. Financial Statements and Supplementary Data
Index to Consolidated Financial Statements
| Page | ||
| 37 | ||
| Consolidated Financial Statements: |
||
| 38 | ||
| 39 | ||
| 40 | ||
| 41 | ||
| 42 |
36
Table of Contents
Report of Independent Registered Public Accounting Firm
The Board of Directors and Stockholders
Veraz Networks, Inc.:
We have audited the accompanying consolidated balance sheets of Veraz Networks, Inc. (the Company) and subsidiaries as of December 31, 2009 and 2008, and the related consolidated statements of operations, redeemable and convertible preferred stock and stockholders’ equity, and cash flows for each of the years in the three-year period ended December 31, 2009. These consolidated financial statements are the responsibility of the Company’s management. Our responsibility is to express an opinion on these consolidated financial statements based on our audits.
We conducted our audits in accordance with the standards of the Public Company Accounting Oversight Board (United States). Those standards require that we plan and perform the audit to obtain reasonable assurance about whether the financial statements are free of material misstatement. An audit includes examining, on a test basis, evidence supporting the amounts and disclosures in the financial statements. An audit also includes assessing the accounting principles used and significant estimates made by management, as well as evaluating the overall financial statement presentation. We believe that our audits provide a reasonable basis for our opinion.
In our opinion, the consolidated financial statements referred to above present fairly, in all material respects, the financial position of Veraz Networks, Inc. and subsidiaries as of December 31, 2009 and 2008, and the related consolidated statements of their operations and their cash flows for each of the years in the three-year period ended December 31, 2009, in conformity with U.S. generally accepted accounting principles.
/s/ KPMG LLP
Mountain View, California
March 12, 2010
37
Table of Contents
VERAZ NETWORKS, INC. AND SUBSIDIARIES
Consolidated Balance Sheets
(in thousands, except share and per share data)
| December 31, | ||||||||
| 2009 | 2008 | |||||||
| ASSETS |
||||||||
| Current assets: |
||||||||
| Cash and cash equivalents |
$ | 25,095 | $ | 35,388 | ||||
| Restricted cash |
608 | 604 | ||||||
| Short-term investments |
7,899 | 2,650 | ||||||
| Accounts receivable (net of allowances of $1,251and $1,459) |
29,959 | 31,666 | ||||||
| Inventories |
8,364 | 12,284 | ||||||
| Prepaid expenses |
1,718 | 2,097 | ||||||
| Deferred tax assets |
— | 945 | ||||||
| Other current assets |
3,113 | 3,674 | ||||||
| Due from related parties |
686 | 912 | ||||||
| Total current assets |
77,442 | 90,220 | ||||||
| Property and equipment, net |
3,149 | 4,635 | ||||||
| Other assets |
120 | 345 | ||||||
| Total assets |
$ | 80,711 | $ | 95,200 | ||||
| LIABILITIES AND STOCKHOLDERS’ EQUITY |
||||||||
| Current liabilities: |
||||||||
| Accounts payable |
$ | 6,375 | $ | 5,671 | ||||
| Accrued expenses |
11,493 | 13,204 | ||||||
| Income tax payable |
1,173 | 354 | ||||||
| Deferred revenue |
14,112 | 17,177 | ||||||
| Due to related parties |
1,117 | 6,670 | ||||||
| Total current liabilities |
34,270 | 43,076 | ||||||
| Commitments and contingencies (Note 12) |
||||||||
| Stockholders’ equity: |
||||||||
| Undesignated preferred stock, $0.001 par value; 10,000,000 shares authorized; no shares issued and outstanding |
— | — | ||||||
| Common stock, $0.001 par value; 200,000,000 shares authorized; 43,685,802 and 42,855,046 shares issued and outstanding |
44 | 43 | ||||||
| Additional paid-in capital |
133,084 | 129,035 | ||||||
| Deferred stock-based compensation |
— | (32 | ) | |||||
| Accumulated other comprehensive income |
2,124 | 268 | ||||||
| Accumulated deficit |
(88,811 | ) | (77,190 | ) | ||||
| Total stockholders’ equity |
46,441 | 52,124 | ||||||
| Total liabilities and stockholders’ equity |
$ | 80,711 | $ | 95,200 | ||||
See accompanying notes to consolidated financial statements
38
Table of Contents
VERAZ NETWORKS, INC. AND SUBSIDIARIES
Consolidated Statements of Operations
(In thousands, except per share data)
| Years Ended December 31, | ||||||||||||
| 2009 | 2008 | 2007 | ||||||||||
| Revenues: |
||||||||||||
| IP Products |
$ | 44,303 | $ | 62,467 | $ | 79,369 | ||||||
| DCME Products |
3,333 | 8,515 | 24,360 | |||||||||
| Services |
27,455 | 22,453 | 22,025 | |||||||||
| Total revenues |
75,091 | 93,435 | 125,754 | |||||||||
| Cost of Revenues: |
||||||||||||
| IP Products |
17,751 | 24,485 | 32,198 | |||||||||
| DCME Products |
1,331 | 3,390 | 8,566 | |||||||||
| Services |
12,141 | 14,098 | 12,793 | |||||||||
| Total cost of revenues |
31,223 | 41,973 | 53,557 | |||||||||
| Gross profit |
43,868 | 51,462 | 72,197 | |||||||||
| Operating Expenses: |
||||||||||||
| Research and development (net of grants from the Office of the Chief Scientist in Israel of $2,150, $2,353 and $1,503 in 2009, 2008 and 2007, respectively) |
18,842 | 25,840 | 31,004 | |||||||||
| Sales and marketing |
23,139 | 30,753 | 28,583 | |||||||||
| General and administrative |
11,501 | 15,309 | 9,671 | |||||||||
| Restructuring charges |
— | 834 | — | |||||||||
| Total operating expenses |
53,482 | 72,736 | 69,258 | |||||||||
| Income (loss) from operations |
(9,614 | ) | (21,274 | ) | 2,939 | |||||||
| Other income (expense), net: |
||||||||||||
| Interest income |
188 | 987 | 2,103 | |||||||||
| Interest expense |
(135 | ) | (271 | ) | (846 | ) | ||||||
| Foreign currency gains (loss), net |
169 | (924 | ) | 160 | ||||||||
| Other, net |
(59 | ) | 110 | (421 | ) | |||||||
| Total other income (expense) |
163 | (98 | ) | 996 | ||||||||
| Income (loss) before income taxes |
(9,451 | ) | (21,372 | ) | 3,935 | |||||||
| Income taxes provision (benefit) |
2,170 | (412 | ) | 559 | ||||||||
| Net income (loss) |
(11,621 | ) | (20,960 | ) | 3,376 | |||||||
| Deemed dividend on Series D convertible preferred stock |
— | — | (5,980 | ) | ||||||||
| Net loss allocable to common stockholders |
$ | (11,621 | ) | $ | (20,960 | ) | $ | (2,604 | ) | |||
| Net loss allocable to common stockholders per share—basic and diluted |
$ | (0.27 | ) | $ | (0.50 | ) | $ | (0.08 | ) | |||
| Weighted average shares outstanding used in computing net loss allocable to common stockholders per share—basic and diluted |
43,424 | 42,034 | 33,917 | |||||||||
Related Party Transactions
The Consolidated Statements of Operations shown above include the following related party transactions:
| Years Ended December 31, | |||||||||
| 2009 | 2008 | 2007 | |||||||
| Revenues: |
|||||||||
| IP Products, related party sales |
$ | 1,027 | $ | 66 | $ | 289 | |||
| DCME Products, related party sales |
— | — | 468 | ||||||
| Cost of Revenues: |
|||||||||
| IP Products, costs arising from related party purchases |
2 | 184 | 175 | ||||||
| DCME Products, costs arising from related party purchases |
1,188 | 3,088 | 7,895 | ||||||
| Services, costs arising from related party purchases |
22 | 180 | — | ||||||
| Operating Expenses: |
|||||||||
| Research and development |
130 | 897 | 2,166 | ||||||
| Sales and marketing |
934 | 3,803 | 4,413 | ||||||
| General and administrative |
246 | 305 | 354 | ||||||
| Other income, related party |
— | — | 113 | ||||||
See accompanying notes to consolidated financial statements
39
Table of Contents
VERAZ NETWORKS, INC. AND SUBSIDIARIES
Consolidated Statements of Stockholders’ Equity
(In thousands, except share data)
| Redeemable Preferred Stock |
Convertible Preferred Stock |
Common Stock | Additional Paid-in Capital |
Deferred Stock-Based Compensation |
Accum. Other Comp. Gains |
Accumulated Deficit |
Total Stockholders’ Equity |
|||||||||||||||||||||||||||||||
| Shares | Amount | Shares | Amount | Shares | Amount | |||||||||||||||||||||||||||||||||
| Balance at December 31, 2006 |
14,000,049 | $ | 19,796 | 18,529,098 | $ | 44,745 | 13,789,287 | $ | 14 | $ | 6,975 | $ | (690 | ) | — | $ | (59,606 | ) | $ | (53,307 | ) | |||||||||||||||||
| Exercise of stock options |
— | — | — | — | 1,001,461 | 1 | 629 | — | — | — | 630 | |||||||||||||||||||||||||||
| Issuance of Series D convertible preferred stock, net of issuance cost of $37 |
— | — | 527,355 | 3,412 | — | — | — | — | — | — | — | |||||||||||||||||||||||||||
| Cashless exercise of warrant to purchase Series C convertible preferred stock |
— | — | 12,744 | — | — | — | — | — | — | — | — | |||||||||||||||||||||||||||
| Redemption of redeemable preferred stock |
(14,000,049 | ) | (19,796 | ) | — | — | — | — | 19,782 | — | — | — | 19,782 | |||||||||||||||||||||||||
| Conversion of Series C convertible preferred stock |
— | — | (17,545,246 | ) | (38,283 | ) | 17,545,246 | 17 | 38,266 | — | — | — | 38,283 | |||||||||||||||||||||||||
| Deemed dividend on Series D convertible preferred stock |
— | — | — | 5,980 | — | — | (5,980 | ) | — | — | — | (5,980 | ) | |||||||||||||||||||||||||
| Conversion of Series D convertible preferred stock |
— | — | (1,523,951 | ) | (15,854 | ) | 1,993,325 | 2 | 15,852 | — | — | — | 15,854 | |||||||||||||||||||||||||
| Issuance of common stock in IPO (net of issuance cost of $7,384) |
— | — | — | — | 6,750,000 | 7 | 46,609 | — | — | — | 46,616 | |||||||||||||||||||||||||||
| Stock-based compensation in connection with stock options granted to employees |
— | — | — | — | — | — | 1,641 | — | — | — | 1,641 | |||||||||||||||||||||||||||
| Stock-based compensation in connection with restricted stock units granted to employees |
— | — | — | — | — | — | 267 | — | — | — | 267 | |||||||||||||||||||||||||||
| Stock-based compensation in connection with restricted stock issued to employees |
— | — | — | — | 10,000 | — | 62 | — | — | — | 62 | |||||||||||||||||||||||||||
| Reversal of deferred stock-based compensation upon employee terminations |
— | — | — | — | — | — | (22 | ) | 22 | — | — | — | ||||||||||||||||||||||||||
| Amortization of deferred stock-based compensation expense |
— | — | — | — | — | — | — | 316 | — | — | 316 | |||||||||||||||||||||||||||
| Release of shares of common stock upon vesting of restricted stock units |
— | — | — | — | 11,140 | — | — | — | — | — | — | |||||||||||||||||||||||||||
| Net income |
— | — | — | — | — | — | — | — | — | 3,376 | 3,376 | |||||||||||||||||||||||||||
| Balance at December 31, 2007 |
— | — | — | — | 41,100,459 | 41 | 124,081 | (352 | ) | — | (56,230 | ) | 67,540 | |||||||||||||||||||||||||
| Exercise of stock options |
— | — | — | — | 1,571,299 | 2 | 742 | — | — | — | 744 | |||||||||||||||||||||||||||
| Release of shares of common stock upon vesting of restricted stock units |
— | — | — | — | 183,288 | — | — | — | — | — | — | |||||||||||||||||||||||||||
| Stock-based compensation in connection with stock options granted to employees |
— | — | — | — | — | — | 1,563 | — | — | — | 1,563 | |||||||||||||||||||||||||||
| Stock-based compensation in connection with restricted stock units granted to employees |
— | — | — | — | — | — | 2,657 | — | — | — | 2,657 | |||||||||||||||||||||||||||
| Reversal of deferred stock-based compensation upon employee terminations |
— | — | — | — | — | — | (8 | ) | 8 | — | — | — | ||||||||||||||||||||||||||
| Amortization of deferred stock-based compensation expense |
— | — | — | — | — | — | — | 312 | — | — | 312 | |||||||||||||||||||||||||||
| Comprehensive income (loss): |
||||||||||||||||||||||||||||||||||||||
| Net loss |
— | — | — | — | — | — | — | — | — | (20,960 | ) | (20,960 | ) | |||||||||||||||||||||||||
| Other comprehensive income: |
||||||||||||||||||||||||||||||||||||||
| Foreign currency translation adjustments |
— | — | — | — | — | — | — | — | 268 | — | 268 | |||||||||||||||||||||||||||
| Total other comprehensive income |
268 | |||||||||||||||||||||||||||||||||||||
| Total comprehensive loss |
(20,692 | ) | ||||||||||||||||||||||||||||||||||||
| Balance at December 31, 2008 |
— | $ | — | — | $ | — | 42,855,046 | 43 | 129,035 | (32 | ) | 268 | (77,190 | ) | 52,124 | |||||||||||||||||||||||
| Exercise of stock options |
— | — | — | — | 148,537 | 1 | 76 | — | — | — | 77 | |||||||||||||||||||||||||||
| Release of shares of common stock upon vesting of restricted stock units |
— | — | — | — | 682,219 | — | — | — | — | — | — | |||||||||||||||||||||||||||
| Stock-based compensation in connection with stock options granted to employees |
— | — | — | — | — | — | 1,271 | — | — | — | 1,271 | |||||||||||||||||||||||||||
| Stock-based compensation in connection with restricted stock units granted to employees |
— | — | — | — | — | — | 2,702 | — | — | — | 2,702 | |||||||||||||||||||||||||||
| Amortization of deferred stock-based compensation expense |
— | — | — | — | — | — | — | 32 | — | — | 32 | |||||||||||||||||||||||||||
| Comprehensive income (loss): |
||||||||||||||||||||||||||||||||||||||
| Net loss |
— | — | — | — | — | — | — | — | — | (11,621 | ) | (11,621 | ) | |||||||||||||||||||||||||
| Other comprehensive income: |
||||||||||||||||||||||||||||||||||||||
| Foreign currency translation adjustments |
— | — | — | — | — | — | — | — | 1,853 | — | 1,853 | |||||||||||||||||||||||||||
| Net unrealized gains on investments |
— | — | — | — | — | — | — | — | 3 | — | 3 | |||||||||||||||||||||||||||
| Total other comprehensive income |
1,856 | |||||||||||||||||||||||||||||||||||||
| Total comprehensive loss |
(9,765 | ) | ||||||||||||||||||||||||||||||||||||
| Balance at December 31, 2009 |
— | $ | — | — | $ | — | 43,685,802 | $ | 44 | $ | 133,084 | — | $ | 2,124 | $ | (88,811 | ) | $ | 46,441 | |||||||||||||||||||
See accompanying notes to consolidated financial statements
40
Table of Contents
VERAZ NETWORKS, INC. AND SUBSIDIARIES
Consolidated Statements of Cash Flows
(In thousands)
| Years Ended December 31, | ||||||||||||
| 2009 | 2008 | 2007 | ||||||||||
| Cash flows from operating activities: |
||||||||||||
| Net income (loss) |
$ | (11,621 | ) | $ | (20,960 | ) | $ | 3,376 | ||||
| Adjustments to reconcile net loss to net cash used in operating activities: |
||||||||||||
| Depreciation and amortization |
2,573 | 3,379 | 3,691 | |||||||||
| Stock-based compensation |
4,005 | 4,532 | 2,286 | |||||||||
| Loss on disposal of assets |
— | 114 | — | |||||||||
| Provision (release) for doubtful accounts |
(175 | ) | 1,460 | 97 | ||||||||
| Amortization of debt issuance cost |
— | 171 | 433 | |||||||||
| Deferred income taxes |
1,237 | (735 | ) | (502 | ) | |||||||
| Non-cash restructuring charges |
(39 | ) | 193 | — | ||||||||
| Foreign currency exchange gains |
(368 | ) | — | — | ||||||||
| Net changes in operating assets and liabilities: |
||||||||||||
| Accounts receivable |
4,402 | 7,688 | (36,050 | ) | ||||||||
| Sold accounts receivable |
— | — | 19,635 | |||||||||
| Inventories |
4,286 | (2,779 | ) | 4,698 | ||||||||
| Prepaid expenses and other current assets |
1,170 | 1,504 | (5,698 | ) | ||||||||
| Due from related parties |
226 | (226 | ) | 766 | ||||||||
| Accounts payable |
455 | (5,517 | ) | 3,973 | ||||||||
| Accrued expenses |
(1,547 | ) | (3,779 | ) | 1,300 | |||||||
| Income tax payable |
786 | 135 | (39 | ) | ||||||||
| Deferred revenue |
(4,313 | ) | 2,823 | (13,174 | ) | |||||||
| Due to related parties |
(5,553 | ) | (3,768 | ) | 2,464 | |||||||
| Net cash used in operating activities |
(4,476 | ) | (15,765 | ) | (12,744 | ) | ||||||
| Cash flows from investing activities: |
||||||||||||
| Restricted cash |
(4 | ) | 6 | (110 | ) | |||||||
| Maturities and sales of short-term investments |
18,976 | 12,287 | 4,732 | |||||||||
| Purchases of short-term investments |
(24,226 | ) | (9,577 | ) | (10,086 | ) | ||||||
| Maturities and sales of long-term investment |
2,858 | — | — | |||||||||
| Purchases of long-term investment |
(2,811 | ) | — | — | ||||||||
| Purchases of property and equipment |
(972 | ) | (1,485 | ) | (3,201 | ) | ||||||
| Other assets |
(66 | ) | (5 | ) | 55 | |||||||
| Net cash provided by (used in) investing activities |
(6,245 | ) | 1,226 | (8,610 | ) | |||||||
| Cash flows from financing activities: |
||||||||||||
| Proceeds from the exercise of stock options |
76 | 744 | 630 | |||||||||
| Proceeds from sale of common stock in connection with the Company’s initial public offering |
— | — | 54,000 | |||||||||
| Payment of underwriting discounts and other offering costs |
— | — | (5,921 | ) | ||||||||
| Proceeds from issuance of Series D convertible preferred stock |
— | — | 3,449 | |||||||||
| Issuance cost for Series D convertible preferred stock |
— | — | (37 | ) | ||||||||
| Redemption of redeemable preferred stock |
— | — | (14 | ) | ||||||||
| Repayment of borrowings |
— | (3,317 | ) | (1,710 | ) | |||||||
| Net cash provided by (used in) financing activities |
76 | (2,573 | ) | 50,397 | ||||||||
| Effect of exchange rate changes on cash and cash equivalents |
352 | 268 | — | |||||||||
| Net increase (decrease) in cash and cash equivalents |
(10,293 | ) | (16,844 | ) | 29,043 | |||||||
| Cash and cash equivalents at beginning of year |
35,388 | 52,232 | 23,189 | |||||||||
| Cash and cash equivalents at end of year |
$ | 25,095 | $ | 35,388 | $ | 52,232 | ||||||
| Supplemental disclosure of cash flow information: |
||||||||||||
| Cash paid: |
||||||||||||
| Interest |
$ | 62 | $ | 306 | $ | 376 | ||||||
| Income taxes |
$ | 696 | $ | 588 | $ | 944 | ||||||
| Noncash financing activities: |
||||||||||||
| Deemed dividend on Series D convertible preferred stock |
$ | — | $ | — | $ | 5,980 | ||||||
See accompanying notes to consolidated financial statements
41
Table of Contents
VERAZ NETWORKS, INC. AND SUBSIDIARIES
Notes to Consolidated Financial Statements
Note 1 – The Company
Veraz Networks, Inc., or the Company was incorporated under the laws of the State of Delaware on October 18, 2001. The Company is a provider of voice infrastructure solutions to established and emerging wireline and wireless service providers. Service providers use the products to transport, convert and manage voice traffic over both legacy Time-Division Multiplexing, or TDM and Internet Protocol, or IP networks, while enabling voice over IP, or VoIP, and other multimedia services. The Company’s ControlSwitch softswitch solution and I-Gate 4000 family of media gateway products, enable service providers to deploy IP networks and efficiently migrate from their legacy circuit-switched networks to IP networks.
In April 2007, the Company completed its Initial Public Offering, or IPO of common stock in which the Company sold and issued 6,750,000 shares of the Company’s common stock at an issue price of $8.00 per share. In addition, ECI sold 2,250,000 shares of Company’s common stock in the offering after which ECI Telecom’s ownership in the Company decreased to approximately 27%. The Company raised a total of $54.0 million in gross proceeds from the IPO, or $46.6 million in net proceeds after deducting underwriting discounts and commissions of $3.8 million and other offering costs of $3.6 million. Upon the closing of the IPO, all shares of Series C and Series D convertible preferred stock outstanding automatically converted into 19,538,571 shares of common stock, and all shares of redeemable preferred stock were redeemed for the par value of $0.001 per share, or an aggregate of $14,000. The conversion of the Series D convertible preferred stock resulted in a deemed dividend in the aggregate amount of approximately $6.0 million. The amount of deemed dividend decreased the net income attributable to common stockholders in 2007. At December 31, 2009, ECI Telecom held approximately 25% of the Company’s outstanding common stock.
Note 2 – Summary of Significant Accounting Policies
The significant accounting policies of the Company are as follows:
(a) Principles of Consolidation
The consolidated financial statements include the accounts of Veraz Networks, Inc. and its wholly-owned subsidiaries. All significant intercompany balances and transactions have been eliminated in consolidation.
(b) Use of Estimates
The preparation of consolidated financial statements in conformity with accounting principles generally accepted in the United States requires management to make estimates and assumptions about future events. These estimates and the underlying assumptions affect the amounts of assets and liabilities reported, disclosures about contingent assets and liabilities, and reported amounts of revenues and expenses. Such estimates include the valuation of accounts receivable, inventories, and deferred tax assets, among others. These estimates and assumptions are based on management’s best estimates and judgment. Management evaluates its estimates and assumptions on an ongoing basis using historical experience and other factors, including the current economic environment, which management believes to be reasonable under the circumstances. The Company adjusts such estimates and assumptions when facts and circumstances dictate. Illiquid credit markets, volatile equity, foreign currency, and energy markets, and declines in consumer spending have combined to increase the uncertainty inherent in such estimates and assumptions. As future events and their effects cannot be determined with precision, actual results could differ significantly from these estimates. Changes in those estimates resulting from continuing changes in the economic environment will be reflected in the financial statements in future periods.
(c) Basis of Presentation
During 2009, revenues and cost of sales each included an additional $0.1 million and other income (expense), net included an additional expense of $0.4 million resulting from the correction of a prior period errors. The Company determined that the amounts were immaterial to the full fiscal year results.
(d) Cash and Cash Equivalents
The Company considers all highly liquid investments purchased with an original or remaining maturity of three months or less at the date of purchase to be cash equivalents. Cash and cash equivalents are maintained with several high credit quality financial institutions.
42
Table of Contents
VERAZ NETWORKS, INC. AND SUBSIDIARIES
Notes to Consolidated Financial Statements—(Continued)
Fair Value of Financial Instruments
The carrying amounts of cash equivalents and accounts receivable approximate fair value because of their generally short maturities. For cash equivalents and short-term securities, the estimated fair values are based on market prices.
(e) Restricted Cash
Restricted cash represents collateral securing guarantee arrangements with banks. The amounts expire upon achievement of certain agreed objectives, typically customer acceptance of the product, completion of installation and commissioning services, or expiration of the term of the product warranty or maintenance period.
(f) Investments
The Company invests in short-term investments. The short-term investments are debt and marketable equity securities and are classified as available-for-sale. Available-for-sale securities are carried at fair value with the unrealized gains and losses, net of tax, reported in stockholders’ equity as a component of accumulated other comprehensive income (loss). Unrealized losses considered to be other than temporary are recognized in current earnings. Realized gains and losses on sales of available-for-sale securities are computed based upon initial cost adjusted for any other-than-temporary declines in fair value. Gains or losses on securities sold are based on the specific identification method.
(g) Inventories
Inventories are stated at the lower of cost or market on a first-in, first-out basis. The Company periodically reviews its inventories and reduces the carrying value to the estimated market value, if lower, based upon assumptions about future demand and market conditions.
When the Company’s products have been shipped, but not yet installed or accepted, the revenue associated with the product has been deferred as a result of not meeting the revenue recognition criteria for delivery (see Note 2(i)). During the period between product shipment and acceptance, the Company recognizes all labor-related expenses as incurred but defers the cost of the related equipment and classifies the deferred costs as “Work in process at customers’ locations” within the inventories line item (see Note 3). These deferred costs are then expensed in the same period that the deferred revenue is recognized as revenue (generally upon customer acceptance). In arrangements for which revenue recognition is limited to amounts due and payable, or of cash received, all related inventory costs are expensed at the date of customer acceptance.
(h) Concentrations
Cash and cash equivalents are maintained with several financial institutions. Deposits held with banks may exceed the amount of insurance provided on such deposits. Generally, these deposits may be redeemed upon demand and therefore bear minimal risk.
Declining business and consumer confidence have resulted in an economic slowdown and a global recession. Continuing market upheavals, including specifically the lack of credit currently available in the market, may have an adverse effect on the Company due to its dependence on capital budgets and customer confidence and customer dependence on obtaining credit to finance purchases of the products. The revenues are likely to decline in such circumstances. Factors such as business investment, the volatility and strength of the capital markets all affect the business and economic environment and, ultimately, the amount and profitability of the business. In an economic slowdown characterized by lower corporate earnings, lower business investment, fewer options to obtain credit, the demand for the Company’s products could be adversely affected. Adverse changes in the economy could affect earnings negatively and could have a material adverse effect on the business, results of operations and financial condition.
The Company performs credit evaluations of its customers and, with the exception of certain financing transactions, does not require collateral from its customers. However, when the Company uses integrators or resellers affiliated with ECI Telecom, a related party, from time to time, prior to fulfillment of the Company’s order for a particular customer, ECI Telecom has requested that the Company obtain either a letter of credit or accounts receivable insurance to mitigate any collection risk (see Note 5).
Pursuant to a master manufacturing and master agreement with ECI Telecom, a related party, the Company derives a portion of its revenues from sales of its line of voice compression telecommunications products, or DCME, products (4%, 9%, and 19% of revenues during 2009, 2008, and 2007, respectively) and related services (4%, 5%, and 5% of revenues during 2009, 2008, and 2007, respectively).
43
Table of Contents
VERAZ NETWORKS, INC. AND SUBSIDIARIES
Notes to Consolidated Financial Statements—(Continued)
The Company receives certain of its components from other sole suppliers. Additionally, the Company relies on a limited number of contract manufacturers to provide manufacturing services for its products. The inability of any contract manufacturer, supplier or ECI Telecom to fulfill supply requirements of the Company could materially impact the Company’s future operating results.
The substantial majority of the manufacturing of the Company’s hardware products occurs in Israel. In addition, a significant portion of the Company’s operations are located in Israel, which includes the Company’s entire media gateway research and development team. The continued threat of terrorist activity or other acts of war or hostility against Israel have created uncertainty throughout the Middle East. To the extent this results in a disruption of the Company’s operations or delays of its manufacturing capabilities or shipments of its products, then the Company’s business, operating results and financial condition could be adversely affected.
In 2009, 2008, and 2007, all our customers are concentrated within the telecom industry and no customer contributed to 10% or more of the Company’s revenue. As of December 31, 2009, one of the Company’s customer, TIM Cellular S.A, contributed to 10% or more of the Company’s accounts receivable. As of December 31, 2008 and 2007, no customer contributed to 10% or more of the Company’s accounts receivable. To date, the Company has not experienced credit issues with TIM Cellular S.A.
(i) Revenue Recognition
DCME product revenues consist of revenues from the sale of the DCME hardware products. IP product revenues consists of revenues from the sale of the I-Gate 4000 family of media gateway hardware products, the ControlSwitch family of softswitch modules, licensing of source code and the Secure Communications Software. Services revenue consists of revenues from separately priced maintenance and extended warranty contracts, post-contract customer support, or PCS, installation training and other professional services.
Based on the revenue recognition guidelines, revenue should not be recognized until it is realized or realizable and earned pursuant to the criteria discussed below. Generally, revenue from standalone sales of DCME products is recognized upon shipment of products and transfer of title. When sales of DCME are bundled with installation services, the hardware and services are accounted as separate units of accounting as the deliverables meet the separation criteria. Revenue for each deliverable is recognized upon the shipment of products for hardware and software and completion of services.
All of the Company’s IP products may be sold in bundled arrangements that include PCS, installation, training, and other professional services. The Company’s media gateway hardware, when sold in a bundled arrangement, is referred to as a static trunking solution, and when sold in a bundled arrangement that includes the Company’s softswitch module software is referred to as a VoIP solution. When the Company’s Secure Communications Software is sold in a bundled arrangement with DCME hardware, it is referred to as a Secure Communications solution. In sales of static trunking solutions, VoIP solutions or Secure Communications solutions, the software is considered more than incidental to the arrangement and essential to the functionality of the hardware.
The Company recognizes revenue when all of the following criteria are met: (i) persuasive evidence of an arrangement exists, (ii) delivery has occurred, (iii) the fee is fixed or determinable, and (iv) collectibility is probable. The Company evaluates each of the four criteria as follows:
(i) Persuasive evidence of an arrangement exists
The Company’s customary practice is to have a written contract, which is signed by both the customer and the Company, or a purchase order or other written or electronic order documentation for those customers who have previously negotiated a standard arrangement with the Company.
(ii) Delivery has occurred
Delivery of hardware and software products generally occurs at the point of shipment when title and risk of loss have passed to the customer. However, initial VoIP solution arrangements typically require evidence of customer acceptance of the implementation of the VoIP solution in the customer’s network, including the ability of the network to carry live data traffic. As a result, delivery of the software, hardware and services is not considered to have occurred until evidence of acceptance is received from the customer on the initial VOIP solution arrangement or the Company has completed its contractual requirements. Historically, the Company has successfully implemented all subsequent sales of VOIP solutions. Accordingly, as of the beginning of January 2009, revenue recognition on subsequent sales of VOIP solutions after the initial arrangement has been accepted from the customer typically occurs
44
Table of Contents
VERAZ NETWORKS, INC. AND SUBSIDIARIES
Notes to Consolidated Financial Statements—(Continued)
at the time of shipment when title and risk of loss have passed to the customer since the additional equipment is merely an expansion of the customer’s already existing working network. The revenue impact related to recognizing revenue on subsequent sales of VOIP solutions before acceptance on the financial statements for the year ended December 31, 2009 was $0.2 million.
Revenue from sales of standalone services, including training courses, is recognized when the services are completed.
(iii) The fee is fixed or determinable
The Company does not offer a right of return to its customers. Arrangement fees are generally due within one year or less from date of acceptance, or the date of delivery if no acceptance, if required. Some arrangements may have payment terms extending beyond these customary payment terms and therefore the arrangement fees are considered not to be fixed or determinable. For multiple element arrangements with payment terms that are considered not to be fixed or determinable, revenue is recognized equal to the cumulative amount due and payable after allocating a portion of the cumulative amount due and payable to any undelivered elements (generally PCS) based on vendor specific objective evidence, or VSOE, after delivery and acceptance of the software, hardware, and services, and assuming all other revenue recognition criteria are satisfied. The Company defers the cost of inventory when products have been shipped, but have not yet been installed or accepted, and expenses those costs in full in the same period that the deferred revenue is recognized as revenue (generally upon customer acceptance). In arrangements for which IP revenue recognition is limited to amounts due and payable, all related inventory costs are expensed at the date of acceptance; this will initially result in lower or negative product margins and cause higher margins in subsequent periods, as compared to similar arrangements with customary payment terms.
The Company sells its products through its direct sales force and channel partners. For products sold through indirect channels, revenue is recognized either on a sell-in basis or when the channel partner sells the product to the end user, depending on the Company’s experience with the individual channel partner.
(iv) Collectibility is probable
Collectibility is assessed on a customer-by-customer basis. The Company evaluates the financial position, payment history, and ability to pay of new customers, and of existing customers that substantially expand their commitments. If it is determined prior to revenue recognition that collectibility is not probable, recognition of the revenue is deferred and recognized upon receipt of cash, assuming all other revenue recognition criteria are satisfied. In arrangements for which IP revenue recognition is limited to amounts of cash received, all related inventory costs are expensed at the date of acceptance; this will initially result in lower or negative product margins and cause higher margins in subsequent periods, as compared to similar arrangements with customary payment terms.
For most arrangements, the Company has established VSOE for the related PCS based on stated renewal rates and installation services based on the price charged when the same element is sold separately. Accordingly, the Company generally allocates revenue in multiple element arrangements using the residual method. For arrangements in which the Company is unable to establish VSOE for its PCS, the entire arrangement fee is deferred and recognized ratably over the PCS term after delivery.
Revenues are recognized net of sales taxes. Revenues include amounts billed to customers in sales transactions for shipping and handling. Shipping and handling fees represented less than 1% of revenues in each of 2009, 2008, and 2007. Shipping and handling costs are included in cost of revenues.
For purposes of classification in the consolidated statements of operations, revenue from sales of static trunking solutions, VoIP solutions, and Secure Communications solutions is allocated between DCME Products, IP Products and Services, as applicable, based on VSOE for any elements for which VSOE exists or based on the relative stated invoice amount for elements for which VSOE does not exist.
(j) Deferred Revenue
Deferred revenue represents fixed or determinable amounts billed to or collected from customers for which the related revenue has not been recognized because one or more of the revenue recognition criteria have not been met. The current portion of deferred revenues represents deferred revenue that is expected to be recognized as revenue within 12 months from the balance sheet date.
45
Table of Contents
VERAZ NETWORKS, INC. AND SUBSIDIARIES
Notes to Consolidated Financial Statements—(Continued)
(k) Property and Equipment
Property and equipment are stated at cost less accumulated depreciation. Depreciation is computed using the straight-line method over the estimated useful lives of the assets. Estimated useful lives used consist of three years for furniture, computer equipment, and related software, and five years for production, engineering, and other equipment. Depreciation of leasehold improvements is computed using the shorter of the remaining lease term or five years. The Company has leased its office buildings, equipments and cars and is considered operating leases.
(l) Impairment of Long-Lived Assets
Long-lived assets, such as property and equipment, and purchased intangible assets subject to amortization, are reviewed for impairment whenever events or changes in circumstances indicate that the carrying amount of an asset may not be recoverable. Recoverability of assets to be held and used is measured by a comparison of the carrying amount of an asset to estimated undiscounted future cash flows expected to be generated by the asset. If the carrying amount of an asset exceeds its estimated future cash flows, an impairment charge is recognized by the amount by which the carrying amount of the asset exceeds the fair value of the asset. Assets to be disposed of would be separately presented in the balance sheet and reported at the lower of the carrying amount or fair value less costs to sell, and are no longer depreciated. The assets and liabilities of a disposal group classified as held for sale would be presented separately in the appropriate asset and liability sections of the balance sheet.
(m) Advertising Costs
The Company expenses all advertising costs as incurred. The Company incurred $13,000, $24,000, and $37,000 in advertising costs in 2009, 2008, and 2007, respectively.
(n) Research and Development
Research and development expenses include payroll, employee benefits, equipment depreciation, materials, and other personnel-related costs associated with product development and are charged to expense as incurred.
(o) Government-Sponsored Research and Development
The Company records grants received from the Office of the Chief Scientist (“OCS”) of the Israeli Ministry of Industry, Trade, and Labor, or the OCS, as a reduction of research and development expenses on a monthly basis, based on the estimated reimbursable cost incurred. Royalties payable to the OCS are classified as cost of revenues.
(p) Foreign Currency Translation
For foreign subsidiaries using the U.S. dollar as their functional currency, transactions and monetary balances denominated in non-dollar currencies are remeasured into dollars using current exchange rates. Transaction gains or losses are recorded in other income (expense), net. For foreign subsidiaries using the local currency as their functional currency, assets and liabilities are translated at exchange rates in effect at the balance sheet date and income and expenses are translated at average exchange rates. The effect of these translation adjustments are reported as a separate component of stockholders’ equity.
(q) Foreign Currency Forward Contracts
The Company enters into forward foreign exchange contracts in which the counterparty is generally a bank. The Company purchases forward foreign exchange contracts to mitigate the risk of changes in foreign exchange rates on certain expenses denominated in New Israeli Shekels. Although the Company believes that these contracts are effective as hedges from an economic perspective, they do not qualify for hedge accounting. Any derivative that is either not designated as a hedge, or is so designated but is ineffective, is recorded at fair value and changes in fair value are recognized in other income (expense), net, as they are incurred. As of December 31, 2009, there were no outstanding forward contracts for the purchase of new Israeli shekels. Generally, the outstanding forward contracts have maturities of approximately one to nine months from the date into which they were entered and expire at or near the end of the month. During 2009, the benefit of the forward contracts recorded in other income (expense), net was a total of $0.6 million. During 2008 and 2007, the Company did not purchase any forward contracts.
46
Table of Contents
VERAZ NETWORKS, INC. AND SUBSIDIARIES
Notes to Consolidated Financial Statements—(Continued)
(r) Accounts Receivable and Allowance for Doubtful Accounts
Generally, the Company’s receivables are recorded when billed and represent claims against third parties that will be settled in cash. The carrying value of the receivables, net of the allowance for doubtful accounts, represents their estimated net realizable value.
The Company maintains an allowance for doubtful accounts for estimated losses resulting from the customers’ failure to make required payments. A judgment is required to determine whether an increase or reversal of the allowance is warranted. The Company will record an increase of the allowance if there is a deterioration in past due balances, if economic conditions are less favorable than we had anticipated, or for customer-specific circumstances, such as bankruptcy. The Company will record a reversal of the allowance if there is significant improvement in collection rates. Historically, the allowance has been adequate to cover the actual losses from uncollectible accounts.
Activity related to allowance for doubtful accounts consisted of the following (in thousands):
| Beginning Balance |
Charges (Reductions) to Operations |
(Recoveries/) Write-Offs |
Ending Balance | ||||||||||
| Accounts receivable allowances: |
|||||||||||||
| Year ended December 31, 2009 |
$ | 1,459 | $ | 438 | $ | (646 | ) | $ | 1,251 | ||||
| Year ended December 31, 2008 |
$ | 151 | 1,460 | (152 | ) | $ | 1,459 | ||||||
| Year ended December 31, 2007 |
$ | 183 | 97 | (129 | ) | $ | 151 | ||||||
During the year ended December 31, 2009, the Company recovered $0.7 million of collections of accounts receivable in which an allowance had been established in 2008, off-set by additional write-offs.
(s) Income Taxes
The Company accounts for income taxes using the asset and liability approach, which requires the recognition of taxes payable or refundable for the current year and deferred tax liabilities and assets for the future tax consequences of events that have been recognized in the Company’s financial statements or tax returns. The measurement of current and deferred tax liabilities and assets are based on provisions of the enacted tax law. Valuation allowances are established when necessary to reduce deferred tax assets to the amount expected to be more likely than not realized. During 2009, the Company performed an assessment of the realizability of the deferred tax assets for the operations in Israel. As a result of recent cumulative losses and uncertainty regarding future taxable income, the Company determined based on all available evidence, that there was substantial uncertainty as to the realizability of recorded net deferred tax assets in future periods.
The Company classifies interest and penalties related to uncertain tax contingencies as other expenses in the consolidated statement of operations. Income taxes payable are recorded whenever there is a difference between amounts reported by the Company in its tax returns and the amounts the Company believes it would likely pay in the event of an examination by the taxing authorities.
(t) Comprehensive Income (Loss)
Comprehensive income (loss) consists of two components, net income (loss) and other comprehensive income (loss). Other comprehensive income (loss) refers to revenue, expenses, gains and losses are recorded as an element of shareholders’ equity but are excluded from net income (loss). The Company’s other comprehensive income (loss) consists of foreign currency translation adjustments from those subsidiaries not using the U.S. dollar as their functional currency, unrealized gains and losses on marketable securities categorized as available-for-sale, and net deferred gains and losses on certain derivative instruments accounted for as cash flow hedges. For 2009 and 2008, the total other comprehensive income of $1.9 million and $0.3 million are included in the consolidated statements of shareholders’ equity. There was no significant difference between the Company’s net income and its total comprehensive income for the year ended December 31, 2007.
(u) Transfers of Financial Assets
For the year ended December 31, 2007, the Company sold its accounts receivable to financial institutions and transfer of financial assets should be accounted for as a sale. The underlying conditions are met for the transfer of financial assets to qualify for accounting as a sale. The transfers of financial assets are typically performed by the factoring of receivables to two financial institutions.
47
Table of Contents
VERAZ NETWORKS, INC. AND SUBSIDIARIES
Notes to Consolidated Financial Statements—(Continued)
(v) Stock-Based Compensation
Stock-based compensation cost is estimated at the grant date based on the award’s fair-value as calculated by the Black-Scholes option-pricing model and is recognized as expense on a straight-line basis over the requisite service period. This model requires various judgment-based assumptions including expected volatility, interest rates and expected option life. Significant changes in any of these assumptions could materially affect the fair value of stock-based awards granted in the future; specifically, any changes in assumptions for expected volatility and expected life significantly affect the grant date fair value. Changes in the expected dividend rate and expected risk-free rate of return do not significantly impact the calculation of fair value, and determining these inputs is not highly subjective. The expected term represents the period that stock-based awards are expected to be outstanding, giving consideration to the contractual terms of the stock-based awards, vesting schedules, and expectations of future employee behavior as influenced by changes to the terms of our stock-based awards. The Company determined the expected term in accordance with the “simplified method” for a plain vanilla employee stock option for which the value was estimated using a Black-Scholes formula. Under this approach, the expected term would be presumed to be the mid-point between the vesting date and the end of the contractual term. The use of this approach was permitted as we did not have sufficient historical exercise data to provide a reasonable basis upon which to estimate expected term due to the limited period of time its equity shares have been publicly traded. The computation of expected volatility is based on the historical and implied volatility of comparable companies from a representative peer group based on industry and market capitalization data.
(w) Recent Accounting Pronouncements
FASB Accounting Standards Codification
In June 2009, the Financial Accounting Standards Board, or FASB, issued the FASB Accounting Standards Codification, or the Codification, which provides authoritative guidance for GAAP. The Codification, which changes the referencing of financial standards, became effective for interim and annual periods ending on or after September 15, 2009. The Codification is now the single official source of authoritative U.S. GAAP (other than guidance issued by the SEC), superseding existing FASB, American Institute of Certified Public Accountants, Emerging Issues Task Force, or EITF, and related literature. Only one level of authoritative U.S. GAAP now exists. All other literature is considered non-authoritative. The Codification does not change U.S. GAAP. The Company adopted the Codification during the third quarter of 2009. The Codification did not have any impact on our consolidated financial statements or related footnotes.
Fair Value Measurements and Disclosures
In September 2006, the FASB issued authoritative guidance included in ASC 820, Fair Value Measurements and Disclosures (previously SFAS 157 Fair Value Measurements and FSP FAS 157-2 Effective Date of FASB Statement No. 157) for fair value measurements, which defines fair value, establishes a framework and gives guidance regarding the methods used for measuring fair value, and expands disclosures about fair value measurement. The Company adopted the guidance in the first quarter of 2009. The adoption of the guidance did not have a significant impact on the consolidated financial statements or related footnotes. In January 2010, the FASB issued an update in ASC 820, Fair Value Measurements and Disclosures: Improving Disclosures about Fair Value Measurements to amended standards that require additional disclosures about inputs and valuation techniques used to measure fair value for both recurring and nonrecurring fair value measurements using Level 2 and Level 3 inputs for fiscal years beginning after December 15, 2010. Additionally, these amended standards require presentation of disaggregated activity within the reconciliation for fair value measurements using significant unobservable inputs (Level 3), annual periods beginning after December 15, 2009. The Company does not expect these new standards to have significant impacts on the Company’s consolidated financial statements.
In August 2009, the FASB issued Accounting Standards Update, or ASU No. 2009-05—Fair Value Measurements and Disclosures (Topic 820): Measuring Liabilities at Fair Value. This update provides clarifications for the fair value measurement of liabilities in circumstances in which a quoted price in an active market for the identical liability is not available. The new guidance is effective for interim and annual periods beginning after August 27, 2009, and applies to all fair-value measurements of liabilities required by GAAP. No new fair-value measurements are required by the standard. The Company does not have long-term liabilities. The adoption of this statement did not have any material impact on the Company’s financial condition or operating results for the year ended December 31, 2009.
In June 2009, the FASB issued new guidance regarding accounting for transfers of financial assets that removes the scope exception from applying consolidations of variable interest entities. The guidance changes the requirements for recognizing financial assets and requires enhanced disclosures. The new requirements are effective for annual periods beginning after November 15, 2009,
48
Table of Contents
VERAZ NETWORKS, INC. AND SUBSIDIARIES
Notes to Consolidated Financial Statements—(Continued)
which is effective for the Company in the first quarter of 2010. The Company does not believe the adoption of the guidance will have a material impact on its consolidated financial statements.
In April 2009, the FASB issued authoritative guidance included in ASC 820, Fair Value Measurements and Disclosures (previously FSP FAS 157-4, Determining Fair Value When the Volume and Level of Activity for the Asset or Liability Have Significantly Decreased and Identifying Transactions That are not Orderly), for estimating fair value when the market activity for an asset or liability has declined significantly. The Company adopted the guidance in the second quarter of 2009. The adoption of the guidance did not have a significant impact on the consolidated financial statements or related footnotes.
In April 2009, the FASB issued authoritative fair value disclosure guidance included in ASC 825, Financial Instruments (previously FSP FAS 107-1 and APB 28-1, Interim Disclosures about Fair Value of Financial Instruments), for financial instruments. The guidance requires disclosures for interim reporting periods of publicly traded companies as well as in annual financial statements. The guidance also requires those disclosures in summarized financial information at interim reporting periods. The Company adopted the guidance in the second quarter of 2009. The adoption of the guidance did not have a significant impact on the consolidated financial statements or related footnotes.
Measurement of Other-Than-Temporary Impairments
Authoritative guidance included in ASC 320, Investments Debt and Equity Securities (previously FSP FAS 115-2 and FAS 124-2 Recognition and Presentation of Other-Than-Temporary Impairments) is intended to bring consistency to the timing of impairment recognition, and provide improved disclosures about the credit and noncredit components of impaired debt securities that are not expected to be sold. The guidance also requires interim disclosures regarding expected cash flows, credit losses, and an aging of securities with unrealized losses. The Company adopted the guidance in the second quarter of 2009. As of December 31, 2009, the unrealized losses were zero. The adoption of the statements did not have an impact on the Company’s financial condition or operating results.
Derivative Instruments and Hedging Activities
In March 2008, the FASB issued the FASB ASC 815, Derivative and Hedging (previously SFAS 161 Disclosures about Derivative Instruments and Hedging Activities). The guidance requires companies with derivative instruments to disclose information that should enable financial statement users to understand how and why a company uses derivative instruments, how derivative instruments and related hedged items are accounted for under the literature for derivative instruments and hedging activities, and how derivative instruments and related hedged items affect a Company’s financial position, financial performance and cash flows. The Company adopted the literature in the first quarter of 2009 and it requires enhanced disclosures, without a change to existing standards relative to measurement and recognition. The Company’s adoption of the literature did not have any effect on its earnings or financial position.
Business Combination
In December 2007, the FASB issued FASB ASC 805, Business Combinations (previously SFAS No. 141 (revised 2007), which establishes principles and requirements for how an acquirer recognizes and measures in its financial statements the identifiable assets acquired, the liabilities assumed, and any noncontrolling interest in the acquiree in a business combination. Under this guidance, an entity is required to recognize the assets acquired, liabilities assumed, contractual contingencies, and contingent consideration at their fair value on the acquisition date. The guidance further requires that acquisition-related costs be recognized separately from the acquisition and expensed as incurred; that restructuring costs generally be expensed in periods subsequent to the acquisition date; and that changes in accounting for deferred tax asset valuation allowances and acquired income tax uncertainties after the measurement period be recognized as a component of provision for taxes. In addition, acquired in-process research and development is capitalized as an intangible asset and amortized over its estimated useful life. The Company adopted the guidance in the first quarter of 2009.
Revenue Recognition
In October 2009, the FASB issued FASB Accounting Standards Update, or FASB ASU 2009-13—Revenue Recognition (Topic 605): Multiple-Deliverable Revenue Arrangements—a consensus of the FASB Emerging Issues Task Force, or ASU 2009-13. ASU 2009-13 addresses how to measure and allocate arrangement consideration to one or more units of accounting within a multiple-deliverable arrangement. The new guidance states that if vendor specific objective evidence or third party evidence for deliverables in
49
Table of Contents
VERAZ NETWORKS, INC. AND SUBSIDIARIES
Notes to Consolidated Financial Statements—(Continued)
an arrangement cannot be determined, companies will be required to develop a best estimate of the selling price to separate deliverables and allocate arrangement consideration using the relative selling price method. The Company will adopt the accounting guidance prospectively and will become effective during the first quarter of 2011. Early adoption is allowed. The Company is currently evaluating the impact of this accounting guidance on its consolidated financial statements.
In October 2009, the FASB issued ASU No. 2009-14—Software (Topic 985): Certain Revenue Arrangements That Include Software Elements—a consensus of the FASB Emerging Issues Task Force, or ASU 2009-14. Previously, companies that sold tangible products with more than incidental software were required to apply software revenue recognition guidance. This guidance often delayed revenue recognition for the delivery of the tangible product. Under the new guidance, tangible products that have software components that are “essential to the functionality” of the tangible product will be excluded from the software revenue recognition guidance. The new guidance will include factors to help companies determine what is essential to the functionality. Software-enabled products will now be subject to other revenue guidance and will likely follow the guidance for multiple deliverable arrangements issued by the FASB in September 2009. The Company will apply the new guidance on a prospective basis for revenue arrangements entered into or materially modified in fiscal years beginning on or after June 15, 2010 and will become effective during the first quarter of 2011. Early application is permitted. The Company is currently evaluating the impact of this accounting guidance on its consolidated financial statements.
Note 3 – Balance Sheet Components
The following tables provide details of selected balance sheet items as of December 31, 2009 and 2008 (in thousands):
| December 31, | ||||||||
| 2009 | 2008 | |||||||
| Inventories: |
||||||||
| Finished products |
$ | 2,600 | $ | 4,217 | ||||
| Work in process at customers locations |
2,424 | 5,060 | ||||||
| Raw material and components |
3,340 | 3,007 | ||||||
| $ | 8,364 | $ | 12,284 | |||||
| December 31, | ||||||||
| 2009 | 2008 | |||||||
| Property and equipment, net: |
||||||||
| Computer equipment and software |
$ | 11,811 | $ | 12,432 | ||||
| Production, engineering and other equipment |
9,450 | 9,597 | ||||||
| Furniture and fixtures |
598 | 524 | ||||||
| Leasehold improvements |
293 | 427 | ||||||
| 22,152 | 22,980 | |||||||
| Accumulated depreciation |
(19,003 | ) | (18,345 | ) | ||||
| $ | 3,149 | $ | 4,635 | |||||
Depreciation expense in 2009, 2008, and 2007 was $2.5 million, $3.4 million, and $3.7 million, respectively.
| December 31, | ||||||
| 2009 | 2008 | |||||
| Accrued expenses: |
||||||
| Accrued compensation and benefits |
$ | 5,844 | $ | 6,813 | ||
| Accrued agent commissions |
1,434 | 1,512 | ||||
| Accrued royalty expenses |
1,011 | 1,639 | ||||
| Other accrued expenses |
3,204 | 3,240 | ||||
| $ | 11,493 | $ | 13,204 | |||
50
Table of Contents
VERAZ NETWORKS, INC. AND SUBSIDIARIES
Notes to Consolidated Financial Statements—(Continued)
Note 4 – Cash, Cash Equivalents and Short-term Investments
Assets are measured and recorded at fair value on a recurring basis for cash, cash equivalents, and short-term available-for-sale securities, excluding accrued interest components, as presented on the Company’s consolidated balance sheets as of December 31, 2009 and 2008. A summary of cash equivalents and short-term available-for-sale securities as of December 31, 2009 and 2008 were as follows (in thousands):
| Security Description |
Percentage of holdings |
Amortized Cost |
Unrealized Gains (Losses) |
Fair Market Value | ||||||||
| 2009 |
||||||||||||
| Cash equivalents: |
||||||||||||
| Money market funds |
100 | % | $ | 11,423 | $ | — | $ | 11,423 | ||||
| Total cash and cash equivalents |
100 | % | $ | 11,423 | $ | — | $ | 11,423 | ||||
| Short-term investments: |
||||||||||||
| U.S. Treasury bills |
100 | % | $ | 7,896 | $ | 3 | $ | 7,899 | ||||
| Total short-term investments |
100 | % | $ | 7,896 | $ | 3 | $ | 7,899 | ||||
| 2008 |
||||||||||||
| Cash equivalents: |
||||||||||||
| Money market funds |
92 | % | $ | 20,918 | $ | — | $ | 20,918 | ||||
| U.S. Treasury bills |
8 | % | 1,700 | — | 1,700 | |||||||
| Total cash and cash equivalents |
100 | % | $ | 22,618 | $ | — | $ | 22,618 | ||||
| Short-term investments: |
||||||||||||
| U.S. Treasury bills |
100 | % | $ | 2,650 | $ | — | $ | 2,650 | ||||
| Total short-term investments |
100 | % | $ | 2,650 | $ | — | $ | 2,650 | ||||
Cash equivalents consist of instruments with remaining maturities of three months or less at the date of purchase.
Short-term investments held by the Company are debt securities classified as available-for-sale. The Company invests in publicly traded, highly liquid securities of entities with credit ratings of A, or better. Unrealized gains and losses, net of related income taxes, for available-for-sale securities are included as a separate component of stockholders’ equity. Contractual maturities of available-for-sale short-term securities at December 31, 2009 are due within 12 months.
For other-than-temporary impairments, the Company discloses the gross unrealized losses and fair value for those investments that were in an unrealized loss position and have been in a continuous loss position. As of December 31, 2009 and 2008, the gross unrealized losses were zero.
The before-tax net unrealized holding gains (losses) on available-for-sale investments that have been included in accumulated other comprehensive income (loss) and the before-tax net gains (losses) reclassified from accumulated other comprehensive income (loss) into earnings were immaterial for all periods presented.
Fair Value of Financial Instruments
The fair value guidance clarifies the definition of fair value as the price that would be received to sell an asset or paid to transfer a liability in an orderly transaction between market participants at the measurement date (exit price). The guidance classifies the inputs used to measure fair value into the following hierarchy:
| Level 1: |
Unadjusted quoted prices in active markets for identical assets or liabilities | |
| Level 2: |
Unadjusted quoted prices in active markets for similar assets or liabilities, unadjusted quoted prices for identical or similar assets or liabilities in markets that are not active, or inputs other than quoted prices that are observable for the assets or liability | |
| Level 3: |
Unobservable inputs for the asset or liability | |
51
Table of Contents
VERAZ NETWORKS, INC. AND SUBSIDIARIES
Notes to Consolidated Financial Statements—(Continued)
The Company’s portfolio manager utilizes a third party pricing services, Interactive Data Corporation, to determine the fair value of the Company’s short-term securities. The Company measures its fixed income and available-for-sale securities assets at fair value on a recurring basis and has determined that these financial assets were level 1 and level 2 in the fair value hierarchy. The following table sets forth the Company’s financial assets that were accounted for at fair value as of December 31, 2009 (in thousands):
| Fair Value at Reporting Date Using | ||||||||||||
| Total | Quoted prices in active markets for identical assets (Level 1) |
Significant other observable inputs (Level 2) |
Significant unobservable inputs (Level 3) | |||||||||
| Assets: |
||||||||||||
| Fixed income available-for-sale securities |
$ | 7,899 | $ | 7,899 | $ | — | $ | — | ||||
| Money market funds |
11,423 | 11,423 | — | — | ||||||||
| $ | 19,322 | $ | 19,322 | $ | — | $ | — | |||||
The fixed income available-for-sale securities are included in short-term investments in the consolidated balance sheet and consist of U.S. Treasury bills issued by the U.S. government.
Note 5 – Related Party Transactions
As a result of the acquisition of Veraz Networks Ltd. and Veraz Networks International in December 2002, at December 31, 2009 ECI Telecom held approximately 25% of the Company’s outstanding common stock. The Company is the exclusive worldwide distributor of the DCME line of products, or DCME, for ECI Telecom under the DCME Master Manufacturing and Distribution Agreement, or the DCME Agreement, which was executed in December 2002, and certain agreements relating to third party intellectual property and quality assurance and quality control services. Under the DCME Agreement, ECI Telecom manufactures or subcontracts the manufacture of all DCME equipment sold by the Company and also provides certain supply, service and warranty repairs. The DCME Agreement is automatically renewed for successive one-year periods unless earlier terminated and was renewed for the period ending December 31, 2009. The DCME Agreement may only be terminated by ECI Telecom in the event the Company projects DCME revenues of less than $1.0 million in a calendar year, the Company breaches a material provision of the agreement and fails to cure such breach within 30 days, or the Company becomes insolvent. As result of the DCME agreement with ECI Telecom, the Company does not currently have an independent ability to produce DCME products and has not entered into arrangements with any third party that would enable the Company to obtain DCME or similar products in the event that ECI Telecom ceases to provide DCME products to the Company. Should ECI Telecom become unable or unwilling to fulfill its obligations under the DCME Agreement for any reason or if the DCME Agreement is terminated, the Company will need to take remedial measures to manufacture DCME or similar products, which could be expensive, and if such efforts fail, the Company’s business would be materially harmed.
The Company pays ECI Telecom a purchase price for the DCME product that is computed as a percentage of revenue. The percentage of revenue that the Company pays has remained unchanged during years ended December 31, 2009 and 2008. From time to time, prior to fulfillment of the Company’s order for a particular customer, ECI Telecom has requested that the Company obtain either a letter of credit or accounts receivable insurance to mitigate any collection risk. Amounts recorded under this arrangement are included in DCME Products, costs of revenue in the consolidated statements of operations.
The Company historically also contracted with ECI Telecom for the use of certain of its European subsidiaries for selling and support activities, including for the use of office space and certain employee related expenses and other general administrative expenses. The Company recorded revenue related to sales to the subsidiaries either on a sell-in basis or when a binding sales agreement with an end-user has been made, depending on the Company’s experience with the individual integrator or reseller. Revenues generated from sales under these arrangements are included in DCME Product revenues, in the consolidated statements of operations, depending on the nature of the products sold. The Company also reimbursed these subsidiaries for certain operating expenses, such as local sales and marketing support. The Company also historically contracted with ECI Telecom and certain of its European subsidiaries for local support, technology and administrative services. The Company allocates such expenses between research and development, sales and marketing, and general and administrative, in the consolidated statements of operations. All such relationships (other than in Israel), however, have been terminated on April 30, 2009.
The Company had appointed ECI Telecom as an agent for selling IP and DCME products and services in Russia and other countries from the former Soviet Union. The Company compensated ECI Telecom for agent services in Russia by paying a commission based on sales. Further, the Company had appointed ECI 2005, an affiliate of ECI Telecom, as a partner to provide services directly to customers in Russia. Effective as of April 30, 2009, ECI Telecom and the Company mutually agreed to terminate the appointment of
52
Table of Contents
VERAZ NETWORKS, INC. AND SUBSIDIARIES
Notes to Consolidated Financial Statements—(Continued)
ECI Telecom as a selling agent and the appointment of ECI 2005 as partner to provide services. Following termination of the appointment of ECI Telecom as selling agent, the Company is still obligated to pay ECI Telecom agent fees related to certain specified accounts for any sales completed by October 31, 2009. At certain times, the Company’s Russian customers purchased installation, training and maintenance services from ECI 2005. To the extent ECI 2005 needed assistance in providing installation, training and maintenance services to its customers in Russia, these services were available from the Company. The Company also reimbursed ECI 2005 for the costs associated with the services activity. In November 2007, the Company entered into a sublease agreement with ECI 2005 for office space located in Moscow. The sublease term was for an eleven month period, and the monthly rent was equal to approximately $15,000. The sublease was extended and eventually terminated as of March 31, 2009. ECI 2005 rent was included in services and cost of revenues in the consolidated statements of operations for the year ended December 31, 2009, 2008, and 2007.
In January 2008, the Company entered into a sublease agreement with ECI Telecom that commenced on May 1, 2008 for office space of 5,950 square feet in Florida. The Company has the right to terminate this sublease on the date immediately preceding the fourth, sixth or eighth annual anniversary of the commencement date and the 12th anniversary if this sublease is extended pursuant to its terms. The monthly rent for this sublease is approximately $13,000. For the years ended December 31, 2009, 2008, and 2007, ECI Telecom rent is included in general and administrative expense in the consolidated statements of operations. Additionally, the Company entered into a consulting agreement with ECI Telecom for ECI Telecom personnel to provide certain logistical support services at the Florida facility but terminated that agreement effective as of June 30, 2009.
Effective June 30, 2009, the Company and ECI Telecom entered into a Settlement Agreement and General Release (Settlement Agreement) relating to a variety of outstanding commercial issues between the parties. The Settlement Agreement effected a mutual release of certain outstanding commercial issues and other claims as of the date of the Settlement Agreement. The Settlement Agreement did not materially impact the Company’s financial statements. The Company paid $2.1 million under the Settlement Agreement to ECI Telecom during 2009 to settle for liabilities recorded pursuant to the agreements described above.
Persistent Systems Pvt Ltd:
On October 1, 2003, the Company entered into a Contractor Agreement with Persistent Systems Pvt. Ltd., or Persistent. Under the Contractor Agreement, Persistent provided independent contract research and development employees located at Persistent’s facility in Pune, India. At the end of the initial two-year period of the Contractor Agreement, the Company exercised its option under the contract to convert some of the Persistent employees performing services under the Contractor Agreement into full-time employees of the Company. In May 2006, the Company entered into an addendum to the Contractor Agreement formalizing the transfer arrangements of certain employees of Persistent during the period ending in December 2006. In November of 2005, Promod Haque, the Company’s Chairman, joined the board of directors of Persistent when Norwest Venture Partners, with whom Mr. Haque is affiliated, made an equity investment in Persistent that resulted in Norwest Venture Partners owning greater than 10% of Persistent’s outstanding capital stock. In 2008, as part of the restructuring activity, the Company cancelled most of the contracted services with Persistent, but has retained some services for a limited transition period. During the years ended December 31, 2009 and 2008, the Company incurred related party research and development expenses owed to Persistent under the Contractor Agreement of $43,000 and $0.9 million, respectively. The Company had no related payable outstanding as of December 31, 2009. The Company had related party payables to Persistent of approximately $37,000 as of December 31, 2008.
Note 6 – Stock
(a) Preferred Stock
In January 2007, the Company completed the second closing of its Series D convertible preferred stock financing, whereby it raised $3.5 million in cash proceeds from the issuance of an additional 527,355 shares of Series D convertible preferred stock at $6.54 per share to existing shareholders.
Upon the closing of the IPO, all shares of redeemable preferred stock were redeemed for the par value of $0.001 per share, or an aggregate of $14,000, and all shares of Series C and Series D convertible preferred stock outstanding automatically converted into 19,538,571 shares of common stock. The conversion rate of the Series D convertible preferred stock equaled the quotient obtained by dividing the original issuance price of $6.54 by the product of the IPO price of a share of common stock multiplied by 62.5%. As a result of the beneficial conversion feature, the Company recorded, simultaneously with the closing of the Company’s IPO, a charge to net loss allocable to common stockholders of approximately $6.0 million related to the deemed dividend to the holders of Series D convertible preferred stock.
53
Table of Contents
VERAZ NETWORKS, INC. AND SUBSIDIARIES
Notes to Consolidated Financial Statements—(Continued)
As of December 31, 2009 and 2008, the Company had no redeemable or convertible preferred stock outstanding.
(b) Reverse Stock Split
On March 27, 2007, the Company effected a two-for-one (2:1) reverse split of its common stock, Series C convertible preferred stock and Series D convertible preferred stock. All references to shares in the consolidated financial statements and the accompanying notes, including but not limited to the number of shares and per share amounts, unless otherwise noted, have been adjusted to reflect the reverse stock split retroactively. Previously awarded options and warrants to purchase shares of the Company’s common stock and Series C convertible preferred stock have been also retroactively adjusted to reflect the reverse stock split.
Note 7 – Loan
On December 7, 2006, the Company secured a loan with a financial institution in the face amount of $5.0 million. The loan bears stated interest of 9.78% and is granted for a period of two years with the principal due in seventeen monthly installments commencing on July 1, 2007. During the period December 2006 through June 2007, the Company made monthly interest payments on the loan. The loan is secured by certain assets, principally equipment, of the Company. The loan agreement required the Company to pay the financial institution a loan commitment fee of $0.3 million and prepay interest of $75,000 for the period from the funding date through January 31, 2007. In addition, in connection with this transaction the Company sold a warrant to purchase 50,000 shares of Series C convertible preferred stock to the financial institution for $0.2 million. At the date of issuance the fair value of the warrant was estimated to be $0.4 million. The warrant was exercised in December 2006. The Company computed interest on the loan using the interest method. Based on the allocation of the net proceeds, between the loan and the warrant, the loan has an effective interest rate of approximately 19%. The loan does not contain financial covenants.
As of December 31, 2009 and 2008, the Company had paid all of the debt outstanding under the loan arrangement amounts.
The Company accounts for the imputed discount on the loan using the interest method with the difference between the present value and the face value treated as a discount and amortized as interest expense over the term of the loan.
Note 8 – Factoring
In 2009 and 2008, the Company did not sell trade receivables to financial institutions. In 2007, the Company sold trade receivables to financial institutions in a total amount of $19.6 million. Control and risk of those trade receivables were fully transferred and accounted for as a sale.
The agreements, pursuant to which the Company sells its trade receivables, are structured such that the Company (i) transfers the proprietary rights in the receivable from the Company to the financial institution; (ii) legally isolates the receivable from the Company’s other assets, and presumptively puts the receivable beyond the lawful reach of the Company and its creditors, even in bankruptcy or other receivership; (iii) confers on the financial institution the right to pledge or exchange the receivable; and (vi) eliminates the Company’s effective control over the receivable, in the sense that the Company is not entitled and shall not be obligated to repurchase the receivable other than in case of failure by the Company to fulfill its commercial obligation.
Note 9 – Restructuring Charges
On July 31, 2008, the Company announced that it planned to reduce its workforce by approximately 160 employees and contractors and consolidate certain operations across all organizations, primarily in the areas of research and development and services. These activities consist of severance costs, equipment write-downs and facilities consolidation. During the three months ended September 30, 2008, the Company incurred total restructuring charges of $0.8 million. During the year ended December 31, 2009, the Company released an accrual for $40,000 related to the restructuring charges, offset by an additional expenses of $39,000. All the balances were paid in full as of December 31, 2009.
Note 10 – Stockholders’ Equity and Stock-Based Compensation
In April 2007, the Company completed its IPO of common stock in which the Company sold and issued 6,750,000 shares of the Company’s common stock at an issue price of $8.00 per share for a total of $54.0 million in gross proceeds. After deducting underwriting discounts and commissions of $3.8 million and other offering costs of $3.6 million the net proceeds from the IPO amounted to $46.6 million.
54
Table of Contents
VERAZ NETWORKS, INC. AND SUBSIDIARIES
Notes to Consolidated Financial Statements—(Continued)
Employee Benefit Plans
The 2006 Equity Incentive Plan, or the 2006 Plan is a shareholder approved plan, which became effective in connection with the Company’s IPO. The 2006 Plan is intended as the successor to and continuation of the 2001 Equity Incentive Plan, or the 2001 Plan. The 2006 Plan provides for broad based grants to employees, directors and consultants. The 2006 Plan provides for the grant of the following stock awards: incentive stock options, or ISO, nonstatutory stock options, or NSO, restricted stock awards, restricted stock unit awards, stock appreciation rights, performance stock awards and other stock awards. Following the effective date of Company’s IPO, no additional stock awards were granted under the 2001 Plan and the shares that remained available for issuance pursuant to the exercise of options or settlement of stock awards under the 2001 Plan became available for issuance pursuant to stock awards granted under the 2006 Plan. Any shares subject to outstanding stock awards granted under the 2001 Plan that expire or terminate for any reason prior to exercise or settlement become available for issuance pursuant to stock awards granted under the 2006 Plan. All outstanding stock awards granted under the 2001 Plan are deemed to be stock awards granted pursuant to the 2006 Plan, but remain subject to the terms of the 2001 Plan with respect to which they were originally granted. All stock awards granted subsequent to the Company’s IPO are subject to the terms on the 2006 Plan.
Options granted to employees in Israel are done so pursuant to the Capital Gains Option for taxation of stock options granted to employees, in accordance with Section 102 (b)(2) of the Israel Income Tax Ordinance, so that stock options (or shares resulting from the exercise thereof) shall be taxed at a rate of 25% and the Company shall not be allowed a deduction for any expense resulting from such grants. Further, grantees are not entitled to sell shares received upon exercise prior to the lapse of two years from the end of the tax year in which the options were granted.
Through December 31, 2009, the Company had reserved 8,653,534 shares of common stock for issuance under the 2006 Plan. The share reserve under the 2006 Plan automatically increases on each January 1st, beginning in 2006 and continuing through January 1, 2016, by the lesser of 3% of the total number of shares of common stock outstanding as of December 31st of the preceding calendar year, or a number of shares determined by the board of directors, but not in excess of 3,000,000 shares. Options may be granted for periods of up to ten years and at prices equal to the estimated fair value of the shares on the date of grant, as determined by the board of directors, provided, however, that the exercise price of an ISO or NSO granted under the Plans shall not be less than 100% or 85% of the estimated fair value of the shares on the date of grant, respectively. Options granted generally become exercisable over a period of four years, based on continued employment, with 25% of the shares underlying such options vesting one year after the vesting commencement date and with the remaining 75% of the shares underlying such options vesting in equal monthly installments during the following three years. Options generally terminate three months following the end of a grantee’s continuous service to the Company.
55
Table of Contents
VERAZ NETWORKS, INC. AND SUBSIDIARIES
Notes to Consolidated Financial Statements—(Continued)
Stock Award Activity
A summary of the Company’s stock award activity and related information, not including the ECI Telecom related party, for the year ended December 31, 2009, 2008, and 2007 is set forth in the following table:
| Number of Shares Available for Grant |
Number of Options Outstanding |
Weighted Average Exercise Price |
Weighted Average Contractual Life (In Years) |
Aggregate Intrinsic Value | ||||||||||
| Balance at December 31, 2006 |
298,597 | 7,823,874 | $ | 1.12 | ||||||||||
| Authorized |
250,652 | — | — | |||||||||||
| Restricted stock units and Restricted stock granted |
(536,720 | ) | — | — | ||||||||||
| Restricted stock units forfeited |
14,225 | — | — | |||||||||||
| Options granted |
(265,750 | ) | 265,750 | $ | 8.34 | |||||||||
| Options exercised |
— | (1,001,461 | ) | $ | 0.63 | |||||||||
| Options cancelled and forfeited |
321,811 | (321,811 | ) | $ | 2.86 | |||||||||
| Balance at December 31, 2007 |
82,815 | 6,766,352 | $ | 1.39 | ||||||||||
| Authorized |
2,433,013 | — | — | |||||||||||
| Restricted stock units and Restricted stock granted |
(1,585,905 | ) | — | — | ||||||||||
| Restricted stock units forfeited |
289,608 | — | — | |||||||||||
| Options granted |
(1,475,000 | ) | 1,475,000 | $ | 1.48 | |||||||||
| Options exercised |
— | (1,571,299 | ) | $ | 0.47 | |||||||||
| Options cancelled and forfeited |
575,630 | (575,630 | ) | $ | 2.61 | |||||||||
| Balance at December 31, 2008 |
320,161 | 6,094,423 | $ | 1.54 | ||||||||||
| Authorized |
1,285,651 | — | — | |||||||||||
| Restricted stock units and Restricted stock granted |
(1,298,825 | ) | — | — | ||||||||||
| Restricted stock units forfeited |
76,862 | — | — | |||||||||||
| Options granted |
(100,000 | ) | 100,000 | $ | 0.82 | |||||||||
| Options exercised |
— | (148,537 | ) | $ | 0.37 | |||||||||
| Options cancelled and forfeited |
160,355 | (160,355 | ) | $ | 2.10 | |||||||||
| Balance at December 31, 2009 |
444,204 | 5,885,531 | $ | 1.54 | 5.78 | $ | 905,623 | |||||||
| Options vested and expected to vest at December 31, 2009 |
5,770,579 | $ | 1.54 | 5.73 | $ | 904,152 | ||||||||
| Options exercisable at December 31, 2009 |
4,712,613 | $ | 1.42 | 5.13 | $ | 894,518 | ||||||||
The total intrinsic value of options exercised was $52,000, $2.2 million, and $2.4 million during the years ended December 31, 2009, 2008, and 2007, respectively.
56
Table of Contents
VERAZ NETWORKS, INC. AND SUBSIDIARIES
Notes to Consolidated Financial Statements—(Continued)
The following table summarizes information about stock options outstanding, not including the ECI Telecom related party, as of December 31, 2009.
| Options Outstanding | Exercisable Options | |||||||||||
| Range of Exercise Price |
Number Outstanding |
Weighted- Average Remaining Contractual Life (in years) |
Weighted- Average Exercise Price |
Number Exercisable |
Weighted- Average Exercise Price | |||||||
| $0.30-$0.34 |
1,153,309 | 3.34 | $ | 0.31 | 1,153,309 | $ | 0.31 | |||||
| $0.35-$0.50 |
339,367 | 4.32 | $ | 0.50 | 339,367 | $ | 0.50 | |||||
| $0.51-$1.04 |
1,776,000 | 5.28 | $ | 1.03 | 1,690,580 | $ | 1.04 | |||||
| $1.05-$1.30 |
239,627 | 4.93 | $ | 1.19 | 239,627 | $ | 1.19 | |||||
| $1.31-$1.44 |
1,303,750 | 8.59 | $ | 1.44 | 440,409 | $ | 1.44 | |||||
| $1.45-$1.92 |
585,916 | 6.23 | $ | 1.74 | 479,229 | $ | 1.72 | |||||
| $1.93-$6.15 |
60,550 | 7.52 | $ | 5.83 | 39,001 | $ | 5.89 | |||||
| $6.16-$6.18 |
298,512 | 6.52 | $ | 6.18 | 239,957 | $ | 6.18 | |||||
| $6.19-$8.00 |
45,000 | 7.26 | $ | 8.00 | 30,000 | $ | 8.00 | |||||
| $8.01-$11.50 |
83,500 | 7.05 | $ | 11.50 | 61,134 | $ | 11.50 | |||||
| $0.30-$11.50 |
5,885,531 | 4,712,613 | ||||||||||
Unamortized compensation expense on stock based awards after January 1, 2006 is not included in deferred stock-based compensation. As of December 31, 2009, the balance of $1.8 million of total unrecognized compensation cost, related to non-vested stock options granted to employees and directors, is expected to be recognized over a weighted average period of approximately 2.5 years. As of December 31, 2009, the balance of $2.1 million of total unrecognized compensation cost, related to non-vested restricted stock units granted to employees and directors, is expected to be recognized over a weighted average period of approximately 2.5 years.
Stock-Based Compensation
Prior to January 1, 2006, the Company accounted for options granted to employees and directors using the intrinsic-value-based method and had adopted the disclosure only provisions using the minimum value method. During 2009, the Company amortized $32,000 of deferred stock-based compensation. During 2008 and 2007, the Company amortized annually $0.3 million of deferred stock-based compensation. During 2009, 2008, and 2007, the Company reversed zero, $9,000, and $22,000, respectively, of deferred stock-based compensation due to employee terminations. As of December 31, 2009 and 2008, the total unamortized deferred stock-based compensation was zero and $32,000, respectively.
Effective January 1, 2006, the Company adopted the fair value recognition using the prospective transition method, which requires the Company to recognize share-based payments only on new awards granted, and to awards modified, repurchased or cancelled, after the effective date. Under this transition method, total employee stock-based compensation expense recognized beginning January 1, 2006 is based on the following: (a) the grant-date fair value of stock option awards granted or modified after January 1, 2006; and (b) the balance of deferred stock-based compensation related to stock option awards granted prior to January 1, 2006, which was calculated using the intrinsic value method.
The following table summarizes the effects of stock-based compensation (in thousands):
| Years Ended December 31, | |||||||||
| 2009 | 2008 | 2007 | |||||||
| Cost of revenues |
$ | 986 | $ | 900 | $ | 473 | |||
| Research and development |
1,261 | 1,381 | 597 | ||||||
| Sales and marketing |
1,079 | 1,350 | 682 | ||||||
| General and administrative |
679 | 901 | 534 | ||||||
| Total stock-based compensation expense |
$ | 4,005 | $ | 4,532 | $ | 2,286 | |||
57
Table of Contents
VERAZ NETWORKS, INC. AND SUBSIDIARIES
Notes to Consolidated Financial Statements—(Continued)
Stock Options:
During 2009, 2008, and 2007, the Company granted the following stock options.
| Shares Granted |
Weighted average grant date fair value per share | ||||
| 2009 |
100,000 | $ | 0.49 | ||
| 2008 |
1,475,000 | $ | 0.93 | ||
| 2007 |
265,750 | $ | 5.75 | ||
In 2009, 2008, and 2007, the stock compensation expense on stock options, including deferred stock-based compensation, amounted to $1.3 million, $1.8 million, and $2.0 million, respectively.
The Company estimated the fair value of stock options granted using the Black-Scholes option-pricing model. This fair value is then amortized on a straight-line basis over the requisite service periods of the awards, which is generally the vesting period. The expected term represents the period that stock-based awards are expected to be outstanding, giving consideration to the contractual terms of the stock-based awards, vesting schedules and expectations of future employee behavior as influenced by changes to the terms of the Company’s stock-based awards. The expected term was determined using the “simplified method”. Under this approach, the expected term would be presumed to be the mid-point between the vesting date and the end of the contractual term. The use of this approach, with appropriate disclosure, was permitted for a plain vanilla employee stock option for which the value was estimated using a Black-Scholes formula.
Accordingly, the Company will continue to use the simplified method until it has enough historical experience to provide a reasonable estimate of expected term. The computation of expected volatility is based on the historical and implied volatility of comparable companies from a representative peer group based on industry and market capitalization data. Management makes an estimate of expected forfeitures and recognizes compensation costs only for those equity awards expected to vest. The interest rate for periods within the contractual life of the award was based on the U.S. Treasury yield curve in effect at the time of grant. The Company has not declared dividends to date.
During 2009, the Company granted 100,000 stock options. The following weighted average assumptions were used to value options granted during the years ended December 31, 2008 and 2007, respectively:
| Years Ended December 31, | |||||||||
| 2009 | 2008 | 2007 | |||||||
| Expected term (in years) |
6.06 | 6.06 | 6.24 | ||||||
| Risk-free interest rate |
3.06 | % | 3.40 | % | 4.66 | % | |||
| Volatility |
62 | % | 67 | % | 72 | % | |||
| Dividend yield |
— | — | — | ||||||
Restricted Stock Awards:
During 2009, 2008, and 2007, the Company granted the following restricted stock units, or RSUs.
| Years Ended |
Shares Granted |
Weighted average grant date fair value per share | |||
| 2009 |
1,298,825 | $ | 0.71 | ||
| 2008 |
1,585,905 | $ | 3.48 | ||
| 2007 |
536,720 | $ | 5.86 | ||
In 2009, 2008, and 2007, the compensation expense on restricted stock based awards amounted to $2.7 million, $2.7 million, and $0.3 million.
58
Table of Contents
VERAZ NETWORKS, INC. AND SUBSIDIARIES
Notes to Consolidated Financial Statements—(Continued)
Restricted stock activity as of December 31, 2009 and 2008 were as follows:
| Number of Shares |
Weighted Average Grant Date Fair Value | |||||
| Nonvested at December 31, 2006 |
— | — | ||||
| Granted |
536,720 | $ | 5.86 | |||
| Vested |
(21,140 | ) | $ | 5.92 | ||
| Forfeited or expired |
(14,225 | ) | $ | 6.02 | ||
| Nonvested at December 31, 2007 |
501,355 | $ | 5.85 | |||
| Granted |
1,585,905 | $ | 3.48 | |||
| Vested |
(181,622 | ) | $ | 4.94 | ||
| Forfeited or expired |
(289,608 | ) | $ | 5.15 | ||
| Nonvested at December 31, 2008 |
1,616,030 | $ | 3.75 | |||
| Granted |
1,298,825 | $ | 0.71 | |||
| Vested |
(683,885 | ) | $ | 3.91 | ||
| Forfeited or expired |
(76,862 | ) | $ | 3.47 | ||
| Nonvested at December 31, 2009 |
2,154,108 | $ | 1.88 | |||
As of December 31, 2009, 2,154,108 million shares of restricted stock based awards were outstanding and unvested, with an aggregate intrinsic value of $2.0 million. As of December 31, 2008, and 2007, aggregate intrinsic value of outstanding and unvested stock based awards were $0.7 million and $2.4 million. During the years ended December 31, 2009, 2008, and 2007, aggregate intrinsic value of vested restricted stock based awards was $0.5 million, $0.3 million, and $0.1 million, respectively.
Most of the RSUs vest over four years in equal installments on each of the first through fourth anniversaries of the vesting commencement date. Upon vesting, the RSUs will convert into an equivalent number of shares of common stock. The amount of the expense related to RSUs is based on the closing market price of the Company’s common stock on the date of grant and is amortized on a straight-line basis over the requisite service period.
Note 11 – Net Loss Allocable to Common Stockholders per Share
Net loss allocable to common stockholders per share is computed by dividing the net loss allocable to common stockholders by the weighted average number of shares of common stock outstanding. The Company has outstanding stock options and restricted stock units, which have not been included in the calculation of diluted net loss allocable to common stockholders per share because to do so would be anti-dilutive. As such, the numerator and the denominator used in computing both basic and diluted net loss allocable to common stockholders per share for each period are the same.
Basic and diluted net loss per share were calculated as follows (in thousands, except per share data):
| Years Ended December 31, | ||||||||||||
| 2009 | 2008 | 2007 | ||||||||||
| Numerator: |
||||||||||||
| Net loss allocable to common stockholders |
$ | (11,621 | ) | $ | (20,960 | ) | $ | (2,604 | ) | |||
| Denominator: |
||||||||||||
| Basic and diluted weighted-average shares: |
||||||||||||
| Weighted-average shares used in computing basic net loss per share |
43,424 | 42,034 | 33,917 | |||||||||
| Basic and diluted net loss per common share |
$ | (0.27 | ) | $ | (0.50 | ) | $ | (0.08 | ) | |||
| Dilutive shares excluded from net loss per share calculation |
4,706 | 2,630 | 5,453 | |||||||||
59
Table of Contents
VERAZ NETWORKS, INC. AND SUBSIDIARIES
Notes to Consolidated Financial Statements—(Continued)
Note 12 – Commitments and Contingencies
(a) Leases
The Company leases its facilities and certain vehicles under non-cancelable operating leases expiring on various dates through 2014. The following is a schedule by years of future minimum rental payments required under operating leases that have initial or remaining non-cancelable lease terms in excess of one year as of December 31, 2009 (in thousands):
| Years ending December 31, |
Amount | ||
| 2010 |
$ | 2,231 | |
| 2011 |
1,463 | ||
| 2012 |
304 | ||
| 2013 |
164 | ||
| Thereafter |
251 | ||
| Total |
$ | 4,413 | |
Amounts include the sublease obligation with ECI Telecom, a related party (see Note 5). Rent expense for all leases for the years ended December 31, 2009, 2008, and 2007 were approximately $2.7 million, $3.1 million, and $2.9 million, respectively.
(b) Office of the Chief Scientist Grants
Veraz Networks Ltd’s research and development efforts, including efforts prior to its acquisition by the Company on December 31, 2002, have been partially financed through grants from the OCS. In return for the OCS’s participation, Veraz Networks Ltd. is committed to pay royalties to the Israeli Government at the rate of approximately 3.5% of sales of products in which the Israeli Government has participated in financing the research and development, up to the amounts granted plus interest. The grants received bear annual interest at LIBOR as of the date of approval. The grants are presented in the consolidated statements of operations as an offset to related research and development expenses. Repayment of the grants is not required in the event that there are no sales of products developed within the framework of such funded programs. However, under certain limited circumstances, the OCS may withdraw its approval of a research program or amend the terms of its approval. Upon withdrawal of approval, the grant recipient may be required to refund the grant, in whole or in part, with or without interest, as the OCS determines. Royalties payable to the OCS are recorded as they become due and are classified as cost of revenues. Royalty expenses relating to OCS grants included in cost of IP product revenues for the years ended December 31, 2009, 2008, and 2007 amounted to $1.2 million, $2.0 million, and $2.0 million, respectively. As of December 31, 2009 and 2008, the royalty payable amounted to $0.9 million and $1.2 million, respectively. The maximum amount of the contingent liability related to royalties payable to the Israeli Government was approximately $16.1 million as of December 31, 2009.
(c) Indemnification Obligations
The Company enters into agreements in the ordinary course of business with, among others, customers, systems integrators, resellers, service providers, lessors, sub-contractor, sales representatives, and parties to other transactions with the Company, with respect to certain matters. Most of these agreements require the Company to indemnify the other party against third party claims alleging that its product infringes a patent or copyright. Certain of these agreements require the Company to indemnify the other party against losses arising from: a breach of representations or covenants, claims relating to property damage, personal injury or acts or omissions of the Company, its employees, agents, or representatives. In addition, from time to time the Company has made certain guarantees regarding the performance of its products to its customers.
The Company has procurement or license agreements with respect to technology that is used in the Company’s products. Under certain of these agreements, the Company has agreed to indemnify the supplier for certain claims that may be brought against such party with respect to Company’s acts or omissions relating to the supplied products or technologies or claims alleging that the vendor’s product in combination with Company’s product infringes a patent or copyright.
The duration and scope of these indemnities, commitments, and guarantees varies, and in certain cases, is indefinite.
(d) Guarantees
From time to time, customers require the Company to issue bank guarantees for stated monetary amounts that expire upon achievement of certain agreed objectives, typically customer acceptance of the product, completion of installation and commissioning
60
Table of Contents
VERAZ NETWORKS, INC. AND SUBSIDIARIES
Notes to Consolidated Financial Statements—(Continued)
services, or expiration of the term of the product warranty or maintenance period. Restricted cash represents the collateral securing these guarantee arrangements with banks. At December 31, 2009 and 2008, the maximum potential amount of future payments Veraz Networks Ltd. could be required to make under the guarantees, amounted to $1.1 million and $0.6 million, respectively. At December 31, 2009 and 2008, the maximum potential amount of future payments Veraz Networks SARL in France could be required to make under the guarantees, amounted to $0.1 million annually. The guarantee term generally varies from three months to thirty years. The guarantees are usually provided for approximately 10% of the contract value.
At December 31, 2009 and 2008, the Company had $0.2 million in each year invested in a bank guarantee as a security for the Company’s office lease in Israel.
(e) Purchase Commitments
The Company purchases raw material and components for its I-Gate 4000 line of media gateways, under binding purchase orders for each product covered by a product forecasts. In addition to the inventory purchased, as of December 31, 2009 and 2008, the Company had open purchase commitments totaling $1.3 million and $2.6 million, respectively.
(f) Litigation
From time to time, the Company is engaged in various legal proceedings incidental to its normal business activity. Although the results of litigation and claims cannot be predicted with certainty, the Company believes the final outcome of such matters will not have a material adverse effect on its financial position, results of operations, or cash flows.
Note 13 – Segment and Geographic Information
Operating segments are defined as components of an enterprise about which separate financial information is available that is evaluated regularly by the chief operating decision maker, or decision making group, in deciding how to allocate resources and in assessing performance. The Company is required to disclose certain information regarding operating segments, products and services, geographic areas of operation and major customers. The Company’s chief operating decision maker is the Company’s Chief Executive Officer. The Chief Executive Officer reviews financial information presented on a consolidated basis, accompanied by information about revenue by geographic region for purposes of allocating resources and evaluating financial performance. The Company has one business activity and there are no segment managers who are held accountable for operations, operating results and plans for levels or components below the consolidated unit level. Accordingly, the Company is considered to be in a single reporting segment and operating unit structure. Revenue by geography is based on the billing address or location of end customer. The following table sets forth revenue and long-lived assets by geographic area (in thousands):
Revenue by geography is based on the billing address of the customer. The following table sets forth revenue and long-lived assets by geographic area (in thousands):
| Years Ended December 31, | |||||||||
| 2009 | 2008 | 2007 | |||||||
| Revenues: |
|||||||||
| Europe, Middle East and Africa |
$ | 38,935 | $ | 53,763 | $ | 64,675 | |||
| North America |
11,701 | 15,802 | 32,678 | ||||||
| Asia Pacific and India |
13,024 | 11,913 | 17,917 | ||||||
| Caribbean and Latin America |
11,431 | 11,957 | 10,484 | ||||||
| $ | 75,091 | $ | 93,435 | $ | 125,754 | ||||
61
Table of Contents
VERAZ NETWORKS, INC. AND SUBSIDIARIES
Notes to Consolidated Financial Statements—(Continued)
The Company’s subsidiary in Russia contributed to more than 10% of revenues in all the above periods.
| Years Ended December 31, | |||||||||
| 2009 | 2008 | 2007 | |||||||
| Sales originating from: |
|||||||||
| United States |
$ | 29,702 | $ | 39,701 | $ | 64,418 | |||
| Israel |
33,055 | 44,253 | 52,031 | ||||||
| Other foreign countries |
12,334 | 9,481 | 9,305 | ||||||
| $ | 75,091 | $ | 93,435 | $ | 125,754 | ||||
| December 31, | |||||||||
| 2009 | 2008 | ||||||||
| Long-lived assets, net: |
|||||||||
| United States |
$ | 910 | $ | 1,588 | |||||
| Israel |
1,845 | 2,613 | |||||||
| Other foreign countries |
394 | 434 | |||||||
| $ | 3,149 | $ | 4,635 | ||||||
Note 14 – Income Taxes
The components of the Company’s income (loss) before income taxes for the years ended December 31, 2009, 2008, and 2007 were as follows (in thousands):
| Years Ended December 31, | ||||||||||||
| 2009 | 2008 | 2007 | ||||||||||
| United States |
$ | (4,341 | ) | $ | (11,990 | ) | $ | (5,719 | ) | |||
| Foreign |
(5,110 | ) | (9,382 | ) | 9,654 | |||||||
| Income (loss) before income taxes |
$ | (9,451 | ) | $ | (21,372 | ) | $ | 3,935 | ||||
The Company’s provisions for income taxes for the years ended December 31, 2009, 2008, and 2007 were as follows (in thousands):
| Years Ended December 31, | ||||||||||||
| 2009 | 2008 | 2007 | ||||||||||
| Current: |
||||||||||||
| Federal |
$ | (36 | ) | $ | (23 | ) | $ | — | ||||
| State |
6 | 24 | 5 | |||||||||
| Foreign |
963 | 322 | 1,052 | |||||||||
| Total current |
$ | 933 | $ | 323 | $ | 1,057 | ||||||
| Deferred: |
||||||||||||
| Federal |
$ | — | $ | — | $ | — | ||||||
| State |
— | — | — | |||||||||
| Foreign |
1,237 | (735 | ) | (498 | ) | |||||||
| Total Deferred |
$ | 1,237 | $ | (735 | ) | $ | (498 | ) | ||||
| Provision (benefit) for income taxes |
$ | 2,170 | $ | (412 | ) | $ | 559 | |||||
62
Table of Contents
VERAZ NETWORKS, INC. AND SUBSIDIARIES
Notes to Consolidated Financial Statements—(Continued)
The differences between income taxes computed by applying the statutory federal income tax rate of 34% to income before taxes and the amounts reported in the consolidated statements of operations are summarized as follows (in thousands):
| Years Ended December 31, | ||||||||||||
| 2009 | 2008 | 2007 | ||||||||||
| Federal tax expense (benefit) computed at statutory rate |
$ | (3,214 | ) | $ | (7,267 | ) | $ | 1,338 | ||||
| State taxes |
4 | 16 | 3 | |||||||||
| Domestic net operating losses not benefited |
545 | 2,582 | 1,747 | |||||||||
| Foreign rate differential |
3,938 | 2,778 | (2,730 | ) | ||||||||
| Non-deductible stock option expense |
886 | 1,425 | 602 | |||||||||
| Stock option deduction |
— | — | (462 | ) | ||||||||
| Permanent differences |
47 | 54 | 61 | |||||||||
| Other |
(36 | ) | — | — | ||||||||
| Provision (benefit) for income taxes |
$ | 2,170 | $ | (412 | ) | $ | 559 | |||||
Deferred income taxes reflect the net tax effects of temporary differences between the carrying amounts of assets and liabilities for financial reporting purposes and the amounts used for income tax purposes. Significant components of the Company’s deferred tax assets as of December 31, 2009 and 2008 were as follows (in thousands):
| December 31, | ||||||||
| 2009 | 2008 | |||||||
| Deferred tax assets: |
||||||||
| Net operating loss carryforwards |
$ | 26,482 | $ | 25,242 | ||||
| Research and development credits |
6,412 | 6,056 | ||||||
| Accruals and reserves |
1,995 | 2,288 | ||||||
| Depreciation and amortization |
784 | 895 | ||||||
| 35,673 | 34,481 | |||||||
| Valuation allowance |
(35,673 | ) | (33,244 | ) | ||||
| Net deferred tax assets |
$ | — | $ | 1,237 | ||||
The net change in the valuation allowance was an increase of approximately $2.4 million, $4.1 million, and $2.1 million for the years ended December 31, 2009, 2008, and 2007, respectively.
At December 31, 2009, the Company had federal and state net operating loss carryforwards of approximately $72.7 million and $24.4 million, respectively. These federal and state net operating loss carryforwards expire in varying amounts from 2021 to 2029, and 2013 to 2029, respectively. The Company also has federal and state tax credits of approximately $3.5 million and $4.3 million, respectively. The federal research credits expire in varying amounts from 2022 to 2029 and the state tax credits have no expiration date. As of December 31, 2009, the Company has foreign net operating loss carryforward of approximately $14.6 million that has an unlimited carryforward period.
Utilization of the Company’s net operating loss carryforwards and tax credits may be subject to substantial annual limitation due to the ownership change limitations provided by the Internal Revenue Code and similar state provisions. Such an annual limitation could result in the expiration of the net operating loss before utilization. The Company has not determined whether an ownership change has occurred.
In 2003, the Company’s subsidiary in Israel received approval as an “Approved Enterprise” and became eligible for tax benefits under Israel’s Law for the Encouragement of Capital Investments, 1959, or the Law. Subject to compliance with applicable requirements, the portion of the Israeli subsidiary’s undistributed income derived from its Approved Enterprise program will be exempt from corporate tax for a period of two years. In addition, the subsidiary in Israel will enjoy a reduced tax rate of 10% commencing in the first year in which it generates taxable income. The period of tax benefits is subject to limits of the earlier of 12 years from the commencement of production, or 14 years from receiving the approval. Dividend distributions originating from the income of the approved enterprise will be subject to tax at the rate of 15%, provided that the dividend is distributed during the period stipulated under Israeli Law. In the event of a dividend distribution (including withdrawals and charges that are deemed to be
63
Table of Contents
VERAZ NETWORKS, INC. AND SUBSIDIARIES
Notes to Consolidated Financial Statements—(Continued)
dividends), out of the income originating from the approved enterprise, and on which the Company received a tax exemption, the distribution is subject to corporate taxes at rates varying from 10% to 25% depending on the percentage of foreign investment holding in the Company, as defined by the Law.
In 2009, 2008, and 2007, the Company recorded an income tax a provision (benefit) of income taxes of $2.2 million, $(0.4 million), and $0.6 million, respectively. The provision recorded in 2009 was partly due to the settlement of income taxes of $0.4 million for years 2003 through 2007 in the Israel subsidiary. The benefit provision of $0.4 million recorded in 2008 is principally due to the loss on operations in Israel and to a lesser extent the recording of a deferred tax benefit for the Company’s Brazilian operations. In 2007, the tax provision was attributable to the Company’s profitable foreign operations, primarily Israel, for income generated on sale of products not covered under the Approved Enterprise status in Israel. During 2009, the Company performed an assessment of the realizability of the deferred tax assets for the operations in Israel. As a result of recent cumulative losses and uncertainty regarding future taxable income, the Company determined based on all available evidence, that there was substantial uncertainty as to the realizability of recorded net deferred tax assets in future periods. Accordingly, the Company recorded a valuation allowance against all of the net deferred tax assets in Israel at the end of 2009.
As of December 31, 2009, the portion of the federal and state net operating loss carryforwards which relates to stock option deductions was approximately $1.1 million. The Company is tracking the portion of its deferred tax assets attributable to stock option benefits arising subsequent to January 1, 2006 in a separate memo account. Therefore, these amounts are no longer included in the Company’s gross or net deferred tax assets. The benefit of these net operating loss carryforwards will only be recorded to equity when they reduce taxes payable.
The Company accounts for uncertainty in income taxes using a two-step approach to recognizing and measuring uncertain tax positions. The first step is to evaluate the tax position for recognition by determining if the weight of available evidence indicates it is more likely than not that the position will be sustained on audit, including resolution of related appeals or litigation processes, if any. The second step is to measure the tax benefit as the largest amount which is more than 50% likely to be realized upon ultimate settlement. An uncertain tax position is considered effectively settled on completion of an examination by a taxing authority if certain other conditions are satisfied. As of December 31, 2009, the Company had no unrecognized tax benefits.
The Company classifies interest and penalties related to tax contingencies as other expenses. As of December 31, 2009, the Company had not accrued any interest or penalties related to tax contingencies.
The Company files U.S. federal income tax returns as well as income tax returns in various states and foreign jurisdictions. The Company may be subject to examination by the Internal Revenue Service, or IRS for calendar years from its inception in 2001 through 2007. Additionally, any net operating losses that were generated in those years may also be subject to examination by the IRS, in the tax year the net operating loss is utilized. In addition, the Company may be subject to examination in the following foreign jurisdictions for the years specified: Brazil for 2007 through 2009, France for 2007 through 2008, India for 2005 through 2009, Israel for 2008 and 2009, Singapore for 2005 through 2008, Russia for 2006 and 2008, and the United Kingdom for 2005 through 2009.
Note 15 – SEC Investigation
On April 3, 2008, the Company received a letter from the SEC informing it that the SEC was conducting a confidential inquiry, or SEC Inquiry, and requesting that the Company voluntarily produce documents in connection with the SEC Inquiry. On April 5, 2008, the Company’s Board of Directors appointed a special committee, or Special Committee, consisting entirely of independent directors to cooperate with the SEC in connection with the SEC Inquiry and to oversee an independent investigation into the matters raised by the SEC Inquiry. Keker & Van Nest LLP, or Independent Counsel, was retained as independent counsel to conduct an investigation. Keker & Van Nest LLP had not previously represented the Company in any matters. On July 17, 2008, Independent Counsel reported their findings to representatives of the SEC and, on July 21, 2008, provided to the SEC copies of certain documents collected by Independent Counsel during the course of its independent investigation. The Company provided all the requested documents to SEC. As a result of the SEC Inquiry, the Company was not able to file timely its quarterly report on Form 10-Q for the first quarter ended March 31, 2008 and, on May 21, 2008, the Company received a notification letter from NASDAQ stating that its common stock may be subject to delisting in accordance the NASDAQ rules. The Company’s management attended a hearing on July 24, 2008 to request that NASDAQ grant the Company’s request for an extension of time in which to comply with the NASDAQ listing standards. On July 29, 2008, the Company filed its quarterly report on Form 10-Q for the quarter ended March 31, 2008 and now believes it is in compliance with all SEC filing requirements. Additionally, on August 6, 2008, the Company received notification from NASDAQ informing the Company that the NASDAQ hearing panel had determined to continue listing the Company’s common stock on the NASDAQ.
64
Table of Contents
VERAZ NETWORKS, INC. AND SUBSIDIARIES
Notes to Consolidated Financial Statements—(Continued)
During the course of the SEC inquiry, the Company became aware of allegations of misconduct relating to the Company’s business practices in the Asia Pacific region that, if true, may constitute violations of the U.S. Foreign Corrupt Practices Act, or FCPA. These potential FCPA violations include alleged misconduct related to a Chinese customer and an Indonesian customer. In addition, the Special Committee was informed and made the Company aware of allegations of possible fraud perpetrated against the Company and violations of the Company’s Code of Conduct and Ethics, or Policy. The allegations of possible fraud and violations of the Policy involve payments from a reseller to certain non-management employees (whose employment has since been terminated) and other potentially inappropriate commercial relationships between non-management employees and a reseller.
On January 27, 2009, the Company received a subpoena from the SEC requesting documents related to the Company’s business practices in Vietnam. In connection with such SEC investigation, the Company produced documents and provided testimony relevant to the SEC’s investigation and is continuing to cooperate with the SEC in its investigation. In January 2010, the Company reached a tentative resolution with the staff of the SEC regarding the matters described above. Under the terms of the resolution, the Company will consent, without admitting or denying the allegations, to the entry of an injunction prohibiting violations of the non-fraud provisions of the FCPA and to pay a civil penalty of $300,000. The agreement requires approval by the SEC and is subject to court approval.
The Company has incurred expenses related to the SEC inquiry of approximately $0.5 million and $2.5 million for 2009 and 2008, respectively. To date, the Company has incurred expenses related to the SEC investigation of approximately $3.0 million.
Note 16 – Employee Benefit Plans
The Company has a 401(k) plan covering all eligible employees. The Company is not required to contribute to the plan and has made no contributions through December 31, 2009.
Israeli law generally requires payment of severance pay upon dismissal of an employee or upon termination of employments in certain other circumstances. The Company’s liability for severance payments are not reflected in the financial statements as the risks have been irrevocably transferred via payments made to funds in the name of the employee.
Note 17 – Selected Quarterly Financial Information (Unaudited)
Basic and diluted earnings per share are computed independently for each of the quarters presented. Therefore, the sum of the quarterly basic and diluted per shares information may not equal annual basic and diluted earnings per share.
The following tables set forth a summary of the Company’s quarterly financial information for each of the four quarters ended December 31, 2009 and 2008 (in thousands, except for per share data):
| Fourth Quarter |
Third Quarter |
Second Quarter |
First Quarter |
|||||||||||||
| 2009 |
||||||||||||||||
| Revenues |
$ | 18,624 | $ | 18,696 | $ | 16,820 | $ | 20,951 | ||||||||
| Gross profit |
$ | 10,678 | $ | 11,951 | $ | 9,097 | $ | 12,142 | ||||||||
| Net loss |
$ | (4,058 | ) | $ | (1,630 | ) | $ | (2,925 | ) | $ | (3,008 | ) | ||||
| Net loss allocable to common stockholder per share – basic and diluted |
$ | (0.09 | ) | $ | (0.04 | ) | $ | (0.07 | ) | $ | (0.07 | ) | ||||
| 2008 |
||||||||||||||||
| Revenues |
$ | 26,330 | $ | 22,955 | $ | 16,267 | $ | 27,883 | ||||||||
| Gross profit |
$ | 15,824 | $ | 13,585 | $ | 7,101 | $ | 14,952 | ||||||||
| Restructuring charges |
$ | 40 | $ | 794 | $ | — | $ | — | ||||||||
| Net loss |
$ | (861 | ) | $ | (5,413 | ) | $ | (11,592 | ) | $ | (3,094 | ) | ||||
| Net loss allocable to common stockholder per share – basic and diluted |
$ | (0.02 | ) | $ | (0.13 | ) | $ | (0.28 | ) | $ | (0.07 | ) | ||||
Item 9. Changes in and Disagreements with Accountants on Accounting and Financial Disclosure
None.
65
Table of Contents
Item 9A(T). Controls and Procedures
Management’s Report on Internal Control over Financial Reporting
Our management is responsible for establishing and maintaining adequate internal control over financial reporting, as such term is defined in Exchange Act Rules 13a-15(f) and 15d-15(f). Under the supervision and with the participation of our management, including our Chief Executive Officer and Chief Financial Officer, we conducted an evaluation of the effectiveness of our internal control over financial reporting as of December 31, 2009. In making this assessment, our management used the criteria set forth by the Committee of Sponsoring Organization of the Treadway Commission in Internal Control-Integrated Framework. Our management has concluded that, as of December 31, 2009, our internal control over financial reporting was effective based on these criteria.
This annual report does not include an attestation report of the Company’s registered public accounting firm regarding internal control over financial reporting. Management’s report was not subject to attestation by the Company’s registered public accounting firm pursuant to temporary rules of the Securities and Exchange Commission that permit the Company to provide only management’s report in this annual report.
Limitations of Disclosure Controls and Procedures and Internal Control Over Financial Reporting
Our management, including our Chief Executive Officer and Chief Financial Officer, does not expect that our disclosure controls and procedures or our internal control over financial reporting will prevent all error and all fraud. A control system, no matter how well conceived and operated, can provide only reasonable, not absolute, assurance that the objectives of the control system are met. Further, the design of a control system must reflect the fact that there are resource constraints, and the benefits of controls must be considered relative to their costs. Because of the inherent limitations in all control systems, no evaluation of controls can provide absolute assurance that all control issues and instances of fraud, if any, within the Company have been detected.
Disclosure Controls and Procedures
We maintain disclosure controls and procedures (as defined in Rules 13a-15(e) and 15d-15(e) under the Exchange Act) that are designed to provide reasonable assurance that the information required to be disclosed in the reports we file or submit under the Exchange Act is recorded, processed, summarized, and reported within the time periods specified in the Securities and Exchange Commission rules and forms, and that such information is accumulated and communicated to management, including our Chief Executive Officer and Chief Financial Officer, as appropriate to allow timely decisions regarding required disclosure.
Our management evaluated (with the participation of our Chief Executive Officer and Chief Financial Officer) our disclosure controls and procedures, and concluded that our disclosure controls and procedures were effective as of December 31, 2009, to provide reasonable assurance that the information required to be disclosed by us in reports that we file or submit under the Exchange Act, is recorded, processed, summarized, and reported within the time periods specified in Securities and Exchange Commission rules and forms, and that such information is accumulated and communicated to management, including our Chief Executive Officer and Chief Financial Officer, as appropriate to allow timely decisions regarding required disclosure.
Changes in Internal Control Over Financial Reporting
There have been no changes in our internal control over financial reporting during the quarter ended December 31, 2009 that have materially affected, or are reasonably likely to materially affect, our internal control over financial reporting.
None.
66
Table of Contents
Item 10. Directors, Executive Officers and Corporate Governance
The information required by this item with respect to directors and executive officers is incorporated by reference to the section entitled “Information Regarding the Board of Directors and Corporate Governance” appearing in our Proxy Statement for our 2010 Annual Meeting of Shareholders, or Proxy Statement, which we expect to file on or before April 30, 2010.
The information required by this Item with respect to our audit committee and audit committee financial expert may be found in the section entitled “Proposal 1 — Election of Directors — Audit Committee” appearing in the Proxy Statement. Such information is incorporated herein by reference.
The information required by this Item with respect to compliance with Section 16(a) of the Securities Exchange Act of 1934 and our code of ethics may be found in the sections entitled “Section 16(a) Beneficial Ownership Reporting Compliance” and “Proposal 1 — Election of Directors — Code of Business Conduct and Ethics,” respectively, appearing in the Proxy Statement. Such information is incorporated herein by reference.
We have adopted a code of business conduct and ethics applicable to our directors, officers (including our principal executive officer, principal financial officer, and principal accounting officer), and employees. The Code of Business Conduct and Ethics is available on our website at www.veraznetworks.com under the section titled Corporate Governance. In addition, we intend to promptly disclose (1) the nature of any amendment to our code of business conduct and ethics that applies to our principal executive officer, principal financial officer, principal accounting officer or controller, or persons performing similar functions and (2) the nature of any waiver, including an implicit waiver, from a provision of our code of business conduct and ethics that is granted to one of these specified officers, the name of such person who is granted the waiver and the date of the waiver on our website in the future.
Item 11. Executive Compensation
The information required by this Item with respect to director and executive officer compensation is incorporated herein by reference to the information from the Proxy Statement under the section entitled “Executive Compensation.”
The information required by this Item with respect to Compensation Committee interlocks and insider participation is incorporated herein by reference to the information from the Proxy Statement under the section entitled “Proposal 1 — Election of Directors — Compensation Committee Interlocks and Insider Participation.”
The information required by this Item with respect to our Compensation Committee’s review and discussion of the Compensation Discussion and Analysis included in the Proxy Statement is incorporate herein by reference to the information from the Proxy Statement under the section entitled “Proposal 1 — Election of Directors — Compensation Committee Report.”
Item 12. Security Ownership of Certain Beneficial Owners and Management and Related Stockholder Matters
The information required by this Item with respect to security ownership of certain beneficial owners and management is incorporated herein by reference to the information from the Proxy Statement under the section entitled “Security Ownership of Certain Beneficial Owners and Management.”
The information required by this Item with respect to securities authorized for issuance under our equity compensation plans is incorporated herein by reference to the information from the Proxy Statement under the section entitled “Equity Compensation Plan Information.”
Item 13. Certain Relationships and Related Transactions, and Director Independence
The information required by this Item with respect to related party transactions is incorporated herein by reference to the information from the Proxy Statement under the section entitled “Certain Relationships and Related Transactions.”
The information required by this Item with respect to director independence is incorporated herein by reference to the information from the Proxy Statement under the section entitled “Proposal 1 — Election of Directors — Independence of the Board of Directors.”
Item 14. Principal Accountant Fees and Services
The information required by this item will be set forth under the caption “Principal Accountant Fees and Services” in our Proxy Statement, and is incorporated herein by reference.
67
Table of Contents
Item 15. Exhibits and Financial Statement Schedules.
(a)(1) Financial Statements
Index to Consolidated Financial Statements
| Page | ||
| 37 | ||
| Consolidated Financial Statements: |
||
| 38 | ||
| 39 | ||
| 40 | ||
| 41 | ||
| 42 |
(a)(2) Financial Statement Schedules
All financial statement schedules have been omitted, since the required information is not applicable or is not present in amounts sufficient to require submission of the schedule, or because the information is included in the consolidated financial statements and notes thereto.
(a)(3) Exhibits
The information required by this item is set forth on the exhibit index that follows the signature page of this report.
68
Table of Contents
Pursuant to the requirements of the Securities Exchange Act of 1934, the registrant has duly caused this report to be signed on its behalf by the undersigned, thereunto duly authorized.
| VERAZ NETWORKS, INC. | ||||||||
| Date: March 16, 2010 | By: | /s/ Albert J. Wood | ||||||
| Name: | Albert J. Wood | |||||||
| Title: | Chief Financial Officer (Principal Financial and Accounting Officer) | |||||||
KNOW ALL PERSONS BY THESE PRESENTS, that each person whose signature appears below constitutes and appoints Albert J. Wood, as his true and lawful attorney-in-fact and agent, with full power of substitution and resubstitution, for him and in his name, place, and stead, in any and all capacities, to sign any and all amendments to this Report, and to file the same, with all exhibits thereto, and other documents in connection therewith, with the Securities and Exchange Commission, granting unto said attorney-in-fact and agent full power and authority to do and perform each and every act and thing requisite and necessary to be done in connection therewith, as fully to all intents and purposes as he might or could do in person, hereby ratifying and confirming that said attorney-in-fact and agent, or his substitute or substitutes, may lawfully do or cause to be done by virtue hereof.
Pursuant to the requirements of the Securities Exchange Act of 1934, this report has been signed below by the following persons on behalf of the registrant and in the capacities and on the dates indicated.
| Name |
Title |
Date | ||
| /s/ Douglas A. Sabella Douglas A. Sabella |
President, Chief Executive Officer and Director (Principal Executive Officer) | March 16, 2010 | ||
| /s/ Albert J. Wood Albert J. Wood |
Chief Financial Officer and (Principal Financial and Accounting Officer) | March 16, 2010 | ||
| /s/ Promod Haque Promod Haque |
Chairman of the Board of Directors | March 16, 2010 | ||
| /s/ Bob L. Corey Bob L. Corey |
Director | March 16, 2010 | ||
| /s/ Dror Nahumi Dror Nahumi |
Director | March 16, 2010 | ||
| /s/ Pascal Levensohn Pascal Levensohn |
Director | March 16, 2010 | ||
| /s/ W. Michael West W. Michael West |
Director | March 16, 2010 | ||
69
Table of Contents
EXHIBIT INDEX
| Incorporated By Reference |
||||||||||||
| Exhibit |
Exhibit Description |
Form | File No. | Exhibit | Filing Date | Filed Herewith | ||||||
| 2.1 | Share Exchange Agreement, dated October 30, 2002, by and among the Registrant, ECI Telecom Ltd., ECI Telecom — NGTS Inc., and Nexverse Networks, Inc. | S-1 | 333-138121 | 2.1 | 10/20/2006 | |||||||
| 2.2 | Amendment No. 1 to the Share Exchange Agreement, dated December 31, 2002, by and among the Registrant, ECI Telecom Ltd., ECI Telecom — NGTS Inc., and Nexverse Networks, Inc. | S-1 | 333-138121 | 2.2 | 10/20/2006 | |||||||
| 3.1 | Amended and Restated Certificate of Incorporation of the Registrant. | S-1/A | 333-138121 | 3.1 | 1/22/2007 | |||||||
| 3.2 | Certificate of Amendment of Amended and Restated Certificate of Incorporation of Registrant. | S-1/A | 333-138121 | 3.2 | 3/30/2007 | |||||||
| 3.4 | Amended and Restated Bylaws of Registrant. | S-1 | 333-138121 | 3.4 | 10/20/2006 | |||||||
| 4.1 | Reference is made to Exhibits 3.1, 3.2 and 3.3. | |||||||||||
| 4.2 | Specimen stock certificate. | S-1/A | 333-138121 | 4.2 | 3/30/2007 | |||||||
| 10.1 | Warrant to Purchase Series C Preferred Stock, dated as of December 31, 2002, issued by the Registrant to Comdisco Ventures, Inc. | S-1 | 333-138121 | 10.1 | 10/20/2006 | |||||||
| 10.2 | U.S. Separation and Asset Purchase Agreement, dated as of December 31, 2002, by and between ECI Telecom-NGTS Inc. and Veraz Networks International, Inc. | S-1 | 333-138121 | 10.2 | 10/20/2006 | |||||||
| 10.3 | Separation and Assets Purchase Agreement, dated December 31, 2002, by and among ECI Telecom Ltd., ECI — Telecom NGTS, Ltd. and Veraz Networks Ltd. | S-1 | 333-138121 | 10.3 | 10/20/2006 | |||||||
| 10.4 | DCME — Master Manufacturing and Distribution Agreement, dated as of December 31, 2002, by and among ECI Telecom Ltd, Veraz Networks Ltd. and the Registrant | S-1 | 333-138121 | 10.4 | 10/20/2006 | |||||||
| 10.5 | Trademark License Agreement, dated as of December 31, 2002, by and between the Registrant and ECI Telecom, Ltd. | S-1 | 333-138121 | 10.5 | 10/20/2006 | |||||||
| 10.6 | Intellectual Property License Agreement, made as of October 2002, by and among ECI Telecom Ltd., ECI Telecom — NGTS Ltd. and Veraz Networks, Ltd. | S-1 | 333-138121 | 10.6 | 10/20/2006 | |||||||
| 10.7 | Intellectual Property Assignment Agreement, dated December 31, 2002, by and among ECI Telecom Ltd., ECI Telecom NGTS Ltd. and Veraz Networks, Ltd. | S-1 | 333-138121 | 10.7 | 10/20/2006 | |||||||
| 10.8 | License Agreement, dated as of October 2002, by and between ECI Telecom Ltd. and Veraz Networks Ltd. | S-1 | 333-138121 | 10.8 | 10/20/2006 | |||||||
| 10.9 | Assignment and Assumption Agreement, dated as of December 31, 2002, by and among ECI Telecom Ltd., ECI Telecom — NGTS Ltd. and the Veraz Networks, Ltd. | S-1 | 333-138121 | 10.9 | 10/20/2006 | |||||||
| 10.10 | Assignment and Assumption Agreement, dated as of December 31, 2002, by and between ECI Telecom — NGTS Inc. and the Veraz Networks International, Inc. | S-1 | 333-138121 | 10.10 | 10/20/2006 | |||||||
| 10.11 | Series C Preferred Stock Purchase Agreement, dated October 30, 2002, by and among the Registrant and the Purchasers listed on Exhibit A thereto. | S-1 | 333-138121 | 10.11 | 10/20/2006 | |||||||
| 10.12 | Amended and Restated Investor Rights Agreement, dated as of December 19, 2006, by and among the Registrant and the Investors listed on Exhibit A thereto. | S-1/A | 333-138121 | 10.12 | 1/22/2007 | |||||||
Table of Contents
| Incorporated By Reference |
||||||||||||
| Exhibit |
Exhibit Description |
Form | File No. | Exhibit | Filing Date | Filed Herewith | ||||||
| 10.13 | Amended and Restated Voting Agreement, dated December 19, 2006, by and among the Registrant and the stockholders listed on Exhibit A and Exhibit B thereto. | S-1/A | 333-138121 | 10.13 | 1/22/2007 | |||||||
| 10.14 | 2001 Equity Incentive Plan and forms of related agreements. | S-1 | 333-138121 | 10.14 | 10/20/2006 | |||||||
| 10.15 | 2003 Israeli Share Option Plan. | S-1/A | 333-138121 | 10.15 | 3/16/2007 | |||||||
| 10.16 | 2006 Equity Incentive Plan, as amended. | 8-K | 001-33391 | 10.1 | 12/18/2008 | |||||||
| 10.17 | Forms of 2006 Equity Incentive Plan agreements. | S-1 | 333-138121 | 10.16 | 10/20/2006 | |||||||
| 10.18 | 2006 Employee Stock Purchase Plan. | S-1/A | 333-138121 | 10.17 | 3/30/2007 | |||||||
| 10.19* | Offer of Employment with the Registrant, dated as of November 17, 2004, by and between the Registrant and Doug Sabella. | S-1 | 333-138121 | 10.18 | 10/20/2006 | |||||||
| 10.20* | Amendment to Offer of Employment with the Registrant, dated November 17, 2004, made by and between the Registrant and Doug Sabella, as of April 21, 2006. | S-1 | 333-138121 | 10.19 | 10/20/2006 | |||||||
| 10.21* | Employment Agreement, dated as of November 20, 2001, by and between the Registrant and Amit Chawla and Personnel Action Notice, dated June 30, 2005. | S-1 | 333-138121 | 10.20 | 10/20/2006 | |||||||
| 10.22* | Offer of Employment with the Registrant, dated April 13, 2005, by and between the Registrant and Al Wood. | S-1 | 333-138121 | 10.21 | 10/20/2006 | |||||||
| 10.23* | Amendment to Offer of Employment with the Registrant, dated April 13, 2005, made by and between the Registrant and Al Wood, as of April 21, 2006. | S-1 | 333-138121 | 10.22 | 10/20/2006 | |||||||
| 10.24* | Letter of Employment Agreement, dated January 1, 2003, by and between Veraz Networks, Ltd. and Israel Zohar. | S-1 | 333-138121 | 10.23 | 10/20/2006 | |||||||
| 10.25 | Sublease Agreement, dated August 31, 2004, by and between the Registrant and ECI Telecom, Inc. | S-1 | 333-138121 | 10.24 | 10/20/2006 | |||||||
| 10.26 | Sublease Agreement Amendment, dated January 31, 2006, by and between the Registrant and ECI Telecom, Inc. | S-1 | 333-138121 | 10.25 | 10/20/2006 | |||||||
| 10.27 | Standard Industrial/Commercial Multi-Tenant Lease — Net American Industrial Real Estate Association, dated December 2001, by and between the Registrant and Balch LLC. | S-1 | 333-138121 | 10.26 | 10/20/2006 | |||||||
| 10.28 | Letter Amendment to Industrial Lease Agreement, dated April 15, 2002, issued by Balch LLC to the Registrant. | S-1 | 333-138121 | 10.27 | 10/20/2006 | |||||||
| 10.29 | First Amendment to Industrial Lease Agreement, dated January 18, 2004, by and between the Registrant and Balch LLC. | S-1 | 333-138121 | 10.28 | 10/20/2006 | |||||||
| 10.30 | Second Amendment to Industrial Lease Agreement, dated April 7, 2005, by and between the Registrant and Balch LLC. | S-1 | 333-138121 | 10.29 | 10/20/2006 | |||||||
| 10.31 | Unprotected Tenancy Contract, dated December 31, 2003, by and between Veraz Networks Ltd. and Amcol Engineering and Industrial Company Ltd. | S-1 | 333-138121 | 10.30 | 10/20/2006 | |||||||
| 10.32 | Addendum to Unprotected Tenancy Contract, dated November 3, 2005, by and between Veraz Networks Ltd. and Amcol Engineering and Industrial Company Ltd. | S-1 | 333-138121 | 10.31 | 10/20/2006 | |||||||
| 10.33 | Letter, dated October 26, 2003, issued by ECI Telecom Ltd. and addressed to Veraz Networks Ltd. | S-1 | 333-138121 | 10.32 | 10/20/2006 | |||||||
| 10.34 | Letter, dated February 23, 2005, issued by Amcol Engineering and Industrial Company Ltd. and addressed to Veraz Networks Ltd. | S-1 | 333-138121 | 10.33 | 10/20/2006 | |||||||
Table of Contents
| Incorporated By Reference |
||||||||||||
| Exhibit |
Exhibit Description |
Form | File No. | Exhibit | Filing Date | Filed Herewith | ||||||
| 10.35 | Unprotected Tenancy Contract, dated November 3, 2005, by and between Veraz Networks Ltd. and Amcol Engineering and Industrial Company Ltd. | S-1 | 333-138121 | 10.34 | 10/20/2006 | |||||||
| 10.36† | Master Manufacturing Agreement dated October 1, 2005, by and between Flextronics (Israel), Ltd. and Veraz Networks Ltd. | S-1/A | 333-138121 | 10.35 | 3/16/2007 | |||||||
| 10.37* | Form of Indemnity Agreement. | S-1 | 333-138121 | 10.36 | 10/20/2006 | |||||||
| 10.38 | Series D Preferred Stock Purchase Agreement, dated December 19, 2006, by and among the Registrant and the Purchasers listed on Exhibit A-1 thereto. | S-1/A | 333-138121 | 10.37 | 1/22/2007 | |||||||
| 10.39* | Letter of Employment Agreement, dated January 1, 2003, by and between Veraz Networks, Ltd. and Pinhas Reich. | S-1/A | 333-138121 | 10.38 | 3/16/2007 | |||||||
| 10.40* | Letter, dated May 30, 2006, issued by the Registrant and addressed to Bob Corey. | S-1/A | 333-138121 | 10.39 | 1/22/2007 | |||||||
| 10.41 | Services Contract, dated October 13, 2005, by and between Veraz Networks Ltd. and LLC ECI Telecom 2005. | S-1/A | 333-138121 | 10.40 | 3/16/2007 | |||||||
| 10.42* | Letter, dated November 29, 2007, issued by the Registrant and addressed to Mike West. | 10-K | 001-33391 | 10.41 | 3/14/2008 | |||||||
| 10.43* | Release Agreement, dated April 15, 2008, by and between Veraz Networks Ltd. and Pinhas Reich. | 8-K | 001-33391 | 10.41 | 4/21/2008 | |||||||
| 10.44* | Amendment to Offer of Employment with Registrant, dated September 8, 2008, by and between the Registrant and Al Wood. | 8-K | 001-33391 | 10.1 | 9/11/2008 | |||||||
| 10.45* | Letter, dated October 1, 2008, by and between Registrant and Amit Chawla. | 8-K | 001-33391 | 10.1 | 10/3/2008 | |||||||
| 10.46* | Offer of Employment with Registrant, dated August 1, 2007, by and between Registrant and William R. Rohrbach. | 10-Q | 001-33391 | 10.1 | 11/14/2008 | |||||||
| 21.1 | Subsidiaries of the Registrant | 10-K | 001-33391 | 21.1 | 3/17/08 | |||||||
| 23.1 | Consent of Independent Registered Public Accounting Firm | X | ||||||||||
| 24.1 | Power of Attorney. Reference is made to the signature page hereto. | X | ||||||||||
| 31.1 | Certification of Chief Executive Officer pursuant to Rule 13a-14(a) or Rule 15d-14(a) of the Exchange Act | X | ||||||||||
| 31.2 | Certification of Chief Financial Officer pursuant to Rule 13a-14(a) or Rule 15d-14(a) of the Exchange Act | X | ||||||||||
| 32.0# | Certification of Chief Executive Officer and Chief Financial Officer pursuant to 13a-14(b) or 15d-14(b) of the Exchange Act | X | ||||||||||
| * | Management contract, compensatory plan or arrangement. |
| † | Portions of the exhibit have been omitted pursuant to a request for confidential treatment. The omitted information has been filed separately with the Securities and Exchange Commission. |
| # | In accordance with Item 601(b)(32)(ii) of Regulation S-K and SEC Release Nos. 33-8238 and 34-47986, Final Rule; Management’s Reports on Internal Control over Financial Reporting and Certification of Disclosure in Exchange Act Periodic Reports, the Certification furnished in Exhibit 32.1 hereto is deemed to accompany this Form 10-K and will not be filed for purposes of Section 18 of the Exchange Act. Such certification will not be deemed incorporated by reference into any filing under the Securities Act or the Exchange Act, except to the extent that the Registrant specifically incorporates it by reference. |