Attached files
|
UNITED
STATES
SECURITIES
AND EXCHANGE COMMISSION
Washington,
D.C. 20549
|
||
|
|
||
|
FORM
10-K
|
||
|
|
||
|
(Mark
One)
|
||
|
þANNUAL REPORT PURSUANT TO
SECTION 13 OR 15(d) OF THE SECURITIES EXCHANGE ACT OF
1934
|
||
|
For
the fiscal year ended December 31, 2009
|
||
|
OR
|
||
|
*TRANSITION REPORT PURSUANT TO
SECTION 13 OR 15(d) OF THE SECURITIES EXCHANGE ACT OF
1934
|
||
|
For
the transition period from ____________to____________
|
||
|
Commission
File Number 000-27385
|
||
|
INTERACTIVE
INTELLIGENCE, INC.
(Exact
name of registrant as specified in its charter)
|
||
|
Indiana
(State
or Other Jurisdiction
of
Incorporation)
|
35-1933097
(IRS
Employer
Identification
No.)
|
|
|
7601 Interactive
Way
Indianapolis,
IN 46278
(Address
of principal executive offices, including zip code)
|
||
|
(317)
872-3000
(Registrant’s
telephone number, including area code)
|
||
|
Securities
registered pursuant to Section 12(b) of the Act:
|
||
|
Title
of each class
|
Name
of each exchange on which registered
|
|
|
Common
Stock, $0.01 par value per share
|
The
NASDAQ Stock Market LLC
(The
NASDAQ Global Market)
|
|
Securities
registered pursuant to Section 12(g) of the Act: None
Indicate
by check mark if the registrant is a well-known seasoned issuer, as defined in
Rule 405 of the Securities Act. Yes £
No þ
Indicate
by check mark if the registrant is not required to file reports pursuant to
Section 13 or Section 15(d) of the Exchange Act.
Yes £
No þ
Indicate
by check mark whether the registrant (1) has filed all reports required to be
filed by Section 13 or 15(d) of the Securities Exchange Act of 1934 during the
preceding 12 months (or for such shorter period that the registrant was required
to file such reports), and (2) has been subject to such filing requirements for
the past 90 days. Yes þ No
£
Indicate
by check mark whether the registrant has submitted electronically and posted on
its corporate Web site, if any, every Interactive Data File required to be
submitted and posted pursuant to Rule 405 of Regulation S-T (§232.405 of this
chapter) during the preceding 12 months (or for such shorter period that the
registrant was required to submit and post such files). Yes £ No
£
Indicate
by check mark if disclosure of delinquent filers pursuant to Item 405 of
Regulation S-K (§229.405 of this chapter) is not contained herein,
and will not be contained, to the best of registrant’s knowledge, in definitive
proxy or information statements incorporated by reference in Part III of this
Form 10-K or any amendment to this Form 10-K. £
Indicate
by check mark whether the registrant is a large accelerated filer, an
accelerated filer, a non-accelerated filer, or a smaller reporting company. See
the definitions of “large accelerated filer,” “accelerated filer” and “smaller
reporting company” in Rule 12b-2 of the Exchange Act. (Check one):
|
Large
accelerated filer £
|
Accelerated
filer þ
|
|
|
Non-accelerated
filer £
(Do
not check if a smaller reporting company)
|
Smaller
reporting company £
|
|
Indicate by check mark whether the
registrant is a shell company (as defined in Rule 12b-2 of the Exchange Act).
Yes £ No þ
Assuming
solely for the purposes of this calculation that all directors and executive
officers of the registrant are “affiliates”, the aggregate market value of the
registrant’s common stock held by non-affiliates of the registrant, based upon
the closing sale price per share of the registrant’s common stock on June 30,
2009 as reported on The NASDAQ Global Market on that date was
$155,744,052.
As of
February 26, 2010, there were 17,318,704 shares outstanding of the registrant’s
common stock, $0.01 par value.
DOCUMENTS
INCORPORATED BY REFERENCE
Portions
of the information required by Part III of this Form 10-K are incorporated by
reference from portions of the registrant’s Proxy Statement for its 2010 Annual
Meeting of Shareholders to be held on May 20, 2010, which will be filed with the
Securities and Exchange Commission no later than 120 days after December 31,
2009.
2
TABLE OF
CONTENTS
|
PART I.
|
Page
|
||||
| 4 | |||||
| 19 | |||||
| 26 | |||||
| 26 | |||||
| 26 | |||||
| 26 | |||||
|
PART II.
|
|||||
| 26 | |||||
| 27 | |||||
| 28 | |||||
| 39 | |||||
| 40 | |||||
| 61 | |||||
| 61 | |||||
| 62 | |||||
|
PART
III.
|
|||||
| 62 | |||||
| 62 | |||||
| 62 | |||||
| 62 | |||||
| 62 | |||||
|
PART IV.
|
|||||
| 63 | |||||
| 67 | |||||
3
PART
I.
SPECIAL
NOTE ABOUT FORWARD-LOOKING INFORMATION
Certain
statements in this Annual Report on Form 10-K contain "forward-looking"
information (as defined in the Private Securities Litigation Reform Act of
1995, Section
27A of the Securities Act of 1933, as amended, and Section 21E of the Securities
Exchange Act of 1934, as amended (the “Exchange Act”)) that involves risks and
uncertainties which may cause actual results to differ materially from those
predicted in the forward-looking statements. Forward-looking statements can
often be identified by their use of such verbs as “expects”, “anticipates”,
“believes”, “intend”, “plan”, “may”, “should”, “will”, “would”, “will be”, “will
continue”, “will likely result”, or similar verbs or conjugations of such verbs.
If any of our assumptions on which the statements are based prove incorrect or
should unanticipated circumstances arise, our actual results could materially
differ from those anticipated by such forward-looking statements. The
differences could be caused by a number of factors or combination of factors,
including, but not limited to, those set forth in the Item 1A “Risk Factors”
section of this Annual Report on Form 10-K.
Company
Overview
Interactive
Intelligence, Inc. (“Interactive Intelligence,” “we,” “us” or “our”) was formed
in 1994 as an Indiana corporation and maintains its world headquarters and
executive offices at 7601 Interactive Way, Indianapolis, IN 46278. Our telephone
number is (317) 872-3000. We are located on the web at http://www.inin.com.
We file annual, quarterly and current reports, proxy statements and other
documents with the United States Securities and Exchange Commission (the “SEC”)
under the Exchange Act. These periodic and current reports and all amendments to
those reports are available free of charge on the investor relations page of our
website at http://investors.inin.com.
Unified
Business Communications Solutions
We are a
leading provider of software application suites for Voice over Internet Protocol
(“VoIP”) business communications and are increasingly leveraging our leadership
position in the worldwide contact center market to offer our solutions to
enterprises. Businesses and organizations, including those that employ remote
and mobile workers, utilize our solutions in industries including, but not
limited to, teleservices, financial services (banks, credit unions, accounts
receivable management), insurance, higher education, healthcare, retail,
technology, government and business services. Our innovative software products
and services are designed for:
|
·
|
Multichannel
contact management and business communications (voice and messaging) using
the Session Initiation Protocol (“SIP”) global communications standard
that supports VoIP;
|
|
·
|
Business
Process Automation (“BPA”) using a communications-based approach; and
|
|
·
|
Contact
management, including document as well as workflow
management.
|
With our
single software platform, organizations can replace various traditional
“multipoint” communications products. Our solutions incorporate a full-featured
media server, media gateways, SIP proxy, and SIP station voice device for
Internet Protocol (“IP”)-based communications networks and infrastructures.
Customers can deploy our solutions on-premises or in a Communications as a
Service (“CaaS”) model using a hosted data center.
Our
solutions integrate with business systems and end-user devices, enhance the
mobility of today’s remote workforce, scale to thousands of users, manage
content in large volumes, provide communications and data security and satisfy a
range of business communications and interaction management needs
for:
|
·
|
The
Contact Center
|
|
·
|
Enterprise
IP Telephony
|
|
·
|
Business
Process Automation
|
By
implementing our all-in-one solutions, businesses are able to unify multichannel
communications media (phone, fax, e-mail, web chat, content) and information,
automate business processes, enhance workforce performance and productivity,
improve customer service processes, and readily adapt to changing market and
customer requirements. Contact
centers can leverage our platform to support thousands of agents, including
remote “Work-at-Home” agents, and handle inbound, outbound and “blended”
inbound/outbound interactions, at one location or throughout multi-site contact
center operations. Our enterprise IP telephony solutions provide
call control and messaging for mid- and large-sized business
enterprises with 100
to several hundred thousand users, with the ability to scale user counts up or
down as needed. Enterprises, contact centers, and other organizations can
utilize our BPA solutions to automate processes using an approach that
incorporates communications functionality such as routing, quality monitoring,
and the ability to indicate employee availability.
Innovation
and Value
We have
long been recognized for our innovative bundled contact center and enterprise
application solutions. Our single integrated platform and all-in-one application
suites allow contact centers and business enterprises to automate, queue and
manage multichannel communications media. Contact centers can leverage this same
software platform for predictive outbound dialing, workforce management, quality
monitoring, post-call customer satisfaction surveys, call and screen recording
and agent scoring, interaction tracking, speech recognition, content management
and other enhanced contact management and compliance capabilities.
Though
many communications vendors continue to migrate toward software-oriented
solutions, they still largely follow traditional proprietary (“legacy”)
approaches and offer a combination of hardware-centric public branch exchange
(“PBX”) phone systems, automated call distributors (“ACD”), voice mail systems,
interactive voice response (“IVR”) systems and associated equipment. In
contrast, our unified platform is architected on open standards software
developed to run on the Microsoft®
Windows®
(“Microsoft Windows”) operating system and industry standard servers, enabling
organizations to reduce both the number of systems and the cost of expensive
communications equipment from proprietary vendors.
4
The added
value of our open software approach is in the clear migration path it provides
to VoIP using the SIP standard for networked voice and data. In addition to
VoIP, this open approach enables broader integration to business systems, such
as insurance policy and claims administration systems, as well as end-user
devices such as telephones and headsets, while reducing overall costs for
network management, system administration, new application deployments, and
functionality upgrades. Our solutions have established integration with many
popular business applications for customer relationship management (“CRM”),
enterprise resource planning (“ERP”) and other processes, enabling customers to
fully integrate and automate their specific business rules with minimal
customization.
Continued
Global Success and Recognition
Our
software has been licensed since 1997. We market and distribute solutions around
the globe, directly to customers and through a channel of approximately 300
value-added partners. Our software applications are available in 18
languages and are installed in 91 countries.
Our
partners and certain customers become certified through our professional
education curriculum. Customers are supported by our global support network of
company technical professionals and implementation partners.
We have
been an ISO 9001:2000 Certified company since January 2005 and obtained our
re-certification in May 2009, marking our fourth consecutive year of compliance.
Being certified ISO 9001:2000 gives assurance to our customers and partners that
we are able to satisfy ISO requirements by having in place the means to
continuously improve our business processes.
Other
recent company recognitions include the following:
|
·
|
Gartner,
Inc., Leader’s Quadrant, 2009 “Magic Quadrant for Contact Center
Infrastructure, Worldwide” report;
|
|
·
|
Gartner,
Inc., Visionaries Quadrant, 2009 “Magic Quadrant for Unified
Communications” report;
|
|
·
|
Number
194 in the Top 500 Global Software & Services Companies list (ninth
consecutive year listed), Software
Magazine;
|
|
·
|
2009
Fastest Growing Public Companies (second consecutive year listed), Fortune Small Business
Magazine;
|
|
·
|
2009
North American Product Differentiation Innovation Award, Frost &
Sullivan;
|
|
·
|
2009
North American Competitive Strategy Leadership Award, Frost &
Sullivan; and
|
|
·
|
2009
UC Innovation Award (second consecutive year), TMC
Labs.
|
Industry Overview and Current Developments
BPA,
VoIP, eServices, content management and the increased use of various media types
in communications continue to cause a major shift in business communications
technologies. Organizations in many industries, and in increasing numbers, are
moving from one-dimensional, hardware-based PBX phone systems to multichannel
software platforms that support a broad list of applications. Such platforms
incorporate IP telephony and a unified communications approach to bring
networks, information, and voice and data applications together, enabling
organizations to reduce communications equipment costs and automate processes to
improve organizational effectiveness. We have followed an open standards
all-in-one software approach since 1994 to develop our industry-leading
solutions.
The
Convergence of Voice and Data
In a
technology trend for new communications system purchases, IP technologies have
allowed many businesses to transmit voice traffic from circuit-switched networks
and bulky hardware equipment to more agile “converged” voice and data networks,
applications servers, and lower-cost end-user devices. One result of this
transition is that traditional PBX phone system hardware, which many established
PBX vendors are slowly phasing out of their products, is being replaced by
software-based IP PBX solutions. We provide such software-based solutions along
with other vendors such as Avaya Inc. (“Avaya”), Cisco Systems, Inc. (“Cisco”),
Genesys Telecommunications Laboratories, Inc. (“Genesys”) and Aspect Software,
Inc. (“Aspect”).
Unified
Communications
According
to industry analysts at Gartner, Inc., unified communications are the “direct
result of convergence in communication networks and applications.” Microsoft has
defined unified communications as a solution that “bridges the gap between
telephony and computing to deliver real-time messaging, voice and conferencing
to the desktop environment.” The term “unified communications” has also been
defined in other ways, primarily by vendors that package collections of products
for voice, data, conferencing, video and mobility into single offerings. The
convergence of voice and data communications, typically on IP networks
leveraging open standards software platforms and integrated application suites,
is a new standard for people, groups and organizations to communicate. Unified
communications products based on software solutions and equipment such as
servers, gateways and IP-based phones and end-user devices are proving to reduce
administration costs over their proprietary hardware counterparts, while at the
same time enabling organizations to facilitate the integration and use of
enterprise communication methods such as presence management, conferencing,
messaging and other “unified” features in addition to voice. Many unified
communications offerings are stand-alone products or part of a portfolio of
integrated applications and platforms. In addition to being positioned in the
“Visionaries Quadrant” of Gartner, Inc.’s 2009 “Magic Quadrant for Unified
Communications” report, Datamonitor rated our unified communications solutions
in the “leaders” category of its September 2008 report, “Business Trends:
Contact Center Investments in Developed Markets.”
5
Business
Process Automation and Communications-Based Process Automation
We
believe business process automation will improve a company’s competitive
position in the global marketplace and strengthen its foundation for growth. Our
applications have long taken an intelligence-based approach to automation,
beginning with the ability to unify and handle multichannel interactions in the
same manner, and followed thereafter with features such as multichannel queuing,
skills-based (agent) routing, speech-enabled interactive voice response (“IVR”)
and auto attendant processes structured according to an organization’s business
rules. More recently and more specifically, Communications-Based Process
Automation (“CBPA”) has combined these established communications automation
practices with the automation of formal business processes, such as help desk
personnel formulating and tracking customer trouble tickets or human resources
staff handling employee time-off requests. We are elevating this
communications-based approach to automating business and interaction processes
with a full-featured process automation product solution, as well as with our
post-call satisfaction survey product and the ongoing automation of interaction
management functionality now deployed in our solutions.
Internet-Based
Interactions
Businesses
and their customers have long utilized voice communications media such as the
telephone, voice mail and the fax machine to interact. The Internet has also
expanded communications media to include additional channels for e-mail, web
chat sessions, web callback requests, VoIP calls, text messages, Short Message
Service (“SMS”) and even videos. With improved customer service as an ongoing
objective, many companies are deploying web-oriented applications for e-mail
management plus knowledge management and web auto response for customer
inquiries and frequently asked questions (“FAQs”), web collaboration, and other
online services to raise service levels. Though many online services are unified
in an applications approach, most companies still support online media channels
using separate e-mail platforms, web servers, chat servers and other disjointed
equipment that can lead to inconsistencies and inefficiencies across customer
touch points.
Communications
as a Service
CaaS is a
communications-specific way of implementing many of the benefits of Software as
a Service on a subscription basis. With most CaaS offerings, service
providers maintain the core communications system in their own data centers and
extend system functionality to customer sites. The benefits of the CaaS model,
commonly referred to as “hosted services” or “on-demand services,” include small
or no capital expenditures for on-premise equipment at customer locations and
lower costs for deployment. The CaaS model also offers faster implementation and
“go live” times, provides a monthly variable-cost structure (often referred to
as “pay as you go”) and requires less user overhead to maintain compared to
infrastructures where application servers reside at service provider data
centers. Organizations additionally benefit as service providers implement
solutions, monitor security, and provide disaster recovery support as part of
their services.
The
Continued Expansion from Call Centers to Contact Centers
Conventional
call centers consist of phone banks and agents handling inbound and outbound
calls. While relegated to a single communications channel, these “call-only”
centers nevertheless required multipoint systems consisting of a PBX, ACD and an
automated attendant to handle voice-based interactions, along with optional
systems such as an IVR system, a predictive outbound dialer and a call logger.
Most call centers also were forced to spend time and money to integrate their
disparate phone system devices. In a continuing movement away from conventional
call center operations, “contact centers” are incorporating all-in-one
communications technologies that pair e-mail, web interaction, and messaging
capabilities alongside phone calls to offer more contact options for customers,
along with a wider range of service and support channels.
The
Ongoing Need to Integrate Telecommunications and Information
Systems
In most
businesses, telecommunications and information systems are distinct components
of a communications infrastructure. Yet to interact internally and externally,
and to do so more effectively, businesses must be able to use both of these
systems together in a seamless manner. Many vendors offer computer telephony
integration (“CTI”) middleware products and services to integrate various types
of telecommunications devices with information technology to “bring the two
sides together.” For example, in a contact center, a CTI-based application can
enable a data window to appear on an agent’s workstation and present information
about a caller at the same time the agent’s telephone or headset rings. For
customer service in particular, such “screen pops” allow agents to view customer
account information usually maintained in CRM or ERP applications.
Broader
Integration to Business/Data Systems and End-User Devices
With the
increasing emphasis on business processes, automation is essential to broadening
the integration capability between a communications platform and business
applications, information systems, databases, knowledge bases and end-user
devices such as phone sets, headsets, hand-held devices, cell phones and laptop
computers. Compared to traditional communications hardware systems and CTI, open
standards solutions, such as ours, designed for IP networks and consisting of
IP-based applications and industry-standard servers increase such integration
capability to a wider range of business systems and low-cost IP devices for
users across an organization. Especially within dispersed multi-site
organizations, integration is easier to accomplish since different locations can
leverage local and wide area IP networks to integrate business system servers,
use SIP connections from the same network to integrate IP phones and devices at
the desktop, and use wireless connections to equip mobile workers. Organizations
that rely on separate PBX, ACD and associated equipment for communications are
not afforded the same integration flexibility.
Content
Management
Content
management has grown increasingly important for organizations in such industries
as insurance, financial services, and healthcare that circulate large amounts of
information internally and externally. Government agencies and other
organizations tasked with managing confidential data are also putting greater
emphasis on content management as they continue to archive information in larger
volumes. Much like the new breed of software-based solutions for converged voice
and data communications and BPA, many contemporary solutions for content
management are server-based applications. End-users of content management
systems can typically range from enterprise business users to contact center
agents, insurance agents and claims adjusters, banking loan officers, healthcare
professionals, human resource personnel, and other users who routinely must
access documents and information in the office or remotely outside the office.
To meet the diverse needs of these end-users, the “virtual file cabinet”
approach of a content management solution allows organizations to easily define
file management structures and retrieval processes specific to their business
and user requirements.
6
The
Mobile Workforce
While
traditional cell phones and laptop computers have enabled mobile workers for
years, sophisticated hand-held devices and “smart phones” have more recently
combined voice functions with web capabilities and a growing number of mobile
applications for managing calls and messages, viewing documents and
presentations, placing product orders, and tracking shipments. With
such technology making workforce mobility increasingly more productive, and with
more businesses supporting mobile employees, we believe solutions will continue
to introduce enhanced mobile client interfaces and applications for capabilities
such as presence management, find-me/follow-me, calendar access, conferencing
and text messaging to improve user availability and workforce
collaboration.
Remote
“Work-at-Home” Agents
In the
same way technology has enabled the mobile workforce in growing numbers, VoIP
and more reliable Internet-based voice and data capabilities have become
particularly important in contact centers, where remote “Work-at-Home” agents
effectively augment on-premise personnel. In its September 2008 report on
contact center business trends, industry analyst Datamonitor noted that the
demand for home agents could increase throughout 2009-2010 as contact centers
look to reduce costs and take advantage of virtualization technologies for agent
outsourcing. In addition to savings from requiring less physical office space,
the scheduling and geographic flexibility of at-home agent programs tends to
curb the high agent turnover rates common in most contact centers, which in turn
reduces the time and cost of constantly having to hire and train new agents.
Virtualization also allows a contact center, especially multi-site and
multinational centers, to recruit agents from a much broader global base,
increasing the ability to find skilled and experienced agents in specific
geographic areas as needed.
Enhanced
Security for Voice Communications as well as Data
As IP
telephony becomes more prevalent in business communications, the potential of
attacks to an IP communications system makes security a critical priority for
businesses and contact centers worldwide, particularly for healthcare providers,
financial institutions, government agencies, public companies and other
organizations that manage confidential voice and data communications over an IP
network. Open standards including SIP provide a rigorous approach to user
authentication and message encryption in a VoIP environment, as do standards
such as the Payment Card Industry Data Security Standard, which allows
businesses that utilize VoIP technologies to safeguard confidential data
stemming from credit card transactions. While many standards focus on security,
SIP is the most regulated given the actions of the Internet Engineering Task
Force (“IETF”), which continuously introduces, amends and strictly monitors SIP
security specifications worldwide. Our solutions leverage the SIP security
standard specification. All-in-one IP
communications application suites improve security inherently, in that they
pre-integrate applications on a single platform for all voice and data
functions, and allow organizations to reduce the number of systems and access
points for potential attacks by streamlining security down to a central
underlying platform. Single software-based platforms likewise extend security
mechanisms to all critical points between an IP network and the desktop,
allowing organizations to deploy virtual private networks, virtual local area
networks, access lists, authentication, Transport Layer Security, Secure
Real-time Transport Protocol and encryption mechanisms from the network to their
IP communications system’s application server, gateway, data servers and phone
devices.
Migration
from Voice Mail to Unified Messaging and Enhanced Messaging
Unified
messaging efficiently combines voice mail, fax and e-mail messages in an
end-user’s “unified” inbox, with messages accessible via the desktop, a web
browser, a handheld device, or even the telephone using Text-to-Speech
technology. With certain of the current voice mail and fax systems now reaching
outdated status, and with e-mail now a commonly used communication medium, more
enterprises are upgrading to unified messaging solutions that integrate with
existing PBXs equipped for IP telephony and VoIP. Many of these IP PBXs natively
support e-mail and directory servers that are already components in most
technology and telecommunication infrastructures, allowing an organization to
protect much of its technology investment as they make the move to a unified
messaging solution. Also, as workers become more mobile, organizations are
studying the value of enhanced messaging, which supplements unified messaging
with features such as customizable personal call rules and greetings for users,
follow-me call routing, real-time presence management, speech- and browser-based
voice mail access, workgroup capabilities and more. Our solutions for enterprise
IP telephony, as well as for the contact center, include core functionality both
for unified messaging and enhanced messaging to meet diverse messaging needs in
organizations of all kinds.
Social
Media
We
believe social media channels can be beneficial for branding and
marketing-related public relations campaigns, and to a similar degree for
networking with customers, partners and prospects. According to a December 29,
2009 report published by Gartner, Inc., “Gartner’s Top Predictions for IT
Organizations and Users, 2010 and Beyond: A New Balance”, Facebook alone is
expected to have more than one billion users by 2011, largely resulting from the
more than 15,000 websites, mobile devices and applications that have already
implemented the Facebook Connect application programming interfaces and
protocols to interface with Facebook, the more than 350,000 active applications
now on the Facebook platform, and the more than one million developers who
leverage the platform. Given the worldwide reach and potential prospect base of
social networking sites such as Facebook, MySpace, Twitter, LinkedIn and others,
many vendors in the communications industry have already extended their
marketing programs to include these sites and take advantage of the exposure
they can provide. As social media technologies continue to gain in popularity,
and in functionality, we will continue to balance the use of these channels with
other existing online initiatives executed via our own web site (www.inin.com)
and industry channel sites such as www.tmcnet.com.
Target
Markets
The
Contact Center
We
are listed in the Gartner, Inc. Leader’s Quadrant, 2009 “Magic Quadrant for
Contact Center Infrastructure, Worldwide” report, which is the third consecutive
year that we have been included in the Leader’s Quadrant. We remain an industry
leader in helping contact centers move from traditional time division multiplex
phone equipment, multipoint call center technology and CTI to pre-integrated
application solutions for multichannel contact management, developed on open
standards for VoIP. Our scalable all-in-one contact center platform and
application suite enables contact centers to intelligently automate, route,
monitor, record, track, and report on phone calls as well as fax, e-mail and web
interactions, whether in a single location or across multi-site operations.
Contact centers can also easily license our pre-integrated add-on applications
for predictive dialing, workforce management, screen recording and multichannel
recording and agent scoring, business process automation, automated post-call
satisfaction surveys, content management, and other enhanced
functionality.
7
For
self-service automation in the contact center environment, including
speech-enabled IVR and e-mail auto response technologies, we offer a full range
of solutions that help organizations support their sales and service objectives
while standardizing customer service options and reducing operations costs.
Among the more popular self-service applications our customers have implemented
are FAQ auto response via e-mail and IVR-based processes for order status
inquiries.
As
on-demand CaaS offerings continue to take hold in the contact center market, our
contact center platform and application suite is already positioned to deliver
ACD, IVR, multimedia queuing, recording, real-time supervisory monitoring and
other critical services via the CaaS model and VoIP, with local control for
services implementation and
administration.
Enterprise
IP Telephony
Leveraging
our strength in the contact center sector has enabled us to offer IP telephony
both to mid-sized business enterprises and to larger enterprises. In positioning
our contact center solution for enterprise requirements, organizations from 100
or more users and up to 5,000 ACD agents can implement a single scalable
platform solution for IP PBX, ACD, IVR, multimedia queuing, messaging, business
process automation, content management, mobile access and other capabilities
that meet the needs of enterprise business users and workgroups as well as
contact center agents. With the messaging component of our enterprise IP
telephony solution, enterprises can leverage our platform’s integrated IP PBX
call processing and voice mail functionality to support unified messaging (voice
mail, e-mail and fax in one inbox) plus enhanced messaging features such as
find-me/follow-me, customizable call rules, calendar access and
SMS.
We offer
a single, highly-scalable, multichannel IP telephony and messaging platform that
allows organizations to route live communications to desk phones, mobile phones,
smart phones and other telephony-enabled handheld devices, and that also allows
users to manage their inbox for e-mail, voice mail and fax messages. For VoIP,
our platform’s open, inherent IP architecture paves a straightforward migration
path to VoIP for organizations looking to make the move to IP telephony, or who
choose to integrate our platform to an existing PBX phone system and move to
VoIP at a later time. In addition, our solution offers a practical replacement
option for certain existing voice mail systems that now are nearing outdated
status. By providing flexible choose-by-function deployment and licensing
options for features and users, organizations can configure and centrally
administer the precise IP telephony and messaging environment needed by
department or enterprise-wide. Our single IP platform/adaptable applications
approach has been successfully deployed by enterprises and organizations such as
banks, insurance companies, healthcare providers, service providers and other
customer service-oriented companies, along with organizations that maintain
mobile and remote workforces and/or thousands of messaging users.
Business
Process Automation
From its
inception, our core software platform was developed as a process automation
platform to automate and unify phone calls, faxes, e-mails and web interactions,
and to manage all of these media types with features including multichannel
queuing, skills-based routing and speech-enabled IVR and auto attendant
processes structured according to an organization’s business rules. As an
outgrowth of our platform’s automation capability, CBPA inherently extends our
communications automation practices to the automation of formal business
processes, such as employees of an insurance company processing a claim or a
banking loan officer reviewing and approving a customer’s online application for
a new car loan. With this established communications-based approach to
automation, and with our Interaction Process Automation™
(“IPA”) application, we are leveraging our platform technology to provide a
business process automation product solution for contact centers and enterprises
in virtually any industry looking to automate key business and interaction
processes.
In
particular, the IPA solution allows an organization to capture, prioritize,
route, escalate and track each step in a work process, to improve process
efficiency and consistency by minimizing the latency and human error common in
most processes that are executed manually. IPA can be applied to horizontal
processes such as approving time-off requests by a human resources group, or to
vertical processes such as processing a loan application at a bank or credit
union. As an “intelligent” application, the principles of IPA stem from
technology proven in contact centers, including presence to determine an
employee’s availability to receive a new work assignment, and routing and
queuing to route work through each step of the defined process with speed and
precision, all while maintaining full integration with each associated
communication activity.
Content
management is also a component of our positioning in the business process
automation market. A primary benefit of our platform’s open architecture has
always been the ability it gives organizations to integrate databases,
information systems, business systems, CRM packages and other data repositories
to manage information critical to their business operations. Additionally, our
integrated module for knowledge management and e-mail auto response has
continued to provide a straightforward solution for automating information
management process and FAQ auto responses, allowing agents in contact centers
and service-oriented enterprises to effectively offload the manual and
time-consuming task of answering customer inquiries. Through our acquisition of
AcroSoft in May 2009, we are also now able to offer an established application
product suite for creating, managing, distributing and delivering
business-critical content across an enterprise. In conjunction with a business’s
automated processes, AcroSoft applications work in unison for content
management, workflow processing, work management, and reporting. By integrating
these capabilities with our platform’s communications and business process
automation features, this “whole solution” will extend greater content
management functionality to our existing customers in the contact center market
and to our customers in the insurance industry and similar vertical markets in
which document management is becoming increasingly critical.
Other Target Markets
Two
additional markets that we believe are essential in supplementing our primary
target markets are content management and enterprise messaging. In
May 2009, we acquired AcroSoft Corporation (“AcroSoft”) and its established
lineup of document management, workflow management and associated products,
adding a number of advanced document management capabilities to our all-in-one
communications software suite. AcroSoft’s business focused on the insurance
industry which is a recognized market for our integrated communications, process
automation and content management solutions. Other vertical industries in which
organizations are tasked with managing large volumes of customer and business
information, such as the healthcare industry, represent additional potential
markets for our solutions.
Our
Scalable All-in-One Platform, Single-System Approach, Products, Customer Support
and Services
Scalable
All-in-One Platform, Single-System Approach
We
provide a comprehensive solution of contact management, business communications,
business process automation and content management applications developed to run
on our pre-integrated Interaction Center Platform®
multichannel event-processing platform and the Microsoft Windows operating
system. Our platform-based software solutions do not require multipoint hardware
or integrations to third-party products or CTI middleware, and, for
communications, are capable of processing thousands of interactions per
hour.
8
Automating
Business Communications
As a true
all-in-one solution for voice, data and process automation, the Interaction
Center Platform does not require separate systems or integration. This
all-in-one approach allows contact centers and enterprises to process
communications consistently across various media channels: telephone calls,
e-mails, faxes, voice mail messages, Internet chat sessions, IP telephony calls,
SMS messages, and generic media such as trouble tickets. Organizations can apply
business rules across media channels and types for uniform customer service
processes and end-to-end tracking and reporting that improves workforce
performance and service quality.
Our
platform provides a single point of system management to simplify administration
and maintenance, eliminates multiple hardware “boxes” to reduce equipment costs
and complexity, and is flexibly deployed as a PBX/IP PBX or with an
organization’s existing PBX/IP PBX.
These
differentiating characteristics of our integrated software solutions allow
businesses to more effectively communicate internally and externally, and to do
so at a much lower total cost of ownership compared to legacy hardware systems
and CTI products. Strategic advantages of our all-in-one, single-system approach
to unified business communications are described further in the following
sections.
Automating
Interaction Processes and Business Processes
From the
beginning, the Interaction Center Platform was designed to queue and distribute
a variety of communications objects via automated processes. Now with the
emergence of CBPA as a business technology, the Interaction Center Platform
provides a logical and proven foundation for automating the business rules,
information, and voice and data interaction components that drive most business
processes.
Scalable
Standards-Based All-Software Architecture and IP Capabilities
Our
software applications incorporate native IP capabilities based on the
international SIP communications standard developed by the IETF and adopted by a
number of industry leaders. Unlike proprietary PBX phone systems and associated
legacy hardware that other vendors often advertise as “IP-enabled,” our core
platform and application solutions are inherently architected on SIP and open
standards throughout, eliminating the costly SIP extension “lock-ins” required
when using proprietary communications hardware systems to support VoIP. To
further reduce costs, our software runs on standard commodity servers with no
need for expensive and unreliable voice board hardware, allowing organizations
to scale to more users and distributed office locations incrementally by adding
servers to their network and licensing new users, rather than having to install
more equipment or add systems to an existing infrastructure. The open standards
capabilities of our solutions also allow businesses to make use of a wide
variety of low-cost IP soft phones and telephone devices (including our
Interaction SIP Station™
product), gateways (including our Interaction Gateway®), and
other components from a number of different vendors.
Broader
Range of Functions, No Need to Integrate Disparate Technologies
With
traditional legacy communications systems, contact center and business
enterprise operations must typically implement separate multipoint products into
their infrastructure, such as a PBX for phone calls, a web server for chat, and
other systems for additional voice and data functions. To work together, these
systems often require significant complex integration hardware, middleware, and
customization services. Our pre-integrated application suites instead offer a
single software solution for common communications features in the contact
center and the enterprise: PBX/IP PBX, telephony, e-mail processing, ACD, IVR,
web interaction event processing, inbound and outbound fax, conferencing,
multichannel recording and screen recording, quality monitoring and more. To
protect existing system investments, businesses can use our software
applications to supplement their PBX with web-based interaction management,
unified messaging, IVR, departmental contact center services, and other phone
system functions. Our solutions also include supervisory features to view
communications statistics in real time, supplemented by workforce management,
coaching features, interaction tracking and end-to-end reporting to improve
operational performance.
Open
Architecture and Greater Compatibility with Leading Technologies
To
accommodate our standards-based approach to business communications, we
developed our Interaction Center Platform on an open architecture completely
different from traditional telecommunications systems that are based on a
proprietary, closed architecture. Traditional systems limit an organization’s
ability to readily adapt to change or to customize communications processes
specific to their users and customers. With proprietary systems, even simple
changes such as adding a new employee or changing an employee’s location can
require costly and time-consuming efforts. Our solutions are built using
industry-standard server, network and software components such as Intel’s
microprocessors, the Microsoft Windows operating system, and gateways from a
select list of certified vendors (including our own Interaction Gateway
offering). Our open platform architecture allows organizations to easily
configure our applications to meet precise communications requirements, and to
flexibly make hardware or software modifications as necessary. Our products also
easily interact with popular technology products that include:
|
|
·
|
E-mail servers such as
Microsoft®
Exchange Server, IBM Lotus Notes and Novell
GroupWise;
|
|
|
·
|
Database systems from
Microsoft, Oracle Corporation (“Oracle”) and
IBM;
|
|
|
·
|
Mainframe systems,
including those that support 3270 and 5250 terminal
emulation;
|
|
|
·
|
Web servers from Apache
Digital Corporation, IBM WebSphere and
Microsoft;
|
|
|
·
|
Network management
systems, including HP OpenView, IBM Tivoli NetView and Computer
Associates International, Inc.’s Unicenter
TNG;
|
|
|
·
|
CRM and ERP systems
such as those from RightNow®
Technologies, Salesforce.com®,
Microsoft, Oracle/Siebel, SAP Corporation (“SAP®”)
and others; and
|
|
|
·
|
Enterprise directories,
including Microsoft Active Directory, Novell NDS e-Directory and
Sun/iPlanet Directory Server.
|
9
Greater
Ability to Utilize the Internet
With
online and mobile initiatives playing an increasingly significant role for sales
and marketing in many businesses, our solutions provide a number of web-based
interaction options. These options include e-mail, FAQ auto response, web chat
and callback requests, online forms, VoIP calls and conferencing. Such options
are increasingly important for effective e-commerce initiatives, eServices,
online customer service, and the availability of mobile employees as consumers
continue to use the Internet and mobile devices to conduct business
transactions.
Greater
Ability to Configure Communications to Meet Specific Needs
Our core
Interaction Center Platform includes the built-in Interaction Designer®
graphical application generator, which allows an organization to structure and
deploy applications for required interaction processes and integrate specific
business rules into those processes. In addition to deploying applications
quickly and with minimal configuration, organizations can use the pre-built tool
sets in Interaction Designer to configure specific routines for nearly any
aspect of their communications processing. This capability allows organizations
to bypass expensive customization programming, and still tailor communications
processes for their customers, employees and other users using a single design
environment to structure dial plans, call distribution rules, IVR menus, web
services, voice mail system menus, fax applications and other communications
applications.
Greater
Ability to Manage Customer and Business Information and Documents
Our
AcroSoft Documents product for document and information management is a
client-server component that provides a view of various electronic file formats
in a user-defined “virtual cabinet.” Users can manipulate and manage document
and folder views using an assortment of functions accessible from the AcroSoft
Documents application. The AcroSoft Documents application complements an
organization’s data and business processing practices as a stand-alone
application, working in tandem with other systems, or can be interfaced into a
processing application. AcroSoft AnyWhere-Documents is our web-based document
management solution that offers many of the same functions as AcroSoft
Documents, including the ability to organize files, upload documents, annotate
images, view multiple file types and implement overall security, all from within
a web-based interface accessible from anywhere that an Internet connection is
available.
Lower
Total Cost of Ownership
We
believe our pre-integrated applications-based solutions result in a lower total
cost of ownership compared to traditional multipoint communications systems with
similar functionality. Our all-in-one platform and application solutions are
developed specifically to replace costly hardware equipment, reduce energy
consumption and simplify configuration and ongoing administration while
delivering enhanced multichannel communications features. The ability to deploy
an application suite on a single server, or group of servers, and license new
features and users rather than procure additional hardware products, provides
additional cost control by eliminating excessive integration costs from
different vendors. Also contributing to a lower total cost of ownership is that
our solutions reduce end-user training with their intuitive Windows-driven
environment and reduce the time and expense typically required to manage changes
in a multi-component business communications system.
Business
Strategy
We intend
to continue building our brand awareness to increase our penetration in the
contact center and IP PBX markets. During 2010, we will begin licensing our IPA
product for business process automation and aim to become more established in
the market for content management, with our initial focus on the insurance
industry. We also plan to emphasize our new packaged approach to professional
services, market these services and enhanced product functionality to existing
customers, and focus on growing our CaaS offering as a viable option that allows
an organization to pay for a communications solution on a monthly subscription
basis. Our strategy for achieving this overall mission includes multiple
objectives, described as follows.
Market
More Effectively to Our Existing Customers and Go Up-Market in the Contact
Center Market
Our
existing customers have long represented a core revenue stream for new
application solutions, services and our business overall. Our existing customers
also provide input on our products, which assists in our development efforts.
Throughout 2010, we intend to market recently-released application solutions to
these established customers, such as the Interaction SIP Station™
device to replace more expensive SIP phones; Interaction Conference™
for premise-based conferencing that replaces third-party hosting services;
integration with RightNow®
Technologies for call control in RightNow’s CRM application; the Interaction
Feedback™
solution for automated post-call satisfaction surveys; and the Interaction
Monitor™
client/server module for full-time off-site system monitoring and
administration. We further anticipate an interest from existing customers for
our IPA application solution for business process automation, for our AcroSoft
content management application solutions, and for the fixed-cost packaged
offerings for our professional services. In the contact center market, in
particular, we intend to leverage our services and these recently released
products to continue moving up-market to compete for larger customers. We
anticipate that our marketing activities will include promotional campaigns and
special offers for our existing customer base, executed primarily via e-mail and
call campaigns conducted by our Lead Team and inside sales
personnel.
Offer
Our Interaction Process Automation Application as a Communications-Based Process
Automation Solution
Communications-enabled
business process (“CEBP”) solutions are currently offered by other vendors.
These CEBP solutions initiate simple notifications via e-mail or the telephone.
For example, banks use CEBP technologies to issue an alert e-mail or phone call
whenever a customer’s database record indicates an account balance less than a
defined threshold. CEBP does not automate the entire business
process.
Our
Interaction Center Platform technology, with our
Interaction Attendant® and graphical call flow
manager, provides a unique foundation for business process automation.
Leveraging our established platform, during early 2010 we intend to begin
offering our IPA application as a CBPA solution that differs significantly from
the current vendor offerings. With our IPA solution, the communications system
becomes the process automation platform. As an example of CBPA, while our
solution is able to handle the outbound notifications of the current offerings,
a bank could also use our solution to queue up new mortgage applications
submitted online and route the application along with all work tasks and due
dates to the next available underwriter, much as a contact center would route an
incoming call to the first available agent or an agent skilled in a particular
product or language.
10
Enhance
Our BPA Offering with Content Management, with a Focus on the Insurance
Vertical
Our
acquisition of AcroSoft in May 2009 allows us to offer an established product
suite for creating, managing, distributing and delivering business-critical
content throughout an organization. AcroSoft product applications provide
capabilities for content management as well as workflow processing, work
management, document scanning, e-mail monitoring (for e-mail boxes), fax
monitoring and reporting. AcroSoft also offers implementation, training, and
consulting services. By integrating AcroSoft’s applications with the
communications and process automation features of our core Interaction Center
Platform technology, we intend to position this “all-in-one” solution to contact
centers and enterprises, with a specific emphasis during 2010 on growth in the
insurance vertical market. Traditionally some of the largest users of BPA and
content management solutions, insurance providers uniquely move information, as
well as communications, among persons and locations by way of claims,
applications from prospective customers and other means. With our single
platform and integrated applications for the contact center, enterprise IP
telephony and business process automation, an insurance organization can manage
communications and information using one complete solution from a single vendor,
rather than with multiple systems from multiple vendors. With content management
as an added BPA component, we believe this comprehensive offering will
differentiate us from, and more effectively position us against, our
competitors.
Promote
Our Packaged Service Offerings
During
2010, we intend to continue promoting our professional services as packaged
offerings. As tightly-defined, fixed-cost services, these packages are intended
to help our customers control costs for implementation, system configuration,
technical support, managed support and administration, and ongoing education,
and are intended to eliminate the series of open-ended service engagements that
many legacy vendors require for their multipoint hardware systems. We believe
that these packaged service offerings will more effectively position us against
our competitors.
Rapidly
Grow Our CaaS Customer Base
In its
December 2008 “Market Trends: Forecast for North American Hosted Contact Center
Market, 2007-2013” report, Gartner, Inc. noted that “the 2008 to 2009 economic
slowdown should favor hosted contact center adoption.” The report forecasts the
North American hosted contact center market to increase from $104 million in
2007 to $361 million by 2013, yielding a 23% compound annual growth rate. Moving
forward, our Interactive Intelligence Customer Interaction Center®
(“CIC”) all-in-one communications software suite positions us to capitalize on
opportunities in the growing hosted or CaaS market. In addition to providing
robust contact center features, CIC is inherently architected for VoIP, a
critical component of the CaaS model for the services delivery, redundancy and
highest reliability that CaaS-based offerings require.
By
providing contact center services with local control, our CaaS offering enables
us to offer an option that we believe no one else in the industry provides.
Specifically, our local control deployment VoIP model allows a contact center to
use its own telephone lines, choose the best-suited telephone signal carrier,
and maintain voice traffic on its own network. With control over call recordings
on their network and in file storage systems, a contact center will be able to
encrypt recordings for greater security. For data, local control allows contact
centers to manage information in their database server to distribute as they
like. Most of all, contact centers maintain their own dedicated virtual server
in our data center, allowing them to run their selected applications with
complete isolation from all other CaaS customers, ensuring that no other
customer can corrupt data or disable another system, as is possible with shared
tenant solutions offered by our competitors.
Our CaaS
offerings currently include Interactive Contact Center Services (“ICCS”) along
with Interactive Notification Services (“INS”). ICCS provides IVR and ACD, plus
call recording, screen pop integration and multimedia routing for e-mail and
text chat. Agents and supervisors also get a desktop client for call control,
desktop faxing, unified messaging, and real-time presence and monitoring. INS
allows organizations to automate outbound messages such as appointment reminders
and time-sensitive announcements that typically require manual calling. We
believe these comprehensive CaaS offerings will differentiate us from our
competitors.
Continue
Our Innovation and Enhance Our Core Product Offerings
Forward-thinking
has been the cornerstone of our company. We will continue to leverage our
knowledge of contact center, telecommunications, IP, and process automation
technologies to improve our solutions with enhanced functionality,
maintainability, security, mobility, scalability and broader integration. We
also will continue to improve and add to our global offerings for VoIP and
unified business communications with our own media server, gateways and SIP
proxy. By continuing to invest in research and development of new and existing
products for contact centers, enterprises and VoIP infrastructures, we intend to
improve our technology to address the requirements of large-scale organizations
with thousands of users.
Expand
in Our Market for Enterprise IP Telephony
For the
enterprise markets we serve, our strategy is to appeal to a broad audience of
customers and partners around the world by providing “whole solutions” for
business communications. We maintain offices and dedicated field marketing
managers throughout the world, and intend to focus our marketing efforts to
execute our global corporate marketing objectives in the enterprise market as
well as the contact center market.
For
enterprise IP telephony and IP PBX needs, we will market our pre-integrated CIC
offering to mid-sized to larger enterprises of 100 to 15,000 users, especially
those that employ growing mobile workforces, that require contact center and
workgroup capabilities, and that see the need for a more scalable unified
communications infrastructure using VoIP. In addition to features such as IP
PBX/PBX call processing, ACD, unified messaging and voice mail, presence
management, mobility, recording, conferencing, IVR, and customer self-service
and eService automation, our standards-based CIC for the Enterprise (“CIC
for the Enterprise”) solution leverages the SIP communications standard to
provide a clear-cut migration path to VoIP. As an “all-in-one” solution, CIC for
the Enterprise eases implementation and simplifies maintenance for information
technology staff by centralizing administration in a single interface, and by
reducing the complexity associated with CTI. To reduce equipment costs, an
all-software IP option allows organizations to deploy our CIC for the Enterprise
solution using standard off-the-shelf servers. By positioning CIC more strongly
as a solution for enterprise needs during 2010, and by offering advanced
optionally available “contact center”-style features such as workforce
management (“WFM”) and customer satisfaction surveys, we intend to provide a
more robust and scalable IP telephony offering for business communications
within an enterprise. In doing so, we believe that we will increase our market
share in the IP telephony market.
We have
enhanced and will continue to offer our Messaging Interaction Center™
(“MIC”) solution for enterprise messaging by positioning it as a combined
application server/telephony user interface solution to deliver advanced voice
and IP capabilities alongside its messaging features. With these enhancements,
we believe MIC offers a clear path to VoIP messaging through a cost-effective,
easy to use system that is easy to install and administer.
11
Leverage
our Relationships with Multi-National Partners to Open New Selling
Opportunities
To reach
a broader geographic customer base and expand our markets, we intend to work
closely with our partner organizations worldwide. Our partners include
approximately 300 firms that are focused on contact center and/or enterprise
telephony. Along with the name and brand recognition of these partners, we will
leverage their marketing capabilities to bring attention to our brand. We
believe that working in conjunction with companies such as these will provide us
with opportunities worldwide.
Develop
Effective Relationships with Companies in Specific Vertical
Industries
In the
last several years, we have attracted an increasing number of customers in
higher education, healthcare, financial services (banks and credit unions),
insurance, teleservices, and other industry-specific markets. To further
penetrate these markets, our strategy is to leverage our existing business
relationships with customers and partners in these industries, and build new
relationships with other established companies in the vertical segments we
serve. To supplement our vertical market offerings, we will work alongside these
companies, as well as with our partners who specialize in specific industries,
to create custom applications and solutions, most notably in the financial
services sector, and will present such offerings throughout our entire partner
channel.
Increase
Awareness of our All-in-One Solution and Launch Aggressive Replacement
Programs
Our
Interaction Center Platform technology and pre-integrated application suite
solutions have offered a true all-in-one system for unified business
communications since being initially designed in 1994 and first implemented in
1997. It is this approach that many of our competitors have tried to replicate,
often by acquiring products from other companies and/or attempting to develop a
similar platform and supported applications. We intend to market directly to our
competitors’ customers to make them aware of our all-in-one application
solutions as a viable replacement for their existing systems. With the economic
uncertainty that many of our competitors now face, we believe that our financial
position and our continuous introduction of new forward-thinking products
position us to attract these customers.
Our
Products
We have
developed a comprehensive product solution to serve the contact management and
business communications needs of organizations in our three target
markets:
|
·
|
The
Contact Center
|
|
·
|
Enterprise
IP Telephony
|
|
·
|
Business
Process Automation
|
It is
important to note that our pre-integrated application solutions, as well as the
core Interaction Center Platform® that
supports them, are designed expressly to work with one another as
fully-integrated all-in-one solutions that require no third party products or
CTI. Because our products are not acquired from other vendors, our customers
avoid the complexities and costs of trying to integrate disparate multipoint
systems that were not originally designed to work together.
Interactive Intelligence Customer
Interaction Center®
Unified
Communications from a Single Integrated Platform for the Contact
Center
CIC gives
contact centers and enterprises a single platform and a pre-integrated
all-in-one application solution for IP telephony, highlighted by multimedia ACD
to uniformly manage phone calls, faxes, e-mails and web interactions. CIC’s
inherent PBX/IP PBX call processing, voice mail, fax server and unified
messaging further enhance performance and customer service for agents,
supervisors and business users. The SIP-architected CIC provides a
straightforward migration path for VoIP, and is well-suited for contact centers,
including remote agents. CIC also serves as a communication solution for
enterprises and multi-site organizations, including mobile workers. CIC can be
deployed as an on-premise product or provided through a CaaS deployment
model.
Interactive Intelligence Customer
Interaction Center® for the
Enterprise
Enterprise
IP Telephony for Mid-Sized and Larger Enterprises
CIC for
the Enterprise is a complete all-software IP PBX phone and communications system
architected for SIP-supported VoIP. The CIC for the Enterprise solution is
targeted at businesses from 100 to 15,000 users, whether in one location or in
distributed branch offices, and with needs to support mobile workgroups and/or
contact center operations. In one system, CIC for the Enterprise includes IP PBX
call processing, ACD, automated attendant, voice mail, operator console,
find-me/follow-me, built-in fax server, and web chat and web callback. The CIC
for the Enterprise software additionally offers features including real-time
presence management and remote access, with pre-integrated unified messaging,
IVR and Interaction Client®
integrations for Microsoft applications optionally available. Also optionally
available are advanced “contact center”-style features such as WFM and customer
satisfaction surveys.
Messaging
Interaction Center™
Voice
Mail, Unified Messaging, Enhanced Enterprise Messaging, SIP-supported
VoIP
MIC
personifies enterprise messaging with its “choose by function” capability on one
integrated platform. Users on the same system can have different capabilities
ranging from voice mail to unified messaging to enhanced messaging features that
include one-number find-me/follow-me, universal web-based message access and
system administration, message notification options, personal settings options,
and calendar and contact management capabilities. MIC also offers call
screening, user-defined call handling rules, automatic callback, and desktop
faxing and fax “navigation.” MIC allows organizations of up to hundreds of
thousands of users to replace legacy voice mail, implement unified messaging,
take advantage of VoIP using the SIP standard, or leverage all of these
capabilities in one solution.
Functionality
included in CIC that can be managed by configuration settings and license keys
is identified in the following sections:
12
Interaction
Process Automation™
The IPA
module integrates to and leverages the CIC platform to automate business
processes based on CIC’s multichannel communications, queuing and routing
capabilities. This approach, termed communications-based process automation, or
CBPA, enables IPA to keep track of work flowing throughout an organization,
including progress, people, skills, qualifications, availability, and resources.
IPA automatically prioritizes and routes work to qualified and available workers
regardless of location. For clarification, business process automation, or
BPA, is the market, IPA is the product and CBPA is the approach the IPA
solution takes to automating processes.
Interaction
Conference™
Organizations
can deploy the Interaction Conference solution at their site via our core
Interaction Center Platform®
technology, providing a scalable independent conferencing infrastructure to
eliminate expensive per-minute charges offered by outsourced conferencing
solutions. Interaction Conference accommodates conference meetings of any
size.
Interaction
Dialer®
Interaction
Dialer leverages the CIC platform for outbound and blended predictive dialing,
and provides call scripting, multi-site campaign management, intelligent
campaign staging, compliance options and more. Version 3.0 of the Interaction
Dialer application also works with our Interaction Gateway for SIP-based
outbound dialing that scales to higher call levels per hour.
Interaction
Director®
Interaction
Director pre-integrates to multiple CIC servers to route calls to the location
that can best handle those calls at that time. A single Interaction Director
server can process hundreds of thousands of calls per hour.
Interaction
EasyScripter™
Interaction
EasyScripter integrates to Interaction Dialer for easy web-based scripting at
all user levels, including for “non-technical” users.
Interaction
Feedback™
Interaction
Feedback integrates to CIC to automate post-call IVR-based customer satisfaction
surveys, including survey development and results scoring.
Interaction
Optimizer®
Interaction
Optimizer supports workforce management forecasting, scheduling and real-time
adherence for contact centers.
Integration
to Microsoft®
Office Communications Server (“OCS”) 2007
OCS
leverages CIC’s Interaction Client®
functionality to give users the ability to call other users and originate
conference calls between any OCS client, Interaction Client, or external party.
OCS and Interaction Client users can also transfer calls and record calls and
conference calls on demand via the Interaction Client. “Shared” users can
additionally leverage an integrated office communicator contacts list in the
Interaction Client to initiate chats and launch OCS instant messages and video
calls.
CRM
application integrations for our core Interaction Center Platform®
are as follows:
We offer
integrations to CRM and help desk products from RightNow®
Technologies, Salesforce.com®,
Consona® CRM
(formerly Onyx), BMC Remedy®,
FrontRange Solutions HEAT®,
Oracle®/Siebel
and SAP® that
enable call functions such as click to dial, call pickup, disconnect, hold,
transfer, conference and other voice capabilities.
Pre-integrated
add-on modules for CIC and CIC for the Enterprise are identified in the
following sections:
Interaction Client®
Interaction
Client’s call control and presence management functionality can be integrated
into widely used Microsoft application solutions including Microsoft®
Outlook®,
Microsoft Dynamics® CRM
and Dynamics GP. With the Outlook application, users are able to utilize
Outlook’s same powerful features for Mail and Contacts, plus integrated call
control, recording, presence, interaction tracking, and ACD that routes web
chats, e-mail and generic objects, such as online documents. In addition,
Contact and Journal screen pops allow users to manage their phone calls and
availability in the Outlook interface. Dynamics CRM and GP users also get access
to voice functionality via a pre-integrated Interaction Client call control
toolbar, and screen-popped customer account information each time a call is
received.
13
Interaction
Monitor™
Interaction Monitor is a client/server solution to remotely observe and
administer the servers, gateways and other associated devices in an Interaction
Center (CIC, CIC for the Enterprise and MIC) network configuration. For
Interaction Center system administrators, as well as for partners and sales
engineers who maintain Interaction Center servers for their customers,
Interaction Monitor fully automates the monitoring process in a single
environment, 24 hours a day, 7 days a week
Interaction
Supervisor™
Interaction
Supervisor pre-integrates to CIC and to the CIC for the Enterprise solution to
provide a single real-time interface for monitoring agent, user and workgroup
activities, along with interaction events and Interaction Center system and
queue statistics.
Interaction
Tracker®
Interaction
Tracker is a full interaction/contact history management application that works
with CIC and CIC for the Enterprise to track multimedia interactions and allows
authorized users to resolve new contacts and search for and view historical
interaction-based information. Interaction Tracker can function as a customer
interaction tracking system, but can also be integrated with packaged CRM
solutions and/or special purpose customer information management
systems.
Interaction
Recorder®
Interaction
Recorder offers complete quality assessment control in one environment for
recording and archiving phone calls, e-mails, faxes and web chats. In addition,
CIC users can capture interactions with Interaction Recorder’s screen recording
capability. Scoring features in the Interaction Recorder application simplify
quality processes and out-of-the-box reports facilitate measuring individual and
group scoring results for performance.
For
self-service automation:
e-FAQ®
e-FAQ
provides users across enterprises and contact centers a seamless, integrated
gateway to vital up-to-date information that employees and customers alike can
query as needed, using their choice of communication channels to ensure rapid
data delivery. The e-FAQ application uses linguistic analysis to clarify
incoming questions, search for matches, and instantly reply when an appropriate
match is found. e-FAQ’s web-based e-FAQ Knowledge Manager™
simplifies authoring and centralizes administration, reporting, and testing.
e-FAQ’s built-in editor interface and sample response templates further
streamline the authoring and implementation process.
For the
mobile workforce:
Interaction
Mobile Office™
Interaction
Mobile Office integrates to the CIC, CIC – Enterprise and MIC application
solutions to extend each system to mobile users. By leveraging the Interaction
Mobile Office application’s speech-enabled telephone user interface, users can
change presence management settings and access Microsoft Exchange-based voice
mails, e-mails, faxes, corporate directories, and calendars from wherever they
are located.
For voice
mail and unified messaging enhancement:
Interaction Message
Indicator™
(“IMI”)
IMI
monitors Microsoft Exchange Server 2007 Unified Messaging mailboxes for the
presence of voice mail messages. IMI initiates the message waiting indicator on
a user’s desktop phone and discontinues the message waiting indicator when new
voice mails have been reviewed. IMI is engineered to work with all third-party
phone systems, and with our CIC for the Enterprise and CIC application
solutions.
We also
have developed SIP and VoIP solutions that enhance our software offerings,
including the following SIP appliances and end points:
Interaction
Gateway®
Interaction
Gateway makes it possible to configure Interaction Dialer (version 2.4 and
higher) and CIC for SIP-supported outbound predictive dialing, increased call
volume capacity, and advanced call analysis for outbound dialing. By supporting
the high-volume outbound capacities of multiple Interaction Dialer servers, the
Interaction Gateway appliance is targeted to teleservices firms and businesses
that offer blended inbound/outbound dialing services to their
customers.
Interaction
Media Server™
and Interaction SIP Proxy™
The
Interaction Media Server and Interaction SIP Proxy for CIC and CIC for the
Enterprise is available in version 2.4 and version 3.0 and increases Interaction
Center system performance by moving audio recording, processing and compression
to this appliance. Interaction Media Server features, which utilize our
next-generation Interaction Over Networks®
technology, also allow organizations to support supervisory monitoring,
recording at remote sites, and the playback of recorded music during ACD wait
states. Interaction SIP Proxy likewise allows organizations employing the SIP
communications standard for VoIP to support all SIP methods and status codes,
comply with SIP specifications, and more effectively balance and route SIP-based
messages.
Interaction
SIP Station™
The
Interaction SIP Station is a simple and compact communications device that works
in conjunction with our Interaction Client desktop client and soft phone to
replace an IP desk phone. By using a standard headset with the Interaction SIP
Station in lieu of a handset, users get basic call-control functions for
pick-up/disconnect, volume, emergency speed-dial and
mute.
14
Hardware
As part
of our product solutions we sell servers, gateways and telephone handsets. Some
customers licensing our CIC software require that we deliver certain hardware,
such as servers and telephone handsets, and occasionally networking hardware, as
part of the solution. In addition, we have developed our Interaction Media
Server, Interaction SIP Proxy, Interaction Gateway and Interaction SIP Station
appliances as a combination of hardware and our software.
AcroSoft
application products and associated services for content (document) management,
as related to our BPA market offering, include:
AcroSoft
Documents
AcroSoft
Documents is our client-server document management component that provides a
comprehensive view of various electronic file formats in a user defined virtual
cabinet. Users can manipulate and manage document and folder views using an
assortment of features and functions accessible from the application. The
AcroSoft Documents offering works as a stand-alone solution, in tandem with
other systems, or seamlessly interfaced into a processing application to
complement data and business processing.
Other
AcroSoft Products
The
web-based AcroSoft AnyWhere-Documents solution offers many of the same functions
as AcroSoft Documents, including the ability to organize files, upload
documents, annotate images, view multiple file types, and implement overall
security, all from within a web-based interface.
For
workflow management, AcroSoft products include AcroSoft WorkFlow to
determine where notifications should be sent at any given time during the
business processing cycle; the web-based AcroSoft AnyWhere WorkQueue
product to create online inboxes for users to access, linking all users together
in a single automated workflow process; and AcroSoft WorkManagement,
which allows users to track activity related to documents and folders as well as
processes and applications outside the AcroSoft suite of products.
Research
and Development
Leveraging
technology is part of our strategic position, and we continue to invest a
substantial percentage of our revenue in research and development. Our research
and development group is comprised of professionals with backgrounds in
telecommunications, software and hardware. This combination of diverse technical
and communications expertise contributes to our competitive advantage with a
differentiated technology approach. A series of packaged customer solutions are
available from this group, such as integration to SAP Corporation, Oracle’s
Siebel, Inc., and Microsoft Dynamics CRM. These solutions allow partners to
quickly install sophisticated applications for customers.
We are
both a Microsoft Certified Developer as well as a Microsoft Certified Solutions
Provider. These designations provide us early access to Microsoft technology and
the opportunity to develop products quicker that effectively interoperate
with Microsoft products.
Research
and development expenses were $24.1 million, $21.5 million and $17.0 million in
2009, 2008 and 2007, respectively. Our research and development group is
structured as technical teams, each of which follows formal processes for
enhancements, release management and technical reviews. Research and development
expenses include a testing department that is increasingly utilizing automated
techniques to stress test significant portions of our core software. We continue
to make research and development a priority in our business in order to remain
on the forefront of innovation.
Customer
Support and Services
We
recognize the importance of offering quality service and support to our partners
and customers. Our partners provide valuable initial support and implementation
services to many of our customers. We provide a wide range of services and
support to both partners and customers via our Worldwide Services teams,
including Professional Services, Support Services, Managed Services and
Education Services. These services teams are described in more detail in the
following sections.
Professional
Services
Our
Professional Services team takes an innovative approach to the delivery of our
services. This team handles strategic accounts and enhances partner expertise on
advanced offerings such as predictive dialing, speech recognition and
third-party CRM integrations. Our Professional Services team can also, among
other things, help integrate our products to applications such as
Salesforce.com, embed call control into in-house applications and speech-enable
IVR applications. The system configuration services and ad-hoc consulting
services from our Professional Services team work to ensure that the customer
has the solution that drives their business to success. The Professional
Services team works closely with new partners as they implement our products at
their sites, and is often involved with the early release of our products to
assist in new release implementations. We are continuing to invest in this team
as we provide more consulting services and implementation services for strategic
customers globally.
Support
Services
Our
Support Services team offers global technical support for our partners and
customers 24 hours a day, 7 days a week by phone, fax, e-mail, web chat and from
our website. We have support centers at our world headquarters in Indianapolis,
Indiana, and in the United Kingdom and Malaysia. Other secondary support
resources are available in California and Virginia in the United States, and in
the Netherlands, Australia and Japan. We utilize our CIC products, leveraged
with technologies such as knowledge base, CRM and the Internet, to maximize the
effectiveness of our support services.
Our
Support Services team is divided into regions that align with our worldwide
sales teams. Interactions are routed to the respective region based on the
customer location. This enables Support Services team members to better know
their customers and offer quality support services. The engineers on our Support
Services team are also specialists. They focus their efforts on very specific
areas of our offerings, allowing them to develop a deeper knowledge set. This
enables us to do skills-based routing that directs the customer to the best
engineer based on their domain, thus reducing the time to resolve the problem.
We use Interaction Director to route incidents globally in a “follow-the-sun”
manner.
15
Managed
Services
With our
growing base of strategic partners and end customers, we now offer a Managed
Care Program in which an assigned Managed Services team of knowledge experts
provides off-site support and day-to-day support on-site within our customers’
locations. We use Interaction Monitor to enable our engineers to have a constant
view of the health of the customer system. Our goal is to provide
proactive system management.
Communications
as a Service
As
mentioned in previous sections, our customers can deploy our solutions as an
on-premise system at their site or as a “hosted services” CaaS model using
a hosted data center. Along with the contact center and notification services
our CaaS offering provides, our services also include hosted disaster recovery
for business organizations of all kinds that require backup systems for inbound
and outbound communications.
Education
Services
Our
Education Services team is also divided into regions that align with our
worldwide sales teams and provides technical certification and advanced
instruction through on-site courses, classroom presentations and web-based
training. This team develops and maintains course curriculum for formal
certification programs such as sales, product installation, troubleshooting,
system administration and custom design. Web-based training courses offer
enhanced topics such as reporting, system administration, and computer-based
user training. All of our partners are required to maintain updated
certifications to license and support our products. Classes are also offered to
all of our end customers to encourage the most effective use of the
applications. We have moved our classroom sessions to a VoIP structure and
focused our Education Services resources on the IP-based Interaction Center.
This enables our partners and our end customers to build a deeper understanding
of the networking infrastructure and telephony technology of the
future.
Marketing
Our
marketing team is organized by five departments: Product Management, Solutions
Marketing, Market Communications, Lead Management and the Marketing Services
Group.
Our
Product Management team is responsible for coordinating activities with our
development teams to define product requirements and to manage the process for
market requirements, product development approvals, pricing definitions, release
scheduling and beta test coordination. The Product Management team oversees the
product management process from product concept through the end of the beta test
cycle.
Our
Solutions Marketing team focuses on the marketing and promotion of our solutions
to customers, prospective customers and partners as well as to industry
analysts. Their responsibilities include product promotional activities, market
positioning of new and updated products, Internet content and other
solutions-related events and actions.
Our
Market Communications team manages media and industry analyst relations,
primarily through regularly-scheduled briefings with magazine editors and
industry analysts and by participating in various media events such as
tradeshows and seminars.
Our Lead
Management team drives all lead-generation activities resulting from tradeshows,
seminars, and web-based marketing programs and utilizes purchased lists of
prospective customers. This team leverages joint marketing activities with
strategic partners such as Intel Corp. (“Intel”), Microsoft and Polycom, Inc. to
generate qualified leads for partners as well as our Territory Managers. This
Lead Management team additionally organizes our annual User Forum customer
conference and Partner Conference.
Our
Marketing Services Group is responsible for all print collateral and associated
materials for tradeshows, marketing seminars, promotions, advertising, brand
awareness, customer and partner relations and other company functions. Field
Marketing Managers throughout Europe, the Middle East and Africa (“EMEA”) and
the Asia-Pacific (“APAC”) regions are aligned with our Marketing Services Group
and are responsible for similar brand awareness, marketing and advertising
functions in their respective areas.
Global
Distribution and Sales
We
distribute our products through partners and direct arrangements with end-user
customers. In 2009, 75% of total product orders were received through
partners.
We assign
geographic or account responsibilities to Territory Managers who manage partners
and direct customer opportunities.
As of
December 31, 2009, we had 49 Territory Managers and maintained a global
channel network of approximately 300 partners with a presence in over 91
countries.
For the
growing VoIP and IP telephony market, our distribution channel is anchored by
knowledgeable and experienced “converged” partners who understand voice and data
networking.
16
In the Americas, we license and distribute mainly through our partners. In
certain countries, principally the United States and Canada, we also maintain
certain direct customers, primarily with major corporations or in areas lacking
adequate partner relationships. We utilize our Territory Managers, supplemented
by lead generation and our inside sales teams, to generate potential
opportunities. In EMEA and APAC, we license and distribute our solutions
principally through a joint strategy between our Master Distributors and
partners at the Elite and Premier Partner levels (as defined below). Our EMEA
headquarters are located near London, England and our APAC headquarters are
located in Kuala Lumpur, Malaysia.
Our
partners are supported by Program Managers, regional Channel Enablement
Managers, Licensing Specialists and other roles related to sales, support
services and education/certification.
Within
our program framework, our principal partner level designations
include:
|
·
|
Master Distributors are
partners with an existing channel that are staffed with the resources to
provide sales, implementation services, support and bundled solutions
(hardware and software) to our Elite and Premier level partners (as
described in the following sections) and their customers. Master
Distributors identify prospective Elite and Premier Partners and assist in
promoting our partner programs. Requirements of this partner level include
call center expertise and focus, expertise in voice/convergence, solution
selling, an enterprise and telephony experienced sales force with
Microsoft competencies and a large existing installed base of customers.
Master Distributors provide support services to Premier and Elite Partners
and have a strong regional presence with dedicated local and/or regional
sales and technical resources.
|
|
·
|
Elite Partners provide
full-scale marketing, sales, services and support for one or more of our
products. By acquiring requisite sales, technical and support
certifications, Elite Partners earn the highest margins possible through
implementation, support and other services in addition to sales. We also
assign a Territory Manager to each Elite Partner for continuous oversight.
Elite Partners also receive all marketing and business development
advantages of our Partner Enablement Program. Elite Partner candidates can
begin at the Elite level by obtaining all appropriate sales and technical
certifications, or can migrate from the Premier Partner designation by
satisfying Elite-level certification
requirements.
|
|
·
|
Premier Partners focus
on marketing and sales and receive product training along with marketing
and business development support. Premier Partners are required to be
sales certified, which requires taking certain sales courses that we offer
and successfully passing a sales examination administered by us. We assign
a Territory Manager to each Premier Partner to provide ongoing assistance.
The Premier Partner level permits partners to grow their customer base
while providing the framework to earn technical certification, build a
service and support practice for our products, and ultimately move to the
Elite Partner level where revenues and margin potentials are much
greater.
|
|
·
|
Referral Agents
generate leads and are compensated for each qualified lead that results in
an order. Referral agents can earn referral fees for identifying potential
leads and are not required to earn technical certifications. Referral
Agents can transition to the Premier Partner designation by completing
sales training and investing in the Premier level’s required demonstration
and internal use Interaction Center communications
system.
|
We also
have a Channel Ready team that extends beyond the software aspects of our
solution to the hardware. Our Channel Ready team takes the final product and
produces an image that enables the partner to install solutions faster and
easier, provide back-up and recovery for normal maintenance, and reduce the cost
of ongoing support. Our Channel Ready team works with hardware providers
globally and has built relationships that enable us to provide a full solution
for our partners. This team also develops appliances that use our software, such
as the Interaction Media Server and Interaction Gateway.
Our
Technical Sales team is responsible for demonstration facilities, systems and
services at our Indianapolis, Indiana headquarters and regional offices
throughout the U.S. and around the world. This team builds and maintains
demonstration scripts and provides training to our partners and internal sales
teams. All of our partners are granted access to our systems and services for
live customer demonstrations on a global basis, and are assisted by our
Technical Sales team as needed to perform demonstrations. Our Technical Sales
team further assists with marketing efforts and presentations at industry
tradeshows, regional seminars, and events including our annual partner
conference and global user forum.
Customers
and Geographic Areas of Operations
As of
December 31, 2009, we had licensed our products to more than 3,500 customers in
the Americas, EMEA and APAC. No customer or partner accounted for 10% or more of
our revenues in 2009, 2008 or 2007. One partner accounted
for 13% of our accounts receivable as of December 31, 2009, but no customer or
partner accounted for more than 10% of our accounts receivable as of December
31, 2008 or 2007. No material part of our
business is dependent upon a single customer or partner or a small group of
customers or partners. Therefore, the loss of any one customer or partner would
not have a material adverse effect on our operations.
See Note
11 of Notes to Consolidated Financial Statements included in Item 8 of this
Annual Report on Form 10-K for financial information about each of the
geographic areas in which we operate.
Supplier
Relationships
We rely
on third parties for several components in the delivery of our complete
solution, including general purpose servers, third-party software, third-party
hardware appliances, telephone end-points, and integration to various vendors’
hardware and software systems. Our reliance upon these third parties comes with
some amount of risk, primarily due to the possibility of these suppliers being
acquired or discontinuing a product we rely on, or failure to renew terms of
contracts with these suppliers. In addition, some of the third-party software is
licensed from our competitors or such suppliers could become our competitors in
the future, which may complicate our relationships with these suppliers. In many
cases, however, we maintain relationships with several different suppliers and
therefore believe alternatives could be available if a supplier would cease
doing business with us. We feel that the risks are further mitigated by the
revenue that we generate for these third-party suppliers and the length of
notice that we would most likely receive from the suppliers if any of the
products were discontinued.
17
Competition
The
markets for our application-based solutions are highly competitive. Competition
is typically based on various factors, including breadth of product line, price,
ease of installation, ease of use, depth of functionality, product roadmap,
total cost of ownership, return on investment, integration with other
applications, security, reliability, and scalability. We
differentiate ourselves from our competitors by enabling customers to choose to
deploy many of our solutions on-premise or as a CaaS model using a hosted
solution, offering an all-in-one platform, adhering to industry standards and
providing a broad set of applications for the business enterprise. Also
contributing to our competitive strengths are our growing installed base of
customers, new products such as Interaction SIP Station, Interaction Conference,
Interaction Feedback, and IPA, as well as enhancements to our Interaction
Optimizer offering. Our
competitive position in the last twelve months has also potentially benefitted
from the acquisition of a major competitor (Nortel Networks Corporation
(“Nortel”)) by another competitor (Avaya), which created additional sales
opportunities for us as Avaya announced that some products would be
discontinued, resulting in general customer uncertainty.
Our
competitive position varies in each of our three markets. In the contact center
market, we are considered a leader by third-party analyst firms based on the
breadth of our product line, our completeness of visions and our ability to
execute. We compete successfully with our contact center competitors including
those companies that are considerably larger in size. A stronger emphasis by us
in CaaS offerings for the contact center market has introduced several new
competitors, most of which are smaller, less established vendors.
In the
enterprise telephony market, we have a small market share in the pure IP PBX
market segment. However, when our IP PBX product is sold in conjunction with our
other solutions such as our contact center solution, resulting in more of a
unified communications offering, our competitive position is stronger. Our
primary competitors in the contact center and enterprise telephony markets have
a great deal of overlap between the two segments, with a small number of
competitors being exclusive to either one or the other of the two
markets.
The
business process automation market can be divided into two submarkets: process
automation and content management. We are new to the process automation market
and compete both with traditional telecommunications vendors such as
Avaya/Nortel and Genesys and to a lesser extent traditional business process
management suite vendors such as IBM, Lombardi Software, Inc., Savvion Inc. and
Oracle. We entered the content management market in part through our acquisition
of AcroSoft, which added industry domain expertise as well as a larger installed
base of insurance customers.
In the
contact center market, our primary competitors are Aspect, Avaya/Nortel and
Cisco. Significant enterprise IP telephony competitors include Alcatel-Lucent,
Avaya, Cisco, Siemens AG and ShoreTel, Inc. For enterprise messaging we compete
mainly with Avaya, Cisco, Intervoice, Inc. and Applied Voice & Speech
Technologies, Inc. In each market we also compete with recent entrants and
various specialized vendors.
Intellectual
Property and Other Proprietary Rights
We own
numerous patents and patent applications that we consider valuable components of
our business. To protect our proprietary rights, we rely primarily on a
combination of:
|
|
·
|
copyright,
patent, trade secret and trademark
laws;
|
|
|
·
|
confidentiality
agreements with employees and third parties;
and
|
|
|
·
|
protective
contractual provisions such as those contained in licenses and other
agreements with consultants, suppliers, partners and
customers.
|
As of
December 31, 2009, we and our subsidiaries held 12 patents and have filed other
patent applications relating to technology embodied in our software products. In
addition, we and our subsidiaries hold 16 United States and 72 foreign
trademark registrations and have numerous other trademark applications pending
worldwide, as well as common law rights in other trademarks and service marks.
We and our subsidiaries also hold 18 registered copyrights and have numerous
other applications pending.
While we
currently hold patents and have filed other patent applications relating to
certain technology which we have developed, we do not believe that we are
significantly dependent on any one of these patents. We hold trademark and
copyright registrations domestically and worldwide and have numerous other
applications pending worldwide for the name “Interactive Intelligence” and
several of the names used for our products. We consider the trademark for the
“Interactive Intelligence” name the most significant trademark or copyright held
because of the impact the “Interactive Intelligence” name has on the market’s
awareness of, and identification with, us. The “Interactive Intelligence”
trademark registration expires in 2017 in the United States and can be renewed
beyond that date. In addition, we have entered into a license arrangement with
one large competitor for certain technologies that we utilize in our
solutions. Without the license arrangement in place, we may be
subject to litigation that could result in significant expense to us resulting
from our use of these technologies. The license arrangement extends through
2026.
Environmental
Compliance
with federal, state and local provisions regulating the discharge of material
into the environment or otherwise relating to the protection of the environment
has not had a material effect upon our capital expenditures, earnings or
competitive position. We believe the nature of our operations have little, if
any, environmental impact. We therefore anticipate no material capital
expenditures for environmental control facilities for our current fiscal year or
for the foreseeable future.
Employees
As of
February 26, 2010, we had 654 employees worldwide, including 207 in
research and development, 173 in client services, 177 in sales and
marketing and 97 in administration. Our future performance depends in
significant part upon the continued service of our key sales, marketing,
technical and senior management personnel and our continuing ability to attract
and retain highly qualified personnel. Competition for such personnel is intense
and we may not be successful in attracting or retaining these individuals in the
future.
We
believe that we have a corporate culture that attracts highly qualified and
motivated employees. We emphasize teamwork, flexible work arrangements, local
decision-making and open communications. Certain key employees have been granted
stock options. We do not have any employees represented by a labor union. We
have not experienced any work stoppages. We consider our relations with our
current employees to be good.
18
|
ITEM
1A.
|
The
following factors, among others, could cause actual results to differ materially
from those contained in forward-looking statements made in this Annual Report on
Form 10-K and presented elsewhere by management from time to time. Such factors,
among others, may have a material adverse effect on our business, financial
condition, and results of operations and you should carefully consider them. It
is not possible to predict or identify all such factors. Consequently, you
should not consider any such list to be a complete statement of all our
potential risks or uncertainties. Because of these and other factors, past
performance should not be considered an indication of future
performance.
The
Overall Economic Climate Could Result in Decreased Demand for Our Products and
Services
Our
products typically represent substantial capital commitments by customers and
involve a potentially long sales cycle. As a result, our operations and
performance depend significantly on worldwide economic conditions and their
impact on customer purchasing decisions. In this current economic
climate, current or prospective customers are reviewing the allocation of their
capital spending budgets to communication software, services and systems, which
has resulted, and may continue to result, in our current or prospective
customers delaying and/or reducing their capital spending related to information
systems. Some of the factors that could influence the levels of spending by our
current or prospective customers include availability of credit, labor and
healthcare costs, consumer confidence and other factors affecting spending
behavior. These and other economic factors could have a material adverse effect
on demand for our products and services and on our financial condition and
operating results.
Our
Quarterly Operating Results Have Varied Significantly
Our
operating results may vary significantly from quarter to quarter and depend on a
number of factors affecting us or our industry, including many that are beyond
our control. As a result, we believe that period-to-period comparisons of our
operating results should not be relied on as an indication of our future
performance. In addition, our operating results in a future quarter or quarters
may fall below expectations of securities analysts or investors and, as a
result, the price of our common stock may fluctuate.
Because
we do not know if or when our partners and current or potential customers will
place orders and finalize license agreements, we cannot accurately forecast our
licensing activity, our revenues and our operating results for future quarters.
We recognize revenues from different licenses over different periods depending
on the satisfaction of the requirements of relevant accounting literature,
including Financial Accounting Standards Board (“FASB”) Accounting Standards
Codification (“ASC”) Topic 985, Software, and Topic 605,
Revenue Recognition. As
a result, our quarterly revenues and operating results depend on many factors,
including the type of license, the size, quantity and timing of orders received
for our products during each quarter, the delivery of the related software or
hardware and our expectations regarding collection. If a large number of orders
or several large orders do not occur or are deferred or delayed, our revenues in
a quarter could be substantially reduced. This risk is heightened by the
significant investment and executive level decision-making typically involved in
our customers’ decisions to license our products. Since a large portion of our
operating expenses, including salaries and rent, is fixed and difficult to
reduce or modify in a short time period, our business, financial condition or
results of operations could be materially adversely affected if revenues do not
meet our expectations.
Our
limited number of products, changes in pricing policies, the timing of
development completion, and announcement and sale of new or upgraded versions of
our products are some of the additional factors that could cause our revenues
and operating results to vary significantly from period to period.
We
May Pursue Acquisitions That by Their Nature Present Risks and That May Not be
Successful
In the
future we may pursue acquisitions to diversify our product offerings and
customer base or for other strategic purposes. We have limited prior history of
making acquisitions and we cannot assure you that any future acquisitions will
be successful. The following are some of the risks associated with acquisitions
that could have a material adverse effect on our business, financial condition
or results of operations:
|
·
|
We
cannot assure that any acquired businesses will achieve anticipated
revenues, earnings or cash flow.
|
|
·
|
We
may be unable to integrate acquired businesses successfully and realize
anticipated economic, operational and other benefits in a timely manner,
particularly if we acquire a business in a market in which we have limited
or no current expertise, or with a corporate culture different from our
own. If we are unable to integrate acquired businesses successfully, we
could incur substantial costs and delays or other operational, technical
or financial problems.
|
|
·
|
Acquisitions
could disrupt our ongoing business, distract management, divert resources
and make it difficult to maintain our current business standards, controls
and procedures.
|
|
·
|
We
may finance future acquisitions by issuing common stock for some or all of
the purchase price. This could dilute the ownership interests of our
shareholders. We may also incur debt or be required to recognize expense
related to intangible assets recorded in future
acquisitions.
|
|
·
|
We
may be competing with other firms, many of which have greater financial
and other resources, to acquire attractive companies, making it more
difficult to acquire suitable companies on acceptable
terms.
|
|
·
|
We
may not generate sufficient cash from operations and our growth could be
limited unless we are able to obtain capital through additional debt or
equity financings. These financings may not be available as required for
acquisitions or other needs, and even if financing is available, it may
not be on terms that are favorable to us or sufficient for our needs. In
addition, if we complete an equity financing, the issuance of shares of
our common stock would dilute your ownership interest in our
company.
|
We
Are Exposed to Fluctuations in the Market Value of Our Money Market Funds and
Investments. The Financial Pressure on Investment Institutions Managing Our
Investments or the Failure of Such Entities May Lead to Restrictions on Access
to Our Investments Which Could Negatively Impact Our Balance of Cash and Cash
Equivalents, thus Affecting Our Overall Financial Condition
We
maintain an investment portfolio of various holdings and maturities. These
securities are recorded on our consolidated balance sheets at fair value. This
portfolio includes money market funds, notes, bonds and commercial paper of
various issuers. If the debt of these issuers is downgraded, the carrying value
of these investments could be impaired. In addition, we could also face default
risk from some of these issuers, which could cause the carrying value to be
impaired. Financial institutions have been under significant pressure over the
past several quarters. Should one or more of the financial institutions
managing our invested funds experience increased financial pressure resulting in
bankruptcy, or the threat of bankruptcy, access to our funds may be restricted
for a period of time and may also result in losses on those funds.
19
Our cash
and cash equivalents are highly liquid investments with original maturities of
three months or less at the time of purchase. We maintain the cash and cash
equivalents with reputable major financial institutions. Deposits with these
banks exceed the Federal Deposit Insurance Corporation insurance limits or
similar limits in foreign jurisdictions. While we monitor daily the cash
balances in the operating accounts and adjust the balances as appropriate, these
balances could be impacted if one or more of the financial institutions with
which we deposit fails or is subject to other adverse conditions in the
financial or credit markets. To date we have experienced no loss or lack of
access to our invested cash or cash equivalents; however, we can provide no
assurance that access to our invested cash and cash equivalents will not be
impacted by adverse conditions in the financial and credit markets.
We
Have a Lengthy Product Sales Cycle Which May Contribute to Variability of
Quarterly Operating Results
We
have generally experienced a lengthy initial sales cycle, which can last six to
nine months and sometimes longer. The lengthy sales cycle is one of the factors
that has caused, and may in the future continue to cause, our product revenues
and operating results to vary significantly from quarter to quarter which may in
turn affect the market price of our common stock. The lengthy sales cycle also
makes it difficult for us to forecast product license revenues. Because of the
unique characteristics of our products and our prospective customers’ internal
evaluation processes, decisions to license our products often require
significant time and executive-level decision making. We believe that many
companies currently are not aware of the benefits of interaction management
software of the type that we license or of our products and capabilities. For
this reason, we must provide a significant level of education to prospective
customers about the use and benefits of our products, which can cause potential
customers to take many months to make these decisions. As a result, sales cycles
for customer orders vary substantially from customer to customer. Excessive
delay in product sales could materially adversely affect our business, financial
condition or results of operations.
The
length of the sales cycle for customer orders depends on a number of other
factors over which we have little or no control, including:
|
·
|
a
customer’s budgetary constraints;
|
|
·
|
the
timing of a customer’s budget
cycle;
|
|
·
|
concerns
by customers about the introduction of new products by us or our
competitors; and
|
|
·
|
downturns
in general economic conditions, including reductions in demand for contact
center services.
|
Our
Inability to Successfully Manage our Increasingly Complex Supplier and
Other Third-Party Relationships Could Adversely Affect Us
As the
complexity of our product technology and our supplier and other third-party
relationships have increased, the management of those relationships and the
negotiation of contractual terms sufficient to protect our rights and limit our
potential liabilities have become more complicated, and we expect this trend to
continue in the future. In addition, because we offer a whole product solution,
this has added complexity to our supplier relationships. We license from third
parties technology that is embedded in our products. Some of these third parties
that license technology to us are our competitors, or could become competitive
with us in the future. Certain license agreements permit either party to
terminate all or a portion of the license without cause at any time. Further,
some of the license agreements provide that upon acquisition of us by certain
other third parties, we would have to pay a significant fee to continue the
license. As a result, our inability to successfully manage these relationships
or negotiate sufficient contractual terms could have a material adverse effect
on us.
For
certain of our orders, we supply hardware to support the implementation of our
software. We are dependent on third parties for the supply of hardware
components to our customers. If these hardware distributors experience
financial, operational or quality assurance difficulties, or if there is any
other disruption in our relationships, we may be required to locate
alternative hardware sources. We are also subject to the following risks related
to our hardware distribution system:
|
·
|
cancellations
of orders due to unavailability of
hardware;
|
|
·
|
increased
hardware prices, which may reduce our gross profit or make our
products less price competitive;
and
|
|
·
|
additional
development expense to modify our products to work with new hardware
configurations.
|
We cannot
assure you that we would be able to locate alternative technology or hardware
sources in a timely manner, on terms favorable to us, or at all. Even if we
and/or our distributors are successful in locating alternative sources of
supply, alternative suppliers could increase prices significantly. In addition,
alternative technology or hardware components may malfunction or interact
with existing components in unexpected ways. The use of new suppliers and the
modification of our products to function with new systems would require testing
and may require further modifications, which may result in additional
expense, diversion of management attention and other resources, inability to
fulfill customer orders or delay in fulfillment, reduction in quality and
reliability, customer dissatisfaction and other adverse effects on our
reputation, business and operating results.
Existing
and New Reseller Partners are Critical to Continued Growth
Our
ability to achieve revenue growth in the future will depend in part on our
success in maintaining productive relationships with our existing and future
reseller partners and in recruiting and training additional reseller partners.
We rely primarily on these partners to market and support our products and plan
on continuing to rely heavily on such partners in the future. We continue to
expand our partner and distribution networks and may be unable to attract
additional partners with both voice and data expertise or appropriate partners
that will be able to market our products effectively and that will be qualified
to provide timely and cost-effective customer support and service. We generally
do not have long-term or exclusive agreements with our partners, and the loss of
specific larger partners or a significant number of partners could materially
adversely affect our business, financial condition or results of operations. In
addition, due to the current economic conditions, the risk of failure of a
specific partner or a significant number of partners is increased, which failure
could also materially adversely affect our business, financial condition or
results of operations.
20
We
Face Competitive Pressures, Which May Have a Material Adverse Effect on
Us
The
market for our software applications is highly competitive and, because there
are relatively low barriers to entry in the software market, we expect
competitive pressures to continue to be a risk to our ongoing success in the
market. In addition, because our industry is evolving and characterized by rapid
technological change, it is difficult for us to predict whether, when and by
whom new competing technologies or new competitors may be introduced into our
markets. Currently, our competition comes from several different market
segments, including computer telephony platform developers, computer telephony
applications software developers and telecommunications equipment vendors.
Additionally, alternative deployment strategies, such as software as a service,
are offered by certain companies. We cannot provide assurance that we will be
able to compete effectively against current and future competitors in these
segments, or in new segments with new types of competitors. In addition,
increased competition or other competitive pressures may result in price
reductions, reduced margins or loss of market share, any of which could have a
material adverse effect on our business, financial condition or results of
operations.
Many of
our current and potential competitors have longer operating histories,
significantly greater resources, greater name recognition and a larger installed
base of customers than we do. Competitors may be able to respond to new or
emerging technologies and changes in customer requirements more effectively than
we can, or devote greater resources to the development, promotion and sale of
products than we can. In addition, for a number of our larger competitors, the
product segment in which they currently compete with us is a small portion of
their overall offering. These competitors might be willing and able to
dramatically cut prices in our segment in order to protect or grow other
segments that are more important to their overall business. Current and
potential competitors have established, and may in the future establish,
cooperative relationships among themselves or with third parties, including
mergers or acquisitions, to increase the ability of their products to address
the needs of our current or prospective customers. If these competitors were to
acquire significantly increased market share, it could have a material adverse
effect on our business, financial condition or results of
operations.
Our
Future Business Prospects Depend in Part on Our Ability to Maintain and Improve
Our Current Products and Develop New Products
We
believe that our future business prospects depend in large part on our ability
to maintain and improve our current software applications and to develop new
software applications on a timely basis. Our software applications will have to
continue to achieve market acceptance, maintain technological competitiveness
and meet an expanding range of customer requirements. As a result of the
complexities inherent in our applications, major new applications and
application enhancements require long development and testing periods. We may
not be successful in developing and marketing, on a timely and cost effective
basis, application enhancements or new software applications that respond to
technological change, evolving industry standards or customer requirements. We
may also experience difficulties that could delay or prevent the successful
development, introduction or marketing of application enhancements, and our new
applications and application enhancements may not achieve market acceptance.
Significant delays in the general availability of new releases of our software
applications or significant problems in the installation or implementation of
new releases of our applications could have a material adverse effect on our
business, financial condition or results of operations.
If
We Are Unable to Maintain the Compatibility of Our Software With Certain Other
Products and Technologies, Our Future Business Would be Adversely
Affected
Our
software must integrate with software and hardware solutions provided by a
number of our existing and potential competitors. For example, our products must
integrate with phone switches made by the telephone switch vendors and computer
telephony software applications offered by other software providers. These
competitors or their business partners could alter their products so that our
software no longer integrates well with them, or they could delay or deny our
access to software releases that allow us to timely adapt our software to
integrate with their products. If we cannot adapt our software to changes in
necessary technology, it may significantly impair our ability to compete
effectively, particularly if our software must integrate with the software and
hardware solutions of our competitors.
A
Decline in Market Acceptance for Microsoft Technologies on Which Our Products
Rely Could Have a Material Adverse Effect on Us
Our products currently run on Microsoft Windows operating systems. Our web
client interfaces are supported on certain browsers which run on Windows, Mac
and Linux. A decline in market acceptance for Microsoft technologies or the
increased acceptance of other server technologies could cause us to incur
significant development costs and could have a material adverse effect on our
ability to market our current products. Although we believe that Microsoft
technologies will continue to be widely used by businesses, we cannot assure you
that businesses will adopt these technologies as anticipated or will not in the
future migrate to other computing technologies that we do not currently support.
In addition, our products and technologies must continue to be compatible with
new developments in Microsoft technologies. We cannot assure you that we can
maintain that compatibility or that we will not incur significant expenses in
connection therewith.
If
Our Customers Do Not Perceive Our Products or the Related Services Provided by
Us or Our Partners to Be Effective or of High Quality, Our Brand and Name
Recognition Will Suffer
We
believe that establishing and maintaining brand and name recognition is critical
for attracting, retaining and expanding customers in our target markets. We also
believe that the importance of reputation and name recognition will increase as
competition in our market increases. Promotion and enhancement of our name will
depend on the effectiveness of our marketing and advertising efforts and on our
success in providing high-quality products and related services, including
installation, training and maintenance, neither of which can be assured. If
our customers do not perceive our products or related services to be effective
or of high quality, our brand and name recognition would suffer which could have
a material adverse effect on our business, financial condition or results of
operations.
21
Our
Products Require Wide Area Networks, and We May be Unable to Sell Our Products
Where Networks Do Not Perform Adequately
Our
products also depend on the reliable performance of the wide area networks of
businesses and organizations, including those that employ remote and mobile
workers. If enterprise customers experience inadequate performance with their
wide area networks, whether due to outages, component failures, or otherwise,
our product performance would be adversely affected. As a result, when these
types of problems occur with these networks, our enterprise customers may not be
able to immediately identify the source of the problem, and may conclude that
the problem is related to our products. This could harm our relationships with
our current enterprise customers and make it more difficult to attract new
enterprise customers, which could negatively affect our business.
Our
Products Could Have Defects for Which We Are Potentially Liable and Which Could
Result in Loss of Revenue, Increased Costs, Loss of Our Credibility, Harm Our
Reputation or Delay in Acceptance of Our Products in the Market
Our
products, including components supplied by others, may contain errors or
defects, especially when first introduced or when new versions are released.
Despite internal product testing, we have in the past discovered software errors
in some of our products after their introduction. Errors in new products or
releases could be found after commencement of commercial shipments, and this
could result in additional development costs, diversion of technical and other
resources from our other development efforts, or the loss of credibility with
current or future customers. This could result in a loss of revenue or delay in
market acceptance of our products, which could have a material adverse effect on
our business, financial condition or results of operations.
Our
license agreements with our customers typically contain provisions designed to
limit our exposure to potential product liability and some contract claims.
However, not all of these agreements contain these types of provisions and,
where present, these provisions vary as to their terms and may not be effective
under the laws of some jurisdictions. A product liability, warranty, or other
claim brought against us could have a material adverse effect on our business,
financial condition or results of operations.
Our
software runs on a Windows 2000 or Windows 2003 server and for telephone call
processing uses voice processing boards or third-party VoIP media processing
software such as Intel HMP software. Our server software also
operates in a complex network environment with database servers, e-mail servers
and other third party systems. Because of this complexity, our software may be
more prone to performance interruptions for our customers than traditional
hardware-based products. Performance interruptions at our customer sites, many
of which currently do not have back-up systems, could affect demand for our
products or give rise to claims against us.
We
May Not Be Able to Protect Our Proprietary Rights Adequately, Which Could Allow
Third Parties to Copy or Otherwise Obtain and Use Our Technology Without
Authorization
We regard
our software products as proprietary. In an effort to protect our proprietary
rights, we rely primarily on a combination of copyright, trademark and trade
secret laws, as well as patents, licensing and other agreements with
consultants, suppliers, partners and customers, and employee and third-party
non-disclosure agreements. These laws and agreements provide only limited
protection of our proprietary rights. It may be possible for a third party to
copy or otherwise obtain and use our technology without authorization. A third
party could also develop similar technology independently. In addition, the laws
of some countries in which we license our products do not protect our software
and intellectual property rights to the same extent as the laws of the United
States. Unauthorized copying, use or reverse engineering of our products could
materially adversely affect our business, results of operations or financial
condition.
Certain
Provisions in Agreements That We Have Entered Into May Expose Us to
Liability for Breach That Is Not Limited in Amount By the Terms of the
Contract
Certain
contract provisions, principally confidentiality and indemnification obligations
in certain of our license agreements, could expose us to risks of loss that, in
some cases, are not limited by contract to a specified maximum amount. If we
fail to perform to the standards required by these contracts, we could be
subject to additional liability and our business, financial condition and
results of operations could be materially and adversely affected.
Infringement
Claims Could Adversely Affect Us
Third
parties have claimed and may in the future claim that our technology infringes
their proprietary rights. As the number of software products in our target
markets increases and the functionality of these products overlap, we believe
that software developers may face additional infringement claims.
Infringement
claims, even if without merit, can be time consuming and expensive to defend. A
third party asserting infringement claims against us or our customers with
respect to our current or future products may require us to enter into costly
royalty arrangements or litigation, or otherwise materially adversely affect
us.
22
Changes
in Corporate Taxes or Adverse Outcomes Resulting from Examination of Our Income
Tax Returns Could Adversely Affect Our Results
Our
provision for income taxes could be adversely affected by changes in the
valuation of our deferred tax assets and liabilities; by earnings being lower
than anticipated in countries that have lower tax rates and higher than
anticipated in countries that have higher tax rates; by expiration of or
lapses in the research and development tax credit laws; by transfer pricing
adjustments including the post-acquisition integration of purchased intangible
assets from certain acquisitions into our intercompany research and
development cost sharing arrangement; by tax effects of nondeductible stock
option expense; by tax costs related to intercompany realignments; or by changes
in tax laws, regulations and accounting principles, including accounting for
uncertain tax positions or interpretations thereof. If amounts included in
tax returns are reduced or disallowed, it would reduce our carryforward losses
and tax credits and the amount of expected future non-cash income tax expense
used by management and investors. Judgment is required to determine the
recognition and measurement attributes prescribed in FASB ASC Topic 740, Income Taxes (“FASB ASC
740”). In addition, FASB ASC 740 applies to all income tax positions, including
the potential recovery of previously paid taxes, which if settled unfavorably
could adversely impact our provision for income taxes or additional paid-in
capital. Further, as a result of certain of our ongoing employment and capital
investment actions and commitments, our income in certain tax jurisdictions is
subject to reduced tax rates and in some cases is wholly exempt from tax. Our
failure to meet these commitments could adversely impact our provision for
income taxes. In addition, we are subject to the examination of our income tax
returns by the U.S. Internal Revenue Service and other tax authorities. We have
also recorded state and local income tax incentives as a reduction of certain
operating expenses and if those incentives were to be disallowed we may be
required to record additional expense. We regularly assess the likelihood of
adverse outcomes resulting from these examinations to determine the adequacy of
our provision for income taxes. There can be no assurance that the outcomes from
these continuous examinations will not have an adverse effect on our operating
results and financial condition.
We
Depend on Key Personnel and Will Need to Retain and Recruit Skilled Personnel,
for Which Competition Is Intense, to Conduct and Grow Our Business
Effectively
Our
success depends in large part on the continued service of our key personnel,
particularly Dr. Donald E. Brown, our Chief Executive Officer and largest
shareholder. The loss of the services of Dr. Brown or other key personnel
could have a material adverse effect on our business, financial condition or
results of operations. Our future success also depends on our ability to
attract, train, assimilate and retain additional qualified personnel.
Competition for persons with skills in the software industry is intense,
particularly for those with relevant technical and/or sales experience. We
cannot assure you that we will be able to retain our key employees or that we
can attract, train, assimilate or retain other highly qualified personnel in the
future.
Our
International Operations Involve Financial and Operational Risks Which May
Adversely Affect Our Business and Operating Results
Our
international operations require significant management attention and financial
resources to establish and operate, including hiring appropriate personnel and
recruiting effective international partners. Non-North American revenues
accounted for 27%, 27% and 25% of our total revenues for the years ended
December 31, 2009, 2008 and 2007, respectively. We intend to continue to
emphasize our international operations and we may enter additional international
markets. Revenues from international operations may be inadequate to cover the
expenses of those operations. Risks inherent in our international business
activities may include the following:
|
·
|
economic
and political instability;
|
|
·
|
unexpected
changes in foreign regulatory requirements and
laws;
|
|
·
|
tariffs
and other trade barriers;
|
|
·
|
timing,
cost and potential difficulty of adapting our software products to the
local language in those foreign countries that do not use the English
alphabet, such as Japan, Korea and
China;
|
|
·
|
lack
of acceptance of our products in foreign
countries;
|
|
·
|
longer
sales cycles and accounts receivable payment
cycles;
|
|
·
|
potentially
adverse tax consequences;
|
|
·
|
restrictions
on the repatriation of funds;
|
|
·
|
acts
of terrorism; and
|
|
·
|
increased
government regulations related to increasing or reducing business activity
in various countries.
|
Our
international revenues are generally denominated in United States dollars with,
principally, the exception of some European partners and customers. Our
international expenses are generally denominated in local foreign currencies.
Although foreign currency transaction gains and losses have been immaterial to
date, fluctuations in exchange rates between the United States dollar and other
currencies could have a material adverse effect on our business, financial
condition or results of operations, and particularly on our operating margins
and net income. To date, we have not sought to actively hedge the risks
associated with fluctuations in exchange rates, but we may more actively
undertake to do so in the future. Any hedging techniques we implement in the
future may not be successful. Exchange rate fluctuations could also make our
products more expensive than competitive products not subject to these
fluctuations, which could adversely affect our revenues and profitability in
international markets.
23
Our
Stock Price Has Been and Could Continue to Be Highly Volatile
Our stock
price has been and could continue to be highly volatile due to a number of
factors, including:
|
·
|
actual
or anticipated fluctuations in our operating
results;
|
|
·
|
announcements
by us, our competitors or our
customers;
|
|
·
|
changes
in financial estimates of securities analysts or investors regarding us,
our industry or our competitors;
|
|
·
|
technological
innovations by others;
|
|
·
|
the
operating and stock price performance of other comparable companies or of
our competitors;
|
|
·
|
the
availability for future sale, or sales, of a substantial number of shares
of our common stock in the public market;
and
|
|
·
|
general
market or economic conditions.
|
This risk
may be heightened because our industry is continually evolving, characterized by
rapid technological change, and is susceptible to the introduction of new
competing technologies or competitors.
In
addition, the stock market has experienced significant price and volume
fluctuations in the recent past that have particularly affected the trading
prices of equity securities of many technology companies, including us. These
price and volume fluctuations often have been unrelated to the operating
performance of the affected companies. In the past, following periods of
volatility in the market price of a company’s securities, securities class
action litigation has sometimes been instituted against that company. This type
of litigation, regardless of the outcome, could result in substantial costs and
a diversion of management’s attention and resources, which could materially and
adversely affect our business, financial condition or results of
operations.
Changes
Made to Generally Accepted Accounting Principles and Other Legislative Changes
May Impact Our Business
Revisions
to generally accepted accounting principles will require us to review our
accounting and financial reporting procedures in order to ensure continued
compliance with required policies. From time to time, such changes may have a
short-term impact on our reporting, and these changes may impact market
perception of our financial condition. In addition, legislative changes, and the
perception these changes create, can have a material adverse effect on our
business.
Failure
to Maintain Effective Internal Controls in Accordance with Section 404 of
the Sarbanes-Oxley Act of 2002 Could Have a Material Adverse Effect on Our
Business, Operating Results and Stock Price
The
Sarbanes-Oxley Act of 2002 imposes certain duties on us and our executives and
directors. We are also required to comply with the internal control over
financial reporting requirements of Section 404 of the Sarbanes-Oxley Act. Our
efforts to comply with the requirements of Section 404 have resulted in
increased general and administrative expense and a diversion of management time
and attention from revenue-generating activities to compliance activities, and
we expect these efforts to require the continued commitment of significant
resources.
If we
fail to maintain the adequacy of our internal controls, we may not be able
to ensure that we can conclude on an ongoing basis that we have effective
internal control over financial reporting. Failure to maintain effective
internal control over financial reporting could result in investigation by
regulatory authorities, and could have a material adverse effect on our business
and operating results, investor confidence in our reported financial
information, and the market price of our common stock.
24
We
May Not Sustain Profitability
We have
been profitable for the past six consecutive years. Prior to 2004, we
historically incurred losses and may do so again in the future. At December 31,
2009, we had accumulated net losses since inception of $19.1 million. We intend
to continue to make significant investments in our research and development,
sales and marketing and services operations.
Anti-Takeover
Provisions in Our Organizational Documents and Indiana Law Make Any Change in
Control of Us More Difficult, May Discourage Bids at a Premium over the Market
Price and May Adversely Affect the Market Price of Our Stock
Our
Restated Articles of Incorporation and By-Laws contain provisions that may have
the effect of delaying, deferring or preventing a change in control of us, may
discourage bids at a premium over the market price of our common stock and may
adversely affect the market price of our common stock, and the voting and other
rights of the holders of our common stock. These provisions
include:
|
|
·
|
the
division of our board of directors into three classes serving staggered
three-year terms;
|
|
|
·
|
removal
of directors only for cause and only upon a 66 2/3% shareholder
vote;
|
|
|
·
|
prohibiting
shareholders from calling a special meeting of
shareholders;
|
|
|
·
|
the
ability to issue additional shares of our common stock or preferred stock
without shareholders’ approval; and
|
|
|
·
|
advance
notice requirements for raising business or making nominations at
shareholders’ meetings.
|
The
Indiana corporation law contains business combination provisions that, in
general, prohibit for five years any business combination with a beneficial
owner of 10% or more of our common stock unless the holder’s acquisition of the
stock was approved in advance by our board of directors. The Indiana corporation
law also contains control share acquisition provisions that limit the ability of
certain shareholders to vote their shares unless their control share acquisition
is approved.
Malicious
Human Actions and/or Catastrophic Events May Disrupt Our Operations and
Harm Our Operating Results
Despite
our implementation of network security measures, our servers are vulnerable to
computer viruses, break-ins, and similar disruptions from unauthorized tampering
with our computer systems. Any such event could have a material adverse effect
on our reputation and our business, operating results, and financial condition.
In addition, the continued threat of terrorism and heightened security and
military action in response to this threat, or any future acts of terrorism, may
cause further disruptions to the economies of the United States and other
countries and create further uncertainties or otherwise materially harm our
business, operating results, and financial condition. Likewise, events such as
widespread blackouts could have similar negative impacts. To the extent that
such disruptions or uncertainties result in delays or cancellations of customer
orders or the manufacture or shipment of our products, our business, operating
results and financial condition could be materially and adversely
affected.
A disruption or failure
of our systems or operations in the event of a major earthquake, weather event,
terrorist attack, or other catastrophic event could cause delays in completing
sales, providing services or performing other mission-critical functions. A
catastrophic event that results in the destruction or disruption of any of our
critical business or information technology systems could harm our ability to
conduct normal business operations and our operating results.
We
Cannot Predict Every Event and Circumstance That May Impact Our Business and,
Therefore, the Risks and Uncertainties Discussed Above May Not Be the Only Ones
You Should Consider
The risks
and uncertainties discussed above are in addition to those that apply to most
businesses generally. In addition, as we continue to grow our business, we may
encounter other risks of which we are not aware at this time. These additional
risks may cause serious damage to our business in the future, the impact of
which we cannot estimate at this time.
25
|
ITEM
1B.
|
None.
|
ITEM
2.
|
Our world
headquarters are located in approximately 200,000 square feet of space in two
office buildings in Indianapolis, Indiana. We lease the space under an operating
lease agreement and amendments which expire on March 31, 2018. In addition to
our world headquarters, we occupy a product distribution center in Indianapolis,
Indiana and three regional offices in the United States which are located in
Herndon, Virginia, Irvine, California and Columbia, South Carolina. We also
lease offices for each of our Canada, EMEA and APAC operations in Montreal,
Quebec, Berkshire, United Kingdom and Kuala Lumpur, Malaysia, respectively, and
have several other office leases throughout the United States and in 11 other
countries. We also rent office space for sales, services, development and
international offices under month-to-month leases. All of these leases are
short-term operating leases. In accordance with FASB ASC Topic 840, Leases (“FASB ASC 840”),
rental expense is recognized ratably over the lease period, including those
leases containing escalation clauses.
We
believe that all of our facilities, including our world headquarters, regional
offices and international offices in EMEA and APAC, are adequate and well suited
to accommodate our business operations. We continuously review space
alternatives to ensure we have adequate room for growth in the
future.
|
ITEM
3.
|
The
information set forth under "Legal Proceedings" in Note 12 of Notes to
Consolidated Financial Statements included in Item 8 of this Annual Report on
Form 10-K is incorporated herein by reference.
|
ITEM
4.
|
PART
II.
|
ITEM
5.
|
MARKET FOR REGISTRANT’S COMMON EQUITY, RELATED
STOCKHOLDER MATTERS AND ISSUER PURCHASES OF EQUITY
SECURITIES.
|
Market
Information
Our
common stock is traded on The NASDAQ Global Market under the ticker symbol ININ.
The following table sets forth, for the quarterly periods indicated, the high
and low common stock prices per share as reported by The NASDAQ Global
Market:
|
2009
|
2008
|
|||||||||||||||
|
Quarter Ended:
|
High
|
Low
|
High
|
Low
|
||||||||||||
|
March
31
|
$ | 9.62 | $ | 5.82 | $ | 26.99 | $ | 11.00 | ||||||||
|
June
30
|
13.85 | 8.80 | 13.71 | 10.88 | ||||||||||||
|
September
30
|
20.50 | 12.26 | 12.37 | 6.60 | ||||||||||||
|
December
31
|
24.00 | 15.60 | 9.48 | 5.51 | ||||||||||||
As
of February 26, 2010, there were 118 registered holders of record of our common
stock.
We have
never declared or paid cash dividends on our common stock and do not expect to
declare or pay any cash dividends in the foreseeable future. We currently intend
to retain future earnings, if any, to finance operations and to expand our
business. Any future determination to declare or pay cash dividends will be at
the discretion of our Board of Directors and will depend upon our financial
condition, operating results, capital requirements and other factors that our
Board of Directors deem relevant.
Share
Repurchase Program
On
July 28, 2008, our Board of Directors approved a share repurchase program,
pursuant to which we could purchase shares of our common stock up to a maximum
aggregate purchase price of $10.0 million. During the third and fourth quarters
of 2008, we repurchased 1,204,454 shares of our common stock under this share
repurchase program at an aggregate cost of $10.0 million. The Board has not
authorized any additional amounts under the share repurchase program, and we did
not repurchase any of our equity securities during 2009.
26
Performance
Graph
The
following graph compares the cumulative total return to shareholders of
our common stock from December 31, 2004 through December 31, 2009 with the
cumulative total return over such period of (i) the Standard & Poor’s 500
Stock Index (the S&P 500 Index) and (ii) the Research Data Group Software
Composite Index (the RDG Software Composite Index). The graph assumes an
investment of $100 on December 31, 2004 in each of our common stock, the S&P
500 Index and the RDG Software Composite Index (and the reinvestment of all
dividends). The performance shown is not necessarily indicative of future
performance. The comparisons shown in the graph below are based on historical
data and we caution that the stock price performance shown is not indicative of,
and is not intended to forecast, the potential future performance of our common
stock. Information used in the graph was obtained from Research Data Group,
a source believed to be reliable, but we are not responsible for any errors or
omissions in such
information.
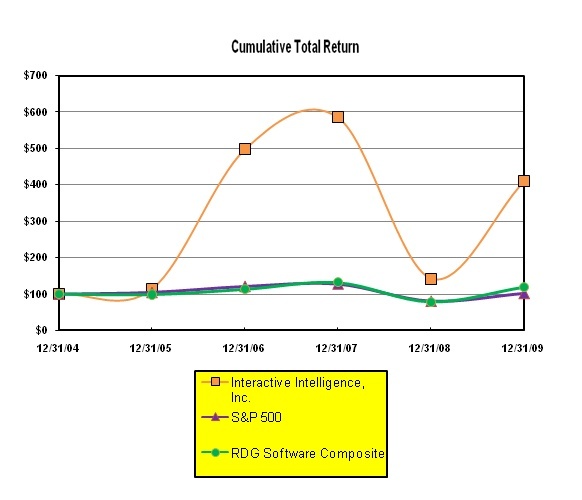
|
Cumulative
Total Return Years
Ended December 31,
|
||||||||||||||||||||||||
|
2004
|
2005
|
2006
|
2007
|
2008
|
2009
|
|||||||||||||||||||
|
Interactive
Intelligence, Inc.
|
$ | 100.00 | $ | 113.33 | $ | 498.22 | $ | 585.56 | $ | 142.44 | $ | 410.00 | ||||||||||||
|
S&P
500
|
100.00 | 104.91 | 121.48 | 128.16 | 80.74 | 102.11 | ||||||||||||||||||
|
RDG
Software Composite
|
100.00 | 98.74 | 113.28 | 131.87 | 78.34 | 119.34 | ||||||||||||||||||
The
preceding Performance Graph and related information shall not be deemed
“soliciting material,” or to be “filed” with the SEC, nor shall such information
be incorporated by reference in any filing of Interactive Intelligence, Inc.
under the Exchange Act or the Securities Act of 1933 whether made before or
after the date hereof and irrespective of any general incorporation language in
any such filing.
The
remaining information required by Item 5 concerning securities authorized for
issuance under our equity compensation plans is set forth in or incorporated by
reference to Part III, Item 12 of this Annual Report on Form 10-K.
ITEM
6. SELECTED CONSOLIDATED FINANCIAL DATA.
The
following selected consolidated financial data (in thousands, except per share
amounts) is qualified in its entirety by, and should be read in conjunction
with, Management’s Discussion and Analysis of Financial Condition and Results of
Operations and our Consolidated Financial Statements and the Notes thereto
contained in Items 7 and 8, respectively, of this Annual Report on Form 10-K.
There were no cash dividends declared per common share.
27
Consolidated
Statements of Operations Data:
|
Years
Ended December 31,
|
||||||||||||||||||||
|
2009
|
2008
|
2007
|
2006
|
2005
|
||||||||||||||||
|
Total
revenues
|
$ | 131,418 | $ | 121,406 | $ | 109,901 | $ | 83,044 | $ | 62,937 | ||||||||||
|
Gross
profit
|
91,564 | 82,268 | 74,648 | 59,071 | 47,374 | |||||||||||||||
|
Operating
income
|
14,441 | 6,948 | 8,106 | 5,007 | 2,389 | |||||||||||||||
|
Net
income
|
8,640 | 4,338 | 17,456 | 10,248 | 2,108 | |||||||||||||||
|
Net
income per share:
|
||||||||||||||||||||
|
Basic
|
$ | 0.51 | $ | 0.24 | $ | 1.00 | $ | 0.62 | $ | 0.13 | ||||||||||
|
Diluted
|
0.47 | 0.23 | 0.91 | 0.56 | 0.13 | |||||||||||||||
Consolidated
Balance Sheet Data:
|
As
of December 31,
|
||||||||||||||||||||
|
2009
|
2008
|
2007
|
2006
|
2005
|
||||||||||||||||
|
Cash
and cash equivalents and short-term
investments
|
$ | 64,979 | $ | 45,510 | $ | 46,327 | $ | 27,086 | $ | 15,127 | ||||||||||
|
Net
working capital
|
54,149 | 35,504 | 37,073 | 14,449 | 3,177 | |||||||||||||||
|
Total
assets
|
132,668 | 105,183 | 103,438 | 66,775 | 38,398 | |||||||||||||||
|
Total
shareholders’ equity
|
67,607 | 47,247 | 48,619 | 24,278 | 7,793 | |||||||||||||||
The
following Management’s Discussion and Analysis of Financial Condition and
Results of Operations is intended to provide investors with an understanding of
our past performance, our financial condition and our prospects and should be
read in conjunction with other sections of this Annual Report on Form 10-K,
including Part I, Item 1 “Business”; Part II, Item 6 “Selected Financial Data”;
and Part II, Item 8 “Financial Statements and Supplementary Data”. Investors
should carefully review the information contained in this report under Part I,
Item 1A “Risk Factors”. The following will be discussed and
analyzed:
|
·
|
Overview
|
|
·
|
Business
Strategy
|
|
·
|
Critical
Accounting Policies and Estimates
|
|
·
|
Financial
Highlights
|
|
·
|
Historical
Results of Operations
|
|
·
|
Liquidity
and Capital Resources
|
Overview
Interactive
Intelligence, Inc. (“Interactive Intelligence”, “we”, “us” or “our”) was formed
in 1994 as an Indiana corporation and maintains its world headquarters and
executive offices at 7601 Interactive Way, Indianapolis, IN 46278. Our telephone
number is (317) 872-3000. We are located on the web at http://www.inin.com.
We file annual, quarterly and current reports, proxy statements and other
documents with the SEC under the Exchange Act. These periodic and current
reports and all amendments to those reports are available free of charge on the
investor relations page of our website at http://investors.inin.com.
We are a
leading provider of software application suites for VoIP business communications
and are increasingly leveraging our leadership position in the worldwide contact
center market to offer our solutions to enterprises. Businesses and
organizations, including those that employ remote and mobile workers, utilize
our solutions in industries including, but not limited to, teleservices,
financial services (banks, credit unions, accounts receivable management),
insurance, higher education, healthcare, retail, technology, government and
business services. Our innovative software products and services are designed
for:
|
·
|
Multichannel
contact management and business communications (voice and messaging) using
the SIP global communications standard that supports
VoIP;
|
|
·
|
BPA
using a communications-based approach; and
|
|
·
|
Contact
management, including document as well as workflow
management.
|
With our
single software platform, organizations can replace various traditional
“multipoint” communications products. Our solutions incorporate a full-featured
media server, media gateways, SIP proxy, and SIP station voice device for
IP-based communications networks and infrastructures. Customers can deploy our
solutions on-premises or in a CaaS model using a hosted data
center.
28
Our
solutions integrate with business systems and end-user devices, enhance the
mobility of today’s remote workforce, scale to thousands of users, manage
content in large volumes, provide communications and data security and satisfy a
range of business communications and interaction management needs
for:
|
·
|
The
Contact Center
|
|
·
|
Enterprise
IP Telephony
|
|
·
|
Business
Process Automation
|
By
implementing our all-in-one solutions, businesses are able to unify multichannel
communications media (phone, fax, e-mail, web chat, content) and information,
automate business processes, enhance workforce performance and productivity,
improve customer service processes, and readily adapt to changing market and
customer requirements. Contact
centers can leverage our platform to support thousands of agents, including
remote “Work-at-Home” agents, and handle inbound, outbound and “blended”
inbound/outbound interactions, at one location or throughout multi-site contact
center operations. Our enterprise IP telephony solutions provide
call control and messaging for mid- and large-sized business
enterprises with 100
to several hundred thousand users, with the ability to scale user counts up or
down as needed. Enterprises, contact centers, and other organizations can
utilize our BPA solutions to automate processes using an approach that
incorporates communications functionality such as routing, quality monitoring,
and the ability to indicate employee availability.
Our
management monitors certain key measures to assess our financial results. In
particular, we track trends on product orders, contracted professional services,
and CaaS orders from quarter to quarter and in comparison to the prior year and
budget. Because salaries are our largest expense, we monitor staffing levels. As
noted below, macroeconomic conditions have materially affected the orders we
received in certain of our recent quarters. We review leading market indicators
to look for trends in economic conditions. In addition to orders and revenues,
management reviews costs of revenue and operating expenses to ensure we are
managing new expenditures and controlling costs. Finally, management monitors
diluted earnings per share, which is a key measure of performance that is also
used by analysts and investors. For
additional discussions regarding trends for 2009 and our expectations for
2010, see the “Financial Highlights” on page
32.
Business
Strategy
In the
coming year, we intend to continue building our brand awareness to increase our
penetration in the contact center and IP PBX markets. During 2010, we will begin
licensing our IPA product for business process automation and aim to become more
established in the market for content management, with our initial focus on the
insurance industry. We also plan to emphasize our new packaged approach to
professional services, market these services and enhanced product functionality
to existing customers, and focus on growing our CaaS offering as a viable option
that allows an organization to pay for a communications solution on a monthly
subscription basis. Our strategy for achieving this overall mission includes
multiple objectives, described as follows:
|
1.
|
Market
more effectively to our existing customers and go up-market in the contact
center market;
|
|
2.
|
Offer
our IPA application as a CBPA
solution;
|
|
3.
|
Enhance
our BPA offering with content management, with a focus on the insurance
vertical;
|
|
4.
|
Promote
our packaged services
offerings;
|
|
5.
|
Rapidly
grow our CaaS customer base;
|
|
6.
|
Continue
our innovation and enhance our core product
offerings;
|
|
7.
|
Expand
in our market for enterprise IP
telephony;
|
|
8.
|
Leverage
our relationships with multi-national partners to open new selling
opportunities;
|
|
9.
|
Develop
effective relationships with companies in specific vertical industries;
and
|
|
10.
|
Increase
awareness of our all-in-one solution and launch aggressive replacement
programs.
|
Critical
Accounting Policies and Estimates
We
believe our accounting policies listed below are important to understanding our
historical and future performance, as these policies affect our reported amounts
of revenues and expenses and are applied to significant areas involving
management’s judgments and estimates. Such accounting policies require
significant judgments, assumptions and estimates used in the preparation of our
consolidated financial statements included in Item 8 of this Annual Report on
Form 10-K, and actual results could differ materially from the amounts reported
based on these policies. These policies, and our procedures related to these
policies, are described below. See also Note 2 of Notes to Consolidated
Financial Statements included in Item 8 of this Annual Report on Form 10-K for a
further summary of our significant accounting policies and methods used in the
preparation of our consolidated financial
statements.
29
Sources
of Revenues and Revenue Recognition Policy
We
generate product revenues from licensing the right to use our software
applications and in certain instances selling hardware as a component
of our solution, and generate services revenues primarily from annual
support fees, annual renewal fees, professional services, educational services
and our CaaS offering. These revenues are generated by direct sales with
customers and by indirect sales through a partner channel.
Product
revenues
Our
license agreements are either perpetual or annually renewable. For
any revenues to be recognized from a license agreement, the following criteria
must be met:
|
·
|
Persuasive
evidence of an arrangement exists;
|
|
·
|
The
fee is fixed or determinable;
|
|
·
|
Collection
is probable; and
|
|
·
|
Delivery
has occurred.
|
For a
perpetual license agreement, upon meeting the revenue recognition criteria
above, we immediately recognize as product revenues the residual amount of the
total fees if sufficient vendor specific objective evidence of fair value
(“VSOE”) exists to support allocating a portion of the total fee to the
undelivered elements of the arrangement. If sufficient VSOE of fair value for
the undelivered elements does not exist, we recognize the initial license fee as
product revenues ratably over the initial term of the support agreement once
support is the only undelivered element. The support period is generally 12
months but may be up to 18 months for initial orders because support begins when
the licenses are downloaded, when support commences, or no more than six months
following the contract date. We determine VSOE of fair value for support in
perpetual agreements based on substantive renewal rates the customer must pay to
renew the support. The VSOE of fair value for other services is based on amounts
charged when the services are sold in stand-alone sales.
For an
annually renewable license agreement, upon meeting the revenue recognition
criteria above, we recognize a majority of the initial license fee as product
revenues ratably over the initial license period, which is generally 12 months,
and the remainder of the initial license fee is recognized as services revenues
over the same time period.
We
recognize revenues related to any hardware sales when the hardware is delivered
and all other revenue recognition criteria are met.
Services
revenues
Services
revenues are primarily recognized for support fees for perpetual license
agreements and renewal fees and support related to annually renewable license
agreements. For annually renewable agreements, the allocation of the order
between product revenues and services revenues is based on an average renewal
rate for our time based contracts. We apply the allocation of product revenues
and services revenues consistently to all annually renewable agreements. Under
annually renewable license agreements, after the initial license period, our
customers may renew their license agreement for an additional period, typically
12 months, by paying a renewal fee. The revenue from annual renewal fees is
classified under services revenue and the revenue is recognized ratably over the
contract period. Under perpetual license agreements, we recognize annual support
fees as services revenues ratably over the post-contract support period, which
is typically 12 months; however, customers have the option to prepay support up
to three years.
We also
generate revenues from other services that we provide to our customers and
partners. These additional revenues include fees for professional services,
educational services and CaaS. Revenues from professional services, which
include implementing our products for a customer or partner, educational
services, which consist of training courses for customers and partners, and
CaaS, which allows customers to deploy our solutions using a hosted data center,
are recognized as the related services are performed.
Goodwill
and Other Intangible Assets
We have
recorded goodwill and other intangible assets as a result of acquisitions
(discussed in further detail in Note 13 of Notes to Consolidated Financial
Statements included in Item 8 of this Annual Report on Form 10-K) in accordance
with FASB ASC Topic
350, Intangibles - Goodwill
and Other. We review our goodwill and intangible assets with indefinite
lives for impairment at least annually. Identifiable intangible assets such as
intellectual property trademarks and patents are amortized over a 10 to 15 year
period using the straight-line method. In addition, other intangible assets,
such as customer relationships and core technology, are amortized over a five to
six year period based upon historical patterns in which the economic benefits
are expected to be realized. We have one reporting segment and therefore our
impairment review of goodwill involves reviewing the impairment of the Company
as a whole. Because of this, we believe the risk of impairment to our goodwill
is minimal. The guidance requires us to perform the goodwill impairment test
annually or when a change in facts and circumstances indicates that the fair
value of an asset may be below its carrying amount. We performed our annual
goodwill impairment test as of September 30, 2009 and determined no indication
of impairment existed. As there were no changes in facts and circumstances that
indicated that the fair value of the reporting unit may have been below its
carrying amount since September 30, 2009, no additional impairment test was
performed during the fourth quarter of 2009.
30
Stock-Based
Compensation Expense
We
account for our employee and director stock options in accordance with FASB ASC
718, which requires the measurement and recognition of compensation expense for
all share-based payment awards made to employees and directors, based on fair
values. Consistent with FASB ASC 718, we continue to use the Black-Scholes
option-pricing model as our method of valuation for share-based payment awards.
Our determination of fair value of share-based payment awards on the date of
grant using the Black-Scholes option-pricing model is affected by our stock
price as well as assumptions regarding a number of highly complex and subjective
variables. These variables include, but are not limited to our expected stock
price volatility over the term of the awards and an expected risk-free rate of
return. If factors change and we use different assumptions for estimating
stock-based compensation expense associated with awards granted in future
periods, stock-based compensation expense may differ materially in the future
from that recorded in the current period.
We record
compensation expense for share-based awards using the straight-line method,
which is recorded into earnings over the vesting period of the award.
Stock-based compensation expense for employee and director stock options
recognized under FASB ASC 718 for the years ended December 31, 2009, 2008 and
2007 was $3.3 million, $3.0 million and $3.1 million, respectively. See Note 5
of Notes to Consolidated Financial Statements in Item 8 of this Annual Report on
Form 10-K for further information on our stock-based compensation.
Income
and Sales Taxes
Income
taxes are accounted for under the asset and liability method. Deferred tax
assets and liabilities are recognized for the future tax consequences
attributable to differences between the financial statement carrying amounts of
existing assets and liabilities and their respective tax bases and operating
loss and tax credit carryforwards. Deferred tax assets and liabilities are
measured using enacted tax rates expected to apply to taxable income in the
years in which those temporary differences are expected to be recovered or
settled. The effect on deferred tax assets and liabilities of a change in tax
rates is recognized in income in the period that includes the enactment
date.
FASB ASC
740 establishes financial accounting and reporting standards for the effect of
income taxes. We are subject to income taxes in both the United States and
numerous foreign jurisdictions. Significant judgment is required in evaluating
our tax positions and determining our provision for income taxes. The objectives
of accounting for income taxes are to recognize the amount of taxes payable or
refundable for the current year and deferred tax liabilities and assets for the
future tax consequences of events that have been recognized in an entity’s
financial statements or tax returns. Variations in the actual outcome of these
future tax consequences could materially impact our financial position, results
of operations or cash flows.
In
assessing the recoverability of deferred tax assets, our management considers
whether it is more likely than not that some portion or all of the deferred tax
assets will not be realized. The ultimate realization of deferred tax assets is
dependent upon generation of future taxable income during the periods in which
temporary differences such as loss carryforwards and tax credits become
deductible. Management considers projected future taxable income and tax
planning strategies in making this assessment and ensuring that the deferred tax
asset valuation allowance is adjusted as appropriate.
As of
December 31, 2009, we had $11.5 million of tax net operating loss carryforwards
which had not been recognized or recorded. In addition, we had $6.1 million in
tax credit carryforwards recorded as deferred tax assets. During the years ended
December 31, 2009 and 2008, we recorded tax expense of $6.4 million and $3.5
million, respectively, and during the year ended December 31, 2007, we recorded
a tax benefit of $7.8 million. There was no valuation allowance at December 31,
2009 because management considers it more likely than not that the deferred tax
assets will be realized. We will continue to evaluate the valuation of deferred
tax assets in accordance with the requirements of FASB ASC 740. See Note 10 of
Notes to Consolidated Financial Statements in Item 8 of this Annual Report on
Form 10-K for further information on our income taxes.
Sales tax
amounts collected from customers is recorded on a net basis.
Allowance
for Doubtful Accounts Receivable
The
allowance for doubtful accounts is our best estimate of the amount of probable
credit losses in our existing accounts receivable. We
evaluate bad debt expense based on a percentage of revenue reported and other
measures each period. We then review the allowance for doubtful accounts
each reporting period based on a detailed analysis of our accounts receivable.
In the analysis, we primarily consider the following attributes of the partner
or customer: the age of the receivable; their creditworthiness; the economic
conditions of their industry; and general economic conditions. If any of these
factors change, we may also change our original estimates, which could impact
the level of our future allowance for doubtful accounts. We have considered the
impact of the current economic conditions as part of our overall determination
of allowance for doubtful accounts.
If
payment is not made timely, we will contact the customer or partner to try to
obtain payment. If this is not successful, we will institute other collection
practices such as generating collection letters, involving our sales personnel
and ultimately terminating the customer’s or partner’s access to future
upgrades, licenses and technical support. Once all collection efforts are
exhausted, the receivable is written off against the allowance for doubtful
accounts.
Research
and Development
Research
and development expenditures are expensed as incurred. FASB ASC 985 requires
capitalization of certain software development costs subsequent to the
establishment of technological feasibility. Based on our product development
process, technological feasibility is established upon completion of a working
model. The costs we incur between completion of a working model and the point at
which a product is ready for general release have historically been
insignificant. Through December 31, 2009, all research and development costs
have been expensed. Research
and development expense for 2009, 2008 and 2007 was $24.1 million, $21.5 million
and $17.0 million, respectively.
Legal
Proceedings
Liabilities
for loss contingencies arising from claims, assessments, litigation, fines, and
penalties and other sources are recorded when it is probable that a liability
has been incurred and the amount of the assessment and/or remediation can be
reasonably estimated. Legal costs incurred in connection with loss contingencies
are expensed as incurred.
31
Financial
Highlights
For the
year ended December 31, 2009, we achieved 8% revenue growth from 2008, almost
doubled our net income, and increased our cash balance by approximately $20
million. Factors affecting our revenue performance in any particular year
include macroeconomic conditions, customer budget constraints, the availability
of personnel to implement our solutions, and willingness of customers to
implement critical telecommunications systems. Revenues in any particular period
can greatly fluctuate from other periods.
The following table sets forth
information about our total revenues (in millions) and the annual growth
percentage over the previous year for the past five years (including the impact
of the reclassifications and adjustments discussed in Note 2 of Notes to
Consolidated Financial Statements).
|
Year:
|
Revenues
|
%
Growth
|
||||||
|
2009
|
$ | 131.4 | 8 | % | ||||
|
2008
|
121.4 | 10 | ||||||
|
2007
|
109.9 | 32 | ||||||
|
2006
|
83.0 | 32 | ||||||
|
2005
|
62.9 | 14 | ||||||
We
believe that the slower growth rates in 2008 and 2009 were primarily
due to the instabilities of the economy worldwide, which has resulted in longer
sales cycles for both new and existing customers. Prospective customers have
been more hesitant to commit to new capital purchases and some existing
customers have delayed purchases of additional software and hardware as they
maintain or reduce staffing levels. When the economy started to stabilize during
the third and fourth quarters of 2009, we began to see improved sales cycles and
believe this trend will continue into 2010.
During
the fourth quarter of 2009, we received one order from our partner channel which
is expected to generate more than $7.0 million in product and services revenues
in 2009 and 2010. We recognized $2.3 million in product revenues and $128,000 in
services revenues during the fourth quarter of 2009 related to this order and
anticipate recognizing the remainder of the product revenues during the first
two quarters of 2010 and the majority of the service revenues in
2010.
Product
revenues increased during 2009 primarily due to a 4% increase in the dollar
amount of product orders received compared to 2008. This increase was primarily
due to an increase in orders from existing customers. In addition, in 2009 we
received seven product orders that were greater than $1.0 million compared to
four orders over $1.0 million in 2008. Finally, perpetual license orders, which
typically have a significant portion of the revenue recognized immediately,
increased to 86% of license orders in 2009 compared to 84% of license orders in
2008.
Services
revenues increased by $7.2 million during 2009 compared to 2008, primarily due
to increased maintenance and support fees from our expanding customer base and
higher revenues from our CaaS related services. Revenues from CaaS orders are
recognized ratably over the life of these contracts, which are typically three
to four years. During the third quarter of 2009, we received orders for future
CaaS services revenues of at least $3.6 million, with two of the orders over
$1.0 million each. These orders represent a significant increase in CaaS
contract amounts compared to those we received in previous periods. Although
some costs related to CaaS are fixed, others are variable based on usage and
call volume. As a result, we expect our services expenses to increase as the
revenues from these orders are recognized over the next three to four
years.
Cost of
products increased by $2.0 million during 2009 compared to 2008 primarily as a
result of an increase of $1.7 million in cost of goods sold as more customers
included more hardware and appliances in their orders. Cost of services
decreased by $1.3 million during 2009 compared to 2008 primarily due to a
decrease in compensation and travel expenses, partially offset by an increase in
CaaS related expenses.
Total
operating expenses, which include sales and marketing, research and development
and general and administrative expenses, increased by $1.8 million, or 2%,
during 2009 compared to 2008. Compensation expense increased $3.0 million during
2009 primarily due to increased incentive compensation expense as operating
performance improved year-over-year. Allocable corporate expenses,
including rent and internal depreciation, also increased in 2009 reflecting a
full year’s worth of rent and depreciation expense related to office and
building expansions that were completed in 2008. Partially offsetting these
increases were decreases in travel and entertainment expenses and fees paid to
third parties for customer referrals. In addition, during the fourth quarter of
2008 we reached a settlement with the French Taxing Authority related to a value
added tax (“VAT”) claim in which we were refunded $577,000 and applied this
amount as a reduction to 2008 operating expenses, split among each department,
as that is where the expense was initially accrued.
On May
15, 2009, we entered into a stock purchase agreement with AcroSoft, a provider
of insurance content management solutions, pursuant to which we purchased 100%
of AcroSoft’s issued and outstanding shares of capital stock for an aggregate
purchase price of $2.2 million funded with cash available from operations. Ten
percent of the purchase price, or $240,000, was deposited into an escrow account
to ensure funds were available to pay any indemnification claims. We acquired
AcroSoft to integrate their document management and workflow functionality into
our Interaction Center Platform, including our IPA application. Over time,
we also anticipate extending the integrated solution to other document-intensive
industry vertical and horizontal processes. AcroSoft's results of operations
were included in our consolidated financial statements subsequent to the
acquisition.
As of
December 31, 2009, we had approximately $11.5 million in stock-based
compensation deductions, which had not been recorded or recognized, available to
offset taxable income and $5.9 million of various tax credit carryforwards. In
addition, we had a deferred tax asset of $121,000 available to offset future
taxable income related to a subsidiary. During 2010, we expect taxes paid in
cash to increase by approximately $100,000 to $200,000 each quarter as a result
of various states where we have utilized all of our tax loss carryforwards and
certain states which have enacted new revenue enhancing programs.
In 2010
we believe that our year-over-year revenues will increase by approximately 10%,
which should also improve our net income. We expect an increase in operating
expenses as we continue to invest in research and development, expand our
marketing efforts, and hire additional staff in various
departments.
32
Historical
Results of Operations
The
following table sets forth, for the periods indicated, our consolidated
financial information expressed as a percentage of total revenues:
|
Years
Ended December 31,
|
||||||||||||
|
2009
|
2008
|
2007
|
||||||||||
|
Revenues:
|
||||||||||||
|
Product
|
48 | % | 50 | % | 52 | % | ||||||
|
Services
|
52 | 50 | 48 | |||||||||
|
Total
revenues
|
100 | 100 | 100 | |||||||||
|
Cost
of revenues:
|
||||||||||||
|
Product
|
13 | 13 | 13 | |||||||||
|
Services
|
17 | 19 | 19 | |||||||||
|
Total
cost of revenues
|
30 | 32 | 32 | |||||||||
|
Gross
profit
|
70 | 68 | 68 | |||||||||
|
Operating
expenses:
|
||||||||||||
|
Sales
and marketing
|
30 | 32 | 33 | |||||||||
|
Research
and development
|
18 | 18 | 16 | |||||||||
|
General
and administrative
|
11 | 12 | 12 | |||||||||
|
Total
operating expenses
|
59 | 62 | 61 | |||||||||
|
Operating
income
|
11 | 6 | 7 | |||||||||
|
Other
income:
|
||||||||||||
|
Interest
income, net
|
-- | 1 | 2 | |||||||||
|
Other
expense
|
-- | -- | -- | |||||||||
|
Total
other income
|
-- | 1 | 2 | |||||||||
|
Income
before income taxes
|
11 | 7 | 9 | |||||||||
|
Income
tax benefit (expense)
|
(4 | ) | (3 | ) | 7 | |||||||
|
Net
income
|
7 | % | 4 | % | 16 | % | ||||||
Comparison
of Years Ended December 31, 2009, 2008 and 2007
Revenues
Primary
Sources of Revenues
We
generate revenues from: (i) product revenues, which include licensing the right
to use our software applications and, in certain instances, selling hardware as
a component of our solutions; and (ii) services revenues, which include annual
support fees, annual renewal fees, professional services fees, educational
services fees and our CaaS offering. Services revenues are primarily recognized
for renewal fees and support related to annually renewable license agreements
and support fees for perpetual license agreements. These revenues are generated
by direct sales to customers and by indirect sales through our partner
channel.
|
Product
Revenues
|
Years
Ended December 31,
|
|||||||||||
|
2009
|
2008
|
2007
|
||||||||||
|
($
in thousands)
|
||||||||||||
|
Product
revenues
|
$ | 63,099 | $ | 60,256 | $ | 57,673 | ||||||
|
Change
from prior year period
|
5 | % | 4 | % | 34 | % | ||||||
|
Percentage
of total revenues
|
48 | % | 50 | % | 52 | % | ||||||
Not all
software and hardware product orders are recognized as revenues when they are
received because of certain contractual terms or the collection history with
particular customers or partners. Consequently, product revenues for any
particular period not only reflect orders received in the current period but
also orders received in previous periods and recognized in the current period.
In addition, product orders include first year support, which is deferred and
recognized over the support period.
33
Product
revenues increased by $2.8 million during 2009 compared to 2008 primarily due to
a 6% increase in the dollar amount of orders received from existing customers,
mainly in North America and Europe. The dollar amount of orders from new
customers in 2009 was comparable to 2008. In 2009 we received seven orders that
were greater than $1.0 million, with three of these orders from existing
customers, compared to four in 2008, with one of these orders from existing
customers. We believe the increases in the number and dollar amount of orders
received were due to the economy beginning to stabilize during the second half
of 2009 and customers making purchasing decisions they had previously delayed.
We believe these increases reflect our developing abilities to sell to larger
customers with the increased scalability of our products. Finally, perpetual
license orders, which typically have a significant portion of the revenue
recognized immediately, were 86% of total product orders in 2009 compared to 84%
in 2008.
During
the fourth quarter of 2009 we received one order from our partner channel which
is expected to generate product revenues greater than $5.0 million in 2009 and
2010. We recognized $2.3 million in product revenues during the fourth quarter
of 2009 and anticipate recognizing $1.5 million and $1.3 million during the
first and second quarters of 2010, respectively. We anticipate higher cost of
sales related to this order in the first quarter of 2010.
In 2008,
the dollar amount of product orders increased by 5% from 2007. The dollar amount
of orders from new customers increased 24%, which we believe resulted from the
demonstrated return on investment and improvement in operations that results
from implementing our solutions. The dollar amount of orders from our existing
customers, however, decreased by 6%. As the economy began to weaken during the
second half of 2008, customers delayed making capital purchases and more closely
monitored expenses. We also experienced an increase of 50% in the dollar amount
of orders for our media server and gateway appliances along with other hardware
we deliver as part of our solutions, which contributed to an increase in product
cost. The increase in the dollar amount of third-party hardware orders was
primarily due to increased marketing efforts that we made during 2008 to
encourage customers to purchase hardware from us rather than from other
vendors.
Product
revenues can fluctuate from period to period depending on the mix of contracts
sold between perpetual licenses and annually renewable licenses. While the
majority of our product licenses are perpetual, we have certain customers, whose
original license contracts were signed prior to 2004, with renewable term
licenses, representing 14%, 16% and 20% of total product orders in 2009, 2008
and 2007, respectively. Generally, orders for perpetual licenses result in a
significant portion of the contract value being recognized when received if
recognition criteria are satisfied, while renewable term licenses are recognized
ratably over the term of the agreement, generally one year. The impact of the mix of
contracts on our product revenues occurs only in the year of a product order;
subsequent renewal fees received for annually renewable licenses and renewal
support fees for perpetual contracts are all allocated entirely to services
revenues.
Our
geographic mix of licenses has been relatively constant over 2009, 2008 and
2007, with the Americas contributing 71% to 74%, EMEA contributing 21% to 22%,
and APAC contributing 5% to 8% of the total contracts in any one
year.
|
Services
Revenues
|
Years
Ended December 31,
|
|||||||||||
|
2009
|
2008
|
2007
|
||||||||||
|
($
in thousands)
|
||||||||||||
|
Services
revenues
|
$ | 68,319 | $ | 61,150 | $ | 52,228 | ||||||
|
Change
from prior year period
|
12 | % | 17 | % | 30 | % | ||||||
|
Percentage
of total revenues
|
52 | % | 50 | % | 48 | % | ||||||
Services
revenues include the portion of license arrangements allocated to maintenance
and support from annually renewable and perpetual contracts, renewals of
annually renewable licenses and maintenance contracts, and revenues from
professional services, CaaS and education. Revenues related to our renewal and
support fees represented approximately 77%, 77% and 76% of our total services
revenues for 2009, 2008 and 2007, respectively.
Services
revenues increased by $7.2 million during 2009 compared to 2008 primarily due to
increased maintenance and support fees of $5.4 million resulting primarily from
continued growth in our installed base of customers. The increase in services
revenues was also due to growth in CaaS revenues of $1.2 million, or 59%, during
2009. During the third quarter of 2009, we received four large orders for our
CaaS solutions for at least $3.6 million in future revenues in which the
majority will be recognized over the next three to four years. We recognized
$115,000 related to these contracts in 2009. We believe our CaaS services
revenues will continue to grow as more customers utilize hosted delivery of
software for their information technology needs instead of licensing software
and purchasing hardware and hiring additional technical employees.
During
the fourth quarter of 2009, we received one order from our partner channel which
is expected to generate more than $2.6 million of services revenues and will be
recognized over seven quarters. We recognized $128,000 in services revenues
during the fourth quarter of 2009 related to this order and anticipate
recognizing $2.0 million during 2010 and $527,000 during 2011.
The
increase in services revenues in 2008 of $8.9 million compared to 2007 was
primarily due to increases in our growing installed base of customers and
increases in related payments of annually renewable license fees and support
fees for perpetual licenses. Education and CaaS revenues increased by $404,000
and $900,000, respectively. The increase in education revenues was due to a
larger number of partners and customers attending our global training sessions.
CaaS revenues increased because more customers opted to purchase a hosted
solution.
Support
and license renewal rates were approximately 90% during each of the last three
years. Renewal rates for license and support fees have not materially changed in
2009.
Services
revenues have and will fluctuate based on dollar amount of orders and license
renewals, the number of attendees at our educational classes, the amount of
assistance our customers and partners need for implementation and installation
and CaaS adoption. The actual percentage fee charged for renewal of annually
renewable licenses and perpetual support agreements as compared to the initial
annually renewable license fee and perpetual license, respectively, is
comparable on a relative percentage basis, and therefore, the mix of these types
of contracts in the future is not expected to impact our future services
revenues. We believe services revenues will continue to grow as we continue to
license our solutions to new customers and expand existing customer
implementations.
34
|
Cost
of Revenues
|
Years
Ended December 31,
|
|||||||||||
|
2009
|
2008
|
2007
|
||||||||||
|
($
in thousands)
|
||||||||||||
|
Cost
of revenues:
|
||||||||||||
|
Product
|
$ | 17,452 | $ | 15,446 | $ | 14,159 | ||||||
|
Services
|
22,402 | 23,692 | 21,094 | |||||||||
|
Total
cost of revenues
|
$ | 39,854 | $ | 39,138 | $ | 35,253 | ||||||
|
Change
from prior year period
|
2 | % | 11 | % | 47 | % | ||||||
|
Product
cost as a % of product gross revenues
|
28 | % | 26 | % | 25 | % | ||||||
|
Services
cost as a % of services gross revenues
|
33 | % | 39 | % | 40 | % | ||||||
Cost of
product consist of hardware costs (including media servers and Interaction
Gateway appliances that we develop, as well as servers, telephone handsets and
gateways that we purchase and resell), royalties for third-party software and
other technologies included in our solutions, personnel costs, product
distribution facility costs and software packaging costs (including product
media and documentation duplication). Cost of product can fluctuate
depending on which software applications are licensed to our customers and
partners, the third-party software that is licensed by the end-user from us as
part of our software applications and the dollar amount of orders for hardware
and appliances.
Cost of
product increased $2.0 million in 2009 from 2008 primarily because more
customers purchased hardware from us when implementing our
solutions.
The $1.3
million increase in these costs in 2008 compared to 2007 was primarily due to
higher sales of our enterprise solution, which includes a hardware component, as
well as an increase in sales of our Interaction Gateway and media
servers.
Cost of
services consist primarily of compensation expenses for technical support,
professional services and educational personnel as well as costs associated with
our CaaS offering. Cost of services decreased by $1.3 million in 2009 from
2008 primarily due to lower compensation expenses of $1.2 million and
travel-related expenses of $763,000, both the result of a reduction in services
staff during the first three quarters of 2009. Partially offsetting these
decreases was an increase of $606,000 in CaaS expenses primarily related to data
center and associated hosting costs. We believe CaaS expenses will continue to
increase as our CaaS business grows.
Cost of
services increased in 2008 from 2007 primarily due to a $1.9 million increase in
compensation expense for our services personnel as a result of an increase in
staffing.
|
Gross
Profit
|
Years
Ended December 31,
|
|||||||||||
|
2009
|
2008
|
2007
|
||||||||||
|
($
in thousands)
|
||||||||||||
|
Gross
profit
|
$ | 91,564 | $ | 82,268 | $ | 74,648 | ||||||
|
Change
from prior year period
|
11 | % | 10 | % | 26 | % | ||||||
|
Percentage
of total revenues
|
70 | % | 68 | % | 68 | % | ||||||
Gross
profit as a percentage of total revenues in any particular period reflects the
amount of product and services revenues recognized and cost of product and
services incurred.
Gross
profit increased during 2009 compared to 2008 primarily due to an increase in
product and services revenues and minimal increases in the cost of product and
services.
The
overall increase in gross profit from 2007 to 2008 was the result of an increase
in our services margin in 2008 due to an increase in license renewal and support
revenues.
35
Operating
Expenses
|
Sales
and Marketing
|
Years
Ended December 31,
|
|||||||||||
|
2009
|
2008
|
2007
|
||||||||||
|
($
in thousands)
|
||||||||||||
|
Sales
and marketing expenses
|
$ | 39,141 | $ | 39,307 | $ | 36,331 | ||||||
|
Change
from prior year period
|
0 | % | 8 | % | 23 | % | ||||||
|
Percentage
of total revenues
|
30 | % | 32 | % | 33 | % | ||||||
|
Percentage
of net product revenues
|
86 | % | 88 | % | 83 | % | ||||||
Sales and
marketing expenses primarily include compensation, travel, and promotional costs
related to our sales, marketing and channel management operations. These expenses decreased
slightly during 2009 compared to 2008 due to decreases in travel and
entertainment expenses of $636,000, fees paid to third parties for customer
referrals of $233,000, and outsourced services of $223,000 as we focused on cost
management in 2009. Partially offsetting these decreases were increases in
commissions and incentives of approximately $1.0 million resulting from
increased sales and related revenues. We expect marketing costs to increase in
2010 as we increase our marketing efforts.
Sales and
marketing compensation expense increased $1.6 million in 2008 from 2007
primarily due to an increase in staffing. Corporate marketing expenses increased
$443,000 due to increases in advertising, public relations and marketing related
events from efforts to continue to increase our brand awareness and
distribution. Allocated rent expense and depreciation increased by $203,000 and
$236,000, respectively, due to staff additions in the sales and marketing
departments. These increases were partially offset by $151,000 of the VAT refund
allocated to sales and marketing.
|
Research
and Development
|
Years
Ended December 31,
|
|||||||||||
|
2009
|
2008
|
2007
|
||||||||||
|
($
in thousands)
|
||||||||||||
|
Research
and development expenses
|
$ | 24,103 | $ | 21,539 | $ | 17,040 | ||||||
|
Change
from prior year period
|
12 | % | 26 | % | 25 | % | ||||||
|
Percentage
of total revenues
|
18 | % | 18 | % | 16 | % | ||||||
Research
and development expenses are comprised primarily of compensation and
depreciation expenses. These expenses increased by $2.6 million during 2009
compared to 2008 primarily due to an increase in compensation expense of $1.8
million and a 16% increase in staff resulting from the AcroSoft
acquisition in the second quarter of 2009 and other hires. In addition,
corporate expenses allocated to research and development increased $721,000
primarily due to an increase in rental rates and a new office in Canada.
Depreciation costs increased primarily due to the expansion of our world
headquarters.
In
2008 research and development compensation expense increased $3.5 million from
2007 due to an increase in staffing. Allocated rent and depreciation expense
also increased by $524,000 and $330,000, respectively, due to these staff
additions.
We
believe that investment in research and development is critical to our future
growth, particularly because our competitive position in the marketplace is
directly related to the timely development of new and enhanced solutions that
are essential to our business. As a result, we expect research and development
expenses will continue to increase in future periods.
|
General
and Administrative
|
Years
Ended December 31,
|
|||||||||||
|
2009
|
2008
|
2007
|
||||||||||
|
($
in thousands)
|
||||||||||||
|
General
and administrative expenses
|
$ | 13,879 | $ | 14,474 | $ | 13,171 | ||||||
|
Change
from prior year period
|
(4 | )% | 10 | % | 20 | % | ||||||
|
Percentage
of total revenues
|
11 | % | 12 | % | 12 | % | ||||||
General
and administrative expenses include salary and incentive compensation expense as
well as general corporate expenses that are not allocable to other departments,
such as legal and other professional fees and bad debt expense.
General
and administrative expenses decreased by $595,000 during 2009 compared to 2008.
This decrease was due to reductions in salary expense of $655,000 resulting from
staff reductions, fees paid to third parties for customer referrals of $262,000,
bad debt expense of $217,000 and travel and entertainment expense of $170,000.
Partially offsetting these decreases was an increase in incentive expense of
$800,000 resulting from the increased operating profit during the
year.
36
General
and administrative compensation related expense increased $595,000 in 2008 from
2007 primarily due to staff additions, as well as increases in non-allocable
office expense and supplies of $241,000 and professional services related to
accounting, legal and tax fees of $169,000. We also recognized an increase in
foreign exchange translation losses of $110,000 in 2008 compared to 2007. These
increases were partially offset by $147,000 of the VAT refund allocated to
general and administration expense.
Other
Income (Expense)
Interest
Income, Net
|
Years
Ended December 31,
|
||||||||||||
|
2009
|
2008
|
2007
|
||||||||||
|
($
in thousands)
|
||||||||||||
|
Cash,
cash equivalents and short-term investments (average)
|
$ | 55,245 | $ | 45,919 | $ | 36,707 | ||||||
|
Interest
income, gross
|
281 | 1,288 | 1,729 | |||||||||
|
Return
on investments
|
1.0 | % | 3.0 | % | 5.0 | % | ||||||
Interest
income, net, primarily consists of interest earned from investments and
interest-bearing cash accounts. Interest expense and fees, which are not
material for any years reported, are also included in this
category.
Interest
earned on investments decreased in 2009 compared to 2008, and in 2008 compared
to 2007, as a result of lower interest rates from decreasing interest yields on
investments. In response to the financial crisis that began in 2008 and
continued in 2009, we transferred the majority of our liquid investments into
money market funds that are secured by low risk government
securities.
We
continue to monitor the allocation of funds in which we have invested to
maximize our return on investment while utilizing safe investment alternatives
within our established investment policy. We do not have any investments in
subprime assets.
|
Other
Income (Expense), Net
|
Years
Ended December 31,
|
|||||||||||
|
2009
|
2008
|
2007
|
||||||||||
|
($
in thousands)
|
||||||||||||
|
Other
income (expense), net
|
$ | 298 | $ | (435 | ) | $ | (208 | ) | ||||
Other
income (expense), net, includes foreign currency transaction gains and losses.
Foreign currency transaction gains and losses can fluctuate based on the amount
of revenue that is generated in certain international currencies (particularly
the Euro), the exchange gain or loss that results from foreign currency
disbursements and receipts, and the cash balances and exchange rates at the end
of a reporting period. In 2007, other income (expense) included foreign
withholding expenses. In 2008 and 2009, we determined that we had sufficient and
appropriate foreign source income to record our foreign withholdings as a tax
credit instead of a deduction to taxable income.
Other
income in 2009 included $310,000 related to foreign currency gains, and the
expense in 2008 included $399,000 related to foreign currency losses, both with
immaterial foreign tax withholdings. The expense in 2007 consisted of $26,000 of
gains related to realized foreign currency transactions and $233,000 of foreign
tax withholdings.
|
Income
Tax Benefit (Expense)
|
Years
Ended December 31,
|
|||||||||||
|
2009
|
2008
|
2007
|
||||||||||
|
($
in thousands)
|
||||||||||||
|
Income
tax benefit (expense)
|
$ | (6,380 | ) | $ | (3,464 | ) | $ | 7,837 | ||||
As of
December 31, 2009, we had approximately $11.5 million in stock-based
compensation deductions available to offset taxable income which had not been
recorded as an asset but will be recognized when realized as a reduction of
taxes payable. The tax benefit of these deductions will be primarily
recorded as a credit to additional paid-in capital. We also had $5.9
million of various tax credit carryforwards and a deferred tax asset of $121,000
available to offset future taxable income related to a subsidiary. There was no
valuation allowance at December 31, 2009, 2008 or 2007. We recorded income tax
expense of $6.4 million in 2009; however, due to the tax net operating loss
carryforwards, the tax credit carryforwards and stock option compensation
deductions, cash payments for income taxes were minimal, and we do not expect to
have a substantial cash payment of income taxes until 2011.
For the
year ended December 31, 2009, $548,000 of the income tax expense was expected to
result in cash payments and the remaining amount was offset by the utilization
of our net operating losses. We have significant remaining credits and losses to
offset taxable income and taxes payable as described in Note 10 of Notes to
Consolidated Financial Statements in Item 8 of this Annual Report on Form 10-K.
Our effective tax rate was 43% for the year ended December 31, 2009. The tax
rate is determined by considering the federal tax rate, rates in various states
and international jurisdictions in which we have operations, and a portion of
the amount of stock-based compensation that is not deductible for income
tax purposes.
37
During 2010, we expect taxes paid in cash to increase by
approximately $100,000 to $200,000 each quarter as a result of various states
where we have utilized all of our tax loss carryforwards and certain states
which have enacted new revenue enhancing programs.
Liquidity
and Capital Resources
We
generate cash from the collections related to licensing our products as well as
from selling hardware, renewals of annual licenses and maintenance and support
agreements, and the delivery of other services. In 2009 we also
received $2.2 million in cash from employees exercising stock options. We use
cash primarily for paying our employees (including salaries, commissions and
benefits), leasing office space, paying travel expenses, marketing activities,
paying vendors for hardware, other services and supplies, and purchasing
property and equipment. During the last six months of 2008, we repurchased $10.0
million of our common stock, and during the second quarter of 2009, we acquired
AcroSoft for $2.2 million in cash. We continue to be debt
free.
We
determine liquidity by combining cash and cash equivalents and short-term
investments as shown in the table below. Based on our recent performance and
current expectations, we believe that our current liquidity position, when
combined with our anticipated cash flows from operations, will be sufficient to
satisfy our working capital needs and current or expected obligations associated
with our operations over the next 12 months. Our future requirements will depend
on many factors, including cash flows from operations, territory expansion and
product development decisions and potential acquisitions. If our liquidity is
not sufficient to cover our needs, we may be forced to raise additional capital,
either through the capital markets or debt financings, and may not be able to do
so on favorable terms or at all.
|
December
31,
|
||||||||
|
2009
|
2008
|
|||||||
|
($
in thousands)
|
||||||||
|
Cash
and cash equivalents
|
$ | 48,497 | $ | 34,705 | ||||
|
Short-term
investments
|
16,482 | 10,805 | ||||||
|
Total
liquidity
|
$ | 64,979 | $ | 45,510 | ||||
On
October 17, 2007, October 23, 2007, and October 26, 2007, we filed separately
with the SEC the first, second and third amendments, respectively, to the
registration statement on Form S-3 utilizing the “shelf” registration process,
which was originally filed on October 19, 2006. This registration statement, as
amended, was declared effective by the SEC on October 31, 2007 and will allow us
to offer and sell up to 3,000,000 shares of our common stock from time to time
in one or more transactions. In addition, under this shelf registration
statement, as amended, Dr. Donald E. Brown, our Chairman of the Board, President
and CEO, registered 1,000,000 shares of our common stock that he owns for sale
from time to time. Although the shelf registration statement, as amended, will
permit us to offer and sell up to 3,000,000 shares of our common stock, doing so
remains at the discretion of our Board of Directors, and there is no assurance
that we would be able to complete any such offering of our common
stock.
The
following table shows cash flows from operating activities, investing activities
and financing activities for the stated periods:
|
Years
Ended December 31,
|
|||||||||||||
|
2009
|
2008
|
2007
|
|||||||||||
|
($
in thousands)
|
|||||||||||||
|
Beginning
cash and cash equivalents
|
$ | 34,705 | $ | 29,359 | $ | 13,531 | |||||||
|
Cash
provided by operating activities
|
15,083 | 15,180 | 20,154 | ||||||||||
|
Cash
used in investing activities
|
(9,676 | ) | (1,162 | ) | (8,085 | ) | |||||||
|
Cash
provided by (used in) financing activities
|
8,385 | (8,672 | ) | 3,759 | |||||||||
|
Ending
cash and cash equivalents
|
$ | 48,497 | $ | 34,705 | $ | 29,359 | |||||||
Cash
provided by operating activities during all three years was generated primarily
by our profitability net of ordinary fluctuations in our operating assets and
liabilities. The cash used in investing activities increased during 2009
compared to 2008 due to the transferring of the majority of our liquid
investments into money market funds during 2009 in response to the financial
crisis. During 2008 and 2007 the cash used in investing activities related
primarily to property, plant and equipment purchases due to office expansions
and purchases of available-for-sale investments, partially offset by sales of
available-for-sale investments. Cash provided by financing activities increased
in 2009 primarily due to an increase in proceeds from stock options exercised
and tax benefits from stock-based compensation as well as no repurchases of our
common stock in 2009 compared to stock repurchases totaling $10.0 million in
2008. During 2007, the cash provided by financing activities was mainly due to
proceeds from stock options that were exercised during the year.
Contractual
Obligations
The following amounts set forth in the table are as of December 31, 2009 (in
thousands):
|
Payments
Due by Period
|
||||||||||||||||||||
|
Total
|
Less
than
1
Year
|
1-3
Years
|
3-5
Years
|
More
than
5
Years
|
||||||||||||||||
|
Contractual Obligations
|
||||||||||||||||||||
|
Operating
lease obligations
|
$ | 38,381 | $ | 5,257 | $ | 9,277 | $ | 9,085 | $ | 14,762 | ||||||||||
|
Purchase
obligations
|
9,277 | 2,161 | 7,116 | -- | -- | |||||||||||||||
|
Other
obligations reflected on the consolidated balance sheet under
GAAP
|
910 | -- | -- | 910 | -- | |||||||||||||||
|
Total
|
$ | 48,568 | $ | 7,418 | $ | 16,393 | $ | 9,995 | $ | 14,762 | ||||||||||
As set
forth in the Contractual Obligations table, we have operating lease obligations
and purchase obligations that are not recorded in our consolidated financial
statements. The operating lease obligations represent future payments on leases
classified as operating leases and disclosed pursuant to FASB ASC 840. These
obligations include the amended operating lease of our world headquarters and
the leases of several other buildings for our offices in the United States and
eight other countries. See Note 7 of Notes to Consolidated Financial
Statements in Item 8 of this Annual Report on Form 10-K for further discussion
on our lease commitments.
38
In
addition, we have signed obligations for activities after December 31,
2009, such as the global user forum and partner conferences, which are
included in our purchase obligations. Finally, other obligations include amounts
regarding our tax liabilities and uncertain tax positions related to FASB ASC
740. See Note 10 of Notes to Consolidated Financial Statements in Item 8 of this
Annual Report on Form 10-K for further discussion on our uncertain tax
positions.
In
addition to the amounts set forth in the table above, we have contractual
obligations with certain third-party technology companies to pay royalties to
them based upon future licensing of their products and patented
technologies. We also have a purchase obligation with a third party
in which the known payments due are currently classified above in the one to
three year category. However, after three years the payments due will be based
on a percentage of our revenues, and are therefore unknown. We cannot estimate
what these future amounts will be; however, we expect them to increase as our
revenues continue to grow.
Off-Balance
Sheet Arrangements
Except as
set forth above in the Contractual Obligations table, we have no off-balance
sheet arrangements that have or are reasonably likely to have a current or
future impact on our financial condition, changes in financial condition,
revenues or expenses, results of operations, liquidity, capital expenditures or
capital resources as of December 31, 2009.
We
provide indemnifications of varying scope and amount to certain customers
against claims of intellectual property infringement made by third parties
arising from the use of our products. Our
direct software license agreements, in accordance with FASB ASC Topic 460, Guarantees, include certain
provisions for indemnifying customers, in material compliance with their license
agreement, against liabilities if our software products infringe upon a third
party's intellectual property rights, over the life of the agreement. There is
no maximum potential amount of future payments set under the guarantee. However,
we may at any time and at our option and expense: (i) procure the right of
the customer to continue to use our software that may infringe a third party’s
rights; (ii) modify our software so as to avoid infringement; or (iii) require
the customer to return our software and refund the customer the fee actually
paid by the customer for our software less depreciation based on a five-year
straight-line depreciation schedule. The customer’s failure to provide
timely notice or reasonable assistance will relieve us of our obligations under
this indemnification to the extent that we have been actually and materially
prejudiced by such failure. To date, we have not incurred, nor do we expect to
incur, any material related costs and, therefore, have not reserved for such
liabilities.
Our
software license agreements also include a warranty that our software products
will substantially conform to our software user documentation for a period of
one year, provided the customer is in material compliance with the software
license agreement. To date, we have not incurred any material costs associated
with these product warranties, and as such, we have not reserved for any such
warranty liabilities in our operating results.
We
develop software application products in the United States and license our
products worldwide. As a result, our financial results could be affected by
market risks, including changes in foreign currency exchange rates, interest
rates or weak economic conditions in certain markets. Market risk is the
potential of loss arising from unfavorable changes in market rates and
prices.
Foreign
Currency Exchange Rates
We
transact business in certain foreign currencies including the British pound and
the Euro. However, as a majority of the orders we receive are denominated in
United States dollars, a strengthening of the dollar could make our products
more expensive and less competitive in foreign markets. We have not historically
used foreign currency options or forward contracts to hedge our currency
exposures because of variability in the timing of cash flows associated with our
larger contracts. We did not have any such hedge instruments in place at
December 31, 2009. Rather, we attempt to mitigate our foreign currency risk by
generally transacting business and paying salaries in the functional currency of
each of the major countries in which we do business, thus creating natural
hedges. Additionally, as our business matures in foreign markets, we may offer
our products and services in certain other local currencies. If this were to
occur, foreign currency fluctuations would have a greater impact on us and may
have an adverse effect on our results of operations. Historically, our gains or
losses on foreign currency exchange transactions have been immaterial to our
consolidated financial statements. For
the year ended December 31, 2009, approximately 18% of our revenues and 13% of
our expenses were denominated in a foreign currency, resulting in
a gain of $298,000 from foreign currency exchange
transactions.
As of
December 31, 2009 and December 31, 2008, we had accounts with Euro balances of
approximately $14.6 million and $1.1 million, respectively, British pound
balances of $289,000 and $450,000, respectively, and balances of seven other
foreign currencies totaling $371,000 and $161,000, respectively. For 2010, we
plan to hold minimal Euro and British pound balances in order to mitigate
foreign currency risk.
Interest
Rate Risk
We invest
cash balances in excess of operating requirements in securities that have
maturities of one year or less. The carrying value of these securities
approximates market value, and there is no long-term interest rate risk
associated with these investments.
39
Report
of Independent Registered Public Accounting Firm
The Board
of Directors and Shareholders
Interactive
Intelligence, Inc.:
We have
audited the accompanying consolidated balance sheets of Interactive
Intelligence, Inc. (the Company) and subsidiaries as of December 31, 2009
and 2008, and the related consolidated statements of income, shareholders’
equity, and cash flows for each of the years in the three-year period ended
December 31, 2009. In connection with our audits of the consolidated
financial statements, we have also audited the consolidated financial statement
Schedule II – Valuation and Qualifying Accounts. We also have audited
the Company’s internal control over financial reporting as of December 31,
2009, based on criteria established in Internal Control – Integrated
Framework issued by the Committee of Sponsoring Organizations of the
Treadway Commission (COSO). The Company’s management is responsible for these
consolidated financial statements and financial statement schedule, for
maintaining effective internal control over financial reporting, and for its
assessment of the effectiveness of internal control over financial reporting,
included in the accompanying Management’s Report on Internal Control over
Financial Reporting. Our responsibility is to express an opinion on these
consolidated financial statements and consolidated financial statement schedule
and an opinion on the Company’s internal control over financial reporting based
on our audits.
We
conducted our audits in accordance with the standards of the Public Company
Accounting Oversight Board (United States). Those standards require that we plan
and perform the audits to obtain reasonable assurance about whether the
financial statements are free of material misstatement and whether effective
internal control over financial reporting was maintained in all material
respects. Our audits of the consolidated financial statements included
examining, on a test basis, evidence supporting the amounts and disclosures in
the financial statements, assessing the accounting principles used and
significant estimates made by management, and evaluating the overall financial
statement presentation. Our audit of internal control over financial reporting
included obtaining an understanding of internal control over financial
reporting, assessing the risk that a material weakness exists, and testing and
evaluating the design and operating effectiveness of internal control based on
the assessed risk. Our audits also included performing such other procedures as
we considered necessary in the circumstances. We believe that our audits provide
a reasonable basis for our opinions.
A
company’s internal control over financial reporting is a process designed to
provide reasonable assurance regarding the reliability of financial reporting
and the preparation of financial statements for external purposes in accordance
with generally accepted accounting principles. A company’s internal control over
financial reporting includes those policies and procedures that (1) pertain
to the maintenance of records that, in reasonable detail, accurately and fairly
reflect the transactions and dispositions of the assets of the company;
(2) provide reasonable assurance that transactions are recorded as
necessary to permit preparation of financial statements in accordance with
generally accepted accounting principles, and that receipts and expenditures of
the company are being made only in accordance with authorizations of management
and directors of the company; and (3) provide reasonable assurance
regarding prevention or timely detection of unauthorized acquisition, use, or
disposition of the company’s assets that could have a material effect on the
financial statements.
Because
of its inherent limitations, internal control over financial reporting may not
prevent or detect misstatements. Also, projections of any evaluation of
effectiveness to future periods are subject to the risk that controls may become
inadequate because of changes in conditions, or that the degree of compliance
with the policies or procedures may deteriorate.
In our
opinion, the consolidated financial statements referred to above present fairly,
in all material respects, the financial position of Interactive Intelligence,
Inc. and subsidiaries as of December 31, 2009 and 2008, and the results of
their operations and their cash flows for each of the years in the three-year
period ended December 31, 2009, in conformity with U.S. generally accepted
accounting principles. Also in our opinion, the related consolidated financial
statement Schedule II – Valuation and Qualifying Accounts, when considered in
relation to the consolidated financial statements taken as a whole, presents
fairly, in all material respects, the information set forth therein. Also in our
opinion, Interactive Intelligence, Inc. maintained, in all material respects,
effective internal control over financial reporting as of December 31,
2009, based on criteria established in Internal Control – Integrated
Framework issued by the Committee of Sponsoring Organizations of the
Treadway Commission.
As
discussed in Note 10 to the consolidated financial statements, effective
January 1, 2007, the Company changed the manner in which it accounts for
uncertain tax positions.
/s/ KPMG
LLP
Indianapolis,
Indiana
March 16,
2010
40
Interactive
Intelligence, Inc.
Consolidated
Balance Sheets
As
of December 31, 2009 and 2008
(in
thousands, except share and per share amounts)
|
December
31,
|
||||||||
|
2009
|
2008
|
|||||||
|
Assets
|
||||||||
|
Current
assets:
|
||||||||
|
Cash
and cash equivalents
|
$ | 48,497 | $ | 34,705 | ||||
|
Short-term
investments
|
16,482 | 10,805 | ||||||
|
Accounts
receivable, net of allowance for doubtful accounts of $1,094 in 2009 and
$1,004 in 2008
|
32,092 | 27,533 | ||||||
|
Deferred
tax assets, net
|
5,808 | 6,017 | ||||||
|
Prepaid
expenses
|
5,976 | 5,507 | ||||||
|
Other
current assets
|
3,935 | 1,995 | ||||||
|
Total
current assets
|
112,790 | 86,562 | ||||||
|
Property
and equipment, net
|
8,499 | 10,762 | ||||||
|
Deferred
tax assets, net
|
6,505 | 5,136 | ||||||
|
Other
assets, net
|
4,874 | 2,723 | ||||||
|
Total
assets
|
$ | 132,668 | $ | 105,183 | ||||
|
Liabilities
and Shareholders’ Equity
|
||||||||
|
Current
liabilities:
|
||||||||
|
Accounts
payable and accrued liabilities
|
$ | 11,903 | $ | 11,361 | ||||
|
Accrued
compensation and related expenses
|
4,946 | 3,486 | ||||||
|
Deferred
product revenues
|
5,567 | 4,754 | ||||||
|
Deferred
services revenues
|
36,225 | 31,457 | ||||||
|
Total
current liabilities
|
58,641 | 51,058 | ||||||
|
Deferred
revenue
|
6,420 | 6,878 | ||||||
|
Total
liabilities
|
65,061 | 57,936 | ||||||
|
Commitments
and contingencies
|
-- | -- | ||||||
|
Shareholders’
equity:
|
||||||||
|
Preferred
stock, no par value: 10,000,000 shares authorized; no shares issued and
outstanding
|
-- | -- | ||||||
|
Common
stock, $0.01 par value; 100,000,000 shares authorized; 17,276,990 issued
and outstanding at December 31, 2009, 16,928,089 issued and outstanding at
December 31, 2008
|
173 | 169 | ||||||
|
Treasury
stock, at cost: 815,875 shares as of December 31, 2009, 1,164,776 shares
as of December 31, 2008
|
(6,242 | ) | (9,714 | ) | ||||
|
Additional
paid-in capital
|
92,815 | 83,604 | ||||||
|
Accumulated
deficit
|
(19,139 | ) | (26,812 | ) | ||||
|
Total
shareholders’ equity
|
67,607 | 47,247 | ||||||
|
Total
liabilities and shareholders’ equity
|
$ | 132,668 | $ | 105,183 | ||||
See
Accompanying Notes to Consolidated Financial Statements
41
Interactive
Intelligence, Inc.
Consolidated
Statements of Income
For
the Years Ended December 31, 2009, 2008 and 2007
(in
thousands, except per share amounts)
|
Years
Ended December 31,
|
||||||||||||
|
2009
|
2008
|
2007
|
||||||||||
|
Revenues:
|
||||||||||||
|
Product
|
$ | 63,099 | $ | 60,256 | $ | 57,673 | ||||||
|
Services
|
68,319 | 61,150 | 52,228 | |||||||||
|
Total
revenues
|
131,418 | 121,406 | 109,901 | |||||||||
|
Cost
of revenues:
|
||||||||||||
|
Product
|
17,452 | 15,446 | 14,159 | |||||||||
|
Services
|
22,402 | 23,692 | 21,094 | |||||||||
|
Total
cost of revenues
|
39,854 | 39,138 | 35,253 | |||||||||
|
Gross
profit
|
91,564 | 82,268 | 74,648 | |||||||||
|
Operating
expenses:
|
||||||||||||
|
Sales
and marketing
|
39,141 | 39,307 | 36,331 | |||||||||
|
Research
and development
|
24,103 | 21,539 | 17,040 | |||||||||
|
General
and administrative
|
13,879 | 14,474 | 13,171 | |||||||||
|
Total
operating expenses
|
77,123 | 75,320 | 66,542 | |||||||||
|
Operating
income
|
14,441 | 6,948 | 8,106 | |||||||||
|
Other
income (expense):
|
||||||||||||
|
Interest
income, net
|
281 | 1,288 | 1,721 | |||||||||
|
Other
income (expense), net
|
298 | (434 | ) | (208 | ) | |||||||
|
Total
other income, net
|
579 | 854 | 1,513 | |||||||||
|
Income
before income taxes
|
15,020 | 7,802 | 9,619 | |||||||||
|
Income
tax (expense) benefit
|
(6,380 | ) | (3,464 | ) | 7,837 | |||||||
|
Net
income
|
$ | 8,640 | $ | 4,338 | $ | 17,456 | ||||||
|
Net
income per share:
|
||||||||||||
|
Basic
|
$ | 0.51 | $ | 0.24 | $ | 1.00 | ||||||
|
Diluted
|
0.47 | 0.23 | 0.91 | |||||||||
|
Shares
used to compute net income per share:
|
||||||||||||
|
Basic
|
17,096 | 17,746 | 17,481 | |||||||||
|
Diluted
|
18,268 | 18,740 | 19,251 | |||||||||
See
Accompanying Notes to Consolidated Financial Statements
42
Interactive
Intelligence, Inc.
Consolidated
Statements of Shareholders’ Equity
For
the Years Ended December 31, 2009, 2008 and 2007
(in
thousands)
|
Common
Stock
|
Additional
Paid-in
|
Treasury
|
Accumulated
|
|||||||||||||||||||||
|
Shares
|
Amount
|
Capital
|
Stock
|
Deficit
|
Total
|
|||||||||||||||||||
|
Balances,
January 1, 2007
|
17,139 | 171 | 72,528 | -- | (48,421 | ) | 24,278 | |||||||||||||||||
|
Stock-based
compensation
|
-- | -- | 3,126 | -- | -- | 3,126 | ||||||||||||||||||
|
Exercise
of stock options
|
750 | 8 | 3,536 | -- | -- | 3,544 | ||||||||||||||||||
|
Issuances
of common stock
|
12 | -- | 215 | -- | -- | 215 | ||||||||||||||||||
|
Comprehensive
income:
|
||||||||||||||||||||||||
|
Net
income
|
-- | -- | -- | -- | 17,456 | 17,456 | ||||||||||||||||||
|
Total
comprehensive income
|
-- | -- | -- | -- | 17,456 | 17,456 | ||||||||||||||||||
|
Balances,
December 31, 2007
|
17,901 | 179 | 79,405 | -- | (30,965 | ) | 48,619 | |||||||||||||||||
|
Stock-based
compensation
|
-- | -- | 2,966 | -- | -- | 2,966 | ||||||||||||||||||
|
Exercise
of stock options
|
207 | 2 | 776 | 286 | (185 | ) | 879 | |||||||||||||||||
|
Issuances
of common stock
|
24 | -- | 284 | -- | -- | 284 | ||||||||||||||||||
|
Tax
benefits from stock-based payment arrangements
|
-- | -- | 177 | -- | -- | 177 | ||||||||||||||||||
|
Purchase
of treasury stock
|
(1,204 | ) | (12 | ) | -- | (10,000 | ) | -- | (10,012 | ) | ||||||||||||||
|
Comprehensive
income:
|
||||||||||||||||||||||||
|
Net
income
|
-- | -- | -- | -- | 4,338 | 4,338 | ||||||||||||||||||
|
Net
unrealized investment loss
|
-- | -- | (4 | ) | -- | -- | (4 | ) | ||||||||||||||||
|
Total
comprehensive income
|
-- | -- | (4 | ) | -- | 4,338 | 4,334 | |||||||||||||||||
|
Balances,
December 31, 2008
|
16,928 | $ | 169 | $ | 83,604 | $ | (9,714 | ) | $ | (26,812 | ) | $ | 47,247 | |||||||||||
|
Stock-based
compensation
|
-- | -- | 3,322 | -- | -- | 3,322 | ||||||||||||||||||
|
Exercise
of stock options
|
321 | 4 | (3 | ) | 3,129 | (967 | ) | 2,163 | ||||||||||||||||
|
Issuances
of common stock
|
28 | -- | (91 | ) | 343 | -- | 252 | |||||||||||||||||
|
Tax
benefits from stock-based payment arrangements
|
-- | -- | 5,970 | -- | -- | 5,970 | ||||||||||||||||||
|
Comprehensive
income:
|
||||||||||||||||||||||||
|
Net
income
|
-- | -- | -- | -- | 8,640 | 8,640 | ||||||||||||||||||
|
Net
unrealized investment gain
|
-- | -- | 13 | -- | -- | 13 | ||||||||||||||||||
|
Total
comprehensive income
|
-- | -- | 13 | -- | 8,640 | 8,653 | ||||||||||||||||||
|
Balances,
December 31, 2009
|
17,277 | $ | 173 | $ | 92,815 | $ | (6,242 | ) | $ | (19,139 | ) | $ | 67,607 | |||||||||||
See
Accompanying Notes to Consolidated Financial Statements
43
Interactive
Intelligence, Inc.
Consolidated
Statements of Cash Flows
For
the Years Ended December 31, 2009, 2008 and 2007
(in
thousands)
|
Years
Ended December 31,
|
||||||||||||
|
2009
|
2008
|
2007
|
||||||||||
|
Operating
activities:
|
||||||||||||
|
Net
income
|
$ | 8,640 | $ | 4,338 | $ | 17,456 | ||||||
|
Adjustments
to reconcile net income to net cash provided by operating
activities:
|
||||||||||||
|
Depreciation
|
4,171 | 3,659 | 2,659 | |||||||||
|
Stock-based
compensation expense
|
3,322 | 2,966 | 3,126 | |||||||||
|
Tax
benefits from stock-based payment arrangements
|
(5,970 | ) | (177 | ) | -- | |||||||
|
Deferred
income tax
|
(1,114 | ) | 2,200 | (8,353 | ) | |||||||
|
Accretion
of investment income
|
(149 | ) | (109 | ) | (447 | ) | ||||||
|
Changes
in operating assets and liabilities:
|
||||||||||||
|
Accounts
receivable
|
(4,497 | ) | (6 | ) | (6,157 | ) | ||||||
|
Prepaid
expenses
|
(439 | ) | (6 | ) | (725 | ) | ||||||
|
Other
current assets
|
(1,939 | ) | (581 | ) | 404 | |||||||
|
Other
assets
|
225 | (339 | ) | (82 | ) | |||||||
|
Accounts
payable and accrued liabilities
|
6,534 | 1,885 | 1,709 | |||||||||
|
Accrued
compensation and related expenses
|
1,460 | (895 | ) | 556 | ||||||||
|
Deferred
product revenues
|
918 | (1,788 | ) | 933 | ||||||||
|
Deferred
services revenues
|
3,921 | 4,033 | 9,075 | |||||||||
|
Net
cash provided by operating activities
|
15,083 | 15,180 | 20,154 | |||||||||
|
Investing
activities:
|
||||||||||||
|
Sales
of available-for-sale investments
|
14,300 | 24,150 | 21,615 | |||||||||
|
Purchases
of available-for-sale investments
|
(19,815 | ) | (17,890 | ) | (24,670 | ) | ||||||
|
Purchases
of property and equipment
|
(1,912 | ) | (7,430 | ) | (4,086 | ) | ||||||
|
Acquisition
of intangible and other assets, net of cash and cash equivalents
acquired
|
(2,249 | ) | -- | (1,033 | ) | |||||||
|
Unrealized
gain on investment
|
-- | 8 | 89 | |||||||||
|
Net
cash used in investing activities
|
(9,676 | ) | (1,162 | ) | (8,085 | ) | ||||||
|
Financing
activities:
|
||||||||||||
|
Proceeds
from stock options exercised
|
2,163 | 879 | 3,544 | |||||||||
|
Proceeds
from issuance of common stock
|
252 | 284 | 215 | |||||||||
|
Repurchase
of treasury stock
|
-- | (10,012 | ) | -- | ||||||||
|
Tax
benefits from stock-based payment arrangements
|
5,970 | 177 | -- | |||||||||
|
Net
cash provided by (used in) financing activities
|
8,385 | (8,672 | ) | 3,759 | ||||||||
|
Net
increase in cash and cash equivalents
|
13,792 | 5,346 | 15,828 | |||||||||
|
Cash
and cash equivalents, beginning of year
|
34,705 | 29,359 | 13,531 | |||||||||
|
Cash
and cash equivalents, end of year
|
$ | 48,497 | $ | 34,705 | $ | 29,359 | ||||||
|
Cash
paid during the year for:
|
||||||||||||
| Interest | $ | -- | $ | -- | $ | 8 | ||||||
|
Income
taxes
|
743 | 431 | 154 | |||||||||
|
Other
non-cash item:
|
||||||||||||
|
Purchase
of property and equipment payable at end of year
|
$ | 29 | $ | 59 | $ | -- | ||||||
See
Accompanying Notes to Consolidated Financial Statements
44
Interactive
Intelligence, Inc.
Notes
to Consolidated Financial Statements
December
31, 2009, 2008 and 2007
|
1.
|
THE
COMPANY
|
Interactive
Intelligence, Inc. (the “Company”) is a leading provider of software application
suites for Voice over Internet Protocol (“VoIP”) business communications
and is increasingly leveraging its leadership position in the worldwide
contact center market to offer its solutions to enterprises. Businesses and
organizations, including those that employ remote and mobile workers, utilize
the Company’s solutions in industries including, but not limited to,
teleservices, financial services (banks, credit unions, accounts receivable
management), insurance, higher education, healthcare, retail, technology,
government and business services. The Company’s innovative software products and
services are designed for:
|
·
|
Multichannel
contact management and business communications (voice and messaging) using
the Session Initiation Protocol (“SIP”) global communications standard
that supports VoIP;
|
|
·
|
Business
Process Automation (“BPA”) using a communications-based approach; and
|
|
·
|
Contact
management, including document as well as workflow
management.
|
With the
Company’s single software platform, organizations can replace various
traditional “multipoint” communications products. The Company’s solutions
incorporate a full-featured media server, media gateways, SIP proxy, and SIP
station voice device for Internet Protocol (“IP”)-based communications networks
and infrastructures. Customers can deploy the Company’s solutions on-premises or
in a Communications as a Service (“CaaS”) model using a hosted data
center.
The
Company’s solutions integrate with business systems and end-user devices,
enhance the mobility of today’s remote workforce, scale to thousands of users,
manage content in large volumes, provide communications and data security, and
satisfy a range of business communications and interaction management needs
for:
|
·
|
The
Contact Center
|
|
·
|
Enterprise
IP Telephony
|
|
·
|
Business
Process Automation
|
By
implementing the Company’s all-in-one solutions, businesses are able to unify
multichannel communications media (phone, fax, e-mail, web chat, content) and
information, automate business processes, enhance workforce performance and
productivity, improve customer service processes, and readily adapt to changing
market and customer requirements. Contact
centers can leverage the Company’s platform to support thousands of agents,
including remote “Work-at-Home” agents, and handle inbound, outbound and
“blended” inbound/outbound interactions, at one location or throughout
multi-site contact center operations. The Company’s enterprise IP telephony
solutions provide
call control and messaging for mid- and large-sized business enterprises
with 100
to several hundred thousand users, with the ability to scale user counts up or
down as needed. Enterprises, contact centers, and other organizations can
utilize the Company’s BPA solutions to automate processes using an approach that
incorporates communications functionality such as routing, quality monitoring,
and the ability to indicate employee availability.
The
Company commenced principal operations in 1994 and revenues were first
recognized in 1997. Since then, the Company has established wholly-owned
subsidiaries in nine other countries. The Company’s world headquarters are
located in Indianapolis, Indiana with regional offices throughout the United
States and eight other countries. The Company markets its software applications
in the Americas, Europe, the Middle East and Africa (“EMEA”), and Asia/Pacific
(“APAC”).
2. SUMMARY
OF SIGNIFICANT ACCOUNTING POLICIES
Principles
of Consolidation
The
accompanying consolidated financial statements include the accounts of the
Company and its wholly-owned subsidiaries after elimination of all significant
intercompany accounts and transactions.
Use
of Estimates
The
preparation of consolidated financial statements in conformity with accounting
principles generally accepted in the United States requires management to make
estimates and assumptions that affect the amounts reported in the consolidated
financial statements and accompanying notes. On an on-going basis, management
reevaluates these estimates including those related to revenue recognition,
allowance for doubtful accounts, stock-based compensation, other assets and
accounting for income taxes. Despite management’s best effort to establish good
faith estimates and assumptions, actual results could differ from these
estimates.
Revenue
Recognition
The
Company generates product revenues from licensing the right to use its software
applications and in certain instances selling hardware as a component of its
solution, and generates services revenues primarily from annual support fees,
annual renewal fees, professional services and educational services. These
revenues are generated by direct sales with customers and by indirect sales
through a partner channel.
45
Product
Revenues
The
Company’s license agreements are either perpetual or annually
renewable. For any revenues to be recognized from a license
agreement, the following criteria must be met:
|
|
·
|
Persuasive
evidence of an arrangement exists;
|
|
|
·
|
The
fee is fixed or determinable;
|
|
|
·
|
Collection
is probable; and
|
|
|
·
|
Delivery
has occurred.
|
For a
perpetual license agreement, upon meeting the revenue recognition criteria
above, the Company immediately recognizes as product revenues the residual
amount of the total fees if sufficient vendor specific objective evidence of
fair value (“VSOE”) exists to support allocating a portion of the total fee to
the undelivered elements of the arrangement. If sufficient VSOE of fair value
for the undelivered elements does not exist, the Company recognizes the initial
license fee as product revenues ratably over the initial term of the support
agreement once support is the only undelivered element. The support period is
generally 12 months but may be up to 18 months for initial orders because
support begins when the licenses are downloaded, when support commences, or no
more than six months following the contract date. The Company determines VSOE of
fair value for support in perpetual agreements based on substantive renewal
rates the customer must pay to renew the support. The VSOE of fair value for
other services is based on amounts charged when the services are sold in
stand-alone sales.
Although
the majority of the Company’s product licenses are perpetual, certain customers,
whose original license contracts were signed prior to 2004, have renewable term
licenses. For an annually
renewable license agreement, upon meeting the revenue recognition criteria
above, the Company recognizes a majority of the license fees under these
agreements as product revenues ratably over the initial license period, which is
generally 12 months, and the remainder of the license fees are recognized as
services revenues over the same time period.
The
Company recognizes revenues related to any hardware sales when the hardware is
delivered and all other revenue recognition criteria are met.
Services
Revenues
Services
revenues are primarily renewal fees and support related to annually renewable
license agreements and support fees for perpetual license agreements. For
annually renewable license agreements, the allocation of the initial order
between product revenues and services revenues is based on an average renewal
rate for the Company’s time based contracts. The Company applies the allocation
of product revenues and services revenues consistently to all annually renewable
license agreements. Under annually renewable license agreements, after the
initial license period, the Company’s customers may renew their license
agreement for an additional period, typically 12 months, by paying a renewal
fee. The revenue from annual renewal fees is classified under services revenue
and the revenue is recognized ratably over the contract period. Under perpetual
license agreements, the Company recognizes annual support fees as services
revenues ratably over the post-contract support period, which is typically 12
months, but may extend up to three years if prepaid.
The
Company also generates revenues from other services that it provides to its
customers and partners. These additional revenues include fees for professional
services, educational services and CaaS. Revenues from professional services,
which include implementing the Company’s products for a customer or partner,
educational services, which consist of training courses for customers and
partners, and CaaS, which allows customers to deploy the Company’s solutions
using a hosted data center, are recognized as the related services are
performed.
Accounts
Receivable and Allowance for Doubtful Accounts Receivable
Trade
accounts receivable are recorded at the invoiced amount. The allowance for
doubtful accounts is the Company’s best estimate of the amount of probable
credit losses in the Company’s existing accounts receivable. The Company
evaluates bad debt expense based on a percentage of revenue reported and other
measures each period. The Company then reviews the allowance for
doubtful accounts each reporting period based on a detailed analysis of its
accounts receivable. In the analysis, the Company primarily considers the age of
the customer’s or partner’s receivable and also considers the creditworthiness
of the customer or partner, the economic conditions of the customer’s or
partner’s industry, and general economic conditions, among other factors. If any
of these factors change, the Company may also change its original estimates,
which could impact the level of its future allowance for doubtful
accounts.
If
payment is not made timely, the Company will contact the customer or partner to
try to obtain the payment. If this is not successful, the Company will institute
other collection practices such as generating collection letters, involving
sales personnel and ultimately terminating the customer’s or partner’s access to
future upgrades, licenses and technical support. Once all collection efforts are
exhausted, the receivable is written off against the allowance for doubtful
accounts.
Cash
and Cash Equivalents
The
Company considers all highly liquid investments with a maturity of three months
or less from date of purchase to be cash equivalents. Cash and cash equivalents
consist primarily of cash on deposit with financial institutions and high
quality money market instruments.
Investments
The
Company’s investments, which consist primarily of taxable corporate and
government debt securities, are classified as available-for-sale. Such
investments are recorded at fair value and unrealized gains and losses are
excluded from earnings and recorded as a separate component of equity until
realized. Premiums or discounts are amortized or accreted over the life of the
related security as an adjustment to yield using the effective interest method.
Realized gains and losses from the sale of available-for-sale securities are
determined on a specific identification basis. A decline in the market value of
securities below cost judged to be other than temporary results in a reduction
in the carrying amount to fair value. The impairment is charged to earnings and
a new cost basis for the security is established. Interest and dividends on all
securities are included in interest income when earned.
46
Financial
Instruments
The fair
value of financial instruments, including cash and cash equivalents, short-term
investments and accounts receivable, approximate their carrying
values.
Property
and Equipment
Property
and equipment are stated at cost. Depreciation is calculated using the
straight-line method over the estimated useful lives of the assets. Leasehold
improvements are amortized using the straight-line method over the lesser of the
term of the related lease or the estimated useful life. The Company leases its
office space under operating lease agreements. In accordance with the Financial
Accounting Standards Board (the “FASB”) Accounting Standards Codification
(“ASC”) Topic 840,
Leases (“FASB ASC
840”), for operating leases with escalating rent payments, the Company records
these rent payments on a straight-line basis over the life of the
lease.
Impairment
of Long-Lived Assets
In
accordance with FASB ASC Topic 360, Property, Plant and
Equipment, certain of the Company’s assets, such as property and
equipment and intangibles subject to amortization, are reviewed for impairment
whenever events or changes in circumstances indicate that the carrying amount of
an asset may not be recoverable. Recoverability of assets to be held and used is
measured by a comparison of the carrying amount of an asset to estimated
undiscounted future cash flows expected to be generated by the asset. If the
carrying amount of an asset exceeds its estimated future cash flows, an
impairment charge is recognized for the amount by which the carrying amount of
the asset exceeds the fair value of the asset.
Goodwill
and Other Intangible Assets
The
Company reviews its goodwill and intangible assets with indefinite lives for
impairment at least annually in accordance with FASB ASC Topic 350, Intangibles - Goodwill and Other
(“FASB ASC 350”). Identifiable intangible assets such as intellectual
property trademarks and patents are amortized over a 10 to 15 year period using
the straight-line method. In addition, other intangible assets, such as customer
relationships and core technology, are amortized over a five to six year period
based upon historical patterns in which the economic benefits are expected to be
realized. The Company has one reporting segment and therefore its
impairment review of goodwill involves reviewing the impairment of the Company
as a whole. Because of this, the Company believes the risk of
impairment to its goodwill is minimal. This guidance requires the Company
to perform the goodwill impairment test annually or when a change in facts and
circumstances indicates that the fair value of an asset may be below its
carrying amount. The Company performed its annual goodwill impairment test as of
September 30, 2009 and determined no indication of impairment existed. As there
were no changes in facts and circumstances that indicated that the fair value of
the reporting unit may have been below its carrying amount since September 30,
2009, no additional impairment test was performed during the fourth quarter of
2009.
Advertising
The
Company expenses all advertising costs as incurred. Advertising expense for
2009, 2008 and 2007 was $788,000, $1,258,000 and $733,000,
respectively.
Research
and Development
Research
and development expenditures are generally expensed as incurred. FASB ASC Topic
985, Software, requires
capitalization of certain software development costs subsequent to the
establishment of technological feasibility. Based on the Company’s product
development process, technological feasibility is established upon completion of
a working model. Costs incurred by the Company between completion of the working
model and the point at which the product is ready for general release have been
insignificant. Through December 31, 2009, all research and development costs
have been expensed. Research and development expense for 2009, 2008 and 2007 was
$24.1 million, $21.5 million and $17.0 million, respectively.
Stock-Based
Compensation
Consistent
with FASB ASC Topic 718, Compensation – Stock
Compensation (“FASB ASC 718”), the Company continues to use the
Black-Scholes option-pricing model as its method of valuation for share-based
payment awards. The Company’s determination of fair value of share-based payment
awards on the date of grant using the Black-Scholes option-pricing model is
affected by the Company’s stock price as well as assumptions regarding a number
of highly complex and subjective variables. These variables include, but are not
limited to, the Company’s expected stock price volatility over the term of the
awards and an expected risk-free rate of return. If factors change and the
Company uses different assumptions for estimating stock-based compensation
expense associated with awards granted in future periods, stock-based
compensation expense may differ materially in the future from that recorded in
the current period.
The
Company records compensation expense for share-based awards using the
straight-line method, which is recorded into earnings over the vesting period of
the award. Stock-based compensation expense for employee and director stock
options recognized under FASB ASC 718 for the years ended December 31, 2009,
2008 and 2007 was $3.3 million, $3.0 million and $3.1 million, respectively. See
Note 5 for further information on the Company’s stock-based
compensation.
47
Fair
Value Measurements
FASB ASC
Topic 820, Fair Value
Measurements and Disclosures (“FASB ASC 820”), as amended, defines fair
value as the exchange price that would be received for an asset or paid to
transfer a liability (an exit price) in the principal or most advantageous
market for the asset or liability in an orderly transaction between market
participants on the measurement date. FASB ASC 820 also establishes a fair value
hierarchy which requires an entity to maximize the use of observable inputs and
minimize the use of unobservable inputs when measuring fair value. The standard
describes the following three levels of inputs that may be used to measure fair
value:
|
·
|
Level 1 - Unadjusted
quoted prices in active markets that are accessible at the measurement
date for identical, unrestricted assets or
liabilities.
|
|
·
|
Level 2 - Observable
inputs other than Level 1 prices such as quoted prices for similar assets
or liabilities; quoted prices in markets that are not active; or other
inputs that are observable or can be corroborated by observable market
data for substantially the full term of the assets or
liabilities.
|
|
·
|
Level 3 - Unobservable
inputs that are supported by little or no market activity and that are
significant to the fair value of the assets or
liabilities.
|
The
Company’s assets that are measured at fair value on a recurring basis are
generally classified within Level 1 or Level 2 of the fair value
hierarchy. The types of instruments valued based on quoted market
prices in active markets include mostly money market securities and equity
investments. Such instruments are generally classified within Level 1
of the fair value hierarchy. The Company invests in money market
funds that are traded daily and does not adjust the quoted price for such
instruments. The types of instruments valued based on quoted prices
in less active markets, broker or dealer quotations, or alternative pricing
sources with reasonable levels of price transparency include corporate notes,
commercial paper and certificates of deposits. Such instruments are
generally classified within Level 2 of the fair value hierarchy. The
Company uses consensus pricing, which is based on multiple pricing sources, to
value its fixed income investments.
The
following table sets forth a summary of the Company’s financial assets,
classified as cash and cash equivalents and short-term investments on its
consolidated balance sheet, measured at fair value on a recurring basis as of
December 31, 2009 (in thousands):
|
Fair
Value Measurements at Reporting
Date Using
|
||||||||||||||||
|
Description
|
Total
|
Quoted
Prices in Active
Markets for Identical
Assets
(Level
1)
|
Significant
Other
Observable
Inputs
(Level
2)
|
Significant
Unobservable
Inputs
(Level
3)
|
||||||||||||
|
Cash
& cash equivalents:
|
||||||||||||||||
|
Money
Market Funds
|
$ | 24,440 | $ | 24,440 | $ | -- | $ | -- | ||||||||
|
Short-term
investments:
|
||||||||||||||||
|
Agency
Bond
|
$ | 2,417 | $ | -- | $ | 2,417 | $ | -- | ||||||||
|
Commercial
Paper
|
4,245 | -- | 4,245 | -- | ||||||||||||
|
Corporate
Notes
|
6,033 | -- | 6,033 | -- | ||||||||||||
|
T-Bill
|
3,787 | -- | 3,787 | -- | ||||||||||||
|
Total
|
$ | 16,482 | $ | -- | $ | 16,482 | $ | -- | ||||||||
Income
and Sales Taxes
Income
taxes are accounted for under the asset and liability method. Deferred tax
assets and liabilities are recognized for the future tax consequences
attributable to differences between the financial statement carrying amounts of
existing assets and liabilities and their respective tax bases and operating
loss and tax credit carryforwards. Deferred tax assets and liabilities are
measured using enacted tax rates expected to apply to taxable income in the
years in which those temporary differences are expected to be recovered or
settled. The effect on deferred tax assets and liabilities of a change in tax
rates is recognized in income in the period that includes the enactment
date.
FASB ASC
Topic 740, Income Taxes
(“FASB ASC 740”), establishes financial accounting and reporting standards for
the effect of income taxes. The Company is subject to income taxes in both the
United States and numerous foreign jurisdictions. Significant judgment is
required in evaluating the Company’s tax positions and determining its provision
for income taxes. The objectives of accounting for income taxes are to recognize
the amount of taxes payable or refundable for the current year and deferred tax
liabilities and assets for the future tax consequences of events that have been
recognized in an entity’s financial statements or tax returns. Variations in the
actual outcome of these future tax consequences could materially impact the
Company’s financial position, results of operations, or cash flows.
48
In
assessing the recoverability of deferred tax assets, management considers
whether it is more likely than not that some portion or all of the deferred tax
assets will not be realized. The ultimate realization of deferred tax assets is
dependent upon generation of future taxable income prior to the period in which
temporary differences such as loss carryforwards and tax credits expire.
Management considers projected future taxable income and tax planning strategies
in making this assessment.
As of
December 31, 2009, the Company had $11.5 million of tax net operating loss
carryforwards which have not been recognized or recorded. The Company also had
$6.1 million in tax credit carryforwards recorded as deferred tax assets. During
the years ended December 31, 2009 and 2008, the Company recorded tax expense of
$6.4 million and $3.5 million, respectively, and during the year ended December
31, 2007, the Company recorded a tax benefit of $7.8 million. There was no
valuation allowance at December 31, 2009. The Company will continue to evaluate
the valuation of deferred tax assets in accordance with the requirements of FASB
ASC 740. See Note 10 for further information on the Company’s income
taxes.
Sales tax
amounts collected from customers is recorded on a net basis.
Net
Income per Share
Basic net
income per share is calculated based on the weighted-average number of common
shares outstanding in accordance with FASB ASC Topic 260, Earnings per Share. Diluted
net income per share is calculated based on the weighted-average number of
common shares outstanding plus the effect of dilutive potential common shares.
When the Company reports net income, the calculation of diluted net income per
share excludes shares underlying stock options outstanding that would be
anti-dilutive. Potential common shares are composed of shares of common stock
issuable upon the exercise of stock options. The following table sets forth the
calculation of basic and diluted net income per share (in thousands, except per
share amounts):
|
Years
Ended December 31,
|
||||||||||||
|
2009
|
2008
|
2007
|
||||||||||
|
Net
income, as reported (A)
|
$ | 8,640 | $ | 4,338 | $ | 17,456 | ||||||
|
Weighted-average
outstanding shares of common stock (B)
|
17,096 | 17,746 | 17,481 | |||||||||
|
Dilutive
effect of stock options
|
1,172 | 994 | 1,770 | |||||||||
|
Common
stock and common stock equivalents (C)
|
18,268 | 18,740 | 19,251 | |||||||||
|
Net
income per share:
|
||||||||||||
|
Basic
(A/B)
|
$ | 0.51 | $ | 0.24 | $ | 1.00 | ||||||
|
Diluted
(A/C)
|
0.47 | 0.23 | 0.91 | |||||||||
Anti-dilutive
shares not included in the diluted per share calculation for 2009, 2008 and 2007
were 1.1 million, 1.3 million and 616,000, respectively.
Comprehensive
Income
Comprehensive
income is comprised of net income and other comprehensive income (loss). The
only item of other comprehensive income (loss) that the Company currently
reports is unrealized gains (losses) on marketable securities.
Legal
Proceedings
Liabilities
for loss contingencies arising from claims, assessments, litigation, fines, and
penalties and other sources are recorded when it is probable that a liability
has been incurred and the amount of the assessment and/or remediation can be
reasonably estimated. Legal costs incurred in connection with loss contingencies
are expensed as incurred.
Reclassifications
and Adjustments
Certain
reclassifications have been made to prior year amounts to conform to the current
period presentation.
During
the second quarter of 2009, the Company identified an error in the amount of
accrued property, plant and equipment included within cash flows from operating
activities on the consolidated statement of cash flows for the year ended
December 31, 2008 in its 2008 Annual Report on Form 10-K. In the consolidated
statement of cash flows for the year ended December 31, 2008 presented above,
$594,000 has been reclassified from cash flows from operating activities to cash
flows from investing activities. This reclassification did not have an impact on
the overall results previously reported.
Effective
April 1, 2009, the Company began presenting gains and losses resulting from
foreign currency fluctuations within other income, net. Previously, the Company
included a portion of these gains and losses within operating expense. The
Company changed its presentation as such gains and losses arising from the
adjustment of foreign currency fluctuations are incidental to its operations.
The Company reclassified $193,000 of foreign currency losses for the year ended
December 31, 2008, and $112,000 of foreign currency losses for the year ended
December 31, 2007 from operating expense to other income, net on the
accompanying consolidated statements of income. This reclassification did not
have any impact on the overall results previously reported.
49
Effective
July 1, 2009, the Company began presenting changes in the issuances of common
stock on the accompanying consolidated statement of shareholders’ equity under
treasury stock and accumulated deficit. Previously, the Company had included
these changes under additional paid-in capital. These changes resulted from
purchases of the Company’s stock by its employees under the Employee Stock
Purchase Program. The purchased shares will be issued from treasury stock,
similar to exercises of stock options, until the treasury stock is depleted. The
Company reclassified $87,000 from additional paid-in capital to treasury stock
related to 2008. The reclassification did not have any impact on the overall
results previously reported.
|
3.
|
INVESTMENTS
|
The
Company’s short-term investments all mature in less than one year and are
considered available for sale. In 2009 and 2008, the Company purchased
short-term investments for $19.8 million and $17.9 million, respectively. As of
December 31, 2009 and 2008, $16.5 million and $10.8 million in short-term
investments were outstanding, respectively, which were recorded at their fair
values. The Company does not invest in subprime assets.
Gross
realized gains and gross realized losses included in interest income, net
totaled less than $10,000 in each of 2009, 2008 and 2007.
Interest
income was $281,000, $1.3 million and $1.7 million in 2009, 2008 and 2007,
respectively.
|
4.
|
PROPERTY
AND EQUIPMENT
|
Property
and equipment are summarized as follows as of December 31, 2009 and 2008 (in
thousands):
|
2009
|
2008
|
|||||||
|
Computer
equipment
|
$ | 11,656 | $ | 13,313 | ||||
|
Leasehold
improvements
|
7,904 | 8,173 | ||||||
|
Furniture
and fixtures
|
4,014 | 4,000 | ||||||
|
Software
|
836 | 1,404 | ||||||
|
Office
equipment
|
759 | 740 | ||||||
|
Trade
show equipment and other
|
420 | 451 | ||||||
|
Total
property and equipment
|
25,589 | 28,081 | ||||||
|
Less
accumulated depreciation
|
(17,090 | ) | (17,319 | ) | ||||
|
Net
property and equipment
|
$ | 8,499 | $ | 10,762 | ||||
Property
and equipment is depreciated over useful lives of 3 to 5 years, except for
leasehold improvements, which are depreciated over the lesser of the term of the
related lease or the estimated useful life, and vary from 3 to 15 years. During
the year ended December 31, 2009, the Company reduced assets and accumulated
depreciation by $4.4 million for fully depreciated computer and software
equipment that was seven years old or older and was no longer in
use.
5. STOCK-BASED
COMPENSATION
Stock
Option Plans
The
Company’s Stock Option Plans, adopted in 1995, 1999 and 2006, authorize the
Board of Directors or the Compensation Committee, as applicable, to grant
incentive and nonqualified stock options, and, in the case of the 2006 Equity
Incentive Plan, as amended (the “2006 Plan”), stock appreciation rights,
restricted stock, restricted stock units, performance shares, performance units
and other stock-based awards. After adoption of the 2006 Plan by the Company’s
shareholders in May 2006, the Company may no longer make any grants under
previous plans, but any shares subject to awards under the 1999 Stock Option and
Incentive Plan and the Outside Directors Stock Option Plan (collectively, the
“1999 Plans”) that are cancelled are added to shares available under the 2006
Plan. A maximum of 5,850,933 shares are available for delivery under the 2006
Plan, which consists of (i) 2,150,000 shares, plus (ii) 320,000 shares available
for issuance under the 1999 Plans, but not underlying any outstanding stock
options or other awards under the 1999 Plans, plus (iii) up to 3,380,933 shares
subject to outstanding stock options or other awards under the 1999 Plans that
expire, are forfeited or otherwise terminate unexercised on or after May 18,
2006. The number of shares available under the 2006 Plan is subject to
adjustment for certain changes in the Company’s capital structure. The exercise
price of options granted under the 2006 Plan is equal to the closing price of
the Company’s common stock, as reported by The NASDAQ Global Market, on the
business day immediately preceding the date of grant. During the first quarter
of 2010, the Company’s Board of Directors approved an increase of 1,200,000
shares available for grant under the 2006 Plan, which increase is subject to
shareholder approval at the Company’s Annual Meeting of Shareholders to be held
on May 20, 2010.
Stock
options granted by the Company are categorized into three types. The first type
of stock options granted by the Company to employees and newly-elected
non-employee directors is non-performance-based stock options that are subject
only to time-based vesting. These stock options vest in four equal
annual installments beginning one year after the grant date. The fair
value of these option grants is determined on the date of grant and the related
compensation expense is recognized for the entire award on a straight-line basis
over the vesting period.
The
second type is performance-based stock options that are subject to cancellation
if the specified performance targets are not met. If the applicable
performance targets have been achieved, the options will vest in four equal
annual installments beginning one year after the performance-related period has
ended. The fair value of these stock option grants is determined on
the date of grant and the related compensation expense is recognized over the
requisite service period, including the initial period for which the specified
performance targets must be met.
50
Commencing
in May 2009, the Company began granting its non-employee directors options
annually that are similar to the non-performance-based options described above
except the director options vest one year after the grant date. The fair value
of these option grants is determined on the date of the grant and the related
compensation expense is recognized over one year. Prior to May 2009,
non-employee directors received non-performance-based stock options that vested
over four years.
The plans
may be terminated by the Company’s Board of Directors at any time.
Valuation
Assumptions
The
Company estimated the fair value of stock options using the Black-Scholes
valuation model. The fair value of each option grant is estimated on the date of
grant and is amortized on a straight-line basis over the vesting period. The
weighted-average estimated per option value of non-performance-based,
performance-based and director options under the stock option plans during the
year ended December 31, 2009, 2008 and 2007 was $4.16, $7.29 and $9.56,
respectively, using the following assumptions:
|
Years
Ended December 31,
|
||||||||||||
|
Valuation
assumptions for non-performance-based options:
|
2009
|
2008
|
2007
|
|||||||||
|
Dividend
yield
|
-- | % | -- | % | -- | % | ||||||
|
Expected
volatility
|
67.88-69.56 | % | 63.21-66.87 | % | 61.18-63.82 | % | ||||||
|
Risk-free
interest rate
|
1.64-2.36 | % | 1.36-3.34 | % | 3.37-5.02 | % | ||||||
|
Expected
life of option (in years)
|
4.25
years
|
4.25
years
|
4.25
years
|
|||||||||
Prior to
May 2009, directors were granted options that vested over four years. The
fair value of these options was estimated using the non-performance-based option
valuation assumptions set forth above.
|
Years
Ended December 31,
|
||||||||||||
|
Valuation
assumptions for performance-based options:
|
2009
|
2008
|
2007
|
|||||||||
|
Dividend
yield
|
-- | % | -- | % | -- | % | ||||||
|
Expected
volatility
|
67.35 | % | 63.66 | % | 67.27 | % | ||||||
|
Risk-free
interest rate
|
1.77 | % | 2.39 | % | 4.48 | % | ||||||
|
Expected
life of option (in years)
|
4.75
years
|
4.75
years
|
4.75
years
|
|||||||||
The
Company granted performance-based options only during the first quarter of each
of 2009, 2008 and 2007.
|
Years
Ended December 31,
|
||||||||||||
|
Valuation
assumptions for director options:
|
2009
|
2008
|
2007
|
|||||||||
|
Dividend
yield
|
-- | % | N/A | N/A | ||||||||
|
Expected
volatility
|
71.48 | % | N/A | N/A | ||||||||
|
Risk-free
interest rate
|
2.01 | % | N/A | N/A | ||||||||
|
Expected
life of option (in years)
|
3.50 | N/A | N/A | |||||||||
The
Company granted annual director options that vest one year after the grant date
only during the second quarter of 2009.
Expected Dividend: The
Black-Scholes valuation model calls for a single expected dividend yield as an
input. The Company has never declared or paid cash dividends on its common stock
and does not expect to declare or pay any cash dividends in the foreseeable
future.
Expected Volatility: The
Company’s volatility factor was based exclusively on its historical stock prices
over the most recent period commensurate with the estimated expected life of the
stock options.
Risk-Free Rate: The Company
bases the risk-free interest rate on the implied yield currently available on
U.S. Treasury zero-coupon issues with an equivalent remaining term commensurate
with the estimated expected life of the stock options.
Expected Term: The Company’s
expected term represents the period that the Company’s stock options are
expected to be outstanding and was determined using the simplified method as
described in FASB ASC 718. The Company chose to use the simplified method given
the lack of historical data at the current expiration term of six years and the
non-employee director options that fully vest in one year. FASB ASC 718 permits
the continued use of this option after December 31, 2007 if the Company does not
believe it has sufficient historical data to support another method. As the
Company chose to continue using the simplified method, the expected term has
remained the same as it was prior to December 31, 2007.
Estimated Pre-vesting
Forfeitures: Beginning January 1, 2006, the Company included an estimate
for forfeitures in calculating stock option expense. When estimating
forfeitures, the Company considers historical termination behavior as well as
any future trends it expects.
For most
options granted through December 31, 2004, the term of each option is ten years
from the date of grant. In 2005, the Company began issuing options with a term
of six years from the date of grant.
If an
incentive stock option is granted to an employee who, at the time the option is
granted, owns stock representing more than 10% percent of the voting power of
all classes of stock of the Company, the exercise price of the option may not be
less than 110% of the market value per share on the date the option is granted
and the term of the option shall be not more than five years from the date of
grant.
51
Expense Information under
FASB ASC 718
The
following table summarizes the allocation of stock-based compensation expense
related to stock options under FASB ASC 718 for the years ended December 31,
2009, 2008 and 2007 (in thousands, except per share amounts):
|
Years
Ended December
31,
|
||||||||||||
|
2009
|
2008
|
2007
|
||||||||||
|
Stock-based
compensation expense by category:
|
||||||||||||
|
Cost
of services
|
$ | 239 | $ | 203 | $ | 247 | ||||||
|
Sales
and marketing
|
1,128 | 1,094 | 1,305 | |||||||||
|
Research
and development
|
952 | 833 | 565 | |||||||||
|
General
and administrative
|
1,003 | 836 | 1,009 | |||||||||
|
Total
stock-based compensation expense
|
$ | 3,322 | $ | 2,966 | $ | 3,126 | ||||||
|
Effect
of stock-based compensation expense on net income per
share:
|
||||||||||||
|
Basic
|
$ | (0.19 | ) | $ | (0.17 | ) | $ | (0.18 | ) | |||
|
Diluted
|
(0.18 | ) | (0.16 | ) | (0.16 | ) | ||||||
During
the fourth quarter of 2009, the Company determined that the performance targets
for certain performance-based awards granted at the beginning of 2009 would not
be met. Therefore, during the fourth quarter of 2009, the Company reversed stock
option expense recorded in previous periods totaling $22,000 related to these
options.
During
the third quarter of 2008, the Company determined that it was improbable that
the performance targets for certain performance-based awards granted at the
beginning of 2008 would be met. Therefore, during the third quarter of 2008, the
Company stopped accruing stock option expense and reversed stock option expense
recorded in previous periods totaling $432,000. During the fourth quarter of
2008, $64,000 of stock-based compensation expense recorded for additional
performance-based options was reversed.
During
the year ended December 31, 2009, the Company granted stock options for 571,375
shares of common stock. After taking into account the 47,000 options that were
cancelled during 2009, the estimated total grant-date fair value was
approximately $2.2 million (not accounting for estimated forfeitures) as of
December 31, 2009. This compared to 599,315 shares of common stock granted
during 2008 and 252,000 options that were cancelled with an estimated total
grant-date fair value as of December 31, 2008 of approximately $2.5 million (not
accounting for estimated forfeitures). During the year ended December 31, 2007,
the Company granted stock options for 655,550 shares of common stock and
cancelled 28,000 options with an estimated total grant-date fair value of
approximately $6.1 million (not accounting for estimated forfeitures) at
December 31, 2007. As required by FASB ASC 718, management has made an estimate
of expected forfeitures and is recognizing compensation expense only for those
stock awards expected to vest. The Company estimated that the total stock-based
compensation expense for the awards not expected to vest was $103,000, with such
amounts deducted to arrive at the fair value of $2.1 million for the year ended
December 31, 2009.
Stock
Option Activity
The
following table sets forth a summary of option activity for the years ended
December 31, 2009, 2008 and 2007:
|
Years
Ended December 31,
|
||||||||||||||||||||||||
|
2009
|
2008
|
2007
|
||||||||||||||||||||||
|
Options
|
Weighted-Average
Exercise
Price
|
Options
|
Weighted-Average
Exercise
Price
|
Options
|
Weighted-Average
Exercise
Price
|
|||||||||||||||||||
|
Balances,
beginning of year
|
3,300,565 | $ | 9.45 | 3,232,483 | $ | 8.71 | 3,422,741 | $ | 6.12 | |||||||||||||||
|
Options
granted
|
571,375 | 7.81 | 599,315 | 14.12 | 665,550 | 17.64 | ||||||||||||||||||
|
Options
exercised
|
(320,993 | ) | 6.73 | (206,958 | ) | 4.23 | (748,856 | ) | 4.72 | |||||||||||||||
|
Options
cancelled, forfeited or expired
|
(125,204 | ) | 14.01 | (324,275 | ) | 13.12 | (106,952 | ) | 6.47 | |||||||||||||||
|
Options
outstanding, end of year
|
3,425,743 | 9.36 | 3,300,565 | 9.46 | 3,232,483 | 8.71 | ||||||||||||||||||
|
Option
price range at end of year
|
$ | 2.51 - $50.50 | $ | 2.51 - $50.50 | $ | 2.51 - $50.50 | ||||||||||||||||||
|
Weighted-average
fair value of options granted during the year
|
$ | 4.16 | $ | 7.29 | $ | 9.56 | ||||||||||||||||||
|
Options
exercisable at end of year
|
2,187,357 | $ | 8.07 | 2,086,610 | $ | 7.30 | 1,774,957 | $ | 6.63 | |||||||||||||||
|
Options
available for grant at end of year
|
915,794 | 1,388,969 | 771,409 | |||||||||||||||||||||
52
The
change in options available for grant at the end of year from 2008 compared to
2007 was related to the Company’s shareholders approving an amendment to the
2006 Plan in May 2008, which increased the number of shares available for grant
by 900,000 shares.
The
following table sets forth information regarding the Company’s stock options
outstanding and exercisable at December 31, 2009:
|
Options
Outstanding
|
Options
Exercisable
|
||||||||||||||||||
|
Range of
Exercise Prices
|
Number
Outstanding
|
Weighted-Average
Remaining
Contractual
Life
|
Weighted-Average
Exercise
Price
|
Number
Exercisable
|
Weighted-Average
Exercise
Price
|
||||||||||||||
| $ | 2.51 – $4.27 | 401,615 |
3.26
years
|
$ | 3.39 | 401,615 | $ | 3.39 | |||||||||||
| $ | 4.29 – $5.17 | 524,135 |
2.05
years
|
4.91 | 443,385 | 4.87 | |||||||||||||
| $ | 5.19 – $5.84 | 452,744 |
4.18
years
|
5.69 | 452,744 | 5.69 | |||||||||||||
| $ | 5.85 – $6.10 | 243,956 |
2.15
years
|
6.00 | 243,956 | 6.00 | |||||||||||||
| $ | 6.22 – $6.66 | 432,750 |
5.05
years
|
6.66 | 4,250 | 6.25 | |||||||||||||
| $ | 6.70 – $13.50 | 381,020 |
3.10
years
|
10.01 | 222,914 | 9.59 | |||||||||||||
| $ | 13.75 – $14.79 | 406,150 |
3.57
years
|
14.41 | 147,400 | 14.48 | |||||||||||||
| $ | 14.86 – $20.50 | 504,617 |
3.60
years
|
18.52 | 201,333 | 18.82 | |||||||||||||
| $ | 21.75 – $50.50 | 78,756 |
1.46
years
|
27.97 | 69,760 | 28.71 | |||||||||||||
|
Total
shares/average price
|
3,425,743 | 9.36 | 2,187,357 | 8.07 | |||||||||||||||
The total
intrinsic value of options exercised during the year ended December 31, 2009 was
$3.0 million. The aggregate intrinsic value of options outstanding as of
December 31, 2009 was $32.3 million and the aggregate intrinsic value of options
currently exercisable as of December 31, 2009 was $23.6 million. The aggregate
intrinsic value represents the total intrinsic value, based on the Company’s
closing stock price per share of $18.45 as of December 31, 2009, which would
have been realized by the option holders had all option holders exercised their
options as of that date. The total number of in-the-money options exercisable as
of December 31, 2009 was 2.0 million with a weighted average exercise price of
$6.58.
As of
December 31, 2009, there was $3.3 million of total unrecognized compensation
cost related to non-vested stock options. These costs are expected to be
recognized over the weighted average remaining vesting period of 2.0
years.
2000
Employee Stock Purchase Plan
In May
2000, the Company adopted the 2000 Employee Stock Purchase Plan (the “2000
Purchase Plan”). A total of 500,000 shares of common stock were reserved for
issuance under the 2000 Purchase Plan. On May 19, 2005, the shareholders of the
Company approved an amendment to the 2000 Purchase Plan that increased the
number of shares of common stock available for purchase and issuance to
750,000. The 2000 Purchase Plan permits eligible employees to acquire
shares of the Company’s common stock through periodic payroll deductions of up
to 20% of their total compensation up to a maximum of $1,000 per pay period. The
price at which the Company’s common stock may be purchased is 95% of the fair
market value of the Company’s closing common stock price, as reported on The
NASDAQ Global Market, on the last business day of the quarter. The actual
purchase date is generally on the first business day of the next calendar
quarter. An employee may set aside up to $25,000 to purchase shares annually.
The initial offering period commenced on April 1, 2000. A total of
27,261 shares, 24,501 shares and 12,027 shares were purchased and issued during
2009, 2008 and 2007, respectively, under the 2000 Purchase Plan at an average
price of $11.13, $12.90 and $18.33, respectively. As of December 31, 2009, there
were 170,416 shares available for purchase and issuance under the 2000 Purchase
Plan.
The 2000
Purchase Plan was modified, as of January 1, 2006, to ensure that it was
considered non-compensatory under FASB ASC 718. As a result, the Company has not
recognized any stock-based compensation expense related to its 2000 Purchase
Plan.
6. SHARE
REPURCHASE PROGRAM
On July
28, 2008, the Company’s Board of Directors approved a share repurchase program
to facilitate the repurchase of its common stock over the course of one
year. Under this program, the Company was authorized to purchase
shares of its common stock up to a maximum aggregate purchase price of $10.0
million. Repurchases could be made from time to time in the open market and in
privately negotiated transactions, based on business and market conditions under
plans designed to comply with Rule 10b5-1 and Rule 10b-18 under the Securities
Exchange Act of 1934, as amended. The program could be amended, suspended or
discontinued at any time and did not commit the Company to repurchase shares of
its common stock.
During
2008, the Company repurchased 1.2 million shares of its common stock at an
aggregate cost of $10.0 million. The share repurchase program was completed on
November 12, 2008. The shares acquired are now available for stock-based
compensation awards and other corporate purposes.
53
|
7.
|
LEASE
COMMITMENTS
|
The
Company’s world headquarters are located in approximately 200,000 square feet of
space in two office buildings in Indianapolis, Indiana. The Company leases the
space under an operating lease agreement and amendments which expire on March
31, 2018. The Company also occupies a product distribution center in
Indianapolis, Indiana and three regional offices in the United States which are
located in Herndon, Virginia, Irvine, California and Columbia, South Carolina.
The Company also leases offices for each of its Canada, EMEA and APAC operations
in Montreal, Quebec, Berkshire, United Kingdom and Kuala Lumpur, Malaysia,
respectively, and has several other office leases throughout the United States
and in 11 other countries. The Company rents office space for sales, services,
development and international offices under month-to-month leases. In accordance
with FASB ASC 840, rental expense is recognized ratably over the lease period,
including those leases containing escalation clauses.
The
Company believes that all of its facilities, including its world headquarters,
regional offices and international offices in EMEA and APAC, are adequate and
well suited to accommodate its business operations. The Company continuously
reviews space requirements to ensure it has adequate room for growth in the
future.
Rent
expense, net was $5.7 million, $4.9 million and $3.8 million for the years ended
December 31, 2009, 2008 and 2007, respectively. Minimum future lease
payments under the Company’s operating leases as of December 31, 2009 are
summarized as follows (in thousands):
|
2010
|
$5,257
|
|
2011
|
4,845
|
|
2012
|
4,433
|
|
2013
|
4,543
|
|
2014
|
4,542
|
|
Thereafter
|
14,762
|
|
Total
minimum lease payments
|
$38,382
|
Prior to and during part of 2008, the Company had sublet a portion of its world headquarters office space. The sublease agreement expired without renewal on February 29, 2008. The Company received sublease payments of $33,000 and $198,000 during 2008 and 2007, respectively. No sublease payments were received in 2009.
|
8.
|
CONCENTRATION
OF CREDIT RISK
|
No
customer or partner accounted for 10% or more of the Company’s revenues in 2009,
2008 and 2007. One
partner accounted for 13% of the Company’s accounts receivable as of December
31, 2009, and no customer or partner accounted for 10% or more of the Company’s
accounts receivable as of December 31, 2008 and 2007. The Company’s
top five partners collectively represented 30% and 20% of the Company’s accounts
receivable balance at December 31, 2009 and 2008, respectively. The Company
evaluates the creditworthiness of its customers and partners on a periodic
basis. The Company generally does not require collateral. The Company manages
its operations as a single segment for purposes of assessing performance and
making operating decisions. No individual country accounted for more than 10% of
the Company's revenues, with the exception of the United States, for the years
ended December 31, 2009, 2008 and 2007.
|
9.
|
RETIREMENT
SAVINGS PLAN
|
The
Company maintains a 401(k) retirement savings plan (the “Plan”) to provide
retirement benefits for substantially all of its North American employees.
Participants in the Plan may elect to contribute up to 50% of their pre-tax
annual compensation to the Plan, limited to the maximum amount allowed by the
Internal Revenue Code, as amended. The Company, at its discretion, may also make
annual contributions to the Plan.
Effective
January 1, 2007, the Plan Administrator approved a restated Plan Document, which
included amendments to the Plan since January 1, 2003, including new benefits
added to the Plan such as a Company matching contribution potential and a Roth
401(k) option.
For the
year ended December 31, 2009 and 2008, subject to meeting specified operating
targets, the Company matched up to 25% of the first 8% of a participant’s
pre-tax compensation contributed to the Plan. For the year ended December 31,
2009, the Company’s performance resulted in a match for the full amount of
$564,000 which was contributed to the employees’ accounts in February 2010. For
the year ended December 31, 2008, the Company’s performance resulted in a match
of $348,000, which was less than the full amount. For the year ended December
31, 2007, the Company met the annual performance target and matched up to 25% of
the first 4% of a participant’s pre-tax compensation contributed to the Plan.
The total amount of the Company’s matching contribution for the year ended
December 31, 2007 was $312,000.
For an
eligible participant who has worked for the Company for less than four years at
the time of the Company matching contribution, the contribution will vest in
equal installments over four years based on the anniversary date of the
participant’s employment. For an eligible participant who has worked for the
Company for four or more years at the time of contribution, the contribution is
100% vested.
For 2010,
subject to meeting specified operating targets, the Company will match up to 33%
of the first 9% of a participant’s pre-tax compensation contributed to the
Plan.
Although
the Company has not expressed any intent to terminate the Plan, it has the
option to do so at any time subject to the provisions of the Employee Retirement
Income Security Act of 1974. Upon termination of the Plan, either full or
partial, participants become fully vested in their entire account
balances.
54
|
10.
|
INCOME
TAXES
|
The
following table sets forth information regarding the United States and foreign
components of income tax benefit (expense) (in thousands) for 2009, 2008 and
2007:
|
Current
|
Deferred
|
Total
|
||||||||||
|
2009:
|
||||||||||||
|
United
States Federal
|
$ | (5,380 | ) | $ | 1,327 | $ | (4,053 | ) | ||||
|
State
and local
|
(1,253 | ) | (213 | ) | (1,466 | ) | ||||||
|
Foreign
jurisdiction
|
(861 | ) | -- | (861 | ) | |||||||
|
Total
|
$ | (7,494 | ) | $ | 1,114 | $ | (6,380 | ) | ||||
|
2008:
|
||||||||||||
|
United
States Federal
|
$ | (829 | ) | $ | (2,081 | ) | $ | (2,910 | ) | |||
|
State
and local
|
(173 | ) | (118 | ) | (291 | ) | ||||||
|
Foreign
jurisdiction
|
(263 | ) | -- | (263 | ) | |||||||
|
Total
|
$ | (1,265 | ) | $ | (2,199 | ) | $ | (3,464 | ) | |||
|
2007:
|
||||||||||||
|
United
States Federal
|
$ | (206 | ) | $ | 7,212 | $ | 7,006 | |||||
|
State
and local
|
(13 | ) | 1,141 | 1,128 | ||||||||
|
Foreign
jurisdiction
|
(297 | ) | -- | (297 | ) | |||||||
|
Total
|
$ | (516 | ) | $ | 8,353 | $ | 7,837 | |||||
The tax
effects of temporary differences that gave rise to significant portions of the
deferred tax assets at December 31, 2009 and 2008 are presented below (in
thousands):
|
2009
|
2008
|
|||||||
|
Allowance
for doubtful accounts
|
$ | 438 | $ | 402 | ||||
|
Accrued
expenses
|
731 | 890 | ||||||
|
Deferred
revenues
|
2,748 | 2,224 | ||||||
|
Stock-based
compensation expense
|
1,632 | 1,021 | ||||||
|
Depreciation
and amortization expense
|
706 | 451 | ||||||
|
Tax
net operating loss carryforwards
|
121 | 1,436 | ||||||
|
Foreign
tax credit carryforwards
|
3,119 | 2,277 | ||||||
|
Research
tax carryforwards
|
2,818 | 2,452 | ||||||
|
Net
deferred tax assets
|
$ | 12,313 | $ | 11,153 | ||||
In
assessing the realizability of deferred tax assets, management considers whether
it is more likely than not that some portion or all of the deferred tax assets
will not be realized. The ultimate realization of deferred tax assets is
dependent upon the generation of future taxable income prior to the periods in
which those temporary differences such as loss carryforwards and tax credits
expire. Management considers the scheduled reversal of deferred tax liabilities,
if any (including the impact of available carryback and carryforward periods),
projected future taxable income, and tax-planning strategies in making this
assessment. The Company will need to generate future taxable income of
approximately $28 million to realize the deferred tax assets prior to the
expiration of the net operating loss carryforwards in 2028. Based upon the level
of historical taxable income and projections for future taxable income over the
periods in which the deferred tax assets are deductible, management believes it
is more likely than not that the Company will realize the benefits of these
deductible differences at December 31, 2009. The amount of the deferred tax
asset considered realizable, however, could be reduced in the near term if
estimates of future taxable income during the carryforward period are
reduced.
For
federal and state net operating loss carryforwards purposes, there is an
additional $11.5 million of tax deductible compensation deductions that were
generated as a result of stock option exercises. These have not been recognized
for financial reporting purposes because they have not yet reduced taxes
payable. The tax benefit of these deductions will be recorded as a
credit to additional paid-in capital when realized.
55
The
following table sets forth the items accounting for the difference between
expected income tax benefit (expense) compared to actual income tax benefit
(expense) recorded in the Company’s consolidated financial statements (in
thousands):
|
Years
Ended December 31,
|
||||||||||||
|
2009
|
2008
|
2007
|
||||||||||
|
Expected
income tax expense at 35% tax rate
|
$ | (5,257 | ) | $ | (2,731 | ) | $ | (3,367 | ) | |||
|
State
taxes, net of federal benefit
|
(1,217 | ) | (189 | ) | (552 | ) | ||||||
|
Stock-based
compensation expense related to non-deductible stock option
expense
|
(461 | ) | (685 | ) | (798 | ) | ||||||
|
Change
in deferred tax asset valuation allowance
|
-- | -- | 12,727 | |||||||||
|
Research
tax credit
|
393 | 278 | 87 | |||||||||
|
Other
|
162 | (137 | ) | (260 | ) | |||||||
|
Income
tax benefit (expense)
|
$ | (6,380 | ) | $ | (3,464 | ) | $ | 7,837 | ||||
During
2009, the Company utilized its remaining net operating loss deferred tax asset
generated in prior years and began utilizing operating losses generated from tax
benefits related to the exercise of stock options. The Company does not have a
deferred tax asset on its balance sheet for the tax benefits from these
deductions, and the reduction in taxes payable related to the use of these
deductions is recorded as a credit to additional paid-in capital. At December
31, 2009, the Company had approximately $11.5 million in stock-based
compensation deductions available to offset taxable income and $5.9 million of
alternative minimum tax, federal and state research tax credit carryforwards and
foreign tax credits available to offset taxes payable. In addition, the Company
had a deferred tax asset of $121,000 available to offset future taxable income
of a subsidiary.
FASB ASC
740 prescribes a recognition threshold and measurement attributes for the
financial statement recognition and measurement of a tax position taken or
expected to be taken in a tax return. The Company has identified an
uncertain tax position related to certain tax credits that the Company currently
believes meets the “more likely than not” recognition threshold to be sustained
upon examination. Prior to the fourth quarter of 2007, this uncertain tax
position had not been recognized because the Company had a full valuation
allowance established. The balance of the reserve was approximately
$910,000 at December 31, 2009.
The
Company and its subsidiaries file federal income tax returns and income tax
returns in various states and foreign jurisdictions. Tax years 2006
and forward remain open for examination for federal tax purposes and tax years
2005 and forward remain open for examination for the Company’s more significant
state tax jurisdictions. To the extent utilized in future years’ tax
returns, net operating loss and capital loss carryforwards at December 31, 2009
will remain subject to examination until the respective tax year is
closed.
The
Company adopted the provisions related to the accounting for uncertainty in
income taxes under FASB ASC 740. The Company did not record a cumulative effect
adjustment to retained earnings as a result of the implementation of this
accounting pronouncement. The Company recognizes financial statement benefits
for positions taken for tax return purposes when it is more-likely-than-not that
the position will be sustained. A reconciliation of the beginning and ending
amount of the gross unrecognized tax benefits is as follows (in
thousands):
|
Balance
at January 1, 2007
|
$ | 328 | ||
|
Increase
in balance due to current year tax position
|
97 | |||
|
Increase
in balance due to prior year tax position
|
325 | |||
|
Balance
at December 31, 2008
|
750 | |||
|
Increase
in balance due to current year tax position
|
80 | |||
|
Increase
in balance due to prior year tax position
|
80 | |||
|
Balance
at December 31, 2009
|
$ | 910 |
If
recognized, the entire remaining balance of unrecognized tax benefits would
impact the effective tax rate. Over the next 12 months, we do not anticipate the total
amount of our unrecognized tax benefits to significantly change. We recognize
interest income, interest expense, and penalties relating to tax exposures as a
component of income tax expense. There was no interest expense and penalties
related to the above unrecognized tax benefits as of December 31,
2009.
|
11.
|
SEGMENT
DISCLOSURES
|
In
accordance with FASB ASC Topic 280, Segment Reporting, the
Company views its operations and manages its business as principally one segment
which is interaction management software applications licensing and associated
services. As a result, the financial information disclosed herein represents all
of the material financial information related to the Company’s principal
operating segment.
Revenues
derived from non-North American customers accounted for approximately 27%, 27%
and 25% in 2009, 2008 and 2007, respectively, of the Company’s total revenues.
The Company attributes its revenues to countries based on the country in which
the customer or partner is located. The sales and licensing revenues in each
individual non-North American country accounted for less than 10% of total
revenues in 2009, 2008 and 2007. As of December 31, 2009, approximately 10% of
the Company’s net property and equipment, which included computer and office
equipment, furniture and fixtures and leasehold improvements, were located in
foreign countries, of which one country, the United Kingdom, represented a
concentration of more than 6%.
56
|
12.
|
COMMITMENTS
AND CONTINGENCIES
|
Legal
Proceedings
From time
to time, the Company has received notification from competitors and other
technology providers claiming that the Company’s technology infringes their
proprietary rights. The Company cannot assure you that these matters can be
resolved amicably without litigation, or that the Company will be able to enter
into licensing arrangements on terms and conditions that would not have a
material adverse effect on its business, financial condition or results of
operations.
In
November 2002, the Company received a notification from the French Taxing
Authority (“FTA”) as a result of a tax audit that had been conducted
encompassing the years 1998 through 2001. In December 2005, the Company received
an additional notification from the FTA as a result of an updated tax audit that
they conducted, which included the years 2002 through
2004. Both of these assessments claimed amounts owed related to
Value Added Tax (“VAT”) and corporation taxes in addition to what has previously
been paid. The FTA claimed the total amount owed was $5.9 million.
During
the fourth quarter of 2008, the Company reached a settlement with the FTA
related to the VAT claim. The settlement included Interactive Intelligence
France SARL paying $5.3 million for VAT, corporation and withholding taxes and
late penalties and interest. In return, Interactive Intelligence, Inc. was
granted a refund of VAT paid (including the current amount and past payments) of
$5.6 million. Interactive Intelligence, Inc. assigned $5.3 million of this
refund to pay off the VAT and other taxes and penalties owed. The remaining
$300,000 was refunded to Interactive Intelligence, Inc. The Company had
previously accrued for corporation taxes owed; therefore, the net U.S. dollar
effect to the Company’s financial position was a reduction in operating expenses
of $577,000, split among each department, as that was where the original expense
for the VAT was allocated. VAT charges were incurred on various items
including rent, hotels and supplies.
Subsequent
to the settlement, the Company received a letter from another division within
the FTA that claimed Interactive Intelligence France SARL owed $650,000 in
penalties and interest as of December 31, 2008. The Company submitted an appeal
for this amount in March 2009, as it believed that these penalties and interest
were agreed to and paid in the previous settlement. In December 2009, the
Company received notice from the FTA that the amount was not owed. The Company
has no liabilities recorded related to this and believes all matters have been
settled.
From time
to time, the Company is also involved in certain legal proceedings in the
ordinary course of conducting its business. While the ultimate liability
pursuant to these actions cannot currently be determined, the Company believes
these legal proceedings will not have a material adverse effect on its financial
position or results of operations. Litigation in general, and intellectual
property litigation in particular, can be expensive and disruptive to normal
business operations. Moreover, the results of complex legal proceedings are
difficult to predict.
Guarantees
The
Company provides indemnifications of varying scope and amount to certain
customers against claims of intellectual property infringement made by third
parties arising from the use of its products. The
Company’s direct software license agreements, in accordance with FASB ASC Topic
460, Guarantees,
include certain provisions for indemnifying customers, in material compliance
with their license agreement, against liabilities if the Company’s software
products infringe upon a third party's intellectual property rights, over the
life of the agreement. There is no maximum potential amount of future payments
set under the guarantee. However, the Company may at any time and at its option
and expense: (i) procure the right of the customer to continue to use the
Company’s software that may infringe a third party’s rights; (ii) modify its
software so as to avoid infringement; or (iii) require the customer to return
its software and refund the customer the fee actually paid by the customer for
its software less depreciation based on a five-year straight-line depreciation
schedule. The customer’s failure to provide timely notice or reasonable
assistance will relieve the Company of its obligations under this
indemnification to the extent that it has been actually and materially
prejudiced by such failure. To date, the Company has not incurred, nor does it
expect to incur, any material related costs and, therefore, has not reserved for
such liabilities.
The
Company’s software license agreements also include a warranty that its software
products will substantially conform to its software user documentation for a
period of one year, provided the customer is in material compliance with the
software license agreement. To date, the Company has not incurred any material
costs associated with these product warranties, and as such, has not reserved
for any such warranty liabilities in its operating results.
Lease
Commitments and Other Contingencies
See Note
7 for further information on the Company’s lease commitments.
The
Company has received and may continue to receive certain payroll tax credits and
real estate tax abatements that were granted to the Company based upon certain
growth projections. If the Company’s actual results are less than those
projections, the Company may be subject to repayment of some or all of the tax
credits or payment of additional real estate taxes in the case of the
abatements. The Company does not believe that it will be subject to
payment of any money related to these taxes; however, the Company cannot provide
assurance as to the outcome.
13.
ACQUISITION
AcroSoft
Acquisition
On May
15, 2009, the Company entered into a stock purchase agreement with AcroSoft
Corporation (“AcroSoft”), a provider of insurance content management solutions,
pursuant to which the Company purchased 100% of AcroSoft’s issued and
outstanding shares of capital stock for an aggregate purchase price of $2.2
million funded with cash available from operations. Ten percent of the purchase
price, or $240,000, was deposited into an escrow account to ensure funds are
available to pay indemnification claims, if any. The Company acquired AcroSoft
to integrate its document management and workflow functionality into the
Company’s Interaction Center Platform, including its IPA application. Over
time, the Company also anticipates extending the integrated solution to other
document-intensive industry vertical and horizontal processes. The
acquisition was accounted for using the acquisition method of accounting in
accordance with FASB ASC Topic 805, Business Combinations (“FASB
ASC 805”), and the results of AcroSoft’s operations were included in the
Company’s consolidated financial statements commencing on the acquisition
date.
57
The
preliminary purchase price allocations for the Company’s acquisition of AcroSoft
are based on a third-party valuation report which was prepared in accordance
with the provisions of FASB ASC 805. The following table summarizes the fair
value of the intangible and other assets acquired and liabilities assumed at the
date of the acquisition (in thousands):
|
May
15, 2009
|
||||
|
Cash
|
$ | 149 | ||
|
Investments
|
2 | |||
|
Accounts
receivable
|
62 | |||
|
Prepaid
royalties
|
30 | |||
|
Other
current assets
|
1 | |||
|
Property,
plant and equipment
|
26 | |||
|
Current
tax asset
|
122 | |||
|
Deferred
tax asset
|
287 | |||
|
Accounts
payable
|
(8 | ) | ||
|
Deferred
tax liability
|
(212 | ) | ||
|
Intangible
assets
|
530 | |||
|
Goodwill
|
1,695 | |||
|
Total
assets acquired
|
$ | 2,684 | ||
|
Deferred
services revenue
|
(284 | ) | ||
|
Net
assets acquired
|
$ | 2,400 | ||
The fair
value of financial assets acquired includes accounts receivable with a fair and
contractual value of $62,000. The receivables consist of amounts due from
customers for products sold and/or services rendered.
During
the third quarter of 2009, the Company finalized AcroSoft’s tax return for the
period beginning January 1, 2009 and ending on the acquisition date of May 15,
2009. As a result, goodwill attributed to AcroSoft increased $61,000,
which is reflected in the Company’s deferred tax assets on the accompanying
consolidated balance sheets. During the fourth quarter of 2009, the Company
completed an Internal Revenue Code Sec. 382, Limitation on Net Operating Loss
Carryforwards and Certain Built-in Losses Following Ownership Change,
limitations review which determined that the AcroSoft state net operating losses
could not be utilized. As a result, goodwill attributed to AcroSoft increased
$90,000, which is reflected in the Company’s deferred tax assets on the
accompanying consolidated balance sheets.
Acquisition-related
costs recognized as of December 31, 2009 include transaction costs such as
legal, accounting, valuation and other professional services, which were
expensed as incurred. Acquisition-related costs totaled approximately $65,000
during 2009. These costs are included within general and administrative expenses
on the consolidated statements of income.
The
premium paid over the fair value of the net assets acquired in the purchase, or
goodwill, was primarily attributed to expected synergies from AcroSoft’s
document management software, experienced document management staff and an
existing client base. Included within goodwill is the assembled workforce,
comprised of 12 employees, which does not qualify for separate recognition. None
of the goodwill is expected to be deductible for tax purposes.
Customer
relationships and core technology are amortized based upon
historical patterns in which the economic benefits are expected to be
realized. Other finite-lived identifiable intangible assets are amortized on a
straight-line basis. The following are the identifiable intangible assets
acquired and their respective economic useful lives at the date of
acquisition:
|
Gross
Amount
|
Accumulated
Amortization
|
Net
Amount
|
Economic
Useful Life
(in
years)
|
|||||||||||||
|
Customer
relationships
|
$ | 210,000 | $ | 21,900 | $ | 188,100 | 6 | |||||||||
|
Core
technology
|
320,000 | 40,000 | 280,000 | 5 | ||||||||||||
|
Total
|
$ | 530,000 | $ | 468,100 | ||||||||||||
Alliance
Acquisition
On April
17, 2007, the Company entered into an asset purchase agreement, dated as of the
same date, with Alliance Systems Ltd. (“Alliance”), a master distributor of the
Company that provides computer infrastructure such as server and storage
solutions that supports wireless, VoIP, contact center, security, and video
enterprise communications solutions. Pursuant to the asset purchase agreement,
the Company acquired the professional services division of Alliance which was
focused on licensing, implementing and supporting the Company’s contact center
automation and enterprise IP telephony software solutions, for an aggregate
purchase price of $1.1 million, less adjustment for certain costs and pro-rated
customer receipts. A total of 13 professional services engineers and one sales
representative joined the Company in connection with the acquisition. The
Company funded the purchase price with cash available from
operations.
58
The
purchase price allocations for the Company’s acquisition of the professional
services division of Alliance were based on estimated fair values in accordance
with the provisions of Statement of Financial Accounting Standard No. 141, Business Combinations. The
following table summarizes the fair value of the intangible and other assets
acquired and liabilities assumed at the date of acquisition (in
thousands):
|
Goodwill
|
$ | 996 | ||
|
Customer
relationships
|
50 | |||
|
Property
and equipment
|
36 | |||
|
Total
assets acquired
|
1,082 | |||
|
Deferred
services revenue
|
(49 | ) | ||
|
Net
assets acquired
|
$ | 1,033 |
The
premium paid over the fair value of the net assets acquired in the purchase, or
goodwill, was primarily attributed to expected synergies from the Company’s
acquisition of a professional services team having prior experience with the
Company’s solutions and their implementation.
Goodwill
and Other Intangible Assets
Goodwill
is reviewed for impairment at least annually in accordance with the provisions
of FASB ASC Subtopic 350-20, Intangibles - Goodwill and
Other. The goodwill impairment test is a two-step test. Under the first
step, the fair value of the reporting unit is compared with its carrying value
(including goodwill). Fair value of the reporting unit is determined using a
discounted cash flow analysis. If the fair value of the reporting unit exceeds
its carrying value, step two does not need to be performed. If the fair value of
the reporting unit is less than its carrying value, an indication of goodwill
impairment exists for the reporting unit and the enterprise must perform step
two of the impairment test (measurement). Under step two, an impairment charge
is recognized for any excess of the carrying amount of the reporting unit’s
goodwill over the implied fair value of that goodwill. The implied fair value of
goodwill is determined by allocating the fair value of the reporting unit in a
manner similar to a purchase price allocation, in accordance with FASB ASC 805.
The residual fair value after this allocation is the implied fair value of the
reporting unit goodwill. The following table presents a roll forward of
goodwill, which is included within other assets, net on the accompanying
consolidated balance sheets, as of December 31, 2009 (in
thousands):
|
Balance
as of January 1, 2009
|
$ | 995 | ||
|
AcroSoft
goodwill
|
1,846 | |||
|
Balance
as of December 31, 2009
|
$ | 2,841 |
The
Company performed a goodwill impairment test as of September 30, 2009 and
concluded that no impairment existed as of September 30, 2009. As
there were no changes in facts and circumstances that indicated that the fair
value of the reporting unit may have been below its carrying amount, no
additional impairment tests were performed during the fourth quarter of
2009.
14.
RECENTLY ISSUED ACCOUNTING PRONOUNCEMENTS
In June
2009, the FASB established the FASB Accounting Standards Codification™
(“Codification”) as the source of authoritative U.S. Generally Accepted
Accounting Principles (“GAAP”) recognized by the FASB to be applied by
nongovernmental entities in the preparation of financial
statements. This guidance was included in the Codification under FASB
ASC Topic 105, Generally
Accepted Accounting Principles. All prior accounting standard
documents were superseded by the Codification and any accounting literature not
included in the Codification is no longer authoritative. Rules and interpretive
releases of the SEC issued under the authority of federal securities laws will
continue to be sources of authoritative U.S. GAAP for SEC
registrants. The Codification became effective for the Company
beginning with the third quarter of 2009. Therefore, beginning with
the third quarter of 2009, all references made by the Company in its
consolidated financial statements use the new Codification numbering
system. The Codification does not change or alter existing U.S. GAAP
and, therefore, did not have an impact on the Company’s consolidated financial
statements.
In April
2009, the FASB established guidance under FASB ASC Paragraph 820-10-65-4, Determining Fair Value When the
Volume and Level of Activity for the Asset or Liability Have Significantly
Decreased and Identifying Transactions That Are Not Orderly, which
provides guidance on determining fair values for assets or liabilities when
there is no active market or where the price inputs being used represent
distressed sales. The guidance reaffirms the need to use judgment to ascertain
if a formerly active market has become inactive and determining fair values when
markets have become inactive. The guidance became effective for interim and
annual reporting periods ending after June 15, 2009. Upon adoption of this
guidance during the second quarter of 2009, there was no material impact on the
Company’s consolidated financial statements.
In April
2009, the FASB established guidance under FASB ASC Paragraph 320-10-65-1, Recognition and Presentation of
Other-Than-Temporary Impairments, which amended the other-than-temporary
impairment guidance in U.S. GAAP for debt securities to make the guidance more
operational and to improve the presentation and disclosure of
other-than-temporary impairments on debt and equity securities in the financial
statements. The guidance became effective for interim and annual reporting
periods ending after June 15, 2009 with early adoption permitted for periods
ending after March 15, 2009. Upon adoption of this guidance during the second
quarter of 2009, there was no material impact on the Company’s consolidated
financial statements.
In April
2009, the FASB established guidance under FASB ASC Paragraph 825-10-65-1, Interim Disclosures about Fair Value
of Financial Instruments, which requires the disclosure of the fair value
of financial instruments in summarized financial information at interim
reporting periods for publicly traded companies as well as in annual financial
statements. The guidance became effective for interim and annual reporting
periods ending after June 15, 2009. Upon adoption of this guidance during the
second quarter of 2009, there was no material impact on the Company’s
consolidated financial statements.
59
In May
2009, the FASB established guidance under FASB ASC Topic 855, Subsequent Events, which
establishes general
standards of accounting for and disclosure of events that occur after the
balance sheet date but before financial statements are issued or are available
to be issued. This guidance became effective for interim and annual
reporting periods ending after June 15, 2009. In February 2010, the
FASB amended this guidance under Accounting Standard Update (“ASU”) 2010-09,
Amendments to Certain
Recognition and Disclosure Requirements. The amended guidance removed the
requirement for SEC filers to disclose the date through which an entity has
evaluated subsequent events and was effective upon issuance. The
Company performed an evaluation of subsequent events and noted no additional
events that warranted disclosure.
In
September 2009, the FASB issued FASB ASU 2009-13, Multiple-Deliverable Revenue
Arrangements, which addresses criteria for separating consideration in
multiple-element arrangements. The guidance requires companies allocating the
overall consideration to each deliverable to use an estimated selling price of
individual deliverables in the arrangement in the absence of vendor-specific
objective evidence or other third-party evidence of the selling price for the
deliverables. This guidance will be effective for fiscal years beginning on or
after June 15, 2010 and early adoption is permitted. The Company has not
determined the effect that the adoption of this guidance will have on its
consolidated financial statements.
In
September 2009, the FASB issued FASB ASU 2009-14, Certain Revenue Arrangements that
Include Software Elements, which excludes from the scope of the FASB’s
software revenue guidance tangible products that contain both software and
non-software components that function together to deliver a product’s essential
functionality. This guidance will be effective prospectively for revenue
arrangements entered into or materially modified in fiscal years beginning on or
after June 15, 2010 with early adoption permitted. If a company chooses to early
adopt this guidance and the adoption is not at the beginning of its fiscal year,
the requirements must be applied retrospectively to the beginning of the fiscal
year. The Company has not determined the effect that the adoption of this
guidance will have on its consolidated financial statements.
In
January 2010, the FASB issued FASB ASU 2010-06, Improving Disclosures About Fair
Value Measurements, which amends FASB ASC 820. The updated guidance
requires new disclosures about recurring or nonrecurring fair-value measurements
including significant transfers into and out of Level 1 and Level 2 fair-value
measurements and information on purchases, sales, issuances, and settlements on
a gross basis in the reconciliation of Level 3 fair-value measurements. The
guidance also clarified existing fair-value measurement disclosure guidance
about the level of disaggregation, inputs, and valuation techniques. The
guidance became effective for interim and annual reporting periods beginning on
or after December 15, 2009, with an exception for the disclosures of purchases,
sales, issuances and settlements on the roll-forward of activity in Level 3 fair
value measurements. Those disclosures will be effective for fiscal years
beginning after December 15, 2010 and for interim periods within those fiscal
years. Upon adopting the guidance, there was no material impact on the Company’s
consolidated financial statements.
15.
UNAUDITED SELECTED QUARTERLY FINANCIAL DATA
The
following selected quarterly data should be read in conjunction with
“Management’s Discussion and Analysis of Financial Condition and Results of
Operations”. This information has been derived from unaudited consolidated
financial statements of the Company that, in management’s opinion, reflect all
recurring adjustments necessary to fairly present the Company’s financial
information when read in conjunction with its consolidated financial statements
and notes thereto. The results of operations for any quarter are not necessarily
indicative of the results to be expected for any future period. As discussed in
Note 2, certain reclassifications have been made to the prior year amounts to
conform to the current period presentation (in thousands, except per share
amounts):
|
2009
|
||||||||||||||||
|
Quarter
Ended
|
||||||||||||||||
|
Mar.
31,
|
Jun.
30,
|
Sep.
30,
|
Dec.
31,
|
|||||||||||||
|
Total
revenues
|
$ | 29,476 | $ | 32,895 | $ | 33,170 | $ | 35,877 | ||||||||
|
Gross
profit
|
20,446 | 22,346 | 23,671 | 25,102 | ||||||||||||
|
Operating
income
|
2,471 | 2,979 | 4,278 | 4,770 | ||||||||||||
|
Net
income
|
1,223 | 2,097 | 2,803 | 2,519 | ||||||||||||
|
Net
income per share:
|
||||||||||||||||
|
Basic
|
$ | 0.07 | $ | 0.12 | $ | 0.16 | $ | 0.15 | ||||||||
|
Diluted
|
0.07 | 0.12 | 0.15 | 0.14 | ||||||||||||
|
Shares
used to compute net income per share:
|
||||||||||||||||
|
Basic
|
16,948 | 17,015 | 17,148 | 17,267 | ||||||||||||
|
Diluted
|
17,635 | 18,070 | 18,486 | 18,643 | ||||||||||||
|
2008
|
||||||||||||||||
|
Quarter
Ended
|
||||||||||||||||
|
Mar.
31,
|
Jun.
30,
|
Sep.
30,
|
Dec.
31,
|
|||||||||||||
|
Total
revenues
|
$ | 29,483 | $ | 30,610 | $ | 30,056 | $ | 31,257 | ||||||||
|
Gross
profit
|
20,456 | 20,613 | 20,295 | 20,904 | ||||||||||||
|
Operating
income
|
1,369 | 1,291 | 1,571 | 2,718 | ||||||||||||
|
Net
income
|
1,117 | 845 | 924 | 1,452 | ||||||||||||
|
Net
income per share:
|
||||||||||||||||
|
Basic
|
$ | 0.06 | $ | 0.05 | $ | 0.05 | $ | 0.09 | ||||||||
|
Diluted
|
0.06 | 0.04 | 0.05 | 0.08 | ||||||||||||
|
Shares
used to compute net income per share:
|
||||||||||||||||
|
Basic
|
17,940 | 17,972 | 17,976 | 17,082 | ||||||||||||
|
Diluted
|
19,216 | 19,077 | 18,855 | 17,711 | ||||||||||||
60
Interactive
Intelligence, Inc.
Schedule
II – Valuation and Qualifying Accounts
For
the Years Ended December 31, 2009, 2008 and 2007
|
Description
|
Balance
at
Beginning
of Period
|
Charged
(Credited) to Revenue and Expenses, net
|
Reduction
of
Allowance
(1)
|
Balance
at
End
of Period
|
||||||||||||
|
Allowance
for Doubtful Accounts Receivable:
|
||||||||||||||||
|
2009
|
$ | 1,004,000 | $ | 627,000 | $ | 537,000 | $ | 1,094,000 | ||||||||
|
2008
|
$ | 1,076,000 | $ | 1,258,000 | $ | 1,330,000 | $ | 1,004,000 | ||||||||
|
2007
|
$ | 596,000 | $ | 1,589,000 | $ | 1,109,000 | $ | 1,076,000 | ||||||||
|
(1)
|
Uncollectible
accounts written off, net of
recoveries.
|
Not applicable.
|
ITEM
9A.
|
|
(a)
|
Disclosure
Controls and Procedures
|
We
maintain a set of disclosure controls and procedures that are designed to ensure
that information required to be disclosed by us in the reports filed by us under
the Exchange Act is (a) recorded, processed, summarized and reported within the
time periods specified in the SEC’s rules and forms, and (b) accumulated and
communicated to our management, including our principal executive and principal
financial officers, to allow timely decisions regarding required disclosures. We
carried out an evaluation, under the supervision and with the participation of
our management, including our President and Chief Executive Officer (principal
executive officer) and our Chief Financial Officer (principal financial
officer), of the effectiveness of the design and operation of our disclosure
controls and procedures as of December 31, 2009, pursuant to Rule 13a-15 of the
Exchange Act. Based on that evaluation, our President and Chief Executive
Officer and our Chief Financial Officer concluded that our disclosure controls
and procedures were effective.
(b) Management’s
Report on Internal Control over Financial Reporting
The
management of Interactive Intelligence, Inc. (the “Company”) is responsible for
establishing and maintaining adequate internal control over financial reporting
for the Company. Internal control over financial reporting is defined in Rule
13a-15(f) and 15d-15(f) promulgated under the Securities Exchange Act of 1934,
as amended, as a process designed by, or under the supervision of, the Company’s
principal executive and principal financial officers and effected by the
Company’s Board of Directors, management and other personnel, to provide
reasonable assurance regarding the reliability of financial reporting and the
preparation of consolidated financial statements for external reporting purposes
in accordance with accounting principles generally accepted in the United States
of America and includes those policies and procedures that:
|
|
·
|
Pertain
to the maintenance of records that in reasonable detail accurately and
fairly reflect the transactions and dispositions of the Company’s
assets;
|
|
|
·
|
Provide
reasonable assurance that transactions are recorded as necessary to permit
preparation of financial statements in accordance with generally accepted
accounting principles, and that the Company’s receipts and
expenditures are being made only in accordance with authorizations of its
management and directors; and
|
|
|
·
|
Provide
reasonable assurance regarding prevention or timely detection of
unauthorized acquisition, use or disposition of the Company’s assets that
could have a material effect on the consolidated financial
statements.
|
Because
of its inherent limitations, internal control over financial reporting may not
prevent or detect misstatements. Also, projections of any evaluation of
effectiveness to future periods are subject to the risk that controls may become
inadequate because of changes in conditions, or that the degree of compliance
with the policies or procedures may deteriorate.
The
Company’s management (with the participation and under the
supervision of the Company’s principal executive and principal financial
officers) conducted an evaluation of the effectiveness of the Company’s internal
control over financial reporting based on the framework in Internal Control—Integrated
Framework issued by the Committee of Sponsoring Organizations of the
Treadway Commission (“COSO”). Based on this evaluation and the criteria in Internal Control—Integrated
Framework issued by COSO, management concluded that the Company’s
internal control over financial reporting was effective as of December 31, 2009.
The Company’s independent registered public accounting firm, KPMG LLP, has
audited the effectiveness of the Company’s internal control over financial
reporting as of December 31, 2009, as stated
in their report dated March 16, 2010, which is included in Item 8 of Part
II of this Annual Report on Form 10-K.
(c) Changes
in Internal Control over Financial Reporting
There have been no changes in our
internal control over financial reporting that occurred during the quarter ended
December 31, 2009 that have materially affected, or are reasonably likely to
materially affect, our internal control over financial reporting.
(d) Attestation
Report of Independent Registered Public Accounting Firm
See
Independent Registered Public Accounting Firm report in Item 8 of Part II
of this Annual Report on Form 10-K.
61
|
ITEM
9B.
|
None.
|
|
PART
III.
|
The
information required by this Item concerning our directors and executive
officers, audit committee members and financial expert, code of ethics,
disclosure of delinquent Section 16 filers and shareholder director nomination
procedures is incorporated herein by reference from our Proxy Statement for the
Annual Meeting of Shareholders to be held on May 20, 2010, which will be filed
with the SEC no later than 120 days after December 31, 2009.
The
following is the current biographical information with respect to our
directors and our executive officers:
|
Board
of Directors
|
Executive
Officers
|
|
Donald
E. Brown, M.D.
|
Donald
E. Brown, M.D.
|
|
Chairman
of the Board, President and Chief Executive
Officer
|
Chairman
of the Board, President and Chief Executive Officer
|
|
Richard
G. Halperin
|
Gary
R. Blough
|
|
Former
Chief Executive Officer of Coherent Networks International Inc.
|
Executive
Vice President of Worldwide Sales
|
|
(GIS
software company)
|
|
|
William
J. Gildea III
|
|
|
Edward
L. Hamburg * ^
|
Vice
President of Business Development
|
|
Venture
Partner, Morgan Stanley Private Equity; Former
Executive Vice
|
|
|
President
of Corporate Operations,
Chief Financial Officer and Corporate
|
Stephen
R. Head
|
|
Secretary
of SPSS Inc. (provider of predictive analytics software technology and
services)
|
Chief
Financial Officer, Vice President, Finance and Administration,
|
|
|
Secretary
and Treasurer
|
|
Michael C. Heim * +
|
|
|
Senior
Vice President, Information Technology and Chief Information Officer,
|
Hans
W. Heltzel
|
|
Eli
Lilly and Company (pharmaceuticals company)
|
Vice
President of Support and Professional Services
|
|
Mark
E. Hill +^
|
Pamela
J. Hynes
|
|
Managing
Partner, Collina Ventures, LLC (private
investment company)
|
Vice
President of Customer Services
|
|
|
|
|
Richard
A. Reck *+
|
Joseph
A. Staples
|
|
President,
Business Strategy Advisors, LLC (business strategy
consultancy)
|
Chief
Marketing Officer
|
* Member of Audit Committee
|
+ Member of Compensation and Stock
Option Committee
|
|
^
Member of Nominating and Corporate Governance
Committee
|
|
ITEM
11.
|
The
information required by this Item concerning remuneration of our executive
officers and directors, material transactions involving such executive officers
and directors and Compensation Committee interlocks, as well as the Compensation
Committee Report and the Compensation Discussion and Analysis, are incorporated
herein by reference from our Proxy Statement for the Annual Meeting of
Shareholders to be held on May 20, 2010, which will be filed with the SEC no
later than 120 days after December 31, 2009.
|
ITEM
12.
|
The
information required by this Item concerning the stock ownership of management,
five percent beneficial owners and securities authorized for issuance under
equity compensation plans is incorporated herein by reference from our Proxy
Statement for the Annual Meeting of Shareholders to be held on May 20, 2010,
which will be filed with the SEC no later than 120 days after December 31,
2009.
The
information required by this Item concerning certain relationships and related
person transactions, and director independence is incorporated herein by
reference from our Proxy Statement for the Annual Meeting of Shareholders to be
held on May 20, 2010, which will be filed with the SEC no later than 120 days
after December 31, 2009.
The
information required by this Item concerning the fees and services of our
independent registered public accounting firm and our Audit Committee actions
with respect thereto is incorporated herein by reference from our Proxy
Statement for the Annual Meeting of Shareholders to be held on May 20, 2010,
which will be filed with the SEC no later than 120 days after December 31,
2009.
62
|
|
PART
IV.
|
|
1.
|
Financial
Statements
|
The
Consolidated Financial Statements are set forth under Item 8 of Part II of this
Annual Report on Form 10-K.
|
2.
|
Financial
Statement Schedule
|
Schedule II - Valuation and Qualifying
Accounts is set forth under Item 8 of Part II of this Annual Report on Form
10-K.
All other schedules are omitted because
they are either not required, not applicable, or the required information is
otherwise shown in the Consolidated Financial Statements, the Notes thereto or
Schedule II - Valuation and Quantifying Accounts.
|
3.
|
Exhibits
|
The
following documents are filed as Exhibits to this Annual Report on Form 10-K or
incorporated by reference herein and, pursuant to Rule 12b-32 of the General
Rules and Regulations promulgated by the SEC under the Exchange Act, reference
is made to such documents as previously filed as exhibits with the
SEC.
63
|
INDEX TO
EXHIBITS
|
|||||||||||||||||
|
Incorporated
by Reference to
|
|||||||||||||||||
|
Exhibit
Number
|
Exhibit
Description
|
Form
|
Exhibit
|
Filing
Date
|
Filed
Herewith
|
||||||||||||
|
3.1
|
Restated
Articles of Incorporation of the Company, as currently in
effect
|
S-1
(Registration
No. 333-79509)
|
3.1
|
5/28/1999
|
|||||||||||||
|
3.2
|
Amended
By-Laws of the Company, as currently in effect
|
8-K
|
3.2
|
7/28/2009
|
|||||||||||||
|
10.1
|
*Restated
1995 Incentive Stock Option Plan, as currently in effect
|
S-1/A
(Registration
No. 333-79509)
|
10.1
|
7/23/1999
|
|||||||||||||
|
10.2
|
*1995
Nonstatutory Stock Option Incentive Plan
|
S-1
(Registration
No. 333-79509)
|
10.2
|
5/28/1999
|
|||||||||||||
|
10.3
|
*Amended
1999 Stock Option and Incentive Plan, as currently in
effect
|
8-K
|
10.3
|
3/17/08
|
|||||||||||||
|
10.4
|
*Amended
Outside Directors Stock Option Plan, as currently in
effect
|
DEF
14A
|
Appendix
A
|
4/8/2004
|
|||||||||||||
|
10.5
|
*Form
of Change of Control and Retention Agreement by and between the Company
and each of Stephen R. Head, Joseph A. Staples, Pamela J. Hynes, Gary R.
Blough and William J. Gildea III
|
8-K
|
10.5
|
3/17/2006
|
|||||||||||||
|
10.6
|
Asset
Purchase Agreement dated as of April 17, 2007 between the Company and
Alliance Systems Ltd.
|
8-K
|
10.6
|
4/23/2007
|
|||||||||||||
|
10.8
|
Patent
License Agreement, dated December 31, 2004, between the Company and
AudioFAX IP LLC (confidential treatment has been granted for certain
portions of this exhibit, and accordingly, those portions have been
omitted from this exhibit and filed separately with the Securities and
Exchange Commission)
|
10-K
|
10.8
|
3/28/2005
|
|||||||||||||
|
10.10
|
*Employment
Agreement, Non-Disclosure and Non-Competition between the Company and Gary
R. Blough, dated May 26, 2006
|
8-K
|
10.6
|
5/31/2006
|
|||||||||||||
|
10.11
|
*Employment
Agreement between the Company and Stephen R. Head, dated November 3,
2003
|
10-K
|
10.11
|
3/25/2004
|
|||||||||||||
|
10.13
|
*(i)
Employment Agreement between the Company and Pamela J. Hynes dated
November 4, 1996 and the First Amendment to Employment Agreement between
the Company and Pamela J. Hynes dated February 23, 2000
|
10-Q
|
10.13
|
5/12/2004
|
|||||||||||||
|
*(ii)
Letter of Assignment between the Company and Pamela J. Hynes, dated as of
January 2, 2007
|
10-K
|
10.20
|
3/15/2007
|
||||||||||||||
|
10.14
|
*Stock
Option Agreement between the Company and Donald E. Brown, M.D., dated
September 22, 1998
|
S-1
(Registration
No. 333-79509)
|
10.14
|
5/28/1999
|
|||||||||||||
64
|
INDEX
TO EXHIBITS
|
||||||||||||||||
|
Incorporated
by Reference to
|
||||||||||||||||
|
Exhibit
Number
|
Exhibit
Description
|
Form
|
Exhibit
|
Filing
Date
|
Filed
Herewith
|
|||||||||||
|
10.16
|
(i)
Office Lease, dated April 1, 2001, between the Company and Duke-Weeks
Realty Limited Partnership (Exhibits thereto will be furnished
supplementally to the Securities and Exchange Commission upon
request)
|
10-K
|
10.16(i)
|
3/17/2008
|
||||||||||||
|
(ii)
Lease Modification Agreement, dated September 19, 2001, between the
Company and Duke-Weeks Realty Limited Partnership (Exhibits thereto will
be furnished supplementally to the Securities and Exchange Commission upon
request)
|
10-K
|
10.16(ii)
|
3/17/2008
|
|||||||||||||
|
(iii)
Third Lease Amendment, dated June 19, 2007, between the Company and Duke
Realty Limited Partnership (formerly Duke-Weeks Realty Limited
Partnership)
|
8-K
|
10
|
6/25/2007
|
|||||||||||||
|
(iv)
Fourth Lease Amendment, dated March 14, 2008, between the Company and Duke
Realty Limited Partnership (formerly Duke-Weeks Realty Limited
Partnership)
|
10-Q
|
10.16
|
5/12/2008
|
|||||||||||||
|
10.18
|
Consolidated
Subordinated Promissory Note made by the Company in favor of Donald E. Brown, M.D.,
dated May 1, 1999
|
S-1
(Registration
No. 333-79509)
|
10.18
|
5/28/1999
|
||||||||||||
|
10.21
|
*Form
of Agreement for Incentive Stock Options under 1999 Stock Option and
Incentive Plan
|
10-K
|
10.21
|
3/17/2008
|
||||||||||||
|
10.22
|
*Form
of Agreement for Nonqualified Stock Options under 1999 Stock Option and
Incentive Plan
|
10-K
|
10.21
|
3/17/2008
|
||||||||||||
|
10.23
|
Form
of Indemnity Agreement between the Company and each of its directors and
executive officers
|
S-1/A
(Registration
No. 333-79509)
|
10.23
|
7/14/1999
|
||||||||||||
|
10.24
|
*Form
of Agreement for Outside Directors Stock Option under Outside Directors
Stock Option Plan
|
10-Q
|
10.24
|
11/15/2004
|
||||||||||||
|
10.25
|
*Employment
Agreement dated January 3, 2005 between the Company and Joseph A.
Staples
|
8-K
|
10.25
|
1/6/2005
|
||||||||||||
|
10.26
|
*Summary
of Certain Director and Executive Officer Compensation
|
X
|
||||||||||||||
|
10.28
|
*Amended
Interactive Intelligence, Inc. Employee Stock Purchase Plan, as currently
in effect
|
8-K
|
10.28
|
1/5/2006
|
||||||||||||
|
10.29
|
*Interactive
Intelligence, Inc. 401(k) Savings Plan
|
S-8
(Registration
No. 333-33772)
|
4.3
|
3/31/2000
|
||||||||||||
|
10.33
|
*Interactive
Intelligence, Inc. 2006 Equity Incentive Plan, as Amended May 30,
2008
|
8-K
|
10.33
|
6/4/2008
|
||||||||||||
65
|
INDEX
TO EXHIBITS
|
|||||||||||||||||||||||||||||||||||||||||
|
Incorporated
by Reference to
|
|||||||||||||||||||||||||||||||||||||||||
|
Exhibit
Number
|
Exhibit
Description
|
Form
|
Exhibit
|
Filing
Date
|
Filed
Herewith
|
||||||||||||||||||||||||||||||||||||
|
10.35
|
*Form
of Incentive Stock Option Agreement under 2006 Equity Incentive
Plan
|
8-K
|
10.35
|
2/22/2007
|
|||||||||||||||||||||||||||||||||||||
|
10.36
|
*Form
of Nonqualified Stock Option Agreement under 2006 Equity Incentive
Plan
|
8-K
|
10.36
|
2/22/2007
|
|||||||||||||||||||||||||||||||||||||
|
10.37
|
*Form
of Non-Employee Director Stock Option Agreement under 2006 Equity
Incentive Plan
|
10-Q
|
10.37
|
8/9/2007
|
|||||||||||||||||||||||||||||||||||||
|
10.38
|
*Form
of Non-Employee Director Change of Control Agreement
|
10-Q
|
10.38
|
8/9/2007
|
|||||||||||||||||||||||||||||||||||||
|
10.40
|
*Employment
Agreement dated March 4, 2008 between the Company and William J.
Gildea, III
|
X | |||||||||||||||||||||||||||||||||||||||
|
21
|
Subsidiaries
of the Company as of December 31, 2009
|
X
|
|||||||||||||||||||||||||||||||||||||||
|
23
|
Consent
of KPMG LLP, Independent Registered Public Accounting Firm
|
X
|
|||||||||||||||||||||||||||||||||||||||
|
31.1
|
Certification
of the Chief Executive Officer pursuant to Rule 13a-14(a)/15d-14(a) of the
Securities Exchange Act of 1934, as adopted pursuant to Section 302 of the
Sarbanes-Oxley Act of 2002
|
X
|
|||||||||||||||||||||||||||||||||||||||
|
31.2
|
Certification
of the Chief Financial Officer pursuant to Rule 13a-14(a)/15d-14(a) of the
Securities Exchange Act of 1934, as adopted pursuant to Section 302 of the
Sarbanes-Oxley Act of 2002
|
X
|
|||||||||||||||||||||||||||||||||||||||
|
32.1
|
Certification
of the Chief Executive Officer, pursuant to 18 U. S. C. Section 1350, as
adopted pursuant to Section 906 of the Sarbanes-Oxley Act of
2002
|
X
|
|||||||||||||||||||||||||||||||||||||||
|
32.2
|
Certification
of the Chief Financial Officer, pursuant to 18 U. S. C. Section 1350, as
adopted pursuant to Section 906 of the Sarbanes-Oxley Act of
2002
|
X
|
|||||||||||||||||||||||||||||||||||||||
|
*
|
The
indicated exhibit is a management contract, compensatory plan or
arrangement required to be filed by Item 601 of Regulation
S-K.
|
||||||||||||||||||||||||||||||||||||||||
66
Pursuant
to the requirements of Section 13 or 15(d) of the Securities Exchange Act of
1934, the registrant has duly caused this report to be signed on its behalf by
the undersigned, thereunto duly authorized.
|
Interactive
Intelligence, Inc.
|
|||
|
(Registrant)
|
|||
|
Date:
March 16, 2010
|
By:
|
/s/
Stephen R. Head
|
|
|
Stephen
R. Head
|
|||
|
Chief
Financial Officer, Vice President of Finance and Administration, Secretary
and Treasurer
|
|||
Pursuant
to the requirements of the Securities Exchange Act of 1934, this report has been
signed below by the following persons on behalf of the registrant and in the
capacities and on the dates indicated.
|
SIGNATURES
|
CAPACITY
|
DATE
|
|||||
|
/s/ Donald E. Brown, M.D.
|
Chairman
of the Board of Directors,
|
March
16, 2010
|
|||||
|
Donald
E. Brown, M.D.
|
President,
Chief Executive Officer
|
||||||
|
(Principal
Executive Officer)
|
|||||||
|
/s/ Stephen R. Head
|
Chief
Financial Officer,
|
March
16, 2010
|
|||||
|
Stephen
R. Head
|
Vice
President of Finance and Administration, Secretary and
Treasurer
(Principal
Financial Officer and Principal Accounting Officer)
|
||||||
|
/s/ Richard G. Halperin
|
Director
|
March
16, 2010
|
|||||
|
Richard
G. Halperin
|
|||||||
|
/s/ Edward L. Hamburg, Ph.
D.
|
Director
|
March
16, 2010
|
|||||
|
Edward
L. Hamburg, Ph. D.
|
|||||||
|
/s/ Mark E. Hill
|
Director
|
March
16, 2010
|
|||||
|
Mark
E. Hill
|
|||||||
|
/s/ Michael C. Heim
|
Director
|
March
16, 2010
|
|||||
|
Michael
C. Heim
|
|||||||
|
/s/ Richard A. Reck
|
Director
|
March
16, 2010
|
|||||
|
Richard
A. Reck
|
|||||||
67