Attached files
| file | filename |
|---|---|
| 8-K - CURRENT REPORT OF MATERIAL EVENTS OR CORPORATE CHANGES - Digital Generation, Inc. | a10-6292_18k.htm |
Exhibit 99.1
|
|
Investor Presentation Nasdaq: DGIT March 2010 |
|
|
Safe Harbor Language This presentation contains forward-looking statements relating to the Company, including the expansion of its digital distribution network, the demand among certain clients for digital audio and video delivery services, and its expectations for previous acquisitions. These statements are based on current economic and market conditions and assume no material changes in economic conditions or other major world events. The Company can give no assurance as to whether these conditions will continue, or if they change, how such changes may affect the Company’s current expectations. While the Company may, from time to time, revise its outlook or issue updated guidance, it assumes no obligation to do so. These forward-looking statements involve risks and uncertainties, which could cause actual results to differ materially from those projected. Additional information on these and other risks, uncertainties and factors is included in DG FastChannel’s Annual Report on Form 10-K, Quarterly Reports on Form 10-Q, Current Reports on Form 8-K and other documents filed with the SEC. |
|
|
[3] Company Overview Company Overview |
|
|
Investment Highlights Dominant player in North American Advertising Services market Long-term relationships across blue chip customer base Uniquely positioned to deliver ads across traditional and online media Technology leadership via proprietary B2B digital platform coupled with world-class operating infrastructure Highly positive growth trends Growing free cash flow model and strong balance sheet |
|
|
#5 on the Fortune “Fastest Growing Companies in the World” list Investment Highlights |
|
|
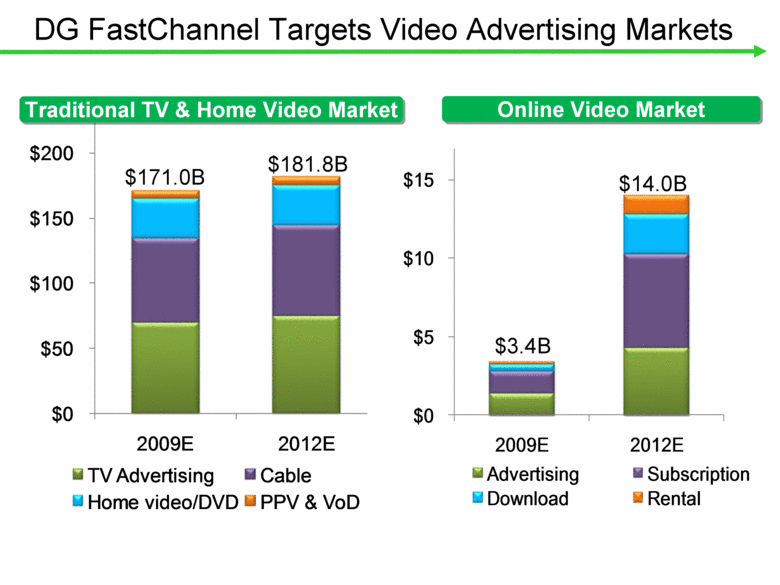
$0 $50 $100 $150 $200 2009E 2012E TV Advertising Cable Home video/DVD PPV & VoD DG FastChannel Targets Video Advertising Markets $0 $5 $10 $15 2009E 2012E Advertising Subscription Download Rental $171.0B $181.8B Online Video Market $3.4B $14.0B Traditional TV & Home Video Market |
|
|
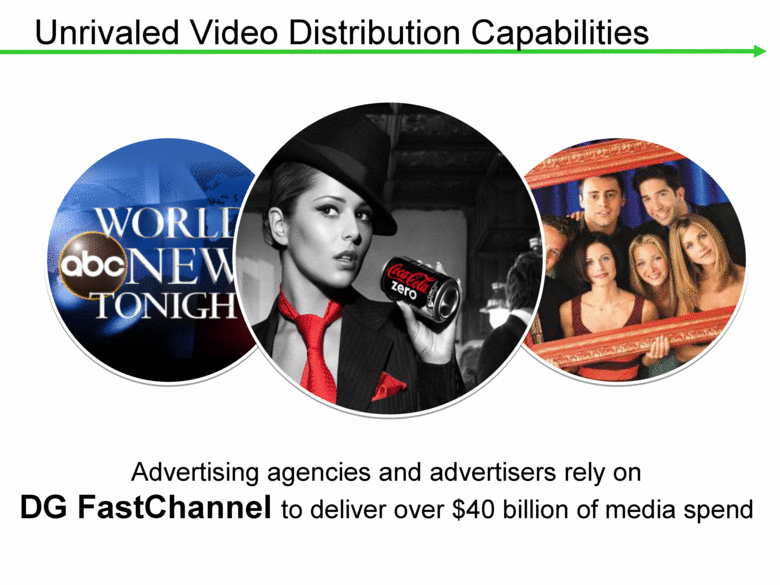
Unrivaled Video Distribution Capabilities Advertising agencies and advertisers rely on DG FastChannel to deliver over $40 billion of media spend |
|
|
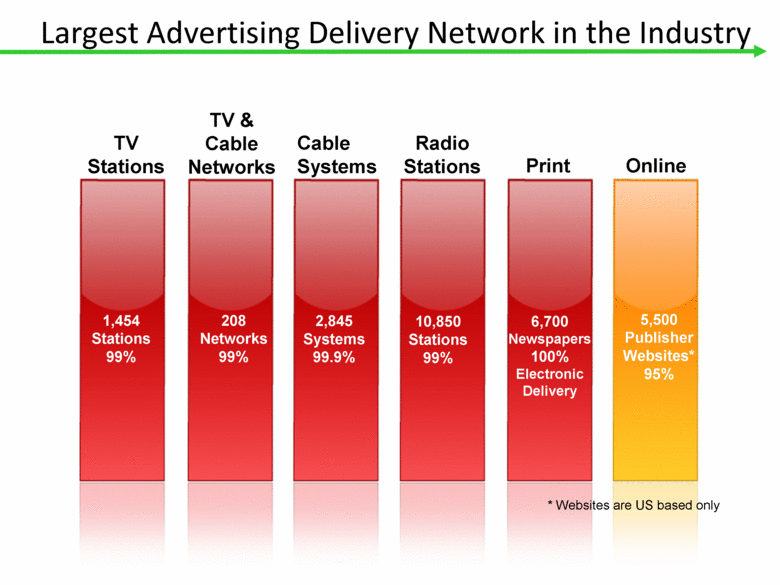
Largest Advertising Delivery Network in the Industry TV Stations TV & Cable Networks Cable Systems Radio Stations Print Online 1,454 Stations 99% 208 Networks 99% 2,845 Systems 99.9% 5,500 Publisher Websites* 95% 6,700 Newspapers 100% Electronic Delivery 10,850 Stations 99% * Websites are US based only |
|
|
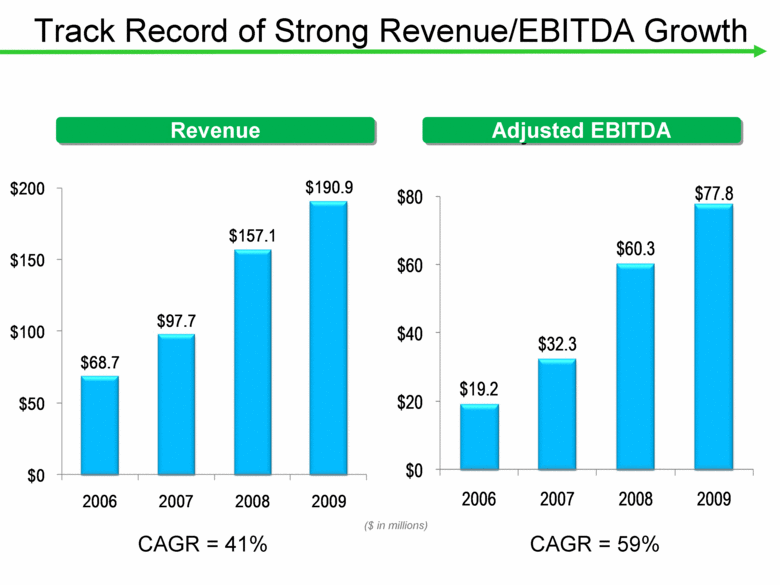
$19.2 $32.3 $60.3 $77.8 $0 $20 $40 $60 $80 2006 2007 2008 2009 Track Record of Strong Revenue/EBITDA Growth Adjusted EBITDA Revenue $68.7 $97.7 $157.1 $190.9 $0 $50 $100 $150 $200 2006 2007 2008 2009 ($ in millions) CAGR = 41% CAGR = 59% |
|
|
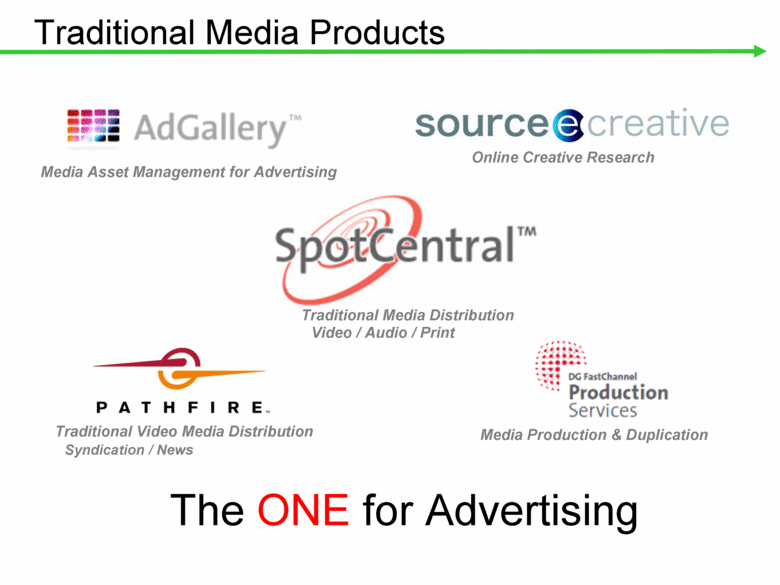
Traditional Media Products The ONE for Advertising Media Production & Duplication Traditional Media Distribution Video / Audio / Print Media Asset Management for Advertising Traditional Video Media Distribution Syndication / News Online Creative Research |
|
|
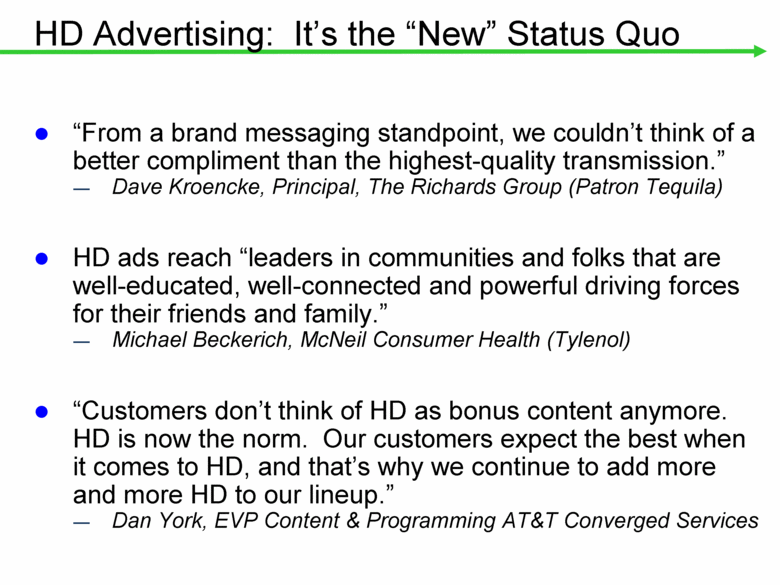
HD Advertising: It’s the “New” Status Quo “From a brand messaging standpoint, we couldn’t think of a better compliment than the highest-quality transmission.” Dave Kroencke, Principal, The Richards Group (Patron Tequila) HD ads reach “leaders in communities and folks that are well-educated, well-connected and powerful driving forces for their friends and family.” Michael Beckerich, McNeil Consumer Health (Tylenol) “Customers don’t think of HD as bonus content anymore. HD is now the norm. Our customers expect the best when it comes to HD, and that’s why we continue to add more and more HD to our lineup.” Dan York, EVP Content & Programming AT&T Converged Services |
|
|
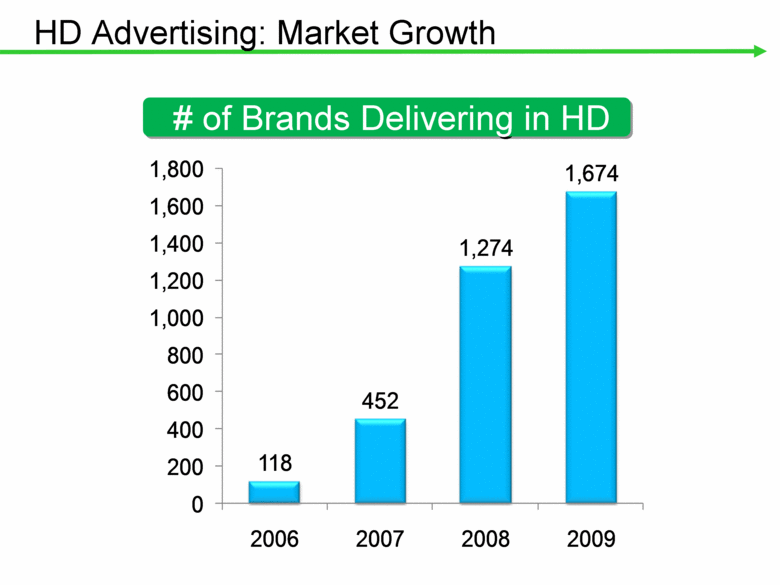
HD Advertising: Market Growth # of Brands Delivering in HD 118 452 1,274 1,674 0 200 400 600 800 1,000 1,200 1,400 1,600 1,800 2006 2007 2008 2009 |
|
|
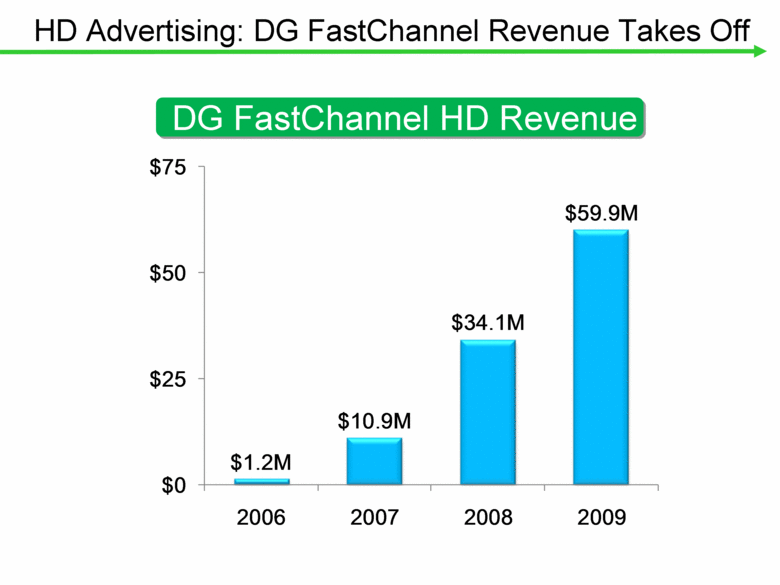
HD Advertising: DG FastChannel Revenue Takes Off $1.2M $10.9M $34.1M $59.9M $0 $25 $50 $75 2006 2007 2008 2009 DG FastChannel HD Revenue |
|
|
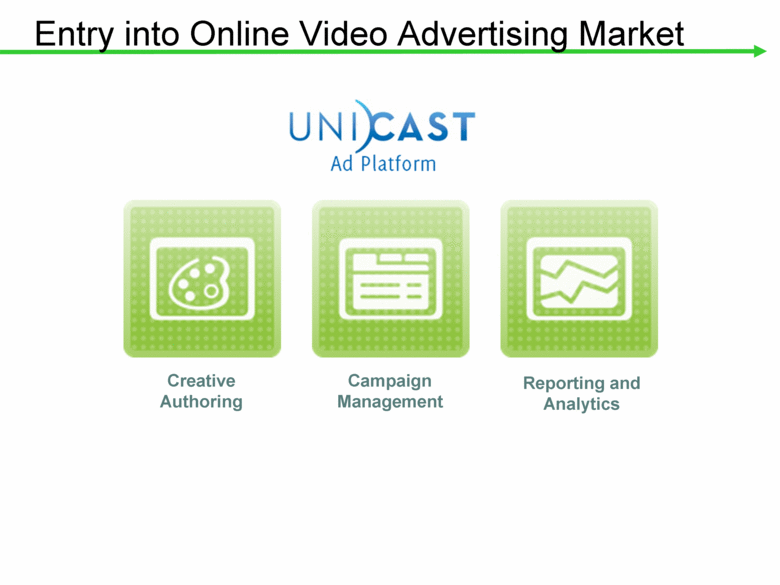
Entry into Online Video Advertising Market Creative Authoring Campaign Management Reporting and Analytics |
|
|
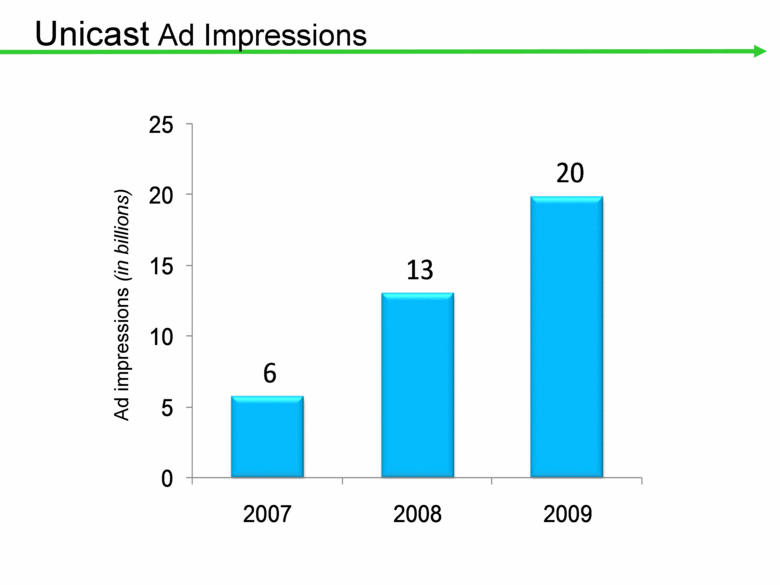
Unicast Ad Impressions 6 13 20 0 5 10 15 20 25 2007 2008 2009 Ad impressions (in billions) |
|
|
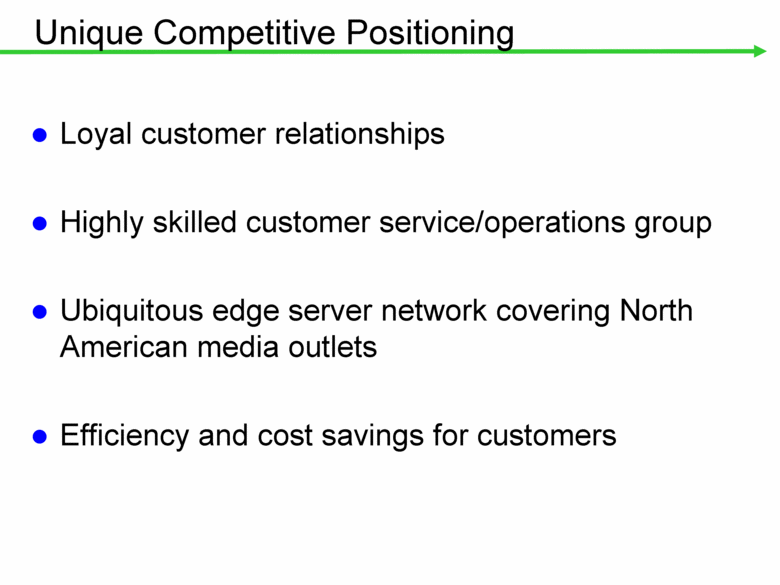
Unique Competitive Positioning Loyal customer relationships Highly skilled customer service/operations group Ubiquitous edge server network covering North American media outlets Efficiency and cost savings for customers |
|
|
Financial Review Financial Review |
|
|
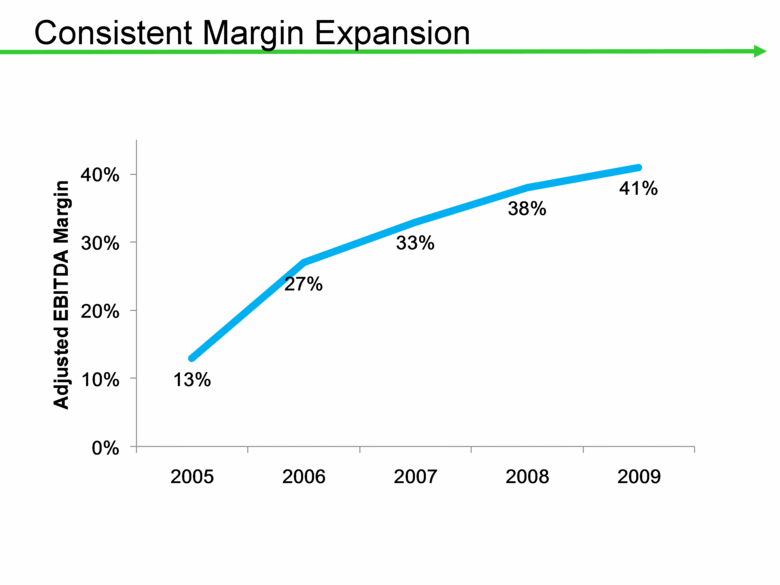
Financial Highlights Track record of revenue growth and diversification Successful integration of multiple transactions Significant operating synergies realized Consistent margin expansion Growing free cash flow Solid balance sheet |
|
|
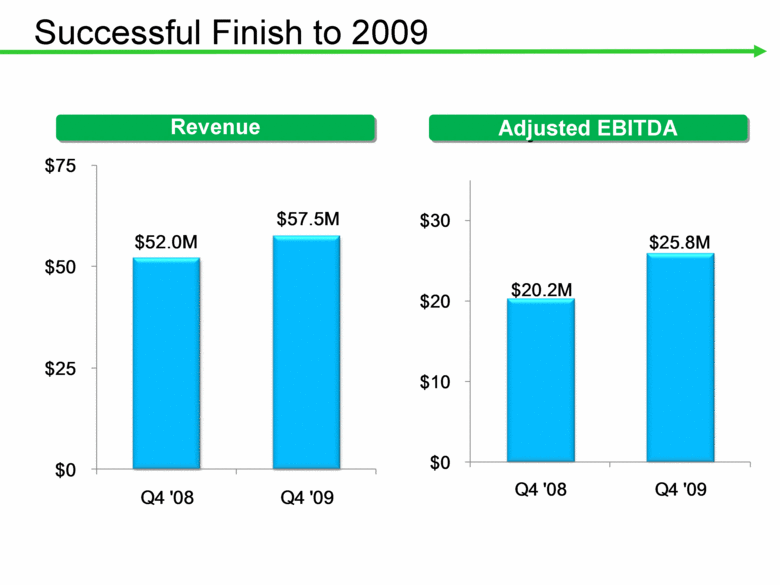
Successful Finish to 2009 ($ in thousands) $52.0M $57.5M $0 $25 $50 $75 Q4 '08 Q4 '09 28% Increase Revenue $20.2M $25.8M $0 $10 $20 $30 Q4 '08 Q4 '09 Adjusted EBITDA |
|
|
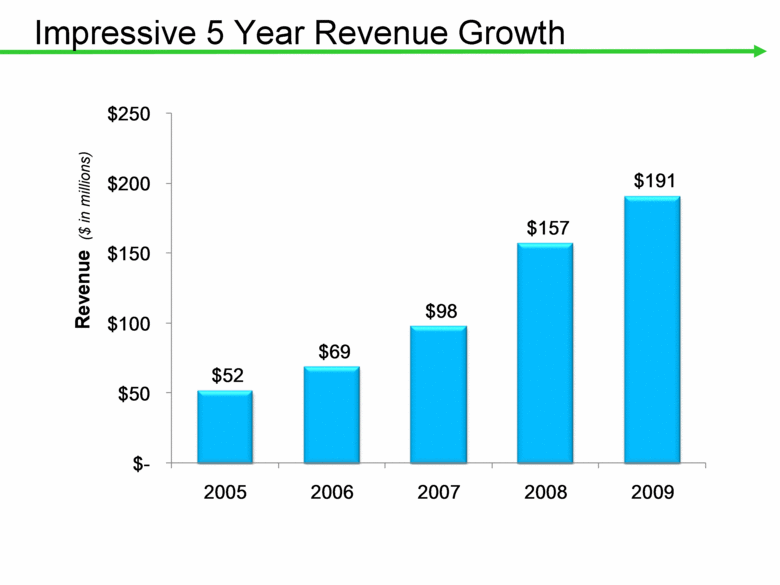
Impressive 5 Year Revenue Growth ($ in millions) $52 $69 $98 $157 $191 $- $50 $100 $150 $200 $250 2005 2006 2007 2008 2009 Revenue ($ in millions) |
|
|
August 2007 Diversification / Operational Synergies Over $40M of operating synergies realized October 2008 Vyvx Advertising Distribution Services August 2007 June 2007 May 2006 June 2008 April 2005 June 2004 gtn Advertising Distribution |
|
|
Consistent Margin Expansion ($ in millions) 13% 27% 33% 38% 41% 0% 10% 20% 30% 40% 2005 2006 2007 2008 2009 Adjusted EBITDA Margin |
|
|
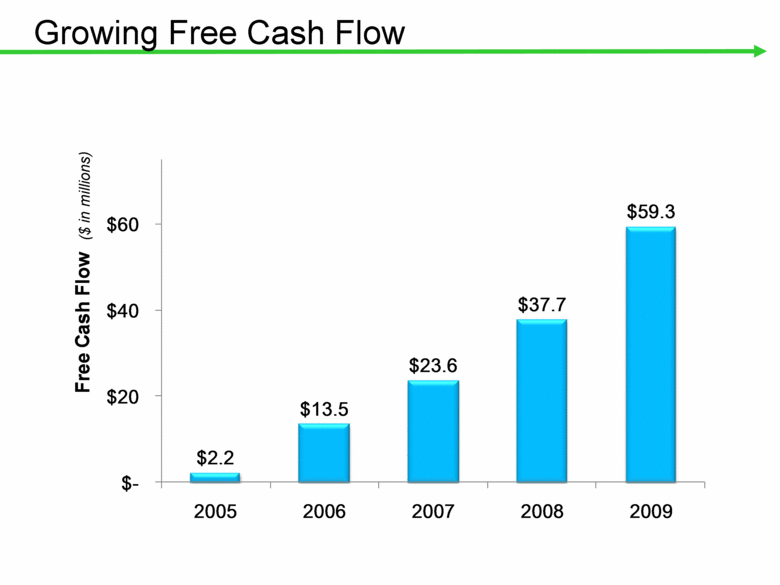
Growing Free Cash Flow ($ in millions) $2.2 $13.5 $23.6 $37.7 $59.3 $- $20 $40 $60 2005 2006 2007 2008 2009 Free Cash Flow ($ in millions) |
|
|
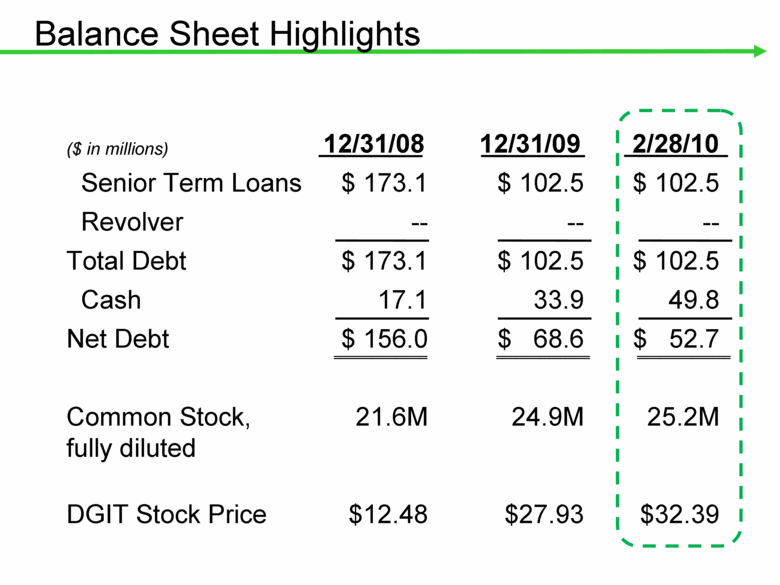
Balance Sheet Highlights ($ in millions) 12/31/08 12/31/09 2/28/10 Senior Term Loans $ 173.1 $ 102.5 $ 102.5 Revolver -- -- -- Total Debt $ 173.1 $ 102.5 $ 102.5 Cash 17.1 33.9 49.8 Net Debt $ 156.0 $ 68.6 $ 52.7 Common Stock, fully diluted 21.6M 24.9M 25.2M DGIT Stock Price $12.48 $27.93 $32.39 |
|
|
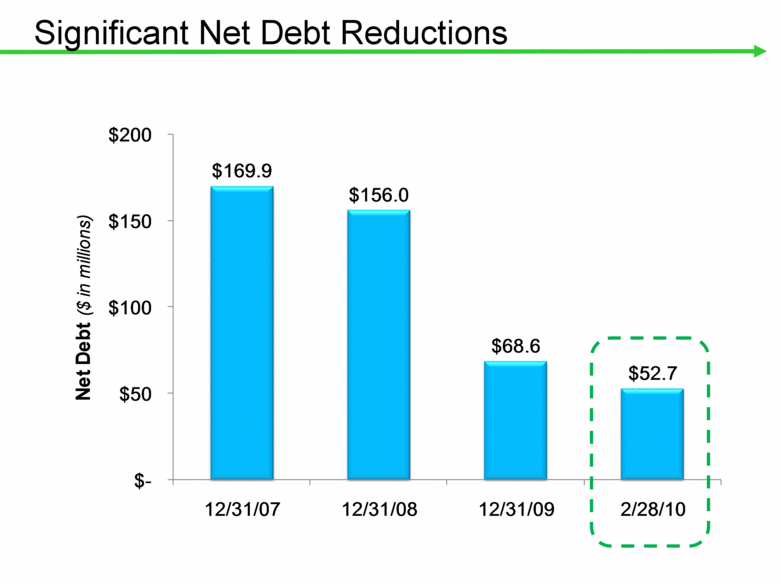
Significant Net Debt Reductions ($ in millions) ($ in millions) $169.9 $156.0 $68.6 $52.7 $- $50 $100 $150 $200 12/31/07 12/31/08 12/31/09 2/28/10 Net Debt ($ in millions) |
|
|
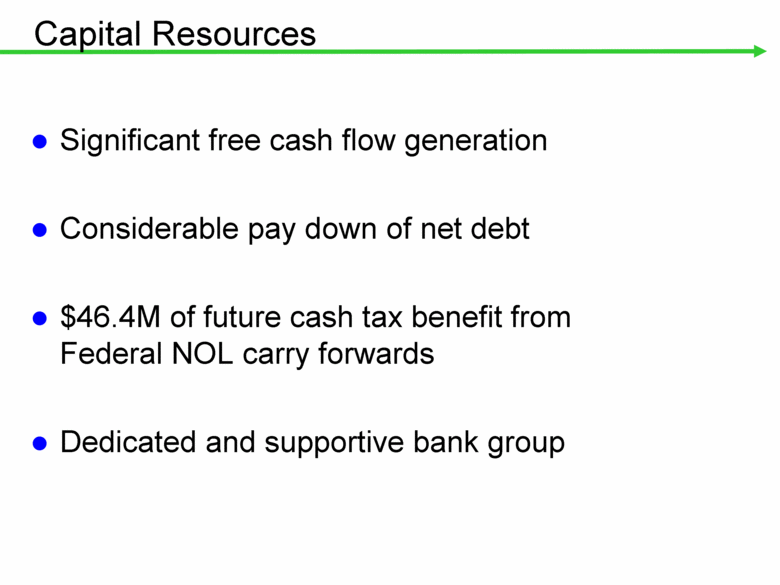
Capital Resources Significant free cash flow generation Considerable pay down of net debt $46.4M of future cash tax benefit from Federal NOL carry forwards Dedicated and supportive bank group |
|
|
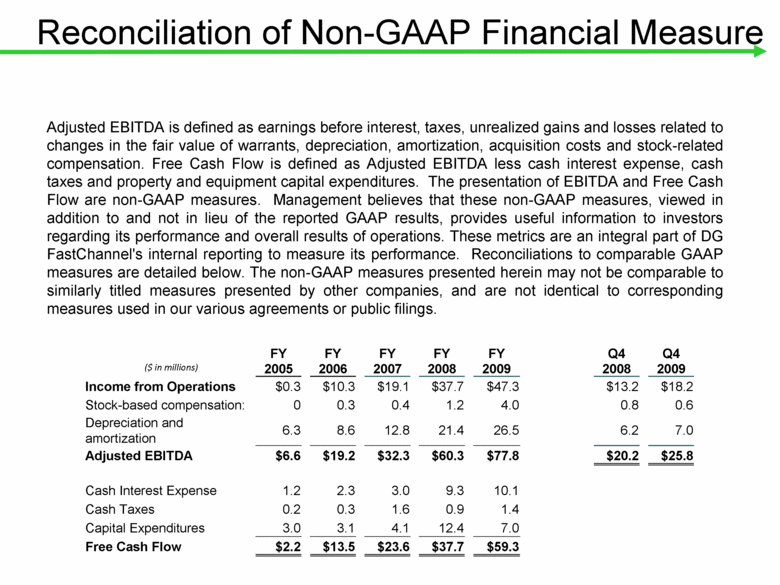
Reconciliation of Non-GAAP Financial Measure Adjusted EBITDA is defined as earnings before interest, taxes, unrealized gains and losses related to changes in the fair value of warrants, depreciation, amortization, acquisition costs and stock-related compensation. Free Cash Flow is defined as Adjusted EBITDA less cash interest expense, cash taxes and property and equipment capital expenditures. The presentation of EBITDA and Free Cash Flow are non-GAAP measures. Management believes that these non-GAAP measures, viewed in addition to and not in lieu of the reported GAAP results, provides useful information to investors regarding its performance and overall results of operations. These metrics are an integral part of DG FastChannel's internal reporting to measure its performance. Reconciliations to comparable GAAP measures are detailed below. The non-GAAP measures presented herein may not be comparable to similarly titled measures presented by other companies, and are not identical to corresponding measures used in our various agreements or public filings. ($ in millions) FY 2005 FY 2006 FY 2007 FY 2008 FY 2009 Q4 2008 Q4 2009 Income from Operations $0.3 $10.3 $19.1 $37.7 $47.3 $13.2 $18.2 Stock-based compensation: 0 0.3 0.4 1.2 4.0 0.8 0.6 Depreciation and amortization 6.3 8.6 12.8 21.4 26.5 6.2 7.0 Adjusted EBITDA $6.6 $19.2 $32.3 $60.3 $77.8 $20.2 $25.8 Cash Interest Expense 1.2 2.3 3.0 9.3 10.1 Cash Taxes 0.2 0.3 1.6 0.9 1.4 Capital Expenditures 3.0 3.1 4.1 12.4 7.0 Free Cash Flow $2.2 $13.5 $23.6 $37.7 $59.3 |
|
|
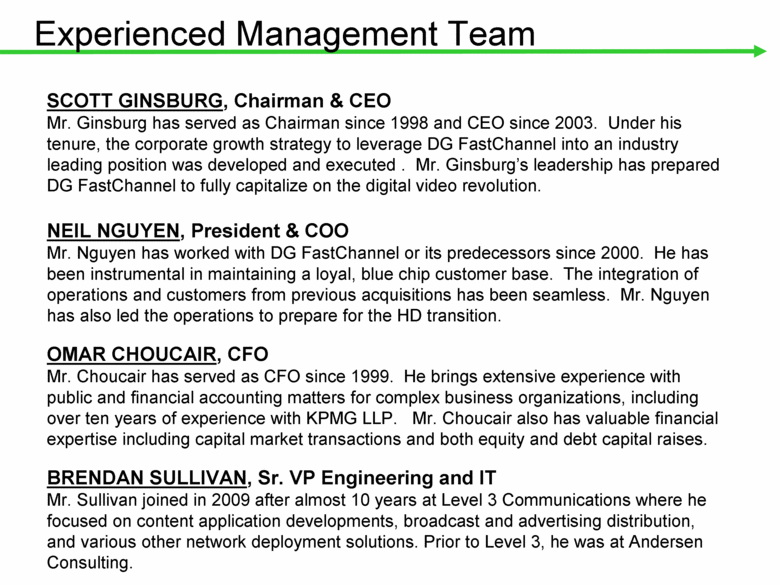
Experienced Management Team SCOTT GINSBURG, Chairman & CEO Mr. Ginsburg has served as Chairman since 1998 and CEO since 2003. Under his tenure, the corporate growth strategy to leverage DG FastChannel into an industry leading position was developed and executed . Mr. Ginsburg’s leadership has prepared DG FastChannel to fully capitalize on the digital video revolution. OMAR CHOUCAIR, CFO Mr. Choucair has served as CFO since 1999. He brings extensive experience with public and financial accounting matters for complex business organizations, including over ten years of experience with KPMG LLP. Mr. Choucair also has valuable financial expertise including capital market transactions and both equity and debt capital raises. NEIL NGUYEN, President & COO Mr. Nguyen has worked with DG FastChannel or its predecessors since 2000. He has been instrumental in maintaining a loyal, blue chip customer base. The integration of operations and customers from previous acquisitions has been seamless. Mr. Nguyen has also led the operations to prepare for the HD transition. BRENDAN SULLIVAN, Sr. VP Engineering and IT Mr. Sullivan joined in 2009 after almost 10 years at Level 3 Communications where he focused on content application developments, broadcast and advertising distribution, and various other network deployment solutions. Prior to Level 3, he was at Andersen Consulting. |
|
|
|

