Attached files
Table of Contents
UNITED STATES
SECURITIES AND EXCHANGE COMMISSION
WASHINGTON, D.C. 20549
FORM 10-K
| x | ANNUAL REPORT PURSUANT TO SECTION 13 OR 15(d) OF THE SECURITIES EXCHANGE ACT OF 1934 |
For The Fiscal Year Ended December 31, 2009
or
| ¨ | TRANSITION REPORT PURSUANT TO SECTION 13 OR 15(d) OF THE SECURITIES EXCHANGE ACT OF 1934 |
For the Transition Period from to
Commission file number-001-33388
CAI International, Inc.
(Exact name of registrant as specified in the charter)
| Delaware | 94-3109229 | |
| (State or other jurisdiction of incorporation or organization) |
(I.R.S. Employer Identification Number) | |
| One Embarcadero Center, Suite 2101 San Francisco, California |
94111 | |
| (Address of principal executive office) | (Zip Code) | |
(415) 788-0100
(Registrant’s telephone number including area code)
Securities registered pursuant to Section 12(b) of the Act:
| Title of each class | Name of exchange on which registered: | |
| Common Stock, par value $0.0001 per share | New York Stock Exchange |
Securities registered pursuant to Section 12(g) of the Act: None
Indicate by check mark if the registrant is a well-known seasoned issuer, as defined in Rule 405 of the Securities Act. Yes ¨ No x
Indicate by check mark if the registrant is not required to file reports pursuant to Section 13 or Section 15(d) of the Act. Yes ¨ No x
Indicate by check mark whether the registrant (1) has filed all reports required to be filed by Section 13 or 15(d) of the Securities Exchange Act of 1934 during the preceding 12 months (or for such shorter period that the registrant was required to file such reports), and (2) has been subject to such filing requirement for the past 90 days. Yes x No ¨
Indicate by check mark whether the registrant has submitted electronically and posted on its corporate Web site, if any, every Interactive Data File required to be submitted and posted pursuant to Rule 405 of Regulation S-T (§ 229.405 of this chapter) during the preceding 12 months (or for such shorter period that the registrant was required to submit and post such files). Yes ¨ No ¨
Indicate by check mark if disclosure of delinquent filers pursuant to Item 405 of Regulation S-K is not contained herein, and will not be contained, to the best of registrant’s knowledge, in definitive proxy or information statements incorporated by reference in Part III of this Form 10-K or any amendment to this Form 10-K. ¨
Indicate by check mark whether the registrant is a large accelerated filer, an accelerated filer, a non-accelerated filer, or a smaller reporting company. See definitions of “large accelerated filer,” “accelerated filer,” and “smaller reporting company” in Rule 12b-2 of the Exchange Act
| Large accelerated filer ¨ | Accelerated filer x | |
| Non-accelerated filer ¨ (Do not check if smaller reporting company) |
Smaller reporting company ¨ |
Indicate by check mark whether the registrant is a shell company (as defined in the Exchange Act Rule 12b-2). Yes ¨ No x
As of June 30, 2009, the last business day of the Registrant’s most recently completed second fiscal quarter, there were 17,917,417 shares of the Registrant’s common stock outstanding, and the aggregate market value of such shares held by non-affiliates of the Registrant (based upon the closing sale price of such shares on the New York Stock Exchange on June 30, 2009) was approximately $53,678,000. Shares of Registrant’s common stock held by each executive officer and director and by each entity or person that, to the Registrant’s knowledge, owned 5% or more of Registrant’s outstanding common stock as of June 30, 2009 have been excluded in that such persons may be deemed to be affiliates of the Registrant. This determination of affiliate status is not necessarily a conclusive determination for other purposes.
As of March 1, 2010, there were 17,917,176 shares of the Registrant’s common stock outstanding.
DOCUMENTS INCORPORATED BY REFERENCE
Portions of the registrant’s Proxy Statement relating to the registrant’s 2010 Annual Meeting of Stockholders are incorporated by reference into Part III hereof.
Table of Contents
2
Table of Contents
CAUTIONARY STATEMENT FOR PURPOSES OF THE “SAFE HARBOR” PROVISIONS OF THE PRIVATE SECURITIES LITIGATION REFORM ACT OF 1995
This Annual Report on Form 10-K contains certain forward-looking statements, including, without limitation, statements concerning the conditions in our industry, our operations, our economic performance and financial condition, including, in particular, statements relating to our business and growth strategy and service development efforts. The Private Securities Litigation Reform Act of 1995 provides a “safe harbor” for certain forward-looking statements so long as such information is identified as forward-looking and is accompanied by meaningful cautionary statements identifying important factors that could cause actual results to differ materially from those projected in the information. When used in this Annual Report on Form 10-K, the words “may”, “might”, “should”, “estimate”, “project”, “plan”, “anticipate”, “expect”, “intend”, “outlook”, “believe” and other similar expressions are intended to identify forward-looking statements and information. You are cautioned not to place undue reliance on these forward-looking statements, which speak only as of their dates. These forward-looking statements are based on estimates and assumptions by our management that, although we believe to be reasonable, are inherently uncertain and subject to a number of risks and uncertainties. These risks and uncertainties include, without limitation, those identified under the caption Item 1A. “Risk Factors” in this annual report and in all our filings filed with the Securities and Exchange Commission (“SEC”). We undertake no obligation to publicly update or revise any forward-looking statement as a result of new information, future events or otherwise, except as otherwise required by law. Reference is also made to such risks and uncertainties detailed from time to time in our filings with the SEC.
WEBSITE ACCESS TO COMPANY’S REPORTS AND CODE OF ETHICS
Our Internet website address is http://www.caiintl.com. Our annual reports on Form 10-K, quarterly reports on Form 10-Q, current reports on Form 8-K, and amendments to those reports filed or furnished pursuant to Section 13(a) or 15(d) of the Exchange Act are available free of charge through our website as soon as reasonably practicable after they are electronically filed with, or furnished to, the Securities and Exchange Commission. Our Code of Business Conduct and Ethics is also available on our website.
Also, copies of the Company’s annual report and Code of Business Conduct and Ethics will be made available, free of charge, upon written request.
SERVICE MARKS MATTERS
The following items referred to in this annual report are registered or unregistered service marks in the United States and/or foreign jurisdictions pursuant to applicable intellectual property laws and are the property of us and our subsidiaries: CAI® and CAI International.
3
Table of Contents
PART I
| ITEM 1. | BUSINESS |
Our Company
We are one of the world’s leading container leasing and management companies. We operate our business through two segments: container leasing and container management. We purchase new containers, lease them primarily to container shipping lines, freight forwarders and other transportation companies and either retain them as part of our owned fleet or sell them to container investors for whom we then provide management services. In operating our fleet, we lease, re-lease and dispose of containers and contract for the repair, repositioning and storage of containers. As of December 31, 2009, our fleet comprised 743,000 20-foot equivalent units or TEUs, the industry’s standard measurement unit, 68.4% of which represented our managed fleet and 31.6% of which represented our owned fleet.
We lease our containers to lessees under long-term leases, short-term leases and finance leases. Long-term leases cover a specified number of containers that will be on lease for a fixed period of time. Short-term leases provide lessees with the ability to lease containers either for a fixed term of less than one year or without a fixed term on an as-needed basis, with flexible pick-up and drop-off of containers at depots worldwide. Finance leases are long-term lease contracts that grant the lessee the right to purchase the container at the end of the term for a nominal amount. As of December 31, 2009, 82.3% of our fleet, as measured in TEUs, was on lease, with 75.7% of these containers on long-term leases, 21.5% on short-term leases and 2.8% on finance leases.
We manage containers under management agreements that cover portfolios of containers. Our management agreements typically have terms of 10 years and provide that we receive a management fee based upon the actual rental revenue for each container less the actual operating expenses directly attributable to that container. We also receive fees for selling used containers on behalf of container investors.
Our container leasing segment revenue comprises container rental revenue and finance lease income from our owned fleet, and our container management segment revenue comprises gain on sale of container portfolios and management fee revenue for managing containers for container investors. The operating results of each segment and details of our revenues for the years ended December 31, 2009, 2008 and 2007, and information regarding the geographic areas in which we do business are summarized in Note 17 to our consolidated financial statements included in this filing. For the year ended December 31, 2009, we recorded total revenue of $65.3 million, net income of $13.6 million and adjusted EBITDA of $46.3 million. A comparison of our 2009 financial results with those of the prior years and a definition of adjusted EBITDA can be found on Item 6, Selected Financial Data of this Form 10-K filing.
The Company’s container lessees use containers for their global trade utilizing many worldwide trade routes. The Company earns its revenue from international carriers when the containers are in use and carrying cargo around the world. Most of the Company’s leasing related revenue is denominated in U.S. dollars. All of the Company’s containers are used internationally and no one container is domiciled in one particular place for a prolonged period of time. As such, all of the Company’s long-lived assets are considered to be international with no single country of use.
History
We were founded in 1989 by our Chairman, Hiromitsu Ogawa, as a traditional container leasing company that leased containers owned by us to container shipping lines. We were originally incorporated under the name Container Applications International, Inc. in the state of Nevada on August 3, 1989. On February 2, 2007, we were reincorporated under our present name in the state of Delaware.
On May 16, 2007, we completed an initial public offering (“IPO”) of our common stock and listed our common stock on the New York Stock exchange under the symbol “CAP”. On April 30, 2008, the Company acquired CAI Consent Sweden AB (Consent), formerly named Consent Equipment AB, a European container
4
Table of Contents
and intermodal equipment leasing company, for $14.6 million in cash (net of $1.3 million cash acquired) and the assumption of approximately $25.7 million in debt. Consent was originally headquartered in Gothenburg, Sweden at the time of its acquisition. In February 2010, Consent’s headquarters were transferred to the United Kingdom. Consent also has offices in Delmenhorst, Germany, which will remain open.
Corporate Information
Our corporate headquarters and principal executive offices are located at One Embarcadero Center, Suite 2101, San Francisco, California 94111. Our telephone number is (415) 788-0100 and our Web Site is located at http://www.caiintl.com. Our U.S. branch office is located in Charleston, South Carolina. We operate our business in 13 offices in 11 countries including the United States, and have agents in Asia, Europe, South Africa, Australia and South America. Our wholly owned international subsidiaries are located in the United Kingdom, Japan, Malaysia, Sweden and Barbados. We also own 80% of CAIJ Ltd. in Japan.
Industry Overview
We operate in the worldwide intermodal freight container leasing industry. Intermodal freight containers, or containers, are large, standardized steel boxes used to transport cargo by a number of means, including ship, truck and rail. Container shipping lines use containers as the primary means for packaging and transporting freight internationally, principally from export-oriented economies in Asia to North America and Western Europe.
Containers are built in accordance with standard dimensions and weight specifications established by the International Standards Organization (ISO). The industry-standard measurement unit is the 20-foot equivalent unit, or TEU, which compares the size of a container to a standard container 20’ in length. For example, a 20’ container is equivalent to one TEU and a 40’ container is equivalent to two TEUs. The standard dry van containers are eight feet wide, come in lengths of 20’or 40’ and are either 8’6” or 9’6” tall. The two principal types of containers are described as follows:
| • | Dry van containers. A dry van container is constructed of steel sides, roof and end panel with a set of doors on the other end, a wooden floor and a steel undercarriage. Dry van containers are the least expensive and most commonly used type of container. According to Containerisation International, World Container Census 2009, dry van containers comprised approximately 89.6% of the worldwide container fleet, as measured in TEUs, as of mid-2008. They are used to carry general cargo, such as manufactured component parts, consumer staples, electronics and apparel. |
| • | Specialized equipment. Specialized equipment consist of open-top, flat-racks, palletwide containers, swapbodies, roll trailers, refrigerated containers and tank containers. An open-top container is similar in construction to a dry van container except that the roof is replaced with a tarpaulin supported by removable roof bows. A flat-rack container is a heavily reinforced steel platform with a wood deck and steel end panels. Open-top and flat-rack containers are generally used to move heavy or oversized cargo, such as marble slabs, building products or machinery. Palletwide containers are a type of dry-van container externally similar to ISO standard containers, but internally about two inches wider so as to accommodate two European-sized pallets side-by-side. Swapbodies are a type of dry van container designed to be easily transferred between rail, truck, and barge and are equipped with legs under their frames. Roll trailers are a type of flat-bed trailer equipped with rubber wheels underneath for terminal haulage and stowage on board of roll-on/roll-off vessels. A refrigerated container has an integral refrigeration unit on one end which plugs into an outside power source and is used to transport perishable goods. Tank containers are used to transport bulk products such as chemicals, oils, and other liquids. According to Containerisation International, World Container Census 2009, specialized containers comprised approximately 10.4% of the worldwide container fleet, as measured in TEUs, as of mid-2008. |
5
Table of Contents
Containers provide a secure and cost-effective method of transportation because they can be used in multiple modes of transportation, making it possible to move cargo from a point of origin to a final destination without repeated unpacking and repacking. As a result, containers reduce transit time and freight and labor costs as they permit faster loading and unloading of shipping vessels and more efficient utilization of transportation containers than traditional bulk shipping methods. The protection provided by containers also reduces damage, loss and theft of cargo during shipment. While the useful economic life of containers varies based upon the damage and normal wear and tear suffered by the container, we estimate that the useful economic life for a dry van container used in intermodal transportation is 12.5 years.
Container shipping lines own and lease containers for their use. Containerisation International, Market Analysis: World Container Census 2009, estimates that as of mid-2008, transportation companies (including container shipping lines and freight forwarders), owned approximately 61.0% of the total worldwide container fleet and container leasing companies owned approximately 39.0% of the total worldwide container fleet. Given the uncertainty and variability of export volumes and the fact that container shipping lines have difficulty in accurately forecasting their container requirements at different ports, the availability of containers for lease significantly reduces a container shipping line’s need to purchase and maintain excess container inventory. In addition, container leases allow the container shipping lines to adjust their container fleets both seasonally and over time and help to balance trade flows. The flexibility offered by container leasing helps container shipping lines improve their overall fleet management and provides the container shipping lines with an alternative source of financing.
Our Strengths
We believe our strengths include the following:
| • | Multiple Sources of Revenue. Our business is structured to generate a diversified stream of revenue from multiple sources. We actively manage a mix of owned and managed containers in our fleet to provide us with diversified revenues over long periods of time. We supplement container rental revenue and management fee revenue with gains on sale of container portfolios that generate significant incremental revenue and facilitate the growth in management fee revenue as we convert containers owned by us to containers managed by us for our container investors. We are also able to diversify our revenue base by managing the mix of containers under long-term, short-term and finance leases. Maintaining a range of lease types and duration allows us to provide services customized to our clients’ needs. By having multiple sources of revenue, we believe that we have been able to realize a higher return on assets and equity than would have been possible if our fleet had consisted entirely of containers owned by us. We believe it is important to maintain a balance between the size of our owned fleet and our managed fleet to maintain our multiple sources of revenue. |
| • | High-Quality Asset Management Services. We sell portfolios of leased containers to a number of container investors in Europe and Asia through various intermediaries. Following the sale, we manage these portfolios on behalf of the container investors. We believe that container investors view us as one of the highest quality companies providing container management services due to the quality of the container portfolios that we sell and the asset management services that we provide. |
| • | Growth in International Trade. Our global reach positions us to participate in long-term global growth trends in international trade. With agreements with multiple container depots in more than 42 countries, we are positioned to serve our global customer base in the developing economies in Asia, Europe and South America. |
| • | Capital-efficient Third-party Fleet Management Operation. Our container management segment provides us with revenue at the time of sale, long-term contractual management fees and a sales fee earned when we sell used containers for container investors, all with very little long-term investment from us. We have grown our managed fleet by selling portfolios of containers to container investors, most of which are subject to lease at the time of sale. By selling these portfolios to container investors, |
6
Table of Contents
| we are able to free up capital more quickly than if we kept the containers as part of our owned fleet. This enables us to deploy the capital for other uses, such as additional container purchases and repayment of debt. |
| • | Long-standing Container Lessee Relationships with Attractive Credit Characteristics. We currently lease containers to over 260 container lessees, including many of the largest international container shipping lines. As of December 31, 2009, we had conducted business with the top 20 lessees of our total fleet, as measured in TEUs, for an average of over 13 years. These top 20 lessees had, as of December 31, 2009, a weighted-average Dynamar credit rating of 3.6 on a rating scale of one through ten, with a one representing the strongest credit rating. Dynamar B.V. provides credit ratings to the container leasing industry. |
| • | Experienced Management Team. We have significant experience in the container leasing industry. Our four key officers have an average of approximately 23 years of experience in the container leasing industry. In addition, our marketing, operations and underwriting personnel have developed long-term relationships with lessees that improve our access to continued opportunities with leading container shipping lines. |
| • | Flexibility to Satisfy Changing Market Demands. Our operating expertise and financial flexibility enable us to meet the evolving requirements of lessees and container investors. We have significant experience in structuring and selling to container investors portfolios of containers that have attractive investment returns. By selling these portfolios to container investors, we have been able to purchase a substantial number of new containers while at the same time maintaining significant borrowing capacity under our senior secured credit facility. This has enabled us to choose when to purchase new containers based upon our expectations of near-term market conditions and quickly respond to the changing demands of lessees for short- and long-term leases. |
| • | Proprietary, Real-time Information Technology System. We have developed a proprietary, real-time information technology (IT) system to assist us in managing our container fleet. Our information technology system allows us to monitor lease status, repair billings and contract terms of every individual container in our fleet. By actively maintaining and reviewing this information, we are able to more efficiently manage the logistics and billings of our business. Our proprietary IT system has been essential to providing a high level of customer service and we believe it is scalable to satisfy our future growth without significant capital expenditures. |
Risks Affecting Us
In operating our business we have faced and will continue to face significant challenges. Our ability to successfully operate our business is subject to numerous risks as discussed more fully in Item 1A entitled “Risk Factors.” For example:
| • | demand for leased containers and per diem rates could decline if the current global recession persists for an extended period of time and other macroeconomic market conditions affecting the container leasing industry worsen; |
| • | demand from container investors to purchase portfolios of leased containers at prices that are attractive to us could decline; |
| • | container shipping lines could decide to buy rather than lease a larger percentage of the containers they use; |
| • | demand for leased containers by container shipping lines could decrease due to consolidation of container shipping lines or other factors; |
| • | new container prices could increase or decrease unexpectedly; |
| • | shipping could be disrupted by a number of causes, including terrorist attacks and regional economic instability; |
7
Table of Contents
| • | we could lose key members of our senior management; |
| • | our lessees could default on their lease payment obligations to us; and |
| • | we face extensive competition in the container leasing industry. |
Any of the above risks could cause our revenue to decline or could otherwise materially and adversely affect our business, financial position and results of operations.
Our Operations
Container Fleet Overview. The table below summarizes the composition of our fleet as of December 31, 2009 by the type of container:
| Dry Van Containers |
Percent of Total Fleet |
Specialized Equipment |
Percent of Total Fleet |
Total | Percent of Total Fleet |
||||||||||
| Managed Fleet in TEU |
494,853 | 66.6 | % | 12,828 | 1.7 | % | 507,681 | 68.4 | % | ||||||
| Owned fleet in TEU |
219,492 | 29.6 | % | 15,590 | 2.1 | % | 235,082 | 31.6 | % | ||||||
| Total |
714,345 | 96.2 | % | 28,418 | 3.8 | % | 742,763 | 100.0 | % | ||||||
Overview of Management Services. We lease, re-lease and dispose of containers and contract for the repair, repositioning and storage of our managed fleet. Our management agreements typically provide that our fee for managing a particular container is based upon the actual net operating revenue for each container, which is equal to the actual rental revenue for a container less the actual operating expenses directly attributable to that container. Management fees are collected monthly or quarterly, depending upon the agreement, and generally are not paid if net operating revenue is zero or less for a particular period. If operating expenses exceed revenue, the container investors are required to pay the excess or we may deduct the excess, including our management fee, from future net operating revenue. Under these agreements, we typically receive a commission for selling or otherwise disposing of containers for the container investor. Our management agreements generally require us to indemnify the container investor for liabilities or losses arising out of our breach of our obligations. In return, the container investor typically indemnifies us in our capacity as the manager of the container against breach by the container investor, sales taxes on commencement of the arrangement, withholding taxes on payments to the container investor under the management agreement and any other taxes, other than our income taxes, incurred with respect to the containers that are not otherwise included as operating expenses deductible from revenue. The term of our management agreements is generally 10 years from the acceptance date of containers under the agreement.
Marketing and Operations. Our marketing and operations personnel are responsible for developing and maintaining relationships with our lessees, facilitating lease contracts and maintaining day-to-day coordination of operational issues. This coordination allows us to negotiate lease contracts that satisfy both our financial return requirements and our lessees’ operating needs. It also facilitates our awareness of lessees’ potential container shortages and their awareness of our available container inventories.
We believe that our long-standing relationships with our lessees and the close communications we maintain with their operating staffs represent an important advantage for us. As of December 31, 2009, we employed 56 people within our marketing and operations group in eight countries. In addition, we have 12 independent agents in 12 other countries that help support our marketing and operations group.
Overview of Our Leases. To meet the needs of our lessees and achieve a favorable utilization rate, we lease containers under three main types of leases:
| • | Long-Term Leases. Our long-term leases specify the number of containers to be leased, the pick-up and drop-off locations, the applicable per diem rate and the contractual term. We typically enter into long- |
8
Table of Contents
| term leases for a fixed term ranging from three to eight years, with five-year term leases being most common. Our long-term leases generally require our lessees to maintain all units on lease for the duration of the lease, which provides us with scheduled lease payments. Some of our long-term leases contain an early termination option and afford the lessee continuing supply and total interchangeability of containers, with the ability to redeliver containers if the lessee’s fleet requirements change. Our leases typically require the lessees to pay additional amounts pursuant to retroactive rate adjustments. These rate adjustments have not been material to our results of operations. As of December 31, 2009, approximately 75.7% of our on-lease fleet, as measured in TEUs, was under long-term leases. |
| • | Short-Term Leases. Short-term leases include both master interchange leases and customized short-term leases. Master interchange leases provide a master framework pursuant to which lessees can lease containers on an as-needed basis, and thus command a higher per diem rate than long-term leases and more flexible terms. The terms of master interchange leases are typically negotiated on an annual basis. Under our master interchange leases, lessees know in advance their per diem rates and drop-off locations, subject to monthly port limits. We also enter into other short-term leases that typically have a term of less than one year and are generally used for one-way leasing, typically for small quantities of containers. The terms of short-term leases are customized for the specific requirements of the lessee. Short-term leases are sometimes used to reposition containers to high-demand locations and accordingly may contain terms that provide incentives to lessees. As of December 31, 2009, approximately 21.5% of our on-lease fleet, as measured in TEUs, was under short-term leases. |
| • | Finance Leases. Finance leases provide our lessees with an alternative method to finance their container acquisitions. Finance leases are long-term in nature, typically ranging from three to five years, and require relatively little customer service attention. They ordinarily require fixed payments over a defined period and provide lessees with a right to purchase the subject containers for a nominal amount at the end of the lease term. Per diem rates under finance leases include an element of repayment of capital and, therefore, typically are higher than per diem rates charged under long-term leases. Finance leases require the container lessee to keep the containers on lease for the entire term of the lease. As of December 31, 2009, approximately 2.8% of our on-lease fleet, as measured in TEUs, was under finance leases. |
Our lease agreements contain business terms, such as the per diem rate, term and drop-off schedule, and the general terms and conditions detailing standard rights and obligations. The lease agreement requires lessees to pay the contractual per diem rate, depot charges, taxes and other charges when due, to maintain the containers in good condition and repair, to return the containers in good condition in accordance with the return condition set forth in the lease agreement, to use the containers in compliance with all applicable laws, and to pay us for the value of the container as determined by the lease agreement if the container is lost or destroyed. The default clause in our lease agreement gives us certain legal remedies in the event that a container lessee is in breach of the terms underlying the lease agreement.
Our lease agreements contain an exclusion of warranties clause and require lessees to defend and indemnify us in most instances from third-party claims arising out of the lessee’s use, operation, possession or lease of the containers. Lessees are required to maintain physical damage and comprehensive general liability insurance and to indemnify us against loss with respect to the containers. We also maintain our own contingent physical damage and third-party liability insurance that covers our containers during both on-lease and off-lease periods. All of our insurance coverage is subject to annual deductible provisions and per occurrence and aggregate limits.
Underwriting. We lease to container shipping lines, freight forwarders and other transportation companies that meet our credit criteria. Depending on credit limits, our underwriting and credit decisions are controlled by our senior executives or our credit committee. Our credit committee includes our chief executive officer, chief financial officer, and two other members of our senior management. Our credit policy sets different maximum exposure limits depending on our relationship and previous experience with each container lessee. Credit criteria may include, but are not limited to, trade route, country, social and political climate, assessments of net worth,
9
Table of Contents
asset ownership, bank and trade credit references, credit bureau reports, including those from Dynamar, operational history and financial strength. Our credit committee monitors our lessees’ performance and our lease exposures on an ongoing basis and generally reviews all accounts with receivables over 90 days past due. Our underwriting processes are aided by the long payment experience we have with most of our lessees, our broad network of relationships in the shipping industry that provide current information about our lessees’ market reputations and our focus on collections.
Other factors minimizing losses due to default by a lessee include our ability to achieve a high recovery rate for containers in default situations and our ability to efficiently re-lease recovered containers. Many of our lessees call on ports that allow us to seize the lessees’ ships or their fuel stocked at depots, or repossess our containers if the container lessee is in default under our container leases. We typically incur operating expenses such as repairs and repositioning when containers are recovered after a container lessee default.
Re-leasing, Logistics Management and Depot Management. We believe that managing the period after termination of our containers’ first lease is one of the most important aspects of our business. Successful management of this period requires disciplined re-leasing capabilities, logistics management and depot management.
| • | Re-leasing. Since our leases allow our lessees to return their containers, we typically lease a container several times during the time we manage it as part of our fleet. New containers can usually be leased with a limited sales and customer service infrastructure because initial leases for new containers typically cover large volumes of units and are fairly standardized transactions. Used containers, on the other hand, are typically leased in smaller transactions that are structured to accommodate pick-ups and returns in a variety of locations. Our utilization rates depend on our re-leasing abilities. Factors that affect our ability to re-lease used containers include the size of our lessee base, ability to anticipate lessee needs, our presence in relevant geographic locations and the level of service we provide our lessees. We believe that our global presence and long-standing relationships with over 260 container lessees as of December 31, 2009 provide us an advantage in re-leasing our containers relative to many of our smaller competitors. |
| • | Logistics Management. The shipping industry is characterized by large regional trade imbalances, with loaded containers generally flowing from export-oriented economies in Asia to North America and Western Europe. Because of these trade imbalances, container shipping lines have an incentive to return leased containers in relatively low export areas to avoid the cost of shipping empty containers. We have managed this structural imbalance of inventories with the following approach: |
| • | Limiting or prohibiting container returns to low-demand areas. In order to minimize our repositioning costs, our leases typically include a list of the specific locations to which containers may be returned, limitations on the number of containers that may be returned to low-demand locations, high drop-off charges for returning containers to low-demand locations or a combination of these provisions; |
| • | Taking advantage of the secondary resale market. In order to maintain a younger fleet age profile, we have aggressively sold our older containers when they are returned to low demand areas. |
| • | Developing country-specific leasing markets to utilize older containers in the portable storage market. In North America and Western Europe, we lease on a limited basis older containers for use as portable storage. |
| • | Seeking one-way lease opportunities to move containers from lower demand locations to higher demand locations. One-way leases may include incentives, such as free days, credits and damage waivers. The cost of offering these incentives is considerably less than the cost we would incur if we paid to reposition the containers. |
| • | Paying to reposition our containers to higher demand locations. At locations where our inventories remain high, despite the efforts described above, we will selectively choose to ship excess containers to locations with higher demand. |
10
Table of Contents
| • | Depot Management. As of December 31, 2009, we managed our container fleet through 248 independent container depot facilities located in 42 countries. Depot facilities are generally responsible for repairing containers when they are returned by lessees and for storing the containers while they are off-hire. Our operations group is responsible for managing our depot contracts and periodically visiting the depot facilities to conduct inventory and repair audits. We also supplement our internal operations group with the use of independent inspection agents. As of December 31, 2009 a large majority of our off-lease inventory was located at depots that are able to report notice of container activity and damage detail via electronic data interchange, or EDI. We use the industry standard, ISO 9897 Container Equipment Data Exchange messages, for EDI reporting. |
Most of the depot agency agreements follow a standard form and generally provide that the depot will be liable for loss or damage of containers and, in the event of loss or damage, will pay us the previously agreed loss value of the applicable containers. The agreements require the depots to maintain insurance against container loss or damage and we carry insurance to cover the risk when a depot’s insurance proves insufficient.
Our container repair standards and processes are generally managed in accordance with standards and procedures specified by the Institute of International Container Lessors, or the IICL. The IICL establishes and documents the acceptable interchange condition for containers and the repair procedures required to return damaged containers to the acceptable interchange condition. At the time that containers are returned by lessees, the depot arranges an inspection of the containers to assess the repairs required to return the containers to acceptable IICL condition. As part of the inspection process, damages are categorized either as lessee damage or normal wear and tear. Items typically designated as lessee damage include dents in the container and debris left in the container, while items such as rust are typically designated as normal wear and tear. In general, lessees are responsible for the lessee damage portion of the repair costs and we are responsible for normal wear and tear. For an additional fee, we sometimes offer our lessees a container damage protection plan, pursuant to which we assume financial responsibility for repair costs up to a pre-negotiated amount.
Investors. We have historically sold portfolios of leased containers to investment entities located in Germany, Switzerland, Austria and Japan. Although we have sold several portfolios containing large numbers of containers to an investment company in Switzerland, the investment entities that typically have purchased containers from us are funds with many underlying investors. In Germany, these funds are frequently referred to as “KG Funds” although similar types of funds exist in other countries. These funds are formed by investment arrangers who act as financial intermediaries between lessors of containers and other shipping assets. We are contacted on a regular basis by independent investment arrangers who are interested in assisting us with arranging sales of container portfolios. These independent investment arrangers will either seek out investments in these leased assets on behalf of an investment fund or a group of investors or will work with us to identify an investor or group of investors to invest in a pool of these leased assets. Our 80% owned subsidiary, CAIJ Ltd., acts as investment arranger for sales of containers by us in Japan and manages container leases for investors in Japan.
Customer Concentration. Our customers include container lessees and container investors to whom we have sold container portfolios and for whom we manage containers.
| • | Container Leasing Segment Concentration. Revenue from our ten largest container lessees represented 45.5% of the revenue from our container leasing segment for the year ended December 31, 2009, with revenue from our single largest container lessee accounting for 7.3%, or $4.1 million, of revenue from our container leasing segment during such period. This $4.1 million of revenue represented 6.3% of our total revenue for this period. The largest lessees of our owned fleet are often among the largest lessees of our managed fleet. The largest lessees of our managed fleet are responsible for a significant portion of the billings that generate our management fee revenue. |
11
Table of Contents
| • | Container Management Segment Concentration. A substantial majority of our container management segment revenue is derived from container investors associated with five different investment arrangers located in Germany, Switzerland, Austria and Japan. These arrangers are typically in the business of identifying and organizing investors for a variety of investment vehicles and compete with other institutions in these and other countries that perform similar functions. Container investors associated with five investment arrangers represented 89.3% of the Company’s container management revenue for the years ended December 31, 2009. Revenue from the two largest container investors, IGB Container GmbH & Co. KG (IGB) and P&R Equipment and Finance Corp. (P&R), represented 31.9%, or $3.0 million, and 21.4% or $2.0 million, respectively, of revenue from the Company’s container management segment during the year ended December 31, 2009. The combined revenue of $5.0 million associated with the two largest investment arrangers represented 7.6% of total revenue for the year ended December 31, 2009. The willingness of investment arrangers to continue to form entities that invest in containers will depend upon a number of factors outside of our control, including the laws in the countries in which they are domiciled, the tax treatment of an investment or restrictions on foreign investments. If changes in tax laws in any country or other conditions make investments in containers less attractive, we will need to identify new container investors in other jurisdictions. If we are unable to identify new investors to offset decreases in demand, our gain on sale of container portfolios will decrease almost immediately, and management fee revenues will decrease if existing management agreements that terminate are not replaced by new management agreements. |
Proprietary Real-time Information Technology System. Our proprietary real-time information technology system tracks all of our containers individually by container number, provides design specifications for the containers, tracks on-lease and off-lease transactions, matches each on-lease container to a lease contract and each off-lease container to a depot contract, maintains the major terms for each lease contract, tracks accumulated depreciation, calculates the monthly bill for each container lessee and tracks and bills for container repairs. Most of our depot activity is reported electronically, which enables us to prepare container lessee bills and calculate financial reporting information more efficiently.
In addition, our system allows our lessees to conduct business with us through the Internet. This allows our lessees to review our container inventories, monitor their on-lease information, view design specifications and receive information on maintenance and repair. Many of our lessees receive billing and on- and off- lease information from us electronically.
Our Suppliers. We purchase most of our containers in China from manufacturers that have met our qualification requirements. We are currently not dependent on any single current manufacturer. We have long-standing relationships with all of our major container suppliers. Our technical services personnel review the designs for our containers and periodically audit the production facilities of our suppliers. In addition, we contract with independent third-party inspectors to monitor production at factories while our containers are being produced. This provides an extra layer of quality control and helps ensure that our containers are produced in accordance with our specifications.
Our Competition
We compete primarily with other container leasing companies, including both larger and smaller lessors. We also compete with bank leasing companies offering long-term operating leases, finance leases and container shipping lines, which sometimes lease their excess container inventory. Other participants in the shipping industry, such as container manufacturers, may also decide to enter the container leasing business. It is common for container shipping lines to utilize several leasing companies to meet their container needs and to minimize reliance on individual leasing companies.
Our competitors compete with us in many ways, including pricing, lease flexibility, supply reliability, customer service and the quality and condition of containers. Some of our competitors have greater financial resources than we do, or are affiliates of larger companies. We emphasize the quality of our fleet, supply
12
Table of Contents
reliability and high level of customer service to our container lessees. We focus on ensuring adequate container availability in high-demand locations, dedicate large portions of our organization to building relationships with lessees, maintain close day-to-day coordination with lessees and have developed a proprietary information technology system that allows our lessees to access real-time information about their containers.
Environmental Matters
We are subject to federal, state, local and foreign laws and regulations relating to the protection of the environment, including those governing the discharge of pollutants to air and water, the management and disposal of hazardous substances and wastes and the cleanup of contaminated sites. We could incur substantial costs, including cleanup costs, fines and third-party claims for property or natural resource damage and personal injury, as a result of violations of or liabilities under environmental laws and regulations in connection with our or our lessees’ current or historical operations. Under some environmental laws in the United States and certain other countries, the owner or operator of a container may be liable for environmental damage, cleanup or other costs in the event of a spill or discharge of material from the container without regard to the fault of the owner or operator. While we typically maintain liability insurance coverage and typically require our lessees to provide us with indemnity against certain losses, the insurance coverage is subject to large deductibles, limits on maximum coverage and significant exclusions and may not be sufficient or available to protect against any or all liabilities and such indemnities may not cover or be sufficient to protect us against losses arising from environmental damage.
Regulation
We may be subject to regulations promulgated in various countries, including the United States, seeking to protect the integrity of international commerce and prevent the use of containers for international terrorism or other illicit activities. For example, the Container Security Initiative, the Customs-Trade Partnership Against Terrorism and Operation Safe Commerce are among the programs administered by the U.S. Department of Homeland Security that are designed to enhance security for cargo moving throughout the international transportation system by identifying existing vulnerabilities in the supply chain and developing improved methods for ensuring the security of containerized cargo entering and leaving the United States. Moreover, the International Convention for Safe Containers, 1972, as amended, adopted by the International Maritime Organization, applies to new and existing containers and seeks to maintain a high level of safety of human life in the transport and handling of containers by providing uniform international safety regulations. As these regulations develop and change, we may incur increased compliance costs due to the acquisition of new, compliant containers and/or the adaptation of existing containers to meet any new requirements imposed by such regulations.
Employees
As of December 31, 2009, we employed approximately 83 employees worldwide. We are not a party to any collective bargaining agreements. We believe that relations with our employees are good.
13
Table of Contents
| ITEM 1A. | RISK FACTORS |
Risks Related to Our Business and the Container Leasing Industry
Current economic conditions may adversely affect our industry, business and results of operations.
The United States and foreign economies are in various stages of recovery from the 2009 economic recession. The capital markets are currently experiencing a high level of volatility and liquidity has become constrained across the debt and equity markets. In addition, recent disruptions in national and international credit markets have led to a scarcity of credit, tighter lending standards and higher interest rates on business loans.
We increased our allowance for doubtful accounts in 2009 to recognize the increased credit risk brought about by the current economic environment. A prolonged economic downturn or a continuing scarcity of credit could further adversely affect the financial condition and levels of business activity of our customers. This may in turn have a corresponding negative impact on our future operating results as some of our customers may suffer business failures that may cause us to further incur higher bad debt expense in the future while others may react to worsening conditions by reducing their level of investment in container portfolios or reducing their leasing of containers from us. In addition, worsening economic conditions may impair our ability to attract new customers. Our average fleet utilization rate has declined from 94.2% during the third quarter of 2008 to 81.9% during the fourth quarter of 2009. If any of these economic circumstances remain in effect for an extended period of time, there could be a material adverse effect on our future financial results.
The demand for leased containers depends on many political, economic and other factors beyond our control.
Substantially all of our revenue comes from activities related to the leasing of containers. Our ability to continue successfully leasing containers to container shipping lines, earning management fees on leased containers and attracting container investors to purchase container portfolios from us depends in part upon the continued demand for leased containers. The demand for containers is affected by numerous factors.
Demand for containers depends largely on the rate of world trade and economic growth, with consumer demand being one of the most critical factors affecting this growth. Current economic downturns in one or more countries, particularly in the United States and other countries with consumer-oriented economies, have resulted in a reduction in world containerized trade growth or in demand by container shipping lines for leased containers. Most of the container investor programs into which we sell container portfolios employ a certain amount of debt in order to increase investor equity returns. The uncertainty on future demand for containers from container shipping lines, the potential of lower than expected performance of existing investments in container funds and the more difficulty in container investors being able to access debt for future investment programs, increases the potential that we may not be able to sell containers to investor programs in the future. In such case, our revenue, net income and cash flow will be lower, which will limit the level of growth in our operating fleet that we might otherwise be able to attain.
The current economic recession could result in a further decline in the future demand for shipping containers by our customers and could lead to an increase the number of containers returned to us, reduce our container rental revenue, further reduce utilization of our fleet, increase our operating expenses (such as storage, bad debt and repositioning costs) and have an adverse effect on our future financial performance. We cannot predict the degree to which the current economic recession in the U.S. and foreign economies will have on our financial condition and our future operating results.
Much of our leasing business involves shipments of goods exported from Asia. From time to time, there have been economic disruptions, health scares (such as SARS, H1N1 flu ), financial turmoil, natural disasters and political instability in Asia. If these events were to occur in the future, they could adversely affect our container lessees and the general demand for shipping and lead to reduced demand for leased containers or otherwise
14
Table of Contents
adversely affect us. Demand for containers originating from China and other Asian economies has been lower since the beginning of September 2008 and is expected to remain weak until world economic growth increases. Other general factors affecting demand for leased containers, utilization and per diem rates include the following:
| • | available supply and prices of new and used containers; |
| • | economic conditions and competitive pressures in the shipping industry; |
| • | shifting trends and patterns of cargo traffic; |
| • | the availability and terms of container financing; |
| • | fluctuations in interest rates and foreign currency values; |
| • | overcapacity or undercapacity of the container manufacturers; |
| • | the lead times required to purchase containers; |
| • | the number of containers purchased by competitors and container lessees; |
| • | container ship fleet overcapacity or undercapacity; |
| • | increased repositioning by container shipping lines of their own empty containers to higher-demand locations in lieu of leasing containers from us; |
| • | consolidation or withdrawal of individual container lessees in the container shipping industry; |
| • | import/export tariffs and restrictions; |
| • | customs procedures, foreign exchange controls and other governmental regulations; |
| • | natural disasters that are severe enough to affect local and global economies; |
| • | political and economic factors; and |
| • | currency exchange rates. |
All of these factors are inherently unpredictable and beyond our control. These factors will vary over time, often quickly and unpredictably, and any change in one or more of these factors may have a material adverse effect on our business and results of operations. Many of these factors also influence the decision by our customers to lease or buy containers. Should one or more of these factors influence our customers to buy a larger percentage of the containers they operate, our utilization rate would decrease, resulting in decreased revenue and increased storage and repositioning costs.
Our operating results have fluctuated significantly in the past and may fluctuate significantly in the future.
Our revenue comes primarily from the leasing of containers owned by us, management fees earned on containers owned by container investors and gain on sale of container portfolios to container investors. Historically, our annual and quarterly total revenues, net income and cash flows have fluctuated significantly as a result of fluctuations in our gain on sale of container portfolios. Selling containers to container investors has very little associated incremental expense, which means that our quarterly results may fluctuate significantly depending upon the amount of gain on sale of container portfolios, if any, we realize in a quarter.
Due to seasonal increased demand for containers in the several months leading up to the holiday season in the United States and Europe and higher demand for purchasing containers by container investors toward the end of the calendar year, a higher proportion of our container sales to investors has typically occurred in the second half of each calendar year. Although by comparison our container rental revenue and management fee revenue have historically fluctuated much less than our gain on sale of container portfolios, container rental revenue and management revenue may also fluctuate significantly in future periods based upon the level of demand by container shipping lines for leased containers, our ability to maintain a high utilization rate of containers in our total fleet, changes in per diem rates for leases and fluctuations in operating expenses.
15
Table of Contents
A large part of our historical revenue comes from gain on sale of container portfolios and our container sale activities in the future may result in lower gains or losses on sales of containers.
Our revenue from gain on sale of container portfolios depends on our ability to make a profit on containers that we purchase and then resell to container investors. We typically enter into firm purchase orders for containers before we begin finding lessees for the containers, and the time necessary to lease these containers may be much longer than we anticipate. The price that a container investor is willing to pay for a portfolio of containers depends on a number of factors, including the historical and future expected cash flows from the portfolio to the container investor, the credit ratings of the lessees, the mix of short-term and long-term leases, the number of TEUs in the portfolio, the timing of the sale and alternative investment opportunities available to the container investor. If any of these factors changes unexpectedly during the period between the date of our purchase order to the date a container investor purchases the container from us, we may recognize a lower gain on sale of the containers to investors, sell them to container investors at a loss or retain them as part of our owned fleet.
The capital markets are currently experiencing a high level of volatility and liquidity has become constrained across the debt and equity markets. Most of the container investor programs into which we sell container portfolios employ a certain amount of debt in order to increase investor equity returns. The uncertainty on future demand for containers from container shipping lines, the potential of lower than expected performance of existing investments in container funds and the reduced availability of credit for future investment programs, increases the potential that the Company may not be able to sell container portfolios in the future. In such case, our revenue, net income and cash flow will be adversely affected.
Per diem rates for our leased containers may decrease, which would have a negative effect on our business and results of operations.
Per diem rates for our leased containers depend on a large number of factors, including the following:
| • | the type and length of the lease; |
| • | embedded residual assumptions; |
| • | the type and age of the container; |
| • | the number of new containers available for lease by our competitors; |
| • | the location of the container being leased; and |
| • | the price of new containers. |
Because steel is the major component used in the construction of new containers, the price of new containers and per diem rates on new containers are highly correlated with the price of raw steel. In the late 1990s, new container prices and per diem rates declined because of, among other factors, a drop in worldwide steel prices and a shift in container manufacturing from Taiwan and Korea to areas in mainland China with lower labor costs. From 2003 to 2004, and again in the second half of 2006, container prices and leasing rates increased partially due to an increase in worldwide steel prices. Similarly, container prices during the first nine months of 2008 rose from their 2007 levels partially due to higher commodity prices. There has been a decrease in steel prices since the beginning of September 2008 and it is believed there has been reduced demand for newly manufactured containers by our customers and competitors. In the first quarter of 2010 container prices have begun increasing due to limited production by container manufacturers. We cannot predict container prices in the future. If newly manufactured container prices decline, we may need to lease the containers at low return rates or at a loss.
Per diem rates may be negatively impacted by the entrance of new leasing companies, overproduction of new containers by manufacturers and over-buying of containers by container shipping lines and leasing competitors. For example, during 2001 and again in 2005, overproduction of new containers, coupled with a
16
Table of Contents
build-up of container inventories in Asia by leasing companies and container shipping lines, led to decreasing per diem rates and utilization rates. In 2007, competitive pressures also reduced per diem rates. In the event that the container shipping industry were to be characterized by overcapacity in the future, or if available supply of containers were to increase significantly as a result of, among other factors, new companies entering the business of leasing and selling containers, both utilization and per diem rates may decrease, adversely affecting our revenue and operating results.
A reduction in the willingness of container investors to have us manage their containers could adversely affect our business, results of operations and financial condition.
A significant percentage of our revenue is attributable to management fees earned on services related to the leasing of containers owned by container investors. This revenue has very low direct operating costs associated with it. Accordingly, fluctuations in our management fee revenue in any period will have a significant impact on our profitability in that period. If we fail to meet performance requirements contained in our management agreements, container investors may seek to terminate these agreements. During the year ended December 31, 2009, the Company did not meet certain performance criteria in several of its container management contracts. The Company has experienced nonperformance due to the reduced income resulting from the decline in world trade and global recession and its impact on equipment utilization. Total revenue for the year ended December 31, 2009 would have been approximately 4.6% lower if such container management had been terminated for not meeting the agreed upon performance levels set forth therein.
If one or more container investors terminated their management agreements, our management revenue would be adversely affected and our ability to sell container portfolios to investors could be severely impaired. However, no container investor has notified the Company of its decision to terminate its management agreement and management does not currently expect any container investor to terminate its agreement. Moreover, our ability to continue to attract new management contracts depends upon a number of factors, including our ability to lease containers on attractive lease terms and to efficiently manage the repositioning and disposition of containers. In the event container investors perceive another container leasing company as better able to provide them with a stable and attractive rate of return, existing contracts may not be renewed, and we may lose management contract opportunities in the future, which could affect our business, results of operations and financial condition.
Please see risk factor “We derive a substantial portion of our revenue for each of our container management and container leasing segments from a limited number of container investors and container lessees, respectively. The loss of, or reduction in business by, any of these container investors or container lessees could result in a significant loss of revenue and cash flow.” on page 20.
Gains and losses associated with the disposition of used equipment may fluctuate and adversely affect our results of operations.
We regularly sell used, older containers upon lease expiration. The residual values of these containers therefore affect our profitability. The volatility of the residual values of such containers may be significant. These values depend upon, among other factors, raw steel prices, applicable maintenance standards, refurbishment needs, comparable new container costs, used container availability, used container demand, inflation rates, market conditions, materials and labor costs and equipment obsolescence. Most of these factors are outside of our control.
Containers are typically sold if it is in the best interest of the owner to do so after taking into consideration earnings prospects, book value, remaining useful life, repair condition, suitability for leasing or other uses and the prevailing local sales price for containers. Gains or losses on the disposition of used container equipment and the sales fees earned on the disposition of managed containers will also fluctuate and may be significant if we sell large quantities of used containers.
17
Table of Contents
The U.S. and foreign economies have been in various stages of recovery from the economic recession in 2009, which increases the potential of increased future inventories of used equipment by leasing companies and shipping lines in depots. Such an increase in inventory of idle equipment increases the potential of reducing the prices attained for disposition of used containers. As a result, the Company may need to dispose of equipment at a loss or not be able to sell equipment, which would increase our storage and repositioning expenses.
We may incur significant costs to reposition containers.
When lessees return containers to locations where supply exceeds demand, we routinely reposition containers to higher demand areas. Repositioning expenses vary depending on geographic location, distance, freight rates and other factors, and may not be fully covered by drop-off charges collected from the last lessee of the containers or pick-up charges paid by the new lessee. We seek to limit the number of containers that can be returned and impose surcharges on containers returned to areas where demand for such containers is not expected to be strong. However, market conditions may not enable us to continue such practices. In addition, we may not accurately anticipate which port locations will be characterized by high or low demand in the future, and our current contracts will not protect us from repositioning costs if ports that we expect to be high-demand ports turn out to be low-demand ports at the time leases expire.
Lessee defaults may adversely affect our business, results of operations and financial condition by decreasing revenue and increasing storage, repositioning, collection and recovery expenses.
Our containers are leased to numerous container lessees. Lessees are required to pay rent and indemnify us for damage to or loss of containers. Lessees may default in paying rent and performing other obligations under their leases. A delay or diminution in amounts received under the leases (including leases on our managed containers), or a default in the performance of maintenance or other lessee obligations under the leases could adversely affect our business, results of operations and financial condition and our ability to make payments on our debt.
Our cash flows from containers, principally container rental revenue, management fee revenue, gain on sale of container portfolios, gain on disposition of used equipment and commissions earned on the sale of containers on behalf of container investors, are affected significantly by the ability to collect payments under leases and the ability to replace cash flows from terminating leases by re-leasing or selling containers on favorable terms. All of these factors are subject to external economic conditions and the performance by lessees and service providers that are not within our control.
When lessees default, we may fail to recover all of our containers and the containers we do recover may be returned to locations where we will not be able to quickly re-lease or sell them on commercially acceptable terms. We may have to reposition these containers to other places where we can re-lease or sell them, which could be expensive depending on the locations and distances involved. Following repositioning, we may need to repair the containers and pay container depots for storage until the containers are re-leased. For our owned containers these costs will directly reduce our income before taxes and for our managed containers, lessee defaults will increase operating expenses, and thus reduce our management fee revenue. We have seen an increase in the number of smaller regional shipping lines defaulting on their lease agreements since the second quarter of 2008. The Company is recovering equipment and incurring expenses for its account and for the account of container investors related to these customer defaults. We maintain insurance to reimburse the Company and container investors for such customer defaults. The insurance agreements are subject to deductibles of up to $3.0 million per occurrence and have significant exclusions and, therefore, may not be sufficient to prevent us from suffering material losses. Additionally, the increase in claims made by the Company under such insurance agreements may result in such insurance not being available to us in the future on commercially reasonable terms, or at all.
18
Table of Contents
Our level of indebtedness reduces our financial flexibility and could impede our ability to operate.
We intend to borrow additional amounts under our senior secured credit facility and other debt facilities to purchase containers and make acquisitions and other investments. We expect that we will maintain a significant amount of indebtedness on an ongoing basis. All of our borrowings under our senior secured credit facility are due and payable on September 25, 2012 and there is no assurance that we will be able to refinance our outstanding indebtedness, or if refinancing is available, that it can be obtained on terms that we can afford. The capital markets are currently experiencing a high degree of volatility. To the extent that volatility in the capital markets continues, the Company’s access to capital may become limited and its borrowing costs may materially increase.
Our senior secured credit facility requires us to pay a variable rate of interest, which will increase or decrease based on variations in certain financial indexes, and fluctuations in interest rates can significantly decrease our profits. We do not have any material amounts of hedge or similar contracts that would protect us against changes in interest rates.
The amount of our indebtedness could have important consequences for you, including the following:
| • | requiring us to dedicate a substantial portion of our cash flow from operations to make payments on our debt, thereby reducing funds available for operations, future business opportunities and other purposes; |
| • | limiting our flexibility in planning for, or reacting to, changes in our business and the industry in which we operate; |
| • | making it more difficult for us to satisfy our debt obligations, and any failure to comply with such obligations, including financial and other restrictive covenants, could result in an event of default under the agreements governing such indebtedness, which could lead to, among other things, an acceleration of our indebtedness or foreclosure on the assets securing our indebtedness, which could have a material adverse effect on our business or financial condition; |
| • | limiting our ability to borrow additional funds, or to sell assets to raise funds, if needed, for working capital, capital expenditures, acquisitions or other purposes; and |
| • | increasing our vulnerability to general adverse economic and industry conditions, including changes in interest rates. |
Our debt and capital lease obligations were $182.4 million as of December 31, 2009. We may not generate sufficient cash flow from operations to service and repay our debt and related obligations and have sufficient funds left over to achieve or sustain profitability in our operations, meet our working capital and capital expenditure needs or compete successfully in our industry.
We may incur future asset impairment charges.
An asset impairment charge may result from the occurrence of unexpected adverse events or management decisions that impact our estimates of expected cash flows generated from our long-lived assets. We regularly review our long-lived assets for impairment, including when events or changes in circumstances indicate the carrying value of an asset may not be recoverable. We may be required to recognize asset impairment charges in the future as a result of reductions in demand for specific container types, a weak economic environment, challenging market conditions, events related to particular customers or asset type, or as a result of asset or portfolio sale decisions by management.
The container investors that purchase containers from us are located in four countries and a change in the conditions and laws in any of these countries could significantly reduce demand by container investors to purchase containers.
The container investors that have historically purchased containers from us are located in Germany, Switzerland, Austria and Japan. The willingness of these investors to continue to purchase containers from us will depend upon a number of factors outside of our control, including the laws in the countries in which they are
19
Table of Contents
domiciled, the tax treatment of an investment and restrictions on foreign investments. If a change in tax laws or other conditions makes investments in containers less attractive, we will need to identify new container investors. The process of identifying new container investors and selling containers to them could be lengthy and we may not be able to find new container investors in these circumstances, which would result in a substantial reduction in the amount of gain on sale of container portfolios and cash flow.
We derive a substantial portion of our revenue for each of our container management and container leasing segments from a limited number of container investors and container lessees, respectively. The loss of, or reduction in business by, any of these container investors or container lessees could result in a significant loss of revenue and cash flow.
We have derived, and believe that we will continue to derive, a significant portion of our revenue and cash flow from a limited number of container investors and container lessees. Our business comprises two reportable segments for financial statement reporting purposes: container management and container leasing. The operating results of each segment and details of our revenues by for the years ended December 31, 2009, 2008 and 2007 are summarized in Note 17 to our consolidated financial statements included in this filing. Revenue for our container management segment comes primarily from container investors that purchase portfolios of containers and then pay us to manage the containers for them. Revenue for our container leasing segment comes primarily from container lessees that lease containers from our owned fleet.
Revenue from our ten largest container lessees represented 45.5% of the revenue from our container leasing segment for the year ended December 31, 2009, with revenue from our single largest container lessee accounting for 7.3%, or $4.1 million, of revenue from our container leasing segment during such period. This $4.1 million of revenue represented 6.3% of our total revenue for this period. We do not distinguish between our owned fleet and our managed fleet when we enter into leases with container shipping lines. Accordingly, the largest lessees of our owned fleet are typically among the largest lessees of our managed fleet, and our management fee revenue is based in part on the number of managed containers on lease to container lessees. As a result, the loss of, or default by, any of our largest container lessees could have a material adverse effect on the revenue for both our container management segment and our container leasing segment. In addition, many of the management agreements with our container investors contain performance criteria, such as minimum per diem net income per container or minimum utilization rates for the pool of containers owned by the container investors. In the event we fail to meet one or more of these criteria in a management agreement, the independent investment arrangers who typically act on behalf of container investors may have the right to terminate the management agreement. In the year ended December 31, 2009, container investors associated with five investment arrangers represented 89.3% of our container management revenue. If we were to not perform our obligations as a container manager under the management agreements controlled by an independent investment arranger, the independent investment manager could decide to terminate all of the management agreements under which we have not performed our obligations. Managed containers associated with our single largest container investor accounted for 31.9%, or $3.0 million, of revenue from our container management segment during the year ended December 31, 2009. This $3.0 million of revenue represented 4.6% of our total revenue for this period. The termination of the management agreements under the control of a single investment arranger or the loss of our largest container investor as a management services customer could have a material adverse effect on the revenue for our container management segment.
Consolidation and concentration in the container shipping industry could decrease the demand for leased containers.
We primarily lease containers to container shipping lines. We believe container shipping lines require two TEUs of available containers for every TEU of capacity on their container ships. The container shipping lines have historically relied on a large number of leased containers to satisfy their needs. Consolidation of major container shipping lines could create efficiencies and decrease the demand that container shipping lines have for
20
Table of Contents
leased containers because they may be able to fulfill a larger portion of their needs through their owned container fleets. It could also create concentration of credit risk if the number of our container lessees decreases due to consolidation. Additionally, large container shipping lines with significant resources could choose to manufacture their own containers, which would decrease their demand for leased containers and could have an adverse impact on our business.
As we increase the number of containers in our owned fleet, we will be subject to significantly greater ownership risks.
The number of containers in our owned fleet fluctuates over time as we purchase new containers and sell containers to container investors or into the secondary resale market. As part of our strategy, we plan to increase both the number of owned containers as well as the number of managed containers in our fleet. We believe we will be able to find container investors to purchase the desired portion of the new containers that we purchase and lease. If we are unable to locate container investors to purchase these containers, we will operate the containers as part of our owned fleet. Ownership of containers entails greater risk than management of containers for container investors, because as we increase the number of containers in our owned fleet, we are subject to an increased level of risk from loss or damage to equipment, financing costs, changes in per diem rates, re-leasing risk, changes in utilization rates, lessee defaults, repositioning costs, storage expenses, impairment charges and changes in sales price upon disposition of containers.
As we increase the number of containers in our owned fleet we will have significantly more capital at risk and may not be able to satisfy the future capital requirements of our container management business.
As we increase the number of containers in our owned fleet, either as a result of planned growth in our owned fleet or as a result of our inability to sell containers to container investors, we may need to maintain higher debt balances which may adversely affect our return on equity and reduce our capital resources, including our ability to borrow money to continue expanding our managed fleet. Future borrowings may not be available under our senior secured credit facility or we may not be able to refinance the facility, if necessary, on commercially reasonable terms or at all. We may need to raise additional debt or equity capital in order to fund our business, expand our sales activities and/or respond to competitive pressures. We may not have access to the capital resources we desire or need to fund our business. These effects, among others, may reduce our profitability and adversely affect our plans to continue the expansion of the container management portion of our business.
Our container lessees prefer newer containers, so to stay competitive we must continually add new containers to our fleet. If we are unable to make necessary capital expenditures, our fleet of containers may be less desirable to our container lessees and our profitability could suffer.
Changes in market price, availability or transportation costs of containers could adversely affect our ability to maintain our supply of containers.
We currently purchase almost all of our containers from manufacturers based in China. If it were to become more expensive for us to procure containers in China or to transport these containers at a low cost from China to the locations where they are needed by our container lessees because of changes in exchange rates between the U.S. Dollar and Chinese Yuan, further consolidation among container suppliers, increased tariffs imposed by the United States or other governments or for any other reason, we may have to seek alternative sources of supply. While we are not currently dependent on any single current manufacturer of our containers, we may not be able to make alternative arrangements quickly enough to meet our container needs, and the alternative arrangements may increase our costs. The availability of containers depends significantly on the availability and cost of steel in China. If a shortage of steel develops either in China or worldwide, container manufacturers may not be able to meet our demand for new containers which would limit our ability to add new containers to our fleet.
21
Table of Contents
Terrorist attacks, the threat of such attacks, piracy or the outbreak of war and hostilities could negatively impact our operations and profitability and may expose us to liability.
Terrorist attacks and the threat of such attacks have contributed to economic instability in the United States and elsewhere, and further acts or threats of terrorism, violence, war or hostilities could similarly affect world trade and the industries in which we and our container lessees operate. For example, worldwide containerized trade dramatically decreased in the immediate aftermath of the September 11, 2001 terrorist attacks in the United States, which affected demand for leased containers. In addition, terrorist attacks, threats of terrorism, piracy or threats thereof, violence, war or hostilities may directly impact ports, depots, our facilities or those of our suppliers or container lessees and could impact our sales and our supply chain. A severe disruption to the worldwide ports system and flow of goods could result in a reduction in the level of international trade and lower demand for our containers. We maintain liability insurance that we believe would apply to claims arising from a terrorist attack, and our lease agreements require our lessees to indemnify us for all costs, liabilities and expenses arising out of the use of our containers, including property damage to the containers, damage to third-party property and personal injury. However, our lessees may not have adequate resources to honor their indemnity obligations and our insurance coverage is subject to large deductibles, a $15.0 million limit on coverage and significant exclusions. Accordingly, we may not be protected from liability (and expenses in defending against claims of liability) arising from a terrorist attack.
Our senior executives are critical to the success of our business and our inability to retain them or recruit new personnel could adversely affect our business.
Most of our senior executives and other management-level employees have over ten years of industry experience. We rely on this knowledge and experience in our strategic planning and in our day-to-day business operations. Our success depends in large part upon our ability to retain our senior management, the loss of one or more of whom could have a material adverse effect on our business. Our success also depends on our ability to retain our experienced sales force and technical personnel as well as recruiting new skilled sales, marketing and technical personnel. Competition for these individuals in our industry is intense and we may not be able to successfully recruit, train or retain qualified personnel. If we fail to retain and recruit the necessary personnel, our business and our ability to obtain new container lessees and provide acceptable levels of customer service could suffer.
We rely on our proprietary information technology system to conduct our business. If this system fails to adequately perform its functions, or if we experience an interruption in its operation, our business, results of operations and financial prospects could be adversely affected.
The efficient operation of our business is highly dependent on our proprietary information technology system. We rely on our system to track transactions, such as repair and depot charges and changes to book value, and movements associated with each of our owned or managed containers. We use the information provided by this system in our day-to-day business decisions in order to effectively manage our lease portfolio and improve customer service. We also rely on it for the accurate tracking of the performance of our managed fleet for each container investor. The failure of our system to perform as we expect could disrupt our business, adversely affect our results of operations and cause our relationships with lessees and container investors to suffer. In addition, our information technology system is vulnerable to damage or interruption from circumstances beyond our control, including fire, natural disasters, power loss and computer systems failures and viruses. Any such interruption could have a material adverse effect on our business, results of operations and financial prospects.
We will require a significant amount of cash to service and repay our outstanding indebtedness and our ability to generate cash depends on many factors beyond our control.
Our ability to make payments on and repay our indebtedness and to fund planned capital expenditures will depend on our ability to generate cash in the future. Based on the balance of our long-term indebtedness as of
22
Table of Contents
December 31, 2009, we will require approximately $7.3 million to service our current indebtedness in the year ending December 31, 2010. It is possible that:
| • | our business will not generate sufficient cash flow from operations to service and repay our debt and to fund working capital requirements and planned capital expenditures; |
| • | future borrowings will not be available under our current or future credit facilities in an amount sufficient to enable us to refinance our debt; or |
| • | we will not be able to refinance any of our debt on commercially reasonable terms or at all. |
Our senior secured credit facility imposes, and the terms of any future indebtedness may impose, significant operating, financial and other restrictions on us and our subsidiaries.
Restrictions imposed by our senior secured credit facility will limit or prohibit, among other things, our ability to:
| • | incur additional indebtedness; |
| • | pay dividends on or redeem or repurchase our stock; |
| • | enter into new lines of business; |
| • | issue capital stock of our subsidiaries; |
| • | make loans and certain types of investments; |
| • | create liens; |
| • | sell certain assets or merge with or into other companies; |
| • | enter into certain transactions with stockholders and affiliates; and |
| • | restrict dividends, distributions or other payments from our subsidiaries. |
These restrictions could adversely affect our ability to finance our future operations or capital needs and pursue available business opportunities. A breach of any of these restrictions, including breach of financial covenants, could result in a default in respect of the related indebtedness. If a default occurs, the relevant lenders could elect to declare the indebtedness, together with accrued interest and fees, to be immediately due and payable and proceed against any collateral securing that indebtedness, which will constitute substantially all of our container assets.
We face extensive competition in the container leasing industry.
We may be unable to compete favorably in the highly competitive container leasing and container management businesses. We compete with a number of major leasing companies, many smaller lessors, manufacturers of container equipment, companies and financial institutions offering finance leases, promoters of container ownership and leasing as a tax-efficient investment, container shipping lines, which sometimes lease their excess container stocks, and suppliers of alternative types of containers for freight transport. Some of these competitors have greater financial resources and access to capital than we do. Additionally, some of these competitors may have large, underutilized inventories of containers, which could lead to significant downward pressure on per diem rates, margins and prices of containers.
Competition among container leasing companies depends upon many factors, including, among others, per diem rates; lease terms, including lease duration, drop-off restrictions and repair provisions; customer service; and the location, availability, quality and individual characteristics of containers. New entrants into the leasing business have been attracted by the high rate of containerized trade growth in recent years. New entrants may be willing to offer pricing or other terms that we are unwilling or unable to match. As a result, we may not be able to maintain a high utilization rate or achieve our growth plans.
23
Table of Contents
The international nature of our business exposes us to numerous risks.
Our ability to enforce lessees’ obligations will be subject to applicable law in the jurisdiction in which enforcement is sought. As containers are predominantly located on international waterways, it is not possible to predict, with any degree of certainty, the jurisdictions in which enforcement proceedings may be commenced. For example, repossession from defaulting lessees may be difficult and more expensive in jurisdictions in which laws do not confer the same security interests and rights to creditors and lessors as those in the United States and in jurisdictions where recovery of containers from defaulting lessees is more cumbersome. As a result, the relative success and expedience of enforcement proceedings with respect to containers in various jurisdictions cannot be predicted.
We are also subject to risks inherent in conducting business across national boundaries, any one of which could adversely impact our business. These risks include:
| • | regional or local economic downturns; |
| • | changes in governmental policy or regulation; |
| • | restrictions on the transfer of funds into or out of the country; |
| • | import and export duties and quotas; |
| • | domestic and foreign customs and tariffs; |
| • | international incidents; |
| • | war, hostilities, terrorist attacks, a piracy, or the threat of any of these events; |
| • | government instability; |
| • | nationalization of foreign assets; |
| • | government protectionism; |
| • | compliance with export controls, including those of the U.S. Department of Commerce; |
| • | compliance with import procedures and controls, including those of the U.S. Department of Homeland Security; |
| • | consequences from changes in tax laws, including tax laws pertaining to the container investors; |
| • | potential liabilities relating to foreign withholding taxes; |
| • | labor or other disruptions at key ports; |
| • | difficulty in staffing and managing widespread operations; and |
| • | restrictions on our ability to own or operate subsidiaries, make investments or acquire new businesses in these jurisdictions. |
One or more of these factors could impair our current or future international operations and, as a result, harm our overall business.
We may incur costs associated with new security regulations, which may adversely affect our business, financial condition and results of operations.
We may be subject to regulations promulgated in various countries, including the United States, seeking to protect the integrity of international commerce and prevent the use of containers for international terrorism or other illicit activities. For example, the Container Security Initiative, the Customs-Trade Partnership Against Terrorism and Operation Safe Commerce are among the programs administered by the U.S. Department of Homeland Security that are designed to enhance security for cargo moving throughout the international
24
Table of Contents
transportation system by identifying existing vulnerabilities in the supply chain and developing improved methods for ensuring the security of containerized cargo entering and leaving the United States. Moreover, the International Convention for Safe Containers, 1972 (CSC), as amended, adopted by the International Maritime Organization, applies to new and existing containers and seeks to maintain a high level of safety of human life in the transport and handling of containers by providing uniform international safety regulations. As these regulations develop and change, we may incur compliance costs due to the acquisition of new, compliant containers and/or the adaptation of existing containers to meet new requirements imposed by such regulations. Additionally, certain companies are currently developing or may in the future develop products designed to enhance the security of containers transported in international commerce. Regardless of the existence of current or future government regulations mandating the safety standards of intermodal shipping containers, our competitors may adopt such products or our container lessees may require that we adopt such products. In responding to such market pressures, we may incur increased costs, which could have a material adverse effect on our business, financial condition and results of operations.
We operate in numerous tax jurisdictions. A taxing authority within any of these jurisdictions may challenge our operating structure which could result in additional taxes, interest and penalties that could materially impact our future financial results.
We have implemented a number of structural changes with respect to our international subsidiaries in an effort to reduce our income tax obligations in countries in which we operate. There can be no assurance that our tax structure and the amount of taxes we pay in any of these countries will not be challenged by the taxing authorities in these countries. If the tax authorities challenge our tax structure or the amount of taxes paid, we could incur substantial expenses associated with defending our tax position as well as expenses associated with the payment of any additional taxes, penalties and interest that may be imposed on us. The payment of these amounts could have an adverse material effect on our business and results of operations.
Environmental liability may adversely affect our business and financial condition.
We are subject to federal, state, local and foreign laws and regulations relating to the protection of the environment, including those governing the discharge of pollutants to air, ground and water, the management and disposal of hazardous substances and wastes and the cleanup of contaminated sites. We could incur substantial costs, including cleanup costs, fines and costs arising out of third-party claims for property or natural resource damage and personal injury, as a result of violations of or liabilities under environmental laws and regulations in connection with our or our lessees’ current or historical operations. Under some environmental laws in the United States and certain other countries, the owner or operator of a container may be liable for environmental damage, cleanup or other costs in the event of a spill or discharge of material from the container without regard to the fault of the owner or operator. While we typically maintain liability insurance and typically require lessees to provide us with indemnity against certain losses, the insurance coverage may not be sufficient, or available, to protect against any or all liabilities and such indemnities may not be sufficient to protect us against losses arising from environmental damage. Moreover, our lessees may not have adequate resources, or may refuse to honor their indemnity obligations and our insurance coverage is subject to large deductibles, coverage limits and significant exclusions.
We may face litigation involving our management of containers for container investors.
We manage containers for container investors under management agreements that are negotiated with each container investor. We make no assurances to container investors that they will make any amount of profit on their investment or that our management activities will result in any particular level of income or return of their initial capital. We believe that as the number of containers that we manage for container investors increases, there is a possibility that we may be drawn into litigation relating to the investments. Although our management agreements contain contractual protections and indemnities that are designed to limit our exposure to such litigation, such provisions may not be effective and we may be subject to a significant loss in a successful litigation by a container investor.
25
Table of Contents
Our 80 percent ownership in CAIJ Ltd, a container investment arranger and advisor focused on arranging container investments with Japanese investors, may subject us to material litigation risks and damage to our professional reputation as a result of litigation allegations and negative publicity.
CAIJ Ltd (CAIJ) was formed and began operation in 2007 for the purpose of arranging investments in our containers with Japanese investors. CAIJ arranged $5.8 million and $14.6 million of investments in container funds in 2009 and 2008, respectively, and we expect that CAIJ will arrange more container investments in the future. Because we are the seller and manager of the containers that will be sold to investors on whose behalf CAIJ acts as an arranger and advisor, there is an inherent conflict of interest between us and CAIJ. We disclose this inherent conflict of interest to container investors prior to any sale to them, but we do not provide them with any assurances that they will realize a specific or any investment return on the containers purchased from, and managed by, us. In the event that these container investors realize losses on their investments or believe that the returns on their investments are lower than expected, they may make claims, including bringing lawsuits, against CAIJ or us for our alleged failure to act in their best interests. Any such claims could result in the payment of legal expenses and damages and also damage our reputation with container investors and potential container investors and materially and adversely affect our business, financial condition or results of operations.
Certain liens may arise on our containers.
Depot operators, repairmen and transporters may come into possession of our containers from time to time and have sums due to them from the lessees or sublessees of the containers. In the event of nonpayment of those charges by the lessees or sublessees, we may be delayed in, or entirely barred from, repossessing the containers, or be required to make payments or incur expenses to discharge liens on our containers.
The lack of an international title registry for containers increases the risk of ownership disputes.
There is no internationally recognized system of recordation or filing to evidence our title to containers nor is there an internationally recognized system for filing security interest in containers. Although we have not incurred material problems with respect to this lack of internationally recognized system, the lack of an international title recordation system with respect to containers could result in disputes with lessees, end-users, or third parties who may improperly claim ownership of the containers.
As a U.S. corporation, we are subject to U.S. Executive Orders and U.S. Treasury Sanctions Regulations regarding doing business in or with certain nations and specially designated nationals (SDNs).
As a U.S. corporation, we are subject to U.S. Executive Orders and U.S. Treasury sanctions regulations restricting or prohibiting business dealings in or with certain nations and with certain specially designated nationals (individuals and legal entities). Any determination that we have violated such Executive Orders and U.S. Treasury sanctions regulations could have a material adverse effect on our business, financial condition, results of operations and cash flows.
We may pursue acquisitions or joint ventures in the future that could present unforeseen integration obstacles or costs.
We may pursue acquisitions and joint ventures in the future. Acquisitions involve a number of risks and present financial, managerial and operational challenges, including:
| • | potential disruption of our ongoing business and distraction of management; |
| • | difficulty integrating personnel and financial and other systems; |
| • | hiring additional management and other critical personnel; and |
| • | increasing the scope, geographic diversity and complexity of our operations. |
26
Table of Contents
In addition, we may encounter unforeseen obstacles or costs in the integration of acquired businesses. Also, the presence of one or more material liabilities of an acquired company that are unknown to us at the time of acquisition may have a material adverse effect on our business. Acquisitions or joint ventures may not be successful, and we may not realize any anticipated benefits from acquisitions or joint ventures.
In the future, we may be required to pay personal holding company taxes, which would have an adverse effect on our cash flows, results of operations and financial condition.
The Internal Revenue Code requires any company that qualifies as a “personal holding company” to pay personal holding company taxes in addition to regular income taxes. A company qualifies as a personal holding company if (1) more than 50.0% of the value of the company’s stock is held by five or fewer individuals and (2) at least 60.0% of the company’s adjusted ordinary gross income constitutes personal holding company income, which, in our case, includes adjusted income from the lease of our containers. If we or any of our subsidiaries are a personal holding company, our undistributed personal holding company income, which is generally taxable income with certain adjustments, including a deduction for federal income taxes and dividends paid, will be taxed at a rate of 15.0%. Based upon our operating results, we were not classified as a personal holding company for the year ended December 31, 2009. Whether or not we or any of our subsidiaries are classified as personal holding companies in future years will depend upon the amount of our personal holding company income and the percentage of our outstanding common stock that will be beneficially owned by Mr. Hiromitsu Ogawa, who beneficially owned 41.3% of our common stock as of December 31, 2009. At some point in the future we could become liable for personal holding company taxes. The payment of personal holding company taxes in the future would have an adverse effect on our cash flows, results of operations and financial condition.
Risks Related to Our Stock
Our stock price has been volatile and may remain volatile.
The trading price of our common stock may be subject to wide fluctuations in response to quarter-to-quarter variations in operating results, new services by us or our competitors, general conditions in the shipping industry and the intermodal container sales and leasing markets, changes in earnings estimates by analysts, or other events or factors. In addition, the public stock markets have experienced extreme price and trading volume volatility in recent months. The broad market fluctuations may adversely affect the market price of our common stock. Since the initial public offering of our stock at $15.00 per share on May 16, 2007, the closing market price of our stock has fluctuated significantly from a high of $19.64 per share to a low of $2.15 per share. Since our stock is not among the most heavily traded stocks in the market, shareholders may experience difficulties in liquidating our stock. Factors affecting the trading price of our common stock may include:
| • | variations in our financial results; |
| • | changes in financial estimates or investment recommendations by any securities analysts following our business; |
| • | the public’s response to our press releases, our other public announcements and our filings with the Securities and Exchange Commission; |
| • | changes in accounting standards, policies, guidance, interpretations or principles; |
| • | future sales of common stock by us or our directors, officers or significant stockholders or the perception such sales may occur; |
| • | our ability to achieve operating results consistent with securities analysts’ projections; |
| • | the operating and stock price performance of other companies that investors may deem comparable to us; |
27
Table of Contents
| • | recruitment or departure of key personnel; |
| • | our ability to timely address changing container lessee preferences; |
| • | container market and industry factors; |
| • | general stock market conditions; and |
| • | other events or factors, including those resulting from war, incidents of terrorism or responses to such events. |
In addition, if the market for companies deemed similar to us or the stock market in general experiences loss of investor confidence, the trading price of our common stock could decline for reasons unrelated to our business or financial results. The trading price of our common stock might also decline in reaction to events that affect other companies in our industry even if these events do not directly affect us.
Future new sales of our common stock by us or outstanding shares by existing stockholders, or the perception that there will be future sales of new shares from the company or existing stockholders, may cause our stock price to decline and impair our ability to obtain capital through future stock offerings.
A substantial number of shares of our common stock held by our current stockholders could be sold into the public market at anytime. In addition, the perception of, or actual sale of, new shares may materially and adversely affect our stock price and could impair our ability to obtain future capital through an offering of equity securities.
We do not expect to pay any dividends in the foreseeable future.
We do not anticipate paying any cash dividends to holders of our common stock in the foreseeable future. In addition, our senior secured credit facility includes restrictions on our ability to pay cash dividends. Agreements governing future indebtedness will likely contain similar restrictions on our ability to pay cash dividends. Although our board of directors may decide in the future to declare and issue a dividend, or to set a dividend policy, no assurance is given that decision to declare such a dividend or to set such a policy will be made in the future. Consequently, investors must rely on sales of their common stock as the only way to realize any future gains on their investment.
If securities analysts do not publish research or reports about our business or if they change their financial estimates or investment recommendation, the price of our stock could decline.
The trading market for our common shares will rely in part on the research and reports that industry or financial analysts publish about us or our business. We do not control or influence the decisions or opinions of these analysts and analysts may not cover us.
If any analyst who covers us changes his or her financial estimates or investment recommendation, the price of our stock could decline. If any analyst ceases coverage of our company, we could lose visibility in the market, which in turn could cause our stock price to decline.
Our founder, Mr. Hiromitsu Ogawa, will continue to have substantial control over us and could act in a manner with which other stockholders may disagree or that is not necessarily in the interests of other stockholders.
Based upon beneficial ownership as of February 28, 2010, Mr. Ogawa beneficially owns approximately 41.3 % of our outstanding common stock. As a result, he may have the ability to determine the outcome of matters submitted to our stockholders for approval, including the election of directors and any merger, consolidation or sale of all or substantially all of our assets. In addition, he may have the ability to control the management and affairs of our company. Mr. Ogawa may have interests that are different from yours.
28
Table of Contents
For example, he may support proposals and actions with which you may disagree or which are not in your interests. The concentration of ownership could delay or prevent a change in control of us or otherwise discourage a potential acquirer from attempting to obtain control of us, which in turn could reduce the price of our common stock. In addition, as Chairman of our Board of Directors, Mr. Ogawa will influence decisions to maintain our existing management and directors in office, delay or prevent changes of control of our company, or support or reject other management and board proposals that are subject to stockholder approval, such as amendments to our employee stock plans and approvals of significant financing transactions.
Our certificate of incorporation and bylaws and Delaware law contain provisions that could discourage a third party from acquiring us and consequently decrease the market value of an investment in our common stock.
Our certificate of incorporation and bylaws and Delaware corporate law each contain provisions that could delay, defer or prevent a change in control of our company or changes in our management. Among other things, these provisions:
| • | authorize us to issue preferred stock that can be created and issued by the board of directors without prior stockholder approval, with rights senior to those of our common stock; |
| • | permit removal of directors only for cause by the holders of a majority of the shares entitled to vote at the election of directors and allow only the directors to fill a vacancy on the board of directors; |
| • | prohibit stockholders from calling special meetings of stockholders; |
| • | prohibit stockholder action by written consent, thereby requiring all stockholder actions to be taken at a meeting of our stockholders; |
| • | allow the authorized number of directors to be changed only by resolution of the board of directors; |
| • | establish advance notice requirements for submitting nominations for election to the board of directors and for proposing matters that can be acted upon by stockholders at a meeting; |
| • | classify our board of directors into three classes so that only a portion of our directors are elected each year; and |
| • | allow our directors to amend our bylaws. |
These provisions could discourage proxy contests and make it more difficult for our stockholders to elect directors and take other corporate actions, which may prevent a change of control or changes in our management that a stockholder might consider favorable. In addition, Section 203 of the Delaware General Corporation Law may discourage, delay or prevent a change in control of us. Any delay or prevention of a change in control or change in management that stockholders might otherwise consider to be favorable could cause the market price of our common stock to decline.
Public-company corporate governance and financial reporting practices and policies will increase our costs, and we may be unable to provide the required financial information in a timely and reliable manner.
The Securities and Exchange Commission, as directed by Section 404 of the Sarbanes-Oxley Act of 2002 (the “Sarbanes-Oxley Act”), requires annual management assessments of the effectiveness of internal control over financial reporting and a report by our independent auditors rendering an opinion on the effectiveness of our internal control over financial reporting. If we fail to maintain the adequacy and effectiveness of internal control over financial reporting, we may not be able to conclude on an ongoing basis that we have effective internal control over financial reporting in accordance with Section 404 of the Sarbanes-Oxley Act and related regulations. Although our management has concluded that adequate internal control procedures are currently in place, no system of internal control can provide absolute assurance that the financial statements are accurate and free of errors. As a result, the risk exists that our internal control may not detect all errors or omissions in the financial statements. Our independent auditors must annually report on the effectiveness of such internal controls
29
Table of Contents
over financial reporting. Our management may not be able to effectively and timely maintain controls and procedures that adequately respond to the increased regulatory compliance and reporting requirements that will be applicable to us as a public company. If we are not able to implement the requirements of the Sarbanes-Oxley Act in a timely manner or with adequate compliance, our independent auditors may not be able to certify as to the effectiveness of our internal controls over financial reporting. This result may subject us to adverse regulatory consequences, and could lead to a negative reaction in the financial markets due to a loss of confidence in the reliability of our financial statements. We could also suffer a loss of confidence in the reliability of our financial statements if we disclose material weaknesses in our internal controls. In addition, if we fail to develop and maintain effective controls and procedures, we may be unable to provide the required financial information in a timely and reliable manner or otherwise comply with the standards applicable to us as a public company. Any failure by us to timely provide the required financial information could materially and adversely impact our financial condition and the market value of our stock.
| ITEM 1B. | UNRESOLVED STAFF COMMENTS |
Not Applicable.
| ITEM 2. | PROPERTIES |
Office Locations. As of December 31, 2009, our employees are located in 13 offices in 11 different countries including the United States. We have 2 offices in the U.S. including our headquarters in San Francisco, California. We have 11 offices outside the U.S. We lease all of our office space. In addition, we have agents in Asia, Europe, South Africa, Australia and South America. Each of our offices locations is used for both our container leasing and container management segments, except for our Consent offices in Sweden and Germany which are used only for container leasing operations.
The following table summarizes the facilities we leased as of December 31, 2009:
Office Location—U.S. Properties
San Francisco, CA (Headquarters)
Charleston, SC
Office Location—International Properties
Brentwood, United Kingdom
St. Michael, Barbados
Antwerp, Belgium
Hong Kong
Singapore
Gothenburg, Sweden
Delmenhorst, Germany
Tokyo, Japan
Kuala Lumpur, Malaysia
Taipei, Taiwan
| ITEM 3. | LEGAL PROCEEDINGS |
From time to time we may become a party to litigation matters arising in connection with the normal course of our business. While we cannot predict the outcome of these matters, in the opinion of our management, any liability arising from these matters will not have a material adverse effect on our business. Nevertheless, unexpected adverse future events, such as an unforeseen development in our existing proceedings, a significant increase in the number of new cases or changes in our current insurance arrangements could result in liabilities that have a material adverse impact on our business.
30
Table of Contents
PART II
| ITEM 5. | MARKET FOR REGISTRANT’S COMMON EQUITY, RELATED STOCKHOLDER MATTERS, AND ISSUER PURCHASES OF EQUITY SECURITIES |
Our common stock has been traded on the New York Stock Exchange (NYSE) under the symbol “CAP” since May 16, 2007. Prior to that time, there was no public market for our common stock. Since the initial public offering of our stock at $15.00 per share on May 16, 2007 to February 26, 2009, our stock price has fluctuated between a high closing price of $19.64 on July 11, 2008 and a low closing price of $2.15 on January 23, 2009.
The following table reflects the range of high and low sales prices, as reported on the New York Stock Exchange, for our common stock in each quarter of the years ended December 31, 2009 and 2008.
| High | Low | |||||
| 2009: |
||||||
| Fourth Quarter |
$ | 9.33 | $ | 6.91 | ||
| Third Quarter |
$ | 7.79 | $ | 5.13 | ||
| Second Quarter |
$ | 6.33 | $ | 2.87 | ||
| First Quarter |
$ | 3.86 | $ | 2.15 | ||
| 2008: |
||||||
| Fourth Quarter |
$ | 9.74 | $ | 2.90 | ||
| Third Quarter |
$ | 19.64 | $ | 9.57 | ||
| Second Quarter |
$ | 17.67 | $ | 12.67 | ||
| First Quarter |
$ | 12.85 | $ | 8.18 | ||
As of February 26, 2010, the closing price of the common stock was $ 9.87 as reported on the NYSE. On that date, there were approximately 29 registered holders of record of the common stock and approximately 922 beneficial holders, based on information obtained from the Company’s transfer agent.
Dividends
We have never declared or paid dividends on our capital stock nor intend to pay any dividends in the foreseeable future. We intend to retain future earnings to finance the operation and expansion of our business.
NYSE Corporate Governance Attestation
On June 30, 2009, Mr. Masaaki (John) Nishibori, President and Chief Executive Officer, certified to the NYSE that as of such date he was not aware of any violation by the Company of the NYSE’s corporate governance listing standards.
31
Table of Contents
PERFORMANCE GRAPH
The graph below compares cumulative shareholder returns for the Company as compared with the Russell 2000 Stock Index and the Dow Jones Transportation Stock Index for the period from May 16, 2007 (the date CAI International, Inc. common stock began trading at the NYSE) to December 31, 2009. The graph assumes an investment of $100 as of May 16, 2007.
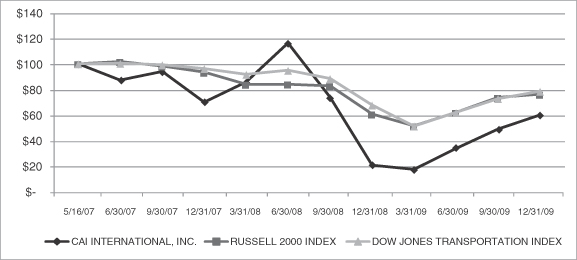
| Base Period 5/16/07 |
INDEX RETURNS Quarters Ending | |||||||||||||||||||||||||||||||||||
| Company/Index |
6/30/07 | 9/30/07 | 12/31/07 | 3/31/08 | 6/30/08 | 9/30/08 | 12/31/08 | 3/31/09 | 6/30/09 | 9/30/09 | 12/31/09 | |||||||||||||||||||||||||
| CAI INTERNATIONAL, INC. |
$ | 100 | $ | 87.13 | $ | 94.00 | $ | 70.13 | $ | 85.67 | $ | 116.00 | $ | 73.73 | $ | 21.13 | $ | 18.87 | $ | 34.00 | $ | 49.13 | $ | 60.20 | ||||||||||||
| RUSSELL 2000 INDEX |
100 | 101.65 | 98.20 | 93.40 | 83.88 | 84.08 | 82.86 | 60.89 | 51.54 | 61.97 | 73.67 | 76.25 | ||||||||||||||||||||||||
| DOW JONES |
||||||||||||||||||||||||||||||||||||
| TRANSPORTATION INDEX |
100 | 100.35 | 99.18 | 96.17 | 91.73 | 94.88 | 88.51 | 67.82 | 51.47 | 62.02 | 72.86 | 78.61 | ||||||||||||||||||||||||
32
Table of Contents
| ITEM 6. | SELECTED FINANCIAL DATA |
On October 1, 2006, we repurchased 10,584,000 shares, or 50.0% of our then-outstanding common stock held by Interpool. In connection with this transaction we applied pushdown accounting and accounted for the purchase as a step acquisition. Due to the application of pushdown accounting and step acquisition accounting in our financial statements, our financial condition and results of operations after September 30, 2006 are not comparable in some respects to our financial condition and results of operations reflected in our historical financial statements as of dates or for periods prior to October 1, 2006. The consolidated balance sheet and statement of operations data prior to October 1, 2006 as presented below, refer to the Predecessor company and this period is referred to as the Predecessor period which relates to the period prior to our repurchase of our common stock held by Interpool. The consolidated balance sheet and statement of operations data on and subsequent to October 1, 2006 refer to the Successor company and the period is referred to as the Successor period which relates to the period after we repurchased our common stock held by Interpool. A line has been drawn between the financial statements data to distinguish between the Predecessor and Sucessor periods.
The selected financial data presented below under the heading “Consolidated Statement of Operations Data” for the years ended December 31, 2009, 2008 and 2007, and the heading “Consolidated Balance Sheet Data” as of December 31, 2009 and 2008 have been derived from our audited consolidated financial statements included elsewhere in this 10-K filing. The selected financial data presented below under the heading “Statement of Operations Data” for the three months ended December 31, 2006, nine months ended September 30, 2006 and year ended December 31, 2005, and under the heading “Consolidated Balance Sheet Data” as of December 31, 2006 and 2005 have been derived from our audited consolidated financial statements that were included in our Registration Statement on Form S-1 filed with the Securities and Exchange Commission on May 11, 2007.
On January 1, 2009, the Company adopted and retrospectively applied Financial Accounting Standards Board (“FASB”) Accounting Standards Codification (“ASC”) 470-20, Debt With Conversion and Other Options, in connection with the Company’s $37.5 million convertible note to Interpool, Inc. that was executed in October 2006 and repaid in May 2007. The retrospective application of ASC 470-20 resulted in a $187,000 decrease in net income for the year ended December 31, 2007 and an increase for the same amount in net income for the three months ended December 31, 2006. The adoption of ASC 470-20 did not have an impact on the Company’s financial position as of December 31, 2007 but increased total assets by $2.2 million, total liabilities by $2.0 million and stockholders’ equity by $187,000 as of December 31, 2006.
Historical results are not necessarily indicative of the results of operations to be expected in future periods. You should read the selected consolidated financial data and operating data presented below in conjunction with “Management’s Discussion and Analysis of Financial Condition and Results of Operations” and with our consolidated financial statements and related notes included elsewhere in this 10-K filing. All common share and per share data have been adjusted to retroactively reflect the 420-to-1 stock split that occurred on April 23, 2007.
33
Table of Contents
Consolidated Statement of Operations Data
| Successor | Predecessor | |||||||||||||||||||||||||
| Year Ended December 31, | Three Months Ended December 31, 2006 |
Nine Months Ended September 30, 2006 |
Year Ended December 31, 2005 |
|||||||||||||||||||||||
| 2009 | 2008 | 2007 | ||||||||||||||||||||||||
| (Dollars in thousands, except per share data) |
||||||||||||||||||||||||||
| Revenue: |
||||||||||||||||||||||||||
| Container rental revenue |
$ | 53,747 | $ | 56,436 | $ | 38,148 | $ | 9,383 | $ | 24,228 | $ | 39,614 | ||||||||||||||
| Management fee revenue |
8,546 | 11,969 | 12,663 | 3,569 | 8,530 | 11,230 | ||||||||||||||||||||
| Gain on sale of container portfolios |
753 | 12,443 | 12,855 | 5,392 | 8,365 | 9,913 | ||||||||||||||||||||
| Finance lease income |
2,218 | 2,297 | 1,206 | 267 | 927 | 829 | ||||||||||||||||||||
| Total revenue |
65,264 | 83,145 | 64,872 | 18,611 | 42,050 | 61,586 | ||||||||||||||||||||
| Operating expenses: |
||||||||||||||||||||||||||
| Depreciation of container rental equipment |
17,140 | 15,824 | 8,805 | 2,360 | 9,653 | 14,764 | ||||||||||||||||||||
| Amortization of intangible assets |
1,566 | 1,534 | 1,241 | 307 | — | — | ||||||||||||||||||||
| Impairment of container rental equipment |
86 | 331 | 365 | 81 | 270 | 572 | ||||||||||||||||||||
| Gain on disposition of used container equipment |
(3,626 | ) | (4,155 | ) | (4,400 | ) | (747 | ) | (804 | ) | (1,166 | ) | ||||||||||||||
| Gain on settlement of lease obligation |
— | — | (780 | ) | — | — | — | |||||||||||||||||||
| Equipment rental expense |
— | 20 | 961 | 395 | 1,187 | 6,875 | ||||||||||||||||||||
| Storage, handling and other expenses |
8,717 | 4,854 | 3,077 | 779 | 2,411 | 3,853 | ||||||||||||||||||||
| Marketing, general and administrative expenses |
18,848 | 20,215 | 15,772 | 3,367 | 9,014 | 12,578 | ||||||||||||||||||||
| Impairment of goodwill |
— | 50,247 | — | — | — | — | ||||||||||||||||||||
| Restructuring charges |
972 | — | — | — | — | — | ||||||||||||||||||||
| Loss (gain) on foreign exchange |
(215 | ) | 564 | (104 | ) | 22 | (47 | ) | (27 | ) | ||||||||||||||||
| Total operating expenses |
43,488 | 89,434 | 24,937 | 6,564 | 21,684 | 37,449 | ||||||||||||||||||||
| Operating income (loss) |
21,776 | (6,289 | ) | 39,935 | 12,047 | 20,366 | 24,137 | |||||||||||||||||||
| Interest expense |
4,311 | 9,346 | 10,705 | 3,416 | 4,183 | 7,798 | ||||||||||||||||||||
| Gain on extinguishment of debt |
— | — | (681 | ) | — | — | — | |||||||||||||||||||
| Interest income |
(10 | ) | (229 | ) | (126 | ) | (20 | ) | (37 | ) | (27 | ) | ||||||||||||||
| Net interest expense |
4,301 | 9,117 | 9,898 | 3,396 | 4,146 | 7,771 | ||||||||||||||||||||
| Income (loss) before income taxes |
17,475 | (15,406 | ) | 30,037 | 8,651 | 16,220 | 16,366 | |||||||||||||||||||
| Income tax expense |
3,919 | 11,547 | 10,990 | 3,231 | 5,856 | 6,377 | ||||||||||||||||||||
| Net income (loss) |
13,556 | (26,953 | ) | 19,047 | 5,420 | 10,364 | 9,989 | |||||||||||||||||||
| (Accretion)/decretion of preferred stock |
— | — | (5,577 | ) | (6 | ) | 1,464 | (713 | ) | |||||||||||||||||
| Net income (loss) available to common shareholders |
$ | 13,556 | $ | (26,953 | ) | $ | 13,470 | $ | 5,414 | $ | 11,828 | $ | 9,276 | |||||||||||||
| Net income (loss) per share: |
||||||||||||||||||||||||||
| Basic |
$ | 0.76 | $ | (1.55 | ) | $ | 0.92 | $ | 0.51 | $ | 0.56 | $ | 0.44 | |||||||||||||
| Diluted |
$ | 0.76 | $ | (1.55 | ) | $ | 0.85 | $ | 0.36 | $ | 0.48 | $ | 0.44 | |||||||||||||
| Weighted average shares outstanding: |
||||||||||||||||||||||||||
| Basic |
17,902 | 17,406 | 14,713 | 10,584 | 21,168 | 21,168 | ||||||||||||||||||||
| Diluted |
17,902 | 17,406 | 16,682 | 16,270 | 21,735 | 21,168 | ||||||||||||||||||||
| Other Financial Data: |
||||||||||||||||||||||||||
| EBITDA (unaudited)(1) |
$ | 40,794 | $ | 61,824 | $ | 50,473 | $ | 14,827 | $ | 30,364 | $ | 39,568 | ||||||||||||||
| Adjusted EBITDA (unaudited)(1) |
46,326 | 68,387 | 54,464 | 15,621 | 33,323 | 42,385 | ||||||||||||||||||||
| Purchase of containers |
31,284 | 189,600 | 219,530 | 45,843 | 89,366 | 127,288 | ||||||||||||||||||||
| Net proceeds from sale of container portfolios |
5,840 | 99,773 | 113,402 | 49,252 | 67,912 | 102,097 | ||||||||||||||||||||
34
Table of Contents
Consolidated Balance Sheet Data
| Successor | Predecessor | |||||||||||||||||||||
| As of December 31, | ||||||||||||||||||||||
| 2009 | 2008 | 2007 | 2006 | 2005 | ||||||||||||||||||
| (Dollars in thousands) | ||||||||||||||||||||||
| Cash |
$ | 14,492 | $ | 28,535 | $ | 8,433 | $ | 20,359 | $ | 7,573 | ||||||||||||
| Container rental equipment, net |
299,340 | 310,397 | 242,606 | 161,353 | 134,563 | |||||||||||||||||
| Net investment in direct finance leases |
12,620 | 20,111 | 10,966 | 6,577 | 7,269 | |||||||||||||||||
| Total assets |
374,083 | 412,628 | 359,099 | 285,221 | 180,661 | |||||||||||||||||
| Long-term debt |
182,395 | 230,784 | 147,631 | 153,806 | 81,711 | |||||||||||||||||
| Total liabilities |
244,985 | 298,838 | 227,951 | 252,379 | 141,308 | |||||||||||||||||
| Cumulative redeemable convertible preferred stock |
— | — | — | 4,900 | 6,358 | |||||||||||||||||
| Total stockholders’ equity |
129,098 | 113,790 | 131,148 | 27,942 | 32,995 | |||||||||||||||||
| Selected Operating Data (unaudited): |
||||||||||||||||||||||
| Managed fleet in TEUs(2) |
507,681 | 534,553 | 500,433 | 483,333 | 456,076 | |||||||||||||||||
| Owned fleet in TEUs(2) |
235,082 | 243,408 | 253,910 | 185,645 | 141,653 | |||||||||||||||||
| 742,763 | 777,961 | 754,343 | 668,978 | 597,729 | ||||||||||||||||||
| Percentage of on-lease fleet on long-term leases(3) |
75.7 | % | 72.9 | % | 70.9 | % | 65.3 | % | 64.7 | % | ||||||||||||
| Percentage of on-lease fleet on short-term leases(3) |
21.5 | % | 23.8 | % | 26.8 | % | 32.8 | % | 33.5 | % | ||||||||||||
| Percentage of on-lease fleet on finance leases |
2.8 | % | 3.3 | % | 2.3 | % | 1.9 | % | 1.8 | % | ||||||||||||
| 100.0 | % | 100.0 | % | 100.0 | % | 100.0 | % | 100.0 | % | |||||||||||||
| Average Utilization rate(4) |
82.2 | % | 94.3 | % | 94.3 | % | 90.6 | % | 90.7 | % | ||||||||||||
| (1) | EBITDA is defined as net income before interest, income taxes, depreciation, amortization and impairment of goodwill and container rental equipment. Adjusted EBITDA is EBITDA plus principal payments from direct finance leases (DFL). We believe adjusted EBITDA is helpful in understanding our past financial performance as a supplement to net income and other performance measures calculated in conformity with accounting principles generally accepted in the United States (“GAAP”). Our management believes that adjusted EBITDA is useful to investors in evaluating our operating performance because it provides a measure of operating results unaffected by differences in capital structures, capital investment cycles and ages of related assets among otherwise comparable companies in our industry. Adjusted EBITDA has limitations as an analytical tool and you should not consider them in isolation or as substitutes for any measure reported under GAAP. Adjusted EBITDA’s usefulness as performance measures as compared to net income is limited by the fact that EBITDA excludes the impact of interest expense, depreciation and amortization expense and taxes, and additionally excludes principal payments from DFL in the case of adjusted EBITDA. We borrow money in order to finance our operations; therefore, interest expense is a necessary element of our costs and ability to generate revenue. Similarly, our use of capital assets makes depreciation and amortization expense a necessary element of our costs and ability to generate income. In addition, since we are subject to state and federal income taxes, any measure that excludes tax expense has material limitations. Moreover, adjusted EBITDA is not calculated identically by all companies; therefore our presentation of adjusted EBITDA may not be comparable to similarly titled measures of other companies. Due to these limitations, we use adjusted EBITDA as a measure of performance only in conjunction with GAAP measures of performance, such as net income. The following table provides a |
35
Table of Contents
| reconciliation of adjusted EBITDA to net income, the most comparable performance measure under GAAP (in thousands): |
| Successor | Predecessor | ||||||||||||||||||||
| Year Ended December 31, | Three Months Ended December 31, 2006 |
Nine Months Ended September 30, 2006 |
Year Ended December 31, 2005 | ||||||||||||||||||
| 2009 | 2008 | 2007 | |||||||||||||||||||
| (Unaudited) | |||||||||||||||||||||
| Net income (loss) |
$ | 13,556 | $ | (26,953 | ) | $ | 19,047 | $ | 5,420 | $ | 10,364 | $ | 9,989 | ||||||||
| Add: |
|||||||||||||||||||||
| Net interest expense |
4,301 | 9,117 | 9,898 | 3,396 | 4,146 | 7,771 | |||||||||||||||
| Depreciation |
17,366 | 16,001 | 8,932 | 2,392 | 9,728 | 14,859 | |||||||||||||||
| Amortization of intangible assets and impairment of container rental equipment |
1,652 | 1,865 | 1,606 | 388 | 270 | 572 | |||||||||||||||
| Impairment of goodwill |
— | 50,247 | — | — | — | — | |||||||||||||||
| Income tax expense |
3,919 | 11,547 | 10,990 | 3,231 | 5,856 | 6,377 | |||||||||||||||
| EBITDA |
40,794 | 61,824 | 50,473 | 14,827 | 30,364 | 39,568 | |||||||||||||||
| Add- principal payments from direct finance leases |
5,532 | 6,563 | 3,991 | 794 | 2,959 | 2,817 | |||||||||||||||
| Adjusted EBITDA |
$ | 46,326 | $ | 68,387 | $ | 54,464 | $ | 15,621 | $ | 33,323 | $ | 42,385 | |||||||||
| (2) | Reflects the total number of TEUs in our managed or owned fleet, as applicable, as of the end of the period indicated, including units held for sale and units we have purchased but held at the manufacturer. |
| (3) | Long-term leases comprise leases that had a contractual term in excess of twelve months at the time of inception of the leases, including leases that permit cancellation by the lessee within 12 months if penalties are paid, and leases that have exceeded their initial contractual term of 12 months or greater. Short-term leases comprise leases that had a contractual term of 12 months or less at the time of inception of the leases. |
| (4) | Reflects the average number of TEUs in our fleet on lease as a percentage of total TEUs available for lease. In calculating TEUs available for lease, we exclude units for sale and units held at the manufacturer that we have purchased. The utilization rate for a period is calculated by averaging the utilization rates at the end of each calendar month during the period. See “Management Discussion and Analysis of Financial Condition and Results of Operations” for a discussion of the calculation of our utilization rate. |
36
Table of Contents
| ITEM 7. | MANAGEMENT’S DISCUSSION AND ANALYSIS OF FINANCIAL CONDITION AND RESULTS OF OPERATIONS |
The following discussion and analysis of our financial condition and results of operations should be read in conjunction with our audited consolidated financial statements and related notes thereto. In addition to historical consolidated financial information, the following discussion contains forward-looking statements that reflect our plans, estimates and beliefs. Our actual results may differ materially from those contained in or implied by any forward-looking statements. See “Special Note Regarding Forward-Looking Statements.” Factors that could cause or contribute to these differences include those discussed below and elsewhere in this 10-K filing, particularly in “Risk Factors.”
The financial information included in this discussion and in our consolidated financial statements may not be indicative of our consolidated financial position, operating results, changes in equity and cash flows in the future, or what they would have been had our equity structure not changed during the periods presented.
Overview
We are one of the world’s leading container leasing and management companies. We purchase new containers, lease them to container shipping lines, freight forwarders and others and either retain them as part of our owned fleet or sell them to container investors for whom we then provide management services. In operating our fleet, we lease, re-lease and dispose of containers and contract for the repair, repositioning and storage of containers. As of December 31, 2009, our fleet comprised 743,000 TEUs, 68.4% of which represented our managed fleet and 31.6% of which represented our owned fleet.
We plan to increase both the number of owned containers as well as the number of managed containers in our fleet. During the year ended December 31, 2009, we paid $31.3 million to purchase additional containers. We believe it is important to maintain a balance between the size of our owned fleet and our managed fleet to preserve our strength of having multiple sources of revenue.
Our business comprises two reportable segments for financial statement reporting purposes—container management and container leasing. Our container leasing segment revenue comprises container rental revenue and finance lease income from our owned fleet and our container management segment revenue comprises gain on sale of container portfolios and management fee revenue for managing containers for container investors. For the years ended December 31, 2009, 2008 and 2007, our container leasing segment generated income before income taxes of $19.7 million, $9.5 million and $15.6 million, respectively. Our container management segment generated a loss before income taxes of $2.3 million, loss before income taxes of $25.1 million and income before income taxes of $14.3 million for the years ended December 31, 2009, 2008 and 2007, respectively. The loss incurred by our container management segment for the year ended December 31, 2009 is primarily due to a $3.4 million decline in management fee revenue and $11.7 million decrease in gain on sale of container portfolios. The loss incurred by our container management segment for the year ended December 31, 2008 is primarily attributable to the impairment of goodwill of $50.2 million, out of which $36.4 million had been allocated to the segment. The goodwill was originally recorded in October 2006 as a result of the application of pushdown accounting and step acquisition accounting relating to our repurchase of our common stock previously held by Interpool. The non-cash charge had no impact on our liquidity and on our performance covenants in our debt agreements. Our goodwill impairment charge is discussed in more detail in the “Operating Expenses” section below and in Note 5 to our consolidated financial statements included in this 10-K filing.
Our revenue depends primarily upon a combination of: (1) the number of containers in our fleet; (2) the utilization level of containers in our fleet; and (3) the per diem rates charged under each container lease. These factors directly affect the amount of our container rental revenue and indirectly affect the amount of our management fee revenue. The number of TEUs in our fleet varies over time as we purchase new containers based on prevailing market conditions during the year, sell portfolios of containers to container investors and sell used containers to parties in the secondary resale market. The timing of our orders and the actual number of TEUs we
37
Table of Contents
order at any one time are based upon our expectations for the three to six months for demand for containers, new container prices, per diem rates, interest rates, container investor interest in purchasing leased containers and competitive conditions. The time between the date we take delivery of a container and the date we begin to recognize revenue from a container can vary substantially. If we take delivery of a container before we are able to lease it, our operating results could be adversely affected until the container is either leased or sold.
Our net income will fluctuate based, in part, upon changes in the proportion of our revenue from our container management segment and the proportion of our revenue from our container leasing segment. We incur significantly lower operating expenses in connection with the revenues from our container management segment as compared to the operating expenses associated with revenues from our container leasing segment. In particular, we recognize an insignificant amount of operating expense in connection with our gain on sale of container portfolios. As a result, a change in the amount of revenues from our container management segment typically will have a disproportionately larger impact on our net income than an equal change in the amount of revenue from our container leasing segment.
Factors Affecting Our Performance
We believe there are a number of factors that have affected, and are likely to continue to affect, our operating performance. These factors include the following, among others:
| • | the strength of global and regional economies and their ability to recover from the current recession; |
| • | changes in the amount of gain we can realize on sales of portfolios of leased containers to container investors; |
| • | changes in demand for container leases; |
| • | changes in the mix of short-term versus long-term leases; |
| • | changes in the per diem rates for leases; |
| • | changes in the number of containers in our owned fleet; |
| • | defaults by container lessees; |
| • | economic disruptions, health scares, financial turmoil and political instability; |
| • | terrorism, or the threat of terrorism, violence or hostilities that affect the flow of world trade and the demand for containers; |
| • | the development of emerging economies in Asia and other parts of the world and the resulting change in trade patterns; |
| • | fluctuations in interest rates; |
| • | increased competition; and |
| • | loss of key members of our senior management. |
For further details of these and other factors which may affect our business and results of operations, see “Risk Factors”.
Key Financial Metrics
Utilization. We measure utilization on the basis of TEUs on lease expressed as a percentage of our total fleet available for lease. We calculate TEUs available for lease by excluding containers that have been manufactured for us but have not been delivered and containers designated as held-for-sale units. We calculate our utilization rate for a period by averaging the utilization rates at the end of each calendar month during the
38
Table of Contents
period. Our utilization is primarily driven by the overall level of container demand, the location of our available containers and the quality of our relationships with container lessees. The location of available containers is critical because containers available in high-demand locations are more readily leased and are typically leased on more favorable terms than containers available in low-demand locations.
The container leasing market is highly competitive. As such, our relationships with our container lessees are important to ensure that container shipping lines continue to select us as one of their providers of leased containers. The global economic recession has led to a decline in world trade and secondary sales of containers and have adversely impacted our average container utilization rate which has declined from 95.1% in the third quarter of 2008 to 81.9% during the fourth quarter of 2009. Our annual average fleet utilization rate for the year ended December 31, 2009 was 82.2% compared to 94.3% for the years ended December 31, 2008 and 2007. However, utilization rate has shown signs of stability during the last three months of 2009 and its continued increase will depend on future global economic conditions and the additional supply of new containers.
Per Diem Rates. The per diem rate for a lease is set at the time we enter into a lease agreement. Our long-term per diem rate has historically been strongly influenced by new container pricing (which in turn is heavily influenced by steel and other component pricing), interest rates, the balance of supply and demand for containers at a particular time and location, our estimate of the residual value of the container at the end of the lease, the type and age of the container being leased, purchasing activities of containers by container shipping lines and efficiencies in container utilization by container shipping lines. Average per diem rates for containers in our owned fleet and in the portfolios of containers comprising our managed fleet change only slightly in response to changes in new container prices because existing lease agreements can only be re-priced upon the expiration of the lease. Average per diem rates per TEU for long-term leases for our total fleet for the year ended December 31, 2009 increased by 0.4% while average per diem rates for long-term leases for the year ended December 31, 2008 decreased by 0.8% from the prior year. Average per diem rates per TEU for short-term leases in our total fleet decreased by 13.6% for the year ended December 31, 2009, as compared to the prior year, and increased by 0.7% for the year ended December 31, 2008 as compared to the year ended December 31, 2007.
Revenue
Our revenue comprises container rental revenue, management fee revenue, gain on sale of container portfolios and finance lease income.
Container Rental Revenue. We generate container rental revenue by leasing our owned containers to container shipping lines. Container rental revenue comprises monthly lease payments due under the lease agreements together with payments for other charges set forth in the leases, such as handling fees, drop-off charges and repair charges.
Management Fee Revenue. Management fee revenue is generated by our management services, which include the leasing, re-leasing, repair, repositioning, storage and disposition of containers. We provide these management services pursuant to management agreements with container investors that purchase portfolios of containers from us. Under these agreements, we earn fees for the management of the containers and a commission, or managed units’ sales fee, upon disposition of containers under management. The management agreements typically have terms of 10 years. Our management fees are calculated as a percentage of net operating revenue for each managed container, which is calculated as the lease payment and any other revenue attributable to a specific container owned by the container investor under a lease minus operating expenses related to the container but does not include the container investor’s depreciation or financing expense. The management fee percentage varies based upon the type of lease and the terms of the management agreement. Management fee percentages for long-term leases are generally lower than management fee percentages for short-term leases because less management time is required to manage long-term leases. The managed units’ sales fees are equal to a fixed dollar amount or based upon a percentage of the sales price.
39
Table of Contents
During the year ended December 31, 2009, the Company did not meet certain performance criteria in some of its container management contracts. The Company believes that these instances of nonperformance were due principally to general economic conditions and not specifically to the Company’s capabilities as equipment manager. As a result of the global economic impacts on the container industry, the expense of changing equipment managers and the Company’s prior experience with container investors, the Company does not expect any container investors to terminate their container management agreements with the Company. Total revenue for the year ended December 31, 2009 would have been approximately 4.6% lower if such container management contracts had been terminated for not meeting the agreed upon performance levels.
Gain on Sale of Container Portfolios. Gain on sale of container portfolios is generated when we sell containers, most of which are on lease at the time of sale, to container investors. Historically, we have entered into management agreements with container investors to manage the portfolios of containers that we have sold to them. The amount of revenue we recognize on these sales of containers is equal to the difference between the cash we receive from container investors and the net book value of the containers sold. We rely upon our borrowing capacity under our senior secured credit facility for the flexibility to hold containers until we sell them to container investors. We have historically been able to sell leased containers to container investors at a gain, and we have typically recognized higher revenue from gain on sale of container portfolios in periods of rising container prices. Because we enter into firm purchase orders for containers before we begin finding lessees for the containers, there is a risk that the time necessary to lease these containers may be much longer than we anticipate or that the price that container investors are willing to pay for portfolios of containers may decline before we take delivery. The price that a container investor is willing to pay for a portfolio of containers depends on a number of factors, including the historical and future expected cash flows from the portfolio to the container investor, the credit ratings of the lessees, the mix of short-term and long-term leases, the number of TEUs in the portfolio, the timing of the sale and alternative investment opportunities available to the container investor. If any of these factors change unexpectedly during the period between the date of our purchase order to the date a container investor purchases the container from us, we may recognize a lower gain on sale of the containers to investors, sell them to container investors at a loss or retain them as part of our owned fleet.
Finance Lease Income. A small percentage of our total fleet is subject to finance leases. Under a finance lease, the lessee’s payment consists of principal and interest components. The interest component is recognized as finance lease income. Lessees under our finance leases have the substantive risks and rewards of container ownership and may have the option to purchase the containers at the end of the lease term for a nominal amount.
Operating Expenses
Our operating expenses are depreciation of container rental equipment, impairment of container rental equipment, amortization of intangible assets, equipment rental expense, storage, handling and other expenses applicable to our owned containers as well as marketing, general and administrative expenses for our total fleet.
We depreciate most of our containers on a straight line basis over a period of 12.5 years to a fixed residual value. We regularly assess both the estimated useful life of our containers and the expected residual values, and, when warranted, adjust our depreciation estimate accordingly. Depreciation of container rental equipment expense will vary over time based upon the number and the purchase price of containers in our owned fleet. Depreciation expense in 2009 increased due primarily to the full year impact of our acquisition of Consent and the greater percentage of newer containers in our owned fleet. For the years ended December 31, 2009 and 2008, our depreciation expense for containers was $17.1 million and $15.8 million, respectively. Approximately $1.0 million of the increase in 2009 was primarily due to the acquisition of Consent in April 2008.
We recognize an impairment charge equal to the amount by which the carrying amount of the asset exceeds the fair value of the asset if the carrying amount of a container held for sale exceeds the estimated future cash flows from that container. See “Critical Accounting Policies and Estimates.”
40
Table of Contents
Equipment rental expense represents the amount that we pay to third parties to lease containers that we sublease to container shipping lines. There were no containers in our fleet that were leased to us under operating leases during all of 2009.
Storage, handling and other expenses are operating costs of our owned fleet. Storage and handling expenses occur when container shipping lines drop off containers at depots around the world. Storage and handling expenses vary significantly by location. Other expenses include repair expenses, which are the result of normal wear and tear on the containers, and repositioning expenses, which are incurred when we contract to move containers from locations where our inventories exceed actual or expected demand to locations with higher demand. Storage, handling and other expenses are directly related to the number of containers in our owned fleet and inversely related to our utilization rate for those containers. As utilization increases, we typically have lower storage, handling and repositioning expenses.
Our marketing, general and administrative expenses are primarily employee-related costs such as salary, bonus and commission expense, employee benefits, rent, allowance for doubtful accounts and travel and entertainment costs, as well as expenses incurred for outside services such as legal, consulting and audit-related fees.
During the year ended December 31, 2008, we recognized a goodwill impairment charge of $50.2 million. The goodwill impairment charge was primarily a result of the material decline in the market value of our equity during the fourth quarter of 2008 due to the expected downturn in future economic activity as a result of the global recession and adverse capital market conditions. The impaired goodwill was associated with our repurchase in October, 2006 of the shares of common stock previously held by Interpool, Inc. The amount of the impairment was determined using a combination of the cost, income and market approaches to estimate the fair value of our intangible and goodwill assets, resulting in our recognizing a $50.2 million impairment charge for the year ended December 31, 2008 (See Note 5 to our consolidated financial statements).
In October 2009 we commenced moving Consent’s operations in Sweden to our European office in the United Kingdom. We recorded a restructuring charge of $972,000 for the year ended December 31, 2009 covering salaries and extended fringe benefits of terminated employees. The move was completed in February 2010.
Our operating expenses are offset by gain on disposition of used container equipment. This gain is the result of our sale of older used containers in the secondary resale market and is the difference between: (1) the cash we receive for these units, less selling expenses; and (2) the net book value of the units.
41
Table of Contents
Results of Operations
The following table summarizes our results of operations for the three years ended December 31, 2009, 2008, and 2007:
| Year Ended December 31, | ||||||||||||
| 2009 | 2008 | 2007 | ||||||||||
| (in thousands) | ||||||||||||
| Revenue: |
||||||||||||
| Container rental revenue |
$ | 53,747 | $ | 56,436 | $ | 38,148 | ||||||
| Management fee revenue |
8,546 | 11,969 | 12,663 | |||||||||
| Gain on sale of container portfolios |
753 | 12,443 | 12,855 | |||||||||
| Finance lease income |
2,218 | 2,297 | 1,206 | |||||||||
| Total revenue |
65,264 | 83,145 | 64,872 | |||||||||
| Operating expenses: |
||||||||||||
| Depreciation of container rental equipment |
17,140 | 15,824 | 8,805 | |||||||||
| Amortization of intangible assets |
1,566 | 1,534 | 1,241 | |||||||||
| Impairment of container rental equipment |
86 | 331 | 365 | |||||||||
| Gain on disposition of used container equipment |
(3,626 | ) | (4,155 | ) | (4,400 | ) | ||||||
| Gain on settlement of lease obligation |
— | — | (780 | ) | ||||||||
| Equipment rental expense |
— | 20 | 961 | |||||||||
| Storage, handling and other expenses |
8,717 | 4,854 | 3,077 | |||||||||
| Marketing, general and administrative expenses |
18,848 | 20,215 | 15,772 | |||||||||
| Impairment of goodwill |
— | 50,247 | — | |||||||||
| Restructuring charges |
972 | |||||||||||
| Loss (gain) on foreign exchange |
(215 | ) | 564 | (104 | ) | |||||||
| Total operating expenses |
43,488 | 89,434 | 24,937 | |||||||||
| Operating income (loss) |
21,776 | (6,289 | ) | 39,935 | ||||||||
| Net interest expense |
4,301 | 9,117 | 9,898 | |||||||||
| Income (loss) before income taxes |
17,475 | (15,406 | ) | 30,037 | ||||||||
| Income tax expense |
3,919 | 11,547 | 10,990 | |||||||||
| Net income (loss) |
$ | 13,556 | $ | (26,953 | ) | $ | 19,047 | |||||
Year Ended December 31, 2009 Compared to Year Ended December 31, 2008
Revenue.
The composition of our revenue is shown on our consolidated statements of operations included in this filing. The following discussion explains the significant changes in the composition of our total revenue for the year ended December 31, 2009 as compared to the year ended December 31, 2008:
Container Rental Revenue. Container rental revenue decreased $2.7 million, or 4.8%, to $53.7 million for the year ended December 31, 2009 from $56.4 million for the year ended December 31, 2008. The decrease in container rental revenue was principally due to the lower TEUs and utilization rate of our owned containers and lower average per diem rate for short term leases. This was partly offset by higher average per diem rate for long-term leases and the full year impact of Consent’s revenue compared to eight months in 2008. The average TEU’s of owned containers during 2009 declined 7.8% from 2008 while average utilization rate of our owned containers during 2009 decreased 10.1% from the same period last year. The average per diem rates for short-term leases for the year ended December 31, 2009 decreased by 13.6% as compared to the year ended December 31, 2008. The average per diem rates for our long-term leases during 2009 was approximately 0.4% higher than those of 2008. Approximately 78% of our billed TEUs during 2009 was for long-term leases compared to 70% during 2008.
42
Table of Contents
Management Fee Revenue. Management fee revenue for the year ended December 31, 2009 was $8.5 million, a decline of $3.4 million, or 28.6%, from $12.0 million for the same period in 2008. The lower utilization and increased expenses from storage costs resulted in lower profitability in most of our container investors’ portfolios. The lower profitability of most of our investor portfolios resulted in lower management fee income.
Gain on Sale of Container Portfolios. Gain on sale of container portfolios of $753,000 for the year ended December 31, 2009 was $11.7 million, or 93.9 %, less than the $12.4 million gain recognized for the year ended December 31, 2008. The decrease was due primarily to the decline in the number of TEUs of containers sold at a lower average margin per TEU during the year ended December 31, 2009 as compared to 2008.
Expenses.
Details of our operating expenses for the years ended December 31, 2009 and 2008 are shown on our statements of operations included in this filing. The following discussion explains the significant changes in expenses for the year ended December 31, 2009 as compared to the year ended December 31, 2008:
Depreciation of Container Rental Equipment. Depreciation of container rental equipment increased by $1.3 million, or 8.3%, to $17.1 million for the year ended December 31, 2009, from $15.8 million for the year ended December 31, 2008. This increase was primarily due to the full year impact of our acquisition of Consent and to the greater impact of newer containers in our owned fleet.
Impairment of Container Rental Equipment. Impairment of container rental equipment decreased $245,000, or 74.0%, to $86,000 for the year ended December 31, 2009 from $331,000 during same period in 2008. The decrease was due primarily to the lower number of containers that were deemed impaired during the year ended December 31, 2009 as compared to fiscal 2008. The secondary sales price for most container categories has remained above the carrying value of our containers held for sale.
Gain on Disposition of Used Container Equipment. Gain on disposition of used container equipment decreased by $529,000, or 12.7%, to $3.6 million for the year ended December 31, 2009, from $4.1 million for the year ended December 31, 2008. The decrease primarily resulted from the lower margin on the sale of used containers which offset the higher volume of used containers sold during the year ended December 31, 2009 as compared to the same period in 2008.
Storage, Handling and Other Expenses. Storage, handling and other expenses increased by $3.8 million, or 78.8%, to $8.7 million for the year ended December 31, 2009, from $4.9 million for the year ended December 31, 2008. The decrease in utilization rate of our owned containers has resulted in higher storage and handling costs due to the increased volume of units in storage during the year ended December 31, 2009 as compared to the prior year.
Restructuring Charges. In October 2009 we commenced moving Consent’s operations in Sweden to our European office in the United Kingdom. We recorded a restructuring charge of $972,000 for the year ended December 31, 2009 covering salaries and extended fringe benefits of terminated employees. The move was completed in February 2010.
Gain /loss on foreign exchange. We recorded a gain of $215,000 on foreign exchange transactions for the year ended December 31, 2009 compared to a loss of $564,000 during the year ended December 31, 2008. The gain on foreign currency primarily resulted from subsidiaries settling contracts denominated in U.S. dollars and remeasured liabilities denominated in U.S. dollars. The average exchange rates of the Euros and British Pound Sterling to U.S. dollar increased over the course of the year ended December 31, 2009 compared to the year ended December 31, 2008.
43
Table of Contents
Net Interest Expense. Net interest expense of $4.3 million for the year ended December 31, 2009 decreased $4.8 million, or 52.8%, from $9.1 million incurred during the year ended December 31, 2008. The decrease in net interest expense was due primarily to the lower interest expense resulting from lower interest rates and a lower average balance of our debts. This was partly offset by a $219,000 decrease in interest income.
Income Tax Expense. Income tax expense for the year ended December 31, 2009 was $3.9 million, a $7.6 million, or a 66.1%, decrease from $11.5 million for the year ended December 31, 2008. The decrease was due primarily to a 49.8% decrease in pretax income after adjusting for goodwill impairment and lower effective tax rate. Our effective tax rate for the year ended December 31, 2009 was 22.4% compared to 33.1% for the year ended December 31, 2008. The lower effective tax rate for the year ended December 31, 2009 as compared to the year ended December 31, 2008 is due primarily to higher proportion of pretax income coming from foreign operations where statutory rates are lower than the U.S. income tax rates. During the year ended December 31, 2009, the Company recorded a $138,000 adjustment to income tax expense to correct a purchase accounting entry relating to the acquisition of Consent in April 2008, and a $285,000 one-time tax benefit relating to the finalization of our 2008 income tax returns. These adjustments reduced the Company’s income tax expense by $423,000 during the year ended December 31, 2009. Without these adjustments our effective tax rate for this period would have been 24.8%.
Segment Information. The following table summarizes our results of operations for each of our business segments for the years ended December 31, 2009 and 2008:
| Year Ended December 31, |
Percent Change |
||||||||||
| 2009 | 2008 | ||||||||||
| (in thousands) | |||||||||||
| Container Leasing |
|||||||||||
| Total revenue |
$ | 55,965 | $ | 58,733 | (4.7 | )% | |||||
| Operating expenses |
31,921 | 26,034 | 22.6 | ||||||||
| Impairment of goodwill |
— | 13,849 | (100.0 | ) | |||||||
| Interest expense |
4,311 | 9,346 | (53.9 | ) | |||||||
| Income before taxes attributable to segment |
$ | 19,733 | $ | 9,504 | 107.6 | ||||||
| Container Management |
|||||||||||
| Total revenue |
$ | 9,299 | $ | 24,412 | (61.9 | ) | |||||
| Operating expenses |
11,567 | 13,153 | (12.1 | ) | |||||||
| Impairment of goodwill |
— | 36,398 | (100.0 | ) | |||||||
| Income (loss) before taxes attributable to segment |
$ | (2,268 | ) | $ | (25,139 | ) | (91.0 | ) | |||
Container Leasing. Total revenue from our container leasing segment for the year ended December 31, 2009 decreased $2.8 million, or 4.7%, to $56.0 million for the year ended December 31, 2009 from $58.7 million for the year ended December 31, 2008. The decrease in container rental revenue was principally due to the lower TEUs and utilization rate of our owned containers and lower average per diem rate for short term leases. This was partly offset by higher average per diem rate for long-term leases. Total operating expenses excluding impairment of goodwill for the container leasing segment increased $5.9 million, or 22.6%, to $31.9 million for the year ended December 31, 2009 from $26.0 million for the year ended December 31, 2008. The increase was primarily due to higher storage, handling and repairs expenses resulting from the decline in the average utilization of our owned containers, increase in depreciation expense attributable to newer containers and to the acquisition of Consent, and restructuring charges in December 2009 relating to the move of Consent’s operations in Sweden to our office in the United Kingdom.
Interest expense for the year ended December 31, 2009 decreased $5.0 million, or 53.9%, to $4.3 million compared to $9.3 million for the same period last year. The decrease in interest expense was due primarily to lower interest rates and a lower average debt balance.
44
Table of Contents
Container Management. Total revenue from our container management segment for the year ended December 31, 2009 was $9.3 million, a decrease of $15.1 million, or 61.9%, from $24.4 million for the year ended December 31, 2008. This decrease in revenue was primarily attributable to an $11.7 million, or 93.9%, decrease in gain on sale of container portfolios, and the $3.4 million, or 28.6%, decline in management fee revenue compared to the year ended December 31, 2008. The decrease in gain on sale of container portfolios was due to the fewer number of TEUs of containers sold during the 2009 as compared to the same period in 2008. The lower utilization and increased expenses from storage costs resulted in lower profitability within some of our container investors’ portfolios which led to lower management fee income.
Total operating expenses excluding impairment of goodwill for the container management segment for the year ended December 31, 2009 decreased $1.6 million, or 12.1%, to $11.6 million from $13.2 million for the same period last year. The decrease was due primarily to lower marketing, general and administrative expense resulting from reductions in legal, accounting and audit related fees.
The container management segment incurred a loss of $2.3 million during the year ended December 31, 2009 as compared to income (excluding impairment of goodwill) of $11.3 million for the year ended December 31, 2008. The loss during 2009 was primarily attributable to the fewer number of containers sold to investors resulting in a $11.7 million decline in the gain on sale of container portfolios. Additionally, the lower average utilization of our managed containers has reduced the profitability of most of our investor portfolios resulting in a decrease of $3.4 million in management fee revenue during the year ended December 31, 2009 as compared to the year ended December 31, 2008.
Year Ended December 31, 2008 Compared to Year Ended December 31, 2007
Revenues
Container Rental Revenue. Container rental revenue increased $18.3 million, or 47.9%, to $56.4 million for the year ended December 31, 2008 from $38.1 million for the year ended December 31, 2007. The increase in container rental revenue was principally due to an increase in the average number of TEUs on lease in our owned fleet, including the acquisition of Consent’s fleet. Consent’s operations accounted for $8.2 million of the increase in container rental revenue. Excluding revenues from Consent’s operations, container rental revenues for the year ended December 31, 2008 increased $10.1 million, or 26.1% from the prior year primarily due to a 25.6% increase in the average number of TEU’s of owned containers on lease as compared to the year ended December 31, 2007. The average utilization of our owned fleet was essentially unchanged from the same period last year.
Management Fee Revenue. Management fee revenue for the year ended December 31, 2008 was $12.0 million, a decline of $694,000, or 5.5%, from $12.7 million for the same period in 2007. The decrease was primarily attributable to the lower commission fees earned on used containers sold by us on behalf of our investors as compared to the year ended December 31, 2007.
Gain on Sale of Container Portfolios. Gain on sale of container portfolios for the year ended December 31, 2008 was $12.4 million, a $412,000, or 3.2 %, decrease from the gain of $12.9 million realized for the year ended December 31, 2007. The decrease was due primarily to lower volume of containers sold during fiscal 2008 as compared to the same period in 2007.
Finance Lease Income. Finance lease income increased $1.1 million, or 90.5%, to $2.3 million for the year ended December 31, 2008 from $1.2 million for the year ended December 31, 2007. This increase was primarily due to finance lease income associated with additional new contracts for direct finance leases and a 13.4% increase in average per diem rate, partly offset by reduction in the principal balance of existing direct finance leases.
45
Table of Contents
Expenses
Details of our operating expenses for the years ended December 31, 2008 and 2007 are shown on our statements of operations included in this filing. The following discussion explains the significant changes in expenses for the year ended December 31, 2008 as compared to the year ended December 31, 2007:
Depreciation of Container Rental Equipment. Depreciation of container rental equipment increased by $7.0 million, or 79.7%, to $15.8 million for the year ended December 31, 2008, from $8.8 million for the year ended December 31, 2007. This increase was primarily attributable to our fleet growth, greater percentage of newer containers in our owned fleet and the acquisition of Consent’s fleet during the second quarter of 2008.
Amortization of Intangible Assets. Amortization expense relating to intangible assets for the year ended December 31, 2008 increased $293,000, or 23.6%, to $1.5 million from $1.2 million during the same period last year. The increase resulted primarily from the intangible assets recorded in connection with the acquisition of Consent on April 30, 2008.
Impairment of Container Rental Equipment. Impairment of container rental equipment held for sale decreased $34,000, or 9.3%, to $331,000 for the year ended December 31, 2008 from $365,000 during the year ended December 31, 2007. The decrease was due primarily to the lower number of TEUs of containers impaired during 2008 as compared to 2007.
Gain on Disposition of Used Container Equipment. Gain on disposition of used container equipment decreased $245,000, or 5.6%, to $4.2 million for the year ended December 31, 2008 from $4.4 million for the year ended December 31, 2007. The decrease was due primarily to the lower margin on the sale of used containers during the year ended December 31, 2008 as compared to the same period in 2007.
Gain on Settlement of Lease Obligation. During the year ended December 31, 2007, the Company recognized a gain of $780,000 upon settling its liabilities related to lost, damaged or sold equipment that had been on operating leases from a lessor. The settlement amount related to the termination of the operating leases with the lessor. No such settlement occurred during the year ended December 31, 2008. Included within the gain on settlement of lease obligation in 2007 were gains totaling $153,000 that arose in prior periods but had not been previously recorded.
Equipment Rental Expense. Equipment rental expense was $20,000 for the year ended December 31, 2008, a $941,000, or 97.9%, decrease from $961,000 expense for the year ended December 31, 2007. We terminated all of our operating leases and purchased the last of the rented units in February 2008.
Storage, Handling and Other Expenses. Storage, handling and other expenses increased by $1.8 million, or 57.8%, to $4.9 million for the year ended December 31, 2008, compared to $3.1 million for the year ended December 31, 2007. The increase was primarily attributable to the operations of Consent, the increase in our owned fleet and the higher overseas storage and handling costs due to the weakening of the U.S. dollar during most of 2008.
Marketing, General and Administrative Expenses. Marketing, general and administrative expenses increased by $4.4 million or 28.2%, to $20.2 million for the year ended December 31, 2008, from $15.8 million for the year ended December 31, 2007. The increase in marketing, general and administrative expenses was driven primarily by higher payroll costs resulting from an increase in personnel and incentive compensation, and higher legal and accounting fees. Additionally, costs relating to our foreign operations, including additional expenses associated with the operations of Consent, have increased due to the weakening of the U.S. dollar during most of 2008.
Impairment of Goodwill. During the year ended December 31, 2008, we recognized a goodwill impairment charge of $50.2 million. The goodwill charge was primarily a result of the material decline in the market value of
46
Table of Contents
our equity during the fourth quarter of 2008 due to the expected downturn in future economic activity as a result of the global recession and adverse capital market conditions (see Note 4 to our consolidated financial statements).
Loss (gain) on foreign exchange. We incurred a loss of $564,000 on foreign exchange transactions for the year ended December 31, 2008 compared to a gain of $104,000 during the year ended December 31, 2007. The loss resulted primarily from certain liabilities denominated in a currency other than the Company’s functional currency, whereby changes in the foreign currency exchange rate resulted in the recognition of a loss as of December 31, 2008. The Euro and British Pound Sterling are the functional currencies used in the operations of Consent and our UK subsidiary, respectively. Losses on foreign currency occurred when Consent and our U.K. subsidiary settled contracts denominated in U.S. dollars and remeasured liabilities denominated in U.S. dollars. The exchange rate of the Euro in relation to the U.S. dollar has declined at December 31, 2008 from the time we acquired Consent in April 2008. The average exchange rate for the British Pound Sterling to U.S. dollar declined over the course of the year ended December 31, 2008 compared to the same period last year.
Net Interest Expense. Net interest expense for the year ended December 31, 2008 was $9.1 million, a decrease of $781,000, or 7.9%, from $9.9 million of net interest expense for the year ended December 31, 2007. The decrease in interest expense was due primarily to the decrease in Eurodollar indexed interest rates and the repayment of the Company’s subordinated convertible note (which had a higher interest rate) in May 2007. Additionally, during the year ended December 31, 2007, we recorded a gain of $681,000 on the extinguishment of our $37.5 million convertible note to Interpool, which offset part of 2007 interest expense for the year ended December 31, 2007.
Income Tax Expense. Income tax expense increased $557,000, or 5.1%, to $11.5 million for the year ended December 31, 2008 from $11.0 million for the year ended December 31, 2007. The increase was primarily driven by a 16% increase in adjusted pre-tax income (after excluding the goodwill impairment charge of $50.2 million) for the year ended December 31, 2008 as compared to the year ended December 31, 2007. This was partly offset by a lower effective tax rate of 33.1% for the year ended December 31, 2008 compared to 36.6% for the year ended December 31, 2007. The lower effective tax rate for the year ended December 31, 2008 as compared to the year ended December 31, 2007 is due primarily to greater income before taxes from foreign operations where statutory rates are lower than the U.S. income tax rates.
Segment Information. The following table summarizes our results of operations for each of our business segments for the year ended December 31, 2008 and 2007:
| Year Ended December 31, |
Percent Change |
|||||||||
| 2008 | 2007 | |||||||||
| (in thousands) | ||||||||||
| Container Leasing |
||||||||||
| Total revenue |
$ | 58,733 | $ | 39,354 | 49.2 | % | ||||
| Operating expenses |
26,034 | 13,706 | 89.9 | |||||||
| Impairment of goodwill |
13,849 | — | — | |||||||
| Interest expense |
9,346 | 10,024 | (6.8 | ) | ||||||
| Income before taxes attributable to segment |
$ | 9,504 | $ | 15,624 | (39.2 | ) | ||||
| Container Management |
||||||||||
| Total revenue |
$ | 24,412 | $ | 25,518 | (4.3 | ) | ||||
| Operating expenses |
13,153 | 11,231 | 17.1 | |||||||
| Impairment of goodwill |
36,398 | — | — | |||||||
| Income (loss) before taxes attributable to segment |
$ | (25,139 | ) | $ | 14,287 | (276.0 | ) | |||
47
Table of Contents
Container Leasing. Total revenue from our container leasing segment increased $19.4 million, or 49.2%, to $58.7 million for the year ended December 31, 2008 from $39.4 million during the year ended December 31, 2007. The increase was primarily due to a greater average number of TEUs on lease in our owned fleet and the acquisition of Consent which accounted for $8.2 million of the increase in revenue.
Total operating expenses excluding impairment of goodwill for the container leasing segment increased $12.3 million, or 89.9%, to $26.0 million for the year ended December 31, 2008 from $13.7 million for the year ended December 31, 2007. The increase was primarily due to the higher depreciation of container rental equipment arising from our fleet growth and greater percentage of newer containers in our owned fleet. In addition, all of Consent’s operating expenses were allocated to the container leasing segment. The higher percentage of owned average TEU’s also resulted in a higher allocation of marketing, general and administrative expense to the container leasing segment.
Interest expense for the year ended December 31, 2008 decreased $678,000, or 6.8%, to $9.3 million from $10.0 million for the year ended December 31, 2007. The decrease resulted primarily from lower Eurodollar indexed interest rates in 2008 and the repayment of the Company’s subordinated convertible note (which had a higher interest rate) in May 2007.
Container Management. Total revenue from our container management segment for the year ended December 31, 2008 was $24.4 million, which was $1.1 million, or 4.3%, lower than the $25.5 million of revenue from our container management segment for the year ended December 31, 2007. The lower revenue was primarily due to a $694,000, or 5.5%, decrease in management fee revenue and a $412,000, or 3.2%, decrease in gain on sale of container portfolios compared to the year ended December 31, 2007.
Total operating expenses excluding impairment of goodwill for the container management segment increased $1.9 million, or 17.1%, to $13.2 million for the year ended December 31, 2008 as compared to $11.2 million for the year ended December 31, 2007. The increase was due primarily to higher marketing, general and administrative expense driven primarily by an increase in payroll related expenses. Additionally, costs relating to our foreign operations have increased due to the weakening of the U.S. dollar during most of 2008.
Liquidity and Capital Resources
Our principal sources of liquidity have been cash flows from operations, sales of container portfolios, borrowings from financial institutions and sale of our common stock. We believe that cash flow from operations, future sales of container portfolios and borrowing availability under our senior secured credit facility are sufficient to meet our liquidity needs for at least the next 12 months.
We have typically funded a significant portion of the purchase price for new containers through borrowings under our senior secured credit facility. However, from time to time we have funded new container acquisitions through the use of working capital.
As of December 31, 2009, the maximum credit available under our existing senior secured credit agreement was $290.0 million. Our senior secured credit facility is secured by substantially all of our assets, including our containers and the underlying leases thereon and our interest in any money received under such contracts. The facility may be increased under certain conditions described in the agreement. In addition, there is a commitment fee on the unused amount of the total commitment, payable quarterly in arrears. The amended agreement provides that swing line loans (short-term borrowings of up to $10.0 million in the aggregate that are payable within 10 business days or at maturity date, whichever comes earlier) and standby letters of credit (up to $15.0 million in the aggregate) will be available to us. These credit commitments are part of, and not in addition to, the total commitment of $290.0 million. The interest rates vary depending upon whether the loans are characterized as Base Rate loans or Eurodollar Rate loans as defined in the senior secured credit facility. As of December 31, 2009 the interest rate on our senior secured credit facility was 1.3%. Our senior secured credit facility will expire on September 25, 2012.
48
Table of Contents
As of December 31, 2009, we had $137.4 million (net of $109,000 in letters of credit) in availability under our senior secured credit facility, subject to our ability to meet the collateral requirements under the agreement governing our senior secured credit facility. The entire amount of the facility drawn at any time plus accrued interest and fees is callable on demand in the event of certain specified events of default.
We intend to use our senior secured credit facility primarily to fund the purchase of containers in the future. We have typically used the proceeds from sales of container portfolios to container investors to repay our senior secured credit facility. As we expand our owned fleet, our senior secured credit facility balance will be higher and this will result in higher interest expense. In addition to customary events of default, our senior secured credit facility contains financial covenants that require us to maintain certain ratios in our financial statements. As of December 31, 2009, we were in compliance with the financial covenants in our senior secured credit facility.
Our capital leases are denominated in U.S. dollars and Euros, are financed by various European banks and financial institutions and secured by their underlying assets. As of December 31, 2009 our capital lease obligations totaled $20.1 million with fixed and floating interest rates averaging 2.5%. On August 20, 2009, we signed a $10.0 million, five-year loan agreement with Development Bank of Japan (DBJ). The loan is payable in 19 quarterly installments of $200,000 starting October 31, 2009 and a final payment of $6.2 million on July 31, 2014. The loan bears a variable interest rate based on BBA LIBOR and is secured by certain of our container rental equipment. The loan had a balance of $9.8 million as of December 31, 2009. DBJ owned approximately 9.4% of the Company’s outstanding common stock as of the date of closing of the loan agreement, and therefore, the loan is classified as a related party term loan.
Cash Flow
The following table sets forth certain cash flow information for the years ended December 31, 2009, 2008 and 2007:
| Year Ended December 31, | ||||||||||||
| 2009 | 2008 | 2007 | ||||||||||
| (in thousands) | ||||||||||||
| Net income (loss) |
$ | 13,556 | $ | (26,953 | ) | $ | 19,047 | |||||
| Adjustments to income (loss) |
17,242 | 54,391 | (19,313 | ) | ||||||||
| Net cash provided by (used in) operating activities |
30,798 | 27,438 | (266 | ) | ||||||||
| Net cash provided by (used in) investing activities |
3,688 | (77,606 | ) | (83,035 | ) | |||||||
| Net cash (used in) provided by financing activities |
(49,007 | ) | 70,663 | 71,369 | ||||||||
| Effect on cash of foreign currency translation |
478 | (393 | ) | 6 | ||||||||
| Net (decrease) increase in cash |
(14,043 | ) | 20,102 | (11,926 | ) | |||||||
| Cash at beginning of year |
28,535 | 8,433 | 20,359 | |||||||||
| Cash at end of year |
$ | 14,492 | $ | 28,535 | $ | 8,433 | ||||||
Operating Activities Cash Flows
Net cash provided by operating activities for the year ended December 31, 2009 increased $3.4 million from the year ended December 31, 2008. The increase was due primarily to higher net income as adjusted for non-cash items (i.e., depreciation amortization, bad debts, goodwill impairment, etc.) and increased collection of receivables, partly offset by increased payments to investors. Operating cash flows for the year ended December 31, 2008 increased $27.7 million from the year ended December 31, 2007 due to primarily to an increase in adjusted net income and a reduction in the payments of accounts payable.
49
Table of Contents
Investing Activities Cash Flows
Net cash provided by investing activities for the year ended December 31, 2009 was $3.7 million compared to a net cash usage of $77.6 million for the year ended December 31, 2008. The $81.3 million change in cash derived from investing activities was due primarily to a $158.3 million reduction in the purchase of containers, partly offset by a $93.9 million decrease in the proceeds from sale of containers to investors. Net cash used in investing activities for the year ended December 31, 2008 decreased $5.4 million from the same period in 2007 due primarily to a $29.9 million decrease in the purchase of containers and a $2.6 million increase in the receipt of principal payments for direct financing leases, partly offset by the $14.6 million used to purchase Consent and $13.6 million reduction in proceeds from the sale of container portfolios.
Financing Activities Cash Flows
Net cash used in financing activities for the year ended December 31, 2009 was $49.0 million compared to net cash provided from financing activities of $70.7 million for the same period in 2008. The net change of $119.7 million was primarily attributable to the reduction in borrowings from our senior secured credit facility. The principal payments made for our long-term obligations during 2009 were a similar amount to the total amount that we paid in 2008.
Net cash provided by financing activities for the year ended December 31, 2008 was $70.7 million compared to $71.4 million for the year ended December 31, 2007. During the year ended December 31, 2008, we received $10.3 million of net proceeds (after deducting underwriting discounts and other offering expenses) from the issuance of 750,000 shares of our common stock compared to $78.1 million proceeds we received in the prior year from the issuance of 5.8 million shares of common stock. In addition to proceeds from sale of common stock, proceeds from bank debt were $134.6 million and $138.1 million for the year ended December 31, 2008 and 2007, respectively. These proceeds from the sale of stock and bank debt were partly offset by principal payments we made on bank debt and capital leases totaling $77.3 million and $106.8 million for the years ended December 31, 2008 and 2007, respectively. During both years, we used part of the proceeds from the sale of stock to repay part of our outstanding obligations under our senior secured credit facility. We also used part of the net proceeds from the issuance of our stock in 2007 to pay the $37.5 million convertible subordinated note payable to Interpool.
Contractual Obligations and Commercial Commitments
The following table sets forth our contractual obligations and commercial commitments by due date as of December 31, 2009 (in thousands):
| Payments Due by Period | ||||||||||||||
| Total | =<1 year | >1-2 years | >2-3 years | >3-4 years | >4-5 years | >5 years | ||||||||
| Total debt obligations: |
||||||||||||||
| Senior secured credit facility |
152,500 | — | — | 152,500 | — | — | — | |||||||
| DBJ Term Loan—Principal |
9,800 | 800 | 800 | 800 | 800 | 6,600 | — | |||||||
| Total Interest on Debt & Capital Lease(1) |
7,740 | 2,647 | 2,510 | 1,900 | 345 | 223 | 115 | |||||||
| Purchase obligations payable |
660 | 660 | — | — | — | — | — | |||||||
| Rent, office facilities and equipment |
1,415 | 930 | 276 | 145 | 64 | — | — | |||||||
| Capital lease obligations |
20,095 | 3,813 | 5,084 | 3,330 | 2,845 | 1,655 | 3,368 | |||||||
| Container purchases commitments |
2,554 | 2,554 | — | — | — | — | — | |||||||
| Total contractual obligations |
194,764 | 11,404 | 8,670 | 158,675 | 4,054 | 8,478 | 3,483 | |||||||
| (1) | Our estimate of interest expense commitment includes $5.3 million relating to our senior secured credit facility, $1.0 million relating to our related party term loan and $1.4 million relating to our capital lease |
50
Table of Contents
| obligations. The calculation of interest related to our senior secured credit facility assumes that the interest rate of 1.3% as of December 31, 2009 on our senior secured credit facility will remain at the same interest level over the next five years. We expect that the interest rate will vary over time based upon fluctuations in the underlying indexes upon which this interest rate is based. The interest relating to our term loan and capital lease obligations was based on an assumed weighted average interest rate as of December 31, 2009 of 2.7% and 2.5%, respectively, over the above periods. |
Our senior secured credit facility provides for a maximum total commitment amount of up to $290.0 million in revolving line of credit. Loans under the senior secured credit facility bear interest at variable rates based on the Eurodollar rate or a Base Rate as defined in our amended agreement, plus a margin that adjusts depending on a certain financial criterion. In addition, there is a commitment fee on the unused amount of the total commitment which is payable quarterly in arrears. The senior secured credit facility provides that swing line loans (up to $10.0 million in the aggregate) and standby letters of credit (up to $15.0 million in the aggregate) will be available to us. These credit commitments are part of, and not in addition to, the total commitment of $290.0 million under our senior secured credit facility. As of December 31, 2009, there was a balance of $152.5 million on the senior secured credit facility which will expire on September 25, 2012.
Off-Balance Sheet Arrangements
As of December 31, 2009, we had no off-balance sheet arrangements or obligations other than noted below. An off-balance sheet arrangement includes any contractual obligation, agreement or transaction arrangement involving an unconsolidated entity under which we would have: (1) retained a contingent interest in transferred assets; (2) an obligation under derivative instruments classified as equity; (3) any obligation arising out of a material variable interest in an unconsolidated entity that provides financing, liquidity, market risk or credit risk support to us, or that engages in leasing, hedging or research and development services with us; or (4) made guarantees.
We sold fleets of dry van containers to Japanese entities that are owned 99% by Japan Investment Adviser Co., Ltd. (JIA) and 1% by CAIJ. CAIJ is an 80%- owned subsidiary of CAI with the remaining 20% owned by JIA. JIA is owned and controlled by a Managing Director of CAIJ. Prior to the purchase of containers from the Company, the purchasing entities had received contributions from unrelated Japanese investors, under separate Japanese investment agreements allowed under Japanese commercial laws. The investments were used to purchase container equipment from the Company. Under the terms of the agreement, the CAI related Japanese entities will manage each of the investments but may outsource the whole or part of each operation to a third party. The profit/loss from each investment will substantially belong to each respective investor. Pursuant to its services agreements with investors, the purchasing Japanese entities have outsourced the general management of the investment’s operations to CAIJ. The Japanese entities have also entered into equipment management service agreements whereby the Company will manage the leasing of equipment that it sold to the investors. The profit/loss from each investment will belong to its respective investor. (See Note 10 to our consolidated financial statements).
Critical Accounting Policies and Estimates
The preparation of financial statements in conformity with GAAP requires management to use judgment in making estimates and assumptions that affect reported amounts of assets and liabilities, the reported amounts of income and expense during the reporting period and the disclosure of contingent assets and liabilities as of the date of the financial statements. We have identified the policies and estimates below as critical to our business operations and the understanding of our results of operations. These policies and estimates are considered critical due to the existence of uncertainty at the time the estimate is made, the likelihood of changes in estimates from period to period and the potential impact that these estimates can have on our financial statements. Significant items subject to such estimates and assumptions include revenue recognition, valuation allowances for receivables, the carrying amount of container equipment, the residual values and lives of container equipment,
51
Table of Contents
impairment of goodwill and intangible assets, the carrying amount and lives of intangible assets, share based payments and income taxes. The following accounting policies and estimates include inherent risks and uncertainties related to judgments and assumptions made by us. Our estimates are based on the relevant information available at the end of each period. Actual results could differ from those estimates. The authoritative U.S. generally accepted accounting principles (GAAP) literatures when used as references herein are referred to as Accounting Standards Codification (“ASC”) as mandated by FASB ASU 2009-01, previously known as The FASB Accounting Standards Codification and the hierarchy of Generally Accepted Accounting Principles- a replacement of FASB Statement No. 162, effective for interim and annual reporting periods ending after September 15, 2009.
Revenue Recognition
We provide a range of services to our customers incorporating rental, sale and management of container equipment. Revenue for all forms of service is recognized when earned following the guidelines under FASB ASC 605-Revenue Recognition and ASC 840- Leases . Revenue is reported net of any related sales tax.
Container Rental Revenue. We recognize revenue from operating leases of our owned containers as earned over the term of the lease. Where minimum lease payments vary over the lease term, revenue is recognized on a straight-line basis over the term of the lease. We cease recognition of lease revenue if and when a container lessee defaults in making timely lease payments or we otherwise determine that future lease payments are not likely to be collected from the lessee. Our determination of the collectability of future lease payments is made by management on the basis of available information, including the current creditworthiness of container shipping lines that lease containers from us, historical collection results and review of specific past due receivables. If we experience unexpected payment defaults from our container lessees, we will cease revenue recognition for those leases which will reduce container rental revenue.
Finance Lease Income. Finance lease income is recognized using the effective interest method, which generates a constant rate of interest over the period of the lease. The same risks of collectability discussed above apply to our collection of finance lease income. If we experience unexpected payment defaults under our finance leases, we cease revenue recognition for those leases which will reduce finance lease income.
Management Fee Revenue and Gain on Sale of Container Portfolios. In addition to leasing owned containers we sell portfolios of containers to container investors. After the date of sale, we generally manage the containers sold to these container investors. As these arrangements contain multiple parts (the sale of an asset followed by the provision of management services), we evaluate if the sale of the container and the management services are separate units of accounting thereby requiring revenue to be recognized separately for each part of the arrangement.
One requirement for the two deliverables to be accounted for as separate units of accounting is that management can determine the fair value of the undelivered item (the management services), when the first item (the sale of containers) is delivered. Assessing fair value evidence requires judgment. In determining fair value we have reviewed information from management agreements entered into with container investors on a standalone basis, compared it to information from management agreements entered into with container investors to whom we concurrently sold portfolios of containers and determined that the fees we have charged to container investors who have entered into management agreements on a standalone basis were comparable to the fees we charged when we entered into management agreements with container investors concurrent with the sales of portfolios of containers. We have also reviewed information of other container management companies disclosed in publicly available documents, including investment fund prospectuses and competitor financial statements. Accordingly we were able to determine that the fees charged for our management services are comparable to those charged by other container management companies for the same service. As such, we have concluded that evidence exists to support our assessment of the fair value of our management services. However, we are one of the few companies in the business of selling and managing portfolios of leased containers and in the future data
52
Table of Contents
may not be available to support our assessment of fair value. Should fair value evidence not be satisfactory in the future, the gain on sale of container portfolios and the management services may need to be accounted for as one unit of accounting. This would result in the gain on sale of container portfolios being deferred and recognized over the term of the management agreement, which is typically 10 years, rather than in the period the sale occurs. As discussed in Note 2(o) of our accompanying consolidated financial statements, we will adopt FASB ASU 2009-13, Multiple Deliverable Revenue Arrangement, for all revenue arrangements entered into or materially modified on or after June 15, 2010. This guidance will eliminate the requirement that all undelivered elements have vendor-specific objective evidence or third party evidence before an entity can recognize the portion of an overall arrangement fee that is attributable to items that have already been delivered. Therefore, the likelihood of having to account for the gain on sale of container portfolios and the management services as one unit of accounting will be reduced upon adoption of this standard.
Based on the conclusion that the sale of containers and the management services can be accounted for separately, we recognize gain on sale of container portfolios when the sale of the containers is completed. The gain is the difference between the sales price and the net book value of the containers sold.
We recognize revenue from management fees earned under management agreements on a monthly basis. Fees are calculated as a percentage of net operating income, which is revenue from the containers under management minus direct operating expense related to those containers. If a lessee of a managed container defaults in making timely lease payments or we otherwise determine that future lease payments are not likely to be collected from the lessee, then we will cease to record lease revenue for purposes of our internal record keeping in connection with determining the amount of management fees that we have earned, which in turn will result in reduced management fee revenue.
Accounting for Container Leasing Equipment
Accounting for container leasing equipment includes depreciation, impairment testing and the impairment of containers as held for sale.
Depreciation. When we acquire containers, we record the cost of the container on our balance sheet. We then depreciate the container over its estimated “useful life” (which represents the number of years we expect to be able to lease the container to shipping companies) to its estimated “residual value” (which represents the amount we estimate we will recover upon the sale or other disposition of the equipment at the end of its “useful life” as a shipping container). Our estimates of useful life are based on our actual experience with our owned fleet, and our estimates of residual value are based on a number of factors including disposal price history.
We regularly review our depreciation policies, including our estimates of useful lives and residual values, to determine whether a change in our estimates of useful lives and residual values is warranted. We estimated that standard dry van containers, which represent substantially all the containers in our fleet, have a useful life of 12.5 years and had fixed residual values of $850 for a 20’, $950 for a 40’, and $1,000 for a 40’ high cube. The estimated useful life for all other containers remains at 15 years with a residual value of 15% of their original cost.
Used containers are depreciated over the number of years remaining from their normal useful life of 12.5 years but no less than two years. Used containers that are over 12.5 years of age at the time of purchase are depreciated over two years. No depreciation is recorded on used containers that are purchased at or below their residual values.
The Company will reassess its estimate of residual value and useful life of containers in the future for possible adjustments to those estimates. If market conditions in the future warrant a further change of our estimates of the useful lives or residual values of our containers, we may be required to again recognize increased or decreased depreciation expense. A decrease in either the useful life or residual value of our containers would result in increased depreciation expense and decreased net income.
53
Table of Contents
Impairment. We periodically evaluate our containers held for use to determine whether there has been any event that would cause the book value of our containers to be impaired. Any such impairment would be expensed in our results of operations. Impairment exists when the future undiscounted cash flows generated by an asset are less than the net book value of that asset. If impairment exists, the containers are written down to their fair value. This fair value then becomes the containers’ new cost basis and is depreciated over their remaining useful life to their estimated residual values. Any impairment charge would result in decreased net income.
Containers Held for Sale. We also evaluate all off-lease containers to determine whether the containers will be repaired and returned to service or sold based upon what we estimate will be the best economic alternative. If we designate a container as held for sale, depreciation on the container ceases, and the container is reported at the lower of (1) its recorded value or (2) the amount we expect to receive upon sale (less the estimated cost to sell the container). Any write-down of containers held for sale is reflected in our statement of income as an expense. If a larger number of containers are identified for sale or prices for used containers drop, impairment charges for containers held for sale may increase which would result in decreased net income.
Goodwill and Intangible Assets
Goodwill represents the excess of purchase price over the fair value of net assets acquired in a business combination accounted for using the purchase method. Goodwill acquired in a purchase business combination is not amortized, but instead tested for impairment at least annually. On October 1, 2006, we recorded goodwill of $50.2 million and intangible assets of $7.4 million resulting from the application of push down accounting in connection with the Company’s repurchase of its common shares of stock held by Interpool. The purchase price for the incremental ownership that we acquired from Interpool was based on forecasts and assumptions made on future cash flows. Management determined that the Company is comprised of two reporting units, container leasing and container management, and allocated $13.8 million and $36.4 million of goodwill, respectively, to each segment. The allocation of the purchase price is based on the expected future cash flow contribution of each segment and goodwill for each reporting unit was determined as the difference between the allocated purchase price and the fair value of the net assets of each reporting unit.
Impairment of goodwill is tested at the reporting unit level annually or more frequently if an event or circumstance occurs that would more likely than not reduce the fair value of a reporting unit below its carrying amount. Factors that would suggest a possible impairment include, but are not limited to, material customer losses, significant decline in the market value of stock, an adverse change in the business climate, an adverse action or assessment by a regulator, unanticipated competition or a loss in key personnel.
We test impairment by comparing the reporting unit’s carrying amount, including goodwill, to the fair value of the reporting unit. We perform the goodwill impairment test using a combination of the market and income approaches. If the carrying amount of a reporting unit exceeds its fair value, an indication of goodwill impairment exists and a second step is performed to measure the amount of impairment loss, if any. In the application of the impairment testing, we are required to make estimates of future operating trends and resulting cash flows and judgments on discount rates and other variables. Actual future results and other assumed variables could differ from these estimates. If goodwill is impaired we will record an impairment charge, which will result in a decrease in net income, or an increase in net loss. We perform our annual review in the fourth quarter of each year or sooner if indicators for impairment exist. During the quarter ended December 31, 2008, we recognized an impairment loss of our entire goodwill of $50.2 million (see Note 4 to our consolidated financial statements).
Intangible assets acquired during the repurchase of its common stock held by Interpool and the acquisition of Consent have been allocated either directly to the relevant unit or on the expected future cash flow contribution of each segment. Intangible assets allocated to the container leasing and container management reporting units, net of accumulated amortization, are $2.6 million and $2.5 million, respectively, as of December 31, 2009. Intangible assets are reviewed for impairment whenever events or changes in circumstances indicate an asset’s carrying value may not be recoverable.
54
Table of Contents
Allowance for Doubtful Accounts
Our allowance for doubtful accounts is developed based on two key components: (1) specific reserves for receivables which are impaired for which management believes full collection is doubtful; and (2) a general reserve for estimated losses inherent in the receivables. The general reserve is estimated by applying certain percentages ranging from 1.0% on accounts that are one to thirty days overdue, to 100% on accounts that are one year overdue. Our allowance for doubtful accounts is reviewed regularly by our management and is based on the risk profile of the receivables, credit quality indicators such as the level of past due amounts and non-performing accounts and economic conditions. Our credit committee meets regularly to assess performance of our container lessees and to recommend actions to be taken in order to minimize credit risks. Changes in economic conditions or other events may necessitate additions or deductions to the allowance for doubtful accounts. The allowance is intended to provide for losses inherent in the owned fleet’s accounts receivable, and requires the application of estimates and judgments as to the outcome of collection efforts and the realization of collateral, among other things. If the financial condition of our container lessees were to deteriorate, reducing their ability to make payments, additional allowances may be required, which would decrease our net income in the period of the adjustment.
The credit risk on accounts receivable related to the containers we manage is the responsibility of the container investors. Accordingly, we do not record an allowance for doubtful accounts related to those accounts receivable. Under our management agreements, if we are unable to ultimately collect any amount due from a managed container lessee, the container investors are obligated to reimburse us for any amounts we have previously paid to them in advance of receiving the amount from the container lessee.
Share-Based Payments
We calculate the value of the stock options for officers and directors using the Black-Scholes-Merton option pricing model using certain assumptions of volatility, risk free interest rate, expected term and dividend yield. As we have no historical data, the expected option term is calculated using the simplified method. The fair value of restricted shares of common stock granted to management employees was their market price on the date of grant. The resulting values for stock options and restricted shares of common stock are amortized on a straight-line basis over their vesting periods and recorded as compensation expense. (See Note 11 to consolidated financial statements.)
On April 23, 2007, our board of directors and our stockholders approved the 2007 Equity Incentive Plan (“Plan”) and reserved 721,980 shares of our common stock for issuance under the Plan. Pursuant to this Plan, on May 15, 2007, we granted our three top corporate officers at that time and three outside members of our board of directors, options totaling 508,620 shares and 37,500 shares, respectively, of our common stock at the IPO price of $15.00 per share. Additional options totaling 22,500 shares were granted to our independent directors on May 22, 2008. On June 5, 2009, the 2007 Equity Incentive Plan was amended to increase the number of shares available for issuance under the Plan to 1,221,980 shares and granted additional options for 480,000 to our officers, certain management employees and independent directors. All of our stock options have a contractual term of 10 years and vest over four years for the officers and employees and one year for the independent directors. As of December 31, 2009, there were 930,180 stock options outstanding for officers, employees and outside directors.
In addition to stock options, we granted certain management employees restricted shares of common stock aggregating 36,876 shares on May 15, 2007. The restricted shares of common stock granted to employees have a vesting period of three years from the date of grant. As of December 31, 2009, there were 11,544 shares of unvested restricted common stock.
55
Table of Contents
Income Taxes
Deferred tax liabilities and assets are recognized for the expected future tax consequences of events that have been reflected in our consolidated financial statements. Deferred tax liabilities and assets are determined based on the differences between the book values and the tax basis of particular assets and liabilities, using tax rates in effect for the years in which the differences are expected to reverse. A valuation allowance is recorded to reduce our deferred tax assets to an amount we determine is more likely than not to be realized, based on our analyses of past operating results, future reversals of existing taxable temporary differences and projected taxable income. Our analyses of future taxable income are subject to a wide range of variables, many of which involve estimates. Uncertainty regarding future events and changes in tax regulation could materially alter our valuation of deferred tax liabilities and assets. If we determine that we would not be able to realize all or part of our deferred tax assets in the future, we would increase our valuation allowance and record a corresponding charge to our earnings in the period in which we make such determination. If we later determine that we are more likely than not to realize our deferred tax assets, we would reverse the applicable portion of the previously provided valuation allowance.
We recognize the effect of income tax positions only if those positions are more likely than not of being sustained. Recognized income tax positions are measured at the largest amount that is greater than 50% likely of being realized. Changes in recognition or measurement are reflected in the period in which the change in judgment occurs. We record penalties and interest related to unrecognized tax benefits within income tax expense.
Recent Accounting Pronouncements.
See Note 2(o) of our accompanying consolidated financial statements for a full description of recent accounting pronouncements and our expectation of their effect on our operations and financial condition.
| ITEM 7A. | QUANTITATIVE AND QUALITATIVE DISCLOSURES ABOUT MARKET RISK |
Market risk represents the risk of changes in value of a financial instrument, derivative or non-derivative, caused by fluctuations in foreign exchange rates and interest rates. Changes in these factors could cause fluctuations in our results of operations and cash flows. We are exposed to the market risks described below.
Foreign Exchange Rate Risk. Although we have significant foreign-based operations, the U.S. dollar is our primary operating currency. Thus, most of our revenue and expenses are denominated in U.S. dollars. We had equipment sales in British Pound Sterling, Euros and Japanese Yen and incurred overhead costs in foreign currencies, primarily in British Pound Sterling and Euros. Consent has significant amounts of revenue as well as expenses denominated in Euro, Swedish Kroner and Norwegian Kroner. During the year ended December 31, 2009 the U.S. dollar has decreased in value in relation to other major foreign currencies (such as the Euro and British Pound Sterling). The decrease in the U.S. dollar has increased our revenues and expenses denominated in foreign currencies. The decrease in the value of the U.S. dollar relative to foreign currencies will also result in U.S. dollar denominated liabilities held at some of our foreign subsidiaries to decrease in value relative to the foreign subsidiaries’ local currencies. If the value of the U.S. dollar continues to decrease in relation to foreign currencies, such decrease may have a significant impact on our future operating results.
Interest Rate Risk. The nature of our business exposes us to market risk arising from changes in interest rates to which our variable-rate debt is linked. In conjunction with its acquisition of Consent, the Company assumed an interest rate swap agreement with a European bank. The interest rate swap contract with the bank is based on a notional amount in Euros equivalent to approximately $4.2 million as of December 31, 2009, with a fixed rate of 4.07% against the three-month Euribor rate. The contract expires on July 1, 2010. As of December 31, 2009, the liability under the rate swap agreement had a fair value of approximately $70,000.
As of December 31, 2009 the principal amount of debt outstanding under the variable-rate arrangement of our senior secured credit facility was $152.5 million. In addition, the capital lease obligations we assumed in conjunction with the acquisition of Consent had a balance of $20.1 million at December 31, 2009 and have
56
Table of Contents
variable interest rates. On August 20, 2009, we signed a five-year term loan agreement with Development Bank of Japan which owns approximately 9.4% our outstanding common stock. The loan bears a variable interest rate and had a balance of $9.8 million as of December 31, 2009. A 1.0% increase or decrease in underlying interest rates for these obligations will increase or decrease interest expense by approximately $1.8 million annually assuming debt remains constant at December 31, 2009 levels.
Quantitative and Qualitative Disclosures About Credit Risk
We maintain detailed credit records about the container lessees for our total fleet. Our credit policy sets different maximum exposure limits for our container lessees. Credit criteria may include, but are not limited to, container lessee trade route, country, social and political climate, assessments of net worth, asset ownership, bank and trade credit references, credit bureau reports, including those from Dynamar, operational history and financial strength. We monitor container lessees’ performance and lease exposures on an ongoing basis, and our credit management processes are aided by the long payment experience we have with most of the container lessees for our total fleet and our broad network of long-standing relationships in the shipping industry that provide current information about the container lessees for our total fleet. In managing this risk we also make an allowance for doubtful accounts. Our allowance for doubtful accounts is developed based on two key components: (1) specific reserves for receivables which are impaired for which management believes full collection is doubtful; and (2) a general reserve for estimated losses inherent in the receivables. The general reserve is estimated by applying certain percentage ranging from 1.0% on accounts that are one to thirty days overdue, to 100% on accounts that are one year overdue. Our allowance for doubtful accounts is reviewed regularly by our management and is based on the risk profile of the receivables, credit quality indicators such as the level of past due amounts and non-performing accounts and economic conditions.
The credit risk on accounts receivable related to the containers we manage is the responsibility of the container investors. We hold back a percentage of lease payments relating to managed containers to be applied against future lessee defaults. Under our management agreements, if we are unable to ultimately collect any amount due from a managed container lessee, the container investors are obligated to reimburse us for any amounts we have previously paid to them in advance of receiving the amount from the container lessee. We typically pay container investors the amounts due to them under the leases we manage within 60 days after invoicing lessees. Accordingly, we have credit risk exposure on amounts that we have paid to container investors in advance of receiving the funds from the lessees. Although our container investors are obligated under the terms of our management agreements to reimburse us for amounts advanced that are subsequently not collected from the managed container lessees, we bear the credit risk that one or more of our managed container lessees will become insolvent or otherwise be unable to pay us the amounts due under the lease. We receive all funds from our managed container lessees directly and if we determine that a payment due from a container lessee is not collectable we deduct that amount from future payments to the relevant container investors to the extent that amount exceeds amounts we have previously held back. We monitor our managed fleet credit risk exposure to managed container lessees and cease making payments to container investors with respect to containers leased to a lessee that we have determined is unlikely to make payment under the lease.
As of December 31, 2009, approximately 95.4% of accounts receivable for our total fleet and 95.4% of the finance lease receivables were from container lessees outside of the United States. China, (including Hong Kong), Korea and Japan accounted for 13.5%, 9.0% and 7.9%, respectively, of our total fleet container leasing revenue for 2009. No other countries accounted for greater than 10.0% of our total fleet container leasing revenue for the same period. Total fleet container leasing revenue differs from our reported container rental revenue in that total fleet container leasing revenue comprises revenue earned from leases on containers in our total fleet, including revenue earned by our investors from leases on containers in our managed fleet, while our reported container revenue only comprises container leasing revenue associated with our owned fleet. We derive revenue with respect to container leasing revenue associated with our managed fleet from management fees based upon the operating performance of the managed containers.
57
Table of Contents
Revenue from our ten largest container lessees represented 45.5% of the revenue from our container leasing segment for the year ended December 31, 2009, with revenue from our single largest container lessee accounting for 7.3%, or $4.1 million, of revenue from our container leasing segment during such period.
An allowance of $1.4 million has been established against non-performing receivables as of December 31, 2009. For the year ended December 31, 2009, receivable write-offs totaled $83,000.
| ITEM 8. | FINANCIAL STATEMENTS AND SUPPLEMENTARY DATA |
The consolidated financial statements and financial statement schedule listed under Item 15- Exhibits, Financial Statement Schedules are set forth on the F-pages of this Annual Report on Form 10-K and are incorporated herein by reference.
| ITEM 9. | CHANGES IN AND DISAGREEMENTS WITH ACCOUNTANTS ON ACCOUNTING AND FINANCIAL DISCLOSURE |
None.
| ITEM 9A. | CONTROLS AND PROCEDURES |
Management’s Evaluation of Disclosure Controls and Procedures
In accordance with Rule 13a-15(b) under the Securities Exchange Act of 1934, as amended (the “Exchange Act”), we carried out an evaluation, under the supervision and with the participation of our management, including our President and Chief Executive Officer along with our Senior Vice President and Chief Financial Officer, of the effectiveness of the design and operation of our disclosure controls and procedures (as defined in Rule 13a-14(c) under the Exchange Act) as of the end of the period covered by this Annual Report on Form 10-K. Based upon their evaluation of these disclosure controls and procedures, our President and Chief Executive Officer along with the Senior Vice President and Chief Financial Officer concluded, as of the end of the period covered by this Annual Report on Form 10-K, that our disclosure controls and procedures were effective with respect to controls and procedures designed to ensure that information required to be disclosed by us in the reports that we file under the Exchange Act is recorded, processed, summarized and reported by our management within the time periods specified in the Securities and Exchange Commission’s rules and forms and are accumulated and communicated to the Company’s management, including the Company’s principal executive and principal financial officers, or persons performing similar functions, as appropriate to allow timely decisions regarding required disclosure.
Changes in Internal Controls
There were no changes in our internal controls over financial reporting (as such term is defined in Rule 13a-15(f) and 15d-15(f) under the Exchange Act), during the period covered by this Annual Report on Form 10-K that have materially affected, or are reasonably likely to materially affect, our internal control over financial reporting.
Management’s Report on Internal Control over Financial Reporting
Our management is responsible for establishing and maintaining adequate internal control over financial reporting (as defined in Rules 13a-15(f) and 15d-15(f) under the Securities and Exchange Act of 1934). Our internal control over financial reporting is a process designed with the participation of our principal executive officer and principal financial officer or persons performing similar functions to provide reasonable assurance regarding the reliability of financial reporting and the preparation of our financial statements for external reporting purposes in accordance with U.S. generally accepted accounting principles.
58
Table of Contents
Our internal control over financial reporting includes policies and procedures that: (a) pertain to the maintenance of records that, in reasonable detail, accurately and fairly reflect our transactions and dispositions of assets; (b) provide reasonable assurance that transactions are recorded as necessary to permit preparation of financial statements in accordance with U.S. generally accepted accounting principles, and that our receipts and expenditures are being made only in accordance with authorizations of our management and Board of Directors; and (c) provide reasonable assurance regarding prevention or timely detection of unauthorized acquisition, use or disposition of our assets that could have a material effect on our financial statements.
Because of its inherent limitations, our internal controls and procedures may not prevent or detect misstatements. A control system, no matter how well conceived and operated, can only provide reasonable, not absolute, assurance that the objectives of the control system are met. Because of the inherent limitations in all control systems, no evaluation of controls can provide absolute assurance that all control issues and instances of fraud, if any, have been detected. Also, projections of any evaluation of effectiveness to future periods are subject to the risk that controls may become inadequate because of changes in conditions or that the degree of compliance with the policies or procedures may deteriorate.
As of December 31, 2009, our management, with the participation of our President and Chief Executive Officer and our Senior Vice President and Chief Financial Officer, conducted an evaluation of the effectiveness of our internal control over financial reporting based on the framework established in Internal Control—Integrated Framework issued by the Committee of Sponsoring Organizations of the Treadway Commission (“COSO”). Based on this evaluation, management has determined that CAI International Inc.’s internal control over financial reporting is effective as of December 31, 2009.
KPMG LLP, the independent registered public accounting firm that audited our 2009 consolidated financial statements included in this Annual Report on Form 10-K, has issued an attestation report on our internal control over financial reporting. The report appears below.
59
Table of Contents
Report of Independent Registered Public Accounting Firm
The Board of Directors and Stockholders
CAI International, Inc.:
We have audited CAI International, Inc. and Subsidiaries (“the Company”) internal control over financial reporting as of December 31, 2009, based on criteria established in Internal Control—Integrated Framework issued by the Committee of Sponsoring Organizations of the Treadway Commission (COSO). The Company’s management is responsible for maintaining effective internal control over financial reporting and for its assessment of the effectiveness of internal control over financial reporting, included in the accompanying Management’s Report on Internal Control over Financial Reporting. Our responsibility is to express an opinion on the Company’s internal control over financial reporting based on our audit.
We conducted our audit in accordance with the standards of the Public Company Accounting Oversight Board (United States). Those standards require that we plan and perform the audit to obtain reasonable assurance about whether effective internal control over financial reporting was maintained in all material respects. Our audit included obtaining an understanding of internal control over financial reporting, assessing the risk that a material weakness exists, and testing and evaluating the design and operating effectiveness of internal control based on the assessed risk. Our audit also included performing such other procedures as we considered necessary in the circumstances. We believe that our audit provides a reasonable basis for our opinion.
A company’s internal control over financial reporting is a process designed to provide reasonable assurance regarding the reliability of financial reporting and the preparation of financial statements for external purposes in accordance with generally accepted accounting principles. A company’s internal control over financial reporting includes those policies and procedures that (1) pertain to the maintenance of records that, in reasonable detail, accurately and fairly reflect the transactions and dispositions of the assets of the company; (2) provide reasonable assurance that transactions are recorded as necessary to permit preparation of financial statements in accordance with generally accepted accounting principles, and that receipts and expenditures of the company are being made only in accordance with authorizations of management and directors of the company; and (3) provide reasonable assurance regarding prevention or timely detection of unauthorized acquisition, use, or disposition of the company’s assets that could have a material effect on the financial statements.
Because of its inherent limitations, internal control over financial reporting may not prevent or detect misstatements. Also, projections of any evaluation of effectiveness to future periods are subject to the risk that controls may become inadequate because of changes in conditions, or that the degree of compliance with the policies or procedures may deteriorate.
In our opinion, the Company maintained, in all material respects, effective internal control over financial reporting as of December 31, 2009, based on criteria established in Internal Control—Integrated Framework issued by COSO.
We also have audited, in accordance with the standards of the Public Company Accounting Oversight Board (United States), the consolidated balance sheets of CAI International, Inc. and Subsidiaries as of December 31, 2009 and 2008, the related consolidated statements of operations, cumulative redeemable convertible preferred stock and stockholders’ equity, and cash flows for the three-year period ended December 31, 2009, and the related financial statement schedule II, and our report dated March 15, 2010 expressed an unqualified opinion on those consolidated financial statements and financial statement schedule.
/s/ KPMG LLP
San Francisco, CA
March 15, 2010
60
Table of Contents
| ITEM 9B. | OTHER INFORMATION |
Not applicable.
PART III
| ITEM 10. | DIRECTORS, EXECUTIVE OFFICERS AND CORPORATE GOVERNANCE |
The information required by this item may be found under the sections captioned “Election of Directors,” “Management,” “Corporate Governance Principles and Board Matters” and “Section 16(a) Beneficial Ownership Reporting Compliance” in our Proxy Statement for our 2010 Annual Meeting of Stockholders (the “2010 Proxy Statement”), and such information is incorporated herein by reference. The 2010 Proxy Statement will be filed with the SEC no later than 120 days after the close of our fiscal year ended December 31, 2009.
| ITEM 11. | EXECUTIVE COMPENSATION |
The information required by this item may be found under the section captioned “Executive Compensation,” “Compensation Committee Interlocks and Insider Participation” and “Compensation Committee Report” in the 2010 Proxy Statement, which is incorporated herein by reference.
| ITEM 12. | SECURITY OWNERSHIP OF CERTAIN BENEFICIAL OWNERS AND MANAGEMENT AND RELATED STOCKHOLDER MATTERS |
The information required by this item may be found under the section captioned “Security Ownership and Certain Beneficial Owners and Management” and “Securities Authorized for Issuance Under Equity Compensation Plans” in the 2010 Proxy Statement, and such information is incorporated herein by reference.
| ITEM 13. | CERTAIN RELATIONSHIPS AND RELATED TRANSACTIONS, AND DIRECTOR INDEPENDENCE |
The information required by this item may be found under the section captioned “Related Person Transactions” and “Corporate Governance Principles and Board Matters” in the 2010 Proxy Statement, and such information is incorporated herein by reference, and in Note 9 to our consolidated financial statements.
| ITEM 14. | PRINCIPAL ACCOUNTING FEES AND SERVICES |
The information required by this item may be found under the section captioned “Audit Fees” in the 2010 Proxy Statement, and such information is incorporated herein by reference.
61
Table of Contents
PART IV
| ITEM 15. | EXHIBITS, FINANCIAL STATEMENT SCHEDULES |
(a)(1) Financial Statements.
The following financial statements are included in Item 8 of this report:
| Page | ||
| F-2 | ||
| Consolidated Balance Sheets at December 31, 2009 and December 31, 2008 |
F-3 | |
| Consolidated Statements of Operations for the years ended December 31, 2009, 2008 and 2007 |
F-4 | |
| F-5 | ||
| Consolidated Statements of Cash Flows for the years ended December 31, 2009, 2008 and 2007 |
F-6 | |
| F-7 | ||
| (a)(2) Financial Statement Schedules. |
||
|
The following financial statement schedule for the Company is filed as part of this report: |
||
| F-31 | ||
Schedules not listed above have been omitted because the information required to be set forth therein is not applicable or is shown in the accompanying Consolidated Financial Statements or notes thereto.
(a)(3) List of Exhibits.
The exhibits used on the accompanying Exhibit Index immediately following the financial statement schedule are filed as part of, or incorporated by reference into, this Annual Report on Form 10-K.
62
Table of Contents
Pursuant to the requirements of Section 13 or 15(d) of the Securities Exchange Act of 1934, the Registrant has duly caused this report to be signed on its behalf by the undersigned, thereunto duly authorized.
| CAI International, Inc. | ||||
| Date: March 15, 2010 |
By: | /s/ MASAAKI (JOHN) NISHIBORI | ||
| Masaaki (John) Nishibori President and Chief Executive Officer | ||||
Pursuant to the requirements of the Securities Exchange Act of 1934, this report has been signed below by the following persons on behalf of the Registrant, in the capacities indicated, on the 15th day of March 2010.
| Signature |
Title(s) | |
| /s/ HIROMITSU OGAWA Hiromitsu Ogawa |
Chairman | |
| /s/ MASAAKI (JOHN) NISHIBORI Masaaki (John) Nishibori |
President and Chief Executive Officer (Principal Executive Officer), Director | |
| /s/ VICTOR M. GARCIA Victor M. Garcia |
Senior Vice President and Chief Financial Officer (Principal Financial and Accounting Officer) | |
| /s/ MARVIN DENNIS Marvin Dennis |
Director | |
| /s/ WILLIAM W. LIEBECK William W. Liebeck |
Director | |
| /s/ GARY M. SAWKA Gary M. Sawka |
Director | |
63
Table of Contents
INDEX TO CONSOLIDATED FINANCIAL STATEMENTS
F-1
Table of Contents
Report of Independent Registered Public Accounting Firm
The Board of Directors and Stockholders
CAI International, Inc.:
We have audited the accompanying consolidated balance sheets of CAI International, Inc. and Subsidiaries (“the Company”) as of December 31, 2009 and 2008, and the related consolidated statements of operations, cumulative redeemable convertible preferred stock and stockholders’ equity, and cash flows for each of the years in the three-year period ended December 31, 2009. In connection with our audits of the consolidated financial statements, we also have audited the related financial statement schedule II. These consolidated financial statements and financial statement schedule are the responsibility of the Company’s management. Our responsibility is to express an opinion on these consolidated financial statements and financial statement schedule based on our audits.
We conducted our audits in accordance with the standards of the Public Company Accounting Oversight Board (United States). Those standards require that we plan and perform the audit to obtain reasonable assurance about whether the financial statements are free of material misstatement. An audit includes examining, on a test basis, evidence supporting the amounts and disclosures in the financial statements. An audit also includes assessing the accounting principles used and significant estimates made by management, as well as evaluating the overall financial statement presentation. We believe that our audits provide a reasonable basis for our opinion.
In our opinion, the aforementioned consolidated financial statements present fairly, in all material respects, the financial position of CAI International, Inc. and Subsidiaries as of December 31, 2009 and 2008, and the results of their operations and their cash flows for each of the years in the three-year period ended December 31, 2009, in conformity with U.S. generally accepted accounting principles. Also, in our opinion, the related financial statement schedule, when considered in relation to the basic consolidated financial statements taken as a whole, presents fairly, in all material respects, the information set forth therein.
We also have audited, in accordance with the standards of the Public Company Accounting Oversight Board (United States), the Company’s internal control over financial reporting as of December 31, 2009, based on criteria established in Internal Control—Integrated Framework issued by the Committee of Sponsoring Organizations of the Treadway Commission (COSO), and our report dated March 15, 2010 expressed an unqualified opinion on the effectiveness of the Company’s internal control over financial reporting.
/s/ KPMG LLP
San Francisco, CA
March 15, 2010
F-2
Table of Contents
CONSOLIDATED BALANCE SHEETS
(In thousands, except share information)
| December 31, 2009 |
December 31, 2008 |
|||||||
| ASSETS | ||||||||
| Cash |
$ | 14,492 | $ | 28,535 | ||||
| Accounts receivable (owned fleet), net of allowance for doubtful accounts of $1,420 and $1,044 at December 31, 2009 and December 31, 2008, respectively |
14,412 | 16,224 | ||||||
| Accounts receivable (managed fleet) |
18,953 | 24,683 | ||||||
| Current portion of direct finance leases |
6,776 | 6,108 | ||||||
| Prepaid expenses |
3,077 | 2,954 | ||||||
| Deferred taxes |
1,669 | 1,924 | ||||||
| Other current assets |
4,000 | 563 | ||||||
| Total current assets |
63,379 | 80,991 | ||||||
| Container rental equipment, net of accumulated depreciation of $80,627 and $86,936 at December 31, 2009 and December 31, 2008, respectively |
299,340 | 310,397 | ||||||
| Net investment in direct finance leases |
5,844 | 14,003 | ||||||
| Furniture, fixtures and equipment, net of accumulated depreciation of |
435 | 629 | ||||||
| Intangible assets, net of accumulated amortization of $4,656 and $3,081 at December 31, 2009 and December 31, 2008, respectively |
5,085 | 6,608 | ||||||
| Total assets |
$ | 374,083 | $ | 412,628 | ||||
| LIABILITIES AND STOCKHOLDERS’ EQUITY | ||||||||
| Accounts payable |
$ | 8,030 | $ | 4,682 | ||||
| Accrued expenses and other current liabilities |
3,638 | 3,747 | ||||||
| Due to container investors |
17,285 | 23,847 | ||||||
| Unearned revenue |
4,225 | 4,542 | ||||||
| Current portion of related party term loan |
800 | — | ||||||
| Current portion of capital lease obligation |
3,813 | 4,514 | ||||||
| Rental equipment payable |
660 | 3,905 | ||||||
| Total current liabilities |
38,451 | 45,237 | ||||||
| Revolving credit facility |
152,500 | 208,200 | ||||||
| Related party term loan |
9,000 | — | ||||||
| Deferred taxes |
26,606 | 25,348 | ||||||
| Capital lease obligation |
16,282 | 18,070 | ||||||
| Income taxes payable |
2,146 | 1,983 | ||||||
| Total liabilities |
244,985 | 298,838 | ||||||
| Stockholders’ equity: |
||||||||
| Common stock, par value $.0001 per share; authorized 84,000,000 shares; issued and outstanding, 17,917,176 shares and 17,920,778 shares at December 31, 2009, and December 31, 2008, respectively |
2 | 2 | ||||||
| Additional paid-in capital |
103,684 | 102,706 | ||||||
| Accumulated other comprehensive loss |
(1,248 | ) | (2,022 | ) | ||||
| Retained earnings |
26,660 | 13,104 | ||||||
| Total stockholders’ equity |
129,098 | 113,790 | ||||||
| Total liabilities and stockholders’ equity |
$ | 374,083 | $ | 412,628 | ||||
See accompanying notes to consolidated financial statements.
F-3
Table of Contents
CONSOLIDATED STATEMENTS OF OPERATIONS
(In thousands, except per share data)
| Year Ended December 31, | ||||||||||||
| 2009 | 2008 | 2007 | ||||||||||
| Revenue: |
||||||||||||
| Container rental revenue |
$ | 53,747 | $ | 56,436 | $ | 38,148 | ||||||
| Management fee revenue |
8,546 | 11,969 | 12,663 | |||||||||
| Gain on sale of container portfolios |
753 | 12,443 | 12,855 | |||||||||
| Finance lease income |
2,218 | 2,297 | 1,206 | |||||||||
| Total revenue |
65,264 | 83,145 | 64,872 | |||||||||
| Operating expenses: |
||||||||||||
| Depreciation of container rental equipment |
17,140 | 15,824 | 8,805 | |||||||||
| Amortization of intangible assets |
1,566 | 1,534 | 1,241 | |||||||||
| Impairment of container rental equipment |
86 | 331 | 365 | |||||||||
| Gain on disposition of used container equipment |
(3,626 | ) | (4,155 | ) | (4,400 | ) | ||||||
| Gain on settlement of lease obligation |
— | — | (780 | ) | ||||||||
| Equipment rental expense |
— | 20 | 961 | |||||||||
| Storage, handling and other expenses |
8,717 | 4,854 | 3,077 | |||||||||
| Marketing, general and administrative expense |
18,848 | 20,215 | 15,772 | |||||||||
| Impairment of goodwill |
— | 50,247 | — | |||||||||
| Restructuring charges |
972 | — | — | |||||||||
| (Gain) Loss on foreign exchange |
(215 | ) | 564 | (104 | ) | |||||||
| Total operating expenses |
43,488 | 89,434 | 24,937 | |||||||||
| Operating income (loss) |
21,776 | (6,289 | ) | 39,935 | ||||||||
| Interest expense |
4,311 | 9,346 | 10,705 | |||||||||
| Gain on extinguishment of debt |
— | — | (681 | ) | ||||||||
| Interest income |
(10 | ) | (229 | ) | (126 | ) | ||||||
| Net interest expense |
4,301 | 9,117 | 9,898 | |||||||||
| Income (loss) before income taxes |
17,475 | (15,406 | ) | 30,037 | ||||||||
| Income tax expense |
3,919 | 11,547 | 10,990 | |||||||||
| Net income (loss) |
13,556 | (26,953 | ) | 19,047 | ||||||||
| Accretion of preferred stock |
— | — | (5,577 | ) | ||||||||
| Net income (loss) available to common shareholders: |
$ | 13,556 | $ | (26,953 | ) | $ | 13,470 | |||||
| Net income (loss) per share: |
||||||||||||
| Basic |
$ | 0.76 | $ | (1.55 | ) | $ | 0.92 | |||||
| Diluted |
$ | 0.76 | $ | (1.55 | ) | $ | 0.85 | |||||
| Weighted average shares outstanding: |
||||||||||||
| Basic |
17,902 | 17,406 | 14,713 | |||||||||
| Diluted |
17,902 | 17,406 | 16,682 | |||||||||
See accompanying notes to consolidated financial statements.
F-4
Table of Contents
CONSOLIDATED STATEMENTS OF CUMULATIVE REDEEMABLE CONVERTIBLE
PREFERRED STOCK AND STOCKHOLDERS’ EQUITY
(In thousands)
| Cumulative Redeemable Convertible Preferred Stock |
Common stock | Additional Paid-In Capital |
Retained Earnings |
Accumulated Other Comprehensive Income (Loss) |
Total Stockholders’ Equity |
|||||||||||||||||||||||||||||
| Shares | Amount | Note Receivable on Preferred Stock |
Shares | Amount | ||||||||||||||||||||||||||||||
| Balances as of December 31, 2006 |
725 | $ | 6,072 | $ | (1,172 | ) | 10,584 | $ | 1,260 | $ | — | $ | 26,587 | $ | 95 | $ | 27,942 | |||||||||||||||||
| Net income |
— | — | — | — | — | — | 19,047 | — | 19,047 | |||||||||||||||||||||||||
| Foreign currency translation adjustment |
— | — | — | — | — | — | — | 6 | 6 | |||||||||||||||||||||||||
| Comprehensive income |
19,053 | |||||||||||||||||||||||||||||||||
| Accretion of preferred stock |
— | 5,606 | (29 | ) | — | — | — | (5,577 | ) | — | (5,577 | ) | ||||||||||||||||||||||
| Payment of dividend on preferred stock |
— | (804 | ) | — | — | — | — | — | — | — | ||||||||||||||||||||||||
| Conversion of preferred stock to common stock |
(725 | ) | (10,874 | ) | — | 725 | — | 10,874 | — | — | 10,874 | |||||||||||||||||||||||
| Conversion of pre-IPO common stock from no par to par value common stock |
— | — | — | — | (1,260 | ) | 1,260 | — | — | — | ||||||||||||||||||||||||
| Common stock issued at IPO, net of underwriting discount and offering expenses |
— | — | — | 5,800 | 2 | 78,115 | — | — | 78,117 | |||||||||||||||||||||||||
| Stock based compensation |
— | — | — | 36 | — | 739 | — | — | 739 | |||||||||||||||||||||||||
| Collection of note receivable on preferred stock |
— | — | 1,201 | — | — | — | — | — | — | |||||||||||||||||||||||||
| Balances as of December 31, 2007 |
— | $ | — | $ | — | 17,145 | $ | 2 | $ | 90,988 | $ | 40,057 | $ | 101 | $ | 131,148 | ||||||||||||||||||
| Net loss |
— | — | — | — | — | — | (26,953 | ) | — | (26,953 | ) | |||||||||||||||||||||||
| Foreign currency translation adjustment |
— | — | — | — | — | — | — | (2,123 | ) | (2,123 | ) | |||||||||||||||||||||||
| Comprehensive loss |
(29,076 | ) | ||||||||||||||||||||||||||||||||
| Issuance of common stock, net of underwriting discount and offering expenses |
— | — | — | 750 | — | 10,289 | — | — | 10,289 | |||||||||||||||||||||||||
| Exercise of stock options |
— | — | — | 30 | — | 478 | — | — | 478 | |||||||||||||||||||||||||
| Payment of income tax withheld on vested restricted stocks |
— | — | — | (4 | ) | — | (54 | ) | — | — | (54 | ) | ||||||||||||||||||||||
| Stock based compensation |
— | — | — | — | — | 1,005 | — | — | 1,005 | |||||||||||||||||||||||||
| Balances as of December 31, 2008 |
— | $ | — | $ | — | 17,921 | $ | 2 | $ | 102,706 | $ | 13,104 | $ | (2,022 | ) | $ | 113,790 | |||||||||||||||||
| Net Income |
— | — | — | — | — | — | 13,556 | — | 13,556 | |||||||||||||||||||||||||
| Foreign currency translation adjustment |
— | — | — | — | — | — | — | 774 | 774 | |||||||||||||||||||||||||
| Comprehensive income |
14,330 | |||||||||||||||||||||||||||||||||
| Payment of income tax withheld on vested restricted stocks |
— | — | — | (4 | ) | — | (14 | ) | — | — | (14 | ) | ||||||||||||||||||||||
| Stock based compensation |
— | — | — | — | — | 992 | — | — | 992 | |||||||||||||||||||||||||
| Balances as of December 31, 2009 |
— | $ | — | $ | — | 17,917 | $ | 2 | $ | 103,684 | $ | 26,660 | $ | (1,248 | ) | $ | 129,098 | |||||||||||||||||
See accompanying notes to consolidated financial statements.
F-5
Table of Contents
CONSOLIDATED STATEMENTS OF CASH FLOW
(in thousands)
| Year Ended December 31, | ||||||||||||
| 2009 | 2008 | 2007 | ||||||||||
| Cash flows from operating activities: |
||||||||||||
| Net income (loss) |
$ | 13,556 | $ | (26,953 | ) | $ | 19,047 | |||||
| Adjustments to reconcile net income to net cash provided by (used in) operating activities: |
||||||||||||
| Depreciation |
17,366 | 16,001 | 8,932 | |||||||||
| Amortization of debt issuance costs |
496 | 474 | 601 | |||||||||
| Amortization of intangible assets |
1,566 | 1,534 | 1,241 | |||||||||
| Impairment of container rental equipment |
86 | 331 | 365 | |||||||||
| Impairment of goodwill |
— | 50,247 | — | |||||||||
| Stock-based compensation expense |
992 | 1,005 | 739 | |||||||||
| (Gain) / loss on foreign exchange |
(418 | ) | 334 | (104 | ) | |||||||
| Gain on sale of container portfolios |
(753 | ) | (12,443 | ) | (12,855 | ) | ||||||
| Gain on disposition of used container equipment |
(3,626 | ) | (4,155 | ) | (4,400 | ) | ||||||
| Deferred income taxes |
(1,130 | ) | (593 | ) | (1,754 | ) | ||||||
| Bad debt expense |
458 | 687 | 463 | |||||||||
| Gain on extinguishment of debt |
— | — | (681 | ) | ||||||||
| Gain on settlement of lease obligation |
— | — | (780 | ) | ||||||||
| Restructuring costs |
883 | — | — | |||||||||
| Changes in other operating assets and liabilities: |
||||||||||||
| Accounts receivable |
7,243 | (4,417 | ) | (3,904 | ) | |||||||
| Related party receivables |
— | — | 128 | |||||||||
| Deposits, prepayments and other assets |
1,036 | 27 | 2,628 | |||||||||
| Accounts payable, accrued expenses and other current liabilities |
2,723 | 2,875 | (12,361 | ) | ||||||||
| Due to container investors |
(9,329 | ) | 2,772 | (575 | ) | |||||||
| Unearned revenue |
(351 | ) | (288 | ) | 3,004 | |||||||
| Net cash provided by (used in) operating activities |
30,798 | 27,438 | (266 | ) | ||||||||
| Cash flows from investing activities: |
||||||||||||
| Purchase of containers |
(31,284 | ) | (189,600 | ) | (219,530 | ) | ||||||
| Acquisition of Consent Equipment AB, net of cash acquired |
— | (14,566 | ) | — | ||||||||
| Net proceeds from sale of container portfolios |
5,840 | 99,773 | 113,402 | |||||||||
| Net proceeds from disposition of used container equipment |
23,669 | 20,357 | 19,238 | |||||||||
| Purchase of furniture, fixtures and equipment |
(69 | ) | (133 | ) | (136 | ) | ||||||
| Receipt of principal payments from direct financing leases |
5,532 | 6,563 | 3,991 | |||||||||
| Net cash provided by (used in) investing activities |
3,688 | (77,606 | ) | (83,035 | ) | |||||||
| Cash flows from financing activities: |
||||||||||||
| Net proceeds from issuance of common stock |
— | 10,289 | 78,117 | |||||||||
| Collection of note receivable on preferred stock |
— | — | 1,201 | |||||||||
| Exercise of stock options |
— | 478 | — | |||||||||
| Payment of dividend on preferred stock |
— | — | (804 | ) | ||||||||
| Proceeds from capital leases |
1,345 | 2,944 | — | |||||||||
| Proceeds from bank debt |
15,000 | 134,600 | 138,100 | |||||||||
| Proceeds from related party term debt |
10,000 | — | — | |||||||||
| Principal payments on capital leases |
(4,359 | ) | (3,308 | ) | (525 | ) | ||||||
| Principal payments made on bank debt |
(70,700 | ) | (74,000 | ) | (106,250 | ) | ||||||
| Principal payments on related party term debt |
(200 | ) | — | — | ||||||||
| Principal payments made on subordinated note payable |
— | — | (37,500 | ) | ||||||||
| Debt issuance costs |
(93 | ) | (340 | ) | (970 | ) | ||||||
| Net cash (used in) provided by financing activities |
(49,007 | ) | 70,663 | 71,369 | ||||||||
| Effect on cash of foreign currency translation |
478 | (393 | ) | 6 | ||||||||
| Net (decrease) increase in cash |
(14,043 | ) | 20,102 | (11,926 | ) | |||||||
| Cash at beginning of the period |
28,535 | 8,433 | 20,359 | |||||||||
| Cash at end of the period |
$ | 14,492 | $ | 28,535 | $ | 8,433 | ||||||
| Supplemental disclosure of cash flow information: |
||||||||||||
| Cash paid during the period for: |
||||||||||||
| Income taxes |
$ | 6,307 | $ | 11,047 | $ | 20,921 | ||||||
| Interest |
3,492 | 7,971 | 11,016 | |||||||||
| Supplemental disclosure of non-cash investing and financing activity: |
||||||||||||
| Conversion of preferred stock to common stock |
— | — | 10,874 | |||||||||
| Transfer of container rental equipment to direct finance lease |
804 | 15,116 | 8,380 | |||||||||
| Transfer of direct finance lease to container rental equipment |
3,099 | — | — | |||||||||
See accompanying notes to consolidated financial statements.
F-6
Table of Contents
NOTES TO CONSOLIDATED FINANCIAL STATEMENTS
(1) The Company and Nature of Operations
CAI International, Inc. (CAI or the Company) was originally incorporated under the name Container Applications International, Inc. in the state of Nevada on August 3, 1989. On February 2, 2007, the Company was reincorporated under its present name in the state of Delaware. The Company operates in the international intermodal marine cargo container leasing business. Within this single industry sector, the Company generates revenue from two reportable segments: container leasing and container management. The container leasing segment specializes primarily in the ownership and leasing of intermodal dry freight standard containers, while the container management segment manages containers for container investors. The Company leases its containers principally to international container shipping lines located throughout the world. The Company sells containers primarily to investor groups and provides management services to those investors in return for a management fee.
The Company completed an initial public offering (“IPO”) of its common stock at $15.00 per share on May 16, 2007, and listed its common stock on the New York Stock exchange under the symbol “CAP”.
On September 12, 2007, the Company formed Container Applications Limited (CAI Barbados), a wholly owned subsidiary in Barbados, to facilitate the Company’s international leasing and related business operations.
On April 30, 2008, the Company acquired CAI Consent Sweden AB (Consent), formerly named Consent Equipment AB, a European container and intermodal equipment leasing company, for $14.6 million in cash (net of $1.3 million cash acquired) and the assumption of approximately $25.7 million in debt. Consent was originally headquartered in Gothenburg, Sweden at the time of its acquisition. In October 2009 the Company commenced moving Consent’s operations in Sweden to the Company’s European office in the United Kingdom. The move was completed in February 2010. (See Notes 3 and 4).
The Company operates its business in 13 offices in 11 countries including the United States, and has agents in Asia, Europe, South Africa, Australia and South America. Its corporate headquarters are located in San Francisco, California.
(2) Summary of Significant Accounting Policies
(a) Basis of Accounting and Principles of Consolidation
The Company utilizes the accrual method of accounting.
The consolidated financial statements include the financial statements of the Company, its wholly owned subsidiaries: Container Applications Limited (CAI Barbados), SKY Container Trading, Inc. and our 80% owned subsidiary in Japan, CAIJ Ltd (CAIJ). The consolidated financial statements of CAI Barbados include those of its wholly owned subsidiaries including Container Applications International Ltd., Container Applications International (U.K.) Ltd., SKY Container Trading, Ltd., SKY Container Leasing, Ltd., Container Applications (Malaysia) SDN BHD and CAI Consent AB and its subsidiaries (from May 1, 2008). The non-controlling interest relating to CAIJ is not shown separately in the Company’s consolidated financial statements as required under FASB ASC 810, Consolidation, as the results of CAIJ’s operations were not material in relation to the Company’s consolidated statements of operations for the years ended December 31, 2009, 2008 and 2007, and the non-controlling interest in the financial position of CAIJ was not material as of December 31, 2009 and 2008. All significant intercompany balances and transactions have been eliminated in consolidation.
F-7
Table of Contents
(b) Use of Estimates
Certain estimates and assumptions were made by the Company’s management that affect the reported amounts of assets and liabilities and disclosure of contingent assets and liabilities at the date of the financial statements and the reported amounts of revenue and expenses during the reporting periods. Significant items subject to such estimates and assumptions include revenue recognition, allowances for receivables, the carrying amount of container equipment, the residual values and lives of container equipment, impairment of goodwill and intangible assets, the carrying amount and lives of intangible assets, fair value of stock options and income tax uncertainties. Actual results could differ from those estimates.
(c) Furniture, Fixtures, and Equipment
Furniture and equipment, which include furniture, fixtures, office equipment, and software, are depreciated on a straight-line basis over estimated useful lives of five years with no salvage value.
(d) Container Rental Equipment
The Company depreciates its new dry van container rental equipment over an estimated useful life of 12.5 years (using the straight-line method) to fixed residual values of $850 for 20’, $950 for 40’ and $1,000 for 40’ high cubes. Used containers are depreciated over the number of years remaining from their normal useful life of 12.5 years but no less than two years. Used containers that are over 12.5 years of age at the time of purchase are depreciated over two years. No depreciation is recorded on used containers that are purchased at or below their residual values. The estimated useful life for all other containers is 15 years with a residual value of 15% of their original cost.
The Company reassesses its estimate of residual value and useful life of containers regularly for possible adjustments to those estimates.
(e) Impairment of Long-Lived Assets
The Company’s container rental equipment and intangible assets are reviewed for impairment whenever events or changes in circumstances indicate that the carrying amount of an asset may not be recoverable. Recoverability of assets to be held and used is measured by a comparison of the carrying amount of an asset to estimated undiscounted future cash flows expected to be generated by the asset. If the carrying amount of an asset exceeds its estimated future undiscounted cash flows, an impairment charge is recognized for the amount by which the carrying amount of the asset exceeds the fair value of the asset. Assets to be disposed of are reported at the lower of the carrying amount or fair value less costs to sell, and are no longer depreciated.
Impairment losses on equipment held for sale are included in total operating expenses reported under the container leasing segment of the Company (see Note 16). For the years ended December 31, 2009, 2008 and 2007 the Company recorded impairment losses of $86,000, $331,000, $365,000, respectively, on container rental equipment identified for sale.
(f) Goodwill and Intangible Assets
Goodwill represents the excess of purchase price over the fair value of net assets acquired in a business combination accounted for using the purchase method. Goodwill acquired in a purchase business combination is not amortized, but instead tested for impairment at least annually.
On October 1, 2006, the Company recorded goodwill of $50.2 million and intangible assets of $7.4 million resulting from the application of push down accounting in connection with the Company’s repurchase of its common shares of stock held by Interpool. The purchase price for the incremental ownership the Company
F-8
Table of Contents
acquired from Interpool was based on forecasts and assumptions made on future cash flows. Management had determined that the Company is comprised of two reporting units, container leasing and container management, and allocated $13.8 million and $36.4 million of goodwill, respectively, to each segment. The allocation of the purchase price was based on the expected future cash flow contribution of each segment and goodwill for each reporting unit was determined as the difference between the allocated purchase price and the fair value of the net assets of each reporting unit.
Impairment of goodwill is tested at the reporting unit level annually or more frequently if an event or circumstance occurs that would more likely than not reduce the fair value of a reporting unit below its carrying amount. Factors that would suggest a possible impairment include, but are not limited to, significant decrease in the Company’s stock price, material customer losses, an adverse change in the business climate, an adverse action or assessment by a regulator, unanticipated competition or a loss in key personnel. The impairment test is conducted by comparing the reporting unit’s carrying amount, including goodwill, to the fair value of the reporting unit. The annual goodwill impairment test is performed using a combination of the market and income approaches. If the carrying amount of a reporting unit exceeds its fair value, an indication of goodwill impairment exists and a second step is performed to measure the amount of impairment loss, if any. In the application of the impairment testing, the Company is required to make estimates of future operating trends and resulting cash flows and judgments on discount rates and other variables. During the quarter ended December 31, 2008, the Company recorded a goodwill impairment charge of $50.2 million after a test for impairment was completed (see Note 5).
Intangible assets acquired during the repurchase of its common stock held by Interpool and the acquisition of Consent have been allocated either directly to the relevant unit or on the expected future cash flow contribution of each segment. Intangible assets allocated to the container leasing and container management reporting units, net of accumulated amortization, are $2.6 million and $2.5 million, respectively, as of December 31, 2009.
Intangible assets with definite useful lives are reviewed for impairment whenever events or changes in circumstances indicate an asset’s carrying value may not be recoverable. The Company currently amortizes intangible assets on a straight-line basis over their estimated useful lives as follows:
| Trademarks |
1-10 years | |
| Software |
1-3 years | |
| Contracts-third party |
7 years | |
| Contracts and customer relationships-owned equipment |
5-7 years | |
| Non-compete agreements |
2-3 years |
(g) Finance Leases
Interest on finance leases is recognized using the effective interest method. Lease income is recorded in decreasing amounts over the term of the contract, resulting in a level rate of return on the net investment in direct finance leases.
(h) Debt Fees
To the extent that the Company is required to pay issuance fees or direct costs relating to its revolving line of credit and related party term loan, such fees are amortized over the lives of the related revolving line of credit and the related party term loan using the straight line method and reflected in interest expense. No fees were paid in connection with convertible subordinated debt.
F-9
Table of Contents
(i) Foreign Currency Translation
The accounts of the Company’s foreign subsidiaries have been converted at rates of exchange in effect at year-end for balance sheet accounts and average exchange rates for the year for income statement accounts. The effects of changes in exchange rates in translating foreign subsidiaries’ financial statements are included in stockholders’ equity as accumulated other comprehensive income.
(j) Accounts Receivable (Owned Fleet)
Amounts billed under operating leases for containers owned by the Company are recorded in accounts receivable (owned fleet). The Company estimates an allowance for doubtful accounts for accounts receivable it does not consider fully collectible. The allowance for doubtful accounts is developed based on two key components: (1) specific reserves for receivables which are impaired for which management believes full collection is doubtful; and (2) a general reserve for estimated losses inherent in the receivables. The general reserve is estimated by applying certain percentages ranging from 1.0% on accounts that are one to thirty days overdue, to 100% on accounts that are one year overdue. The allowance for doubtful accounts is reviewed regularly by management and is based on the risk profile of the receivables, credit quality indicators such as the level of past due amounts and non-performing accounts and economic conditions. The Company’s credit committee meets regularly to assess performance of container lessees and to recommend actions to be taken in order to minimize credit risks. Changes in economic conditions or other events may necessitate additions or deductions to the allowance for doubtful accounts. The allowance is intended to provide for losses inherent in the owned fleet’s accounts receivable, and requires the application of estimates and judgments as to the outcome of collection efforts and the realization of collateral, among other things. Changes in the financial condition of the container lessee or an adverse development in negotiations or legal proceedings to obtain payment could result in the actual loss exceeding the estimated allowance. If the financial condition of container lessees were to deteriorate, reducing their ability to make payments, additional allowances may be required, which would decrease net income in the period of the adjustment.
(k) Income Taxes
Income taxes are accounted for using the asset-and-liability method. Under this method, deferred income taxes are recognized for the future tax consequences of differences between the tax bases of assets and liabilities and their financial reporting amounts at each year-end. Deferred tax assets and liabilities are measured using enacted tax rates expected to apply to taxable income in the years in which those temporary differences are expected to be recovered or settled. Valuation allowances are established when it is more likely than not that deferred tax assets will not be recovered.
The Company recognizes the effect of income tax positions only if those positions are more likely than not of being sustained. Recognized income tax positions are measured at the largest amount that is greater than 50% likely of being realized. Changes in recognition or measurement are reflected in the period in which the change in judgment occurs. We record penalties and interest related to unrecognized tax benefits within income tax expense.
(l) Revenue Recognition
The Company provides a range of services to its customers incorporating rental, sale and management of container equipment. Revenue for all forms of service is recognized when earned following the guidelines under FASB ASC 605-Revenue Recognition and FASB ASC 840- Leases. Revenue is reported net of any related sales tax.
Container Rental Revenue
Container rental revenue arises from renting containers owned by the Company to various shipping lines. Rental agreements are typically leases with a fixed term of between one and eight years or short-term master lease agreements where there is no term and the equipment can be returned at any time without penalty. Revenue
F-10
Table of Contents
is recorded on an accruals basis for master lease agreements as these agreements have no fixed term. For long-term leases, revenue is recorded on a straight-line basis when earned according to the terms of the container rental contracts. These contracts are classified as operating leases. Early termination of the container rental contracts subjects the lessee to a penalty, which is included in container rental revenue upon such termination.
Included in container rental revenue is revenue consisting primarily of fees charged to the lessee for handling, delivery, repairs, and fees relating to the Company’s damage protection plan, which are recognized as earned.
Management Fee Revenue and Gain on Sale of Container Portfolios
In addition to renting containers, the Company sells leased container portfolios to investor groups. After the date of sale the Company generally manages the container assets sold to the investor group. The Company has determined that the two deliverables under the arrangements, the sale of the container and the management services, are separate units of accounting, thus revenue is recognized for each unit.
One requirement for the two deliverables to be accounted for as separate units of accounting is that management can determine the fair value of the undelivered item (the management services), when the first item (the sale of containers) is delivered. Assessing fair value evidence requires judgment. In determining fair value the Company has reviewed information from management agreements entered into with container investors on a standalone basis, compared it to information from management agreements entered into with container investors to whom it concurrently has sold portfolios of containers and determined that the fees charged to container investors who have entered into management agreements on a standalone basis were comparable to the fees charged when the Company entered into management agreements with container investors concurrent with the sales of portfolios of containers. The Company has also reviewed information of other container management companies disclosed in publicly available documents, including investment fund prospectuses and competitor financial statements. Accordingly it was able to determine that the fees charged for its management services were comparable to those charged by other container management companies for the same service. As such, the Company has concluded that evidence exists to support its assessment of the fair value of the management services. However, the Company is one of few companies in the business of selling and managing portfolios of leased containers and in the future data may not be available to support its assessment of fair value. Before the adoption of FASB ASU 2009-13, Multiple Deliverable Revenue Arrangement, (see Note 2(o), Recent Accounting Pronouncements below), should fair value evidence not be satisfactory in the future, the gain on sale of container portfolios and the management services may need to be accounted for as one unit of accounting. This would result in the gain on sale of container portfolios being deferred and recognized over the term of the management agreement, which typically ranges from 8 to 10 years, rather than in the period the sale occurs.
Based on the conclusion that the sale of containers and the management services can be accounted for separately, the Company recognizes gain on sale of container portfolios when the sale of the containers is completed. The gain is the difference between the sales price and the net book value of the containers sold.
The Company recognizes revenue from management fees earned under equipment management agreements as earned on a monthly basis. Management fees are typically a percentage of net operating income of each investor group’s fleet calculated on an accruals basis. Included in the Company’s balance sheet are accounts receivable from the managed fleet which are uncollected lease billings related to managed equipment. With the exception of containers managed under pooling agreements, all direct costs (storage, repairs, repositioning etc.) are charged to investors on a specific-identification basis or allocated basis. The Company’s financial statements include accounts payable and accruals of expenses related to managed equipment. The net amount of rentals billed less expenses payable and less management fees is recorded in amounts due to container investors on the balance sheet.
As described above, the Company periodically sells containers to container investors which are generally managed by the Company in return for a management fee. A gain is calculated as the excess of sales proceeds
F-11
Table of Contents
over the net book value of the containers sold. The proceeds from sale of these container portfolios were $5.8 million, $99.8 million and $113.4 million for the years ended December 31, 2009, 2008 and 2007, respectively. The gain on sale of container portfolios was $753,000, $12.4 million and $12.9 million for the years ended December 31, 2009, 2008 and 2007, respectively.
(m) Stock-Based Compensation
The Company granted stock options to its officers and directors and restricted common stock to certain management employees under it 2007 Equity Incentive Plan. The Company has adopted a fair-value-based method of accounting for the plan in which compensation cost is measured at the date the award is granted based on the fair value of the award calculated using the Black-Scholes-Merton stock valuation model. The stock based compensation expense is recognized over the vesting period of the grant. (See Note 12).
(n) Repairs and Maintenance
The Company’s leases require the lessee to pay for any damage to the container beyond normal wear and tear at the end of the lease term. The Company also offers a damage protection plan (“DPP”) pursuant to which the lessee pays a fee in exchange for not being charged for certain damages at the end of the lease term. The Company accounts for repair and maintenance expense on accrual basis when an obligation to pay has been incurred.
(o) Recent Accounting Pronouncements
In June 2009, the Financial Accounting Standards Board (FASB) Accounting Standards Update (“ASU”) 2009-01, previously known as The FASB Accounting Standards Codification™ and the Hierarchy of Generally Accepted Accounting Principles—a replacement of FASB Statement No. 162. The FASB Accounting Standards Codification™ (“ASC”) has become the source of authoritative U.S. generally accepted accounting principles (GAAP) recognized by the FASB to be applied by nongovernmental entities for financial statements issued for interim and annual periods ending after September 15, 2009. Rules and interpretive releases of the Securities and Exchange Commission (SEC) under authority of federal securities laws are also sources of authoritative GAAP for SEC registrants. Since the effective date of this Statement, the Codification has superseded all then-existing non-SEC accounting and reporting standards. All other non-grandfathered non-SEC accounting literature not included in the ASC have become non-authoritative. Following ASU 2009-01, the FASB will not issue new standards in the form of Statements, FASB Staff Positions, or Emerging Issues Task Force Abstracts. Instead, the FASB will issue FASB ASUs, which will serve only to: (a) update the Codification; (b) provide background information about the guidance; and (c) provide the bases for conclusions on the change(s) in the Codification. The application of the provisions of SFAS No. 168 has resulted in revisions to the Company’s references to authoritative GAAP in this filing. The change to ASC as a reference for GAAP did not have any impact to the Company’s financial position, results of operations or cash flows.
In May 2008, the FASB issued Accounting Standards Modification (ASC) 470-20, Debt With Conversion and Other Options, which clarifies the accounting for convertible debt instruments that may be settled in cash (including partial cash settlement) upon conversion. ASC 470-20 requires issuers of applicable convertible debt instruments to account separately for the liability (debt) and equity (conversion option) components in a manner that reflects the issuer’s nonconvertible debt (unsecured debt) borrowing rate. ASC 470-20 requires bifurcation of a component of the convertible debt, classification of that component as equity, and then accretion of the resulting discount on the debt as additional interest expense over the expected term of the debt. ASC 470-20 requires retrospective application to all periods presented.
On January 1, 2009, the Company adopted and retrospectively applied FASB ASC 470-20 in connection with the Company’s $37.5 million convertible note to Interpool, Inc. that was executed in October 2006 and repaid in
F-12
Table of Contents
May 2007. The retrospective application of ASC 470-20 resulted in a $187,000 decrease in net income for the year ended December 31, 2007. The adoption of ASC 470-20 did not have an impact on the Company’s financial position as of December 31, 2007 but increased stockholders equity by $187,000 as of December 31, 2006.
In April 2009, the FASB issued ASC 825-10-50, Financial Instruments. ASC 825-10-50 applies to all financial instruments within the scope of ASC 825-10 Financial Instruments (formerly referenced as Statement of Financial Accounting Standards (“SFAS”) No. 107, Disclosures about Fair Value of Financial Instruments) held by publicly traded companies. This standard amends ASC 825-10 to require disclosures about fair value of financial instruments for interim reporting periods of publicly traded companies as well as in annual financial statements. This standard also amends ASC 270-10, Interim Reporting (formerly referenced as APB Opinion No. 28, Interim Financial Reporting), to require those disclosures in summarized financial information at interim reporting periods. ASC 825-10-50 and ASC 270-10 are effective for the interim reporting periods ending after June 15, 2009, with early adoption permitted for periods ending after March 15, 2009.
In May 2009, the FASB issued ASC 855, Subsequent Events, to establish general standards of accounting for and disclosure of events that occur after the balance sheet date but before financial statements are issued or are available to be issued. In accordance with this Statement, an entity should apply the requirements to interim or annual financial periods ending after June 15, 2009. The Company has adopted ASC 855 and evaluated subsequent events through the date and time the financial statements were issued.
In December 2009, the FASB issued ASU 2009-16, Accounting for Transfer of Financial Assets. This ASU amends the FASB Statement 166, Accounting for Transfers of Financial Assets—an amendment of FASB Statement No. 140. ASU 2009-16 eliminates the concept of a qualifying special-purpose entity, creates more stringent conditions for reporting a transfer of a portion of a financial asset as a sale, clarifies other sale-accounting criteria, and changes the initial measurement of a transferor’s interest in transferred financial assets. ASU 2009-16 is effective for the periods beginning after December 15, 2009 and may not be adopted early. The Company does not expect the adoption of this ASU to have a signification impact to its consolidated financial position or results.
In December 2009, the FASB issued ASU 2009-17, Consolidation (Topic 810): Improvements to Financial Reporting by Enterprises Involved With Variable Interest Entities, which amends FASB Statement No. 167, Amendments to FASB Interpretation No. 46(R). ASU 2009-17 which amends the Variable Interest Entity (“VIE”) Subsections of ASC Subtopic 810-10, Consolidation Overall, revises the test for determining the primary beneficiary of a VIE from a primarily quantitative risk and reward calculation based on the VIE’s expected losses and expected residual returns to a primarily qualitative analysis based on identifying the party or related party group (if any) with: (a) the power to direct the activities that most significantly impact the VIE’s economic performance and, (b) the obligation to absorb losses of, or the right to receive the benefits from, the VIE that could potentially be significant to the VIE. The ASU requires kick out rights and participating rights to be ignored in evaluating whether a variable interest holder meets the power criterion unless those rights are unilaterally exercisable by a single party or related party group. The ASU also revises the criteria for determining whether the fees paid by an entity to a decision maker or another service provider are a variable interest in the entity and revises the Topic 810 scope characteristic that identifies an entity as a VIE if the equity-at-risk investors as a group do not have the right to control the entity through their equity interest to address the impact of kick-out rights and participating rights on the analysis. Finally, the ASU adds a new requirement to reconsider whether an entity is a VIE if the holder of the equity investment at risk as a group lose the power, through the rights of those interests, to direct the activities that most significantly impact the VIE’s economic performance, and requires the Company to reassess on an ongoing basis whether it is deemed to be the primary beneficiary of a VIE. ASU 2009-17 is effective for fiscal years beginning after December 15, 2009, with earlier adoption prohibited. The Company does not expect the adoption of ASU 2009-17 to have a significant impact on its consolidated statement of financial position and results of operations.
F-13
Table of Contents
In August 2009, FASB issued ASU 2009-05, Fair Value Measurements and Disclosures (Topic 820), Measuring Liabilities at Fair Value. The update amends ASC 820-10, Fair Value Measurements and Disclosure—Overall, for the fair value measurement of liabilities. ASU 2009-05 provides clarification where a quoted price in an active market for an identical liability is unavailable, a reporting entity is required to measure fair value using one or more of the techniques prescribed by this amendment. This amendment is effective for interim and annual periods beginning after August 27, 2009. ASU 2009-05 did not have a significant impact to Company’s statement of financial position and results of operations.
In October 2009, the FASB issued ASU No. 2009-13, Multiple Deliverable Revenue Arrangement. ASU 2009-13 sets forth the requirements that must be met for an entity to recognize revenue from the sale of a delivered item that is part of a multiple element arrangement when other items have not yet been delivered. This update amends ASC 605-25, Revenue Recognition—Multiple revenue Arrangements, to eliminate the requirement that all undelivered elements have vendor-specific objective evidence or third party evidence before an entity can recognize the portion of an overall arrangement fee that is attributable to items that have already been delivered. Additionally, this new guidance will require entities to disclose more information about their multiple-revenue arrangements. This consensus will be effective prospectively for revenue arrangements entered into or materially modified on or after June 15, 2010. Early adoption is permitted. If a company elects early adoption and the period of adoption is not the beginning of its fiscal year, the requirements must be applied retrospectively to the beginning of the fiscal year. The Company plans to adopt ASU 2009-13 on the aforementioned effective date and does not expect it to have a material effect on its future financial results.
In January 2010, the FASB issued ASU 2010-06, Fair Value Measurements and Disclosures (topic 820), Improving Disclosures About Fair Value Measurements, which requires new disclosures relating to the transfers in and outs of Level 1 and Level 2 fair value measurements and requires description of the transfers. It also provides clarification on existing disclosures relating to the level of disaggregation and disclosures about inputs and valuation techniques. This ASU is effective for fiscal years beginning after December 15, 2010. The Company does not expect ASU 2010-06 to have a significant impact to its statement of financial position and results of operations.
(3) Acquisition of CAI Consent Sweden AB, formerly Named Consent Equipment AB
On April 30, 2008, the Company entered into a Stock Purchase Agreement with BNS Consent Holding AS, a Norwegian corporation, pursuant to which the Company purchased all of the issued and outstanding capital stock of CAI Consent Sweden AB, (Consent), formerly named Consent Equipment AB, a European container and intermodal equipment leasing company, for $14.6 million in cash (net of $1.3 million cash acquired) and the assumption of approximately $25.7 million of Consent’s debt. Consent is headquartered in Gothenburg, Sweden, and has operations located in Sweden, Germany and the United Kingdom. It owned approximately 4,400 palletwide containers, 1,200 roll trailers and 2,400 German swap bodies as of April 30, 2008. The functional currency of Consent is the Euro.
F-14
Table of Contents
The acquisition was recorded during the second quarter of 2008 using the purchase method of accounting as prescribed under SFAS No. 141, Business Combinations. Accordingly, assets acquired and liabilities assumed were recorded at their fair value estimated by management as of April 30, 2008. The purchase price for the acquisition has been allocated to the assets acquired and liabilities assumed as follows (in thousands):
| Current assets |
$ | 3,445 | ||
| Container rental equipment |
38,847 | |||
| Intangible assets |
2,395 | |||
| Other assets |
1,156 | |||
| Total assets acquired |
45,843 | |||
| Current liabilities, excluding current portion of capital lease obligations |
2,165 | |||
| Deferred income tax liability |
2,134 | |||
| Capital lease obligations |
25,705 | |||
| Total liabilities assumed |
30,004 | |||
| Net assets acquired |
15,839 | |||
| Cash acquired (included in current assets above) |
(1,273 | ) | ||
| Debt assumed (included in liabilities assumed above) |
25,705 | |||
| Purchase price and debt assumed, net of cash acquired |
$ | 40,271 | ||
Adjustments to record the assets acquired and liabilities assumed at fair values include the recognition of $2.4 million of intangible assets as follows:
| Amount (In thousands) |
Estimated Life | ||||
| Trademarks |
$ | 43 | 1 year | ||
| Software |
43 | 1 year | |||
| Contracts and customer relationships-owned equipment |
2,137 | 7 years | |||
| Non-compete agreements |
172 | 2-3 years | |||
The Company’s consolidated results for the year ended December 31, 2008 include the results of Consent from May 1, 2008 through December 31, 2008. Pro forma results are not presented as they are not material to the Company’s overall financial statements.
(4) Restructuring Charges
In October 2009, as part of its cost reduction effort, Company started the process of moving Consent’s office in Sweden to the Company’s European office in the United Kingdom. The Company recorded restructuring charges of $972,000 for the year ended December 31, 2009 covering extended salaries and fringe benefits of terminated employees. The move was completed in February 2010. All restructuring charges were allocated to the container leasing segment. The following details the changes in the restructuring accruals during the year ended December 31, 2009 (in thousands):
| Balance, December 31, 2008 |
$ | — | ||
| Accrued extended salaries and other termination benefits |
972 | |||
| Termination benefits paid to employees during the year |
(89 | ) | ||
| Balance, December 31, 2009 |
$ | 883 | ||
F-15
Table of Contents
(5) Impairment of Goodwill
The Company is required to test its goodwill for impairment at least annually, or more often if there are impairment indicators present. The impairment test is a two-step approach in determining whether, and by how much, goodwill is impaired. The first step requires a comparison of the fair value of the Company’s reporting units (container leasing unit and container management unit) to their respective net book values. The fair value of each reporting unit was evaluated using a combination of the income and market approaches. If the fair value is greater, then no impairment is deemed to have occurred and step 2 is not carried out. If the reporting unit’s fair value is less than its book value, then the second step must be completed to determine the amount, if any, of actual impairment.
During the year ended December 31, 2008, the Company recognized a goodwill impairment charge of $50.2 million. The goodwill charge was primarily a result of the material decline in the market value of the Company’s equity during the fourth quarter of 2008 due to the expected downturn in future economic activity as a result of the global recession and adverse capital market conditions. The impaired goodwill was associated with the Company’s repurchase in October, 2006 of the shares of its common stock previously held by Interpool, Inc. The Company compared its book value with its market value based on the quoted price of the Company’s stock in the fourth quarter of 2008. Based upon the results of step 1, the Company completed step 2 analysis and recognized $50.2 million impairment charge for the year ended December 31, 2008. All goodwill in both of the Company’s reporting units was impaired.
The impairment charge was recorded as a component of operating expenses in the accompanying Consolidated Statements of Operations for the year ended December 31, 2008.
(6) Other Intangible Assets
The Company’s other intangible assets as of December 31, 2009 were as follows:
| Gross Carrying Amount |
Accumulated Amortization |
Net Carrying Amount | ||||||||
| Trademarks |
$ | 1,282 | $ | (448 | ) | $ | 834 | |||
| Software |
539 | (539 | ) | — | ||||||
| Contracts-third party |
3,650 | (1,695 | ) | 1,955 | ||||||
| Contracts and customer relationships-owned equipment |
4,113 | (1,865 | ) | 2,248 | ||||||
| Non-compete agreements |
157 | (109 | ) | 48 | ||||||
| $ | 9,741 | $ | (4,656 | ) | $ | 5,085 | ||||
Amortization recorded for the years ended December 31, 2009, 2008 and 2007 was $1.6 million, $1.5 million, and $1.2 million, respectively. Estimated future amortization expenses are as follows (in thousands):
| 2010 |
$ | 1,400 | |
| 2011 |
$ | 1,263 | |
| 2012 |
$ | 931 | |
| 2013 |
$ | 801 | |
| 2014 and thereafter |
$ | 690 |
F-16
Table of Contents
(7) Container Leases
The Company leases its containers on either short-term operating leases through master lease agreements, long-term non-cancelable operating leases, or finance leases. The following represents future minimum rents receivable under long-term non-cancelable operating and finance leases as of December 31, 2009 (in thousands):
| Long-term operating |
Finance | |||||
| Year ending December 31: |
||||||
| 2010 |
$ | 20,255 | $ | 8,884 | ||
| 2011 |
17,948 | 4,263 | ||||
| 2012 |
16,177 | 2,128 | ||||
| 2013 |
11,802 | 330 | ||||
| 2014 and thereafter |
15,138 | 74 | ||||
| Total minimum rents receivable |
$ | 81,320 | 15,679 | |||
| Less amount representing unearned income |
3,059 | |||||
| Net investment in direct financing leases |
$ | 12,620 | ||||
(8) Revolving Credit Facility, Related Party Term Loan, Capital Lease Obligations and Interest Rate Swap
(a) Revolving Credit Facility
The Company has a senior secured line of credit agreement with a consortium of banks to finance the acquisition of assets and for general working capital purposes. This agreement was amended on May 27, 2008 to increase the maximum credit availability. As of December 31, 2009, the maximum credit commitment under the senior secured line of credit was $290.0 million.
The Company’s senior secured credit facility, including any amounts drawn on the facility, is secured by substantially all of the assets of the Company including the containers owned by the Company, the underlying leases thereon and the Company’s interest in any money received under such contracts. The facility may be increased under certain conditions described in the agreement governing the facility. In addition, there is a commitment fee on the unused amount of the total commitment, payable quarterly in arrears. The agreement provides that swing line loans (short-term borrowings of up to $10.0 million in the aggregate that are payable within 10 business days or at maturity date, whichever comes earlier) and standby letters of credit (up to $15.0 million in the aggregate) will be available to the Company. These credit commitments are part of, and not in addition to, the total commitment provided under the agreement. The interest rates vary depending upon whether the loans are characterized as Base Rate loans or Eurodollar rate loans, as defined in the senior secured credit facility. As of December 31, 2009, the interest rate under the amended agreement was approximately 1.3%. The agreement governing the Company’s senior secured credit facility also contains various financial and other covenants. It also includes certain restrictions on the Company’s ability to incur other indebtedness or pay dividends to stockholders. As of December 31, 2009, the Company was in compliance with the terms of the senior secured credit facility.
As of December 31, 2009, the outstanding balance under the Company’s senior secured revolving credit facility was $152.5 million. As of December 31, 2009, the Company had $137.4 million in availability under the senior secured credit facility (net of $109,000 in letters of credit) subject to our ability to meet the collateral requirements under the agreement governing the facility. The entire amount of the facility drawn at any time plus accrued interest and fees is callable on demand in the event of certain specified events of default. The agreement under the Company’s senior secured credit facility will terminate on September 25, 2012.
F-17
Table of Contents
(b) Related Party Term Loan
On August 20, 2009, the Company signed a $10.0 million five-year loan agreement with the Development Bank of Japan (DBJ). As of the date of closing of the loan agreement, DBJ owned approximately 9.4% of the Company’s outstanding common stock. The loan is payable in 19 quarterly installments of $200,000 starting October 31, 2009 and a final payment of $6.2 million on July 31, 2014. The loan bears a variable interest rate based on BBA LIBOR rate and is secured by a number of container rental equipment owned by the Company. The loan had a balance of $9.8 million and interest rate of 2.7% as of December 31, 2009. The agreement governing the Company’s term loan contains various financial and other covenants. As of December 31, 2009, the Company was in compliance with the terms of the term loan.
The following are the estimated future principal and interest payments under this loan as of December 31, 2009 (in thousands). The payments were calculated assuming interest rate remains the same through maturity of the loan.
| 2010 |
$ | 1,058 | ||
| 2011 |
1,037 | |||
| 2012 |
1,015 | |||
| 2013 |
993 | |||
| 2014 and thereafter |
6,730 | |||
| 10,833 | ||||
| Less: Amount representing interest |
(1,033 | ) | ||
| Related party term loan |
$ | 9,800 | ||
(c) Capital Lease Obligations
As of December 31, 2009, the Company had capital lease obligations of $20.1 million. The underlying obligations are denominated in U.S. Dollars and Euros at fixed and floating interest rates averaging 2.5% as of December 31, 2009 and maturity dates between December 2010 and June 2019. The liability under each lease is secured by the underlying equipment on the lease.
Future payments under capital lease obligations assuming the same average interest rate as of December 31, 2009 is sustained through maturity dates of the obligations are as follows (in thousands):
| 2010 |
$ | 4,280 | ||
| 2011 |
5,435 | |||
| 2012 |
3,578 | |||
| 2013 |
2,997 | |||
| 2014 and thereafter |
5,231 | |||
| 21,521 | ||||
| Less: Amount representing interest |
(1,426 | ) | ||
| Capital lease obligation |
$ | 20,095 | ||
(d) Interest Rate Swap
The Company has an interest rate swap agreement with a European bank. The interest rate swap contract with the bank is based on a notional amount in Euros equivalent to approximately $4.2 million as of December 31, 2009, with a fixed rate of 4.07% against the three-month Euribor rate. The contract expires on July 1, 2010. As of December 31, 2009, the interest liability under the rate swap agreement had a fair value of approximately $70,000. The Company records the monthly change in the fair value of the agreement as an increase or decrease in interest expense. The purpose of the interest rate swap agreement is to manage the risk associated with fluctuations in interest rates.
F-18
Table of Contents
(9) Income Taxes
For the years ended December 31, 2009, 2008 and 2007 income (loss) from continuing operations before taxes consists of the following (in thousands):
| 2009 | 2008 | 2007 | |||||||||
| U.S. operations |
$ | 9,217 | $ | (22,045 | ) | $ | 31,455 | ||||
| Foreign operations |
8,258 | 6,639 | (1,418 | ) | |||||||
Income tax expense (benefit) attributable to income from operations consists of (in thousands):
| Year Ended December 31, 2009 |
Year Ended December 31, 2008 |
Year Ended December 31, 2007 |
||||||||||
| Current: |
||||||||||||
| Federal |
$ | 1,736 | $ | 10,736 | $ | 11,985 | ||||||
| State |
(218 | ) | 777 | 667 | ||||||||
| Foreign |
889 | 972 | 92 | |||||||||
| 2,407 | 12,485 | 12,744 | ||||||||||
| Deferred: |
||||||||||||
| Federal |
1,757 | (1,048 | ) | (1,864 | ) | |||||||
| State |
(368 | ) | (66 | ) | 58 | |||||||
| Foreign |
123 | 176 | 52 | |||||||||
| 1,512 | (938 | ) | (1,754 | ) | ||||||||
| Income tax expense |
$ | 3,919 | $ | 11,547 | $ | 10,990 | ||||||
The reconciliation between the Company’s income tax expense and the amounts computed by applying the U.S. federal income tax rates of 35% for the years ended December 31, 2009, 2008 and 2007 are as follows (in thousands):
| Year Ended December 31, 2009 |
Year Ended December 31, 2008 |
Year Ended December 31, 2007 | |||||||||
| Computed expected tax expense |
$ | 6,116 | $ | (5,392 | ) | $ | 10,513 | ||||
| Non-deductible stock-based compensation |
76 | 47 | 28 | ||||||||
| Provision to tax return true-up |
(451 | ) | — | — | |||||||
| Enactment of California apportionment factor law change |
(313 | ) | — | — | |||||||
| Other permanent differences |
224 | 496 | 7 | ||||||||
| Goodwill impairment |
— | 18,227 | — | ||||||||
| Increase (decrease) in income taxes resulting from: |
|||||||||||
| State income tax expense, net of federal income tax benefit |
145 | (197 | ) | 393 | |||||||
| Foreign tax differential |
(1,878 | ) | (1,634 | ) | 49 | ||||||
| $ | 3,919 | $ | 11,547 | $ | 10,990 | ||||||
As of December 31, 2009, the Company had $38.4 million of net operating loss (NOL) carry forwards to offset future Barbados taxable income. The NOL carry forwards will begin to expire in 2017.
F-19
Table of Contents
The tax effects of temporary differences that give rise to significant portions of the deferred tax assets and deferred tax liabilities as of December 31, 2009 and 2008 are presented below (in thousands):
| 2009 | 2008 | |||||
| Deferred tax assets: |
||||||
| Accounts receivable (owned fleet) |
$ | 433 | $ | 379 | ||
| Accrued expenses and other current liabilities |
67 | 76 | ||||
| State taxes |
— | 241 | ||||
| Unearned revenue |
1,208 | 1,228 | ||||
| Stock-based compensation |
814 | 558 | ||||
| Interest expense |
146 | 114 | ||||
| Tax credits |
72 | — | ||||
| Net operating loss carry forwards |
959 | — | ||||
| Gross deferred tax assets |
3,699 | 2,596 | ||||
| Deferred tax liabilities: |
||||||
| Intangible assets |
1,269 | 1,782 | ||||
| Depreciation and amortization |
24,283 | 20,947 | ||||
| Foreign deferred tax liabilities |
2,397 | 2,658 | ||||
| Deferred subpart F income |
649 | 553 | ||||
| Unrealized gain |
38 | — | ||||
| Change in accounting method |
— | 80 | ||||
| Net deferred tax liability |
$ | 24,937 | $ | 23,424 | ||
The realization of deferred tax assets is dependent upon the generation of future taxable income during the periods in which those temporary differences become deductible. The Company’s management considers the projected future taxable income for making this assessment. Based upon the level of historical taxable income and projections for future taxable income over the periods in which the deferred tax assets are deductible, the Company’s management believes it is more likely than not the Company will realize the benefits of the deductible differences noted above.
Deferred income taxes have not been provided on the undistributed earnings of foreign subsidiaries. As of December 31, 2009, the amount of such earnings totaled approximately $5.7 million. These earnings have been permanently reinvested and the Company does not plan to initiate any action that would precipitate the payment of income taxes thereon. If these earnings were distributed to the United States in the form of dividends or otherwise, the Company would be subject to additional U.S. income taxes of approximately $880,000.
The following table summarizes the activity related to the Company’s unrecognized tax benefits (in thousands):
| Balance at January 1, 2008 |
$ | 1,752 | |
| Increases related to current year tax positions |
— | ||
| Balance at December 31, 2008 |
$ | 1,752 | |
| Increases related to prior year tax positions |
68 | ||
| Increases related to current year tax positions |
6 | ||
| Balance at December 31, 2009 |
$ | 1,826 | |
The unrecognized tax benefits of approximately $1.8 million at December 31, 2009, if recognized, would reduce the Company’s effective tax rate. The Company accrued interest of $88,000 and $120,000 related to
F-20
Table of Contents
unrecognized tax benefits for the years ended December 31, 2009 and 2008, respectively. Total accrued interest was $319,000 and $231,000 for the years ended December 31, 2009 and 2008, respectively.
The Company’s federal tax returns in the United States and state tax returns in the states of California, New Jersey and South Carolina are subject to examination by the tax authorities. The Company accrues for unrecognized tax benefits based upon its best estimate of the additional taxes, interest and penalties expected to be paid. These estimates are updated over time as more definitive information becomes available from taxing authorities, completion of tax audits, expiration of statute of limitations, or upon occurrence of other events. The Company believes the total amount of unrecognized tax benefits as of December 31, 2009 will decrease by approximately $1.7 million in the next twelve months.
As of December 31, 2009, the statutes of limitation for tax examinations in the United States has not expired for the years ended December 31, 2006 through 2008, while the statutes of limitation for tax examinations in the states of California, New Jersey and South Carolina have not expired for tax returns filed for the years December 31, 2005 through 2008.
(10) Related Party Transactions
During the years ended December 31, 2009 and 2008, the Company sold dry van containers to Japanese entities that are both owned 99% by Japan Investment Adviser Co., Ltd. (JIA) and 1% by CAIJ. CAIJ is an 80%- owned subsidiary of CAI with the remaining 20% owned by JIA. JIA is owned and controlled by a Managing Director of CAIJ. Prior to the purchase of containers from the Company, the purchasing entities had received contributions from unrelated Japanese investors, under separate Japanese investment agreements allowed under Japanese commercial laws. The investments were used to purchase container equipment from the Company. Under the terms of the agreements, the CAI related Japanese entities will manage the investments but may outsource the whole or part of each operation to a third party. The profit or loss from each investment will substantially belong to each respective investor.
Pursuant to its services agreement with investors, the purchasing Japanese entities have outsourced the general management of their investment’s operations to CAIJ. The Japanese entities have also entered into equipment management service agreements whereby the Company will manage the leasing of equipment that it sold to the investors. The profit/loss from each investment will belong to its respective investor.
The Japanese entities that purchased the containers from the Company are variable interest entities (VIEs). The Company has a variable interest in each VIE by virtue of its 1% ownership in each of the purchasing entities (through CAIJ) and relationship with JIA which is owned by a related party and owns the remaining 99% of the equity investment in each of the purchasing entities. The Company does not bear the risk of loss nor rewards of ownership in the operations of the purchasing entities and does not consolidate the VIE’s operations in its financial results as all the rights and obligations relating to the profits and losses of the purchasing entities belong to the unrelated investor.
The sale of containers to the VIEs has been recorded on the Company’s books as a sale in the ordinary course of the business, including gain on sale of container portfolios recognized thereon of $753,000 and $488,000 during the years ended December 31, 2009 and 2008, respectively. No sale of containers to VIEs occurred during the year ended December 31, 2007.
On August 20, 2009, the Company signed a $10.0 million five-year loan agreement with the Development Bank of Japan (DBJ). As of the date of closing of the loan agreement, DBJ owned approximately 9.4% of the Company’s outstanding common stock. The loan is payable in 19 quarterly installments of $200,000 starting October 31, 2009 and a final payment of $6.2 million on July 31, 2014. The loan bears a variable interest rate based on BBA LIBOR and is secured by a number of container rental equipment owned by the Company. The loan had a balance of $9.8 million as of December 31, 2009.
F-21
Table of Contents
(11) Capital Stock
On August 12, 2008, the Company sold 750,000 shares of its common stock at $15.50 per share in conjunction with it secondary offering of 2,250,000 shares, which included 1.5 million shares owned by the Company’s Chairman, Hiromitsu Ogawa. The Company’s share of $10.3 million (net of underwriting fees and expenses) from the sale of stock was used to pay part of the Company’s outstanding senior secured credit facility. The Company did not receive any proceeds from the sale of stock by Mr. Ogawa.
In addition to the sale of common stock, the Company received $478,000 in July 2008 from the exercise of 29,610 shares of stock options by a former officer of the Company.
(12) Stock–Based Compensation Plan
(a) Stock Options
The Company grants stock options to its officers, independent directors and certain senior management employees pursuant to its 2007 Equity Incentive Plan (“Plan”) which was adopted on April 23, 2007 and amended on June 5, 2009. The following table summarizes the activity in the Company’s stock option plan for the three years ended December 31, 2009:
| Number of Shares |
Weighted Average Exercise Price |
Weighted Average Remaining Contractual Term (in years) |
Aggregate Intrinsic Value (in thousands) | ||||||||
| Balance at December 31, 2006 |
— | $ | — | — | — | ||||||
| Shares authorized |
|||||||||||
| Options granted—officers |
508,620 | $ | 15.00 | ||||||||
| Options granted—directors |
37,500 | $ | 15.00 | ||||||||
| Options exercised |
— | ||||||||||
| Options cancelled/forfeited |
— | ||||||||||
| Balance at December 31, 2007 |
546,120 | $ | 15.00 | ||||||||
| Options granted—officers |
|||||||||||
| Options granted—directors |
22,500 | $ | 15.30 | ||||||||
| Options exercised |
(29,610 | ) | $ | 15.00 | |||||||
| Options cancelled/forfeited |
(88,830 | ) | $ | 15.00 | |||||||
| Balance at December 31, 2008 |
450,180 | $ | 15.01 | ||||||||
| Additional shares authorized |
|||||||||||
| Options granted—officers |
450,000 | $ | 5.60 | ||||||||
| Options granted—directors |
30,000 | $ | 5.60 | ||||||||
| Options exercised |
— | ||||||||||
| Options cancelled/forfeited |
— | ||||||||||
| Balance at December 31, 2009 |
930,180 | $ | 10.16 | 8.5 | $ | 1,646 | |||||
| Exercisable at December 31, 2009 |
311,991 | $ | 15.02 | 7.5 | $ | — | |||||
| Expected to vest after December 31, 2009 (net of estimated forfeitures) |
584,589 | $ | 7.70 | 9.0 | $ | 1,531 | |||||
The aggregate intrinsic value represents the value by which the Company’s closing stock price on the last trading day of the year ended December 31, 2009 exceeds the exercise price of the stock multiplied by the number of options outstanding or exercisable, excluding options that have a zero or negative intrinsic value. The intrinsic value of stock options exercised during the year ended December 31, 2008 was approximately $89,000. No options were exercised during 2007 and 2009.
F-22
Table of Contents
The total fair value of the stock options granted to the Company’s officers, certain management employees and independent directors at the time of grant was $993,000 or $2.07 per share, $118,000 or $5.26 per share and $3.4 million, or $6.17 per share for the years ended December 31, 2009, 2008 and 2007, respectively, calculated using the Black-Scholes-Merton pricing model under the following assumptions:
| 2009 | 2008* | 2007 | ||||||||||
| Stock Price |
$ | 5.60 | $ | 15.30 | $ | 15.00 | ||||||
| Exercise Price |
$ | 5.60 | $ | 15.30 | $ | 15.00 | ||||||
| Volatility |
35.1 | % | 30.3 | % | 31.9 | % | ||||||
| Expected term—Officers and employees |
6.25 years | N/A | 6.25 years | |||||||||
| Expected term—Independent directors |
5.5 years | 5.5 years | 5.5 years | |||||||||
| Risk free interest rate |
2.83 | % | 3.24 | % | 4.63 | % | ||||||
| Dividend yield |
— | — | — | |||||||||
| * | Assumptions for 2008 relate to stock options granted the independent directors. No stock options were granted to officers and employees. |
An estimated forfeiture rate of 7% was applied and deducted from the resulting calculations for the year ended December 31, 2009 and zero forfeiture rate for the years ended December 31, 2008 and 2007. The forfeiture rate was estimated based on the average forfeiture rates for similar companies for the last four years and the Company’s estimated future forfeitures. The risk-free rate is based on the implied yield on a U.S. Treasury bond with a term approximating the expected term of the option. In the absence of historical data, the assumed volatility factors used in the calculation were derived from the average price volatility of common shares for similar companies as of June 5, 2009 over a period approximating the expected term of the options. As the Company has no historical data, the expected option term is calculated using the simplified method (“Plain Vanilla” approach).
The Company recorded stock-based compensation expense of $816,000, $828,000 and $629,000 relating to stock options for the years ended December 31, 2009, 2008 and 2007, respectively. As of December 31, 2009, the remaining unamortized stock-based compensation cost relating to stock options granted to the Company’s executive officers and management employees was approximately $1.6 million which is to be recognized over the remaining average vesting period of 2.4 years. Unamortized stock-based compensation cost relating to independent directors’ options at December 31, 2009 was approximately $25,000 which is to be recognized over a remaining vesting period of 5 months.
F-23
Table of Contents
(b) Restricted Stock Grant
In addition to stock options granted to officers and independent directors, the Company also granted certain management employees restricted stocks under the Plan. The following table summarizes the activity relating to the Company’s restricted stock for the three years ended December 31, 2009:
| Number of Shares |
Weighted Average Grant Date Fair Value |
Aggregate Intrinsic Value (in thousands) | |||||||
| Balance at December 31, 2006 |
— | $ | — | — | |||||
| Restricted stock granted |
38,876 | $ | 14.94 | ||||||
| Restricted stock vested |
— | ||||||||
| Restricted stock cancelled/forfeited |
(2,819 | ) | $ | 15.00 | |||||
| Balance at December 31, 2007 |
36,057 | $ | 14.93 | ||||||
| Restricted stock granted |
— | ||||||||
| Restricted stock vested |
(12,019 | ) | $ | 14.93 | |||||
| Restricted stock cancelled/forfeited |
(470 | ) | $ | 15.00 | |||||
| Balance at December 31, 2008 |
23,568 | $ | 14.21 | ||||||
| Restricted stock granted |
— | ||||||||
| Restricted stock vested |
(11,546 | ) | $ | 14.93 | |||||
| Restricted stock cancelled/forfeited |
(478 | ) | $ | 15.00 | |||||
| Balance at December 31, 2009 |
11,544 | $ | 14.93 | $ | 104 | ||||
For the years ended December 31, 2009 and 2008, the Company withheld 3,124 shares and 3,339 shares, respectively, from employees to cover minimum withholding taxes on vested restricted stocks. The Company returned the withheld shares to the Equity Incentive Plan to make them available for future grant and paid the applicable taxes to federal and state taxing authorities. The restricted stock have a three-year vesting period, with one third of vested shares issued every 12 months from grant date. Compensation expense relating to restricted stocks for the years ended December 31, 2009, 2008 and 2007 was $176,000, $178,000 and $110,000, respectively. As of December 31, 2009, unrecognized compensation cost related to the restricted stock grants was approximately $61,000 which is expected to be recognized over a weighted average remaining vesting period of 4.6 months.
Compensation expense relating to stock options and restricted stock is recorded as a component of administrative expenses in the Company’s consolidated statement of operations with a corresponding credit to additional paid-in capital in the company’s consolidated balance sheet.
(13) 401K Savings Plan
The Company established a 401(k) plan in January 1995 for certain eligible employees. Company contribution to this plan was entirely at the Company’s discretion. On October 1, 2007, the Company enhanced the plan to cover all of its U.S. employees. Under the enhanced provisions of the plan, an employee may contribute up to the statutory limit of his or her salary into the plan. The Company matches employee contributions up to 4% of qualified compensation. The Company’s contribution vests immediately. Company contribution to the plan for the years ended December 31, 2009, 2008 and 2007 was $158,000, $166,000 and $39,000, respectively.
(14) Gain on Settlement of Lease Obligation and Gain on Disposition of Used Container Equipment
During 2007, the Company terminated certain operating lease contracts with the lessors prior to their expiration in December 2007. The assets covered under the leases included several containers that were lost, damaged and sold by the Company and for which the Company had received cash payments from its sub-lessees.
F-24
Table of Contents
The Company purchased all containers included under the leases (including those that were lost, damaged or sold) and recognized gains totaling $780,000 on the settlement of the lease obligations. Included within the gain on settlement of lease obligation of $780,000 was the inclusion of gains totaling $153,000 that arose in prior periods but had not been previously recorded.
A gain on disposition of used container equipment of $4.4 million was recognized for the year ended December 31, 2007 and is allocated to the container leasing segment as a reduction of operating expenses. It included a previously unrecorded gain of $214,000 that relates to equipment sold in prior periods that had been purchased as part of the operating leases that were terminated in 2005 and 2006.
(15) Fair Value of Financial Instruments
The carrying amount reported in the consolidated balance sheets for cash, accounts receivable, and accounts payable approximates fair value because of the immediate or short-term maturity of these financial instruments. The Company’s outstanding balances on its senior secured credit facility, capital lease obligations, related party term loan and direct finance leases as of December 31, 2009 were estimated to have fair values of approximately $144.5 million, $18.7 million, $9.8 million and $12.6 million, respectively, based on the fair values of their estimated future payments calculated using the prevailing interest rates.
(16) Commitments and Contingencies
The Company utilizes certain office facilities and office equipment under non-cancelable operating lease agreements which generally have original terms of up to five years. Future minimum lease payments required under non-cancellable operating leases having an original term of more than one year as of December 31, 2009 are as follows (in thousands):
| Office facilities and equipment | |||
| Year ending December 31: |
|||
| 2010 |
$ | 930 | |
| 2011 |
276 | ||
| 2012 |
145 | ||
| 2013 |
64 | ||
| 2014 and thereafter |
— | ||
| $ | 1,415 | ||
Office facility expense for the years ended December 31, 2009 and 2008 was $1.2 million each year and $1.1 million for the year ended December 31, 2007, which is included in marketing, general and administrative expense in the statements of operations.
As of December 31, 2009 and 2008, the Company has one outstanding letter of credit of $109,000 and $328,000, respectively. The letter of credit guarantees the Company’s obligations under certain operating lease agreements.
The Company has commitments to purchase approximately $2.6 million of container equipment as of December 31, 2009.
In the ordinary course of business, the Company executes contracts involving indemnifications standard in the industry and indemnifications specific to a transaction such as an assignment and assumption agreement. These indemnifications might include claims related to tax matters, governmental regulations, and contractual relationships. Performance under these indemnities would generally be triggered by a breach of terms of the
F-25
Table of Contents
contract or by a third-party claim. The Company regularly evaluates the probability of having to incur costs associated with these indemnifications and as of December 31, 2009 there were no claims outstanding under such indemnifications nor does the Company believe any future claims are probable of occurring.
The Company entered into an amended and restated employment agreement with Mr. Masaaki (John) Nishibori effective April 9, 2009 in connection with his position as President and Chief Executive Officer. The employment agreement is effective until November 1, 2010 and automatically renews for additional two-year periods, unless the agreement is terminated earlier by the Company for death, disability, company insolvency or “cause” by Mr. Nishibori for “good reason” or by either party with at least 90 days’ written notice prior to the end of the term. Mr. Nishibori will be entitled to receive a cash bonus of up to 100% of his salary if certain percentages of the Company’s budgeted pretax profit are achieved in a specific fiscal year.
The Company entered into an amended and restated employment agreement with Mr. Victor M. Garcia effective April 9, 2009 in connection with his position as Senior Vice President and Chief Financial Officer. The employment agreement was initially effective until November 1, 2009 and automatically renews for additional two-year periods, unless the agreement is terminated earlier by the Company for death, disability, company insolvency or “cause,” by Mr. Garcia for “good reason” or by either party with at least 90 days written notice prior to the end of the term. In addition to being eligible for discretionary cash bonuses, as a result of the successful completion of the Company’s IPO, Mr. Garcia received a cash bonus of $100,000 on November 1, 2009 and will receive an additional cash bonus of $100,000 on November 1, 2010, so long as he remains employed by the Company on such dates. Mr. Garcia may also become entitled to an annual cash bonus of up to 40.0% of his base salary.
On June 5, 2009, Mr. Hiromitsu Ogawa retired as the Company’s Executive Chairman but retained his position as Chairman of the Company’s Board of Directors and signed a compensation agreement with the Company. Under the compensation agreement, Mr. Ogawa shall be entitled to an annual retainer fee of $100,000, payable each calendar quarter in increments of $25,000. The annual retainer fee shall be increased by at least 4% on July 1 of each subsequent year that the agreement is in effect. The compensation is in lieu of the retainer and meeting fees that are payable to other members of the board. In addition to the annual retainer fee, Mr. Ogawa will continue to receive the fringe benefits that he was receiving prior to his retirement as an executive officer of the Company. The agreement is effective for as long as Mr. Ogawa serves as Chairman of the Board or for a period of three years from the date of the agreement.
(17) Segment Information
The Company operates in one industry segment, container leasing, but has two reportable business segments; container leasing and container management.
The container leasing segment derives its revenue via the ownership and leasing of containers to container shipping lines.
The container management segment derives its revenue from management fees earned from portfolios of containers and associated leases which are managed on behalf of container investors. It also derives revenue from the sale of containers, previously owned by the Company, to container investors who in turn enter into management agreements with the Company.
There are no inter-segment revenues.
With the exception of amortization of intangible assets and marketing, general and administrative expenses, operating expenses are allocated directly to the container leasing segment. Amortization of intangible assets relating to owned and third party contracts is allocated directly to the container leasing segment and container management segment, respectively. The amortization of remaining intangible assets relating to the trademark and software is allocated to the segments based on average segment TEUs during the year. Marketing, general and
F-26
Table of Contents
administrative expenses are also allocated to the segments based on average segment TEUs after direct allocation of bad debt expense to the container leasing segment. The Company makes its management decisions based on pretax income, and as such does not allocate income tax expense/benefit to its segments.
The allocation of assets between segments is determined by the direct allocation of the managed accounts receivable, the net carrying value of the intangible asset relating to third party contracts, $36.4 million of goodwill (subsequently impaired on December 31, 2008), and a portion of the intangible asset relating to trademark and software (determined based on the percentage of average TEUs of managed containers to total average TEUs), to the managed container segment. The remaining balance of total assets is allocated to the container leasing business.
The following tables show segment information for the years ended December 31, 2009, 2008 and 2007, reconciled to the Company’s income before taxes as shown in its consolidated statements of operations (in thousands):
| Year Ended December 31, 2009 | Year Ended December 31, 2008 | |||||||||||||||||||||||||||||||
| Container Leasing |
Container Management |
Unallocated | Total | Container Leasing |
Container Management |
Unallocated | Total | |||||||||||||||||||||||||
| Container rental revenue |
$ | 53,747 | $ | — | $ | — | $ | 53,747 | $ | 56,436 | $ | — | $ | — | $ | 56,436 | ||||||||||||||||
| Management fee revenue |
— | 8,546 | — | 8,546 | — | 11,969 | — | 11,969 | ||||||||||||||||||||||||
| Gain on sale of container portfolios |
— | 753 | — | 753 | — | 12,443 | — | 12,443 | ||||||||||||||||||||||||
| Finance lease income |
2,218 | — | — | 2,218 | 2,297 | — | — | 2,297 | ||||||||||||||||||||||||
| Total revenue |
55,965 | 9,299 | — | 65,264 | 58,733 | 24,412 | — | 83,145 | ||||||||||||||||||||||||
| Depreciation of container rental equipment |
17,140 | — | — | 17,140 | 15,824 | — | — | 15,824 | ||||||||||||||||||||||||
| Amortization of intangible assets |
805 | 761 | — | 1,566 | 619 | 915 | — | 1,534 | ||||||||||||||||||||||||
| Impairment of container rental equipment |
86 | — | — | 86 | 331 | — | — | 331 | ||||||||||||||||||||||||
| Gain on disposition of used container equipment |
(3,626 | ) | — | — | (3,626 | ) | (4,155 | ) | — | — | (4,155 | ) | ||||||||||||||||||||
| Equipment rental expense |
— | — | — | — | 20 | — | — | 20 | ||||||||||||||||||||||||
| Storage, handling and other expenses |
8,717 | — | — | 8,717 | 4,854 | — | — | 4,854 | ||||||||||||||||||||||||
| Marketing, general and administrative expenses |
8,042 | 10,806 | — | 18,848 | 7,977 | 12,238 | — | 20,215 | ||||||||||||||||||||||||
| Impairment of goodwill |
— | — | — | — | 13,849 | 36,398 | — | 50,247 | ||||||||||||||||||||||||
| Restructuring charges |
972 | — | — | 972 | — | — | — | — | ||||||||||||||||||||||||
| (Gain) loss on foreign exchange |
(215 | ) | — | — | (215 | ) | 564 | — | — | 564 | ||||||||||||||||||||||
| Total operating expenses |
31,921 | 11,567 | — | 43,488 | 39,883 | 49,551 | — | 89,434 | ||||||||||||||||||||||||
| Operating income (loss) |
24,044 | (2,268 | ) | — | 21,776 | 18,850 | (25,139 | ) | — | (6,289 | ) | |||||||||||||||||||||
| Interest expense |
4,311 | — | — | 4,311 | 9,346 | — | — | 9,346 | ||||||||||||||||||||||||
| Interest income |
— | — | (10 | ) | (10 | ) | — | — | (229 | ) | (229 | ) | ||||||||||||||||||||
| Net interest expense |
4,311 | — | (10 | ) | 4,301 | 9,346 | — | (229 | ) | 9,117 | ||||||||||||||||||||||
| Income (loss) before income taxes |
19,733 | (2,268 | ) | 10 | 17,475 | 9,504 | (25,139 | ) | 229 | (15,406 | ) | |||||||||||||||||||||
| Income tax expense |
— | — | 3,919 | 3,919 | — | — | 11,547 | 11,547 | ||||||||||||||||||||||||
| Net income (loss) |
$ | 19,733 | $ | (2,268 | ) | $ | (3,909 | ) | $ | 13,556 | $ | 9,504 | $ | (25,139 | ) | $ | (11,318 | ) | $ | (26,953 | ) | |||||||||||
| Total assets |
$ | 352,604 | $ | 21,479 | $ | — | $ | 374,083 | $ | 384,716 | $ | 27,912 | $ | — | $ | 412,628 | ||||||||||||||||
F-27
Table of Contents
| Year Ended December 31, 2007 | |||||||||||||||
| Container Leasing |
Container Management |
Unallocated | Total | ||||||||||||
| Container rental revenue |
$ | 38,148 | $ | — | $ | — | $ | 38,148 | |||||||
| Management fee revenue |
— | 12,663 | — | 12,663 | |||||||||||
| Gain on sale of container portfolios |
— | 12,855 | — | 12,855 | |||||||||||
| Finance lease income |
1,206 | — | — | 1,206 | |||||||||||
| Total revenue |
39,354 | 25,518 | — | 64,872 | |||||||||||
| Depreciation of container rental equipment |
8,805 | — | — | 8,805 | |||||||||||
| Amortization of intangible assets |
520 | 721 | — | 1,241 | |||||||||||
| Impairment of container rental equipment |
365 | — | — | 365 | |||||||||||
| Gain on disposition of used container equipment |
(4,400 | ) | — | — | (4,400 | ) | |||||||||
| Gain on settlement of lease obligation |
(780 | ) | — | — | (780 | ) | |||||||||
| Equipment rental expense |
961 | — | — | 961 | |||||||||||
| Storage, handling and other expenses |
3,077 | — | — | 3,077 | |||||||||||
| Marketing, general and administrative expenses |
5,262 | 10,510 | — | 15,772 | |||||||||||
| Gain on foreign exchange |
(104 | ) | — | — | (104 | ) | |||||||||
| Total operating expenses |
13,706 | 11,231 | — | 24,937 | |||||||||||
| Operating income (loss) |
25,648 | 14,287 | — | 39,935 | |||||||||||
| Interest expense |
10,705 | — | — | 10,705 | |||||||||||
| Gain on extinguishment of debt |
(681 | ) | — | — | (681 | ) | |||||||||
| Interest income |
— | — | (126 | ) | (126 | ) | |||||||||
| Net interest expense |
10,024 | — | (126 | ) | 9,898 | ||||||||||
| Income before income taxes |
15,624 | 14,287 | 126 | 30,037 | |||||||||||
| Income tax expense |
— | — | 10,990 | 10,990 | |||||||||||
| Net income |
$ | 15,624 | $ | 14,287 | $ | (10,864 | ) | $ | 19,047 | ||||||
| Total assets |
$ | 296,508 | $ | 62,591 | $ | — | $ | 359,099 | |||||||
Geographic Segment Information
The Company’s container lessees use containers for their global trade utilizing many worldwide trade routes. The Company earns its revenue from international carriers when the containers are in use and carrying cargo around the world. Most of the Company’s leasing related revenue is denominated in U.S. dollars. All of the Company’s containers are used internationally and no one container is domiciled in one particular place for a prolonged period of time. As such, all of the Company’s long-lived assets are considered to be international with no single country of use.
(18) Revenue Concentration
Container Leasing Segment Concentration. Revenue from the Company’s ten largest container lessees represented 45.5% and 46.4% of the revenue from its container leasing segment for the years ended December 31, 2009 and 2008, respectively. Revenue from the Company’s single largest container lessee accounted for 7.3%, or $4.1 million, and 12.0%, or $7.0 million, of revenue from its container leasing segment for the years ended December 31, 2009 and 2008, respectively. The $4.1 million and $7.0 million of revenue represented 6.3% and 8.5% of the Company’s total revenue for the years ended December 31, 2009 and 2008, respectively. The largest lessees of the Company’s owned fleet are often among the largest lessees of its managed fleet. The largest lessees of our managed fleet are responsible for a significant portion of the billings that generate our management fee revenue.
Container Management Segment Concentration. A substantial majority of the Company’s container management segment revenue is derived from container investors associated with five different investment arrangers located in Germany, Switzerland, Austria and Japan. These arrangers are typically in the business of
F-28
Table of Contents
identifying and organizing investors for a variety of investment vehicles and compete with other institutions in these and other countries that perform similar functions.
Container investors associated with the five investment arrangers represented 89.3% and 90.4% of the Company’s container management revenue for the years ended December 31, 2009 and 2008, respectively. Revenue from the two largest container investors, IGB Container GmbH & Co. KG (IGB) and P&R Equipment and Finance Corp. (P&R), represented 31.9%, or $3.0 million, and 21.4% or $2.0 million, respectively, of revenue from the Company’s container management segment during the year ended December 31, 2009. The combined revenue of $5.0 million associated with the two largest investment arrangers represented 7.6% of total revenue for the year ended December 31, 2009. Revenue from the two largest container investors, IGB Container GmbH & Co. KG (IGB) and P&R Equipment and Finance Corp. (P&R), represented 44.2%, or $10.8 million, and 22.7%, or $5.5 million, respectively, of revenue from the Company’s container management segment during the year ended December 31, 2008. The combined revenue of $16.3 million associated with the two largest investment arrangers represented 19.6% of total revenue for the year ended December 31, 2008.
The willingness of investment arrangers to continue to form entities that invest in containers will depend upon a number of factors outside of the Company’s control, including the laws in the countries in which they are domiciled, the tax treatment of an investment or restrictions on foreign investment. If changes in tax laws in any country or other conditions make investments in containers less attractive, the Company will need to identify new container investors in other jurisdictions. If the Company is unable to identify new investors to offset decreases in demand, the gain on sale of container portfolios will decrease almost immediately, and management fee revenues will decrease if existing management agreements that terminate are not replaced by new management agreements.
(19) Earnings per Share
Basic earnings per share is computed by dividing income available to common shareholders by the weighted average number of common shares outstanding for the period. Diluted earnings per share reflects the potential dilution that would occur if securities or other contracts to issue common stock were exercised or converted into common stock; however, potential common equivalent shares are excluded if their effect is anti-dilutive.
Diluted net income per share takes into account the potential conversion of the convertible subordinated note payable and preferred stock purchased with cash to common stock using the “if-converted” method and the treasury stock method for stock options, restricted stock and preferred shares purchased with notes and accounted for as stock options. The following table sets forth the reconciliation of basic and diluted net income per share for the year ended December 31, 2009, 2008 and 2007 (dollars in thousands except per share data):
| Years Ended December 31, | ||||||||||
| 2009 | 2008 | 2007 | ||||||||
| Numerator: |
||||||||||
| Net income (loss) available to common shareholders |
$ | 13,556 | $ | (26,953 | ) | $ | 13,470 | |||
| Interest expense on $37.5 million convertible note, net of tax |
— | — | 735 | |||||||
| Net income (loss) used in calculation of diluted earnings (loss) per share |
$ | 13,556 | $ | (26,953 | ) | $ | 14,205 | |||
| Denominator: |
||||||||||
| Weighted average shares used in the calculation of basic earnings (loss) per share |
17,902 | 17,406 | 14,713 | |||||||
| Effect of dilutive securities: |
||||||||||
| Restricted common stock |
— | — | 4 | |||||||
| $37.5 million convertible note |
— | — | 1,965 | |||||||
| Weighted average shares used in the calculation of diluted earnings (loss) per share |
17,902 | 17,406 | 16,682 | |||||||
| Net income (loss) per share: |
||||||||||
| Basic |
$ | 0.76 | $ | (1.55 | ) | $ | 0.92 | |||
| Diluted |
$ | 0.76 | $ | (1.55 | ) | $ | 0.85 | |||
F-29
Table of Contents
The denominator used in the calculation of diluted income (loss) per share for the years ended December 31, 2009 and 2008 excluded options for 930,000 shares and 450,000 shares, respectively, of common stock granted to officers and directors, and 12,000 shares and 24,000 shares, respectively, of restricted stocks granted to employees because their effect would have been antidilutive. The calculation of diluted earnings per share for the year ended December 31, 2007 excluded the add back of $5.6 million in accretion of preferred stock in the numerator and 237,000 shares of common stock in the denominator because their effect would have been anti-dilutive. In addition, the denominator used in calculating diluted earnings per share for the year ended December 31, 2007 excluded 546,000 shares of common stock options granted to officers and directors because their effect would have been antidilutive.
(20) Selected Quarterly Financial Data (Unaudited)
The following table sets forth key interim financial information for the years ended December 31, 2009 and 2008:
| 2009 Quarters Ended | 2008 Quarters Ended | ||||||||||||||||||||||||
| Dec. 31 | Sept. 30 | June 30 | Mar. 31 | Dec. 31 | Sept. 30 | June 30 | Mar. 31 | ||||||||||||||||||
| (in thousands, except per share amount) | |||||||||||||||||||||||||
| Revenue |
$ | 15,318 | $ | 15,709 | $ | 16,661 | $ | 17,576 | $ | 22,728 | $ | 22,124 | $ | 20,642 | $ | 17,651 | |||||||||
| Operating Expenses |
10,841 | 10,761 | 11,156 | 10,730 | 61,671 | 10,657 | 9,211 | 7,895 | |||||||||||||||||
| Operating income (loss) |
4,477 | 4,948 | 5,505 | 6,846 | (38,943 | ) | 11,467 | 11,431 | 9,756 | ||||||||||||||||
| Net income (loss) |
3,074 | 3,194 | 3,333 | 3,955 | (44,395 | ) | 5,889 | 6,264 | 5,289 | ||||||||||||||||
| Basic and diluted earnings (loss) per share available to common stockholders |
$0.17 | $0.18 | $0.19 | $0.22 | $(2.48 | )(1) | $0.34 | $0.37 | $0.31 | ||||||||||||||||
| (1) | Basic and diluted loss per share available to common shareholders for the quarter ended December 31, 2008 includes the effect of goodwill impairment of $50.2 million or $2.81 loss per share. |
F-30
Table of Contents
Valuation Accounts
(In thousands)
| Balance at Beginning of Period |
Additions Charged to Expense |
Deductions* | Balance at End of Period | ||||||
| December 31, 2007 |
|||||||||
| Accounts receivable, allowance for doubtful accounts |
1,045 | 463 | (978 | ) | 530 | ||||
| December 31, 2008 |
|||||||||
| Accounts receivable, allowance for doubtful accounts |
530 | 599 | (85 | ) | 1,044 | ||||
| December 31, 2009 |
|||||||||
| Accounts receivable, allowance for doubtful accounts |
1,044 | 458 | (82 | ) | 1,420 |
| * | Primarily consists of write-offs, net of recoveries and other adjustments |
F-31
Table of Contents
EXHIBIT INDEX
| Exhibit No. |
Description | |
| 3.1 | Amended and Restated Certificate of Incorporation of CAI International, Inc. (incorporated by reference to Exhibit 3.1 of our Registration Statement on Form S-1, as amended, File No. 333-140496) | |
| 3.2 | Amended and Restated Bylaws of CAI International, Inc. (incorporated by reference to Exhibit 3.1 of our Current Report on Form 8-K, dated March 10, 2009) | |
| 4.1 | Form of Common Stock Certificate (incorporated by reference to Exhibit 4.1 of our Registration Statement on Form S-1, as amended, File No. 333-140496) | |
| 10.1 | Amended and Restated Registration Rights Agreement, dated February 16, 2007, by and among CAI International, Inc., Hiromitsu Ogawa, Ogawa Family Trust dated 7/06/98, Ogawa Family Limited Partnership and DBJ Value Up Fund (incorporated by reference to Exhibit 10.7 of our Registration Statement on Form S-1, as amended, File No. 333-140496) | |
| 10.2* | Form of Indemnification Agreement between CAI International, Inc. and each of its current executive officers and directors (incorporated by reference to Exhibit 10.8 of our Registration Statement on Form S-1, as amended, File No. 333-140496) | |
| 10.3* | 2007 Equity Incentive Plan (incorporated by reference to Appendix A of our Definitive Proxy Statement on Schedule 14A filed with the Commission on April 24, 2009) | |
| ‡‡10.4 | Second Management Agreement between Container Applications International, Inc. and P&R Equipment & Finance Corporation dated March 1, 1996 (incorporated by reference to Exhibit 10.11 of our Registration Statement on Form S-1, as amended, File No. 333-140496) | |
| ‡‡10.5 | Management Agreement between Container Applications International, Inc, P&R Equipment & Finance Corporation and Interpool Containers Limited dated March 14, 2006 (incorporated by reference to Exhibit 10.12 of our Registration Statement on Form S-1, as amended, File No. 333-140496) | |
| 10.6 | Second Amended and Restated Revolving Credit Agreement, dated as of September 25, 2007, by and among CAI International, Inc., Container Applications Limited, various financial institutions, Bank of America, N.A. and the administrative agent, Banc of America Securities LLC as the arranger, LaSalle Bank National Association as the syndication agent and Union Bank of California, N.A. as the documentation agent (incorporated by reference to Exhibit 10.1 of our report on Form 8-K dated September 25, 2007) | |
| 10.7 | Amendment No. 1 to that certain Second Amended and Restated Revolving Credit Agreement, dated as of February 26, 2008, by and among CAI International, Inc., Container Applications Limited, the guarantors listed on the signature pages thereto, various lenders, Bank of America, N.A. as administrative agent for itself and the other lenders and Union Bank of California, N.A. as co-agent for itself and the other lenders (incorporated by reference to Exhibit 10.1 of our report on Form 8-K dated February 26, 2008) | |
| 10.8* | Amended and Restated Employment Agreement effective April 9, 2009 by and between CAI International, Inc. and Masaaki (John) Nishibori (incorporated by reference to Exhibit 10.1 of our quarterly report on Form 10-Q for the fiscal quarter ended March 31, 2009) | |
| 10.9* | Amended and Restated Employment Agreement effective April 9, 2009, by and between CAI International, Inc. and Victor M. Garcia (incorporated by reference to Exhibit 10.2 of our quarterly report on Form 10-Q for the fiscal quarter ended March 31, 2009) | |
| 10.10* | Chairman of the Board Compensation Agreement, effective June 5, 2009, by and between CAI International, Inc. and Hiromitsu Ogawa (incorporated by reference to Exhibit 10.1 to Amendment No. 1 to our quarterly report on Form 10-Q for the fiscal quarter ended June 30, 2009, filed with the Commission on September 21, 2009) | |
I
Table of Contents
| Exhibit No. |
Description | |
| 10.11 | Stock Purchase Agreement, dated as of April 30, 2008, between Container Applications Limited and BNS Consent Holding AS (incorporated by reference to Exhibit 2.1 of our Current Report on Form 8-K, dated May 6, 2008, file No. 001-33388) | |
| 21.1 | Subsidiaries of CAI International, Inc. | |
| 23.1 | Consent of KPMG LLP | |
| 31.1 | Certification of Chief Executive Officer Pursuant to Exchange Act Rule 13a-14(a) | |
| 31.2 | Certification of Chief Financial Officer Pursuant to Exchange Act Rule 13a-14(a) | |
| 32.1 | Certification of Chief Executive Officer Furnished Pursuant to 18 U.S.C. Section 1350, as Adopted Pursuant to Section 906 of the As Sarbanes-Oxley Act of 2002 | |
| 32.2 | Certification of Chief Financial Officer Furnished Pursuant to 18 U.S.C. Section 1350, as Adopted Pursuant to Section 906 of the As Sarbanes-Oxley Act of 2002 | |
| * | Management contract or compensatory plan. |
| ‡‡ | Confidential treatment requested as to portions of this exhibit. Confidential information has been omitted and filed separately with the Securities and Exchange Commission. |
II