Attached files
| file | filename |
|---|---|
| 10-K - THE YORK WATER COMPANY 10K 12-31-09 - YORK WATER CO | form10k123109.htm |
| EX-23 - CONSENT OF PARENTEBEARD LLC - YORK WATER CO | exhibit23-123109.htm |
| EX-31.1 - YWC CERTIFICATION OF CEO - YORK WATER CO | exhibit311-123109.htm |
| EX-31.2 - YWC CERTIFICATION OF CFO - YORK WATER CO | exhibit312-123109.htm |
| EX-32.1 - YWC SECTION 906 CERTIFICATION OF CEO - YORK WATER CO | exhibit321-123109.htm |
| EX-32.2 - YWC SECTION 906 CERTIFICATION OF CFO - YORK WATER CO | exhibit322-123109.htm |
EXHIBIT 13

| 1 | |
| 2 | |
| 4 | |
| 14 | |
| 15 | |
| 16 | |
| 17 | |
| 19 | |
| 20 | |
| 21 | |
| 22 |
(In
thousands of dollars, except per share amounts)
|
Summary
of Operations
|
|||||
|
For
the Year
|
2009
|
2008
|
2007
|
2006
|
2005
|
|
Water
operating revenue
|
$37,043
|
$32,838
|
$31,433
|
$28,658
|
$26,805
|
|
Operating
expenses *
|
19,655
|
18,158
|
17,333
|
15,754
|
14,049
|
|
Operating
income *
|
17,388
|
14,680
|
14,100
|
12,904
|
12,756
|
|
Interest
expense
|
4,780
|
4,112
|
3,916
|
3,727
|
3,423
|
|
Other
income (expenses), net *
|
(517)
|
(509)
|
(78)
|
110
|
(117)
|
|
Income
before income taxes
|
12,091
|
10,059
|
10,106
|
9,287
|
9,216
|
|
Income
taxes
|
4,579
|
3,628
|
3,692
|
3,196
|
3,383
|
|
Net
income
|
$
7,512
|
$
6,431
|
$
6,414
|
$
6,091
|
$
5,833
|
|
Per
Share of Common Stock
|
|||||
|
Book
value
|
$6.92
|
$6.14
|
$5.97
|
$5.84
|
$4.85
|
|
Basic
earnings per share
|
0.64
|
0.57
|
0.57
|
0.58
|
0.56
|
|
Dividends
declared per share
|
0.506
|
0.489
|
0.475
|
0.454
|
0.424
|
|
Weighted
average number of shares
|
|||||
|
outstanding
during the year
|
11,695,155
|
11,298,215
|
11,225,822
|
10,475,173
|
10,359,374
|
|
Utility
Plant
|
|||||
|
Original
cost,
|
|||||
|
net
of acquisition adjustments
|
$259,839
|
$245,249
|
$222,354
|
$202,020
|
$181,756
|
|
Construction
expenditures
|
12,535
|
24,438
|
18,154
|
20,678
|
15,562
|
|
Other
|
|||||
|
Total
assets
|
$248,837
|
$240,442
|
$210,969
|
$196,064
|
$172,296
|
|
Long-term
debt
|
|||||
|
including
current maturities
|
77,568
|
86,353
|
70,505
|
62,335
|
51,874
|
*Certain
prior year amounts have been reclassified to conform to the 2009
presentation.
For
Management's Discussion and Analysis of Financial Condition and Results of
Operations, please refer to page 4.
Market
for Common Stock and Dividends
The
common stock of The York Water Company is traded on the NASDAQ Global Select
Market (Symbol “YORW”). Quarterly price ranges and cash dividends per
share for the last two years follow:
|
2009
|
2008
|
|||||
|
High
|
Low
|
Dividend*
|
High
|
Low
|
Dividend*
|
|
|
1st
Quarter
|
$13.50
|
$9.74
|
$0.126
|
$16.28
|
$14.19
|
$0.121
|
|
2nd
Quarter
|
16.26
|
11.75
|
0.126
|
16.50
|
14.51
|
0.121
|
|
3rd
Quarter
|
17.95
|
13.75
|
0.126
|
15.00
|
6.23
|
0.121
|
|
4th
Quarter
|
15.24
|
13.65
|
0.128
|
13.31
|
10.25
|
0.126
|
*Cash
dividends per share reflect dividends declared at each dividend
date.
Prices
listed in the above table are sales prices as listed on the NASDAQ Global Select
Market. Shareholders of record (excluding individual participants in
securities positions listings) as of December 31, 2009 numbered approximately
1,516.
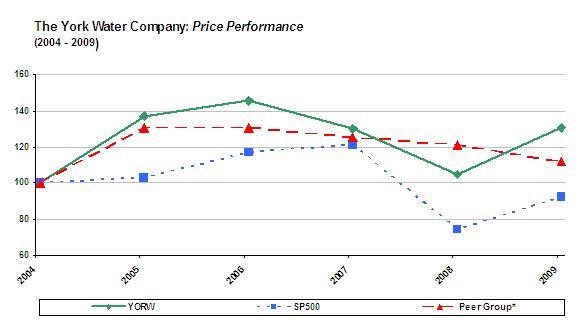
Performance
Graph
The
following line graph presents the annual and cumulative total shareholder return
for The York Water Company Common Stock over a five-year period from 2004
through 2009, based on the market price of the Common Stock and assuming
reinvestment of dividends, compared with the cumulative total shareholder return
of companies in the S&P 500 Index and a peer group made up of publicly
traded water utilities, also assuming reinvestment of dividends. The
peer group companies include: American States, Aqua America, Artesian
Resources, California Water Service, Connecticut Water Service, Middlesex Water,
Pennichuck Corporation, San Jose Water and Southwest Water.
|
2004
|
2005
|
2006
|
2007
|
2008
|
2009
|
|
|
The
York Water Company
|
100.00
|
136.99
|
145.72
|
129.93
|
105.04
|
130.61
|
|
S&P
500 Index
|
100.00
|
103.00
|
117.03
|
121.16
|
74.53
|
92.01
|
|
Peer
Group*
|
100.00
|
130.35
|
130.39
|
125.63
|
121.40
|
111.79
|
*ARTNA,
AWR, CTWS, CWT, MSEX, PNNW, SJW, SWWC, WTR
Source:
FactSet Research Systems Inc.
Dividend
Policy
Dividends
on the Company's common stock are declared by the Board of Directors and are
normally paid in January, April, July and October. Dividends are paid
based on shares outstanding as of the stated record date, which is ordinarily
the last day of the calendar month immediately preceding the dividend
payment.
The
dividend paid on the Company’s common stock on January 15, 2010 was the 556th
consecutive dividend paid by the Company. The Company has paid
consecutive dividends for its entire history, since 1816. The policy
of our Board of Directors is currently to pay cash dividends on a quarterly
basis. The dividend rate has been increased annually for thirteen
consecutive years. The Company’s Board of Directors declared dividend
number 557 in the amount of $0.128 per share at its January 2010
meeting. The dividend is payable on April 15, 2010 to shareholders of
record as of February 26, 2010. Future cash dividends will be
dependent upon the Company’s earnings, financial condition, capital demands and
other factors and will be determined by the Company’s Board of
Directors. See Note 4 to the Company’s financial statements included
herein for restrictions on dividend payments.
Financial
Reports and Investor Relations
Shareholders
may request, without charge, copies of the Company’s financial reports,
including Annual Reports, and Forms 8-K, 10-K and 10-Q filed with the Securities
and Exchange Commission (SEC). Such requests, as well as other
investor relations inquiries, should be addressed to:
|
Kathleen
M. Miller
|
The
York Water Company
|
(717)
845-3601
|
|
Chief
Financial Officer
|
P.
O. Box 15089
|
(800)
750-5561
|
|
York,
PA 17405-7089
|
kathym@yorkwater.com
|
The
Annual Report as well as reports filed with the SEC and other information about
the Company can also be found on the Company's website at: www.yorkwater.com.
of
Financial Condition and Results of Operations
(In
thousands of dollars, except per share amounts)
Forward-looking
Statements
This
Annual Report contains certain matters which are not historical facts, but which
are forward-looking statements. Words such as "may," "should,"
"believe," "anticipate," "estimate," "expect," "intend," "plan" and similar
expressions are intended to identify forward-looking statements. The
Company intends these forward-looking statements to qualify for safe harbor from
liability established by the Private Securities Litigation Reform Act of
1995. These forward-looking statements include certain information
relating to the Company's business strategy; statements including, but not
limited to:
|
|
·
|
expected
profitability and results of
operations;
|
|
|
·
|
goals,
priorities and plans for, and cost of, growth and
expansion;
|
|
|
·
|
strategic
initiatives;
|
|
|
·
|
availability
of water supply;
|
|
|
·
|
water
usage by customers; and
|
|
|
·
|
ability
to pay dividends on common stock and the rate of those
dividends.
|
The
forward-looking statements in this Annual Report reflect what the Company
currently anticipates will happen. What actually happens could differ
materially from what it currently anticipates will happen. The
Company does not intend to make any public announcement when forward-looking
statements in this Annual Report are no longer accurate, whether as a result of
new information, what actually happens in the future or for any other
reason. Important matters that may affect what will actually happen
include, but are not limited to:
|
|
·
|
changes
in weather, including drought
conditions;
|
|
|
·
|
levels
of rate relief granted;
|
|
|
·
|
the
level of commercial and industrial business activity within the Company's
service territory;
|
|
|
·
|
construction
of new housing within the Company's service territory and increases in
population;
|
|
|
·
|
changes
in government policies or
regulations;
|
|
|
·
|
the
ability to obtain permits for expansion
projects;
|
|
|
·
|
material
changes in demand from customers, including the impact of conservation
efforts which may impact the demand of customers for
water;
|
|
|
·
|
changes
in economic and business conditions, including interest rates, which are
less favorable than expected;
|
|
|
·
|
the
ability to obtain financing; and
|
|
|
·
|
other
matters set forth in Item 1A, “Risk Factors,” of the Company's Annual
Report on Form 10-K for the year ended December 31,
2009.
|
Overview
The
Company is the oldest investor-owned water utility in the United States and is
duly organized under the laws of the Commonwealth of
Pennsylvania. The Company has operated continuously since
1816. The business of the Company is to impound, purify to meet or
exceed safe drinking water standards and distribute water. The
Company operates within its franchised territory, which covers 39 municipalities
within York County, Pennsylvania and seven municipalities within Adams County,
Pennsylvania. The Company is regulated by the Pennsylvania Public
Utility Commission, or PPUC, in the areas of billing, payment procedures,
dispute processing, terminations, service territory, debt and equity financing
and rate setting. The Company must obtain PPUC approval before
changing any practices associated with the aforementioned
areas. Water service is supplied through the Company's own
distribution system. The Company obtains its water supply from both
the South Branch and East Branch of the Codorus Creek, which together have an
average daily flow of 73.0 million gallons per day. This combined
watershed area is approximately 117 square miles. The Company has two
reservoirs, Lake Williams and Lake Redman, which together hold up to
approximately 2.2 billion gallons of water. The Company has a 15-mile
pipeline from the Susquehanna River to Lake Redman which provides access to an
additional supply of 12.0 million gallons of untreated water per
day. As of December 31, 2009, the Company's average daily
availability was 35.0 million gallons, and daily consumption was approximately
18.2 million gallons. The Company's service territory had an
estimated population of 180,000 as of December 31, 2009. Industry
within the Company's service territory is diversified, manufacturing such items
as fixtures and furniture, electrical machinery, food products, paper, ordnance
units, textile products, air conditioning systems, laundry detergent, barbells
and motorcycles.
The
Company's business is somewhat dependent on weather conditions, particularly the
amount of rainfall. Revenues are particularly vulnerable to weather
conditions in the summer months. Prolonged periods of hot and dry
weather generally cause increased water usage for watering lawns, washing cars,
and keeping golf courses and sports fields irrigated. Conversely,
prolonged periods of dry weather could lead to drought restrictions from
governmental authorities. Despite the Company's adequate water
supply, customers may be required to cut back water usage under such drought
restrictions which would negatively impact our revenues. The Company
has addressed some of this vulnerability by instituting minimum customer charges
which are intended to cover fixed costs of operations under all likely weather
conditions. In 2009, reduced water consumption, rainfall patterns and
a sluggish economy have combined to reduce per capita consumption by industrial,
commercial and residential customers by approximately 5.7% compared to
2008. If this downward trend continues, the Company's revenues would
be diminished in the short term, making timely and adequate rate filings even
more important.
The
Company's business does not require large amounts of working capital and is not
dependent on any single customer or a very few customers for a material portion
of its business. In 2009, operating revenue was derived from the
following sources and in the following percentages: residential, 63%; commercial
and industrial, 29%; and other, 8%, which is primarily from the provision for
fire service. Increases in revenues are generally dependent on the
Company's ability to obtain rate increases from regulatory authorities in a
timely manner and in adequate amounts and to increase volumes of water sold
through increased consumption and increases in the number of customers
served. The Company continuously looks for acquisition and expansion
opportunities both within and outside its current service
territory. The Company also looks for additional opportunities to
enter into bulk water contracts with municipalities and other entities to supply
water.
During
the five-year period ended December 31, 2009, the Company has maintained an
increasing growth in the number of customers and distribution facilities as
demonstrated by the following chart:
|
2009
|
2008
|
2007
|
2006
|
2005
|
|
|
Average
daily consumption (gallons per day)
|
18,233,000
|
18,298,000
|
19,058,000
|
18,769,000
|
18,657,000
|
|
Miles
of mains at year-end
|
938
|
884
|
845
|
817
|
786
|
|
Additional
distribution
mains
installed/acquired (ft.)
|
286,326
|
206,140
|
147,803
|
159,330
|
212,702
|
|
Number
of customers at year-end
|
62,186
|
61,527
|
58,890
|
57,578
|
55,731
|
|
Population
served at year-end
|
180,000
|
176,000
|
171,000
|
166,000
|
161,000
|
Performance
Measures
Company
management uses financial measures including operating revenues, net income,
earnings per share and return on equity to evaluate its financial
performance. Additional statistical measures including number of
customers, customer complaint rate, annual customer rates and the efficiency
ratio are used to evaluate performance quality. These measures are
calculated on a regular basis and compared with historical information, budget
and the other publicly-traded water companies.
The
Company's 2009 performance was strong under most of the above
measures. Effective October 9, 2008, the PPUC authorized an increase
in rates which allowed the Company to recover some of the increasing expenses
and offset some of the declining per capita water usage by our
customers. In 2009, we issued 1,070,000 additional shares of common
stock through an underwritten public offering. Despite an increase in
net income in 2009 over 2008 of 16.8%, return on equity on year end common
equity fell due to dilution.
The
efficiency ratio, which is calculated as net income divided by revenues, is used
by management to evaluate its ability to keep expenses in line. Over
the five previous years, our ratio averaged 21.3%. In 2009, the ratio
fell slightly to 20.3% due to reduced per capita water usage by our customers
which caused water usage revenues to decline, but not expenses, and increased
expenses, some of which had not yet been included in rates charged to
customers. Despite the reduction in the efficiency ratio, management
is confident that our ratio will again exceed that of our peers. Management continues to
look for ways to decrease expenses and increase efficiency as well as to file
for rate increases promptly when needed.
Results
of Operations
2009
Compared with 2008
Net
income for 2009 was $7,512, an increase of $1,081, or 16.8%, from net income of
$6,431 for 2008. The primary contributing factors to the increase in
net income were higher water revenues which were partially offset by increased
depreciation, higher pension cost, reduced interest capitalized, increased
interest expense on debt and higher salary and wage expense.
Water
operating revenues for the year increased $4,205, or 12.8%, from $32,838 for
2008 to $37,043 for 2009. The primary reasons for the increase in
revenues were a rate increase of 17.9% effective October 9, 2008 and growth in
the customer base. The average number of customers served in 2009
increased as compared to 2008 by 2,414 customers, from 59,483 to 61,897
customers. Approximately 2,050 of the additional customers were due
to the Asbury Pointe and West Manheim acquisitions. Despite this
increase in customers, the total per capita volume of water sold in 2009
decreased compared to 2008 by approximately 5.7%. The largest decline
occurred in the industrial category followed by the commercial and residential
categories. The reduction is attributed to, among other things, a
sluggish economy and rainfall patterns. The Company expects revenues
to remain consistent as the impact of new customers is expected to be offset by
the decline in per capita consumption. Drought warnings or
restrictions as well as regulatory actions could impact results.
Operating
expenses for the year increased $1,497, or 8.2%, from $18,158 for 2008 to
$19,655 for 2009. The increase was primarily due to higher
depreciation of $790 due to increased plant investment, increased pension
expense of $487, higher salary and wage expense of $229 due mainly to the
increased vacation accrual discussed in Note 1 (Reclassifications) and higher
distribution system maintenance expense, chemical expense, power costs, rate
case expense, provision for doubtful accounts, banking fees, realty taxes and
other expenses aggregating approximately $482. The increase was
partially offset by reduced health insurance costs, increased capitalized
overhead, lower transportation expenses and reduced software support and legal
expenses aggregating approximately $491. Depreciation expenses are
expected to continue to rise due to investment in plant and other operating
expenses are expected to increase at a moderate rate as costs to serve customers
and to extend our distribution system continue to rise.
Interest
on debt for 2009 increased $231, or 4.9%, from $4,759 for 2008 to $4,990 for
2009. Interest on the Company's long-term debt increased by $706 due
to an increase in the amount of long-term debt outstanding from new debt issued
on October 15, 2008 in the aggregate principal amount of $15,000 at an interest
rate of 6%. The increased expenses were partially offset by lower
interest on the $12,000 variable rate bonds of approximately $69 due to lower
variable interest rates. Interest on the Company's lines of credit
decreased by $346 due to lower interest rates. The average interest
rate on the lines of credit was 1.41% for 2009 compared to 3.61% for
2008. The average debt outstanding under the lines of credit was
$16,848 for 2009 and $16,128 for 2008. Other long-term interest
decreased $60.
Allowance
for funds used during construction decreased $437, from $647 for 2008 to $210 in
2009, due to a lower volume of eligible construction. Eligible 2008
construction expenditures included an investment in a large water treatment
replacement and expansion project and a main extension to West Manheim Township
that was placed in service in December, 2008.
Other
income (expenses), net for 2009 reflects increased expenses of $8 as compared to
2008. The increase was primarily due to increased charitable
contributions, higher debt cost amortization and other expenses which were
partially offset by reduced retirement expenses.
Income
taxes for 2009 increased by $951, or 26.2%, compared to 2008, primarily due to
an increase in taxable income. The Company's effective tax rate was
37.9% in 2009 and 36.1% in 2008. The increase in the effective tax
rate was due to taxable gains on the surrender of life insurance policies and
bonus depreciation initially being taxable for state tax purposes.
2008
Compared with 2007
Net
income for 2008 was $6,431, an increase of $17, or 0.3%, from net income of
$6,414 for 2007. The primary contributing factors to the increase in
net income were higher water operating revenues partially offset by increased
operating and retirement expenses.
Water
operating revenues for the year increased $1,405, or 4.5%, from $31,433 for 2007
to $32,838 for 2008. The primary reasons for the increase in revenues
were a rate increase effective October 9, 2008, an increased distribution
surcharge through the first three quarters and growth in the customer
base. The average number of customers served in 2008 increased as
compared to 2007 by 993 customers, from 58,490 to 59,483 customers due to growth
in the Company's service territory. The total number of customers
added during the year was approximately 2,600 with approximately 250 of those
customers added in November due to the Asbury Pointe acquisition and
approximately 1,800 customers added in December due to the West Manheim
acquisition. Despite this increase in customers, the total per capita
volume of water sold in 2008 decreased compared to 2007 by approximately
4.1%. Reduced consumption is attributed to a sluggish economy and
increased rainfall.
Operating
expenses for the year increased $825, or 4.8%, from $17,333 for 2007 to $18,158
for 2008. Higher depreciation expense of approximately $395 due to
increased plant investment, increased health insurance costs of approximately
$136, higher banking fees of approximately $103 related to lockbox processing
and credit enhancement, increased pension expense of approximately $96 and
higher salaries of approximately $87 due to wage increases were the principal
reasons for the increase. Higher power costs, legal fees, realty
taxes, transportation costs, director fees and other expenses aggregating
approximately $353 also added to the increase. The increase in
expenses was partially offset by lower software support expenses of
approximately $209, reduced chemical expenses of approximately $89 and lower
shareholder costs of approximately $47.
Interest
on debt for 2008 increased $615, or 14.8%, from $4,144 for 2007 to $4,759 for
2008. Interest on the Company's lines of credit increased by $329 due
to increased borrowings to fund operations and construction. The
average interest rate on the lines of credit was 3.61% for 2008 compared to
5.96% for 2007. The average debt outstanding under the lines of
credit was $16,128 for 2008 and $3,898 for 2007. Interest on the
Company's long-term debt increased by $192 due to an increase in the amount of
long-term debt outstanding from new debt issued on October 15, 2008 in the
aggregate principal amount of $15,000 at an interest rate of
6%. Interest on the $12,000 variable rate bonds increased $58 and
other long-term interest increased $36.
Allowance
for funds used during construction increased $419, from $228 in 2007 to $647 in
2008, due to an increased volume of construction
expenditures. Eligible 2008 construction expenditures included an
investment in a large water treatment replacement and expansion project and a
main extension to West Manheim Township.
Other
income (expenses), net for 2008 reflects increased expenses of $431 as compared
to 2007. The increase was primarily due to higher retirement expenses
of approximately $479. The additional expense resulted from changes
to the plans to make them compliant with Internal Revenue Code Section 409A and
a reduction in the discount rate used in recording the present value of the
benefits. The increase in expenses was partially offset by higher
interest income in 2008 of approximately $53 on water district notes
receivable. Interest income on water district notes receivable in the
first nine months of 2007 included a negative adjustment (expense) due to the
recalculation of a note. Decreased charitable contributions of
approximately $25 also reduced other expenses.
Income
taxes for 2008 decreased by $64, or 1.7%, compared to 2007 primarily due to a
decrease in taxable income. The Company's effective tax rate was
36.1% in 2008 and 36.5% in 2007.
Rate
Developments
From time
to time, the Company files applications for rate increases with the PPUC and is
granted rate relief as a result of such requests. The most recent
rate request was filed by the Company on May 16, 2008 and sought an increase of
$7,086, which would have represented a 19.6% increase in
rates. Effective October 9, 2008, the PPUC authorized an increase in
rates designed to produce approximately $5,950 in additional annual
revenues. The Company anticipates that it will file a rate increase
request in 2010.
Acquisitions
See Note
2 to the Company's financial statements included herein for a discussion of our
acquisitions.
Capital
Expenditures
During
2009, the Company invested $12,535 in construction expenditures for routine
items as well as an additional standpipe and booster station, various
replacements of aging infrastructure, and a main extension to support our
westward expansion. In addition to construction projects, we invested
approximately $2,236 for the acquisition of West Manheim and Beaver Creek
Village water systems and additional expenditures relating to the Asbury Pointe
water system. The Company was able to fund operating activities and
construction expenditures using internally-generated funds, borrowings against
the Company's lines of credit, an underwritten common stock offering, proceeds
from its stock purchase plans (see Note 5 to the Company's financial statements
included herein), customer advances and the distribution surcharge (DSIC)
allowed by the PPUC. The distribution surcharge allows the Company to
add a charge to customers’ bills for qualified replacement costs of certain
infrastructure without submitting a rate filing.
The
Company anticipates construction and acquisition expenditures for 2010 and 2011
of approximately $12,740 and $13,926, respectively. In addition to
routine transmission and distribution projects, a portion of the anticipated
2010 and 2011 expenditures will be for additional standpipes, further upgrades
to water treatment facilities, reinforcement of one of our dams, and various
replacements of aging infrastructure. We intend to use
internally-generated funds for at least half of our anticipated 2010 and 2011
construction and fund the remainder through line of credit borrowings, proceeds
from our stock purchase plans or public offerings, possible long-term debt
offerings, the DSIC and customer advances and contributions (see Note 1 to the
Company's financial statements included herein). Customer advances
and contributions are expected to account for approximately 5% of funding
requirements in 2010 and 15% of funding requirements in 2011. We
believe we will have adequate access to the capital markets, if necessary during
2010, to fund anticipated construction and acquisition
expenditures.
Liquidity
and Capital Resources
Cash
Although
the Company is able to generate funds internally through customer bill payments,
we have not historically maintained cash on the balance sheet. The
Company manages its cash through a cash management account that is directly
connected to a line of credit. Excess cash generated automatically
pays down outstanding borrowings under the line of credit
arrangement. If there are no outstanding borrowings, the cash is
automatically invested in an interest-bearing account
overnight. Likewise, if additional funds are needed, besides what is
generated internally, for payroll, to pay suppliers, or to pay debt service,
funds are automatically borrowed under the line of credit. The cash
management facility has historically provided the necessary liquidity and
funding for our operations and we expect that to continue to be the case for the
foreseeable future.
Internally-generated
Funds
The
amount of internally-generated funds available for operations and construction
depends on our ability to obtain timely and adequate rate relief, our customers’
water usage, weather conditions, customer growth and controlled
expenses. In 2009, we generated $15,801 internally as compared to
$11,527 in 2008 and $10,040 in 2007. A successful rate increase
request, the addition of approximately 2,600 customers and increased
depreciation and deferred income taxes, which are non-cash expenses, helped to
increase cash flow from operating activities during 2009. In addition
to internally-generated funds, we used our bank lines of credit and proceeds
from an underwritten common stock offering to help fund operations and
construction.
Credit
Lines
Historically,
the Company has borrowed $15,000 to $20,000 under its lines of credit before
refinancing with long-term debt or equity capital. As of December 31,
2009, the Company maintained unsecured lines of credit aggregating $33,000 with
three banks. One line of credit includes a $4,000 portion which is
payable upon demand and carries an interest rate of 4.00% or LIBOR plus 0.70%,
whichever is greater, and a $13,000 committed portion with a revolving 2-year
maturity (currently May 2011), which carries an interest rate of LIBOR plus
0.70%. In January 2010, we signed a renewal for this line of credit
which eliminated the 4.00% interest rate floor on the on-demand portion and
raised the interest rate on both portions to LIBOR plus 2.00%. The
Company had $3,054 in outstanding borrowings under the committed portion and no
on-demand borrowings under this line of credit as of December 31,
2009. The second line of credit, in the amount of $11,000, is a
committed line of credit, which matures in May 2010 and carries an interest rate
of LIBOR plus 1.50%. This line of credit has a compensating balance
requirement of $500. The Company had $3,000 in outstanding borrowings
under this line of credit as of December 31, 2009. The third line of
credit, in the amount of $5,000, is a committed line of credit, which matures in
April 2010 and carries an interest rate of LIBOR plus 2.00%. The
Company had $2,000 in outstanding borrowings under this line of credit as of
December 31, 2009. The weighted average interest rate on line of
credit borrowings as of December 31, 2009 was 1.56% compared to 2.32% as of
December 31, 2008. The Company plans to renew the lines of credit
that expire in 2010 under similar terms and conditions.
The
credit and liquidity crisis which began in 2008 has caused substantial
volatility and uncertainty in the capital markets and in the banking industry
resulting in increased borrowing costs and reduced credit
availability. While actual interest rates are currently low, one of
our banks has recently increased the interest rate on our line of credit from
LIBOR plus 70 basis points to LIBOR plus 200 basis points. Although
we have taken steps to manage the risk of reduced credit availability such as
maintaining primarily committed lines of credit that cannot be called on demand
and obtaining a 2-year revolving maturity, there is no guarantee that we will be
able to obtain sufficient lines of credit with favorable terms in the
future. In addition, if we are unable to refinance our line of credit
borrowings with long-term debt or equity when necessary, we may have to
eliminate or postpone capital expenditures. We believe we will have
adequate capacity under our current lines of credit to meet our financing needs
throughout 2010.
Long-term
Debt
The
Company's loan agreements contain various covenants and
restrictions. We believe we are currently in compliance with all of
these restrictions. See Note 4 to the Company's financial statements
included herein for additional information regarding these
restrictions.
The 3.6%
Industrial Development Authority Revenue Refunding Bonds, Series 1994, had a
mandatory tender date of May 15, 2009. The Company retired the $2,700
bonds using funds available under its lines of credit. The 3.75%
Industrial Development Authority Revenue Refunding Bonds, Series 1995, have a
mandatory tender date of June 1, 2010. The Company currently plans to meet its
$4,300 obligation using funds available under its lines of credit or a potential
debt issuance.
The
Company's debt (long-term debt plus current portion of long-term debt) as a
percentage of the total capitalization, defined as total common stockholders’
equity plus long-term debt (including current portion of long-term debt), was
47.2% as of December 31, 2009, compared with 55.3% as of December 31,
2008. While our debt load has trended upward over the years, we have
historically matched increasing debt with increasing equity so that our debt to
total capitalization ratio was nearly fifty percent. This capital
structure has historically been acceptable to the PPUC in that prudent debt
costs and a fair return have been granted by the PPUC in rate
filings. The economic downturn during the latter part of 2008 delayed
the matching increase in equity, resulting in a higher debt ratio and increased
borrowings under our lines of credit. The improved market conditions
in 2009 allowed the Company to complete an underwritten common stock offering
and reduce the percentage of debt in its capital structure. See Note
4 to the Company's financial statements included herein for the details of our
long-term debt outstanding as of December 31, 2009.
Common
Stock
In
September 2009, the Company closed an underwritten public offering of 950,000
shares of its common stock. In October 2009, the underwriters
exercised an over-allotment of 120,000 shares. Boenning &
Scattergood, Inc. and J.J.B. Hilliard, W.L. Lyons, LLC were the underwriters in
the offering. The Company received net proceeds in the offering,
after deducting offering expenses and underwriter’s discounts and commissions,
of approximately $14.1 million. The net proceeds were used to repay a
portion of the Company's borrowings under its line of credit agreements incurred
to fund capital expenditures and acquisitions, and for general corporate
purposes.
Common
stockholders’ equity as a percent of the total capitalization was 52.8% as of
December 31, 2009, compared with 44.7% as of December 31, 2008. It is
the Company's intent to maintain a ratio near fifty percent. Economic
conditions in 2008 caused us to modify our plans to issue common stock due to a
reduced stock price, the potential inability to raise the needed funds and the
prospect of further dilution to our stock value. The improved market
conditions in 2009 allowed the Company to complete an underwritten common stock
offering and increase the percentage of common stockholders’ equity in its
capital structure. We have the ability to issue additional shares of
the Company's common stock in the future under a shelf Registration Statement on
Form S-3 filed with the Securities and Exchange Commission on April 28,
2009.
Credit
Rating
On March
26, 2009, Standard and Poor’s affirmed our credit rating at A-, with a stable
outlook. Our ability to maintain this rating depends, among other
things, on adequate and timely rate relief, which we have been successful in
obtaining, and our ability to fund capital expenditures in a balanced manner
using both debt and equity. In 2010, our objectives will be to
continue to maximize our funds provided by operations and maintain the equity
component of total capitalization.
Dividends
During
2009, the Company's dividend payout ratios relative to net income and cash
provided by operating activities were 80.5% and 37.0%,
respectively. During the fourth quarter of 2009, the Board of
Directors increased the dividend by 1.6% from $0.126 per share to $0.128 per
share per quarter. This was the thirteenth consecutive annual
dividend increase and the 194th consecutive year of paying
dividends.
The
Company's Board of Directors declared a dividend in the amount of $0.128 per
share at its January 2010 meeting. The dividend is payable on April
15, 2010 to shareholders of record as of February 26, 2010. While the
Company expects to maintain this dividend amount in 2010, future dividends will
be dependent upon the Company's earnings, financial condition, capital demands
and other factors and will be determined by the Company's Board of
Directors. See Note 4 to the Company's financial statements included
herein for restrictions on dividend payments.
Inflation
The
Company is affected by inflation, most notably by the continually increasing
costs incurred to maintain and expand its service capacity. The
cumulative effect of inflation results in significantly higher facility
replacement costs which must be recovered from future cash flows. The
ability of the Company to recover this increased investment in facilities is
dependent upon future rate increases, which are subject to approval by the
PPUC. The Company can provide no assurances that its rate increases
will be approved by the PPUC; and, if approved, the Company cannot guarantee
that these rate increases will be granted in a timely or sufficient manner to
cover the investments and expenses for which the rate increase was
sought.
Contractual
Obligations
The
following summarizes the Company's contractual obligations by period as of
December 31, 2009:
|
Payments
due by period
|
|||||||
|
Total
|
2010
|
2011
|
2012
|
2013
|
2014
|
Thereafter
|
|
|
Long-term
debt obligations (a)
|
$77,568
|
$4,341
|
$15,095
|
$42
|
$42
|
$43
|
$58,005
|
|
Interest
on long-term debt (b)
|
66,676
|
4,188
|
4,121
|
4,120
|
4,120
|
4,119
|
46,008
|
|
Short-term
borrowings (c)
|
5,000
|
5,000
|
-
|
-
|
-
|
-
|
-
|
|
Purchase
obligations (d)
|
1,756
|
1,756
|
-
|
-
|
-
|
-
|
-
|
|
Defined
benefit obligations (e)
|
1,218
|
1,218
|
-
|
-
|
-
|
-
|
-
|
|
Deferred
employee benefits (f)
|
4,489
|
229
|
224
|
236
|
226
|
235
|
3,339
|
|
Other
deferred credits (g)
|
1,161
|
343
|
241
|
154
|
99
|
57
|
267
|
|
Total
|
$157,868
|
$17,075
|
$19,681
|
$4,552
|
$4,487
|
$4,454
|
$107,619
|
|
(a)
|
Represents
debt maturities including current maturities. Included in the
table is a payment of $12,000 in 2011 on the variable rate bonds which
would only be due if the bonds were unable to be
remarketed. There is currently no indication of this
happening.
|
|
(b)
|
Excludes
interest on the $12,000 variable rate debt as these payments cannot be
reasonably estimated. The interest rate on this issue is reset
weekly by the remarketing agent based on then current market
conditions. Also excludes interest on the committed line of
credit due to the variability of both the outstanding amount and the
interest rate.
|
|
(c)
|
Represents
obligations under the Company's short-term lines of
credit.
|
|
(d)
|
Represents
an approximation of open purchase orders at year end.
|
|
(e)
|
Represents
contributions expected to be made to qualified defined benefit
plans. The amount of required contributions in 2011 and
thereafter is not currently determinable.
|
|
(f)
|
Represents
the obligations under the Company's Supplemental Retirement and Deferred
Compensation Plans for executives.
|
|
(g)
|
Represents
the estimated settlement payments to be made under the Company's interest
rate swap contract.
|
In
addition to these obligations, the Company makes refunds on Customers’ Advances
for Construction over a specific period of time based on operating revenues
related to developer-installed water mains or as new customers are connected to
and take service from such mains. The refund amounts are not included
in the above table because the timing cannot be accurately
estimated. Portions of these refund amounts are payable annually
through 2020 and amounts not paid by the contract expiration dates become
non-refundable and are transferred to Contributions in Aid of
Construction.
See Note
9 to the Company's financial statements included herein for a discussion of our
commitments.
Critical
Accounting Estimates
The
methods, estimates and judgments we use in applying our accounting policies have
a significant impact on the results we report in our financial
statements. Our accounting policies require us to make subjective
judgments because of the need to make estimates of matters that are inherently
uncertain. Our most critical accounting estimates include: regulatory
assets and liabilities, revenue recognition and accounting for our pension
plans.
Regulatory
Assets and Liabilities
Generally
accepted accounting principles define professional standards for companies whose
rates are established by or are subject to approval by an independent
third-party regulator. In accordance with the professional standards,
the Company defers costs and credits on its balance sheet as regulatory assets
and liabilities when it is probable that these costs and credits will be
recognized in the rate-making process in a period different from when the costs
and credits were incurred. These deferred amounts are then recognized
in the statement of income in the period in which they are reflected in customer
rates. If the Company later finds that these assets and liabilities
cannot be included in rate-making, they are adjusted
appropriately. See Note 1 for additional details regarding regulatory
assets and liabilities.
Revenue
Recognition
Revenues
include amounts billed to metered customers on a cycle basis and unbilled
amounts based on both actual and estimated usage from the latest meter reading
to the end of the accounting period. Estimates are based on average
daily usage for those particular customers. The unbilled revenue
amount is recorded as a current asset on the balance sheet. Actual
results could differ from these estimates and would result in operating revenues
being adjusted in the period in which the actual usage is
known. Based on historical experience, the Company believes its
estimate of unbilled revenues is reasonable.
Pension
Accounting
Accounting
for defined benefit pension plans requires estimates of future compensation
increases, mortality, the discount rate, and expected return on plan assets as
well as other variables. These variables are reviewed annually with
the Company's pension actuary. The Company selected its December 31,
2009 and 2008 discount rates based on the Citigroup Pension Liability
Index. This index uses the Citigroup spot rates for durations out to
30 years and matches them to expected disbursements from the plan over the long
term. The Company believes this index most appropriately matches its
pension obligations. The present values of the Company's future
pension obligations were determined using a discount rate of 6.0% at December
31, 2009 and 2008.
Choosing
a lower discount rate normally increases the amount of pension expense and the
corresponding liability. In the case of the Company, a reduction in
the discount rate would increase its liability, but would not have an impact on
its pension expense. The PPUC, in a previous rate settlement, agreed
to grant recovery of the Company's contribution to the pension plans in customer
rates. As a result, under the professional standards, expense in
excess of the Company's pension plan contribution is deferred as a regulatory
asset and will be expensed as contributions are made to the plans and the
contributions are recovered in customer rates. Therefore, changes in
the discount rate affect regulatory assets rather than pension
expense.
The
Company's estimate of the expected return on plan assets is primarily based on
the historic returns and projected future returns of the asset classes
represented in its plans. The target allocation of pension assets is
50% to 70% equity securities, 30% to 50% debt securities, and 0% to 10%
reserves. The Company used 7% as its estimate of expected return on
assets in both 2009 and 2008. If the Company were to reduce the
expected return, its liability would increase, but its expense would again
remain unchanged because the expense is equal to the Company's contribution to
the plans. The additional expense would instead be recorded as an
increase to regulatory assets.
Other
critical accounting estimates are discussed in the Significant Accounting
Policies Note to the Financial Statements.
Off-Balance
Sheet Transactions
The
Company does not use off-balance sheet transactions, arrangements or obligations
that may have a material current or future effect on financial condition,
results of operations, liquidity, capital expenditures, capital resources or
significant components of revenues or expenses. The Company does not
use securitization of receivables or unconsolidated entities. The Company does
not engage in trading or risk management activities, with the exception of the
interest rate swap agreement discussed in Note 4 to the financial statements,
does not use derivative financial instruments for speculative trading purposes,
has no lease obligations, no guarantees and does not have material transactions
involving related parties.
Impact
of Recent Accounting Pronouncements
See Note
1 to the Company's financial statements included herein for a discussion on the
effect of new accounting pronouncements.
Management’s
Report on Internal Control Over Financial Reporting
Management
of The York Water Company (the “Company”) is responsible for establishing and
maintaining adequate internal control over financial reporting. Internal control
over financial reporting is a process designed to provide reasonable assurance
regarding the reliability of financial reporting and the preparation of
financial statements for external purposes in accordance with generally accepted
accounting principles. A Company's internal control over financial reporting
includes those policies and procedures that pertain to the maintenance of
records that, in reasonable detail, accurately and fairly reflect the
transactions and dispositions of the assets of the company; provide reasonable
assurance that transactions are recorded as necessary to permit preparation of
financial statements in accordance with generally accepted accounting
principles, and that receipts and expenditures of the company are being made
only in accordance with authorizations of management and directors of the
company; and provide reasonable assurance regarding prevention or timely
detection of unauthorized acquisition, use, or disposition of the
company's assets that could have a material effect on the financial
statements.
Because
of its inherent limitations, internal control over financial reporting may not
prevent or detect misstatements. Also, projections of any evaluation of
effectiveness to future periods are subject to the risk that controls may become
inadequate because of changes in conditions, or that the degree of compliance
with the policies or procedures may deteriorate.
Management
evaluated the Company's internal control over financial reporting as of December
31, 2009. In making this assessment, management used the criteria set forth by
the Committee of Sponsoring Organizations of the Treadway Commission in Internal Control-Integrated
Framework (COSO). As a result of this assessment and based on the
criteria in the COSO framework, management has concluded that, as of December
31, 2009, the Company’s internal control over financial reporting was
effective.
The
Company’s independent auditors, ParenteBeard LLC, have audited the Company’s
internal control over financial reporting. Their opinions on the Company’s
internal control over financial reporting and on the Company’s financial
statements appear on the following pages of this annual report.
|
/s/Jeffrey
R. Hines
|
/s/Kathleen
M. Miller
|
||
|
Jeffrey
R. Hines
|
Kathleen
M. Miller
|
||
|
President,
Chief Executive Officer
|
Chief
Financial Officer
|
March 11,
2010
Report
of Independent Registered Public Accounting Firm
To the
Board of Directors and
Stockholders
of The York Water Company
We have
audited The York Water Company’s internal control over financial reporting as of
December 31, 2009, based on criteria established in Internal Control—Integrated
Framework issued by the Committee of Sponsoring Organizations of the
Treadway Commission (COSO). The York Water Company’s management is
responsible for maintaining effective internal control over financial reporting
and for its assessment of the effectiveness of internal control over financial
reporting included in the accompanying Management’s Report on Internal Control
over Financial Reporting. Our responsibility is to express an opinion
on the Company’s internal control over financial reporting based on our
audit.
We
conducted our audit in accordance with the standards of the Public Company
Accounting Oversight Board (United States). Those standards require
that we plan and perform the audit to obtain reasonable assurance about whether
effective internal control over financial reporting was maintained in all
material respects. Our audit of internal control over financial
reporting included obtaining an understanding of internal control over financial
reporting, assessing the risk that a material weakness exists, and testing and
evaluating the design and operating effectiveness of internal control based on
the assessed risk. Our audit also included performing such other
procedures as we considered necessary in the circumstances. We
believe that our audit provides a reasonable basis for our opinion.
A
company’s internal control over financial reporting is a process designed to
provide reasonable assurance regarding the reliability of financial reporting
and the preparation of financial statements for external purposes in accordance
with generally accepted accounting principles. A company’s internal
control over financial reporting includes those policies and procedures that
(1) pertain to the maintenance of records that, in reasonable detail,
accurately and fairly reflect the transactions and dispositions of the assets of
the Company; (2) provide reasonable assurance that transactions are
recorded as necessary to permit preparation of financial statements in
accordance with generally accepted accounting principles, and that receipts and
expenditures of the Company are being made only in accordance with
authorizations of management and directors of the Company; and (3) provide
reasonable assurance regarding prevention or timely detection of unauthorized
acquisition, use, or disposition of the Company’s assets that could have a
material effect on the financial statements.
Because
of its inherent limitations, internal control over financial reporting may not
prevent or detect misstatements. Also, projections of any evaluation
of effectiveness to future periods are subject to the risk that controls may
become inadequate because of changes in conditions, or that the degree of
compliance with the policies or procedures may deteriorate.
In our
opinion, The York Water Company maintained, in all material respects, effective
internal control over financial reporting as of December 31, 2009, based on
criteria established in Internal Control—Integrated
Framework issued by the Committee of Sponsoring Organizations of the
Treadway Commission (COSO).
We have
also audited, in accordance with the standards of the Public Company Accounting
Oversight Board (United States), the balance sheets and the related statements
of income, common stockholders’ equity and comprehensive income, and cash flows
of The York Water Company, and our report dated March 11, 2010 expressed an
unqualified opinion.
/s/ParenteBeard
LLC
ParenteBeard
LLC
York,
Pennsylvania
March 11,
2010
Report
of Independent Registered Public Accounting Firm
To the
Board of Directors and
Stockholders
of The York Water Company
We have
audited the accompanying balance sheets of The York Water Company as of
December 31, 2009 and 2008, and the related statements of income, common
stockholders’ equity and comprehensive income, and cash flows for each of the
years in the three-year period ended December 31, 2009. The York
Water Company’s management is responsible for these financial
statements. Our responsibility is to express an opinion on these
financial statements based on our audits.
We
conducted our audits in accordance with the standards of the Public Company
Accounting Oversight Board (United States). Those standards require
that we plan and perform the audit to obtain reasonable assurance about whether
the financial statements are free of material misstatement. An audit
includes examining, on a test basis, evidence supporting the amounts and
disclosures in the financial statements. An audit also includes
assessing the accounting principles used and significant estimates made by
management, as well as evaluating the overall financial statement
presentation. We believe that our audits provide a reasonable basis
for our opinion.
In our
opinion, the financial statements referred to above present fairly, in all
material respects, the financial position of The York Water Company as of
December 31, 2009 and 2008, and the results of its operations and its cash flows
for each of the years in the three-year period ended December 31, 2009 in
conformity with accounting principles generally accepted in the United States of
America.
We also
have audited, in accordance with the standards of the Public Company Accounting
Oversight Board (United States), The York Water Company’s internal control over
financial reporting as of December 31, 2009, based on criteria established in
Internal Control—Integrated
Framework issued by the Committee of Sponsoring Organizations of the
Treadway Commission (COSO), and our report dated March 11, 2010 expressed an
unqualified opinion.
/s/ParenteBeard
LLC
ParenteBeard
LLC
York,
Pennsylvania
March 11,
2010
|
Balance
Sheets
|
|||||||||
|
(In
thousands of dollars, except per share amounts)
|
|||||||||
| December 31 | |||||||||
|
2009
|
2008
|
||||||||
|
ASSETS
|
|||||||||
|
UTILITY
PLANT, at original cost
|
$ | 262,598 | $ | 246,613 | |||||
|
Plant
acquisition adjustments
|
(2,759 | ) | (1,364 | ) | |||||
|
Accumulated
depreciation
|
(38,364 | ) | (34,429 | ) | |||||
|
Net
utility plant
|
221,475 | 210,820 | |||||||
|
OTHER
PHYSICAL PROPERTY:
|
|||||||||
|
Net
of accumulated depreciation of $175 in 2009
|
|||||||||
|
and
$162 in 2008
|
554 | 562 | |||||||
|
CURRENT
ASSETS:
|
|||||||||
|
Restricted
cash-compensating balance
|
500 | - | |||||||
|
Receivables,
net of reserves of $225 in 2009 and $195 in 2008
|
2,938 | 3,243 | |||||||
|
Unbilled
revenues
|
2,451 | 2,687 | |||||||
|
Recoverable
income taxes
|
- | 131 | |||||||
|
Materials
and supplies inventories, at cost
|
716 | 741 | |||||||
|
Prepaid
expenses
|
387 | 412 | |||||||
|
Deferred
income taxes
|
154 | 133 | |||||||
|
Total
current assets
|
7,146 | 7,347 | |||||||
|
OTHER
LONG-TERM ASSETS:
|
|||||||||
|
Deferred
debt expense
|
1,906 | 2,013 | |||||||
|
Notes
receivable
|
476 | 536 | |||||||
|
Deferred
regulatory assets
|
14,010 | 15,972 | |||||||
|
Other
|
3,270 | 3,192 | |||||||
|
Total
other long-term assets
|
19,662 | 21,713 | |||||||
|
Total
Assets
|
$ | 248,837 | $ | 240,442 | |||||
|
The
accompanying notes are an integral part of these
statements.
|
|||||||||
|
THE
YORK WATER COMPANY
|
||||||||
|
Balance
Sheets
|
||||||||
|
(In
thousands of dollars, except per share amounts)
|
||||||||
| December 31 | ||||||||
|
2009
|
2008
|
|||||||
|
STOCKHOLDERS'
EQUITY AND LIABILITIES
|
||||||||
|
COMMON
STOCKHOLDERS' EQUITY:
|
||||||||
|
Common
stock, no par value, authorized 46,500,000 shares,
|
$ | 73,569 | $ | 57,875 | ||||
|
issued
and outstanding 12,558,724 shares in 2009
|
||||||||
|
and
11,367,248 shares in 2008
|
||||||||
|
Retained
earnings
|
13,353 | 11,891 | ||||||
|
Total
common stockholders' equity
|
86,922 | 69,766 | ||||||
|
PREFERRED
STOCK, authorized 500,000 shares, no shares issued
|
- | - | ||||||
|
LONG-TERM
DEBT, excluding current portion
|
73,227 | 83,612 | ||||||
|
COMMITMENTS
|
- | - | ||||||
|
CURRENT
LIABILITIES:
|
||||||||
|
Short-term
borrowings
|
5,000 | 6,000 | ||||||
|
Current
portion of long-term debt
|
4,341 | 2,741 | ||||||
|
Accounts
payable
|
892 | 2,011 | ||||||
|
Dividends
payable
|
1,393 | 1,192 | ||||||
|
Accrued
taxes
|
488 | 75 | ||||||
|
Accrued
interest
|
1,019 | 1,080 | ||||||
|
Other
accrued expenses
|
1,472 | 1,097 | ||||||
|
Total
current liabilities
|
14,605 | 14,196 | ||||||
|
DEFERRED
CREDITS:
|
||||||||
|
Customers'
advances for construction
|
16,188 | 18,258 | ||||||
|
Deferred
income taxes
|
22,507 | 19,549 | ||||||
|
Deferred
employee benefits
|
8,765 | 9,758 | ||||||
|
Other
deferred credits
|
1,679 | 2,789 | ||||||
|
Total
deferred credits
|
49,139 | 50,354 | ||||||
|
Contributions
in aid of construction
|
24,944 | 22,514 | ||||||
|
Total
Stockholders' Equity and Liabilities
|
$ | 248,837 | $ | 240,442 | ||||
|
The
accompanying notes are an integral part of these
statements.
|
||||||||
|
Statements
of Income
|
||||||||||||
|
(In
thousands of dollars, except per share amounts)
|
||||||||||||
|
Year
Ended December 31
|
||||||||||||
|
2009
|
2008
|
2007
|
||||||||||
|
WATER
OPERATING REVENUES:
|
||||||||||||
|
Residential
|
$ | 23,299 | $ | 20,572 | $ | 19,722 | ||||||
|
Commercial
and industrial
|
10,734 | 9,671 | 9,290 | |||||||||
|
Other
|
3,010 | 2,595 | 2,421 | |||||||||
| 37,043 | 32,838 | 31,433 | ||||||||||
|
OPERATING
EXPENSES:
|
||||||||||||
|
Operation
and maintenance
|
7,067 | 6,749 | 6,593 | |||||||||
|
Administrative
and general
|
7,101 | 6,685 | 6,506 | |||||||||
|
Depreciation
and amortization
|
4,412 | 3,622 | 3,227 | |||||||||
|
Taxes
other than income taxes
|
1,075 | 1,102 | 1,007 | |||||||||
| 19,655 | 18,158 | 17,333 | ||||||||||
|
Operating
income
|
17,388 | 14,680 | 14,100 | |||||||||
|
OTHER
INCOME (EXPENSES):
|
||||||||||||
|
Interest
on debt
|
(4,990 | ) | (4,759 | ) | (4,144 | ) | ||||||
|
Allowance
for funds used during construction
|
210 | 647 | 228 | |||||||||
|
Other
income (expenses), net
|
(517 | ) | (509 | ) | (78 | ) | ||||||
| (5,297 | ) | (4,621 | ) | (3,994 | ) | |||||||
|
Income
before income taxes
|
12,091 | 10,059 | 10,106 | |||||||||
|
Income
taxes
|
4,579 | 3,628 | 3,692 | |||||||||
|
Net
income
|
$ | 7,512 | $ | 6,431 | $ | 6,414 | ||||||
|
Basic
Earnings Per Share
|
$ | 0.64 | $ | 0.57 | $ | 0.57 | ||||||
|
Cash
Dividends Declared Per Share
|
$ | 0.506 | $ | 0.489 | $ | 0.475 | ||||||
|
The
accompanying notes are an integral part of these
statements.
|
||||||||||||
|
Statements
of Common Stockholders' Equity and Comprehensive Income
|
||||||||||||||||
|
(In
thousands of dollars, except per share amounts)
|
||||||||||||||||
|
For
the Years Ended December 31, 2009, 2008 and 2007
|
||||||||||||||||
|
Accumulated
|
||||||||||||||||
|
Other
|
||||||||||||||||
|
Common
|
Retained
|
Comprehensive
|
||||||||||||||
|
Stock
|
Earnings
|
Income
(Loss)
|
Total
|
|||||||||||||
|
Balance,
December 31, 2006
|
$ | 55,558 | $ | 9,904 | $ | (101 | ) | $ | 65,361 | |||||||
|
Net
income
|
- | 6,414 | - | 6,414 | ||||||||||||
|
Other
comprehensive income (loss):
|
||||||||||||||||
|
Unrealized
loss on interest rate swap,
|
||||||||||||||||
|
net
of $125 income tax
|
- | - | (183 | ) | (183 | ) | ||||||||||
|
Reclassification
adjustment for amounts
|
||||||||||||||||
|
recognized
in income, net of $3 income tax
|
- | - | 4 | 4 | ||||||||||||
|
Comprehensive
income
|
6,235 | |||||||||||||||
|
Dividends
($0.475 per share)
|
- | (5,332 | ) | - | (5,332 | ) | ||||||||||
|
Issuance
of common stock under
|
||||||||||||||||
|
dividend
reinvestment and
|
||||||||||||||||
|
employee
stock purchase plans
|
1,008 | - | - | 1,008 | ||||||||||||
|
Balance,
December 31, 2007
|
56,566 | 10,986 | (280 | ) | 67,272 | |||||||||||
|
Net
income
|
- | 6,431 | - | 6,431 | ||||||||||||
|
Other
comprehensive income (loss):
|
||||||||||||||||
|
Reclassification
adjustment for unrealized loss
|
||||||||||||||||
|
on
interest rate swap to regulatory asset,
|
||||||||||||||||
|
net
of $191 income tax
|
- | - | 280 | 280 | ||||||||||||
|
Comprehensive
income
|
6,711 | |||||||||||||||
|
Dividends
($0.489 per share)
|
- | (5,526 | ) | - | (5,526 | ) | ||||||||||
|
Issuance
of common stock under
|
||||||||||||||||
|
dividend
reinvestment, direct stock and
|
||||||||||||||||
|
employee
stock purchase plans
|
1,309 | - | - | 1,309 | ||||||||||||
|
Balance,
December 31, 2008
|
57,875 | 11,891 | - | 69,766 | ||||||||||||
|
Net
income
|
- | 7,512 | - | 7,512 | ||||||||||||
|
Dividends
($0.506 per share)
|
- | (6,050 | ) | - | (6,050 | ) | ||||||||||
|
Issuance
of 1,070,000 shares of common stock
|
14,094 | - | - | 14,094 | ||||||||||||
|
Issuance
of common stock under
|
||||||||||||||||
|
dividend
reinvestment, direct stock and
|
||||||||||||||||
|
employee
stock purchase plans
|
1,600 | - | - | 1,600 | ||||||||||||
|
Balance,
December 31, 2009
|
$ | 73,569 | $ | 13,353 | $ | - | $ | 86,922 | ||||||||
|
The
accompanying notes are an integral part of these
statements.
|
||||||||||||||||
|
Statements
of Cash Flows
|
|||||||||||||
|
(In
thousands of dollars, except per share amounts)
|
|||||||||||||
|
Year
Ended December 31
|
|||||||||||||
|
2009
|
2008
|
2007
|
|||||||||||
|
CASH
FLOWS FROM OPERATING ACTIVITIES:
|
|||||||||||||
|
Net
income
|
$ | 7,512 | $ | 6,431 | $ | 6,414 | |||||||
|
Adjustments
to reconcile net income to net cash provided by operating
activities:
|
|||||||||||||
|
Depreciation
and amortization
|
4,412 | 3,622 | 3,227 | ||||||||||
|
Increase
in deferred income taxes
|
2,515 | 1,911 | 1,143 | ||||||||||
|
Other
|
39 | (166 | ) | (71 | ) | ||||||||
|
Changes
in assets and liabilities:
|
|||||||||||||
|
(Increase)
decrease in accounts receivable, unbilled revenues and recoverable income
taxes
|
440 | (816 | ) | (216 | ) | ||||||||
|
(Increase)
decrease in materials and supplies and prepaid expenses
|
50 | 105 | (38 | ) | |||||||||
|
Increase
in accounts payable, accrued expenses, regulatory
|
|||||||||||||
|
and
other liabilities, and deferred employee benefits and
credits
|
666 | 870 | 103 | ||||||||||
|
Increase
(decrease) in accrued interest and taxes
|
352 | 221 | (52 | ) | |||||||||
|
Increase
in regulatory and other assets
|
(185 | ) | (651 | ) | (470 | ) | |||||||
|
Net
cash provided by operating activities
|
15,801 | 11,527 | 10,040 | ||||||||||
|
CASH
FLOWS FROM INVESTING ACTIVITIES:
|
|||||||||||||
|
Utility
plant additions, including debt portion of allowance for funds used
during
|
|||||||||||||
|
construction
of $117 in 2009, $427 in 2008 and $127 in 2007
|
(12,535 | ) | (24,438 | ) | (18,154 | ) | |||||||
|
Acquisitions
of water systems
|
(2,236 | ) | (259 | ) | (896 | ) | |||||||
|
Increase
in compensating balance
|
(500 | ) | - | - | |||||||||
|
Decrease
in notes receivable
|
60 | 74 | 858 | ||||||||||
|
Net
cash used in investing activities
|
(15,211 | ) | (24,623 | ) | (18,192 | ) | |||||||
|
CASH
FLOWS FROM FINANCING ACTIVITIES:
|
|||||||||||||
|
Customers'
advances for construction and contributions in aid of
construction
|
443 | 804 | 2,447 | ||||||||||
|
Repayments
of customer advances
|
(926 | ) | (1,489 | ) | (1,469 | ) | |||||||
|
Proceeds
of long-term debt issues
|
23,659 | 52,308 | 8,210 | ||||||||||
|
Debt
issuance costs
|
- | (950 | ) | - | |||||||||
|
Repayments
of long-term debt
|
(32,444 | ) | (36,460 | ) | (40 | ) | |||||||
|
Borrowings
(repayments) under short-term line of credit agreements
|
(1,000 | ) | 3,000 | 3,000 | |||||||||
|
Changes
in cash overdraft position
|
(167 | ) | 34 | 277 | |||||||||
|
Issuance
of common stock
|
15,694 | 1,309 | 1,008 | ||||||||||
|
Dividends
paid
|
(5,849 | ) | (5,460 | ) | (5,281 | ) | |||||||
|
Net
cash (used in) provided by financing activities
|
(590 | ) | 13,096 | 8,152 | |||||||||
|
Net
change in cash and cash equivalents
|
- | - | - | ||||||||||
|
Cash
and cash equivalents at beginning of year
|
- | - | - | ||||||||||
|
Cash
and cash equivalents at end of year
|
$ | - | $ | - | $ | - | |||||||
|
Supplemental
disclosures of cash flow information:
|
|||||||||||||
|
Cash
paid during the year for:
|
|||||||||||||
|
Interest,
net of amounts capitalized
|
$ | 4,911 | $ | 4,200 | $ | 3,970 | |||||||
|
Income
taxes
|
1,284 | 1,611 | 2,324 | ||||||||||
|
Supplemental
schedule of non-cash investing and financing activities:
|
|||||||||||||
|
Accounts
payable includes $292 in 2009, $950 in 2008 and $2,311 in 2007 for the
construction of utility plant.
|
|||||||||||||
|
Accounts
payable and other deferred credits includes $19 in 2009, $93 in 2008 and
$173 in 2007 for the acquisition of water systems.
|
|||||||||||||
|
Contributions
in aid of construction includes $51 of contributed land in
2008.
|
|||||||||||||
|
The
accompanying notes are an integral part of these
statements.
|
|||||||||||||
(In
thousands of dollars, except per share amounts)
|
1.
|
Significant
Accounting Policies
|
The
business of The York Water Company is to impound, purify and distribute
water. The Company operates within its franchised territory located
in York and Adams Counties, Pennsylvania, and is subject to regulation by the
Pennsylvania Public Utility Commission, or PPUC.
The
following summarizes the significant accounting policies employed by The York
Water Company.
Utility
Plant and Depreciation
The cost
of additions includes contracted cost, direct labor and fringe benefits,
materials, overhead and, for certain utility plant, allowance for funds used
during construction. In accordance with regulatory accounting
requirements, water systems acquired are recorded at estimated original cost of
utility plant when first devoted to utility service and the applicable
depreciation is recorded to accumulated depreciation. The difference
between the estimated original cost less applicable accumulated depreciation,
and the purchase price is recorded as an acquisition adjustment within utility
plant. At December 31, 2009 and 2008, utility plant includes a credit
acquisition adjustment of $2,759 and $1,364, respectively. The
acquisition of West Manheim water assets yielded a negative acquisition
adjustment of $1,440. The acquisition of Beaver Creek Village water
assets yielded a negative acquisition adjustment of $26. In 2008, the
acquisition of Asbury Pointe water assets yielded a negative acquisition
adjustment of $207. Additional acquisition expenditures in 2009 of
$22 resulted in a reduction of the negative acquisition adjustment to
$185. The net acquisition adjustment is being amortized over the
remaining life of the respective assets. Amortization amounted to $49
in 2009, $27 in 2008, and $28 in 2007.
Upon
normal retirement of depreciable property, the estimated or actual cost of the
asset is credited to the utility plant account, and such amounts, together with
the cost of removal less salvage value, are charged to the reserve for
depreciation. To the extent the Company recovers cost of removal or
other retirement costs through rates after the retirement costs are incurred, a
regulatory asset is reported. Gains or losses from abnormal
retirements are reflected in income currently.
The
Company charges to maintenance expense the cost of repairs and replacements and
renewals of minor items of property. Maintenance of transportation
equipment is charged to clearing accounts and apportioned therefrom in a manner
similar to depreciation. The cost of replacements, renewals and
betterments of units of property is capitalized to the utility plant
accounts.
The
straight-line remaining life method is used to compute depreciation on utility
plant cost, exclusive of land and land rights. Annual provisions for
depreciation of transportation and mechanical equipment included in utility
plant are computed on a straight-line basis over the estimated service
lives. Such provisions are charged to clearing accounts and
apportioned therefrom to operating expenses and other accounts in accordance
with the Uniform System of Accounts as prescribed by the PPUC.
The
following remaining lives are used for financial reporting
purposes:
|
December
31,
|
Approximate
range
|
|||||
|
Utility Plant Asset
Category
|
2009
|
2008
|
of
remaining lives
|
|||
|
Mains
and accessories
|
$138,738
|
$128,142
|
13
– 85 years
|
|||
|
Services,
meters and hydrants
|
53,195
|
49,544
|
22
– 54 years
|
|||
|
Operations
structures, reservoirs and
|
||||||
|
water
tanks
|
39,928
|
38,620
|
9 –
66 years
|
|||
|
Pumping
and purification equipment
|
16,167
|
14,891
|
7 –
25 years
|
|||
|
Office,
transportation and
|
||||||
|
operating
equipment
|
9,212
|
9,152
|
3-
21 years
|
|||
|
Land
and other non-depreciable assets
|
2,963
|
2,821
|
-
|
|||
|
Utility
plant in service
|
260,203
|
243,170
|
||||
|
Construction
work in progress
|
2,395
|
3,443
|
-
|
|||
|
Total
Utility Plant
|
$262,598
|
$246,613
|
||||
The
effective rate of depreciation was 2.10% in 2009, 1.94% in 2008, and 1.98% in
2007 on average utility plant, net of customers' advances and
contributions. Larger depreciation provisions resulting from
allowable accelerated methods are deducted for tax purposes.
Accounts
Receivable
Accounts
receivable are stated at outstanding balances, less a reserve for doubtful
accounts. The reserve for doubtful accounts is established through
provisions charged against income. Accounts deemed to be
uncollectible are charged against the reserve and subsequent recoveries, if any,
are credited to the reserve. The reserve for doubtful accounts is
maintained at a level considered adequate to provide for losses that can be
reasonably anticipated. Management's periodic evaluation of the
adequacy of the reserve is based on past experience, agings of the receivables,
adverse situations that may affect a customer's ability to pay, current economic
conditions, and other relevant factors. This evaluation is inherently
subjective. Unpaid balances remaining after the stated payment terms
are considered past due.
Revenues
Revenues
include amounts billed to customers on a cycle basis and unbilled amounts based
on actual and estimated usage from the latest meter reading to the end of the
accounting period.
Deferred
Debt Expense
Deferred
debt expense is amortized on a straight-line basis over the term of the related
debt.
Notes
Receivable
Notes
receivable are recorded at cost and represent amounts due from various
municipalities for construction of water mains into their particular
municipality. Management, considering current information and events
regarding the borrowers' ability to repay their obligations, considers a note to
be impaired when it is probable that the Company will be unable to collect all
amounts due according to the contractual terms of the note
agreement. When a note is considered to be impaired, the carrying
value of the note is written down. The amount of the impairment is
measured based on the present value of expected future cash flows discounted at
the note's effective interest rate.
Regulatory
Assets and Liabilities
The
Company is subject to the provisions of generally accepted accounting principles
regarding rate-regulated entities. The professional standards provide
for the recognition of regulatory assets and liabilities as allowed by
regulators for costs or credits that are reflected in current customer rates or
are considered probable of being included in future rates. The
regulatory assets or liabilities are then relieved as the cost or credit is
reflected in rates. Regulatory assets represent costs that are
expected to be fully recovered from customers in future rates while regulatory
liabilities represent amounts that are expected to be refunded to customers in
future rates. These deferred costs have been excluded from the
Company’s rate base and, therefore, no return is being earned on the unamortized
balances.
Regulatory
assets and liabilities are comprised of the following:
|
December
31,
|
Remaining
Recovery
|
||||
|
2009
|
2008
|
Periods
|
|||
|
Assets
|
|||||
|
Income
taxes
|
$3,706
|
$3,291
|
Various
|
||
|
Postretirement
benefits
|
8,632
|
9,764
|
10-20
years
|
||
|
Unrealized
swap losses
|
949
|
2,037
|
1-20
years
|
||
|
Utility
plant retirement costs
|
600
|
590
|
5
years
|
||
|
Rate
case filing expenses
|
123
|
290
|
1 -
3 years
|
||
|
$14,010
|
$15,972
|
||||
|
Liabilities
|
|||||
|
Income
taxes
|
$853
|
$861
|
1-50
years
|
||
Certain
items giving rise to deferred state income taxes, as well as a portion of
deferred federal income taxes related primarily to differences between book and
tax depreciation expense, are recognized for ratemaking purposes on a cash or
flow-through basis and will be recovered in rates as they reverse.
Postretirement
benefits include (a) deferred pension expense in excess of contributions made to
the plans, and (b) the underfunded status of the pension plans. The
underfunded status represents the excess of the projected benefit obligation
over the fair market value of the assets. Both are expected to be
recovered in future years as additional contributions are made. The
recovery period is dependent on contributions made to the plans and the discount
rate used to value the obligations. The period is estimated at
between 10 and 20 years.
Beginning
October 1, 2008, the Company began using regulatory accounting treatment to
defer the mark-to-market unrealized gains and losses on its interest rate swap
to reflect that the gain or loss is included in the ratemaking formula when the
transaction actually settles. The value of the swap as of the balance
sheet date is recorded as part of other deferred credits. Realized
gains or losses on the swap will be recorded as interest expense in the
statement of income over its remaining life of 20 years.
The
regulatory asset for utility plant retirement costs, including cost of removal,
represents costs already incurred which are expected to be recovered over a
five-year period in rates, through depreciation expense. Rate case
filing expenses are deferred and amortized over a period of 1-3
years.
Regulatory
liabilities relate mainly to deferred investment tax credits, and additionally
to deferred taxes related to postretirement death benefits and bad
debts. These liabilities will be given back to customers in rates as
tax deductions occur over the next 1-50 years. Regulatory liabilities
are part of other accrued expenses and other deferred credits on the balance
sheets.
Materials
and Supplies Inventories
Materials
and supplies inventories are stated at cost. Costs are determined
using the average cost method.
Other
Assets
Other
assets consist mainly of the cash value of life insurance policies held as an
investment by the Company for reimbursement of costs and benefits associated
with its supplemental retirement and deferred compensation
programs.
Customers'
Advances for Construction
Customer
advances are cash payments from developers, municipalities, customers or
builders for construction of utility plant, and are refundable upon completion
of construction, as operating revenues are earned. If the Company
loaned funds for construction to the customer, the refund amount is credited to
the note receivable rather than paid out in cash. After all refunds
to which the customer is entitled are made, any remaining balance is transferred
to contributions in aid of construction. From 1986 – 1996 when
customer advances were taxable income to the Company, additional funds were
collected from customers to cover the taxes. Those funds were
recorded as a liability within Customer Advances and are being amortized as
deferred income over the tax life of the underlying assets.
Contributions
in Aid of Construction
Contributions
in Aid of Construction is composed of (i) direct, non-refundable contributions
from developers, customers or builders for construction of water infrastructure
and (ii) customer advances that have become
non-refundable. Contributions in aid of construction are deducted
from the Company’s rate base, and therefore, no return is earned on property
financed with contributions. The PPUC requires that contributions
received remain on the Company’s balance sheet indefinitely as a long-term
liability.
Comprehensive
Income
Accounting
principles generally accepted in the United States of America require that
recognized revenue, expenses, gains and losses be included in net
income. Although certain changes in assets and liabilities, such as
unrealized gains and losses on interest rate swaps, are usually reported as a
separate component of the equity section of the balance sheet, such items, along
with net income, are components of comprehensive income. Since
December 31, 2008, the Company has used regulatory accounting for its unrealized
gains and losses on its interest rate swap, and will no longer report
comprehensive income for this item in the future.
Interest
Rate Swap Agreement
The
Company is exposed to certain risks relating to its ongoing business
operations. The primary risk managed by using derivative instruments
is interest rate risk. The Company utilizes an interest rate swap
agreement to convert a portion of its variable-rate debt to a fixed
rate. The Company had designated the interest rate swap agreement as
a cash flow hedge. Interest rate swaps are contracts in which a
series of interest rate cash flows are exchanged over a prescribed
period. The notional amount on which the interest payments are based
is not exchanged. The interest rate swap agreement is classified as a
financial derivative used for non-trading activities.
The
professional standards regarding accounting for derivatives and hedging
activities requires companies to recognize all derivative instruments as either
assets or liabilities at fair value on the balance sheet. In
accordance with the standards, the interest rate swap is recorded on the balance
sheet in other deferred credits at fair value. Prior to October 1,
2008, the Company used hedge accounting to record its swap
transactions. The effective portion of the gain or loss on a
derivative designated and qualifying as a cash flow hedging instrument was
initially reported as a component of other comprehensive income and subsequently
reclassified into earnings as interest expense in the same period or periods
during which the hedged transaction affected earnings. The
ineffective portion of the gain or loss on the derivative instrument was
recognized in earnings.
The
Company began using regulatory accounting treatment rather than hedge accounting
to defer the unrealized gains and losses on its interest rate swap on October 1,
2008. Instead of the effective portion being recorded as other
comprehensive income and the ineffective portion being recognized in earnings,
the entire unrealized swap value is now recorded as a regulatory
asset. Based on current ratemaking treatment, the Company expects the
gains and losses to be recognized in rates and interest expense as the swap
settlements occur. Swap settlements are recorded in the income
statement with the hedged item as interest expense. During the year
ended December 31, 2009, $381 was reclassified from regulatory assets to
interest expense as a result of swap settlements. The overall swap
result was a gain of $708 for the year ended December 31,
2009. During the twelve months ending December 31, 2010, the Company
expects to reclassify $334 (before tax) from regulatory assets to interest
expense.
The
interest rate swap will expire on October 1, 2029.
Income
Taxes
Certain
income and expense items are accounted for in different time periods for
financial reporting than for income tax reporting purposes.
Income
taxes are accounted for under the asset and liability
method. Deferred tax assets and liabilities are recognized for the
future tax consequences attributable to differences between the financial
statement carrying amounts of existing assets and liabilities and their
respective tax bases and tax credit carryforwards. Deferred tax
assets and liabilities are measured using enacted tax rates expected to apply to
taxable income in the years in which those temporary differences are expected to
be recovered or settled. The effect on deferred tax assets and
liabilities of a change in tax rates is recognized in income in the period that
includes the enactment date. To the extent such income taxes increase
or decrease future rates, an offsetting regulatory asset or liability has been
recorded.
Investment
tax credits have been deferred and are being amortized to income over the
average estimated service lives of the related assets. As of December
31, 2009 and 2008, deferred investment tax credits amounted to $928 and $967,
respectively.
Allowance
for Funds Used During Construction
Allowance
for funds used during construction (AFUDC) represents the estimated cost of
funds used for construction purposes during the period of
construction. These costs are reflected as non-cash income during the
construction period and as an addition to the cost of plant
constructed. AFUDC includes the net cost of borrowed funds and a rate
of return on other funds. The PPUC approved rate of 10.04% was
applied for 2009 and 2007. We applied a blended rate in 2008 due to
our partial use of tax-exempt financing for 2008 construction
projects. The tax-exempt borrowing rate of 6.00% was applied to those
expenditures so financed, whereas the approved 10.04% rate was applied to the
remainder of 2008 expenditures. AFUDC is recovered through water
rates as utility plant is depreciated.
Cash
and Cash Equivalents
For the
purposes of the statements of cash flows, the Company considers all highly
liquid debt instruments purchased with a maturity of three months or less to be
cash equivalents except for those instruments earmarked to fund construction
expenditures or repay long-term debt.
The
Company had a book overdraft of $195 and $362 at December 31, 2009 and 2008,
respectively. The book overdraft represents outstanding checks and
other items which had not cleared the bank as of the end of the
period. The overdraft is included in accounts payable on the balance
sheet and the change in overdraft position is recorded as a financing activity
on the statement of cash flows.
Use
of Estimates in the Preparation of Financial Statements
The
preparation of financial statements in conformity with accounting principles
generally accepted in the United States of America requires management to make
estimates and assumptions that affect the reported amounts of assets and
liabilities and disclosure of contingent assets and liabilities at the date of
the financial statements and the reported amounts of revenues and expenses
during the reporting period. Actual results could differ from those
estimates.
Reclassifications
Certain
2008 and 2007 amounts have been reclassified to conform to the 2009
presentation. Such reclassifications had no effect on net income, the
statement of common stockholders’ equity and comprehensive income, or the
statement of cash flow category reporting.
As
discussed above, the Company changed the accounting treatment for its interest
rate swap. For the year ended December 31, 2007, and for the nine
months ended September 30, 2008, the Company accounted for the interest rate
swap as a cash flow hedge. As of October 1, 2008, management assessed
the probability of collecting the unrealized gain or loss value of the swap in
rates as the Company is currently reflecting the realized gain or loss as a
component of interest expense in the statement of income. This change
in accounting treatment resulted in the reversal of $224 of long-term interest
expense, $189 recorded in deferred income taxes and $277 recorded in accumulated
other comprehensive income as of September 30, 2008. Management
determined that the amounts previously reported using the cash flow hedge method
of accounting as of the year ended December 31, 2007, and for each of the three
quarters and periods ended March 31, 2008, June 30, 2008 and September 30, 2008
were not materially misstated.
During
the first quarter of 2009, the Company determined that it had understated the
amount of accrued vacation recorded in its financial statements. As a
result, the Company recorded additional salary and wage expense of $257 in
accordance with the professional standards regarding accounting for compensated
absences. The additional accrual, amounting to $152 after taxes,
represents an error correction from prior periods. Management
determined that the financial statements as of and for the years ended December
31, 2007 and December 31, 2008 were not materially misstated.
Impact
of Recent Accounting Pronouncements
In
November 2008, the Securities and Exchange Commission (SEC) released a proposed
roadmap regarding the potential use by U.S. issuers of financial statements
prepared in accordance with International Financial Reporting Standards (IFRS).
IFRS is a comprehensive series of accounting standards published by the
International Accounting Standards Board (IASB). Under the proposed roadmap, the
Company may be required to prepare financial statements in accordance with IFRS
as early as 2014. The SEC will make a determination in 2011 regarding the
mandatory adoption of IFRS. The Company is currently assessing the impact that
this potential change would have on its financial statements, and it will
continue to monitor the development of the potential implementation of
IFRS.
In June
2009, the FASB issued “Accounting for Transfers of Financial Assets—an amendment
of FASB Statement No. 140,” formerly SFAS No. 166. This statement is
codified within FASB ASC Section 860. This statement requires more
information about transfers of financial assets, including securitization
transactions, and where companies have continuing exposure to the risks related
to transferred financial assets. This statement is effective for
fiscal years beginning after November 15, 2009. This statement is not
expected to have an impact on the Company’s financial statements.
In June
2009, the FASB issued “Amendments to FASB Interpretation No. 46(R),
Consolidation of Variable Interest Entities,” formerly SFAS No.
167. This statement is codified within FASB ASC Section
810. This statement changes how a company determines when an entity
that is insufficiently capitalized or is not controlled through voting or
similar rights should be consolidated. This statement is effective
for fiscal years beginning after November 15, 2009. This statement is
not expected to have an impact on the Company’s financial
statements.
In
January 2010, the FASB issued Accounting Standards Update No. 2010-06,
“Improving Disclosures about Fair Value Measurements” (ASU
2010-06). This update includes a requirement that reporting entities
provide information about movements of assets among Levels 1 and 2 of the
three-tier fair value hierarchy established by the professional standards, and
present separately information about purchases, sales, issuances, and
settlements within Level 3. This update is effective for periods
beginning after December 15, 2009 with the exception of the disclosures of
activity in Level 3, which is effective for fiscal years beginning after
December 15, 2010, and for interim periods within those fiscal
years. This update is not expected to have an impact on the Company’s
financial statements.
|
2.
|
Acquisitions
|
On
November 24, 2008, the Company completed the acquisition of the water facilities
of Asbury Pointe Water Company in York County, Pennsylvania. The
Company acquired and is using Asbury Pointe’s distribution system through an
interconnection with its current distribution system. This
acquisition resulted in the addition of approximately 250 customers and the
purchase price was approximately $242, which is less than the depreciated
original cost of the assets. The Company recorded a negative
acquisition adjustment of approximately $207 as of December 31,
2008. Additional acquisition expenditures during the first quarter of
2009 of approximately $22 resulted in a reduction of the negative acquisition
adjustment to $185. The Company is amortizing the negative
acquisition adjustment over the remaining life of the underlying assets as
required by the PPUC.
On
January 9, 2009, the Company completed the acquisition of the water system of
West Manheim Township in York County, Pennsylvania. The Company had
begun serving the customers of West Manheim Township in December 2008 through an
interconnection with its current distribution system. This
acquisition resulted in the addition of 1,800 customers at a purchase price of
approximately $2,075, which is less than the depreciated original cost of the
assets. The Company recorded a negative acquisition adjustment of
approximately $1,440 and is amortizing it over the remaining life of the
underlying assets as required by PPUC.
On
November 12, 2009, the Company completed the acquisition of the water system of
Beaver Creek Village in Adams County, Pennsylvania. The Company
acquired and is using Beaver Creek Village’s distribution facilities through an
interconnection with its current distribution system. This
acquisition resulted in the addition of 167 customers at a purchase price of
approximately $70, which is less than the depreciated original cost of the
assets. The Company recorded a negative acquisition adjustment of
approximately $26 and is amortizing it over the remaining life of the underlying
assets as required by PPUC.
The
Company began to include the operating results of the Asbury Pointe and Beaver
Creek Village acquisitions in its operating results on the acquisition
dates. The West Manheim acquisition was included in operating results
prior to the closing date as indicated above. The results have been
immaterial to total company results.
|
3.
|
Income
Taxes
|
The
provisions for income taxes consist of:
|
2009
|
2008
|
2007
|
|
|
Federal
current
|
$1,176
|
$1,157
|
$1,946
|
|
State
current
|
888
|
559
|
603
|
|
Federal
deferred
|
2,564
|
1,954
|
1,170
|
|
State
deferred
|
(10)
|
(3)
|
12
|
|
Federal
investment tax credit, net of current utilization
|
(39)
|
(39)
|
(39)
|
|
Total
income taxes
|
$4,579
|
$3,628
|
$3,692
|
A
reconciliation of the statutory Federal tax provision (34%) to the total
provision follows:
|
2009
|
2008
|
2007
|
|
|
Statutory
Federal tax provision
|
$4,111
|
$3,420
|
$3,436
|
|
State
income taxes, net of Federal benefit
|
579
|
367
|
407
|
|
Tax-exempt
interest
|
(39)
|
(39)
|
(21)
|
|
Amortization
of investment tax credit
|
(39)
|
(39)
|
(39)
|
|
Cash
value of life insurance
|
68
|
(29)
|
(29)
|
|
Domestic
production deduction
|
(79)
|
(62)
|
(73)
|
|
Other,
net
|
(22)
|
10
|
11
|
|
Total
income taxes
|
$4,579
|
$3,628
|
$3,692
|
The tax
effects of temporary differences between book and tax balances that give rise to
significant portions of the deferred tax assets and deferred tax liabilities as
of December 31, 2009 and 2008 are summarized in the following
table:
|
2009
|
2008
|
|||
|
Deferred
tax assets:
|
||||
|
Reserve
for doubtful accounts
|
$91
|
$79
|
||
|
Compensated
absences
|
166
|
38
|
||
|
Deferred
compensation
|
995
|
949
|
||
|
Customers'
advances and contributions
|
111
|
152
|
||
|
Deferred
taxes associated with the gross-up
|
||||
|
of
revenues necessary to return, in rates,
the
effect of temporary differences
|
89
|
81
|
||
|
Pensions
|
2,617
|
3,077
|
||
|
Costs
deducted for book, not for tax
|
39
|
40
|
||
|
Total
deferred tax assets
|
4,108
|
4,416
|
||
|
Deferred
tax liabilities:
|
||||
|
Accelerated
depreciation
|
20,801
|
17,958
|
||
|
Investment
tax credit
|
551
|
574
|
||
|
Deferred
taxes associated with the gross-up
|
||||
|
of
revenues necessary to recover, in rates,
the
effect of temporary differences
|
1,247
|
1,067
|
||
|
Tax
effect of pension regulatory asset
|
3,504
|
3,964
|
||
|
Costs
deducted for tax, not for book
|
358
|
269
|
||
|
Total
deferred tax liabilities
|
26,461
|
23,832
|
||
|
Net
deferred tax liability
|
$22,353
|
$19,416
|
||
|
Reflected
on balance sheets as:
|
||||
|
Current
deferred tax asset
|
$(154)
|
$(133)
|
||
|
Noncurrent
deferred tax liability
|
22,507
|
19,549
|
||
|
Net
deferred tax liability
|
$22,353
|
$19,416
|
||
No
valuation allowance is required for deferred tax assets as of December 31, 2009
and 2008. In assessing the soundness of deferred tax assets,
management considers whether it is more likely than not that some portion or all
of the deferred tax assets will not be realized. The ultimate
realization of deferred tax assets is dependent upon the generation of future
taxable income during the periods in which those temporary differences become
deductible. Management considers the scheduled reversal of deferred
tax liabilities, projected future taxable income, and tax planning strategies in
making this assessment. Based upon the level of historical taxable
income and the current regulatory environment, management believes it is more
likely than not the Company will realize the benefits of these deductible
differences.
The
Company determined that there were no uncertain tax positions meeting the
recognition and measurement test of the professional standards recorded in the
years that remain open for review by taxing authorities. The federal
income tax returns and the state income tax returns for the years 2006 through
2008 remain open. The Company has not yet filed tax returns for 2009,
but has not taken any new positions in its 2009 income tax
provision.
The
Company’s policy is to recognize interest and penalties related to income tax
matters in other expenses. There were no interest or penalties for
the years ended December 31, 2009 and 2008. The Company recorded
interest and penalties of $5 for the year ended December 31, 2007.
|
4.
|
Long-Term
Debt and Short-Term Borrowings
|
Long-term
debt as of December 31, 2009 and 2008 is summarized in the following
table:
|
2009
|
2008
|
||||
|
3.60%
Industrial Development Authority Revenue
|
|||||
|
Refunding
Bonds, Series 1994, due 2009
|
$ -
|
$2,700
|
|||
|
3.75%
Industrial Development Authority Revenue
|
|||||
|
Refunding
Bonds, Series 1995, due 2010
|
4,300
|
4,300
|
|||
|
4.05%
Pennsylvania Economic Development Financing Authority
|
|||||
|
Exempt
Facilities Revenue Bonds, Series A, due 2016
|
2,350
|
2,350
|
|||
|
5.00%
Pennsylvania Economic Development Financing Authority
|
|||||
|
Exempt
Facilities Revenue Bonds, Series A, due 2016
|
4,950
|
4,950
|
|||
|
10.17%
Senior Notes, Series A, due 2019
|
6,000
|
6,000
|
|||
|
9.60%
Senior Notes, Series B, due 2019
|
5,000
|
5,000
|
|||
|
1.00%
Pennvest Loan, due 2019
|
414
|
455
|
|||
|
10.05%
Senior Notes, Series C, due 2020
|
6,500
|
6,500
|
|||
|
8.43%
Senior Notes, Series D, due 2022
|
7,500
|
7,500
|
|||
|
Variable
Rate Pennsylvania Economic Development Financing Authority
|
|||||
|
Exempt
Facilities Revenue Bonds, Series 2008A, due 2029
|
12,000
|
12,000
|
|||
|
4.75%
Industrial Development Authority Revenue
|
|||||
|
Bonds,
Series 2006, due 2036
|
10,500
|
10,500
|
|||
|
6.00%
Pennsylvania Economic Development Financing Authority
|
|||||
|
Exempt
Facilities Revenue Bonds, Series 2008B, due 2038
|
15,000
|
15,000
|
|||
|
Committed
Line of Credit, due 2011
|
3,054
|
9,098
|
|||
|
Total
long-term debt
|
77,568
|
86,353
|
|||
|
Less
current maturities
|
(4,341)
|
(2,741)
|
|||
|
Long-term
portion
|
$73,227
|
$83,612
|
|||
Payments
due by year:
|
2010
|
2011
|
2012
|
2013
|
2014
|
|
$4,341
|
$15,095
|
$42
|
$42
|
$43
|
Payments
due in 2010 include the 3.75% Industrial Development Authority Revenue Refunding
Bonds, Series 1995, which have a mandatory tender date of June 1, 2010. The
Company currently plans to meet its $4,300 obligation using funds available
under its lines of credit or a potential debt issuance.
Payments
due in 2011 include the payback of the committed line of credit. The
committed line of credit is reviewed annually, and upon favorable outcome, would
likely be extended for another year. Also included in payments due by
period in 2011 are payments of $12,000 on the variable rate bonds (due 2029)
which would only be payable if all of the bonds were tendered and could not be
remarketed. There is currently no indication of this
happening.
On May 7,
2008, the PEDFA issued $12,000 aggregate principal amount of PEDFA Exempt
Facilities Revenue Refunding Bonds, Series A of 2008 (York Water Company
Project) (the “Series A Bonds”) for our benefit pursuant to the terms of a trust
indenture, dated as of May 1, 2008, between the PEDFA and Manufacturers and
Traders Trust Company, as trustee. The PEDFA then loaned the proceeds
of the offering of the Series A Bonds to us pursuant to a loan agreement, dated
as of May 1, 2008, between us and the PEDFA. The loan agreement
provides for a $12,000 loan with a maturity date of October 1,
2029. Amounts outstanding under the loan agreement are our direct
general obligations. The proceeds of the loan were used to redeem the
PEDFA Exempt Facilities Revenue Bonds, Series B of 2004 (the “2004 Series B
Bonds”). The 2004 Series B Bonds were redeemed because the bonds were
tendered and could not be remarketed due to the downgrade of the bond insurer’s
credit rating.
Borrowings
under the loan agreement bear interest at a variable rate as determined by PNC
Capital Markets, as remarketing agent, on a periodic basis elected by
us. We have currently elected that the interest rate be determined on
a weekly basis. The remarketing agent determines the interest rate
based on then current market conditions in order to determine the lowest
interest rate which would cause the Series A Bonds to have a market value equal
to the principal amount thereof plus accrued interest thereon. The
variable interest rate under the loan agreement averaged 0.51% in 2009 and 2.22%
in 2008. As of December 31, 2009 and 2008, the interest rate was
0.26% and 1.28%, respectively.
The
holders of the $12,000 variable rate PEDFA Series A Bonds may tender their bonds
at any time. When the bonds are tendered, they are subject to an
annual remarketing agreement, pursuant to which a remarketing agent attempts to
remarket the tendered bonds pursuant to the terms of the
Indenture. In order to keep variable interest rates down and to
enhance the marketability of the Series A Bonds, the Company entered into a
Reimbursement, Credit and Security Agreement with PNC Bank, National Association
(“the bank”) dated as of May 1, 2008. This agreement provides for a
three-year direct pay letter of credit issued by the bank to the trustee for the
Series A Bonds. The bank is responsible for providing the trustee
with funds for the timely payment of the principal and interest on the Series A
Bonds and for the purchase price of the Series A Bonds that have been tendered
or deemed tendered for purchase and have not been remarketed. The
Company’s responsibility is to reimburse the bank the same day as regular
interest payments are made, and within fourteen months for the purchase price of
tendered bonds that have not been remarketed. The reimbursement
period for the principal is immediate at maturity, upon default by the Company,
or if the Bank does not renew the Letter of Credit. The Letter of
Credit is a three-year agreement with a one-year extension evaluated
annually.
The
Company may elect to have the Series A Bonds redeemed, in whole or in part, on
any date that interest is payable for a redemption price equal to 100% of the
principal amount thereof plus accrued interest to the date of
redemption. The Series A Bonds are also subject to mandatory
redemption for the same redemption price in the event that the Internal Revenue
Service determines that the interest payable on the Series A Bonds is includable
in gross income of the holders of the bonds for federal tax
purposes.
In
connection with the issuance of the PEDFA 2004 Series B Bonds, the Company
entered into an interest rate swap agreement with a counterparty, in the
notional principal amount of $12,000. We elected to retain the swap
agreement for the PEDFA Series A Bonds of 2008. Interest rate swap
agreements derive their value from underlying interest rates. These
transactions involve both credit and market risk. The notional
amounts are amounts on which calculations, payments, and the value of the
derivative are based. Notional amounts do not represent direct credit
exposure. Direct credit exposure is limited to the net difference
between the calculated amounts to be received and paid, if any. Such
difference, which represents the fair value of the swap, is reflected on the
Company’s balance sheet. See Note 10 for additional information
regarding the fair value of the swap.
The
interest rate swap will terminate on the maturity date of the 2008 Series A
Bonds (which is the same date as the maturity date of the loan under the loan
agreement), unless sooner terminated pursuant to its terms. In the
event the interest rate swap terminates prior to the maturity date of the 2008
Series A Bonds, either we or the swap counterparty may be required to make a
termination payment to the other based on market conditions at such
time. The Company is exposed to credit-related losses in the event of
nonperformance by the counterparty. The Company controls the credit
risk of its financial contracts through credit approvals, limits and monitoring
procedures, and does not expect the counterparty to default on its
obligations. Notwithstanding the terms of the swap agreement, we are
ultimately obligated for all amounts due and payable under the loan
agreement.
The
interest rate swap agreement contains provisions that require the Company to
maintain a credit rating of at least BBB- with Standard &
Poor’s. If the Company’s rating were to fall below this rating, it
would be in violation of these provisions, and the counterparty to the
derivative could request immediate payment if the derivative was in a liability
position. The Company’s interest rate swap was in a liability
position as of December 31, 2009. If a violation were triggered on
December 31, 2009, the Company would have been required to pay the counterparty
approximately $997.
Our
interest rate swap agreement provides that we pay the counterparty a fixed
interest rate of 3.16% on the notional amount of $12,000. In exchange, the
counterparty pays us a floating interest rate (based on 59% of the U.S. Dollar
one-month LIBOR rate) on the notional amount. The floating interest
rate paid to us is intended, over the term of the swap, to approximate the
variable interest rate on the loan agreement and the interest rate paid to
bondholders, thereby managing our exposure to fluctuations in prevailing
interest rates. The Company’s net payment rate on the swap averaged
2.98% in 2009 and 1.57% in 2008.
As of
December 31, 2009, there was a spread of 12 basis points between the variable
rate paid to bondholders and the variable rate received from the swap
counterparty, which equated to an overall effective rate of 3.28% (including
variable interest and swap payments). As of December 31, 2008, there
was a spread of 62 basis points which equated to an overall effective rate of
3.78% (including variable interest and swap payments).
On
October 15, 2008, the PEDFA issued $15,000 aggregate principal amount of PEDFA
Exempt Facilities Revenue Refunding Bonds, Series B of 2008 (The York Water
Company Project) (the “2008 Series B Bonds”) for our benefit pursuant to the
terms of a trust indenture, dated as of October 1, 2008, between the PEDFA and
Manufacturers and Traders Trust Company, as trustee. The PEDFA then
loaned the proceeds of the offering of the 2008 Series B Bonds to us pursuant to
a loan agreement, dated as of October 1, 2008, between the Company and the
PEDFA. The loan agreement provides for a $15,000 loan bearing
interest at a rate of 6.00% with a maturity date of November 1,
2038. Amounts outstanding under the loan agreement are the Company’s
direct general obligations. The proceeds of the loan, net of issuance
costs, were used to pay down a portion of the Company’s short-term borrowings
incurred for capital improvements, replacements and equipment for the Company’s
water system. The 2008 Series B Bonds are subject to redemption at
the direction of the Company, in whole or in part at any time on or after
November 1, 2013. In addition, other special redemption requirements
apply as defined in the loan agreement.
The 3.60%
Industrial Development Authority Revenue Refunding Bonds, Series 1994, had a
mandatory tender date of May 15, 2009. The Company retired the $2,700
bonds using funds available under its lines of credit.
The terms
of the debt agreements carry certain covenants and limit in some cases the
Company's ability to borrow additional funds, to prepay its borrowings and
include certain restrictions with respect to declaration and payment of cash
dividends and acquisition of the Company's stock. Under the terms of
the most restrictive agreements, the Company cannot borrow in excess of 60% of
its utility plant, and cumulative payments for dividends and acquisition of
stock since December 31, 1982 may not exceed $1,500 plus net income since that
date. As of December 31, 2009, none of the earnings retained in the
business are restricted under these provisions. Our 1.00% Pennvest
Loan is secured by $800 of receivables. Other than this loan, our
debt is unsecured.
As of
December 31, 2009, the Company maintained unsecured lines of credit aggregating
$33,000 with three banks. One line of credit includes a $4,000
portion which is payable upon demand and carries an interest rate of 4.00% or
LIBOR plus 0.70%, whichever is greater, and a $13,000 committed portion with a
revolving 2-year maturity (currently May 2011), which carries an interest rate
of LIBOR plus 0.70%. As of December 31, 2009, $3,054 was outstanding
under the committed portion and none was outstanding under the on-demand
portion. As of December 31, 2008, $9,098 was outstanding under the
committed portion and none was outstanding under the on-demand
portion. The second line of credit, in the amount of $11,000, is a
committed line of credit, which matures in May 2010 and carries an interest rate
of LIBOR plus 1.50%. This line of credit has a compensating balance
requirement of $500. The Company had $3,000 outstanding under this
line as of December 31, 2009 and $6,000 outstanding under this line as of
December 31, 2008. The third line of credit, in the amount of $5,000,
is a committed line of credit, which matures in April 2010 and carries an
interest rate of LIBOR plus 2.00%. The Company had $2,000 outstanding
under this line as of December 31, 2009. The weighted average
interest rate on line of credit borrowings as of December 31, 2009 was 1.56%
compared to 2.32% as of December 31, 2008.
Average
borrowings outstanding under our lines of credit were $16,848 in 2009 and
$16,128 in 2008. The average cost of borrowings under our lines of
credit during 2009 and 2008 was 1.41% and 3.61%, respectively.
In
January 2010, we signed a renewal for the $17,000 line of credit which
eliminated the 4.00% interest rate floor on the on-demand portion and raised the
interest rate on both portions to LIBOR plus 2.00%.
Our lines
of credits require us to maintain a minimum equity to total capitalization ratio
(defined as the sum of equity plus funded debt) and a minimum interest coverage
ratio (defined as net income plus interest expense plus income tax expense
divided by interest expense). The Company is currently in compliance
with these covenants.
|
5.
|
Common
Stock and Earnings Per Share
|
Earnings
per share are based upon the weighted average number of shares outstanding of
11,695,155 in 2009, 11,298,215 in 2008 and 11,225,822 in 2007. The
Company does not have dilutive securities outstanding.
Under the
employee stock purchase plan, all full-time employees who have been employed at
least six consecutive months may purchase shares of the Company's common stock
through payroll deductions limited to 10% of gross compensation. The
purchase price is 95% of the fair market value (as defined). Shares
issued during 2009, 2008 and 2007 were 6,860, 6,841 and 5,398,
respectively. As of December 31, 2009, 44,828 authorized shares
remain unissued under the plan.
In June
2008, the Company modified its Dividend Reinvestment Plan to include direct
stock purchase and sale options. These options are subject to certain
restrictions and are available to both current shareholders and the general
public. Purchases are made weekly at 100% of the stock’s fair market
value, as defined in the Prospectus contained in Amendment No. 1 to Securities
and Exchange Commission Form S-3, filed by the Company on June 26,
2008. The Company realized $592 in 2009 and $295 in 2008 of equity
proceeds for shares issued under the plan.
Under the
optional dividend reinvestment portion of the plan, holders of the Company's
common stock may purchase additional shares instead of receiving cash
dividends. The purchase price is 95% of the fair market value (as
defined). Shares issued under the newly titled Dividend Reinvestment
and Direct Stock Purchase and Sale Plan, during 2009, 2008, and 2007 were
114,616, 95,484 and 58,406, respectively. As of December 31, 2009,
755,519 authorized shares remain unissued under the plan.
In
September 2009, the Company closed an underwritten public offering of 950,000
shares of its common stock. In October 2009, the underwriters
exercised an over-allotment of 120,000 shares. Boenning &
Scattergood, Inc. and J.J.B. Hilliard, W.L. Lyons, LLC were the underwriters in
the offering. The Company received net proceeds in the offering,
after deducting offering expenses and underwriter’s discounts and commissions,
of approximately $14.1 million. The net proceeds were used to repay a
portion of the Company’s borrowings under its line of credit agreements incurred
to fund capital expenditures and acquisitions, and for general corporate
purposes.
|
6.
|
Employee
Benefit Plans
|
Pensions
The
Company maintains two defined benefit pension plans covering substantially all
of its employees. The benefits are based upon years of service and
compensation over the last five years of service. The Company's
funding policy is to contribute annually the amount permitted by the PPUC to be
collected from customers in rates, but in no case less than the minimum Employee
Retirement Income Security Act (ERISA) required contribution.
The
following table sets forth the plans' funded status as of December 31, 2009 and
2008. The measurement of assets and obligations of the plans is as of
December 31, 2009 and 2008.
|
Obligations
and Funded Status
At
December 31
|
2009
|
2008
|
|
|
Change
in Benefit Obligation
|
|||
|
Pension
benefit obligation beginning of year
|
$21,282
|
$19,220
|
|
|
Service
cost
|
793
|
617
|
|
|
Interest
cost
|
1,311
|
1,209
|
|
|
Actuarial
loss
|
833
|
1,185
|
|
|
Benefit
payments
|
(984)
|
(949)
|
|
|
Pension
benefit obligation end of year
|
23,235
|
21,282
|
|
|
Change
in Plan Assets
|
|||
|
Fair
value of plan assets beginning of year
|
13,702
|
17,082
|
|
|
Actual
return on plan assets
|
2,686
|
(3,327)
|
|
|
Employer
contributions
|
1,383
|
896
|
|
|
Benefits
paid
|
(984)
|
(949)
|
|
|
Fair
value of plan assets end of year
|
16,787
|
13,702
|
|
|
Funded
status of plans at end of year
|
$(6,448)
|
$(7,580)
|
The
professional standards require that the funded status of defined benefit pension
plans be fully recognized in the balance sheet. They also call for
the unrecognized actuarial gain or loss, the unrecognized prior service cost and
the unrecognized transition costs which were previously netted with the funded
status in a liability account, to be adjustments to shareholders’ equity
(accumulated other comprehensive income). Due to a rate order granted
by the PPUC, the Company is permitted under the professional standards to defer
the charges to accumulated other comprehensive income as a regulatory
asset. We believe these costs will be recovered in future rates
charged to customers. The funded status of our pension plans is
recorded in “Deferred employee benefits” on our balance sheet.
Changes
in plan assets and benefit obligations recognized in regulatory assets are as
follows:
|
2009
|
2008
|
||
|
Net
actuarial (gain) loss arising during the period
|
$(909)
|
$5,703
|
|
|
Recognized
actuarial loss
|
(404)
|
(12)
|
|
|
Recognized
prior service cost
|
(18)
|
(17)
|
|
|
Total
changes in regulatory asset during the year
|
$(1,331)
|
$5,674
|
Amounts
recognized in regulatory assets that have not yet been recognized as components
of net periodic benefit cost consist of the following at December
31:
|
2009
|
2008
|
||
|
Net
actuarial loss
|
$5,812
|
$7,126
|
|
|
Prior
service cost
|
120
|
137
|
|
|
Regulatory
asset
|
$5,932
|
$7,263
|
Components
of Net Periodic Benefit Cost are as follows:
|
2009
|
2008
|
2007
|
|||
|
Service
cost
|
$793
|
$617
|
$724
|
||
|
Interest
cost
|
1,311
|
1,209
|
1,150
|
||
|
Expected
return on plan assets
|
(944)
|
(1,192)
|
(1,097)
|
||
|
Amortization
of loss
|
404
|
12
|
107
|
||
|
Amortization
of prior service cost
|
18
|
17
|
265
|
||
|
Rate-regulated
adjustment
|
(199)
|
233
|
(349)
|
||
|
Net
periodic benefit cost
|
$1,383
|
$896
|
$800
|
The
rate-regulated adjustment set forth above is required in order to reflect
pension expense for the Company in accordance with the method used in
establishing water rates. The Company is permitted by rate order of
the PPUC to expense pension costs to the extent of contributions and defer the
remaining expense to regulatory assets to be collected in rates at a later date
as additional contributions are made. During 2009, the deferral was
increased by $199.
The
estimated costs for the defined benefit pension plans relating to the December
31, 2009 balance sheet that will be amortized from regulatory assets into net
periodic benefit cost over the next fiscal year are $250. The Company
plans to contribute at least $1,218 to the plans in 2010.
The
following benefit payments, which reflect expected future service, as
appropriate, are expected to be paid in each of the next five years and the
subsequent five years in the aggregate:
|
2010
|
2011
|
2012
|
2013
|
2014
|
2015-2019
|
|
$1,137
|
$1,119
|
$1,121
|
$1,159
|
$1,230
|
$7,549
|
The
accumulated benefit obligation for both defined benefit pension plans was
$19,793 and $18,141 at December 31, 2009 and 2008, respectively. The
following table shows the accumulated benefit obligation, the projected benefit
obligation and the fair value of plan assets for each plan:
|
General
and Administrative Plan
|
Union-Represented
Plan
|
|||
|
2009
|
2008
|
2009
|
2008
|
|
|
Accumulated
benefit obligation
|
$12,654
|
$11,612
|
$7,139
|
$6,529
|
|
Projected
benefit obligation
|
15,010
|
13,769
|
8,225
|
7,513
|
|
Fair
value of plan assets
|
10,449
|
8,484
|
6,338
|
5,218
|
Weighted-average
assumptions used to determine benefit obligations at December 31:
|
2009
|
2008
|
|
|
Discount
rate
|
6.00%
|
6.00%
|
|
Rate
of compensation increase
|
4.00
- 5.00%
|
4.00
- 5.00%
|
Weighted-average
assumptions used to determine net periodic benefit cost for years ended December
31:
|
2009
|
2008
|
2007
|
|
|
Discount
rate
|
6.00%
|
6.50%
|
5.90%
|
|
Expected
long-term return on plan assets
|
7.00%
|
7.00%
|
7.00%
|
|
Rate
of compensation increase
|
4.00
- 5.00%
|
4.00
- 5.00%
|
5.00%
|
The
selected long-term rate of return on plan assets (7.0%) was primarily based on
the asset allocation of the Plan's assets (approximately 50% to 70% equity
securities and 30% to 50% fixed income securities). Analysis of the
historic returns of these asset classes and projections of expected future
returns were considered in setting the long-term rate of return.
The
investment objective of the Company's defined benefit pension plans is that of
Growth and Income. Our weighted-average target asset allocations are
50% to 70% equity securities, 30% to 50% fixed income securities and 0% to 10%
reserves (cash equivalents). Within the equity category, our target
allocation is approximately 50% large cap, 15% mid cap, 10% small cap, 20%
international, and 5% emerging markets. Within the debt category, our
target allocation is approximately 30% U.S. Treasury and Agency securities, 40%
corporate bonds, 10% mortgage-backed securities, 10% international, and 10% high
yield bonds. Our investment performance objectives over a three to
five year period are to exceed the annual rate of inflation as measured by the
Consumer Price Index by 3%, and to exceed the annualized total return of
specified benchmarks applicable to the funds within the asset
categories.
Further
guidelines within equity securities include: (1) holdings in any one company
cannot exceed 5% of the portfolio; (2) a minimum of 20 individual stocks must be
included in the domestic stock portfolio; (3) a minimum of 30 individual stocks
must be included in the international stock portfolio; (4) equity holdings in
any one industry cannot exceed 20-25% of the portfolio; and (5) only
U.S.-denominated currency securities are permitted.
Further
guidelines for debt securities include: (1) fixed income holdings in a single
issuer are limited to 5% of the portfolio; (2) acceptable investments include
money market securities, U.S. Government and its agencies and sponsored
entities' securities, mortgage-backed and asset-backed securities, corporate
securities and mutual funds offering high yield bond portfolios; (3) purchases
must be limited to investment grade or higher; (4) non-U.S. dollar denominated
securities are not permissible; and (5) high risk derivatives are
prohibited.
The fair
values of the Company's pension plan assets at December 31, 2009 by asset
category and Fair Value Hierarchy level are as follows. The majority
(82%) of the valuations are based on quoted prices on active markets (Level 1)
with the remaining 18% based on broker/dealer quotes, active market makers,
models, and yield curves (Level 2).
|
Asset Category
|
Total
Fair
Value
|
Quoted
Prices in
Active
Markets for
Identical
Assets
(Level 1)
|
Significant
Other
Observable
Inputs
(Level 2)
|
|
Cash
and Money Market Funds (a)
|
$ 341
|
$ 341
|
$ -
|
|
Equity Securities:
|
|||
|
Common
Equity Securities (b)
|
5,296
|
5,296
|
-
|
|
Equity
Mutual Funds (c)
|
6,745
|
6,745
|
-
|
|
Fixed Income Securities:
|
|||
|
U.S.
Treasury Obligations
|
850
|
-
|
850
|
|
U.S.
Government Agencies
|
773
|
-
|
773
|
|
Corporate
and Foreign Bonds (d)
|
1,391
|
-
|
1,391
|
|
Fixed
Income Mutual Funds (e)
|
1,391
|
1,391
|
-
|
|
Total
Assets
|
$
16,787
|
$
13,773
|
$ 3,014
|
|
(a)
|
The
portfolios are designed to keep approximately three months of
distributions in immediately available
funds.
|
|
(b)
|
This
category includes investments in 100% U.S. common stocks widely
distributed among consumer discretionary, consumer staples, healthcare,
information technology, financial services, telecommunications,
industrials, energy and utilities. The individual stocks are
primarily large cap stocks which track with the S&P 500 with the
exception of $280 (1.7% of total assets) which are invested in York Water
Company common stock.
|
|
(c)
|
This
category includes investments in approximately 12% U.S. commodity mutual
funds used primarily as an inflation hedge, 8% International mutual funds,
and the remaining 80% in closed-end mutual funds which give the portfolio
exposure to small, mid and large cap index funds as well as international
diversified index funds.
|
|
(d)
|
This
category currently includes only U.S. corporate bonds and notes equitably
distributed to the food and staples, financial and information technology
sectors.
|
|
(e)
|
This
category includes fixed income investments in mutual funds which include
municipal, government, corporate and mortgage securities of both the U.S.
and other countries. The mortgage and asset-backed securities
and non-U.S. corporate and sovereign investments add further diversity to
the fixed income portion of the
portfolio.
|
Defined
Contribution Plan
The
Company has a savings plan pursuant to the provisions of section 401(k) of the
Internal Revenue Code. The plan provides for elective employee
contributions of up to 15% of compensation and Company matching contributions of
70% of the participant's contribution, up to a maximum annual Company
contribution of $2 for each employee. The Company's contributions to
the plan amounted to $146 in 2009, $168 in 2008, and $171 in 2007.
Deferred
Compensation
The
Company has non-qualified deferred compensation and supplemental retirement
agreements with certain members of senior management. The future commitments
under these arrangements are offset by corporate-owned life insurance
policies. At December 31, 2009 and 2008, the present value of the
future obligations was approximately $2,454 and $2,342,
respectively. The insurance policies included in other assets had a
total cash value of approximately $3,173 and $3,092, respectively, at December
31, 2009 and 2008. The Company’s expenses under the plans amounted to
$413 in 2009, $490 in 2008 and $11 in 2007.
|
7.
|
Rate
Increases
|
From time
to time, the Company files applications for rate increases with the PPUC and is
granted rate relief as a result of such requests. The most recent
rate request was filed by the Company on May 16, 2008 and sought an increase of
$7,086, which would have represented a 19.6% increase in
rates. Effective October 9, 2008, the PPUC authorized an increase in
rates designed to produce approximately $5,950 in additional annual
revenues. The Company anticipates that it will file a rate increase
request in 2010.
|
8.
|
Notes
Receivable and Customers' Advances for
Construction
|
The
Company has agreements with three municipalities to extend water service into
previously formed water districts. The Company loaned funds to the
municipalities to cover the costs related to the projects. The
municipalities concurrently advanced these funds back to the Company in the form
of customers' advances for construction. The municipalities are
required by enacted ordinances to charge application fees and water revenue
surcharges (fees) to customers connected to the system, which are remitted to
the Company. The note principal and the related customer advance are
reduced periodically as operating revenues are earned by the Company from
customers connected to the system and refunds of advances are
made. There is no due date for the notes or expiration date for the
advances.
In March
of 2007, the Company corrected a miscalculation of a note receivable with one of
the water districts served. While this recalculation was deemed
immaterial to operations as a whole, it reduced notes receivable by $544,
customer advances by $473 and interest income by $71. The income
reduction was applicable to the years 2003-2006. In June 2007, this
same water district paid off its note receivable in the amount of
$543.
The
Company has recorded interest income of $116 in 2009, $114 in 2008 and $62 in
2007. Interest rates on the notes outstanding at December 31, 2009
vary from 6.75% to 7.5%.
Included
in the accompanying balance sheets at December 31, 2009 and 2008 were the
following amounts related to these projects.
|
2009
|
2008
|
|
|
Notes
receivable, including interest
|
$476
|
$536
|
|
Customers'
advances for construction
|
1,013
|
1,047
|
The
Company has other customers' advances for construction totaling $15,175 and
$17,211 at December 31, 2009 and 2008, respectively.
|
9.
|
Commitments
|
Based on
its capital budget, the Company plans to spend approximately $12,740 in 2010 and
$13,926 in 2011 on construction. The Company plans to finance ongoing
capital expenditures with internally-generated funds, borrowings against the
Company’s lines of credit, proceeds from the issuance of common stock under its
dividend reinvestment and direct stock purchase and sale plan and ESPP,
potential common stock or debt issues, customer advances and the distribution
surcharge allowed by the PPUC. The distribution surcharge allows the
Company to add a charge to customers’ bills for qualified replacement costs of
certain infrastructure without submitting a rate filing.
As of
December 31, 2009, the Company employed 111 full time people, including 42 under
union contract. The current contract was ratified during 2007 and
expires on April 30, 2010. Management is currently negotiating a new
contract with the union leadership. Based on past experience and the
current relationship between the Company and the union, we expect to reach a
mutually beneficial agreement.
The
Company is involved in certain legal and administrative proceedings before
various courts and governmental agencies concerning water service and other
matters. The Company expects that the ultimate disposition of these
proceedings will not have a material effect on the Company's financial position,
results of operations and cash flows.
|
10.
|
Fair
Value of Financial Instruments
|
The
professional standards regarding fair value measurements establish a fair value
hierarchy which indicates the extent to which inputs used in measuring fair
value are observable in the market. Level 1 inputs include quoted
prices for identical instruments and are the most observable. Level 2
inputs include quoted prices for similar assets and observable inputs such as
interest rates, commodity rates and yield curves. Level 3 inputs are
not observable in the market and include management’s own judgments about the
assumptions market participants would use in pricing the asset or
liability.
The Company has recorded its interest
rate swap liability at fair value in accordance with the
standards. The liability is recorded under the caption “Other
deferred credits” on the balance sheet. The table below illustrates
the fair value of the interest rate swap as of the end of the reporting
period.
|
Fair
Value Measurements
at Reporting Date
Using
|
||
|
Description
|
December 31,
2009
|
Significant Other
Observable Inputs (Level 2)
|
|
Interest
Rate Swap
|
$979
|
$979
|
Fair
values are measured as the present value of all expected future cash flows based
on the LIBOR-based swap yield curve as of the date of the
valuation. These inputs to this calculation are deemed to be Level 2
inputs. The balance sheet carrying value reflects the Company’s
credit quality as of December 31, 2009. The rate used in discounting
all prospective cash flows anticipated to be made under this swap reflects a
representation of the yield to maturity for 30-year debt on utilities rated A-
as of December 31, 2009. The use of the Company’s credit quality
resulted in a reduction in the swap liability of $18. The fair value
of the swap reflecting the Company’s credit quality as of December 31, 2008 is
shown in the table below.
|
Fair
Value Measurements
at Reporting Date
Using
|
||
|
Description
|
December 31,
2008
|
Significant Other
Observable Inputs (Level 2)
|
|
Interest
Rate Swap
|
$2,037
|
$2,037
|
The
carrying amount of current assets and liabilities that are considered financial
instruments approximates fair value as of the dates presented. The
Company's long-term debt, with a carrying value of $77,568 at December 31, 2009,
and $86,353 at December 31, 2008, had an estimated fair value of approximately
$91,000 and $89,000 at December 31, 2009 and 2008, respectively. The
estimated fair value of debt was calculated using a discounted cash flow
technique that incorporates a market interest yield curve with adjustments for
duration and risk profile. The Company considered its A- credit
rating in determining the yield curve, and did not factor in third party credit
enhancements including bond insurance on the 2004 PEDFA Series A and 2006
Industrial Development Authority issues, and the letter of credit on the 2008
PEDFA Series A issue.
Customers'
advances for construction and notes receivable have carrying values at December
31, 2009 of $16,188 and $476, respectively. At December 31, 2008,
customers’ advances for construction and notes receivable had carrying values of
$18,258 and $536, respectively. The relative fair values of these
amounts cannot be accurately estimated since the timing of future payment
streams is dependent upon several factors, including new customer connections,
customer consumption levels and future rate increases.
|
11.
|
Taxes
Other than Income Taxes
|
The
following table provides the components of taxes other than income
taxes:
|
2009
|
2008
|
2007
|
|||
|
Regulatory
Assessment
|
$210
|
$194
|
$170
|
||
|
Property
|
311
|
266
|
214
|
||
|
Payroll,
net of amounts capitalized
|
419
|
421
|
411
|
||
|
Capital
Stock *
|
133
|
219
|
210
|
||
|
Other
|
2
|
2
|
2
|
||
|
Total
taxes other than income taxes
|
$1,075
|
$1,102
|
$1,007
|
||
*Certain
prior year amounts have been reclassified to conform to the 2009
presentation.
|
12.
|
Shareholder
Rights Plan
|
On
January 24, 2009, the Company entered into a Shareholder Rights Agreement with
American Stock Transfer and Trust Company, LLC designed to protect the Company's
shareholders in the event of an unsolicited, unfair offer to acquire the
Company. This plan replaced the previous Shareholder Rights Plan
which expired on January 24, 2009. The Rights were to expire on
January 24, 2019, unless redeemed prior to such date.
On
December 8, 2009, in response to a shareholder proposal, the Company entered
into an Amendment to the Shareholder Rights Agreement dated January 24, 2009
with American Stock Transfer and Trust Company, LLC. The Amendment
accelerated the expiration of the Rights issued under the Rights Agreement from
the close of business on January 24, 2019 to the close of business on December
15, 2009. Accordingly, as of December 15, 2009, the rights issued
under the Rights Agreement expired and were no longer
outstanding.
|
13.
|
Selected
Quarterly Financial Data
(Unaudited)
|
|
First
|
Second
|
Third
|
Fourth
|
Year
|
|
|
2009
|
|||||
|
Water
operating revenues
|
$8,774
|
$9,210
|
$9,750
|
$9,309
|
$37,043
|
|
Water
operating income
|
3,971
|
4,228
|
4,836
|
4,353
|
17,388
|
|
Net
income
|
1,497
|
1,913
|
2,091
|
2,011
|
7,512
|
|
Basic
earnings per share
|
0.13
|
0.17
|
0.18
|
0.16
|
0.64
|
|
Dividends
declared per share
|
0.126
|
0.126
|
0.126
|
0.128
|
0.506
|
|
2008
|
|||||
|
Water
operating revenues
|
$7,506
|
$7,862
|
$8,566
|
$8,904
|
$32,838
|
|
Water
operating income *
|
2,992
|
3,333
|
4,025
|
4,330
|
14,680
|
|
Net
income **
|
1,206
|
1,520
|
1,740
|
1,965
|
6,431
|
|
Basic
earnings per share
|
0.11
|
0.13
|
0.15
|
0.18
|
0.57
|
|
Dividends
declared per share
|
0.121
|
0.121
|
0.121
|
0.126
|
0.489
|
|
*
|
Certain
prior year amounts have been reclassified to conform to the 2009
presentation.
|
|
**
|
Fourth
quarter net income includes $224 ($133 after tax) which resulted from the
reversal
of
third quarter unrealized swap losses which are now part of regulatory
assets.
|