Attached files
Table of Contents
UNITED STATES
SECURITIES AND EXCHANGE COMMISSION
Washington, D.C. 20549
Form 10-K
| x | ANNUAL REPORT PURSUANT TO SECTION 13 OR 15(d) OF THE SECURITIES EXCHANGE ACT OF 1934 |
For the fiscal year ended December 31, 2009
or
| ¨ | TRANSITION REPORT PURSUANT TO SECTION 13 OR 15(d) OF THE SECURITIES EXCHANGE ACT OF 1934 |
For the transition period from to
Commission File Number: 000-51299
TALEO CORPORATION
(Exact name of registrant as specified in its charter)
| Delaware | 52-2190418 | |
| (State or other jurisdiction of incorporation or organization) |
(I.R.S. Employer Identification Number) |
4140 Dublin Boulevard, Suite 400
Dublin, California 94568
(Address of principal executive offices, including zip code)
(925) 452-3000
(Registrant’s telephone number, including area code)
Securities registered pursuant to Section 12(b) of the Act:
| Title of Each Class |
Name of Each Exchange on Which Registered | |
| Class A Common Stock, $0.00001 par value | The Nasdaq Stock Market LLC |
Securities registered pursuant to Section 12(g) of the Act:
None
Indicate by check mark if the registrant is a well-known seasoned issuer, as defined in Rule 405 of the Securities Act. Yes ¨ No x
Indicate by check mark if the registrant is not required to file reports pursuant to Section 13 or Section 15(d) of the Act. Yes ¨ No x
Indicate by check mark whether the registrant (1) has filed all reports required to be filed by Section 13 or 15(d) of the Securities Exchange Act of 1934 during the preceding 12 months (or for such shorter period that the registrant was required to file such reports), and (2) has been subject to such filing requirements for the past 90 days. Yes x No ¨
Indicate by check mark whether the registrant has submitted electronically and posted on its corporate Web site, if any, every Interactive Data File required to be submitted and posted pursuant to Rule 405 of Regulation S-T (§ 229.405 of this chapter) during the preceding 12 months (or for such shorter period that the registrant was required to submit and post such files). Yes ¨ No ¨
Indicate by check mark if disclosure of delinquent filers pursuant to Item 405 of Regulation S-K is not contained herein, and will not be contained, to the best of registrant’s knowledge, in definitive proxy or information statements incorporated by reference in Part III of this Form 10-K or any amendment to this Form 10-K. ¨
Indicate by check mark whether the registrant is a large accelerated filer, an accelerated filer, a non-accelerated filer, or a smaller reporting company. See the definition of “large accelerated filer,” “accelerated filer” and “smaller reporting company” in Rule 12b-2 of the Exchange Act.
| Large accelerated filer | ¨ | Accelerated filer | x | |||||||
| Non-accelerated filer | ¨ | (Do not check if a smaller reporting company) | Smaller reporting company | ¨ | ||||||
Indicate by check mark whether the registrant is a shell company (as defined in Rule 12b-2 of the Exchange Act). Yes ¨ No x
The aggregate market value of the voting common equity held by non-affiliates of the registrant as of June 30, 2009 was approximately $552 million (based on the closing sale price of such shares on the Nasdaq Global Market on June 30, 2009). This calculation excludes the shares of Class A common stock held by executive officers and directors at June 30, 2009. This calculation does not reflect a determination that such persons are affiliates for any other purposes.
On March 5, 2010, the registrant had 39,586,535 shares of Class A common stock outstanding.
DOCUMENTS INCORPORATED BY REFERENCE
The registrant has incorporated by reference into Part III of this Form 10-K portions of its Proxy Statement for the registrant’s 2010 Annual Meeting of Stockholders, to be filed with the Securities and Exchange Commission pursuant to Regulation 14A not later than 120 days after the end of the fiscal year covered by this Form 10-K.
Table of Contents
FORM 10-K
TABLE OF CONTENTS
2
Table of Contents
FORWARD-LOOKING INFORMATION
This Form 10-K, including Part I, Item 1 — Business and Part II, Item 7 — Management’s Discussion and Analysis of Financial Condition and Results of Operations, contains forward-looking statements within the meaning of Section 27A of the Securities Act of 1933, as amended, and Section 21E of the Securities Exchange Act of 1934, as amended. These statements identify prospective information, particularly statements referencing our expectations regarding revenue and operating expenses, cost of revenue, tax and accounting estimates, cash, cash equivalents and cash provided by operating activities, the demand and expansion opportunities for our products, our customer base and our competitive position. In some cases, forward-looking statements can be identified by the use of words such as “may,” “could,” “would,” “might,” “will,” “should,” “expect,” “forecast,” “predict,” “potential,” “continue,” “anticipates,” “expects,” “intends,” “plans,” “believes,” “seeks,” “estimates,” “is scheduled for,” “targeted,” and variations of such words and similar expressions. Such forward-looking statements are based on current expectations, estimates, and projections about our industry, management’s beliefs, and assumptions made by management. These statements are not guarantees of future performance and are subject to certain risks, uncertainties and assumptions that are difficult to predict; therefore, actual results and outcomes may differ materially from what is expressed or forecasted in any such forward-looking statements. Such risks and uncertainties include those set forth herein under Part I, Item 1A — Risk Factors or included elsewhere in this Annual Report on Form 10-K. Unless required by law, we undertake no obligation to update publicly any forward-looking statements, whether as a result of new information, future events or otherwise.
PART I
| ITEM 1. | BUSINESS |
Overview
We are a leading global provider of on-demand talent management software solutions. Our goal is to help our customers improve business results through better talent management. We offer recruiting, performance management, compensation, succession planning, leadership development and analytics software solutions that help our customers attract and retain high quality talent, more effectively match workers’ skills to business needs, reduce the time and costs associated with manual and inconsistent processes, ease the burden of regulatory compliance, and increase workforce productivity through better alignment of workers’ goals, career plans and compensation with corporate objectives. In addition, our solutions are highly configurable which allows our customers to implement talent management processes that are tailored to accommodate different employee types (including professional and hourly), in different locations, business units and regulatory environments.
We deliver our solutions on-demand as a service that is accessed through an Internet connection and a standard web browser. Our solution delivery model, also called software-as-a-service or SaaS, eliminates the need for our customers to install and maintain hardware and software in order to use our solutions. We believe our SaaS model significantly reduces the time, cost and complexity associated with deployment of traditional, on-premise software solutions, and generally offers a lower upfront and total cost of ownership than traditional software solutions. We offer our solutions as a subscription-based service for which our customers pay a recurring annual or quarterly fee during the subscription term.
We market Taleo Enterprise, our suite of talent management solutions for medium and large enterprises with more complex needs, through our direct sales force and indirectly through our strategic partners. We completed our acquisition of Worldwide Compensation, Inc. (“WWC”) on January 1, 2010, which allows us to directly offer a compensation management solution to larger, more complex organizations. We market Taleo Business Edition, our suite of talent management solutions for smaller more centralized organizations, primarily through our inside sales team and Internet marketing efforts. As of December 31, 2009, our customer base included over 4,400 customers worldwide. Our customer base ranges in size from large, global organizations, including 47 of the Fortune 100, to small, private companies with few employees.
3
Table of Contents
The Talent Management Market
Talent management encompasses multiple complex processes that together play a vital role in helping organizations attract, develop, motivate, compensate and retain human capital to more effectively execute on business objectives. Most organizations no longer view human capital as an expense to be minimized, but instead as an asset to be developed and optimized. Modern, innovative organizations now recognize that much of their value resides in human capital. This shift in thinking has mirrored the evolution of talent management from a manual, paper-based practice to a technology-enabled, strategic initiative. At the same time as this shift in thinking, demographic trends in certain working populations and the increasing rate of voluntary and involuntary job turn-over, what we refer to as job velocity, have made the ability to manage talent wisely a pressing need in organizations today.
To increase their return on investment in human capital, organizations now understand the need to systematically focus on measures such as quality of hire, time-to-productivity, internal employee mobility, employee retention, employee engagement, employee contribution and pay for performance. Systematically pursuing these goals requires the comprehensive, unified view of talent management that our solutions provide.
Our Software-as-a-Service Delivery Model
Our on-demand, software-as-a-service, delivery model enables our proprietary software solutions to be implemented, accessed and used by our customers remotely through an Internet connection, a standard web browser and a variety of other access points such as smart phones, hand-held devices, and productivity tools, like Microsoft Outlook. Our solutions are hosted and maintained by us, thus eliminating for our customers the time, risk, headcount and costs associated with installing and maintaining applications within their own information technology infrastructures. As a result, we believe our solutions require less initial investment in third-party software, hardware and implementation services, and have lower ongoing support costs than traditional enterprise software. The SaaS model also allows advanced information technology infrastructure management, security, disaster recovery and other best practices to be leveraged by smaller customers that might not otherwise be able to implement such practices in their own information technology environments. Our SaaS delivery model also enables us to take advantage of operational efficiencies. Since updates and upgrades to our solutions are managed by us on behalf of our customers, we are able to implement improvements to our solutions in a more rapid and uniform way. As a result, we are required to support fewer old versions of our solutions. This allows our development resources to focus more effort on innovative new products.
We believe our SaaS delivery model, coupled with our subscription-based license model, effectively replaces the large, front-loaded cost, typical of most traditional licensed enterprise software deployments, with a lower risk, pay-as-you-go model. We believe the SaaS model is well suited to the talent management market in which we operate.
Our Products
We offer two suites of talent management solutions: Taleo Enterprise and Taleo Business Edition. Taleo Enterprise is designed for medium and large enterprises with more complex needs. Our Taleo Enterprise solution provides support for unified, end-to-end talent management processes ranging from sourcing, recruiting and onboarding to performance management, goals management, development planning, succession planning and compensation. Taleo Business Edition is designed for smaller more centralized organizations, stand-alone departments and divisions of larger organizations, and staffing companies. Taleo Business Edition supports recruiting, onboarding, performance management and compensation. Our solutions are designed to address multiple worker types, including professional and hourly, with support for multiple languages as well as differing geographic and cultural requirements.
Our solutions are accessed through intuitive role-specific user interfaces, which allows only the content and functionality relevant to a specific user — whether a candidate, current employee, corporate recruiter, agency,
4
Table of Contents
line manager or system administrator — to be easily accessed by that user. The candidate-facing portions of Taleo Enterprise solutions are available in 27 languages. Taleo Business Edition is currently available in 4 languages.
Taleo Enterprise
Taleo Enterprise includes several product sets that address talent management.
Taleo Recruiting™ consists of a core solution offering that enables organizations to manage the recruitment process for professional and hourly job seekers, including attracting and evaluating candidates and existing employees, matching skills against job opportunities and managing candidate relationships. Taleo Recruiting provides configurable career sites through which job seekers may view and apply for open positions or submit a profile for future opportunities, and which enable many-to-many matching of job seekers against available job opportunities. Taleo Recruiting also includes the ability to structure variable workflows for different types of job seekers (including new college graduates) in different locations and regulatory environments. Taleo Recruiting also allows organizations to directly link with third party staffing agencies and provides tools to help streamline agency management and optimize agency spend.
Taleo Performance™ provides tools to help transform traditional employee assessment from an annual event to an ongoing, business-driven, evaluation and process improvement tool.
Taleo Development™ helps employees and managers create focused and dynamic career and development plans to improve individual performance and increase retention.
Taleo Goals™ helps organizations to better manage business outcomes by automating the creation, alignment and monitoring of organizational goals.
Taleo Succession™ provides access to a complete view of available, qualified talent and helps identify the best candidates to deliver on business goals.
Taleo Compensation™ provides a single view of compensation budgets and plans and offers tools to help update base and variable pay budgets as organization structures change.
Talent Management Platform Modules
Our talent management platform features and modules may be used in combination with our recruiting and performance management offerings. These features and modules help organizations gain strategic visibility across all of their talent management solutions and integrate our products to other systems.
Taleo Analytics™ gives customers a tool to gain strategic insights into their talent management practices through a metrics configuration tool, standard analytics dashboards, and dashboard authoring tools.
Taleo Anywhere™ provides access to Taleo’s solutions through many alternative platforms, such as Blackberry, smartphones, common productivity tools like Microsoft Outlook, and through alternate Web 2.0 means such as RSS feeds.
Taleo Connect™ uses a services-oriented integration framework to enable customer-managed and Taleo-managed integrations between our solutions and other systems.
Taleo Passport™ offers pre-built integrations with certified solution partners for background checks, assessments, tax credit screening and more.
5
Table of Contents
Taleo Reporting™ offers tools to measure, analyze and optimize organizations’ talent processes with standard reports and advanced report writing tools.
Taleo Business Edition
Taleo Business Edition includes four distinct product sets, Taleo Recruit, Taleo Onboard, Taleo Perform, and Taleo Comp, built on a single platform.
Taleo Recruit™ facilitates an organization’s employee recruiting process. Taleo Recruit offers three service options that enable small businesses to acquire talent. The user interface allows users to create a customer specific talent management system with configurable objects, fields, layouts, views, workflow, reports, and integration.
Taleo Onboard™ automates the new hire process by enabling every department involved in the onboarding process to receive task assignments and update progress as tasks are completed.
Taleo Perform™ allows companies to define and monitor the full employee review cycle. Managers can initiate the review process and support employee self appraisals, manager assessments, and multi-rater reviews. Taleo Perform’s goals management module allows managers to establish quantitative and qualitative employee goals, and align employee goals to broader company goals. A secure employee portal enables employees to submit self-assessments online and provides access to basic employee data, company messaging, assigned goals, and performance reviews.
Taleo Comp™ enables small enterprises to determine the total cost of a compensation cycle and apply maximum and minimum limits. Managers may use multiple performance reviews to allocate merit and bonus pay based on employee achievement over a period of time.
Taleo Talent Grid
Taleo Talent Grid is a set of three online exchanges that provides a forum for our customers, solution partners and job seekers to share information, best practices and innovative solutions to common problems. The Talent Grid includes: (1) the Knowledge Exchange, an online social networking community that facilitates our customers’ ability to share and discuss talent management topics, product ideas and best practices in a quick social manner; (2) the Solution Exchange, an online exchange that allows our customers to explore, evaluate, demo and compare the products and services of our network of pre-integrated alliance partners (including sourcing, compliance, assessment, learning, tax credit screening, background checks and other technologies) in order to extend the value of their Taleo investments; and (3) the Talent Exchange, an opt-in marketplace where job seekers and employers can be connected to match job opportunities to a job seeker’s universal profile.
Our Growth Strategy
Our objective is to become the leading global provider of unified talent management solutions. Key elements of our strategy include:
Extending our technology leadership. We believe we have established advanced technological capabilities and competitive advantages through our component-based and service oriented architectures. Our advanced technologies have enabled us to develop our solutions on a common and native talent management platform. We intend to utilize our experience and our internal and third-party development resources to continue to develop our technology platform, infrastructure and applications to leverage new technologies and methodologies, such as Web 2.0 design principles, to capitalize on the talent management market opportunity. For example, Taleo 10, the latest version of our talent management solutions, includes a new, streamlined Web 2.0 user interface and greater mobile accessibility options, among other new features.
6
Table of Contents
Expanding our solution offerings. We plan to continue to expand our suite of talent management solutions to deliver additional functionality that we can sell to our customer base and to new customers. We will continue this expansion through our internal development initiatives, like our development of a compensation management solution for smaller, less complex organizations, and we may also pursue strategic acquisitions, like our acquisition of WWC, through which we added solutions for compensation management and incentive compensation for larger, more complex organizations.
Expanding our target market opportunity. We intend to continue to expand and better serve our potential customer base by tailoring solutions and service offerings to meet the needs of specific vertical markets, government entities and mid-sized businesses of varying complexities. We also intend to implement marketing campaigns targeted to the needs and requirements of each of these segments of the talent management market. In the short term, we intend to continue our efforts to gain market share among organizations with between 5,000 and 13,000 employees, an initiative we refer to as Taleo Edge, and to gain market share in the U.S. federal government market.
Expanding our multinational customer base. We believe the increasing globalization of large organizations provides us with substantial opportunities to capitalize on our leadership in global deployments. We intend to expand our efforts to deploy our solutions to more organizations that are based outside of North America. We also intend to continue to enhance our multinational functionality and to expand our investment in our international operations to support organizations of all sizes globally.
Expanding adoption of the Taleo Talent Grid. In September 2009, we launched the Taleo Talent Grid, a set of three online exchanges that provides a forum for our customers, solution partners and job seekers to share information, best practices and innovative solutions to common problems. The Talent Grid is accessible as a convenient extension of our on-demand talent management software. We intend to continue to encourage adoption of the Talent Grid to enhance the value of our solutions to our customers and make our solutions more difficult to replace.
Technology
Our Software Applications
Our Taleo Enterprise solutions for recruiting and performance management reside on a common technology platform. Our component-based platform includes reporting and analytics capabilities, self-service integration and configuration tools, our proprietary method for contextualizing the user experience based upon a variety of organizational, location and job function attributes (which we refer to as our SmartOrg feature), the Talent Master Structured Data Platform (described in further detail below), and global language and currency capabilities. Because Taleo Recruiting and Taleo Performance share a common, native platform, we can provide clients superior interoperability between applications and a unified view of all talent management information. The self-service tools and SmartOrg make our solutions configurable for complex operations, giving companies enterprise-wide data and process consistency while being able to adapt the solution locally according to the organization, location, applicable laws, local staffing model, types of hires and internal mobility requirements.
The Talent Master Structured Data Platform maintains all employee, candidate, job and performance data elements required by our solutions. The data structure within the Talent Master Structured Data Platform includes information on skills, competencies, experience, behaviors and level of interest in a skill or competency that can be matched precisely to job requirements and business plans. The Talent Master Structured Data Platform enables organizations to inventory and search the skills of their external candidates and current employees in a common format to help managers and recruiters to decide between internal and external hires for new business initiatives, measure skills gaps in the existing workforce and prepare succession plans using both internal and external talent profiles.
Our Taleo Enterprise software applications for recruiting and performance management are written in Java and use Oracle as the relational database management system.
7
Table of Contents
Our Taleo Business Edition solutions reside on a common technology platform that is separate from the Taleo Enterprise platform. The Taleo Business Edition platform enables us to deliver superior usability and functionality focused on small businesses, and allows for predictive modeling throughout the talent management lifecycle. Self-service tools within the platform provide standard and custom reporting and the ability to configure all Taleo Business Edition modules. The common platform also allows users to localize language and currency across the modules and within the configurable career websites and employee portals. It exposes all data through a standard open web service for integration, allowing customers to integrate Taleo Business Edition with any third party software application that accepts such standard protocols. These self-service configuration and integration tools, together with pre-configured templates for specific industry verticals, enable our small and midsize customers to use Taleo Business Edition for both simple and complex talent management operations.
Our Taleo Business Edition software applications are written in Java and use Microsoft SQL Server® as the relational database management system.
Our Taleo Compensation software applications, which we added through our recent purchase of WWC, and the Taleo Talent Grid are on a separate technology platform, are written in Java and use MySQL® as the relational database management system.
Our On-Demand Infrastructure
Taleo Enterprise
Our technology infrastructure is designed to achieve high levels of security, scalability, performance and availability. We use commercially available hardware in our data centers. Our software and hardware architecture runs on the Linux operating system and uses some proprietary and commercially available software as well as open-source software components for enhanced reliability and a scalable and secure computing environment which can accommodate exponential transaction load increases. Our secure Internet facing infrastructure includes load balancing and secure socket layer devices, anti-virus appliances and technology that allows us to detect and prevent unauthorized access to our infrastructure. Our tiered and virtualized application architecture specializes systems and application functions on dedicated servers for web, application, search, reporting, computing utilities, database management and storage services. Each server tier is designed and implemented with n+1 redundancy which allows us to extend systems and application capacity and availability on demand. All of our equipment and systems are remotely operated, monitored and managed by our personnel working on a 24/7 schedule. Key production technology specialists and managers are also on call at all times on a rotating basis. Our monitoring technology uses industry leading system monitoring and performance monitoring tools and we have also developed our own customized monitoring tools for added insight into the performance and availability of our systems.
We provide a highly secure computing environment as well as high application availability. Each customer is provided with its own secure application instance (which we refer to as a Zone). Each customer Zone includes its own logical and standard database schema, text translation management, configuration settings, reporting tools and data integration tools. Customers share infrastructure at all levels. The scalable design of the software and hardware infrastructure allows us to deploy customer Zones horizontally across any number of servers and to balance user session load to ensure continuous availability and high performance of applications. Our business continuity measures include daily incremental database backups to disk with recovery capabilities in any of our datacenters and weekly automated tape backups which we store off-site on encrypted tapes with a secure third party provider.
Data Centers
We currently deliver our solutions from ten data centers that host the applications for all of our customers.
8
Table of Contents
The Taleo Enterprise platform is hosted from three facilities: a U.S. facility leased from Equinix, Inc. in San Jose, California, a U.S. facility leased from Internap Network Services Corporation in New York City, New York and a European data center facility, also leased from Equinix, in Amsterdam, the Netherlands. Internet bandwidth and access is provided by Internap in the two U.S. facilities and by Equinix in the Netherlands. In 2010 we plan to consolidate our U.S. production data center operations for our Taleo Enterprise solution into a new single facility in Chicago, Illinois.
The Taleo Business Edition platform is hosted from four U.S. facilities: facilities located in San Jose, California and Ashburn, Virginia, via a managed services arrangement, and facilities located in Jacksonville, Florida and San Francisco, California to host the legacy Vurv product for small and medium-sized organizations. Opsource, Inc. provides hardware, internet bandwidth, and access in the San Jose, California and Ashburn, Virginia hosting facilities through a managed services arrangement. Internet bandwidth and access for the legacy Vurv small and medium-sized organization recruiting product is provided by Peak 10 in the Jacksonville, Florida facility and by Serverpath in the San Francisco, California facility.
The Vurv legacy enterprise recruiting product for larger organizations is hosted through four facilities: Jacksonville, Florida, San Jose, California, Atlanta, Georgia and Amsterdam, the Netherlands. Internet bandwidth and access for the Vurv legacy enterprise recruiting product is provided by Peak 10 in the Florida and Georgia facilities, by Internap in San Jose and by Equinix in Amsterdam.
The Taleo Compensation solution is currently hosted from two facilities leased from Internap in San Jose, California and Los Angeles, California. Internap also provides the Internet bandwidth and access services for both of these locations.
Each location provides highly secure 24/7 manned facilities with cage environments, redundant power and cooling systems with on-site backup power generators, multi-layered access using access card/PIN code and/or biometrics for authentication.
Over time we expect to consolidate the data centers hosting Vurv legacy products for larger organizations into existing data centers hosting the Taleo Enterprise platform. We expect to discontinue all data center operations related to the Vurv legacy products for small and medium-sized organizations in 2010 as that product line has been discontinued.
The Taleo Talent Grid solution is hosted from cloud computing facilities located in the U.S.
Professional Services
Our professional services organization leverages our consultants’ and educators’ domain expertise and our proprietary methodologies to provide implementation services, solution optimization services, technical services and training services that help our customers maximize their return on investment. We also subcontract or refer consulting engagements or portions of consulting engagements to our third-party implementation partners from time to time.
Taleo Services Methodologies
We have developed methodologies that enable us to accelerate the deployment of our solutions across a variety of industries and talent management environments:
Taleo Implementation Methodology Working with Fortune 500 companies, we developed methods to optimize critical business processes, while maintaining the integrity of our customers’ business drivers. The Taleo Implementation Methodology addresses specific recruiting and performance management processes for position management, requisition management, candidate management, collaborative workflow, new hire
9
Table of Contents
on-boarding review, performance appraisals, goals management, career management and succession planning. Our Taleo Enterprise consultants work with our customers to implement our solutions by mapping solution workflows and best practices to the organization’s structure, business requirements, and processes, and ultimately configuring a skills-based platform for complete talent management configured uniquely for each customer.
Talent Practices Knowledge Base Our talent practices knowledge base (which we call “Green Pages”) enables us to understand an organization’s overall talent management environment, including internal and external business drivers, talent management models, hire types and talent management processes and to recommend best practices to optimize talent management processes. Green Pages is a searchable database of descriptions of the complex enterprise talent management challenges faced within different industries and geographies. Green Pages also provides specific details of the solutions our consultants implemented to address these challenges, and the results obtained. This knowledge base reflects years of talent management experience across a wide variety of industries. Our consultants use the collective data from our knowledge base to help our new customers solve their complex talent management challenges, and to help our existing customers hone their talent management practices and processes.
Implementation Services
Our Taleo Enterprise implementation services begin with a complete evaluation of a customer’s current talent management practices. Services include process definition, to determine the configuration of the solutions, and integration with existing applications to fit each organization’s dynamic business requirements. We have a dedicated project management office that equips our consultants with a library of toolkits, forms, training documentation and workshop templates. The project management office also audits active customer engagements quarterly to help ensure consistent quality.
Solution Optimization and Expansion
We provide ongoing solution optimization and expansion services to help our customers achieve desired results in quality improvement, increased productivity, cost savings and operational effectiveness after the initial deployment of our solution. We work with our customers to measure improvement in their talent management processes and we modify and expand configuration of our solutions to increase their effectiveness, when necessary. In collaboration with customer project leaders, we establish an ongoing process for continual evolution and solution optimization. Using this process, our customers can promote best practice usage and end user adoption after our solutions have been deployed.
Technical Services
We offer comprehensive technical services to help our customers integrate our solutions with other third-party solutions within our customers’ system portfolios. Many of our Taleo Enterprise clients leverage our technical expertise to assist with technical engagements such as data conversion, ongoing data interfaces, single sign-on for internal users, third-party integration and technical readiness assessments. We also provide services to identify and develop reports and dashboards using our advanced reporting technology. We work with our clients in various ways, from knowledge transfer to help them better use our self-service technology, to full-service, on-site implementation projects.
Training
Through Taleo University, we offer a full range of educational services to foster customer self-sufficiency. These services include: pre-deployment classroom training, train-the-trainer programs, system administrator training, post-deployment specialty training, upgrade training and a full catalogue of interactive, self-study eLearning/web-based training courses. We also offer a variety of training tools to drive user adoption, including solution user manuals, process user guides, feature training exercises, a self-service website for training
10
Table of Contents
scheduling and registration, post-training assessment and certification, and both synchronous and asynchronous web-based training options for remote users. Customers may license Taleo University courseware and trainer kits for in-house use or license the Taleo Proficiency learning content development tools to build their own custom elearning programs. Our solutions are designed to meet the requirements of customers of various sizes, and we measure all training engagements for quality and customer satisfaction.
Customer Support
Our global customer support organization for Taleo Enterprise provides both proactive and customer-initiated support. We deliver customer assistance via universal toll-free telephone access, internet “‘click-to-chat’” technology, and our web-based incident management system to our customers’ designated points-of-contacts, 24 hours a day, seven days a week. Our customer support organization tracks all customer support requests in our incident management system and displays the status of these requests to the user through our Customer Support Portal, enabling users to know the status of their support requests, the person responsible for resolving them, and the targeted timing and process for resolution. Our Customer Support Portal, directly accessible through our Taleo Enterprise solutions, gives customers easy access to: our incident management system; our knowledge database, which enables easy search of documentation and solutions; our reporting system which allow customers to see real-time support metrics for their issues; and our production portal, which provides real-time views and reports on the health, performance, and activity of a customer’s Zone.
Customer support is provided from support centers in five locations operating globally in a follow-the-sun model. In North America, customer support operates from Quebec City, Canada, Jacksonville, Florida, and our corporate headquarters in Dublin, California. Internationally, customer support operates from the Greater London area and Sydney, Australia. We utilize our corporate VOIP telephone system coupled with web-based tools and systems to deliver seamless service to our customers, irrespective of the point of delivery.
Our customer support management team utilizes real-time analytic dashboards to monitor performance and make rapid adjustments to ensure consistency in our service levels. Our senior customer support executives receive automated alerts for escalated issues, review the analytic dashboards, customer satisfaction reports, and take appropriate action to ensure that we maintain customer satisfaction.
Customers
As of December 31, 2009, our customer base included over 4,400 customers worldwide, including 47 of the Fortune 100. We market our Taleo Enterprise solutions to medium and large organizations with more complex needs, typically with more than 5,000 employees. We market our Taleo Business Edition solutions to smaller, more centralized organizations, typically with fewer than 5,000 employees. Our customers include organizations in the business services, consumer goods, energy, financial services, healthcare, manufacturing, technology, transportation, government and retail sectors, and range in size from smaller, private companies to large, global corporations with more than 300,000 employees. No single customer has accounted for more than ten percent of our revenue or accounts receivable in any of the last three years.
Sales and Marketing
We sell subscriptions to our solutions through our global direct sales force and through our strategic partners. Our direct sales organization has field sales professionals in metropolitan areas throughout the United States, Canada, Europe and Australia. Our Taleo Enterprise direct sales force consists of regional sales managers, solutions consultants and business development representatives that sell our solutions to new customers. We also maintain a separate team of account executives that focuses on renewing and selling new solutions and services to existing Taleo Enterprise customers. In addition, we have developed partnerships and direct sales relationships with business process outsourcing, or BPO, human resources outsourcing, or HRO, and recruitment process outsourcing, or RPO, providers. Our BPO, HRO and RPO partners use our solutions to manage talent
11
Table of Contents
management for their customers as part of their broader human resource offerings. Our Taleo Business Edition offerings are sold primarily through an inside sales team and through our website.
Our marketing programs are designed to increase awareness of our solutions within our target markets and enhance the perception of our brand. Our marketing initiatives include market research, product and strategy updates with industry analysts, public relations activities, web marketing, direct mail and relationship marketing programs, seminars, industry specific trade shows, speaking engagements and cooperative marketing with customers and partners. Our marketing team generates qualified leads and provides programs for prospects and customers that build awareness and generate demand for our existing solutions as well as new products and services. Our marketing department also produces materials that include brochures, data sheets, white papers, presentations, demonstrations, and other marketing tools on our corporate website. We also generate awareness through electronic and print advertising in trade magazines, websites, search engines, seminars, and direct customer and partner events.
Research and Development
Our research and development organization consists of product management and development employees. Our research and development organization is primarily located in Quebec City, Canada and Jacksonville, Florida. We also have development staff in Dublin, California and other locations. We use independent development firms or contractors for portions of our development related work, with current research and development efforts occurring in Budapest, Hungary, and Kiev, Ukraine. Our development methodology allows us to implement flexible development cycles that result in more timely and efficient delivery of new solutions and enhancements to existing solutions. We focus our research and development efforts on improving and enhancing our existing solution offerings as well as developing new solutions. The responsibilities of our research and development organization include product management, product development, and software maintenance. We allocate a portion of our research and development budget to the development of our technology platform, including our Talent Master Structured Data Platform (discussed above) and the platform underlying the configuration capabilities of our solutions (what we refer to as Configurable Staffing Process Platform). Our research and development expenditures, net of provincial investment credits we receive from the province of Quebec for qualifying research and development expenditures, are expensed as incurred.
Competition
The market for talent management solutions is highly competitive and rapidly evolving. We believe that the principal competitive factors in this market include:
| • | product performance and functionality; |
| • | breadth and depth of functionality; |
| • | multinational capabilities; |
| • | ease of implementation and use; |
| • | security and data privacy; |
| • | ability to integrate with third-party solutions; |
| • | scalability and reliability; |
| • | company reputation; |
| • | financial stability; and |
| • | price. |
12
Table of Contents
We believe that we compete favorably with respect to these factors. Our Taleo Enterprise solution competes with enterprise resource planning software from vendors such as Oracle Corporation and SAP AG, and also with products and services from vendors such as ADP, Cezanne, Cornerstone OnDemand, Halogen Software, HRSmart, Jobpartners, Kenexa, Kronos, Peopleclick Authoria, Pilat, Plateau, Saba, Salary.com, Stepstone, SuccessFactors, SumTotal Systems, Technomedia, TEDS, Workday and Workstream. Our Taleo Business Edition solution competes primarily with ADP, Bullhorn, Halogen Software, iCIMs, KMS Software Company, Monster, SilkRoad Technology, SuccessFactors and Talent Technology Corporation.
Our current and potential competitors include large, multi-national companies who have a larger installed base of users, longer operating histories, greater name recognition and substantially greater technical marketing and financial resources. In addition, we compete with smaller companies who may adapt better to changing conditions in the market. Our competitors may develop products or services that will be superior to our products, or that will achieve greater market acceptance.
Intellectual Property
Our success is dependent in part on our ability to protect our proprietary technology. We rely on a combination of trademark, copyright and trade secret laws in the United States and other jurisdictions as well as confidentiality procedures and contractual provisions to protect our proprietary technology, services methodology and brand. We have registered trademarks for certain of our products and services and will continue to evaluate the registration of additional trademarks as appropriate. We also enter into confidentiality and proprietary rights agreements with our employees, consultants and other third parties and control access to software, documentation and other proprietary information. However, we do not have any issued patents, we have one pending patent, and existing copyright laws afford only limited protection.
Despite our efforts to protect our intellectual property, it may be possible for unauthorized third parties to copy certain portions of our products or to reverse engineer or otherwise obtain and use our proprietary information. In addition, we cannot be certain that others will not develop substantially equivalent or superior proprietary technology, or that equivalent products will not be marketed in competition with our products, thereby substantially reducing the value of our proprietary rights. Furthermore, confidentiality agreements between us and our employees or any license agreements with our clients may not provide meaningful protection of our proprietary information in the event of any unauthorized use or disclosure of it. In addition, the laws of certain countries do not protect our proprietary rights to the same extent as do the laws of the United States. Accordingly, the steps we have taken to protect our intellectual property rights may not be adequate and we may not be able to protect our proprietary software in the United States or abroad against unauthorized third party copying or use, which could significantly harm our business.
In addition, we license third-party technologies that are incorporated into some elements of our services. Licenses from third-party technologies may not continue to be available to us at a reasonable cost, or at all.
Taleo is a registered trademark in the United States, European Union, Australia, Canada and Singapore and in various other jurisdictions.
Employees
As of December 31, 2009, we had 916 employees. None of our employees are represented by a collective bargaining agreement and we have never experienced a strike or similar work stoppage. We consider our relationship with our employees to be good.
13
Table of Contents
Business Combinations
Over the past three years, we expanded our market share, acquired new technology or supplemented our technology by purchasing businesses and assets focused in the talent management market. During this time period, we acquired the following businesses:
| Date of Closing |
Company |
Details | ||
| July 1, 2008 |
Vurv Technology, Inc. (“Vurv”) | Taleo acquired Vurv which provided new customer relationships and intellectual property. | ||
| July 3, 2007 |
Wetfeet, Inc. (“Wetfeet”) | Taleo acquired certain assets associated with the Wetfeet hiring management solution, including customer contracts, from Wetfeet, Inc. and its parent Universum Communications Holdings, Inc. | ||
| March 7, 2007 |
JobFlash, Inc. (“JobFlash”) | Taleo acquired certain assets of JobFlash, Inc., including customer contracts and intellectual property related to hourly hiring management, scheduling management and voice recognition tools for hiring management. The assets acquired provided the basis for our Taleo Scheduling Center solution and hourly hiring management tools for our Taleo Business Edition solution. | ||
Subsequent to year-end, on January 1, 2010 we acquired Worldwide Compensation, Inc. (“WWC”) through which we added solutions for compensation management and incentive compensation for larger, more complex organizations.
Available Information
Our annual reports on Form 10-K, quarterly reports on Form 10-Q, current reports on Form 8-K, and amendments to reports furnished or filed pursuant to Sections 13(a) and 15(d) of the Securities Exchange Act of 1934, as amended, are available, free of charge, on the “Investor Relations” section of our website (www.taleo.com) as soon as reasonably practicable after we electronically file such material with, or furnish it to, the Securities and Exchange Commission. Information available on, or that can be accessed through, our website is not part of this report. The public may also read and copy any materials we file with the SEC at the SEC’s Public Reference Room at 100 F Street, N.E., Washington D.C. 20549. The public may obtain information on the operation of the Public Reference Room by calling the SEC at 1-800-SEC-0330. The SEC also maintains an Internet website (www.sec.gov) that contains reports, proxy and information statements and other information regarding us that we file electronically with the SEC.
14
Table of Contents
| ITEM 1A. | RISK FACTORS |
RISK FACTORS
Because of the following factors, as well as other variables affecting our operating results and financial condition, past performance may not be a reliable indicator of future performance, and historical trends should not be used to anticipate results or trends in future periods. The risks and uncertainties described below are not the only ones facing us. Additional risks and uncertainties that we are unaware of, or that we currently deem immaterial, also may become important factors that affect us. If any of the following risks occurs, our business, financial condition or results of operation could be materially and adversely affected. In that case, the trading price of our stock could decline, and you may lose some or all of your investment.
We have a history of losses, and we cannot be certain that we will achieve or sustain profitability.
With the exception of the years ended December 31, 2007 and 2009, we have incurred annual losses in every year since our inception. As of December 31, 2009, our accumulated deficit was $77.0 million, comprised of aggregate net losses of $63.2 million and $13.8 million of dividends and issuance costs on preferred stock. In the twelve months ended December 31, 2009, we reported net income of $1.3 million. We cannot be certain that we will be able to achieve or sustain profitability on a quarterly or annual basis in the future. As we continue to incur costs associated with regulatory compliance and implement initiatives to grow our business, which include, among other things, acquisitions, international expansion and new product development, any failure to increase revenue or manage our cost structure could prevent us from achieving or sustaining profitability. For instance, in the year ended December 31, 2009, our profitability was negatively impacted by amortization expense associated with our acquisition of Vurv. In the near term, we expect to continue to incur significant amortization expense associated with both the July 1, 2008 acquisition of Vurv Technology, Inc. (“Vurv”) and the January 1, 2010 acquisition of Worldwide Compensation, Inc. (“WWC”). In addition, we may incur losses as a result of revenue shortfalls or increased expenses associated with our business. As a result, our business could be harmed and our stock price could decline.
Unfavorable economic conditions and reductions in information technology spending could limit our ability to grow our business.
Our operating results may vary based on the impact of changes in economic conditions globally and within the industries in which our customers operate. The revenue growth and profitability of our business depends on the overall demand for enterprise application software and services. Our revenue is derived from organizations whose businesses may fluctuate with global economic and business conditions. Historically, economic downturns have resulted in overall reductions in corporate information technology spending. Accordingly, the current downturn in global economic conditions has weakened and may continue to weaken demand for our software and services. For example, we believe that customer budget cuts and the lack of available credit for small- and medium-sized organizations have negatively impacted sales of our Taleo Business Edition solutions, and we believe that sales of our Taleo Enterprise solutions have been negatively affected by economic conditions as well. In addition, an economic decline impacting a particular industry may negatively impact demand for our software and services in the affected industry. Many of the industries we serve, including financial services, manufacturing (including automobile manufacturing), technology and retail, have recently suffered a downturn in economic and business conditions and may continue to do so. A softening of demand for enterprise application software and services, and in particular enterprise talent management solutions, caused by a weakening global economy or economic downturn in a particular sector would adversely affect our business and likely cause a decline in our revenue.
We will likely experience longer sales cycles, increased pricing pressure and decreased demand for certain of our services as a result of unfavorable economic conditions.
If general economic conditions worsen or fail to improve, we will likely continue to experience the conditions that began in the first quarter of 2008 of increased delays in our sales cycles and increased pressure
15
Table of Contents
from prospective customers to offer discounts higher than our historical practices. We may also experience increased pressure from existing customers to renew expiring software subscriptions agreements at lower rates. In addition, certain of our customers may attempt to negotiate lower software subscription fees for existing arrangements because of downturns in their businesses. If we accept certain requests for higher discounts or lower fees, our business may be adversely affected and our revenues may decline. Also, in a difficult economic environment, our existing customers may elect not to purchase additional education and consulting services from us outside of the context of new product implementations, which we refer to as standalone engagements. Additionally, certain of our customers have become or may become bankrupt or insolvent as a result of the current economic downturn, and we may lose all future revenue from such customers and payment of receivables may be lower or delayed as a result of bankruptcy proceedings.
We may not achieve the anticipated benefits of our acquisition of Vurv, which could adversely affect our operating results and cause the price of our common stock to decline.
On July 1, 2008, we completed our acquisition of Vurv, our largest acquisition to date. We have limited experience in integrating an acquired company of Vurv’s size, and our acquisition of Vurv subjects us to a number of risks, including the following:
| • | we may have difficulty renewing former Vurv customers at the expiration of their current agreements; |
| • | we may be unable to convert certain Vurv customers — including in particular those that previously entered into perpetual licenses and customer on-premise hosting arrangements — to the Taleo platform and our vendor-hosted subscription model; |
| • | we may find it difficult to support or migrate Vurv customers that are using specific customized versions of the Vurv software to our solutions, as we historically have maintained a single version of each release of our software applications without customer-specific code customization. Additionally, certain customized versions of the legacy Vurv software may not have been subject to the same level of data security review that Taleo has historically required; |
| • | we will incur additional expense to maintain and support the Vurv product lines for up to three years while customers are migrated to the Taleo platform; and |
| • | we may find it difficult to integrate Vurv’s hosting infrastructure and operations with our own hosting operations. |
There can be no assurance that we will be successful in overcoming these risks or any other problems encountered in connection with our acquisition of Vurv. To the extent that we are unable to successfully manage these risks, our business, operating results, or financial condition could be adversely affected, and the price of our common stock could decline.
Because we recognize software subscription revenue over the term of the agreements for our software subscriptions, a significant downturn in our business may not be reflected immediately in our operating results, which increases the difficulty of evaluating our future financial position.
We generally recognize revenue from software subscription agreements ratably over the terms of these agreements, which are typically three or more years for our Taleo Enterprise customers and one year for our Taleo Business Edition customers. As a result, a substantial majority of our software subscription revenue in each quarter is generated from software subscription agreements entered into during prior periods. Consequently, a decline in new software subscription agreements in any one quarter may not affect our results of operations in that quarter, but will reduce our revenue in future quarters. Additionally, the timing of renewals or non-renewals of a software subscription agreement during any one quarter may affect our financial performance in that particular quarter or may not affect our financial performance until the next quarter. For example, because we recognize revenue ratably, the non-renewal of a software subscription agreement late in a quarter will have very little impact on revenue for that quarter, but will reduce our revenue in future quarters. Accordingly, the effect of significant declines in sales and market acceptance of our solutions may not be reflected in our short-term results
16
Table of Contents
of operations, which would make these reported results less indicative of our future financial results. By contrast, a non-renewal occurring early in a quarter may have a significant negative impact on revenue for that quarter and we may not be able to offset a decline in revenue due to such non-renewals with revenue from new software subscription agreements entered into in the same quarter. In addition, we may be unable to adjust our costs in response to reduced revenue.
Because of the way we are required to recognize our consulting revenue under applicable accounting guidance, consulting revenue reported for a particular period may not be indicative of trends in our consulting business, which increases the difficulty of evaluating our future financial position.
During 2009 and prior years, when we sold software subscriptions and consulting services in a single arrangement, we recognized revenue from consulting services ratably over the term of the software subscription agreement, which is typically three or more years, rather than as the consulting services were delivered, which is typically during the first six to nine months of a software subscription agreement. Accordingly, a significant portion of the revenue for consulting services performed in any quarterly reporting period prior to 2010 was deferred to future periods. As a result, our consulting revenue for any quarterly reporting period may not be reflective of the consulting services delivered during the reporting period or of the business trends with respect to our consulting services business. Further, since we recognize expenses related to our consulting services in the period in which the expenses are incurred, the consulting margins we report in any quarterly reporting period may not be indicative of the actual gross margin on consulting services delivered during the reporting period.
In October 2009 the Financial Accounting Standards Board (“FASB”) issued new accounting guidance for revenue arrangements that contain multiple components to be delivered to a customer. Under the new standard each revenue component is considered a separate deliverable and the standard provides guidance for establishing fair value for each deliverable. When vendor-specific objective evidence or third-party evidence of selling price for deliverables in an arrangement cannot be determined, companies will be required to develop a best estimate of the selling price of each separate deliverable and allocate consideration for the arrangement using the relative selling price method. This guidance is effective as of the beginning of an entity’s fiscal year that begins after June 15, 2010; however, early adoption is permitted. We have elected to adopt the new guidance as of January 1, 2010.
In the context of our typical arrangements in which software subscriptions and consulting services are sold together, the new guidance will result in the consulting services revenue in such arrangements being recognized as delivered. We expect substantially all of our revenue from consulting service arrangements entered into on or after January 1, 2010 to be recognized as the consulting services are delivered, while consulting revenue from combined software subscription and consulting services arrangements entered into prior to 2010 will continue to be recognized ratably over the term of the software subscription agreement. The application of these two revenue recognition methodologies will result in our consulting revenue for the foreseeable future including a mix of revenue from consulting services delivered during the reporting period and consulting services delivered in previous reporting periods.
If our existing customers do not renew their software subscriptions and buy additional solutions from us, our business will suffer.
We expect to continue to derive a significant portion of our revenue from renewal of software subscriptions and, to a lesser extent, service fees from our existing customers. As a result, maintaining the renewal rate of our software subscriptions is critical to our future success. Factors that may affect the renewal rate for our solutions include:
| • | the price, performance and functionality of our solutions; |
| • | the availability, price, performance and functionality of competing products and services; |
| • | the effectiveness of our maintenance and support services; |
17
Table of Contents
| • | our ability to develop complementary products and services; and |
| • | the stability, performance and security of our hosting infrastructure and hosting services. |
Most of our Taleo Enterprise customers enter into software subscription agreements with duration of three years or more from the initial contract date. Most of our Taleo Business Edition customers enter into annual software subscription agreements. Our customers have no obligation to renew their subscriptions for our solutions after the expiration of the initial term of their agreements. In addition, our customers may negotiate terms less advantageous to us upon renewal, which may reduce our revenue from these customers. Under certain circumstances, our customers may cancel their subscriptions for our solutions prior to the expiration of the term. Our future success also depends, in part, on our ability to sell new products and services to our existing customers. If our customers terminate their agreements, fail to renew their agreements, renew their agreements upon less favorable terms, or fail to buy new products and services from us, our revenue may decline or our future revenue may be constrained.
If our efforts to attract new customers are not successful, our revenue growth will be adversely affected.
In order to grow our business, we must continually add new customers. Our ability to attract new customers will depend in large part on the success of our sales and marketing efforts. However, our prospective customers may not be familiar with our solutions, or may have traditionally used other products and services for their talent management requirements. In addition, our prospective customers may develop their own solutions to address their talent management requirements, purchase competitive product offerings, or engage third-party providers of outsourced talent management services that do not use our solution to provide their services. If our prospective customers do not perceive our products and services to be of sufficiently high value and quality, we may not be able to attract new customers. In addition, certain of our prospective customers may delay the purchasing of, or choose not to purchase, our products as a result of the current negative general economic conditions or downturns in their businesses.
If we do not compete effectively with companies offering talent management solutions, our revenue may not grow and could decline.
We have experienced, and expect to continue to experience, intense competition from a number of companies. Our Taleo Enterprise solution competes with enterprise resource planning software from vendors such as Oracle Corporation and SAP AG, and also with products and services from vendors such as ADP, Cezanne, Cornerstone OnDemand, Halogen Software, HRSmart, Jobpartners, Kenexa, Kronos, Peopleclick Authoria, Pilat, Plateau, Saba, Salary.com, Stepstone, SuccessFactors, SumTotal Systems, Technomedia, TEDS, Workday, and Workstream. Our Taleo Business Edition solution competes primarily with ADP, Bullhorn, Halogen Software, iCIMs, KMS Software Company, Monster, SilkRoad Technology, SuccessFactors and Talent Technology Corporation. Our competitors may announce new products, services or enhancements that better meet changing industry standards or the price or performance needs of customers. Increased competition may cause pricing pressure and loss of market share, either of which could have a material adverse effect on our business, results of operations and financial condition.
Certain of our competitors and potential competitors have significantly greater financial, technical, development, marketing, sales, service and other resources than we have. Some of these companies also have a larger installed base of customers, longer operating histories and greater brand recognition than we have. Certain of our competitors provide products that incorporate capabilities which are not available in our current suite of solutions, such as automated payroll and benefits, or services that we do not currently offer, such as recruitment process outsourcing services. Products with such additional functionalities may be appealing to some customers because they can reduce the number of different types of software or applications used to run their business and such additional services may be viewed by some customers as enhancing the effectiveness of a competitor’s solutions. In addition, our competitors’ products may be more effective than our products at performing particular talent management functions or may be more customized for particular customer needs in a given market. Further, our competitors may be able to respond more quickly than we can to changes in customer requirements.
18
Table of Contents
Our customers often require our products to be integrated with software provided by our existing or potential competitors. These competitors could alter their products in ways that inhibit integration with our products, or they could deny or delay access by us to advance software releases, which would restrict our ability to adapt our products to facilitate integration with these new releases and could result in lost sales opportunities. In addition, many organizations have developed or may develop internal solutions to address talent management requirements that may be competitive with our solutions.
The consolidation or acquisition of our competitors or other similar strategic alliances could weaken our competitive position or reduce our revenue.
There has been vendor consolidation in the market in which we operate. For example, recently Peopleclick was acquired by Bedford Funding, a private equity firm that also acquired Authoria in 2008. Additional consolidation within our industry may change the competitive landscape in ways that adversely affect our ability to compete effectively.
Our competitors may also establish or strengthen cooperative relationships with our current or future BPO partners, HRO partners, systems integrators, third-party consulting firms or other parties with whom we have relationships, thereby limiting our ability to promote our products and limiting the number of consultants available to implement our solutions. Disruptions in our business caused by these events could reduce our revenue.
The results of our review of our revenue recognition practices and resulting restatement has had adverse effects on our financial results and has resulted in litigation and may continue to have adverse effects on our financial results.
In March 2009, we announced that we had completed a review of our revenue recognition practices and, as a result of this review, we restated certain financial statements. Our review of our revenue recognition practices and the resulting restatement of our historical financial statements have required us to expend significant management time and incur significant accounting, legal, and other expenses. The accounting, legal and other expenses associated with the restatement have had a material adverse effect on our results of operations. Also, litigation has been filed against us and certain of our current and former officers relating to a failure to apply accounting principles generally accepted in the United States, or GAAP, in the reporting of quarterly and annual financial statements and securities prospectuses from the time of our initial public offering to our most recent filing with the SEC. See Note 9 of the Notes to Consolidated Financial Statements in Part II, Item 7 of our Annual Report on Form 10-K for the year ended December 31, 2009 for a more detailed description of these proceedings. Though the complaint in these proceedings has been dismissed, these proceedings are in the preliminary stages, and plaintiff has been granted leave to amend and re-file its complaint. The ultimate outcome of these proceedings could have a material adverse effect on our business, financial condition, results of operations, cash flows and the trading price for our securities. Litigation may be time-consuming, expensive and disruptive to normal business operations, and the outcome of litigation is difficult to predict. The defense of this litigation could result in further significant expenditures and diversion of our management’s time and attention from the operation of our business, which could impede our business. While we maintain standard directors and officers insurance, all or a portion of any amount we may be required to pay to satisfy a judgment or settlement of any or all of these claims may not be covered by insurance.
We have had to restate our historical financial statements.
In October 2009, we announced that, after upgrading to a new version of the equity program administration software that we license from a third-party provider, we identified differences in the stock-based compensation expense of prior periods and, after reviewing such differences, identified an error in our accounting for stock-based compensation expense. As a result of identifying the error, in October 2009, we concluded that accounting adjustments were necessary to correct certain previously issued financial statements. Accordingly, we restated those financial statements and recorded total cumulative additional stock-based compensation expense of
19
Table of Contents
approximately $2.6 million for the fiscal years ended December 31, 2008, 2007 and 2006 and the quarters ended June 30, 2009 and March 31, 2009. Specifically, we recorded increases in stock-based compensation expense of approximately $1.3 million in fiscal 2007, $1.2 million in fiscal 2006 and $0.3 million in the quarter ended June 30, 2009, and recorded reductions in stock-based compensation expense of approximately $0.1 million in fiscal 2008 and $0.1 million in the quarter ended March 31, 2009. In connection with this restatement, we determined that there was a material weakness in our internal control over financial reporting as of December 31, 2008, March 31, 2009, June 30, 2009 and September 30, 2009. Specifically, our controls to calculate stock-based compensation expense related to the application of the forfeiture rate were not designed effectively, and a material weakness existed in the design of the controls over the calculation of stock-based compensation expense related to the application of the forfeiture rate as of those periods.
In addition, in March 2009, we announced that we had completed a review of our revenue recognition practices and, as a result of this review, we restated certain financial statements in our Annual Report on Form 10-K for the year ended December 31, 2008. The restatement resulted in the deferral to future periods of $18 million of consulting services revenue and approximately $0.2 million in application revenue previously recognized through June 30, 2008. Amounts in our previously issued consolidated financial statements for the years ended December 31, 2003 through 2007, and the interim consolidated financial statements for each of the periods ended March 31, 2008 and June 30, 2008, have been corrected for the timing of revenue recognition for consulting services revenue during these periods, as well as to correct an error relating to the timing of revenue recognition for set-up fees, an element of our application services revenue. In connection with such review we identified certain control deficiencies relating to the application of applicable accounting literature related to revenue recognition. These deficiencies constituted a material weakness in internal control over financial reporting as of September 30, 2008, which led to items requiring correction in our historical financial statements and our conclusion to restate such financial statements to correct those items. Specifically, the control deficiencies related to our failure to correctly interpret EITF 00-21 in determining the proper accounting treatment when application and consulting services are sold together.
We cannot be certain that the measures we have taken since these restatements will ensure that restatements will not occur in the future. Execution of restatements like the ones described above could create a significant strain on our internal resources and cause delays in our filing of quarterly or annual financial results, increase our costs and cause management distraction.
Failure to implement and maintain the appropriate internal controls over financial reporting could negatively affect our ability to provide accurate and timely financial information.
Prior to the filing of our financial results for the period ended March 31, 2007, we identified a material weakness in connection with the evaluation of the effectiveness of our internal controls as of March 31, 2007 related to the identification of a material required adjustment, which affected cash, accounts receivable and cash flow from operations. Additionally in the third quarter of 2008, we identified certain control deficiencies relating to the application of applicable accounting literature related to revenue recognition. These deficiencies constituted a material weakness in internal control over financial reporting as of September 30, 2008. In October 2009, we determined that there was a material weakness in our internal control over financial reporting as of December 31, 2008, March 31, 2009, June 30, 2009 and September 30, 2009. Specifically, our controls to calculate stock-based compensation expense related to the application of the forfeiture rate were not designed effectively, and a material weakness existed in the design of the controls over the calculation of stock-based compensation expense related to the application of the forfeiture rate as of those periods.
As part of our ongoing processes we will continue to focus on improvements in our controls over financial reporting. We have discussed deficiencies in our financial reporting and our remediation of such deficiencies with the audit committee of our board of directors and will continue to do so as required. However, we cannot be certain that we will be able to remediate all deficiencies in the future. Any current or future deficiencies could materially and adversely affect our ability to provide timely and accurate financial information.
20
Table of Contents
We have previously not been in compliance with SEC reporting requirements and NASDAQ listing requirements. If we again fail to remain in compliance with SEC reporting requirements and NASDAQ listing requirements, there may be a material adverse effect on our business and our stockholders.
As a consequence of our review of our revenue recognition practices and resulting restatement of our historical financial statements, we were delayed until April 30, 2009 in filing our Annual Report on Form 10-K for the year ended December 31, 2008 and our Quarterly Report on Form 10-Q for the period ended September 30, 2008 with the SEC. During the period of such delay, we faced the possibility of delisting of our stock from the NASDAQ Global Market. We cannot be certain that we will be able to comply with SEC reporting requirements and NASDAQ listing requirements in the future. If we are delisted from the NASDAQ as a result of noncompliance with NASDAQ listing requirements, the price of our stock and the ability of our stockholders to trade in our stock would be adversely affected. In addition, we would be subject to a number of restrictions regarding the registration of our stock under federal securities laws, and we would not be able to allow our employees to exercise their outstanding options, which could adversely affect our business and results of operations. Furthermore, if we are delisted in the future from the NASDAQ Global Market, there may be other negative implications, including the potential loss of confidence by customers, suppliers and employees and the loss of institutional investor interest in our company.
As a result of the delayed filing of our Annual Report on Form 10-K for the year ended December 31, 2008 as well as our Quarterly Report on Form 10-Q for the period ended September 30, 2008, we will be ineligible to register our securities on Form S-3 for sale by us or resale by others through March 16, 2010, which is one year from the original due date of the last untimely filed report. We have used and may use Form S-1 to raise capital or complete acquisitions in the future, but doing so may increase transaction costs and adversely impact our ability to raise capital or complete acquisitions of other companies in a timely manner.
Our financial performance may be difficult to forecast as a result of our historical focus on large customers and the long sales cycle associated with our solutions.
The majority of our revenue is currently derived from organizations with complex talent management requirements. Accordingly, in a particular quarter the majority of our bookings from new customers on an aggregate contract value basis are from large sales made to a relatively small number of customers. As such, our failure to close a sale in a particular quarter will impede desired revenue growth unless and until the sale closes. In addition, sales cycles for our Taleo Enterprise clients are generally between three months and one year, and in some cases can be longer. As a result, substantial time and cost may be spent attempting to secure a sale that may not be successful. The period between our first sales call on a prospective customer and a contract signing is relatively long due to several factors such as:
| • | the complex nature of our solutions; |
| • | the need to educate potential customers about the uses and benefits of our solutions; |
| • | the relatively long duration of our contracts; |
| • | the discretionary nature of our customers’ purchases; |
| • | the timing of our customers’ budget cycles; |
| • | the competitive evaluation of our solutions; |
| • | fluctuations in the staffing management requirements of our prospective customers; |
| • | announcements or planned introductions of new products by us or our competitors; and |
| • | the lengthy purchasing approval processes of our prospective customers. |
If our sales cycles unexpectedly lengthen, our ability to forecast accurately the timing of sales in any given period will be adversely affected and we may not meet our forecasts for that period.
21
Table of Contents
A portion of our revenue is generated by sales to government entities, which are subject to a number of challenges and risks.
Sales to U.S. and foreign federal, state and local governmental agency end-customers have accounted for a small portion of our revenue, and we may in the future increase sales to government entities. Sales into government entities are subject to a number of risks. Selling to government entities can be highly competitive, expensive and time consuming, often requiring significant upfront time and expense without any assurance that we will successfully sell our products and services to such governmental entity. Government entities may require contract terms that differ from our standard arrangements. In addition, government demand and payment for our products may be affected by public sector budgetary cycles and funding authorizations, with funding reductions or delays adversely affecting public sector demand for our products. Most of our sales to government entities have been made indirectly through third-party prime contractors that resell our solutions. Government entities may have contractual or other legal rights to terminate contracts with our resellers for convenience or due to a default, and any such termination may adversely impact our future results of operations.
Governments routinely audit and investigate government contractors, and we may be subject to such audits and investigations. For example, we have been subject to government contract audits in the past and have received a subpoena from the Department of Homeland Security’s inspector general’s office relating to our commercial pricing for the Transportation Security Administration, a government entity that accessed our services through a prime contractor. As a result of an audit or investigation, we may be subject to civil or criminal penalties and administrative sanctions, including termination of contracts, forfeiture of profits, suspension of payments, fines, and suspension or prohibition from doing business with the government entity. In addition, we could suffer serious reputational harm if allegations of impropriety were made against us.
If we fail to develop or acquire new products or enhance our existing products to meet the needs of our existing and future customers, our sales will decline.
To keep pace with technological developments, satisfy increasingly sophisticated customer requirements, and achieve market acceptance, we must enhance and improve existing products and continue to introduce new products and services. For instance, the Taleo Talent Grid, a foundation for sharing industry knowledge, technology and candidates, became generally available to our customers in September 2009, and Taleo 10, the newest version of our talent management solutions, became generally available to our customers in February 2010. Additionally, on January 1, 2010, we completed our acquisition of WWC, which allows us to offer a compensation management solution directly to our customers. Any new products we develop or acquire may not be introduced in a timely manner and may not achieve the broad market acceptance necessary to generate significant revenue and may generate losses. If we are unable to develop or acquire new products that appeal to our target customer base or enhance our existing products or if we fail to price our products to meet market demand or if the products we develop or acquire do not meet performance expectations or have a higher than expected cost structure to host and maintain, our business and operating results will be adversely affected. Our efforts to expand our solutions beyond our current offerings or beyond the talent management market may divert management resources from existing operations and require us to commit significant financial resources to an unprofitable business, which may harm our existing business.
We expect to incur additional expense to develop software products and to integrate acquired software products into existing platforms to maintain our competitive position. For example, our acquisition of WWC will require significant effort to integrate existing WWC products into our platform and hosting infrastructure over time. In addition, we have invested in software development locations other than the locations where we traditionally developed our software. For example, we have invested in development locations in Eastern Europe and Ukraine and we may invest in other locations outside of North America in the future. In addition, we plan to continue to invest in Jacksonville, Florida, as a software development location. We may engage independent contractors for all or portions of this work. These efforts may not result in commercially viable solutions, may be more expensive or less productive than we anticipate, or may be difficult to manage and result in distraction to our management team. If we do not manage these remote development centers effectively or receive significant revenue from our product development investments, our business will be adversely affected.
22
Table of Contents
Additionally, we intend to maintain a single version of each release of our software applications that is configurable to meet the needs of our customers. Customers may require customized solutions or features and functions that we do not yet offer and do not intend to offer in future releases, which may disrupt our ability to maintain a single version of our software releases or cause our customers to choose a competing solution. Vurv has historically allowed customer specific customizations of its software and we may find it difficult to support or migrate such customizations.
Acquisitions and investments present many risks, and we may not realize the anticipated financial and strategic goals for any such transactions, which would harm our business, operating results and overall financial condition.
We have made, continue to make and are actively evaluating acquisitions or investments in companies, products, services, and technologies to expand our product offerings, customer base and business. For example, in 2008, we completed our acquisition of Vurv, which is our largest acquisition to date. In January 2010, we completed our acquisition of WWC. We have limited experience in executing acquisitions and investments. Acquisitions and investments involve a number of risks, including the following:
| • | being unable to achieve the anticipated benefits from our acquisitions; |
| • | discovering that we may have difficulty integrating the accounting systems, operations, and personnel of the acquired business, and may have difficulty retaining the key personnel of the acquired business; |
| • | our ongoing business and management’s attention may be disrupted or diverted by transition or integration issues and the complexity of managing geographically and culturally diverse locations; |
| • | difficulty incorporating the acquired technologies or products into our existing code base; |
| • | problems arising from differences in applicable accounting standards of the acquired business (for instance, non-U.S. businesses may not prepare their financial statements in accordance with GAAP); |
| • | problems arising from differences in the revenue, licensing or support model of the acquired business; |
| • | customer confusion regarding the positioning of acquired technologies or products; |
| • | difficulty maintaining uniform standards, controls, procedures and policies across locations; |
| • | difficulty retaining the acquired business’ customers; and |
| • | problems or liabilities associated with product quality, data privacy, data security, technology and legal contingencies. |
The consideration paid in connection with an investment or acquisition also affects our financial results. If we should proceed with one or more significant acquisitions in which the consideration includes cash, we could be required to use a substantial portion of our available cash to consummate any such acquisition. To the extent that we issue shares of stock or other rights to purchase stock, existing stockholders may be diluted and earnings per share may decrease. In addition, acquisitions may result in our incurring debt, material one-time write-offs, or purchase accounting adjustments and restructuring charges. They may also result in recording goodwill and other intangible assets in our financial statements which may be subject to future impairment charges or ongoing amortization costs, thereby reducing future earnings. In addition, from time to time, we may enter into negotiations for acquisitions or investments that are not ultimately consummated. Such negotiations could result in significant diversion of management time, as well as incurring expenses that may impact operating results.
We may lose sales opportunities if we do not successfully develop and maintain strategic relationships to sell and deliver our solutions.
We have partnered with a number of business process outsourcing, or BPO, and human resource outsourcing, or HRO, providers that resell our solutions as a component of their outsourced human resource services and we intend to partner with more BPOs and HROs in the future. If customers or potential customers
23
Table of Contents
begin to outsource their talent management functions to BPOs or HROs that do not resell our solutions, or to BPOs or HROs that choose to develop their own solutions, our business will be harmed. In addition, we have relationships with third-party consulting firms, system integrators and software and service vendors who provide us with customer referrals, integrate their complementary products with ours, cooperate with us in marketing our products and provide our customers with system implementation or other consulting services. If we fail to establish new strategic relationships or expand our existing relationships, or should any of these partners fail to work effectively with us or go out of business, our ability to sell our products into new markets and to increase our penetration into existing markets may be impaired.
If we are required to reduce our prices to compete successfully, our margins and operating results could be adversely affected.
The intensely competitive market in which we do business may require us to reduce our prices. If our competitors offer discounts on certain products or services, we may be required to lower prices or offer our solutions on less favorable terms to compete successfully. Some of our larger competitors have significantly greater resources than we have and are better able to absorb short-term losses. Any such changes would likely reduce our margins and could adversely affect our operating results. Some of our competitors may provide bundled product offerings that compete with ours for promotional purposes or as a long-term pricing strategy. These practices could, over time, limit the prices that we can charge for our products or services. If we cannot offset price reductions with a corresponding increase in the quantity of applications sold, our margins and operating results would be adversely affected.
If our security measures are breached and unauthorized access is obtained to customer data or personal information, customers may curtail or stop their use of our solutions, which would harm our reputation, operating results, and financial condition.
Our solutions involve the storage and transmission of customers’ proprietary information and users’ personal information, including the personal information of our customers’ job candidates. As part of our solution, we may also offer third-party proprietary solutions which require us to transmit our customers’ proprietary data and the personal information of job candidates to such third parties. Security breaches could expose us to loss of this information, and we could be required to undertake an investigation, notify affected data subjects and appropriate legal authorities and regulatory agencies, and conduct remediation efforts, which could include modifications to our current security practices and ongoing monitoring for users whose data might have been subject to unauthorized access. Accordingly, security breaches may result in investigation, remediation and notification expenses, litigation, liability, and financial penalties. For example, in May 2009, a legacy Vurv customer using a customized version of the Vurv software informed us that email addresses contained in its candidate database, which we host, were used by an unauthorized third party to solicit additional personal information from job candidates. While it has not been determined that this incident resulted from a breach of our security measures, our customer has been sued with respect to this incident and we cannot be certain that a claim will not be asserted against us or that we will not incur liability or additional expense with respect to this matter.
While we have administrative, technical, and physical security measures in place, and we contractually require third parties to whom we transfer data to have appropriate security measures, if any of these security measures are breached as a result of third-party action, employee error, criminal acts by an employee, malfeasance, or otherwise, and, as a result, someone obtains unauthorized access to customer data or personal information, our reputation will be damaged, our business may suffer and we could incur significant liability. Techniques used to obtain unauthorized access or to sabotage systems change frequently and generally are not recognized until launched against a target. As a result, we and our partners to whom we transfer data may be unable to anticipate these techniques or to implement adequate preventative measures. We do not encrypt all data we store for our customers while such data is at rest in the database. Applicable law may require that a security breach involving certain types of unencrypted data be disclosed to each data subject or publicly disclosed. If an actual or perceived breach of our security occurs, the market perception of our security measures could be
24
Table of Contents
harmed and we could lose sales and customers. Our insurance policies may not adequately compensate us for any losses that may occur due to failures in our security measures.
Defects or errors in our products could affect our reputation, result in significant costs to us and impair our ability to sell our products, which would harm our business.
Our products may contain defects or errors, which could materially and adversely affect our reputation, result in significant costs to us and impair our ability to sell our products in the future. The costs incurred in correcting any product defects or errors may be substantial and could adversely affect our operating results. While we test our products for defects or errors prior to product release, defects or errors have been identified from time to time by our customers and may continue to be identified in the future.
Any defects that cause interruptions in the availability or functionality of our solutions could result in:
| • | lost or delayed market acceptance and sales of our products; |
| • | loss of customers; |
| • | product liability and breach of warranty suits against us; |
| • | diversion of development and support resources; |
| • | injury to our reputation; and |
| • | increased maintenance and warranty costs. |
While our software subscription agreements typically contain limitations and disclaimers that should limit our liability for damages related to defects in our software, such limitations and disclaimers may not be upheld by a court or other tribunal or otherwise protect us from such claims.
If we fail to manage our hosting infrastructure capacity satisfactorily, our existing customers may experience service outages and data loss, and our new customers may experience delays in the deployment of our solution.
We have experienced significant growth in the number of users, transactions, and data that our hosting infrastructure supports. Failure to address the increasing demands on our hosting infrastructure satisfactorily may result in service outages, delays or disruptions. For example, we have experienced downtimes within our hosting infrastructure, some of which have been significant, which have prevented customers from using our solutions from time to time. We seek to maintain sufficient excess capacity in our hosting infrastructure to meet the needs of all of our customers. We also maintain excess capacity to facilitate the rapid provisioning of new customer deployments and expansion of existing customer deployments. The development of new hosting infrastructure to keep pace with expanding storage and processing requirements could be a significant cost to us that we are not able to predict accurately and for which we are not able to budget significantly in advance. Such outlays could raise our cost of goods sold and be detrimental to our financial results. At the same time, the development of new hosting infrastructure requires significant lead time. If we do not accurately predict our infrastructure capacity requirements, our existing customers may experience service outages that may subject us to financial penalties, financial liabilities and the loss of customers. If our hosting infrastructure capacity fails to keep pace with sales, customers may experience delays as we seek to obtain additional capacity, which could harm our reputation and adversely affect our revenue growth.
In addition, we may in the future consolidate certain of our data centers with our other existing data centers, or move certain data center operations to new facilities. For example, we plan to consolidate our U.S. production data center operations for our Taleo Enterprise solution into a new Chicago, Illinois facility in 2010. If we consolidate these data center operations, we will need to relocate existing hardware, purchase new hardware, and migrate all of our Taleo Enterprise customers’ proprietary information and their users’ personal information. Although we take reasonable precautions designed to mitigate the risks of such a move, such transitions create
25
Table of Contents
increased risk of service disruptions, outages or the theft or loss of important customer and user data that could harm our reputation, subject us to financial liability, and adversely affect our revenue and earnings.
Any significant disruption in our computing and communications infrastructure could harm our reputation, result in a loss of customers and adversely affect our business.
Our computing and communications infrastructure is a critical part of our business operations. Our customers access our solutions through a standard web browser. Our customers depend on us for fast and reliable access to our applications. Much of our software is proprietary, and we rely on the expertise of members of our engineering and software development teams for the continued performance of our applications. We have experienced, and may in the future experience, serious disruptions in our computing and communications infrastructure. Factors that may cause such disruptions include:
| • | human error; |
| • | physical or electronic security breaches; |
| • | telecommunications outages from third-party providers; |
| • | computer viruses; |
| • | acts of terrorism or sabotage; |
| • | fire, earthquake, flood and other natural disasters; and |
| • | power loss. |
Although we back up data stored on our systems at least daily to disks in our data centers, and weekly to automated tape which is stored offsite, our infrastructure does not currently include real-time, or near real-time, mirroring of data storage and production capacity in more than one geographically distinct location. Thus, in the event of a physical disaster, or certain other failures of our computing infrastructure, customer data from recent transactions may be permanently lost.
We currently deliver our solutions from ten data centers that host the applications for all of our customers. The Taleo Enterprise platform is hosted from three facilities: a U.S. facility leased from Equinix, Inc. in San Jose, California, a U.S. facility leased from Internap Network Services Corporation in New York City, New York and a European data center facility also leased from Equinix in Amsterdam, the Netherlands. Internet bandwidth and access is provided by Internap in the two U.S. facilities and by Equinix in the Netherlands. The Taleo Business Edition is hosted from four facilities in the U.S.: facilities located in San Jose, California and Ashburn, Virginia, both operated via a managed services arrangement, and facilities located in Jacksonville, Florida and San Francisco, California to host the legacy Vurv product for small and medium-sized organizations. Opsource, Inc. provides hardware, internet bandwidth, and access in the San Jose, California and Ashburn Virginia hosting facilities through the managed services arrangement. Internet bandwidth and access for the legacy Vurv small and medium-sized organization recruiting product is provided by Peak 10 in the Jacksonville, Florida facility and by Serverpath in the San Francisco, California facility.
The Vurv legacy enterprise recruiting product is hosted through four facilities located in Jacksonville, Florida, San Jose, California, Atlanta, Georgia and Amsterdam, the Netherlands. Internet bandwidth and access for the Vurv legacy enterprise recruiting product is provided by Peak 10 in the Florida and Georgia facilities, by Internap in San Jose and by Equinix in Amsterdam.
The Taleo Compensation solution is currently hosted from two facilities leased from Internap in San Jose, California, and Los Angeles, California. Internap also provides the Internet bandwidth and access services for both of these locations.
26
Table of Contents
We do not control the operation of these facilities and must rely on these vendors to provide the physical security, facilities management and communications infrastructure services to ensure the reliable and consistent delivery of our solutions to our customers. In the case of Opsource and Vurv locations that are managed service locations, we also rely upon the third-party vendor for hardware associated with our hosting infrastructure. Although we believe we would be able to enter into a similar relationship with another third party should one of these relationships fail or terminate for any reason, we believe our reliance on any third-party vendor exposes us to risks outside of our control. If these third-party vendors encounter financial difficulty such as bankruptcy or other events beyond our control that cause them to fail to secure adequately and maintain their hosting facilities or provide the required data communications capacity, our customers may experience interruptions in our service or the loss or theft of important customer data. We plan to consolidate our U.S. production data center operations for our Taleo Enterprise Solution into a new single facility in Chicago, Illinois in 2010. We may elect to open computing and communications hardware operations at additional third-party facilities located in the United States, Europe or other regions. We are not experienced at operating such facilities in jurisdictions outside the United States and doing so may pose additional risk to us.
We have experienced system failures in the past. If our customers experience service interruptions or the loss or theft of their data caused by us, we may be required to issue credits pursuant to the terms of our contracts and may also be subject to financial liability or customer losses. Such credits could reduce our revenues below the levels that we have indicated we expect to achieve and adversely affect our margins and operating results.
Our insurance policies may not adequately compensate us for any losses that may occur due to any failures or interruptions in our systems.
We must hire and retain key employees and recruit qualified personnel or our future success and business could be harmed.
Our success depends on the continued employment of our senior management and other key employees, such as our chief executive officer and our chief financial officer. If we lose the services of one or more of our senior management or key employees, or if one or more of them decides to join a competitor or otherwise to compete with us, our business could be harmed. We do not maintain key person life insurance on any of our executive officers. Additionally, our continued success depends, in part, on our ability to attract and retain qualified technical, sales and other personnel. It may be particularly challenging to retain employees as we integrate newly acquired entities, like Vurv, due to uncertainty among employees regarding their career options and cultural differences between us and the newly acquired entities.
We currently derive a significant portion of our revenue from international operations and expect to expand our international operations. However, we do not have substantial experience in international markets, and may not achieve the expected results.
During the twelve months ended December 31, 2009, application revenue generated outside of the United States was 19% of total revenue, based on the location of the legal entity of the customer with which we contracted, of which 4% was revenue generated in Canada. Our primary research and development operation is in Quebec, Canada, but we conduct research and development in other international locations as well. We currently have international offices outside of North America in Australia, France, the Netherlands, Singapore and the United Kingdom, which focus primarily on selling and implementing our solutions in those regions. In the future, we may expand to other international locations. Our current international operations and future initiatives will involve a variety of risks, including:
| • | unexpected changes in regulatory requirements, taxes, trade laws, tariffs, export quotas, custom duties or other trade restrictions; |
| • | differing regulations in Quebec, Canada with regard to maintaining operations, products and public information in both French and English; |
27
Table of Contents
| • | differing labor regulations, especially in the European Union and Quebec, Canada where labor laws are generally more advantageous to employees as compared to the United States, including deemed hourly wage and overtime regulations in these locations; |
| • | more stringent regulations relating to data privacy and the unauthorized use of, or access to, commercial and personal information, particularly in Europe and Canada; |
| • | reluctance to allow personally identifiable data related to non-U.S. citizens to be stored in databases within the United States, due to concerns over the United States government’s right to access personally identifiable data of non-U.S. citizens stored in databases within the United States or other concerns; |
| • | greater difficulty in supporting and localizing our products; |
| • | greater difficulty in localizing our marketing materials and legal agreements, including translations of these materials into local language; |
| • | changes in a specific country’s or region’s political or economic conditions; |
| • | challenges inherent in efficiently managing an increased number of employees or independent contractors over large geographic distances, including the need to implement appropriate systems, policies, benefits and compliance programs; |
| • | limited or unfavorable intellectual property protection; and |
| • | restrictions on repatriation of earnings. |
If we invest substantial time and resources to expand our international operations and are unable to do so successfully and in a timely manner, our business and operating results will suffer.
Fluctuations in the exchange rate of foreign currencies could result in currency transaction losses, which could harm our operating results and financial condition.
We currently have foreign sales denominated in foreign currencies, including the Australian dollar, British pound sterling, Canadian dollar, the euro, New Zealand dollar, Singapore dollar and Swiss franc and may in the future have sales denominated in the currencies of additional countries. In addition, we incur a substantial portion of our operating expenses in Canadian dollars and, to a much lesser extent, other foreign currencies. Any fluctuation in the exchange rate of these foreign currencies may negatively affect our business, financial condition and operating results. For instance, in 2009, the impact of changes in foreign currency exchange rates compared to the average rates in effect during 2008 was a $2.1 million increase in income before income taxes. In 2010, the volatility in exchange rates for foreign currencies has continued and may continue and, as a result, we may continue to see fluctuations in our revenue and expenses, which may impact our operating results. We have not previously engaged in foreign currency hedging. If we decide to hedge our foreign currency exposure, we may not be able to hedge effectively due to lack of experience, unreasonable costs or illiquid markets.
If we fail to defend our proprietary rights aggressively, our competitive advantage could be impaired and we may lose valuable assets, experience reduced revenue, and incur costly litigation fees to protect our rights.
Our success is dependent, in part, upon protecting our proprietary technology. We rely on a combination of copyrights, trademarks, service marks, trade secret laws, and contractual restrictions to establish and protect our proprietary rights in our products and services. We do not have any issued patents. We do not rely on patent protection. We will not be able to protect our intellectual property if we are unable to enforce our rights or if we do not detect unauthorized use of our intellectual property. Despite our precautions, it may be possible for unauthorized third parties to copy our products and use information that we regard as proprietary to create products and services that compete with ours. Some license provisions protecting against unauthorized use, copying, transfer and disclosure of our licensed products may be unenforceable under the laws of certain jurisdictions and foreign countries in which we operate. Further, the laws of some countries do not protect
28
Table of Contents
proprietary rights to the same extent as the laws of the United States. To the extent we expand our international activities, our exposure to unauthorized copying and use of our products and proprietary information may increase. We enter into confidentiality and invention assignment agreements with our employees and consultants and enter into confidentiality agreements with the parties with whom we have strategic relationships and business alliances. No assurance can be given that these agreements will be effective in controlling access to and distribution of our products and proprietary information. Further, these agreements do not prevent our competitors from developing technologies independently that are substantially equivalent or superior to our products. Initiating legal action has been and may continue to be necessary in the future to enforce our intellectual property rights and to protect our trade secrets. Litigation, whether successful or unsuccessful, could result in substantial costs and diversion of management resources, either of which could seriously harm our business.
Current and future litigation against us could be costly and time consuming to defend.
We are sometimes subject to legal proceedings and claims that arise in the course of business. For example, we are currently defendant in a suit alleging patent infringement and were recently defendant in a suit alleging securities fraud, both of which are described in more detail in Note 9 of the Notes to Consolidated Financial Statements in Part II, Item 8 of our Annual Report on Form 10-K for the year ended December 31, 2009. Litigation may result in substantial costs, including lengthened or discontinued sales cycles due to concerns of existing or prospective customers with respect to litigation, and may divert management’s attention and resources, which may seriously harm our business, overall financial condition, and operating results. In addition, legal claims that have not yet been asserted against us may be asserted in the future. See Note 9 of the Notes to Consolidated Financial Statements in Part II, Item 8 of our Annual Report on Form 10-K for the year ended December 31, 2009, for further information regarding pending and threatened litigation and potential claims.
Our results of operations may be adversely affected if we are subject to a protracted infringement claim or a claim that results in a significant award for damages.
Software product developers such as us may continue to receive infringement claims as the number of products and competitors in our space grows and the functionality of products in different industry segments overlaps. For example, Kenexa, a competitor, filed suit against us for patent infringement in August 2007 and other infringement claims have been threatened against us. We can give no assurance that such claims will not be filed in the future. Our competitors or other third parties may also challenge the validity or scope of our intellectual property rights. A claim may also be made relating to technology that we acquire or license from third parties. If we were subject to a claim of infringement, regardless of the merit of the claim or our defenses, the claim could:
| • | require costly litigation to resolve and the payment of substantial damages; |
| • | require significant management time; |
| • | cause us to enter into unfavorable royalty or license agreements; |
| • | require us to discontinue the sale of our products; |
| • | damage our relationship with existing or prospective customers and disrupt our sales cycles; |
| • | require us to indemnify our customers or third-party service providers; or |
| • | require us to expend additional development resources to redesign our products. |
We entered into standard indemnification agreements in the ordinary course of business and may be required to indemnify our customers for our own products and third-party products that are incorporated into our products and that infringe the intellectual property rights of others. Although many of the third parties from which we purchase are obligated to indemnify us if their products infringe the rights of others, this indemnification may not be adequate.
29
Table of Contents
Our insurance policies will not compensate us for any losses or liabilities resulting from patent infringement claims.
We use open source software in our products, which could subject us to litigation or other actions.
We use open source software in our products and may use more open source software in the future. From time to time, there have been claims challenging the ownership of open source software against companies that incorporate open source software into their products. As a result, we could be subject to suits by parties claiming ownership of what we believe to be open source software. Litigation could be costly for us to defend, have a negative effect on our operating results and financial condition or require us to devote additional research and development resources to change our products. In addition, if we were to combine our proprietary software products with open source software in a certain manner, we could, under certain of the open source licenses, be required to release the source code of our proprietary software products. If we inappropriately use open source software, we may be required to re-engineer our products, discontinue the sale of our products or take other remedial actions.
We employ technology licensed from third parties for use in or with our solutions, and the loss or inability to maintain these licenses or errors in the software we license could result in increased costs, or reduced service levels, which would adversely affect our business.
Our hosted solutions incorporate certain technology obtained under licenses from other companies, such as Oracle for database software. We anticipate that we will continue to license technology and development tools from third parties in the future. Although we believe that there are commercially reasonable software alternatives to the third-party software we currently license, this may not always be the case, or we may license third-party software that is more difficult or costly to replace than the third party software we currently license. In addition, integration of our products with new third-party software may require significant work and require substantial allocation of our time and resources. Also, to the extent that our products depend upon the successful operation of third-party products in conjunction with our products, any undetected errors in these third-party products could prevent the implementation or impair the functionality of our products, delay new product introductions and injure our reputation. Our use of additional or alternative third-party software would require us to enter into license agreements with third parties, which could result in higher costs.
Difficulties that we may encounter in managing changes in the size of our business could affect our operating results adversely.
In order to manage our business effectively, we must continually manage headcount in an efficient manner. In the past, we have undergone facilities consolidations and headcount reductions in certain locations and departments. As a result, we have incurred, and may incur, charges for employee severance. We may experience additional facilities consolidations and headcount reductions in the future. As many employees are located in jurisdictions outside of the United States, we are required to pay the severance amounts legally required in such jurisdictions, which may exceed those of the United States. Further, we believe reductions in our workforce and facility consolidation create anxiety and uncertainty, and may adversely affect employee morale.
These measures could adversely affect our employees that we wish to retain and may also adversely affect our ability to hire new personnel. They may also negatively affect customers.
Failure to manage our customer deployments effectively could increase our expenses and cause customer dissatisfaction.
Enterprise deployments of our products require a substantial understanding of our customers’ businesses, and the resulting configuration of our solutions to their business processes and integration with their existing systems. We may encounter difficulties in managing the timeliness of these deployments and the allocation of personnel
30
Table of Contents
and resources by us or our customers. In certain situations, we also work with third-party service providers in the implementation or software integration-related services of our solutions, and we may experience difficulties in managing such third parties. Failure to manage customer implementation or software integration-related services successfully by us or our third-party service providers could harm our reputation and cause us to lose existing customers, face potential customer disputes or limit the rate at which new customers purchase our solutions.
Our ability to conclude that a control deficiency is not a material weakness or that an accounting error does not require a restatement can be affected by a number of factors, including our level of pre-tax income.
Under the Sarbanes-Oxley Act of 2002, our management is required to assess the impact of control deficiencies based upon both quantitative and qualitative factors, and depending upon that analysis we classify such identified deficiencies as either a control deficiency, significant deficiency or a material weakness.
One element of our analysis of the significance of any control deficiency is its actual or potential financial impact. This assessment will vary depending on our level of pre-tax income or loss. For example, a smaller pre-tax income or loss will increase the likelihood of a quantitative assessment of a control deficiency as a significant deficiency or material weakness.
Because our pre-tax income is relatively small, if management or our independent registered public accountants identify an error in our interim or annual financial statements, it is more likely that such an error may be determined to be a material weakness or may meet the quantitative threshold established under Staff Accounting Bulletin No. 99, “Materiality”, that could, depending upon the complete quantitative and qualitative analysis, result in our having to restate previously issued financial statements.
Our reported financial results may be adversely affected by changes in generally accepted accounting principles or changes in our operating history that impact the application of generally accepted accounting principles.
Accounting principles generally accepted in the United States, or GAAP, are subject to interpretation by the FASB, the SEC, the American Institute of Certified Public Accountants, or AICPA, the Public Company Accounting Oversight Board and various other organizations formed to promulgate and interpret accounting principles. A change in these principles or interpretations could have a significant effect on our historical or future financial results.
The application of GAAP to our operations may also require significant judgment and interpretation as to the appropriate treatment of a specific issue. These judgments and interpretations are complicated by the relative newness of the on-demand, vendor-hosted software business model, also called software-as-a-service, or SaaS, and the relative lack of interpretive guidance with respect to the application of GAAP to the SaaS model. For example, in connection with our 2009 review of our revenue recognition practices, we submitted a pre-clearance submission to the Office of the Chief Accountant of the SEC, or OCA, requesting its view of our historical application of accounting guidance related to the recognition of multiple element arrangements. Following consultation with the OCA, we changed our application of the guidance to recognize revenue from consulting services ratably over the term of the software subscription agreement when we sell software subscriptions and consulting services in a single arrangement, rather than as the consulting services are delivered, as we had done in the past. In October 2009, however, the FASB issued accounting guidance related to the recognition of multiple element arrangements, which will supersede the guidance in place during 2009. The new guidance, which we are adopting as of January 1, 2010, will generally require us to recognize the majority of consulting services revenue from multiple element arrangements as the consulting services are delivered for arrangements we enter into after January 1, 2010. We cannot ensure that our interpretations and judgments with respect to the application of GAAP will be correct in the future and any incorrect interpretations and judgments could adversely affect our business.
31
Table of Contents
If benefits currently available under the tax laws of Canada, the province of Quebec and other jurisdictions are reduced or repealed, or if we have taken an incorrect position with respect to tax matters under discussion with the federal Canadian Revenue Agency or other domestic or international taxing authorities, our business could suffer.
The majority of our research and development activities are conducted through our Canadian subsidiary, Taleo (Canada) Inc. We participate in a provincial government program in Quebec that provides investment credits based upon qualifying research and development expenditures. These expenditures primarily consist of the salaries for the persons conducting research and development activities. We have participated in the program since 1999, and expect that we will continue to receive these refundable investment tax credits through December 2010. In 2009, we recorded a $2.4 million reduction in our research and development expenses as a result of this program. We anticipate the continued reduction of our research and development expenses through application of these credits through 2010. If these investment credit benefits are reduced or eliminated, our financial condition and operating results may be adversely affected.
In addition to the provincial research and development investment credit program described above, our Canadian subsidiary is participating in a scientific research and experimental development, or SRED, program administered by the Canadian federal government that provides income tax credits based upon qualifying research and development expenditures. For tax year 2009, we recorded an estimated SRED credit claim of approximately $1.0 million. Our Canadian subsidiary is eligible to remain in the SRED program for future tax years as long as its development projects continue to qualify. These Canadian federal SRED tax credits can only be applied to offset Canadian federal taxes payable and are reported as a credit to our tax provision to the extent they reduce taxes payable to zero with any residual benefits recorded as a net deferred tax asset. We believe that our Canadian subsidiary is in compliance with these government programs and that all amounts recorded will be fully realized. If these SRED investment credits are reduced or disallowed by the federal Canada Revenue Agency (“CRA”), our financial condition and operating results may be adversely affected.
In December 2008, we were notified by the CRA of their intention to audit tax years 2003 through 2007. To date, CRA has issued proposed assessment notices for tax years 2002 and 2003 seeking increases to taxable income of CAD $3.8 million and CAD $6.9 million, respectively. These adjustments relate, principally, to our treatment of Canadian Development Technology Incentives (“CDTI”) investment credits and income and expense allocations recorded between our parent company and our Canadian subsidiary. We disagree with the CRA’s basis for these adjustments and intend to appeal their decision through applicable administrative and judicial procedures.
There could be significant unrecognized tax benefits over the next twelve months depending on the outcome of any audit. We have recorded income tax reserves believed to be sufficient to cover any potential tax assessments for the open tax years. In the event the CRA audit results in adjustments that exceed both our unrecognized tax benefits and available deferred tax assets, we may become a tax paying entity in 2010 or in a prior year and may be required to pay penalties and interest. Any such penalties and interest cannot be reasonably estimated at this time.
We will seek U.S. tax treaty relief through the appropriate Competent Authority tribunals for all settlements entered into with the CRA. Although we believe we have reasonable basis for our tax positions, it is possible an adverse outcome could have a material effect upon our financial condition, operating results or cash flows in a particular quarter or annual period.
In 2008 and 2009, the state of California suspended the usage of prior year tax loss carryforwards used to reduce taxable income in California. We cannot be certain in 2010 whether California or another state may impose a similar restriction which could negatively impact our operations resulting in additional tax expense.
As we continue to expand domestically and internationally, we are increasingly subject to reviews by various U.S. and foreign taxing authorities which could negatively impact our financial results. While we have
32
Table of Contents
reserved for these uncertainties and do not expect the outcomes of these reviews to be material to our operations, our current assessment as to the potential financial impact of these reviews could prove incorrect and we may incur additional income tax expense in the period the uncertainty is resolved.
Evolving regulation of the Internet or changes in the infrastructure underlying the Internet may adversely affect our financial condition by increasing our expenditures and causing customer dissatisfaction.
As Internet commerce continues to evolve, increasing regulation by federal, state or foreign agencies may become more likely. We are particularly sensitive to these risks because the Internet is a critical component of our business model. For example, we believe increased regulation is likely in the area of data privacy, and laws and regulations applying to the solicitation, collection, processing or use of personal or consumer information could affect our customers’ ability to use and share data, potentially reducing demand for solutions accessed via the Internet and restricting our ability to store, process and share data with our customers via the Internet. In addition, taxation of services provided over the Internet or other charges imposed by government agencies or by private organizations for accessing the Internet may also be imposed. Legislation has been proposed that may impact the way that internet service providers treat Internet traffic. The outcome of such proposals is uncertain but certain outcomes may negatively impact our business or increase our operating costs. Any regulation imposing greater fees for internet use or restricting information exchange over the Internet could result in a decline in the use of the Internet and the viability of internet-based services, which could harm our business.
The rapid and continual growth of traffic on the Internet has resulted at times in slow connection and download speeds among Internet users. Our business expansion may be harmed if the Internet infrastructure cannot handle our customers’ demands or if hosting capacity becomes insufficient. If our customers become frustrated with the speed at which they can utilize our software over the Internet, our customers may discontinue use of our products and choose not to renew their contract with us.
Our stock price is likely to be volatile and could decline.
The stock market in general and the market for technology-related stocks in particular have been highly volatile. As a result, the market price of our stock is likely to be similarly volatile, and investors in our stock may experience a decrease in the value of their stock, including decreases unrelated to our operating performance or prospects. The price of our stock could be subject to wide fluctuations in response to a number of factors, including those listed in this “Risk Factors” section and others such as:
| • | our operating performance and the performance of other similar companies; |
| • | overall performance of the equity markets; |
| • | developments with respect to intellectual property rights; |
| • | publication of unfavorable research reports about us or our industry or withdrawal of research; |
| • | coverage by securities analysts or lack of coverage by securities analysts; |
| • | speculation in the press or investment community; |
| • | general economic conditions and data and the impact of such conditions and data on the equity markets; |
| • | terrorist acts; and |
| • | announcements by us or our competitors of significant contracts, new technologies, acquisitions, commercial relationships, joint ventures or capital commitments. |
33
Table of Contents
We may need to raise additional capital, which may not be available, thereby adversely affecting our ability to operate our business.
If we need to raise additional funds due to unforeseen circumstances, we cannot be certain that we will be able to obtain additional financing on favorable terms, if at all, and any additional financings could result in additional dilution to our stockholders. If we need additional capital and cannot raise it on acceptable terms, we may not be able to meet our business objectives, our stock price may fall and you may lose some or all of your investment.
If securities or industry analysts do not publish research or publish misleading or unfavorable research about our business, our stock price and trading volume could decline.
The trading market for our common stock depends in part on the research and reports that securities or industry analysts publish about us or our business. If no or few securities or industry analysts cover our company, the trading price for our stock would be negatively impacted. If one or more of the analysts who covers us downgrades our stock or publishes misleading or unfavorable research about our business, our stock price would likely decline. If one or more of these analysts ceases coverage of our company or fails to publish reports on us regularly, demand for our stock could decrease, which could cause our stock price or trading volume to decline.
Provisions in our charter documents and Delaware law may delay or prevent a third party from acquiring us.
Our certificate of incorporation and bylaws contain provisions that could increase the difficulty for a third party to acquire us without the consent of our board of directors. For example, if a potential acquirer were to make a hostile bid for us, the acquirer would not be able to call a special meeting of stockholders to remove our board of directors or act by written consent without a meeting. In addition, our board of directors has staggered terms, which means that replacing a majority of our directors would require at least two annual meetings. The acquirer would also be required to provide advance notice of its proposal to replace directors at any annual meeting, and will not be able to cumulate votes at a meeting, which will require the acquirer to hold more shares to gain representation on the board of directors than if cumulative voting were permitted.
Our board of directors also has the ability to issue preferred stock that could significantly dilute the ownership of a hostile acquirer. In addition, Section 203 of the Delaware General Corporation Law limits business combination transactions with 15% or greater stockholders that have not been approved by the board of directors. These provisions and other similar provisions make it more difficult for a third party to acquire us without negotiation. These provisions may apply even if the offer may be considered beneficial by some stockholders.
| ITEM 1B. | UNRESOLVED STAFF COMMENTS |
Not applicable.
| ITEM 2. | PROPERTIES |
Our principal offices are in Dublin, California, where we lease approximately 35,000 square feet of space. We entered into the Dublin lease in March 2006. The term of the Dublin lease is seven years, commencing on June 15, 2006, and we have one option to renew the lease for an additional term of five years. Over the term, our base rent ranges from approximately $52,000 per month to approximately $85,000 per month, in addition to operating expenses and taxes. At the end of 2009, we entered into a sublease for an additional 12,000 square feet of space in our Dublin office building at a rate of $13,000 per month. We began occupying the additional space in January 2010 and the lease term ends in July 2012.
34
Table of Contents
In connection with the acquisition of Vurv, we assumed the lease of 40,000 square feet of office space in Jacksonville, Florida. This facility, which at the time of the acquisition was Vurv’s principal office, is used for customer training and other general operations. The remaining term of the Jacksonville lease ends on November 1, 2010. We have two options to renew the lease for an additional term of five years. Our base rent is approximately $60,000 per month, in addition to operating expenses and taxes.
Our primary research and development facility is in Quebec City, Canada, where we lease approximately 41,000 square feet of space. The Quebec lease has been in effect since December 1998 and will expire in December 2012. Our base rent is CAD $72,000 per month, in addition to operating expenses and taxes.
Our former principal office in San Francisco, California, consisting of approximately 12,109 square feet, was subleased on October 19, 2006. The term of the sublease commenced on October 31, 2006, and ended on July 30, 2009. As of December 31, 2009, the sublease and lease had expired and no future cash payments remain to be made related to this lease.
In North America, we have additional offices for our sales and services personnel throughout the United States, including offices in Chicago, Illinois and Petaluma, California. Outside of North America, we maintain offices for our sales and services personnel in the London area, Melbourne, Paris and Sydney.
We believe that our facilities are adequate for current needs, though we may open additional sales, services, development and support locations in 2010. We believe that suitable additional or substitute space will be available as needed to accommodate foreseeable expansion of our operations.
| ITEM 3. | LEGAL PROCEEDINGS |
Kenexa Litigations — Kenexa BrassRing, Inc., (“Kenexa”) filed suit against us in the United States District Court for the District of Delaware on August 27, 2007. Kenexa alleges that we infringed Patent Nos. 5,999,939 and 6,996,561, and seeks monetary damages and an order enjoining us from further infringement. We answered Kenexa’s complaint on January 28, 2008. On May 9, 2008, Kenexa filed a similar lawsuit against Vurv Technology, Inc. (now known as Vurv Technology LLC) (“Vurv”) in the United States District Court for the District of Delaware, alleging that Vurv has infringed Patent Nos. 5,999,939 and 6,996,561, and seeking monetary damages and an order enjoining further infringement. Vurv answered Kenexa’s complaint on May 29, 2008. We acquired Vurv on July 1, 2008. We have reviewed these matters and believe that neither our nor Vurv’s software products infringe any valid and enforceable claim of the asserted patents. We have engaged in settlement discussions with Kenexa, but no settlement agreement has been reached. Litigation is ongoing with respect to these matters.
On June 30, 2008, we filed a reexamination request with the United States Patent and Trademark Office (“USPTO”), seeking reconsideration of the validity of Patent No. 6,996,561 based on prior art that we presented with our reexamination request. Finding that our reexamination request raised a “substantial new question of patentability,” the USPTO ordered reexamination of Patent No. 6,996,561 on September 5, 2008. On November 13, 2008, the USPTO issued an office action rejecting all of the claims of Patent No. 6,996,561 because they are either anticipated by or unpatentable over the prior art. After comments by both parties to the reexamination, on June 4, 2009 the USPTO issued a subsequent action standing by its determination that certain claims of Patent No. 6,996,561 are unpatentable, but indicating patentability of other claims. Both parties have since provided additional comments on this subsequent action and both parties have since filed notices of their intention to appeal elements of the reexamination to the USPTO’s Board of Patent Appeals and Interferences. Accordingly, the USPTO’s reexamination of Patent No. 6,996,561 is ongoing.
In a separate action filed on June 25, 2008 in the United States District Court for the District of Delaware, Kenexa’s parent, Kenexa Technology, Inc. (“Kenexa Technology”), asserted claims against us for tortious interference with contract, unfair competition, unfair trade practices, and unjust enrichment arising from our
35
Table of Contents
refusal to allow Kenexa Technology employees to access and use our proprietary applications to provide outsourcing services to a Taleo customer. Kenexa Technology seeks monetary damages and injunctive relief. We answered Kenexa Technology’s complaint on July 23, 2008. On October 16, 2008, we amended our answer and filed counterclaims against Kenexa Technology, alleging copyright infringement, misappropriation of trade secrets, interference with contractual relations, and unfair competition arising from Kenexa’s unauthorized access and use of the Taleo products in the course of providing outsourcing services to our customers, and seeking declaratory judgment, monetary damages, and injunctive relief. We filed a motion to dismiss Kenexa’s claims on July 21, 2009 and a motion for preliminary injunction to enjoin Kenexa employees from accessing our solutions deployed at joint customers of both companies on July 22, 2009. These motions are pending before the Court and this matter is ongoing.
On November 7, 2008, Vurv sued Kenexa, Kenexa Technology, and two of Vurv’s former employees (who now work for Kenexa and/or Kenexa Technology) in the United States District Court for the Northern District of Georgia. In this action, Vurv asserts claims for breach of contract, computer theft, misappropriation of trade secrets, tortious interference, computer fraud and abuse, and civil conspiracy. The defendants answered Vurv’s complaint on December 12, 2008 without asserting any counterclaims. This matter is ongoing.
On July 17, 2009, Kenexa and Kenexa Recruiter (together, the “Kenexa Plaintiffs”) filed suit against Taleo, a current Taleo employee and a former Taleo employee in Massachusetts Superior Court (Middlesex County). The Kenexa Plaintiffs amended the complaint on August 27, 2009 and added Vurv Technology LLC, two former employees of Taleo and two current employees of Taleo. The Kenexa Plaintiffs assert claims for breach of contract and the implied covenant of good faith and fair dealing, unfair trade practices, computer theft, misappropriation of trade secrets, tortious interference, unfair competition, unjust enrichment, computer fraud and abuse. Vurv removed the complaint to the United States District Court for the District of Massachusetts and Taleo and Vurv, along with two other defendants, answered the complaint on October 5, 2009. Additionally, four other defendants (current and former employees of Taleo) moved to dismiss for lack of jurisdiction on October 5 and October 26, 2009. The Kenexa Plaintiffs did not oppose the motion to dismiss for two of these four defendants, and the motion pertaining to the other two defendants is pending before the court and the matter is ongoing.
Securities Claims — On November 14, 2008, following the announcement that we were re-evaluating certain of our historical and then current accounting practices, a shareholder class action lawsuit entitled Brett Johnson v. Taleo Corporation, Michael Gregoire, Katy Murray, and Divesh Sisodraker, CV-08-5182 SC, was filed in the United States District Court for the Northern District of California. The complaint alleged violations of §10(b) of the Exchange Act and SEC Rule 10b-5. The Johnson lawsuit was dismissed without prejudice on December 22, 2008. On December 17, 2008, a second substantially similar shareholder lawsuit entitled Terrence Popyk v. Taleo Corporation, Michael Gregoire, Katy Murray, and Divesh Sisodraker, CV 08-5634 PH, was filed in the Northern District of California; the Popyk lawsuit was dismissed without prejudice on January 20, 2009. On January 13, 2009, a third shareholder lawsuit entitled Scott Stemper v Taleo Corporation, Michael Gregoire, Katy Murray, and Divesh Sisodraker, CV 09-0151 JSW, was filed in the United States District Court for the Northern District of California. On February 9, 2009, the court renamed the Stemper action “In re Taleo Corporation Securities Litigation” and appointed the Greater Pennsylvania Carpenter’s Pension Fund as lead plaintiff (the “Plaintiff”). On June 15, 2009, the Plaintiff filed an amended complaint naming Taleo Corporation, Michael Gregoire, Katy Murray, and Divesh Sisodraker as defendants (the “Amended Complaint”).
The Amended Complaint alleges that defendants engaged in securities fraud in violation of §10(b) of the Exchange Act and SEC Rule 10b-5. The fraud allegations include a failure to apply GAAP in the reporting of quarterly and annual financial statements and securities prospectuses from the time of our initial public offering to recent filings with the SEC. The complaint seeks an unspecified amount of damages on behalf of a purported class of individuals or institutions who purchased or acquired shares of our common stock between September 29, 2005 and November 12, 2008. In response to the Amended Complaint, the defendants filed a motion to dismiss the lawsuit on July 31, 2009. On February 17, 2010, the Court granted defendants’ motion and
36
Table of Contents
dismissed the Amended Complaint. The Court also granted Plaintiff leave to amend and gave Plaintiff until March 12, 2010 to file a second amended complaint. A case management conference is currently set for May 14, 2010.
Other Matters — In addition to the matters described above, we are subject to various claims and legal proceedings that arise in the ordinary course of its business from time to time, including claims and legal proceedings that have been asserted against us by customers, former employees and advisors and competitors. We have accrued for estimated losses in the accompanying consolidated financial statements for matters where we believe the likelihood of an adverse outcome is probable and the amount of the loss is reasonably estimable. Based on currently available information, we do not believe that the ultimate outcome of these unresolved matters, individually or in the aggregate, is likely to have a material adverse effect on our financial position or results of operations. However litigation is subject to inherent uncertainties and our view on these matters may change in the future. Were an unfavorable outcome to occur in any one or more of those matters or the matters described above, over and above the amount, if any, that has been estimated and accrued in our consolidated financial statements, it could have a material adverse effect on our business, financial condition, results of operations and/or cash flows in the period in which the unfavorable outcome occurs or becomes probable, and potentially in future periods.
| ITEM 4. | RESERVED |
None.
37
Table of Contents
PART II
| ITEM 5. | MARKET FOR REGISTRANT’S COMMON EQUITY, RELATED STOCKHOLDER MATTERS AND ISSUER PURCHASES OF EQUITY SECURITIES |
Our Class A common stock has been listed on the Nasdaq Global Market under the symbol “TLEO” since September 29, 2005. Prior to that time, there was no public market for our Class A common stock. The following table sets forth the range of high and low sales prices on the Nasdaq Global Market of the Class A common stock for the periods indicated.
| High | Low | |||||
| For the year ended December 31, 2009 |
||||||
| Fourth quarter |
$ | 23.86 | $ | 19.72 | ||
| Third quarter |
22.65 | 16.39 | ||||
| Second quarter |
19.03 | 11.60 | ||||
| First quarter |
12.30 | 7.09 | ||||
| For the year ended December 31, 2008 |
||||||
| Fourth quarter |
$ | 20.26 | $ | 5.69 | ||
| Third quarter |
25.75 | 17.38 | ||||
| Second quarter |
21.66 | 17.28 | ||||
| First quarter |
29.00 | 16.72 | ||||
As of March 5, 2010, there were approximately 162 holders of record of our Class A common stock. Because many of our shares of Class A common stock are held by brokers and other institutions on behalf of stockholder, we are unable to estimate the total number of stockholders represented by these record holders.
Issuer Purchases of Equity Securities(1)
| Period |
Total Number of Shares Purchased |
Price Paid per Share |
Total Number of Shares Purchased as Part of Publicly Announced Plans or Programs |
Maximum Dollar Value of Shares that May Yet Be Purchased under the Plans or Programs | ||||||
| October 1, 2009 through October 31, 2009 |
18,643 | $ | 21.70 | (2) | — | — | ||||
| November 1, 2009 through November 30, 2009 |
— | — | — | — | ||||||
| December 1, 2009 through December 31, 2009 |
— | — | — | — | ||||||
| 18,643 | $ | 21.70 | (2) | — | — | |||||
| (1) | In connection with our awards of restricted stock and/or performance shares, we repurchase common stock from employees as consideration for the payment of required withholding taxes. |
| (2) | Represents the price per share. |
In addition to acquiring our Class A common stock from employees in fourth quarter of 2009, we received 111,167 shares of Class A common stock from the settlement of the Vurv escrow account. The shares we received were recorded as treasury stock to be held for fulfillment of future employee stock purchases under our employee stock purchase plan. The $2.5 million value of the shares received was recorded as other income in the fourth quarter of 2009.
Dividend Policy
We have never declared or paid any cash dividends on our Class A common stock. We currently expect to retain any future earnings for use in the operation and expansion of our business and do not anticipate paying any cash dividends on our Class A common stock in the foreseeable future.
38
Table of Contents
Stock Performance Graph
The following graph shows a comparison from September 28, 2005 through December 31, 2009 of cumulative total return for Taleo’s Class A common stock, the Nasdaq stock Market (U.S.) Index and the Nasdaq Computer and Data Processing Index. The graph assumes that $100 was invested on September 28, 2005 in Taleo’s Class A common stock and each of the indices as noted below, including reinvestment of dividends. No dividends have been paid or declared on Taleo’s Class A common stock. Note that historic stock price performance is not necessarily indicative of future stock price performance.
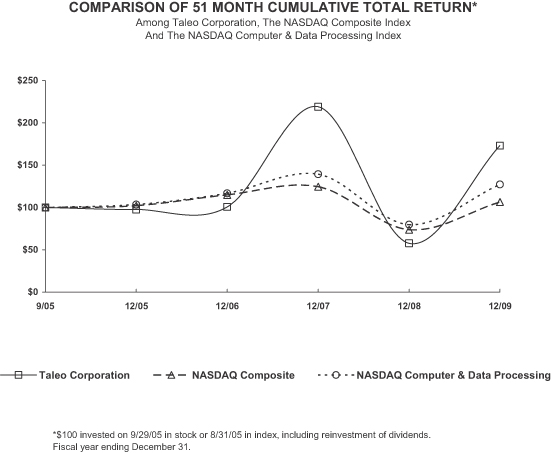
Information used in the graph was obtained from Research Data Group Inc, a third party investment research firm, a source believed to be reliable, but we are not responsible for any errors or omissions in such information.
The stock performance graph shall not be deemed “filed” for purposes of Section 18 of the Securities Exchange Act of 1934, as amended, or otherwise subject to the liabilities under that Section, and shall not be deemed to be incorporated by reference into any filing of Taleo under the Securities Act of 1933, as amended, or the Exchange Act.
39
Table of Contents
| ITEM 6. | SELECTED FINANCIAL DATA |
The information below is derived from our consolidated financial statements and should be read in conjunction with Item 8.— Financial Statements and Supplementary Data and Item 7.— Management’s Discussion and Analysis of Financial Condition and Results of Operations. The consolidated statement of operations data for each of the years ended December 31, 2006 and 2005 and the consolidated balance sheet data as of December 31, 2007, 2006 and 2005 are derived from our consolidated financial statements which are not included in this report. Our historical results are not necessarily indicative of results for any future period.
| Year Ended December 31, | ||||||||||||||||||||
| 2009 | 2008 | 2007 | 2006 | 2005 | ||||||||||||||||
| (In thousands, except per share data) | ||||||||||||||||||||
| Consolidated Statements of Operations Data(1): |
||||||||||||||||||||
| Revenue: |
||||||||||||||||||||
| Application |
$ | 173,495 | $ | 138,628 | $ | 105,032 | $ | 79,116 | $ | 63,269 | ||||||||||
| Consulting |
24,917 | 29,791 | 23,038 | 15,864 | 8,945 | |||||||||||||||
| Total revenue |
198,412 | 168,419 | 128,070 | 94,980 | 72,214 | |||||||||||||||
| Cost of revenue: |
||||||||||||||||||||
| Application |
41,478 | 32,376 | 22,642 | 19,394 | 16,411 | |||||||||||||||
| Consulting |
24,614 | 25,269 | 18,098 | 12,857 | 11,058 | |||||||||||||||
| Total cost of revenue |
66,092 | 57,645 | 40,740 | 32,251 | 27,469 | |||||||||||||||
| Gross profit |
132,320 | 110,774 | 87,330 | 62,729 | 44,745 | |||||||||||||||
| Operating expenses: |
||||||||||||||||||||
| Sales and marketing |
65,731 | 53,827 | 37,172 | 29,841 | 22,481 | |||||||||||||||
| Research and development |
34,847 | 30,994 | 23,197 | 19,722 | 16,650 | |||||||||||||||
| General and administrative |
33,152 | 32,382 | 24,281 | 21,619 | 10,829 | |||||||||||||||
| Restructuring and severance expense |
— | 1,914 | — | 414 | 804 | |||||||||||||||
| Total operating expenses |
133,730 | 119,117 | 84,650 | 71,596 | 50,764 | |||||||||||||||
| Operating income / (loss) |
(1,410 | ) | (8,343 | ) | 2,680 | (8,867 | ) | (6,019 | ) | |||||||||||
| Other income / (expense): |
||||||||||||||||||||
| Interest income |
329 | 1,717 | 3,045 | 2,891 | 873 | |||||||||||||||
| Interest expense |
(166 | ) | (199 | ) | (137 | ) | (107 | ) | (1,273 | ) | ||||||||||
| Fees for early extinguishment of debt |
— | — | — | — | (2,264 | ) | ||||||||||||||
| Worldwide Compensation purchase option write-off |
(1,084 | ) | — | — | — | — | ||||||||||||||
| Settlement of Vurv escrow account |
2,471 | — | — | — | — | |||||||||||||||
| Total other income / (expense), net |
1,550 | 1,518 | 2,908 | 2,784 | (2,664 | ) | ||||||||||||||
| Income / (loss) before provision for (benefit from) income taxes |
140 | (6,825 | ) | 5,588 | (6,083 | ) | (8,683 | ) | ||||||||||||
| Provision for / (benefit from) for income taxes |
(1,153 | ) | 1,303 | 3,083 | (323 | ) | 4 | |||||||||||||
| Net income / (loss) |
1,293 | (8,128 | ) | 2,505 | (5,760 | ) | (8,687 | ) | ||||||||||||
| Accrual of dividends and issuance costs on preferred stock |
— | — | — | — | (2,984 | ) | ||||||||||||||
| Net income / (loss) attributable to Class A common stockholders |
$ | 1,293 | $ | (8,128 | ) | $ | 2,505 | $ | (5,760 | ) | $ | (11,671 | ) | |||||||
| Net income / (loss) attributable to Class A common stockholders per share — basic |
$ | 0.04 | $ | (0.29 | ) | $ | 0.10 | $ | (0.29 | ) | $ | (2.53 | ) | |||||||
| Net income / (loss) loss attributable to Class A common stockholders per share — diluted |
$ | 0.04 | $ | (0.29 | ) | $ | 0.09 | $ | (0.29 | ) | $ | (2.53 | ) | |||||||
| Weighted-average Class A common shares — basic |
31,507 | 27,569 | 24,116 | 20,031 | 4,619 | |||||||||||||||
| Weighted-average Class A common shares — diluted(2) |
32,406 | 27,569 | 28,777 | 20,031 | 4,619 | |||||||||||||||
40
Table of Contents
| As of December 31, | |||||||||||||||
| 2009 | 2008 | 2007 | 2006 | 2005 | |||||||||||
| (In thousands) | |||||||||||||||
| Consolidated balance sheet data: |
|||||||||||||||
| Cash and cash equivalents |
$ | 244,229 | $ | 49,462 | $ | 86,135 | $ | 58,785 | $ | 59,358 | |||||
| Working capital |
202,524 | 19,594 | 60,515 | 49,310 | 51,202 | ||||||||||
| Total assets |
456,377 | 283,189 | 164,821 | 118,571 | 99,008 | ||||||||||
| Long-term debt(3) |
107 | 519 | 16 | 17 | 420 | ||||||||||
| Total preferred stock and exchangeable share obligation |
— | — | 331 | 796 | 1,715 | ||||||||||
| Total stockholders’ equity |
337,209 | 172,421 | 85,668 | 61,155 | 57,350 | ||||||||||
| (1) | We acquired Recruitforce.com, Inc. in March 2005, certain assets of JobFlash, Inc. in March 2007, certain assets of Wetfeet, Inc. in July 2007, and Vurv Technology, Inc. in July 2008. Our consolidated statement of operations and balance sheet data include the results of Recruitforce.com, JobFlash, Wetfeet and Vurv Technology only for periods subsequent to March 7, 2007, July 3, 2007, and July 1, 2008, respectively. See Item 7, “ Management’s Discussion and Analysis of Financial Condition and Results of Operations” and Note 2 “Business Combinations and Dispositions” of the Notes to Consolidated Financial Statements for additional information regarding our acquisitions with respect to JobFlash, Inc., Wetfeet, Inc., and Vurv Technology, Inc. |
| (2) | Exchangeable shares, redeemable convertible preferred stock, stock options, and warrants are not included if antidilutive for the periods presented. See Note 7 “Common Stock” of the Notes to Consolidated Financial Statements. |
| (3) | Includes long-term debt and capital leases related to production equipment and internal use software. See Note 9. “Commitments and Contingencies” of the Notes to Consolidated Financial Statements. |
| ITEM 7. | MANAGEMENT’S DISCUSSION AND ANALYSIS OF FINANCIAL CONDITION AND RESULTS OF OPERATIONS |
The following discussion should be read in conjunction with our Item 8 — Financial Statements and Supplementary Data.
We are a leading global provider of on-demand talent management software solutions. Our goal is to help our customers improve business results through better talent management. We offer recruiting, performance management, compensation, succession planning, leadership development and analytics software solutions that help our customers attract and retain high quality talent, more effectively match workers’ skills to business needs, reduce the time and costs associated with manual and inconsistent processes, ease the burden of regulatory compliance, and increase workforce productivity through better alignment of workers’ goals, career plans and compensation with corporate objectives. In addition, our solutions are highly configurable which allows our customers to implement talent management processes that are tailored to accommodate different employee types (including professional and hourly), in different locations, business units and regulatory environments.
We offer two suites of talent management solutions: Taleo Enterprise and Taleo Business Edition. Taleo Enterprise is designed for medium and large enterprises with more complex needs. Taleo Business Edition is designed for smaller, more centralized organizations, stand-alone departments and divisions of larger organizations, and staffing companies. Our revenue is primarily earned through subscription fees charged for accessing and using these solutions. Our customers generally are billed in advance for their use of our solutions, and we use these cash receipts to fund our operations. Our customers generally pay us on a quarterly or annual basis.
We focus our evaluation of our operating results and financial condition on certain key metrics, as well as certain non-financial aspects of our business. Included in our evaluation of our financial condition are our revenue composition and growth, net income, and our overall liquidity that is primarily comprised of our cash and accounts receivable balances. Non-financial data is also evaluated, including purchasing trends for software
41
Table of Contents
applications across industries and geographies, input from current and prospective customers relating to product functionality and general economic data. We use the financial and non-financial data described above to assess our historic performance, and also to plan our future strategy. We continue to believe that our strategy and our ability to execute that strategy may enable us to improve our relative competitive position in a difficult economic environment and may provide long-term growth opportunities given the cost saving benefits of our solutions and the business requirements our solutions address.
However, if general economic conditions worsen or fail to improve, we will likely continue to experience the conditions that began in the first quarter of 2008 of increased delays in our sales cycles and increased pressure from prospective customers to offer discounts higher than our historical practices. Additionally, while our renewal rates on a dollar-for-dollar basis in 2009 were strong, we may experience increased pressure from existing customers to renew expiring software subscription agreements at lower rates, and certain of our customers may attempt to negotiate lower software subscription fees for existing arrangements or decrease or discontinue use of our consulting services because of downturns in their businesses. Additionally, certain of our customers have become or may become bankrupt or insolvent as a result of the current economic downturn. To date, we have not been negatively impacted in a material way by customer bankruptcies but if a significant customer were to declare bankruptcy, we could lose all revenue from such customer or payments might be delayed during bankruptcy proceedings.
On September 14, 2009, we entered into an Amended and Restated Agreement and Plan of Merger (the “Merger Agreement”) to acquire Worldwide Compensation, Inc. (“WWC”), a private company with headquarters in California that provides compensation management solutions. In accordance with the terms of the Merger Agreement, the Company was to pay up to $16.0 million in cash, subject to adjustment for any outstanding debt, third-party expenses and certain other specified items, in exchange for all of the issued and outstanding capital stock, options and warrants of WWC that we do not already own. Fifteen percent (15%) of the consideration was to be placed into escrow for one year following the closing to be held as security for losses incurred by us in the event of certain breaches of the representations and warranties contained in the Merger Agreement or certain other events. Previously, in the third quarter of 2008, we made an initial investment of $2.5 million for a 16% equity investment in and an option to purchase the remainder of WWC at a later date. In connection with the execution of the Merger Agreement, we negotiated more favorable terms than the purchase option and also terminated the purchase option. Accordingly, we wrote-off the $1.1 million carrying value of the purchase option in the third quarter of 2009.
On January 1, 2010, we completed the acquisition of WWC. Accordingly, the assets, liabilities and operating results of WWC will be reflected in our consolidated financial statements from the date of acquisition. The total consideration paid by us for the portion of WWC that we did not already own was approximately $14.1 million in cash. No contingent cash payments remain for this transaction.
On November 19, 2009, we completed our offering of 6,500,000 shares of common stock at a price of $20.25 per share. We sold 7,475,000 shares, including 975,000 shares related to an underwriter’s option to sell additional shares to cover over-allotments of shares. Upon the closing of the offering, we received net proceeds of $144.6 million, after deducting underwriting discounts and commissions. Additionally, we incurred $0.8 million of other costs in connection with the offering further reducing, the net proceeds to approximately $143.8 million.
Sources of Revenue
We derive our revenue from two sources: application revenue and consulting revenue.
Application Revenue
Application revenue is generally comprised of subscription fees from customers accessing our applications, which includes the use of the application, application and data hosting, and maintenance of the application. The
42
Table of Contents
majority of our application subscription revenue is recognized monthly over the life of the application agreement, based on a stated, fixed-dollar amount. Revenue associated with our Taleo Contingent solution was recognized based on a fixed contract percentage of the dollar amount invoiced for contingent labor through use of the application. Effective March 2007, we ceased entering into agreements to provide time and expense processing as a component of our Taleo Contingent solution and, accordingly, our revenue model based on a percentage of spend from such processing services ended. We serviced our customers to which we provide such time and expense processing services through the expiration of their agreements with us. Revenue from time and expense processing for these customers ended in August 2008.
The term of our application agreements for Taleo Enterprise signed with new customers in 2009, 2008, and 2007 is typically three or more years. The term of application agreements for Taleo Business Edition is typically one year. Our customer renewals on a dollar basis have historically been greater than 95%.
Application agreements entered into during 2009, 2008, and 2007 are generally non-cancelable, or contain significant penalties for early cancellation, although customers typically have the right to terminate their contracts for cause, if we fail to perform our material obligations.
Consulting Revenue
Consulting revenue consists primarily of fees associated with application process definition, configuration, integration, change management, optimization, expansion and education and training services. From time to time, certain of our consulting projects are subcontracted to third parties. Our customers may also elect to use unrelated third parties for the types of consulting services that we offer. Our typical consulting contract provides for payment within 30 to 60 days of invoice.
Cost of Revenue and Operating Expenses
Cost of Revenue
Cost of application revenue primarily consists of expenses related to hosting our application and providing support, including employee related costs, data center operations costs, depreciation expense associated with computer equipment and the amortization of acquired intangible assets. We allocate overhead such as rent and occupancy charges, employee benefit costs and depreciation expense to all departments based on employee count. As such, overhead expenses are reflected in each cost of revenue and operating expense category. We currently deliver our solutions from 10 data centers that host the applications for all of our customers and we also use cloud computing services as part of our solution delivery. In 2009 we reduced our total number of data centers through consolidation and we acquired two new data centers with the acquisition of WWC on January 1, 2010. We plan to consolidate our U.S. production data center operations for our Taleo Enterprise solution into a new single facility in Chicago, Illinois in 2010.
Cost of consulting revenue consists primarily of employee related costs associated with these services and allocated overhead. The cost associated with providing consulting services is significantly higher as a percentage of revenue than for our application revenue, primarily due to labor costs. We also subcontract to third parties for a portion of our consulting business. To the extent that our customer base grows, we intend to continue to invest additional resources in our consulting services. The timing of these additional expenses could affect our cost of revenue, both in dollar amount and as a percentage of revenue, in a particular quarterly or annual period.
Sales and Marketing
Sales and marketing expenses consist primarily of salaries and related expenses for our sales and marketing staff, including commissions, marketing programs, allocated overhead and amortization of intangibles from acqusitions. Marketing programs include advertising, events, corporate communications, and other brand building and product marketing expenses. As our business grows, we plan to continue to increase our investment
43
Table of Contents
in sales and marketing by adding personnel, building our relationships with partners, expanding our domestic and international selling and marketing activities, building brand awareness, and sponsoring additional marketing events. We expect research and development cost to increase in terms of absolute dollars, but remain constant as a percentage of total revenue in 2010 as we continue to develop new product functionality and integrate acquired technology into our product suite.
Research and Development
Research and development expenses consist primarily of salaries and related expenses and allocated overhead, and third-party consulting fees. Our expenses are net of the provincial investment credits we receive from the province of Quebec. We focus our research and development efforts on increasing the functionality and enhancing the ease of use and quality of our applications, as well as developing new products and enhancing our infrastructure. We expect research and development cost to increase in terms of absolute dollars, but remain constant as a percentage of total revenue in 2010 as we continue to develop new product functionality and integrate acquired technology into our product suite.
General and Administrative
General and administrative expenses consist of salaries and related expenses for executive, finance and accounting, human resource, legal, operations and management information systems personnel, professional fees, board compensation and expenses, expenses related to potential mergers and acquisitions, and other corporate expenses. We expect that the amount of general and administrative expenses will slightly increase in dollar terms as we add personnel over the next year. However, we expect that as a percentage of revenue these expenses are expected to decrease.
Critical Accounting Policies and Estimates
Our consolidated financial statements are prepared in accordance with accounting principles generally accepted in the United States, or GAAP. The preparation of these consolidated financial statements requires us to make estimates and assumptions that affect the reported amounts of assets, liabilities, revenue, costs and expenses and related disclosures. We base our estimates on historical experience and on various other assumptions that we believe to be reasonable under the circumstances. In many instances, we could have reasonably used different accounting estimates, and in other instances changes in the accounting estimates are reasonably likely to occur from period to period. Accordingly, actual results could differ significantly from the estimates made by our management. To the extent that there are material differences between these estimates and actual results, our future financial statement presentation, financial condition, results of operations and cash flows will be affected.
In many cases, the accounting treatment of a particular transaction is specifically dictated by GAAP and does not require management’s judgment in its application, while in other cases, management’s judgment is required in selecting among available alternative accounting standards that allow different accounting treatment for similar transactions. We believe that the accounting policies discussed below are critical to understanding our historical and future performance, as these policies relate to the more significant areas involving management’s judgments and estimates. Our management has reviewed these critical accounting policies, our use of estimates and the related disclosures with our audit committee.
Revenue Recognition
We derive revenue from fixed subscription fees for access to and use of our on-demand application services, and from consulting fees.
In addition to fixed subscription fees arrangements, the Company has on limited occasions, entered into arrangements including a perpetual license with hosting services to be provided over a fixed term. For hosted arrangements, revenues are recognized in accordance with the standards established by the FASB for hosting arrangements that includes a right of the customer to use the software on another entity’s hardware.
44
Table of Contents
Our application and consulting fee revenue is recognized when all of the following conditions have been satisfied:
| • | persuasive evidence of an agreement exists; |
| • | delivery has occurred; |
| • | fees are fixed or determinable; and |
| • | the collection of fees is considered probable. |
If collection is not considered probable, we recognize revenues when the fees for the services performed are collected. In addition, if non-standard acceptance periods or non-standard performance criteria are required, we recognize revenue upon the satisfaction of the acceptance or performance criteria, as applicable.
We follow accounting guidance for revenue recognition of multiple-element arrangements to determine whether such arrangements contain more than one unit of accounting. Multiple element arrangements require the delivery or performance of multiple products, services and/or rights to use assets. To qualify as a separate unit of accounting, the delivered item must have value to the customer on a standalone basis and there must be objective and reliable evidence of fair value of any undelivered element. Our consulting services have standalone value because those services are sold separately by other vendors and we have objective and reliable evidence of fair value for consulting services based on the consistency in pricing when sold separately. Our application services have standalone value because we often sell such services separately; however, in multiple element arrangements that include both application and consulting services, we typically do not have objective and reliable evidence of fair value for our application services. As such, we treat multiple element arrangements that include both application and consulting services as a single unit of accounting and recognize the combined revenue over the subscription term.
The Company’s objective and reliable evidence of fair value for consulting services and its assessment of fair value with respect to application services are used to derive a reasonable approximation for presenting application services and consulting services separately in its consolidated financial statements.
Application Revenue
The majority of our application revenue is recognized monthly over the life of the application agreement, based on stated, fixed-dollar amount contracts with our customers and consists of:
| • | fees paid for subscription services; |
| • | amortization of any related set-up fees; and |
| • | amortization of fees paid for hosting services and software maintenance services under certain software license arrangements. |
Set up fees paid by customers in connection with subscription services are deferred and recognized ratably over the longer of the life of the application agreement or the expected lives of customer relationships, which generally range from three to seven years. We continue to evaluate the length of the amortization period of the set up fees as we gain more experience with customer contract renewals.
Our revenue associated with the time and expense processing functionality of our Taleo Contingent solution was recognized based on a fixed, contracted percentage of the dollar amount invoiced for contingent labor through use of the application, and was recorded on a net basis as opposed to a gross basis as we were not the primary obligor under the arrangements, the percentage earned by us was typically fixed, and we did not take credit risk.
45
Table of Contents
Consulting Revenue
Consulting revenue consists primarily of fees associated with application configuration, integration, business process re-engineering, change management, and education and training services. In arrangements that include both an application subscription and consulting services, the related consulting revenues are recognized ratably over the remaining subscription term. Our consulting engagements are typically billed on a time and materials basis and, for engagements sold separately from application services, we recognize consulting revenues as delivered. In some instances we sell consulting services on a fixed-fee basis and, in those cases, for engagements sold separately from application services, we recognize consulting revenues using a proportional performance model based on services performed. Associated out-of-pocket travel and expenses related to the delivery of consulting services is typically reimbursed by the customer. This is accounted for as both revenue and expense in the period the cost is incurred. From time to time, certain of our consulting projects are subcontracted to third parties. Our customers may also elect to use unrelated third parties for the types of consulting services that we offer. Our typical consulting contract provides for payment within 30 to 60 days of invoice.
In October 2009, the FASB amended the accounting standards for revenue recognition for multiple deliverable revenue arrangements to:
| • | Provide updated guidance on how the deliverables of an arrangement should be separated, and how the consideration should be allocated: |
| • | Eliminate the use of the residual method and require an entity to allocate revenue using the relative selling price method; and |
| • | Require an entity to allocate revenue to an arrangement using the estimated selling prices (“ESP”) of deliverables if it does not have vendor-specific objective evidence (“VSOE”) or third-party evidence (“TPE”) of selling price. Valuation terms defined as below: |
| • | VSOE — the price at which we sell the element in a separate stand-alone transaction |
| • | TPE — evidence from us or other companies of the value of a largely interchangeable element in a transaction |
| • | ESP — our best estimate of the selling price of an element in a transaction. |
We have elected to early adopt this accounting guidance for our fiscal year ending December 31, 2010 on a prospective basis. We expect the implementation will significantly increase our services revenue and services gross margins throughout the year as we will continue to recognize previously deferred services revenue ratably for bundled transactions that occurred prior to fiscal year 2010, while consulting services revenue from new transactions in 2010 will generally be recognized as performed. We are currently evaluating the impact of this accounting standard on our consolidated financial statements.
Research and Development
We incur cost to develop internal-use software during the application development stage. These costs are capitalized after technological feasibility of the product has been established. Such costs have been insignificant to date, and accordingly, no costs were capitalized during the years ended December 31, 2009 and 2008.
Stock-based Compensation
We recognize the fair value of stock-based compensation in financial statements over the requisite service period of the individual grants, which generally equals a four year vesting period. We recognize compensation expense for stock option awards, restricted stock awards, performance share grants and shares purchased under the employee stock purchase plan on a straight-line basis over the requisite service period, see Note 1 “Description of Business and Summary of Significant Accounting Policies Stock-Based Compensation” in the Notes to Consolidated Financial Statements. Estimates are used in determining the fair value of such awards. Changes in these estimates could result in changes to our compensation charges.
46
Table of Contents
Impairment of Goodwill, Other Intangible Assets and Long-Lived Assets
We conduct a test for the impairment of goodwill on at least an annual basis. We adopted October 1 as the date of the annual impairment test. The impairment test first compares the fair value of reporting units to their carrying amount, including goodwill, to assess whether impairment is present. Based on our most recent assessment test, the fair value of the reporting unit exceeds our carrying value and therefore we do not have impairment as of October 1, 2009. We will assess the impairment of goodwill annually on October 1, or sooner if indicators of impairment arise.
We review the carrying value of long-lived assets including intangible assets when impairment indicators arise. The review of these long-lived assets is based on factors including estimates of the future operating cash flows of our business. These future estimates are based on historical results, adjusted to reflect our best estimates of future market and operating conditions, and are continuously reviewed. Actual results may vary materially from our estimates, and accordingly may cause a full impairment of our long-lived assets.
Income Taxes
We are subject to income taxes in both the United States and foreign jurisdictions and we use estimates in determining our provision for income taxes. Deferred tax assets, related valuation allowances and deferred tax liabilities are determined separately by tax jurisdiction. This process involves estimating actual current tax liabilities together with assessing temporary differences of items for tax and accounting purposes. These differences result in deferred tax assets and liabilities which are recorded on the balance sheet. Our deferred tax assets consist primarily of net operating loss carry forwards and temporary differences related to deferred revenue, stock-based compensation and Canadian federal investment tax credits.
We assess the likelihood that deferred tax assets will be recovered from future taxable income and a valuation allowance is recorded if it is deemed more likely than not some portion of the deferred tax assets will not be realized. In 2007, we reversed valuation allowances for certain foreign subsidiaries, which resulted in a tax provision benefit of approximately $0.3 million. We continue to maintain a full valuation allowance against our U. S. deferred tax assets with the exception of U.S. federal alternative minimum tax credits.
Compliance with income tax regulations requires us to make decisions relating to the transfer pricing of revenue and expenses between each of our legal entities that are located in several countries. Our determinations include many decisions based on our knowledge of the underlying assets of the business, the legal ownership of these assets, and the ultimate transactions conducted with customers and other third-parties. The calculation of our tax liabilities involves dealing with uncertainties in the application of complex tax regulations in multiple tax jurisdictions. We are periodically reviewed by domestic and foreign tax authorities regarding the amount of taxes due. These reviews include questions regarding the timing and amount of deductions and the allocation of income among various tax jurisdictions. In evaluating the uncertainty associated with various filing positions, we record tax benefits in accordance with FASB-issued authoritative guidance. Such estimates are subject to change.
47
Table of Contents
Results of Operations
The following tables set forth certain consolidated statements of operations data expressed as a percentage of total revenue for the periods indicated. Period-to-period comparisons of our financial results are not necessarily meaningful and you should not rely on them as an indication of future performance.
| Year Ended December 31, | |||||||||
| 2009 | 2008 | 2007 | |||||||
| Condensed Consolidated Statement of Operations Data: |
|||||||||
| Revenue: |
|||||||||
| Application |
87 | % | 82 | % | 82 | % | |||
| Consulting |
13 | % | 18 | % | 18 | % | |||
| Total revenue |
100 | % | 100 | % | 100 | % | |||
| Cost of revenue (as a percent of related revenue): |
|||||||||
| Application |
24 | % | 23 | % | 22 | % | |||
| Consulting |
99 | % | 85 | % | 79 | % | |||
| Total cost of revenue |
33 | % | 34 | % | 32 | % | |||
| Gross profit |
67 | % | 66 | % | 68 | % | |||
| Operating expenses: |
|||||||||
| Sales and marketing |
33 | % | 32 | % | 29 | % | |||
| Research and development |
18 | % | 18 | % | 18 | % | |||
| General and administrative |
17 | % | 19 | % | 19 | % | |||
| Restructuring |
0 | % | 1 | % | 0 | % | |||
| Total operating expenses |
68 | % | 71 | % | 66 | % | |||
| Operating income / (loss) |
-1 | % | -5 | % | 2 | % | |||
| Other income (expense): |
|||||||||
| Interest income |
0 | % | 1 | % | 2 | % | |||
| Interest expense |
0 | % | 0 | % | 0 | % | |||
| Other income |
1 | % | 0 | % | 0 | % | |||
| Total other income, net |
1 | % | 1 | % | 2 | % | |||
| Income / (loss) before provision for / (benefit from) income taxes |
0 | % | -4 | % | 4 | % | |||
| Provision for / (benefit from) income taxes |
-1 | % | 1 | % | 2 | % | |||
| Net income / (loss) |
1 | % | -5 | % | 2 | % | |||
Comparison of the Years Ended December 31, 2009 and 2008
Dollar amounts in tables are shown in thousands.
Revenue
| 2009 | 2008 | $ change | % change | ||||||||||
| (In thousands) | |||||||||||||
| Application revenue |
$ | 173,495 | $ | 138,628 | $ | 34,867 | 25 | % | |||||
| Consulting revenue |
24,917 | 29,791 | (4,874 | ) | -16 | % | |||||||
| Total revenue |
$ | 198,412 | $ | 168,419 | $ | 29,993 | 18 | % | |||||
The increase in application revenue was due to increased renewals by existing customers, sales to new customers, sales of additional applications to existing customers, broader roll out of our applications by existing customers and the addition of customers through our acquisition of Vurv Technology, Inc. (“Vurv”) on July 1,
48
Table of Contents
2008. In 2009, we had 65 new Taleo Enterprise customers and 599 new Taleo Business Edition customers. Application revenue associated with our product lines for Taleo Enterprise customers increased by $30.3 million as compared to 2008. Additionally, application revenue includes a full year of revenue from the legacy Vurv customers as compared to the prior year which included six months of revenue from the acquisition date, July 1, 2008. Application revenue associated with Taleo Business Edition customers increased by $4.6 million as compared to 2008. Our list prices for application services have remained relatively consistent on a year-over-year basis, however; we have experienced increased pressure from competitors and the economic environment to discount our prices. Renewals of application services for larger more complex organizations, on a dollar-for-dollar basis, remained at approximately 95%. For 2010, we expect to see renewals in the same percentage range, but unexpected events, such as bankruptcy filings within our customer base, may negatively impact our renewal trends. We expect total application revenue to increase as we continue to increase our sales of new and existing applications into our installed customer base as well as to new customers.
In 2009, our consulting revenue came from two kinds of engagements: standalone consulting engagements which are not associated with new product implementations and bundled consulting engagements which are associated with new product implementations. Standalone consulting engagement revenue is generally recognized when the services are performed, while bundled consulting engagement revenue is generally recognized ratably over the term of the associated application services agreement with a significant portion of revenue deferred to periods beyond the period in which services were performed.
In 2009, consulting revenue decreased due to a decrease in standalone consulting engagements, where revenue is recognized as the consulting services are performed, as well as a reduction in consulting services for legacy Vurv products. In 2009, consulting services revenue for legacy Vurv engagements decreased significantly compared to the prior year as we have completed a significant portion of the consulting engagements assumed in connection with the July 2008 acquisition of Vurv. We have entered into a very limited number of new consulting agreements related to legacy Vurv products since we no longer sell those products. The utilization rate for our consultants is the percentage of time billable out of a 2,080 hour year and we experienced a slight decrease in 2009 from 66% in 2008 to 65% in 2009. The prices of our consulting services were relatively consistent on a period-to-period comparative basis.
We expect total consulting revenue to increase in 2010 given we elected to early adopt new accounting guidance for arrangements with multiple deliverables. Under this guidance, revenue from new transactions in 2010 will generally be recognized as performed. As noted previously, historically, consulting revenue from bundled consulting engagements associated with new product implementations was generally recognized over the term of the associated application service agreement. In 2010, we expect an increase in consulting revenue recognized as a result of the adoption of this new accounting guidance. We are currently evaluating the impact of this accounting standard on our consolidated financial statements.
Our U.S. company is the contracting party for all sales agreements in the United States and our Canadian subsidiary is the contracting party for all Taleo Enterprise Edition sales agreements in Canada. Prior to January 1, 2005, certain of our subsidiaries outside of North America were the contracting parties for sales transactions within their regions. After January 1, 2005, our U.S. company has been the contracting party for all new sales agreements and renewals of existing sales agreements entered into with customers outside of North America. Accordingly, as our customers renew their agreements with us over time, the percentage of total revenue identified to our subsidiaries outside of North America should decline. Accordingly, the geographic mix of total revenue, based on the country of location of the Taleo contracting entity, in the year ended December 31, 2009 was about 96%, less than 4% and less than 1% in the United States, Canada and the rest of the world, respectively, as compared to about 95%, less than 5% and less than 1%, respectively, in the year ended December 31, 2008. For the year ended December 31, 2007, it was 94% from the United States, 5% from Canada, 1% from the rest of the world. We also track the geographic mix of our revenue on the basis of the location of the contracting entity for our customers. The geographic mix of application revenue based on the region of location of the customer contracting in the year ended December 31, 2009 was 81% from the United
49
Table of Contents
States, 4% from Canada, 11% from Europe, and 4% from the rest of the world. For the year ended December 31, 2008, it was 83% from the United States, 5% from Canada, 8% from Europe, and 4% from the rest of the world and for the year ended December 31, 2007, it was 85% from the United States, 6% from Canada, 6% from Europe, and 3% from the rest of the world. Due to the nature of consulting services revenue recognition, it is impracticable to determine revenue by location of the customer contracting, however the trends for contracted consulting services would be expected to be similar to the geographic mix of application revenue.
Cost of Revenue
| Year ended December 31, | |||||||||||||
| 2009 | 2008 | $ change | % change | ||||||||||
| (In thousands) | |||||||||||||
| Cost of revenue — application |
$ | 41,478 | $ | 32,376 | $ | 9,102 | 28 | % | |||||
| Cost of revenue — consulting |
24,614 | 25,269 | (655 | ) | -3 | % | |||||||
| Cost of revenue — total |
$ | 66,092 | $ | 57,645 | $ | 8,447 | 15 | % | |||||
Cost of revenue — application — summary of changes
| Change from 2008 to 2009 | |||
| Hosting facility cost |
$ | 4,160 | |
| Employee-related costs |
2,009 | ||
| Depreciation and amortization |
1,519 | ||
| Various other expense |
1,414 | ||
| $ | 9,102 | ||
The increase in cost of application revenue was primarily driven by an increase in hosting facility expenses. Hosting facility expenses increased primarily due to the opening of our production data center in Amsterdam in the fourth quarter of 2008. We also incurred a full year of additional hosting facility costs, including third-party software costs, internet bandwidth costs, depreciation and other costs associated with legacy Vurv hosting facilities added July 1, 2008. Our employee related costs increased due to additional headcount assumed in connection with the acquisition of Vurv. Additionally, we incurred additional amortization expenses attributable to the amortization of intangible assets obtained from the acquisition of Vurv as compared to 2008. We expect the cost of application revenue to increase in terms of absolute dollars as we plan to consolidate our U.S. production data center operations for our Taleo Enterprise solution into a new single facility in Chicago, Illinois in 2010.
Cost of revenue — consulting — summary of changes
| Change from 2008 to 2009 | ||||
| Employee-related costs |
$ | 783 | ||
| Professional services |
(1,245 | ) | ||
| Travel and entertainment |
(536 | ) | ||
| Various other expense |
343 | |||
| $ | (655 | ) | ||
Expenses associated with delivering consulting services are generally recognized as incurred when the services are performed. During 2009, cost of consulting revenue decreased primarily due to a reduction in outsourced consulting services. In the past, we have outsourced a portion of consulting services engagements to
50
Table of Contents
third-party providers however, as a result of the overall decrease in demand for consulting services during 2009 our need for these third-party providers decreased as well. During 2009, employee-related costs increased due to a net headcount increase as a result of the July 2008 Vurv acquisition which increased costs in the first six months of 2009 compared to same period in 2008. We expect cost of consulting revenue to increase as we increase resources to meet an anticipated increased demand for our professional services.
Gross Profit and Gross Profit Percentage
| Year ended December 31, | |||||||||||||||
| 2009 | 2008 | $ change | % change | ||||||||||||
| (In thousands) | |||||||||||||||
| Gross profit |
|||||||||||||||
| Gross profit — application |
$ | 132,017 | $ | 106,252 | $ | 25,765 | 24 | % | |||||||
| Gross profit — consulting |
303 | 4,522 | (4,219 | ) | -93 | % | |||||||||
| Gross profit — total |
$ | 132,320 | $ | 110,774 | $ | 21,546 | 19 | % | |||||||
| Year ended December 31, | |||||||||||||||
| 2009 | 2008 | % change | |||||||||||||
| Gross profit percentage |
|||||||||||||||
| Gross profit percentage — application |
76 | % | 77 | % | -1 | % | |||||||||
| Gross profit percentage — consulting |
1 | % | 15 | % | -14 | % | |||||||||
| Gross profit percentage — total |
67 | % | 66 | % | 1 | % | |||||||||
Gross profit — application
The decrease in gross profit percentage on application revenue during 2009 compared to 2008 was driven predominantly by increased hosting costs associated with increasing the scalability of the existing Taleo hosting environment and incremental hosting costs as a result of the Vurv acquisition. Additionally, Vurv’s gross profit percentage on application revenue was lower than Taleo’s on a standalone basis and as a result negatively impacted the consolidated gross profit percentage on application revenue for 2009. Gross profit was further reduced by amortization of intangibles associated with the acquisition of Vurv. We expect gross profit percentage on application revenue to decrease slightly as result of the additional hosting cost as we have plans in 2010 to consolidate our U.S. production data center operations for our Taleo Enterprise solution into a new single facility in Chicago, Illinois.
Gross profit — consulting
For services performed on new product implementations, revenue in 2009 was generally recognized ratably over the term of the associated application services agreement with a significant portion of revenue deferred to periods beyond the period in which services were performed. We generally recognize revenue for services performed on stand-alone consulting engagements as the services are performed. Expenses associated with delivering these services are recognized as incurred when the services are performed. The difference of the timing of revenue recognition compared to the timing of recognizing expenses as performed can cause fluctuations in gross profit for consulting services.
The lower gross profit percentage on consulting revenue in 2009 compared to 2008 resulted from a reduction in standalone consulting engagements, where revenue and the related expenses are typically recognized in the same period. There was also an increase in cost of consulting revenue resulting from increased employee related expenses compared to the same period in 2008. In 2009, gross profit on consulting was also negatively impacted by a reduction in revenue related to legacy Vurv consulting engagements, and the deferral of revenue
51
Table of Contents
related to certain bundled agreements being deferred to future periods while the related expenses are reflected in the current period. We expect the gross profit percentage on consulting revenue to increase when we recognize previously deferred revenue without incurring any incremental delivery cost and implement the new accounting guidance related to revenue recognition.
We expect the total gross profit percentage to be constant in 2010 as the decrease in gross profit on application revenue is expected to be offset by the increase in gross profit on consulting revenue.
Operating expenses
| Year ended December 31, | |||||||||||||
| 2009 | 2008 | $ change | % change | ||||||||||
| (In thousands) | |||||||||||||
| Sales and marketing |
$ | 65,731 | $ | 53,827 | $ | 11,904 | 22 | % | |||||
| Research and development |
34,847 | 30,994 | 3,853 | 12 | % | ||||||||
| General and administrative |
33,152 | 32,382 | 770 | 2 | % | ||||||||
| Restructuring and severance expense |
— | 1,914 | (1,914 | ) | * | ||||||||
| Total operating expenses |
$ | 133,730 | $ | 119,117 | $ | 14,613 | |||||||
| * | not meaningful |
Sales and marketing — summary of changes
| Change from 2008 to 2009 | |||
| Amortization |
$ | 7,151 | |
| Employee-related costs |
3,107 | ||
| Marketing expenses |
876 | ||
| Various other expense |
770 | ||
| $ | 11,904 | ||
The increase in sales and marketing expense was primarily driven by an increase in amortization expenses attributable to the amortization of intangible assets obtained from the acquisition of Vurv namely customer relationships. Employee-related expenses increased due to a net headcount increase of 16 persons as compared to the prior year and marketing expenditures related to tradeshows and demand generation efforts primarily related to the sale of our application products. Overall, sales and marketing expense increased as a result of the acquisition of Vurv and the overall expansion of our operations. We expect sales and marketing cost to increase in terms of dollars and to remain constant as a percentage of total revenue in 2010.
Research and development — summary of changes
| Change from 2008 to 2009 | |||
| Employee-related costs |
$ | 3,641 | |
| Various other expense |
212 | ||
| $ | 3,853 | ||
The increase in research and development expense was primarily driven by a net headcount increase of 20 persons as compared to the same period in the prior year. In 2009, we increased our product development team to focus on our new recruiting product, Taleo 10, and our new product functionality, Taleo Development and Taleo Anywhere. Also in 2009, research and development expenses were favorably affected by the positive impact of foreign currency movements against the U.S. dollar as the operational costs of our Quebec City facility are
52
Table of Contents
denominated in the local currency, Canadian dollars. We expect research and development cost to increase in terms of absolute dollars, but remain constant as a percentage of total revenue in 2010 as we continue to develop new product functionality and integrate acquired technology into our product suite.
General and administrative — summary of changes
| Change from 2008 to 2009 | ||||
| Employee-related costs |
$ | 1,104 | ||
| Consultants / temporary help |
626 | |||
| Legal |
(714 | ) | ||
| Audit |
(576 | ) | ||
| Bad debt reserve |
603 | |||
| Various other expense |
(273 | ) | ||
| $ | 770 | |||
The increase in general and administrative expenses resulted primarily from increases in employee-related costs from additional headcount added in 2009. The outside consulting and temporary help expense increased during 2009 primarily due to the evaluation of our historical revenue practices associated with the restatement reflected in our annual report on Form 10-K for the period ended December 31, 2008 filed on April 30, 2009 and the correction of stock-based compensation expense associated with the restatement reflected in Amendment No. 1 on Form 10-K/A for the period ended December 31, 2008 filed on October 27, 2009. Additionally, we decreased our legal reserves due to current developments in on-going litigation. Audit fees decreased during the year primarily due to a change in the methodology for recording fees associated with the annual audit and a general decrease in the overall annual audit cost. In prior years, we recognized annual audit fees ratably over the year but we now record the expense in the period in which the work is performed. Additionally, annual audit fee rates decreased for 2009. These decreases were partially offset by audit fees related to our two financial reporting restatements of our annual report on Form 10-K for the period ended December 31, 2008. During 2009, bad debt expense increased primarily from at-risk receivables associated with legacy Vurv customers. Various other expenses decreased primarily from cost management during the year. We expect general and administrative cost to increase in absolute dollars for the remainder of the year and decrease as a percentage of revenue over the course of 2010.
Contribution Margin — Operating Segments
| Year ended December 31, | |||||||||||||
| 2009 | 2008 | $ change | % change | ||||||||||
| (In thousands) | |||||||||||||
| Contribution Margin(1) |
|||||||||||||
| Contribution margin — application |
$ | 97,170 | $ | 75,258 | $ | 21,912 | 29 | % | |||||
| Contribution margin — consulting |
303 | 4,522 | (4,219 | ) | -93 | % | |||||||
| Contribution margin — total |
$ | 97,473 | $ | 79,780 | $ | 17,693 | 22 | % | |||||
| (1) | Contribution margins equals gross profit minus research and development expenses |
Application contribution margin increased 29% year over year. This was primarily due to the 25% increase in application revenue over the same period. Consulting contribution margin decreased by 93% year over year as a result of expenses incurred to deliver services in advance of the revenue recognition for a significant percentage of our consulting services and a decrease in higher margin standalone consulting engagements.
53
Table of Contents
Interest income and interest expense
| Year ended December 31, | |||||||||||||||
| 2009 | 2008 | $ change | % change | ||||||||||||
| (In thousands) | |||||||||||||||
| Interest income |
$ | 329 | $ | 1,717 | $ | (1,388 | ) | -81 | % | ||||||
| Interest expense |
(166 | ) | (199 | ) | 33 | -17 | % | ||||||||
| Other income |
1,387 | — | 1,387 | * | |||||||||||
| Total interest and other income, net |
$ | 1,550 | $ | 1,518 | $ | 32 | 2 | % | |||||||
| * | not meaningful. |
Interest Income. The decrease in interest income is primarily attributable to a decline in the average rate earned on our cash balance from 2.26% in 2008 to 0.42% in 2009.
Interest Expense. The decrease in interest expense is attributable to the decrease in capital lease obligations payments during 2009.
Other Income. Other income consists of a $2.5 million settlement of the Vurv escrow account offset by the $(1.1) million write-off of the WWC purchase option. We received 111,167 shares of our Class A common stock valued at $2.5 million from the Vurv escrow account as a result of a settlement with the former shareholders of Vurv. In the third quarter of 2009, we recorded an impairment of the WWC purchase option obtained in September 2008 as the terms of the September 19, 2009 merger agreement were more favorable than the terms of the purchase option.
Provision for (Benefit from) for Income Taxes
| Year ended December 31, | ||||||||||||||
| 2009 | 2008 | $ change | % change | |||||||||||
| (In thousands) | ||||||||||||||
| Provision for (Benefit from) income taxes |
$ | (1,153 | ) | $ | 1,303 | $ | (2,456 | ) | -188 | % | ||||
We recorded an income tax benefit of approximately $1.2 million in 2009 compared to an income tax provision of $1.3 million in 2008. The change year over year is primarily attributable to the foreign tax benefit generated from a favorable income tax audit settlement with the Canadian government covering tax years 2000 and 2001, offset by foreign income tax expense, and state income tax expense. At December 31, 2009, we maintained a valuation allowance against our U.S. deferred tax assets, excluding U.S. federal alternative minimum tax credits, as we determined it was more likely than not these assets will not be realized. If we are to conclude the U.S. deferred tax assets will more likely than not be realized in the future, we will reverse the valuation allowance, which would likely have a material impact on our financial results in the form of reduced tax expense or increased tax benefits in the period the reversal occurs. There can be no assurances we will reverse our valuation allowance in 2010.
Comparison of the Years Ended December 31, 2008 and 2007
Dollar amounts in tables are shown in thousands.
Revenue
| Year ended December 31, | ||||||||||||
| 2008 | 2007 | $ change | % change | |||||||||
| (In thousands) | ||||||||||||
| Application revenue |
$ | 138,628 | $ | 105,032 | $ | 33,596 | 32 | % | ||||
| Consulting revenue |
29,791 | 23,038 | 6,753 | 29 | % | |||||||
| Total revenue |
$ | 168,419 | $ | 128,070 | $ | 40,349 | 32 | % | ||||
54
Table of Contents
The increase in application revenue was due to increased renewals by existing customers, sales to new customers, sales of additional applications to existing customers, broader roll out of our applications by existing customers and the addition of customers through our acquisition of Vurv on July 1, 2008. In 2008, we had 86 new Taleo Enterprise Edition customers and 777 new Taleo Business Edition customers. Application revenue associated with our product lines for Taleo Enterprise Edition customers increased by $16.1 million as compared to 2007. In addition we recognized approximately $12.0 million in revenue related to product lines we acquired from Vurv on July 1, 2008. Application revenue associated with Taleo Business Edition customers increased by $5.5 million as compared to 2007. The prices of our applications were relatively consistent on a period-to-period comparative basis.
The increase in consulting revenue was attributable to higher demand for services from new and existing customers and a one time increase of $3.3 million in consulting revenue related to legacy Vurv engagements which were completed by December 31, 2008. Our consulting utilization rate increased to 66% in 2008 from 64% in the prior year. The utilization rate for our consultants is the percentage of time billable out of a 2,080 hour year. The prices of our consulting services were relatively consistent on a period-to-period comparative basis.
Our U.S. company is the contracting party for all sales agreements in the United States and our Canadian subsidiary is the contracting party for all Taleo Enterprise Edition sales agreements in Canada. Prior to January 1, 2005, certain of our subsidiaries outside of North America were the contracting parties for sales transactions within their regions. After January 1, 2005, our U.S. company has been the contracting party for all new sales agreements and renewals of existing sales agreements entered into with customers outside of North America. While Vurv generally contracted with customers outside of the U.S. via a local subsidiary, renewals of such existing agreements going forward will be with a U.S. entity. Accordingly, as our customers renew their agreements with us over time, the percentage of total revenue identified to our subsidiaries outside of North America should decline. Accordingly, the geographic mix of total revenue, based on the country of location of the Taleo contracting entity, in the year ended December 31, 2008 was about 95%, less than 5% and less than 1% in the United States, Canada and the rest of the world, respectively, as compared to about 94%, 5% and 1%, respectively, in the year ended December 31, 2007. We also track the geographic mix of our revenue on the basis of the location of the contracting entity for our customers. The geographic mix of application services revenue based on the region of location of the customer contracting in the year ended December 31, 2008 was 83% from the United States, 5% from Canada, 8% from Europe, and 4% from the rest of the world. For the year ended December 31, 2007 it was 85% from the United States, 6% from Canada, 6% from Europe, and 3% from the rest of the world. Due to the nature of consulting services revenue recognition, it is impracticable to determine revenue by location of the customer contracting, however the trends for contracted consulting services would be expected to be similar to the geographic mix of application services.
Cost of Revenue
| Year ended December 31, | ||||||||||||
| 2008 | 2007 | $ change | % change | |||||||||
| (In thousands) | ||||||||||||
| Cost of revenue — application |
$ | 32,376 | $ | 22,642 | $ | 9,734 | 43 | % | ||||
| Cost of revenue — consulting |
25,269 | 18,098 | 7,171 | 40 | % | |||||||
| Cost of revenue — total |
$ | 57,645 | $ | 40,740 | $ | 16,905 | 41 | % | ||||
55
Table of Contents
Cost of revenue — application — summary of changes
| Change from 2007 to 2008 | |||
| Employee-related costs |
$ | 2,784 | |
| Hosting facility cost |
4,578 | ||
| Depreciation and amortization |
1,586 | ||
| Various other expense |
786 | ||
| $ | 9,734 | ||
The increase in cost of application revenue was primarily driven by a net headcount increase of 58 persons as compared to the prior year (including the addition of 48 employees from Vurv), additional costs related to hosting legacy Vurv applications (including third party software costs, internet bandwidth costs, and other costs associated with legacy Vurv hosting facilities) and a significant increase in amortization expense of $1.4 million due to the amortization of intangible assets acquired in connection with Vurv. Additionally, third party software costs related to the legacy Taleo applications increased due to infrastructure enhancements and an increase in capacity. Further, general operating expenses also increased as a result of our expanded operations.
Cost of revenue — consulting — summary of changes
| Change from 2007 to 2008 | |||
| Employee-related costs |
$ | 4,971 | |
| Professional services |
1,256 | ||
| Travel and entertainment |
554 | ||
| Various other expense |
390 | ||
| $ | 7,171 | ||
The increase in cost of consulting revenue resulted from an increase in headcount by 42 persons as compared to the prior year (including the addition of 35 former Vurv employees which was reduced to 32 persons at December 31, 2008). Additionally, professional services expenses increased as a result of our subcontracting more of our of consulting services to third parties than we did in the prior year. The increase in various other expenses resulted from general expense increases of our expanded operations.
Gross Profit and Gross Profit Percentage
| Year ended December 31, | |||||||||||||||
| 2008 | 2007 | $ change | % change | ||||||||||||
| (In thousands) | |||||||||||||||
| Gross profit |
|||||||||||||||
| Gross profit — application |
$ | 106,252 | $ | 82,390 | $ | 23,862 | 29 | % | |||||||
| Gross profit — consulting |
4,522 | 4,940 | (418 | ) | -8 | % | |||||||||
| Gross profit — total |
$ | 110,774 | $ | 87,330 | $ | 23,444 | 27 | % | |||||||
| Year ended December 31, | |||||||||||||||
| 2008 | 2007 | % change | |||||||||||||
| Gross profit percentage |
|||||||||||||||
| Gross profit percentage — application |
77 | % | 78 | % | -1 | % | |||||||||
| Gross profit percentage — consulting |
15 | % | 21 | % | -6 | % | |||||||||
| Gross profit percentage — total |
66 | % | 68 | % | -2 | % | |||||||||
56
Table of Contents
The decrease in gross profit percentage on application revenue was driven predominantly by higher application expenses incurred as a result of the Vurv acquisition on July 1, 2008, including amortization of intangible expense of $1.4 million. Vurv’s gross profit percentage on application revenue was lower than Taleo on a stand-alone basis and as a result, it negatively impacted the consolidated gross profit percentage on application revenue during the second half of 2008.
Gross profit percentage on consulting decreased in 2008 due to the combination of the growth in our consulting business and the timing of recognition of expenses as incurred while a significant percentage of consulting services revenue is recognized over the term of the application services agreement which is typically three years. This resulted in deferred consulting revenue at December 31, 2008 of $25.8 million compared to $20.9 million at December 31, 2007. Additionally, the acquisition of Vurv had minimal impact on the gross profit percentage as the gross profit percentage on engagements assumed was consistent with the net increase in consulting expenses relating to Taleo engagements.
Operating expenses
| Year ended December 31, | ||||||||||||
| 2008 | 2007 | $ change | % change | |||||||||
| (In thousands) | ||||||||||||
| Sales and marketing |
$ | 53,827 | $ | 37,172 | $ | 16,655 | 45 | % | ||||
| Research and development |
30,994 | 23,197 | 7,797 | 34 | % | |||||||
| General and administrative |
32,382 | 24,281 | 8,101 | 33 | % | |||||||
| Restructuring and severance expense |
1,914 | — | 1,914 | * | ||||||||
| Total operating expenses |
$ | 119,117 | $ | 84,650 | $ | 34,467 | ||||||
| * | not meaningful |
Sales and marketing — summary of changes
| Change from 2007 to 2008 | |||
| Depreciation and Amortization |
$ | 4,219 | |
| Employee-related costs |
8,043 | ||
| Travel and entertainment |
1,089 | ||
| Marketing expenses |
2,235 | ||
| Various other expense |
1,069 | ||
| $ | 16,655 | ||
The increase in sales and marketing expense was primarily driven by a net headcount increase of 39 persons as compared to the prior year (including the addition of 29 employees from Vurv); higher commission payments associated with our increase in new customer arrangements; amortization expenses of $4.1 million attributable to the amortization of intangible assets obtained as a result of the acquisition of Vurv on July 1, 2008; travel expenses associated with an increase in headcount, and marketing expenditures related to tradeshows, demand generation efforts for our Taleo Business Edition products.
57
Table of Contents
Research and development — summary of changes
| Change from 2007 to 2008 | |||
| Employee-related costs |
$ | 4,864 | |
| Software support |
1,700 | ||
| Travel and entertainment |
360 | ||
| Depreciation and amortization |
392 | ||
| Various other expense |
481 | ||
| $ | 7,797 | ||
The increase in research and development expense was primarily driven by a net headcount increase of 67 persons as compared to the prior year (including the addition of 34 employees from Vurv). We outsourced development and quality assurance activity performed outside North America on projects such as our next Recruiting release, Taleo Performance, and the current version of Taleo Recruiting. Travel and entertainment expenses also increased as a result of the increase in headcount and travel requirements outside North America.
General and administrative — summary of changes
| Change from 2007 to 2008 | |||
| Employee-related costs |
$ | 4,493 | |
| Legal |
2,295 | ||
| Audit |
273 | ||
| Bad debt reserve |
312 | ||
| Foreign currency (gain) / loss |
434 | ||
| Travel and entertainment |
271 | ||
| Various other expense |
23 | ||
| $ | 8,101 | ||
The increase in general and administrative expense in 2008 was primarily driven by a net headcount increase of 23 persons (including the addition of 17 employees from Vurv). Employee-related cost relating to stock-based compensation increased due to 2008 equity compensation grants to senior management. Our legal expenses increased significantly in 2008 due to a litigation accrual for a pending matter. Additionally, our on-going litigation costs increased and we incurred legal fees in relation to our investment in Worldwide Compensation, Inc. General and administrative expenses also increased due to telecommunication, facility and travel expenses associated with the acquisition and integration of Vurv.
Restructuring charges. In the second quarter of 2008, we initiated a restructuring plan to reorganize the company. The reorganization plan resulted in the termination of 34 employees during the year ended December 31, 2008 at a total cost of approximately $1.8 million. Additionally, we incurred $0.1 million in facility closure cost associated with this plan.
Contribution Margin — Operating Segments
| Year ended December 31, | |||||||||||||
| 2008 | 2007 | $ change | % change | ||||||||||
| (In thousands) | |||||||||||||
| Contribution Margin(1) |
|||||||||||||
| Contribution margin — application |
$ | 75,258 | $ | 59,193 | $ | 16,065 | 27 | % | |||||
| Contribution margin — consulting |
4,522 | 4,940 | (418 | ) | -8 | % | |||||||
| Contribution margin — total |
$ | 79,780 | $ | 64,133 | $ | 15,647 | 24 | % | |||||
| (1) | Contribution margins equal gross profit minus research and development expenses |
58
Table of Contents
Application contribution margin increased 27% year over year. This was due to a 32% increase in application revenue over the same period. Consulting contribution margin decreased by 8% year over year as a result of expenses incurred to deliver services in advance of the revenue recognition for a significant percentage of our consulting services.
Interest income and interest expense
| Year ended December 31, | |||||||||||||||
| 2008 | 2007 | $ change | % change | ||||||||||||
| (In thousands) | |||||||||||||||
| Interest income |
$ | 1,717 | $ | 3,045 | $ | (1,328 | ) | -44 | % | ||||||
| Interest expense |
(199 | ) | (137 | ) | (62 | ) | 45 | % | |||||||
| Total other income, net |
$ | 1,518 | $ | 2,908 | $ | (1,390 | ) | -48 | % | ||||||
Interest Income. The decrease in interest income is primarily attributable to a lower cash balance due to a $49.7 million cash outlay for the acquisition of Vurv in July of 2008. Additionally, we experienced a decline in the average rate earned on our cash balance from 3.73% at the beginning of the year to 0.7% by the end of the year.
Interest Expense. The increase in interest expense is attributable to imputed interest related to two financing agreements for software purchases entered into in 2007 and an increase in capital lease obligations as a result of the Vurv acquisition.
Provision for Income Taxes
| Year ended December 31, | |||||||||||||
| 2008 | 2007 | $ change | % change | ||||||||||
| (In thousands) | |||||||||||||
| Provision for income taxes |
$ | 1,303 | $ | 3,083 | $ | (1,780 | ) | -58 | % | ||||
We recorded an income tax provision of $1.3 million in 2008 compared to an income tax provision of $3.1 million in 2007. The provision was generated principally from our international operations, state income taxes and from the reversal of valuation allowances as we utilized operating loss carryforwards. At December 31, 2008, we maintained a valuation allowance against our U.S. deferred tax assets, excluding U.S. federal alternative minimum tax credits, as we determined it was more likely than not these assets will not be realized.
Liquidity and Capital Resources
We have funded our operations primarily through cash flow from operations and the 2005 initial public offering of our common stock. As of December 31, 2009, we had cash and cash equivalents totaling $244.2 million, net accounts receivable of $43.9 million, and investment credits receivable of $5.5 million. In addition, we have $0.6 million in restricted cash for security deposits on our property leases.
| Year ended December 31, | |||||||||||||||
| 2009 | 2008 | $ change | % change | ||||||||||||
| (In thousands) | |||||||||||||||
| Cash provided by operating activities |
$ | 50,672 | $ | 17,754 | $ | 32,918 | 185 | % | |||||||
| Cash used in investing activities |
(8,722 | ) | (62,843 | ) | 54,121 | -86 | % | ||||||||
| Cash provided by financing activities |
151,728 | 8,499 | 143,229 | 1685 | % | ||||||||||
| Year ended December 31, | |||||||||||||||
| 2008 | 2007 | $ change | % change | ||||||||||||
| (In thousands) | |||||||||||||||
| Cash provided by operating activities |
$ | 17,754 | $ | 30,190 | $ | (12,436 | ) | -41 | % | ||||||
| Cash used in investing activities |
(62,843 | ) | (13,789 | ) | (49,054 | ) | 356 | % | |||||||
| Cash provided by financing activities |
8,499 | 10,063 | (1,564 | ) | -16 | % | |||||||||
59
Table of Contents
Net Cash Provided by Operating Activities
Net cash provided by operating activities of $50.7 million in the year ended December 31, 2009 compares to net cash provided by operating activities of $17.8 million in the year ended December 31, 2008. Consistent with prior years, cash provided by operating activities has historically been affected by revenues, changes in working capital accounts, particularly changes in deferred revenue, customer deposits and add-backs of non-cash expense items such as depreciation, amortization, and the expense associated with stock-based awards.
Another item which impacts our net cash provided by operating activities is accounts receivable, net of allowances. This item is impacted both by the timing of billings and collections. In 2009 this balance decreased by $5.3 million compared to 2008, however this balance increased by $11.4 million in 2008 compared to 2007. Our accounts receivable balance fluctuates from period to period, depending on the timing of sales and billing activity, cash collections, and changes to our allowance for doubtful accounts. We also use days sales outstanding, or DSO, calculated on a quarterly basis, as a measurement of the quality and status of our receivables. We define DSO as (1) accounts receivable, net of allowance for doubtful accounts, divided by total revenue for the most recent quarter, multiplied by (2) the number of days in that quarter. DSO was 81 days at December 31, 2009 compared to 94 days at December 31, 2008. The decrease in DSO results from the timing of customer invoicing and an increase in cash collection in 2009 compared to 2008. DSO was 79 days at December 31, 2007 compared to 94 days at December 31, 2008. The increase in DSO in 2008 resulted primarily from the timing of customer invoicing.
In addition, our stock-based compensation expense was $11.0 million for the year ended December 31, 2009 compared to $11.4 million stock-based compensation expense for the year ended December 31, 2008 and $8.0 million for the year ended December 31, 2007. We expect an increase in stock-based compensation expense in 2010 as a result of ongoing new hire and annual equity grants.
In 2009, depreciation and amortization expense increased by $11.0 million from 2008 as we recognized a full year of intangible asset amortization expense related to the Vurv acquisition in 2009 compared to six months of amortization expense recognized in 2008. Depreciation and amortization expense was $16.5 million for the year ended December 31, 2008 compared to $6.9 million for the year ended December 31, 2007. The increase in expense was due to additions to fixed assets as well as an increase in intangibles due to the acquisition of Vurv in July 2008 which increased amortization expense by $5.4 million for the six month period of July 1, 2008 through December 31, 2008.
Net Cash Used in Investing Activities
Net cash used in investing activities decreased to $8.7 million in 2009 compared to $62.8 million in 2008 as a result of our significant acquisition and investment activity in 2008. In 2008, $49.7 million in cash was used in connection with the Vurv acquisition and $2.5 million in cash was used to make an equity investment in Worldwide Compensation, Inc. In 2007, net cash used for investing was $13.8 million which was primarily used for capital expenditures related to our data centers, acquisitions of certain assets of JobFlash and Wetfeet and the purchase of other hardware and software.
Net Cash Provided by Financing Activities
In 2009, net cash provided by financing activities was $151.7 million compared to $8.5 million in 2008. The significant increase resulted primarily from the November 19, 2009 sale of 7,475,000 Class A common shares for $20.25 resulting in proceeds, net of underwriter commissions and $0.2 million in paid other transaction costs, of $144.4 million. We also incurred an additional $0.6 million in other transition costs, yet to be paid at December 31, 2009, resulting in net proceeds from the offering of $143.8 million.
In 2008, net cash provided by financing activities was $8.5 million. This $1.6 million decrease from 2007 resulted from a reduction in proceeds from stock option exercises and employees stock purchase plan contributions. Such equity activity diminished in 2008 due to 50% fewer options exercised in 2008 offset by $0.7 million of payments related to capital lease obligations.
60
Table of Contents
In 2007, net cash provided by financing activities was $10.1 million and this is primarily the result of $11.1 million in net proceeds received from the exercise of stock options, warrants and contributions to the employee stock purchase plan, offset by $0.4 million of payments related to capital lease obligations.
We had capital lease obligations of $0.5 million and $1.6 million outstanding as of December 31, 2009 and 2008 respectively. These leases to unrelated third parties are subject to interest rates ranging from 0.4 to 6% and mature at varying dates through 2013.
We believe our existing cash and cash equivalents, and anticipated cash provided by operating activities will be sufficient to meet our working capital and capital expenditure needs for at least the next year. Our future capital requirements will depend on many factors, including our rate of revenue growth, the expansion of our sales and marketing activities, the timing and extent of spending to support product development efforts and expansion into new territories, the timing of introductions of new applications and enhancements to existing applications, the continuing market acceptance of our applications and the extent to which we acquire or invest in complimentary business products or technologies. To the extent that existing cash and cash equivalents, and cash from operations, are insufficient to fund our future activities, we may need to raise additional funds through public or private equity or debt financing. We will likely enter into agreements or letters of intent with respect to potential investments in, or acquisitions of, complementary businesses, applications or technologies in the future, which could also require us to seek additional equity or debt financing. For example, we entered into the Merger Agreement to acquire WWC in September 2009, a privately held company that provides compensation management solutions. The acquisition closed January 1, 2010 for approximately $14.1 million. Additional funds may not be available on terms favorable to us or at all.
Off Balance Sheet Arrangements
We do not participate in transactions that involve unconsolidated entities or financial partnerships, such as entities often referred to as structured finance or special purpose entities, which have been established for the purpose of facilitating off-balance sheet arrangements or other contractually narrow or limited purposes. Excluding operating leases for office space, computer equipment, software, and third party facilities that host our applications, which are described below, we do not engage in off-balance sheet financing arrangements.
Contractual Obligations
We generally do not enter into long-term minimum purchase commitments. Our principal commitments, which are not included in our debt agreements discussed above, consist of obligations under leases for office space, operating leases for computer equipment and to a lesser extent, leases for third-party facilities that host our applications. The following table summarizes our commitments to settle contractual obligations in cash under operating leases and other purchase obligations, as of December 31, 2009:
Contractual obligations (in thousands)
| Total | Less Than 1 Year |
2—3 Years | 4—5 Years | |||||||||
| (In thousands) | ||||||||||||
| Capital lease obligations |
$ | 519 | $ | 412 | $ | 101 | $ | 6 | ||||
| Interest payments |
23 | 17 | 6 | — | ||||||||
| Facility leases |
6,572 | 2,318 | 3,427 | 827 | ||||||||
| Operating equipment leases |
149 | 90 | 59 | — | ||||||||
| Third party hosting facilities |
1,810 | 1,282 | 517 | 11 | ||||||||
| Software contracts |
5,405 | 3,923 | 1,478 | 4 | ||||||||
| Total contractual cash obligations |
$ | 14,478 | $ | 8,042 | $ | 5,588 | $ | 848 | ||||
61
Table of Contents
We have excluded $5.1 million in liabilities for uncertain tax benefits from the contractual obligations table because we can not make a reasonable reliable estimate of the periodic cash settlements with the respective taxing authorities. See Note 8 to the Consolidated Financial Statements in Item 8 of this Form 10-K for a discussion of income taxes.
Legal expenditures could also affect our liquidity. We are regularly subject to legal proceedings and claims that arise in the ordinary course of business, see Note 9 “Commitments and Contingencies” in Notes to the Consolidated Financial Statements. Litigation may result in substantial costs and may divert management’s attention and resources, which may seriously harm our business, financial condition, operating results and cash flows.
| ITEM 7A. | QUANTITATIVE AND QUALITATIVE DISCLOSURES ABOUT MARKET RISK |
Foreign Currency Exchange Risk
Our revenue is generally denominated in the local currency of the contracting party. The majority of our revenue is denominated in U.S. dollars. In the year ended December 31, 2009, 4% and 11% of our revenue, was denominated in Canadian dollars and currencies other than the U.S. or Canadian dollar, respectively. Our expenses are generally denominated in the currencies in which our operations are located. Our expenses are incurred primarily in the United States and Canada, including the expenses associated with our largest research and development operations that are maintained in Canada, with a small portion of expenses incurred outside of North America where our other international sales offices are located. Our results of operations and cash flows are therefore subject to fluctuations due to changes in foreign currency exchange rates, particularly changes in the Canadian dollar, and to a lesser extent, to the Australian dollar, British pound sterling, the euro, Singapore dollar and New Zealand dollar, in which certain of our customer contracts are denominated. For the year ended December 31, 2009, the U.S. dollar strengthened by approximately 9% against the Canadian dollar on an average basis compared to the same period in the prior year. This change in value did not have a significant effect on our earnings and should not have a significant effect on future earnings as a result of our transfer pricing policy. Our planning process for 2010 includes estimated foreign exchange risk profile. If the currencies noted above uniformly fluctuated by plus or minus 500 basis points from our estimated rates, we would expect our results to change by approximately minus or plus $2.2 million. We do not currently enter into forward exchange contracts to hedge exposure denominated in foreign currencies or any derivative financial instruments for trading or speculative purposes. In the future, we may consider entering into hedging transactions to help mitigate our foreign currency exchange risk.
Interest Rate Sensitivity
We had cash and cash equivalents of $244.2 million at December 31, 2009. This compares to $49.5 million at December 31, 2008. These amounts were held primarily in cash or money market accounts. Cash and cash equivalents are held for working capital purposes, and restricted cash amounts are held as security against various lease obligations. We do not enter into investments for trading or speculative purposes. Due to the short-term nature of these investments, we believe that we do not have any material exposure to changes in the fair value of our investment portfolio as a result of changes in interest rates. Declines in interest rates, however, will reduce future interest income.
62
Table of Contents
| ITEM 8. | FINANCIAL STATEMENTS AND SUPPLEMENTARY DATA |
REPORT OF INDEPENDENT REGISTERED PUBLIC ACCOUNTING FIRM
To the Board of Directors and Stockholders
of Taleo Corporation:
In our opinion, the accompanying consolidated balance sheet and the related consolidated statement of operations, stockholders’ equity and comprehensive income and cash flows present fairly, in all material respects, the financial position of Taleo Corporation and its subsidiaries (the “Company”) at December 31, 2009, and the results of their operations and their cash flows for year ended December 31, 2009 in conformity with accounting principles generally accepted in the United States of America. Also in our opinion, the Company maintained, in all material respects, effective internal control over financial reporting as of December 31, 2009, based on criteria established in Internal Control — Integrated Framework issued by the Committee of Sponsoring Organizations of the Treadway Commission (COSO). The Company’s management is responsible for these financial statements, for maintaining effective internal control over financial reporting and for its assessment of the effectiveness of internal control over financial reporting, included in Management’s Report on Internal Control over Financial Reporting under Item 9A. Our responsibility is to express opinions on these financial statements and on the Company’s internal control over financial reporting based on our integrated audit. We conducted our audit in accordance with the standards of the Public Company Accounting Oversight Board (United States). Those standards require that we plan and perform the audits to obtain reasonable assurance about whether the financial statements are free of material misstatement and whether effective internal control over financial reporting was maintained in all material respects. Our audit of the financial statements included examining, on a test basis, evidence supporting the amounts and disclosures in the financial statements, assessing the accounting principles used and significant estimates made by management, and evaluating the overall financial statement presentation. Our audit of internal control over financial reporting included obtaining an understanding of internal control over financial reporting, assessing the risk that a material weakness exists, and testing and evaluating the design and operating effectiveness of internal control based on the assessed risk. Our audit also included performing such other procedures as we considered necessary in the circumstances. We believe that our audit provides a reasonable basis for our opinion.
A company’s internal control over financial reporting is a process designed to provide reasonable assurance regarding the reliability of financial reporting and the preparation of financial statements for external purposes in accordance with generally accepted accounting principles. A company’s internal control over financial reporting includes those policies and procedures that (i) pertain to the maintenance of records that, in reasonable detail, accurately and fairly reflect the transactions and dispositions of the assets of the company; (ii) provide reasonable assurance that transactions are recorded as necessary to permit preparation of financial statements in accordance with generally accepted accounting principles, and that receipts and expenditures of the company are being made only in accordance with authorizations of management and directors of the company; and (iii) provide reasonable assurance regarding prevention or timely detection of unauthorized acquisition, use, or disposition of the company’s assets that could have a material effect on the financial statements.
Because of its inherent limitations, internal control over financial reporting may not prevent or detect misstatements. Also, projections of any evaluation of effectiveness to future periods are subject to the risk that controls may become inadequate because of changes in conditions, or that the degree of compliance with the policies or procedures may deteriorate.
/s/ PricewaterhouseCoopers LLP
San Jose, California
March 9, 2010
63
Table of Contents
REPORT OF INDEPENDENT REGISTERED PUBLIC ACCOUNTING FIRM
To the Board of Directors and Stockholders of
Taleo Corporation
We have audited the accompanying consolidated balance sheets of Taleo Corporation and its subsidiaries (the “Company”) as of December 31, 2008, and the related consolidated statements of operations, stockholders’ equity and comprehensive income (loss), and cash flows for the years ended December 31, 2008 and 2007. These consolidated financial statements are the responsibility of the Company’s management. Our responsibility is to express an opinion on these consolidated financial statements based on our audits.
We conducted our audits in accordance with the standards of the Public Company Accounting Oversight Board (United States). Those standards require that we plan and perform the audit to obtain reasonable assurance about whether the financial statements are free of material misstatement. An audit includes examining, on a test basis, evidence supporting the amounts and disclosures in the financial statements. An audit also includes assessing the accounting principles used and significant estimates made by management, as well as evaluating the overall financial statement presentation. We believe that our audits provide a reasonable basis for our opinion.
In our opinion, such consolidated financial statements present fairly, in all material respects, the financial position of the Company as of December 31, 2008, and the results of its operations and its cash flows for the years ended December 31, 2008 and 2007, in conformity with accounting principles generally accepted in the United States of America.
As described in Note 17, the accompanying consolidated financial statements for the years ended December 31, 2008 and 2007 have been restated.
/s/ Deloitte & Touche LLP
San Jose, California
April 30, 2009 (October 27, 2009 as to the effects of the Restatement — Stock-based Compensation discussed in Note 17)
64
Table of Contents
MANAGEMENT’S REPORT ON INTERNAL CONTROL OVER FINANCIAL REPORTING
Management of the Company is responsible for establishing and maintaining adequate internal control over financial reporting as defined in Rules 13a-15 (f) and 15(d)-15(f) under the Securities Exchange Act of 1934. The Company’s internal control over financial reporting is a process designed by, or under the supervision of, our Chief Executive Officer and Chief Financial Officer, and effected by our board of directors, management and other personnel, to provide reasonable assurance regarding the reliability of financial reporting and the preparation of financial statements for external purposes in accordance with generally accepted accounting principles. Internal control over financial reporting includes those policies and procedures that:
| • | pertain to the maintenance of records that, in reasonable detail, accurately and fairly reflect the transactions and dispositions of the assets of the Company; |
| • | provide reasonable assurance that transactions are recorded as necessary to permit preparation of financial statements in accordance with generally accepted accounting principles, and that receipts and expenditures of the Company are being made only in accordance with authorizations of management and directors of the Company; and |
| • | provide reasonable assurance regarding prevention or timely detection of unauthorized acquisition, use or disposition of the Company’s assets that could have a material effect on the financial statements. |
Because of its inherent limitations, internal control over financial reporting may not prevent or detect all misstatements. Also, projections of any evaluation of effectiveness to future periods are subject to the risk that controls may become inadequate because of changes in conditions or that the degree of compliance with the policies or procedures may change over time.
Our management, under the supervision of our Chief Executive Officer and Chief Financial Officer, conducted an evaluation of the effectiveness of our internal control over financial reporting based on the framework in Internal Control — Integrated Framework, issued by the Committee of Sponsoring Organizations of the Treadway Commission. Based on this evaluation, management concluded that our internal control over financial reporting was effective as of December 31, 2009.
The Company reviewed the results of management’s assessment with the Audit Committee of the Board of Directors.
The effectiveness of the Company’s internal control over financial reporting as of December 31, 2009 has been audited by PricewaterhouseCoopers LLP, an independent registered public accounting firm, as stated in their report which appears herein.
| /s/ Michael Gregoire | /s/ Katy Murray | |||
| Michael Gregoire Chairman and Chief Executive Officer |
Katy Murray Executive Vice President and Chief Financial Officer | |||
|
March 11, 2010 |
March 11, 2010 |
65
Table of Contents
TALEO CORPORATION AND SUBSIDIARIES
CONSOLIDATED BALANCE SHEETS
(In thousands, except shares and share data)
| December 31, | ||||||||
| 2009 | 2008 | |||||||
| ASSETS | ||||||||
| Current assets: |
||||||||
| Cash and cash equivalents |
$ | 244,229 | $ | 49,462 | ||||
| Restricted cash |
409 | 521 | ||||||
| Accounts receivables, net of allowances of $759 and $884 at December 31, 2009 and 2008, respectively |
43,928 | 49,167 | ||||||
| Prepaid expenses and other current assets |
10,126 | 10,977 | ||||||
| Investment credits receivable |
5,499 | 6,087 | ||||||
| Total current assets |
304,191 | 116,214 | ||||||
| Property and equipment, net |
23,510 | 25,250 | ||||||
| Restricted cash |
210 | 515 | ||||||
| Goodwill |
91,027 | 91,626 | ||||||
| Intangibles assets, net |
30,544 | 44,802 | ||||||
| Other assets |
6,895 | 4,782 | ||||||
| Total assets |
$ | 456,377 | $ | 283,189 | ||||
| LIABILITIES AND STOCKHOLDERS’ EQUITY | ||||||||
| Current liabilities: |
||||||||
| Accounts payable and accrued liabilities |
$ | 23,592 | $ | 24,877 | ||||
| Deferred revenue — application services and customer deposits |
60,140 | 54,421 | ||||||
| Deferred revenue — consulting services |
17,523 | 16,221 | ||||||
| Capital lease obligations |
412 | 1,101 | ||||||
| Total current liabilities |
101,667 | 96,620 | ||||||
| Long-term deferred revenue — application and customer deposits |
201 | 777 | ||||||
| Long-term deferred revenue — consulting services |
13,220 | 9,594 | ||||||
| Other liabilities |
3,973 | 3,258 | ||||||
| Capital lease obligations, long-term |
107 | 519 | ||||||
| Commitments and contingencies (Note 9) |
||||||||
| Total liabilities |
119,168 | 110,768 | ||||||
| Stockholders’ equity: |
||||||||
| Class A Common Stock; par value, $0.00001 per share; 150,000,000 shares authorized; 39,507,837 and 31,120,614 shares outstanding at December 31, 2009 and 2008, respectively |
1 | — | ||||||
| Additional paid-in capital |
414,106 | 250,168 | ||||||
| Accumulated deficit |
(77,029 | ) | (78,322 | ) | ||||
| Treasury stock, at cost, 111,167 shares outstanding at December 31, 2009 and no shares outstanding at December 31, 2008 |
(2,471 | ) | — | |||||
| Accumulated other comprehensive income |
2,602 | 575 | ||||||
| Total stockholders’ equity |
337,209 | 172,421 | ||||||
| Total liabilities and stockholders’ equity |
$ | 456,377 | $ | 283,189 | ||||
See Accompanying Notes to Consolidated Financial Statements
66
Table of Contents
TALEO CORPORATION AND SUBSIDIARIES
CONSOLIDATED STATEMENTS OF OPERATIONS
(in thousands, except shares and per share data)
| Year Ended December 31, | ||||||||||||
| 2009 | 2008 | 2007 | ||||||||||
| Revenue: |
||||||||||||
| Application |
$ | 173,495 | $ | 138,628 | $ | 105,032 | ||||||
| Consulting |
24,917 | 29,791 | 23,038 | |||||||||
| Total revenue |
198,412 | 168,419 | 128,070 | |||||||||
| Cost of revenue: |
||||||||||||
| Application |
41,478 | 32,376 | 22,642 | |||||||||
| Consulting |
24,614 | 25,269 | 18,098 | |||||||||
| Total cost of revenue |
66,092 | 57,645 | 40,740 | |||||||||
| Gross profit |
132,320 | 110,774 | 87,330 | |||||||||
| Operating expenses: |
||||||||||||
| Sales and marketing |
65,731 | 53,827 | 37,172 | |||||||||
| Research and development |
34,847 | 30,994 | 23,197 | |||||||||
| General and administrative |
33,152 | 32,382 | 24,281 | |||||||||
| Restructuring and severance expense |
— | 1,914 | — | |||||||||
| Total operating expenses |
133,730 | 119,117 | 84,650 | |||||||||
| Operating income / (loss) |
(1,410 | ) | (8,343 | ) | 2,680 | |||||||
| Other income / (expense): |
||||||||||||
| Interest income |
329 | 1,717 | 3,045 | |||||||||
| Interest expense |
(166 | ) | (199 | ) | (137 | ) | ||||||
| Other income — Note 11 |
1,387 | — | — | |||||||||
| Total interest and other income, net |
1,550 | 1,518 | 2,908 | |||||||||
| Income / (loss) before provision for / (benefit from) income taxes |
140 | (6,825 | ) | 5,588 | ||||||||
| Provision for / (benefit from) income taxes |
(1,153 | ) | 1,303 | 3,083 | ||||||||
| Net income / (loss) |
$ | 1,293 | $ | (8,128 | ) | $ | 2,505 | |||||
| Net income / (loss) per share attributable to Class A common stockholders — basic |
$ | 0.04 | $ | (0.29 | ) | $ | 0.10 | |||||
| Net income / (loss) per share attributable to Class A common stockholders — diluted |
$ | 0.04 | $ | (0.29 | ) | $ | 0.09 | |||||
| Weighted-average Class A common shares — basic |
31,507 | 27,569 | 24,116 | |||||||||
| Weighted-average Class A common shares — diluted |
32,406 | 27,569 | 28,777 | |||||||||
See Accompanying Notes to Consolidated Financial Statements.
67
Table of Contents
TALEO CORPORATION AND SUBSIDIARIES
CONSOLIDATED STATEMENTS OF STOCKHOLDERS’ EQUITY
AND COMPREHENSIVE INCOME (LOSS)
Years Ended December 31, 2009, 2008, and 2007
(In thousands, except share data)
| Common Stock | Additional Paid-In-Capital |
Accumulated Deficit |
Treasury Stock |
Accumulated Comprehensive Other Income |
Total Stockholders’ Equity |
Comprehensive Income (Loss) |
||||||||||||||||||||||||
| Shares | Par Value |
|||||||||||||||||||||||||||||
| Balances, January 1, 2007 |
22,253,127 | — | $ | 134,826 | $ | (73,758 | ) | $ | (158 | ) | $ | 245 | $ | 61,155 | ||||||||||||||||
| Cumulative transition adjustment related to the adoption of accounting standard for recognition of uncertain tax positions |
— | — | — | 1,059 | — | — | 1,059 | |||||||||||||||||||||||
| Employee stock options exercised |
1,438,610 | — | 9,439 | — | — | — | 9,439 | |||||||||||||||||||||||
| Issuance of ESPP shares |
143,992 | — | 1,018 | — | 608 | — | 1,626 | |||||||||||||||||||||||
| Cashless exercise of warrants |
356,200 | — | — | — | — | — | — | |||||||||||||||||||||||
| Class B Common stock exchanged for Class A Common Stock |
1,218,159 | — | 548 | — | — | — | 548 | |||||||||||||||||||||||
| Shares acquired for payroll tax payments |
(34,678 | ) | — | — | — | (645 | ) | — | (645 | ) | ||||||||||||||||||||
| Restricted shares reacquired or forfeited |
(16,193 | ) | — | — | — | — | — | — | ||||||||||||||||||||||
| Issuance of restricted shares |
83,156 | — | 248 | — | — | — | 248 | |||||||||||||||||||||||
| Stock-based compensation |
— | — | 7,972 | — | — | — | 7,972 | |||||||||||||||||||||||
| Net income |
— | — | — | 2,505 | — | — | 2,505 | $ | 2,505 | |||||||||||||||||||||
| Foreign currency translation adjustments |
— | — | — | — | — | 1,761 | 1,761 | 1,761 | ||||||||||||||||||||||
| Balances, December 31, 2007 |
25,442,373 | — | $ | 154,051 | $ | (70,194 | ) | $ | (195 | ) | $ | 2,006 | $ | 85,668 | $ | 4,266 | ||||||||||||||
| Employee stock options exercised |
698,231 | — | 7,742 | — | — | — | 7,742 | |||||||||||||||||||||||
| Class A Common stock issued for acquisition of Vurv |
3,823,192 | — | 73,444 | — | — | — | 73,444 | |||||||||||||||||||||||
| Class A Common stock exchange for Vurv stock options |
— | — | 1,745 | — | — | — | 1,745 | |||||||||||||||||||||||
| Issuance of ESPP shares |
175,669 | — | 1,173 | — | 1,263 | — | 2,436 | |||||||||||||||||||||||
| Class B Common stock exchanged for Class A Common Stock |
655,652 | — | 282 | — | — | — | 282 | |||||||||||||||||||||||
| Shares acquired for payroll tax payments |
(49,326 | ) | — | — | — | (1,068 | ) | — | (1,068 | ) | ||||||||||||||||||||
| Restricted shares reacquired or forfeited |
(81,743 | ) | — | — | — | — | — | — | ||||||||||||||||||||||
| Issuance of restricted shares |
456,566 | — | 242 | — | — | — | 242 | |||||||||||||||||||||||
| Stock-based compensation |
— | — | 11,433 | — | — | — | 11,433 | |||||||||||||||||||||||
| Excess tax benefit associated with stock based compensation |
— | — | 56 | — | — | — | 56 | |||||||||||||||||||||||
| Net loss |
— | — | — | (8,128 | ) | — | — | (8,128 | ) | $ | (8,128 | ) | ||||||||||||||||||
| Foreign currency translation adjustments |
— | — | — | — | — | (1,431 | ) | (1,431 | ) | (1,431 | ) | |||||||||||||||||||
| Balances, December 31, 2008 |
31,120,614 | — | $ | 250,168 | $ | (78,322 | ) | $ | — | $ | 575 | $ | 172,421 | $ | (9,559 | ) | ||||||||||||||
| Employee stock options exercised |
616,806 | — | 7,438 | — | — | — | 7,438 | |||||||||||||||||||||||
| Issuance of restricted shares |
299,279 | — | 247 | — | — | — | 247 | |||||||||||||||||||||||
| Issuance of ESPP shares |
182,608 | — | 1,137 | — | 1,066 | — | 2,203 | |||||||||||||||||||||||
| Stock offering |
7,475,000 | 1 | 151,370 | — | — | — | 151,371 | |||||||||||||||||||||||
| Stock offering transaction cost |
— | — | (7,584 | ) | — | — | — | (7,584 | ) | |||||||||||||||||||||
| Shares received from Vurv escrow settlement |
(111,167 | ) | — | — | — | (2,471 | ) | — | (2,471 | ) | ||||||||||||||||||||
| Shares acquired for payroll tax payments |
(67,865 | ) | — | — | — | (1,066 | ) | — | (1,066 | ) | ||||||||||||||||||||
| Restricted shares reacquired or forfeited |
(7,438 | ) | — | — | — | — | — | — | ||||||||||||||||||||||
| Stock-based compensation |
— | — | 11,029 | — | — | — | 11,029 | |||||||||||||||||||||||
| Excess tax benefit associated with stock-based compensation |
— | — | 301 | — | — | — | 301 | |||||||||||||||||||||||
| Net income |
— | — | — | 1,293 | — | — | 1,293 | $ | 1,293 | |||||||||||||||||||||
| Foreign currency translation adjustments |
— | — | — | — | — | 2,027 | 2,027 | 2,027 | ||||||||||||||||||||||
| Balances, December 31, 2009 |
39,507,837 | $ | 1 | $ | 414,106 | $ | (77,029 | ) | $ | (2,471 | ) | $ | 2,602 | $ | 337,209 | $ | 3,320 | |||||||||||||
See Accompanying Notes to Consolidated Financial Statements.
68
Table of Contents
TALEO CORPORATION AND SUBSIDIARIES
CONSOLIDATED STATEMENTS OF CASH FLOWS
(in thousands)
| Year Ended December 31, | ||||||||||||
| 2009 | 2008 | 2007 | ||||||||||
| Cash flows from operating activities: |
||||||||||||
| Net income / (loss) |
$ | 1,293 | $ | (8,128 | ) | $ | 2,505 | |||||
| Adjustments to reconcile net income / (loss) to net cash provided by operating activities: |
||||||||||||
| Depreciation and amortization |
27,437 | 16,453 | 6,934 | |||||||||
| (Gain) / loss on disposal of fixed assets and other assets |
17 | (64 | ) | 13 | ||||||||
| Tenant inducements from landlord |
114 | — | — | |||||||||
| Amortization of tenant inducements |
(152 | ) | (152 | ) | (223 | ) | ||||||
| Stock-based compensation expense |
11,029 | 11,433 | 7,972 | |||||||||
| Director fees settled with stock |
247 | 242 | 248 | |||||||||
| Worldwide Compensation purchase option write-off |
1,084 | — | — | |||||||||
| Settlement of Vurv escrow account |
(2,471 | ) | — | — | ||||||||
| Excess tax benefits on the exercise of stock options |
(301 | ) | — | — | ||||||||
| Bad debt expense (reversal) |
840 | 237 | (69 | ) | ||||||||
| Interest earned on restricted cash |
— | — | 1 | |||||||||
| Changes in assets and liabilities, net of effect of acquisition: |
||||||||||||
| Accounts receivable |
4,440 | (11,663 | ) | (2,590 | ) | |||||||
| Prepaid expenses and other assets |
(1,576 | ) | (3,836 | ) | (1,992 | ) | ||||||
| Investment credit receivable |
1,471 | (2,637 | ) | 446 | ||||||||
| Accounts payable and accrued liabilities |
(2,249 | ) | (5,329 | ) | 831 | |||||||
| Deferred revenues and customer deposits |
9,449 | 21,198 | 16,114 | |||||||||
| Net cash provided by operating activities |
50,672 | 17,754 | 30,190 | |||||||||
| Cash flows from investing activities: |
||||||||||||
| Purchases of property and equipment |
(9,140 | ) | (11,055 | ) | (13,152 | ) | ||||||
| Restricted cash — decrease |
418 | 375 | 2,664 | |||||||||
| Purchase of investment |
— | (2,498 | ) | — | ||||||||
| Acquisition of business, net of cash acquired |
— | (49,665 | ) | (3,301 | ) | |||||||
| Net cash used in investing activities |
(8,722 | ) | (62,843 | ) | (13,789 | ) | ||||||
| Cash flows from financing activities: |
||||||||||||
| Principal payments on capital lease obligations |
(1,591 | ) | (667 | ) | (357 | ) | ||||||
| Excess tax benefits on the exercise of stock options |
301 | 56 | — | |||||||||
| Treasury stock acquired to settle employee withholding liability |
(1,066 | ) | (1,068 | ) | (645 | ) | ||||||
| Net proceeds from stock offering |
144,444 | — | — | |||||||||
| Proceeds from stock options exercised and ESPP Shares |
9,640 | 10,178 | 11,065 | |||||||||
| Net cash provided by financing activities |
151,728 | 8,499 | 10,063 | |||||||||
| Effect of exchange rate changes on cash and cash equivalents |
1,089 | (83 | ) | 886 | ||||||||
| Increase / (decrease) in cash and cash equivalents |
194,767 | (36,673 | ) | 27,350 | ||||||||
| Cash and cash equivalents: |
||||||||||||
| Beginning of period |
49,462 | 86,135 | 58,785 | |||||||||
| End of period |
$ | 244,229 | $ | 49,462 | $ | 86,135 | ||||||
| Supplemental cash flow disclosures: |
||||||||||||
| Cash paid for interest |
$ | 64 | $ | 60 | $ | 9 | ||||||
| Cash paid for income taxes |
$ | 275 | $ | 278 | $ | 305 | ||||||
| Supplemental disclosure of non-cash financing and investing activities: |
||||||||||||
| Property and equipment acquired under capital lease |
$ | — | $ | 44 | ||||||||
| Property and equipment purchases included in accounts payable and accrued liabilities |
$ | 2,636 | $ | 1,416 | $ | 3,492 | ||||||
| Accrued offering expenses |
$ | 659 | $ | — | $ | — | ||||||
| Class B common stock exchanged for Class A common stock |
$ | — | $ | 282 | $ | 548 | ||||||
| Stock and stock options issued in connection with Vurv acquisition |
$ | — | $ | 75,189 | $ | — | ||||||
See Accompanying Notes to Consolidated Financial Statements.
69
Table of Contents
TALEO CORPORATION
NOTES TO CONSOLIDATED FINANCIAL STATEMENTS
1. Description of Business and Summary of Significant Accounting Policies
Nature of Business — Taleo Corporation and its subsidiaries (the “Company”) provide on-demand talent management solutions that enable organizations of all sizes to assess, acquire, develop, align and compensate their workforces for improved business performance. The Company’s software applications are offered to customers primarily on a subscription basis.
The Company was incorporated under the laws of the state of Delaware in May 1999 as Recruitsoft, Inc. and changed its name to Taleo Corporation in March 2004. The Company has principal offices in Dublin, California and conducts its business worldwide, with wholly owned subsidiaries in Canada, France, the Netherlands, the United Kingdom, Singapore, and Australia. The subsidiary in Canada performs the primary product development activities for the Company, and the other foreign subsidiaries are generally engaged in providing sales, account management and support.
Basis of Presentation — The consolidated financial statements have been prepared in accordance with accounting principles generally accepted in the United States of America. The consolidated financial statements include the accounts of Taleo Corporation and its wholly owned subsidiaries. All intercompany balances and transactions have been eliminated.
Allocation of Overhead Costs — The Company allocates overhead such as rent and occupancy charges, employee benefit costs and depreciation expense to all departments based on employee count. As such, overhead expenses are reflected in each cost of revenue and operating expense category.
Use of Estimates — The preparation of financial statements in conformity with accounting principles generally accepted in the United States of America, or GAAP, requires company management to make estimates and assumptions that affect the amount of assets and liabilities and disclosure of contingent assets and liabilities at the date of the financial statements and the reported amounts of revenues and expenses during the reporting period. Actual results could differ from those estimates. Items subject to the use of estimates include revenue, research and development costs, bad debt expense, certain accrued liabilities, impairment of goodwill, other intangible assets and other long-lived assets, amortization of acquired intangible assets, stock-based compensation and income tax expense.
Revenue Recognition — Company derives its revenue from fixed subscription fees for access to and use of its on-demand application services and from consulting fees. The Company presents revenue and deferred revenue from each of these sources separately in its consolidated financial statements.
In addition to fixed subscription fees arrangements, the Company has on limited occasions, entered into arrangements including perpetual licenses with hosting services to be provided over a fixed term. For hosted arrangements, revenues are recognized in accordance with the standards established by the FASB for hosting arrangements that includes a right of the customer to use the software on another entity’s hardware.
The Company’s application and consulting fee revenue is recognized when all of the following conditions have been satisfied:
| • | persuasive evidence of an agreement exists; |
| • | delivery has occurred; |
| • | fees are fixed or determinable; and |
| • | the collection of fees is considered probable. |
70
Table of Contents
TALEO CORPORATION
NOTES TO CONSOLIDATED FINANCIAL STATEMENTS—(Continued)
If collection is not considered probable, the Company recognizes revenues when the fees for the services performed are collected. In addition, if non-standard acceptance periods or non-standard performance criteria are required, the Company recognizes revenue upon the satisfaction of the acceptance or performance criteria, as applicable.
The Company follows accounting guidance for revenue recognition of multiple-element arrangements to determine whether such arrangements contain more than one unit of accounting. Multiple-element arrangements require the delivery or performance of multiple products, services and/or rights to use assets. To qualify as a separate unit of accounting, the delivered item must have value to the customer on a standalone basis and there must be objective and reliable evidence of fair value of the undelivered element. The Company’s consulting services have standalone value because those services are sold separately by other vendors and the Company has objective and reliable evidence of fair value for consulting services based on the consistency in pricing when sold separately. The Company’s application services have standalone value as such services are often sold separately. However, in multiple element arrangements that include both application and consulting services the Company does not have objective and reliable evidence of fair value for our application services. As such, the Company treats multiple element arrangements that include both application and consulting services as a single unit of accounting and recognizes the combined revenue over the subscription term.
The Company’s objective and reliable evidence of fair value for consulting services and its assessment of fair value with respect to application services are used to derive a reasonable approximation for presenting application services and consulting services separately in its consolidated financial statements.
Application Revenue
The majority of the Company’s application revenue is recognized monthly over the life of the application agreement, based on stated, fixed-dollar amount contracts with its customers and consists of:
| • | fees paid for subscription services |
| • | amortization of any related set-up fees; and |
| • | amortization of fees paid for hosting services and software maintenance services under certain software license arrangements |
Set up fees paid by customers in connection with subscription services are deferred and recognized ratably over the longer of the life of the application agreement or the expected lives of customer relationships, which generally range from three to seven years. The Company continues to evaluate the length of the amortization period of the set up fees as it gains more experience with customer contract renewals.
The Company’s revenue associated with the time and expense processing functionality of its Taleo Contingent solution was recognized based on a fixed, contracted percentage of the dollar amount invoiced for contingent labor through use of the application, and had been recorded on a net basis. During the second quarter of 2008, the Company discontinued its Taleo Contingent product offering. At December 31, 2009, the Company was not obligated under any arrangements related to its Taleo Contingent solution.
Consulting Revenue
Consulting revenue consists primarily of fees associated with application configuration, integration, business process re-engineering, change management, and education and training services. In arrangements that include both application subscription and consulting services, the related consulting revenues are recognized
71
Table of Contents
TALEO CORPORATION
NOTES TO CONSOLIDATED FINANCIAL STATEMENTS—(Continued)
ratably over the remaining subscription term. The Company’s consulting engagements are typically billed on a time and materials basis and, for engagements sold separately from application services, the Company recognizes consulting revenues as delivered. In some instances the Company sells consulting services on a fixed-fee basis and, in those cases, for engagements sold separately from application services, the Company recognizes consulting revenues using a proportional performance model based on services performed. Expenses associated with delivering these services are recognized as incurred when the services are performed. Associated out-of-pocket travel and expenses related to the delivery of consulting services is typically reimbursed by the customer. This is accounted for as both revenue and expense in the period the cost is incurred. From time to time, certain of our consulting projects are subcontracted to third parties. Customers of the Company may also elect to use unrelated third parties for the types of consulting services that it offers. The Company’s typical consulting contract provides for payment within 30 to 60 days of invoice.
In October 2009, the FASB amended the accounting standards for revenue recognition for multiple deliverable revenue arrangements to:
| • | Provide updated guidance on how the deliverables of an arrangement should be separated, and how the consideration should be allocated: |
| • | Eliminate the use of the residual method and require an entity to allocate revenue using the relative selling price method; and |
| • | Require an entity to allocate revenue to an arrangement using the estimated selling prices (“ESP”) of deliverables if it does not have vendor-specific objective evidence (“VSOE”) or third-party evidence (“TPE”) of selling price. Valuation terms defined as below: |
| • | VSOE — the price at which the Company sells the element in a separate stand-alone transaction |
| • | TPE — evidence from us or other companies of the value of a largely interchangeable element in a transaction |
| • | ESP — our best estimate of the selling price of an element in a transaction. |
The Company has elected to early adopt this accounting guidance for its fiscal year ending December 31, 2010 on a prospective basis. The Company expects the implementation will significantly increase our services revenue and services gross margins throughout the year as the Company will continue to recognize previously deferred services revenue ratably for bundled transactions entered into prior to fiscal year 2010, while consulting services revenue from new engagements entered into in 2010 will generally be recognized as performed. The Company is currently evaluating the impact of this accounting standard on our consolidated financial statements.
Deferred Revenue and Customer Deposits — Deferred revenue and customer deposits primarily consists of billings or payments received in advance of revenue recognition from the Company’s solutions described above and are recognized as the revenue recognition criteria are met. The Company generally invoices its customers for application agreements in quarterly or annual installments. Accordingly, the deferred revenue balance does not represent the total contract value of all, noncancelable subscription agreements in effect.
Commission Expense — Commissions are the incremental costs that are directly associated with revenue contracts. In the case of commissions for application revenue contracts, the commissions are calculated based upon a percentage of the revenue for the first contract year. The commission payment is earned by the Company’s sales persons over the twelve-month period following the initiation of a new customer contract. To the extent that a commission is paid before it is expensed, it is recorded as a prepaid expense and amortized over the period benefited by the service period of the sales person.
72
Table of Contents
TALEO CORPORATION
NOTES TO CONSOLIDATED FINANCIAL STATEMENTS—(Continued)
Goodwill and Other Intangible Assets — Goodwill represents the excess of the purchase price over the fair value of net assets acquired in connection with the Company’s business combinations accounted for using the purchase method of accounting. The Company conducts a test for the impairment of goodwill on at least an annual basis. October 1 has been adopted as the date of the annual impairment test. The impairment test compares the fair value of reporting units to their carrying amount, including goodwill, to assess whether impairment is present. The Company estimates the fair value of its application reporting unit using two methods: quoted market price and a discounted cash flow valuation model. The discounted cash flow method requires estimates of its future revenues, profits, capital expenditures, working capital, and other relevant factors from a market participants’ perspective. The Company estimates these amounts by evaluating historical trends, current budgets, operating plans, industry data, and other relevant factors. Based on the most recent impairment test conducted on October 1, 2009, the Company has concluded that there was no impairment of goodwill as of that date. The Company will continue to assess the impairment of goodwill annually on October 1 or sooner, if other indicators of impairment arise. See Note 3. “Intangible Assets and Goodwill”.
Impairment of Long-Lived Assets — The Company assesses potential impairment to long-lived assets and certain identifiable intangible assets with finite lives whenever events or changes in circumstances indicate that the carrying amount of an asset may not be recoverable. Recoverability of assets to be held and used is measured by a comparison of the carrying amount of an asset to the future undiscounted net cash flows that are expected to be generated by the asset. If such assets are considered to be impaired, the impairment to be recognized is measured by the amount by which the carrying amount of the assets exceeds the fair value of the assets. The Company determined that its long-lived assets were not impaired at December 31, 2009, 2008 and 2007. Assets to be disposed are reported at the lower of the carrying amount or fair value less costs to sell.
Income Taxes — Recognition of deferred tax assets and liabilities is provided for the expected future tax consequences of events that have already been recognized in the Company’s consolidated financial statements or tax returns. Deferred tax assets and liabilities are determined based on the differences between the financial accounting and tax bases of assets and liabilities using enacted tax rates expected to be in effect for the year in which the differences are expected to reverse. Valuation allowances are provided against net deferred tax assets when it is more likely than not that such assets will not be realized.
The Company is subject to income taxes in both the United States and foreign jurisdictions and uses estimates in determining its provision for income taxes. Deferred tax assets, related valuation allowances and deferred tax liabilities are determined separately by tax jurisdiction. This process involves estimating actual current tax liabilities together with assessing temporary differences resulting from differing treatment of items for tax and accounting purposes. These differences result in deferred tax assets and liabilities, which are recorded on the balance sheet. The Company’s deferred tax assets consist primarily of net operating loss carry forwards and temporary differences related to deferred revenue, stock-based compensation and Canadian federal investment tax credits. The Company assesses the likelihood that deferred tax assets will be recovered from future taxable income and a valuation allowance is recognized if it is more likely than not that some portion of the deferred tax assets will not be recognized. At December 31, 2007, the Company reversed valuation allowances recorded in its remaining foreign subsidiaries resulting in a tax provision benefit of approximately $0.3 million. The Company continues to maintain a full valuation allowance against its U.S. deferred tax assets with the exception of U.S. federal alternative minimum tax credits which were reversed in 2008. A portion of the remaining U.S. valuation allowance relates to deferred tax assets established in connection with prior acquisitions.
Effective January 1, 2007, the Company adopted FASB-issued authoritative accounting guidance related to the accounting for uncertain tax positions. Under these provisions, the Company recognizes the tax benefit from an uncertain tax position only if it is more likely than not that the tax position will be sustained on examination
73
Table of Contents
TALEO CORPORATION
NOTES TO CONSOLIDATED FINANCIAL STATEMENTS—(Continued)
by the taxing authorities based on the technical merits of the position. The tax benefits recognized in the financial statements from such a position would be measured based on the largest benefit that has a greater than 50% likelihood of being realized upon ultimate settlement. The Company considers many factors when evaluating and estimating its uncertain tax positions which may require periodic adjustments and which may not accurately anticipate actual outcomes. The impact of this guidance on the Company’s financial position is discussed in Note 8 “Income Taxes”. Accordingly, the Company reports a liability or reduces a tax attribute or temporary difference for unrecognized tax benefits resulting from the uncertain tax positions taken or expected to be taken in a tax return and recognizes interest and penalties, if any, related to uncertain tax positions in income tax expense.
Compliance with income tax regulations requires the Company to make decisions relating to the transfer pricing of revenue and expenses between each of its legal entities that are located in several countries. The Company’s determinations include many decisions based on its knowledge of the underlying assets of the business, the legal ownership of these assets, and the ultimate transactions conducted with customers and other third-parties. The calculation of its tax liabilities involves dealing with uncertainties in the application of complex tax regulations in multiple tax jurisdictions. The Company is periodically reviewed by domestic and foreign tax authorities regarding the amount of taxes due. These reviews include questions regarding the timing and amount of deductions and the allocation of income among various tax jurisdictions. In evaluating the uncertainty associated with various filing positions, we record tax benefits in accordance with FASB-issued authoritative guidance. Such estimates are subject to change.
Allowance for Doubtful Accounts — The Company maintains an allowance for doubtful accounts for estimated losses resulting from the inability of customers to make required payments. This allowance is established using estimates formulated by the Company’s management based upon factors such as the composition of the accounts receivable aging, historical bad debts, changes in payments patterns, customer creditworthiness, and current economic trends. The following is a summary of the activity in the allowance for doubtful accounts for the years ended December 31:
| 2009 | 2008 | 2007 | ||||||||||
| (In thousands) | ||||||||||||
| Balance at January 1 |
$ | 884 | $ | 369 | $ | 585 | ||||||
| Provision charged to expense |
840 | 237 | 512 | |||||||||
| Provision related to Vurv acquisition |
(241 | ) | 602 | — | ||||||||
| Reversal of allowance provision |
— | — | (581 | ) | ||||||||
| Write-offs charged against allowance |
(724 | ) | (324 | ) | (147 | ) | ||||||
| Balance at December 31 |
$ | 759 | $ | 884 | $ | 369 | ||||||
Cash and Cash Equivalents — The Company defines cash and cash equivalents as cash and highly liquid investments with maturity of three months or less when purchased.
Restricted Cash — The Company’s restricted cash balance of $0.6 million at December 31, 2009 is maintained in two money market accounts in the amounts of $0.4 million and $0.2 million. The $0.6 million is collateralized by two letters of credit for $0.4 million and $0.2 million issued to the Company’s landlords as security deposits. The money market accounts bear interest at prevailing market rates. The rates at December 31, 2009 ranged from 0.15% to 0.75%.
Concentration of Credit and Market Risk — Financial instruments that potentially subject the Company to credit risk consist primarily of cash and cash equivalents, accounts receivable and debt. The Company maintains substantially all of its cash and cash equivalents in financial institutions that are believed to have good credit
74
Table of Contents
TALEO CORPORATION
NOTES TO CONSOLIDATED FINANCIAL STATEMENTS—(Continued)
ratings and represent minimal risk of loss of principal. The Company grants credit to customers in the ordinary course of business and provides a reserve when necessary for potential credit losses. The Company is not exposed to any material credit concentration risk. A portion of the Company’s revenues and expenses are generated in Canadian dollars as well as other foreign currencies and, as a result, the Company is exposed to market risks from changes in foreign currency exchange rates.
Fair Value of Financial Instruments — The carrying amounts of the Company’s financial instruments, which include cash and cash equivalents, restricted cash, accounts receivable, accounts payable, and other accrued expenses, approximate their fair values due to their short maturities. Based on borrowing rates currently available to the Company for loans with similar terms, the carrying value of capital lease obligations approximates fair value.
Foreign Currency Translation — The U.S. dollar is the reporting currency for all periods presented. The financial information for entities outside the United States is measured using the local currency as the functional currency. Assets and liabilities for foreign entities are translated into U.S. dollars at the exchange rate in effect on the respective balance sheet dates, and revenues and expenses are translated into U.S. dollars based on the average rate of exchange for the corresponding period. Exchange rate differences resulting from translation adjustments are accounted for as a component of accumulated comprehensive income. Gains or losses from foreign currency transactions are reflected in the consolidated statements of operations within the line item general and administrative expense, and were $0.9 million, $1.0 million, and $0.5 million in 2009, 2008 and 2007, respectively. Such foreign currency transactions include billings denominated in foreign currencies by the Company’s U.S. entity, which are reported based on the applicable exchange rate in effect on the balance sheet date. The related deferred revenue from such billings are reported in U.S. dollars at the exchange rate in effect at the billing dates when the revenue was deferred.
Property and Equipment — Property and equipment are stated at cost, less accumulated depreciation. Expenditures for maintenance and repairs are charged to operations. Depreciation is provided using the straight-line method over the estimated useful lives of the related assets or, for leasehold improvements, the shorter of lease term or useful life of the asset. The following table presents the estimated useful lives of the Company’s property and equipment:
| Computer hardware and software |
3 to 5 years | |
| Furniture and equipment |
5 years | |
| Leasehold improvements |
Shorter of lease term or useful life of asset |
Investment Credits — The Company participates in a provincial government program in Quebec that provides investment credits based upon qualifying research and development expenditures. The Company has participated in the program for ten years, and management expects that the Company will continue to be eligible to earn these refundable investment credits through December 2010, when the program is scheduled to end. The credits are estimated and recognized when the expenditures are made. The credits earned are reported as a reduction of related research and development expense in the year incurred. During the years ended December 31, 2009, 2008, and 2007, approximately $2.4 million, $2.3 million and $2.5 million, respectively, have been recorded as a reduction of research and development expenses.
In addition to the provincial research and development investment credit program described above, the Company’s Canadian subsidiary participates in a scientific research and experimental development, or SR&ED, program administered by the Canadian federal government that provides income tax credits based upon qualifying research and development expenditures. For tax year 2009, the Company recorded an estimated SRED credit claim of approximately $1.0 million and is eligible to remain in the SRED program for future tax years as
75
Table of Contents
TALEO CORPORATION
NOTES TO CONSOLIDATED FINANCIAL STATEMENTS—(Continued)
long as its development projects continue to qualify. These Canadian federal SRED tax credits can only be applied to offset Canadian federal taxes payable and are reported as a credit to our tax provision to the extent they reduce taxes payable to zero with any residual benefits recorded as a net deferred tax asset
Advertising Expenses — The cost of advertising is expensed as incurred. Advertising costs were approximately $0.7 million, $1.7 million, and $0.8 million for the years ended December 31, 2009, 2008, and 2007, respectively.
Product and Software Development Costs — The Company incurs cost to develop internal-use software during the application development stage. These costs are capitalized after technological feasibility of the product has been established. Such costs have been insignificant to date, and accordingly, no costs were capitalized in 2009, 2008 or 2007. Also, in connection with the development of its on-demand application service, the Company capitalizes qualifying computer software costs, which are incurred during the application development stage, and amortizes them over the software’s estimated useful life of five years.
Stock-Based Compensation — The Company amortizes stock-based compensation expense based upon the fair value of stock-based awards on a straight-line basis over the requisite vesting period as defined in the applicable plan documents. Corporate income tax benefits realized upon exercise or vesting of an award in excess of that previously recognized in earnings, referred to as an excess tax benefit, are presented in the consolidated statements of cash flows as a financing activity. Realized excess tax benefits are credited to additional paid-in capital in the consolidated balance sheets. Realized shortfall tax benefits, amounts which are less than that previously recognized in earnings, are first offset against the cumulative balance of excess tax benefits, if any, and then charged directly to income tax expense. See Note 7. “Common Stock”
Comprehensive Income (Loss) — Comprehensive income (loss) consists of net loss or gain on foreign currency translations and net income or loss from operations and is presented in the consolidated statements of stockholders’ equity. This includes charges and credits to equity that are not the result of transactions with stockholders. Included in other comprehensive income or loss are the cumulative translation adjustments related to the net assets of the operations of the Company’s foreign subsidiaries. These adjustments are accumulated within the consolidated statements of stockholders’ equity under the caption “Accumulated Other Comprehensive Income (Loss).” Comprehensive Income (Loss) for the years ended December 31, 2009, 2008, and 2007, was approximately $3.3 million, $(9.6) million and $4.3 million, respectively.
Recent Accounting Pronouncements —
In October 2009, the FASB issued accounting standards for revenue recognition for multiple deliverable revenue arrangements to:
| • | Provide updated guidance on how the deliverables of an arrangement should be separated, and how the consideration should be allocated: |
| • | Eliminate the use of the residual method and require an entity to allocate revenue using the relative selling price method; and |
| • | Require an entity to allocate revenue to an arrangement using the estimated selling prices (“ESP”) of deliverables if it does not have vendor-specific objective evidence (“VSOE”) or third-party evidence (“TPE”) of selling price. Valuation terms defined as below: |
| • | VSOE — the price at which the Company sells the element in a separate stand-alone transaction |
| • | TPE — evidence from us or other companies of the value of a largely interchangeable element in a transaction |
| • | ESP — our best estimate of the selling price of an element in a transaction. |
76
Table of Contents
TALEO CORPORATION
NOTES TO CONSOLIDATED FINANCIAL STATEMENTS—(Continued)
The Company has elected to early adopt this accounting guidance for our fiscal year ending December 31, 2010 on a prospective basis. The Company expects the implementation will significantly increase our services revenue and services gross margins throughout the year as we will continue to recognize previously deferred services revenue ratably for bundled transactions entered into prior to fiscal year 2010, while consulting services revenue from new engagements entered into in 2010 will generally be recognized as performed. The Company is currently evaluating the impact of this accounting standard on our consolidated financial statements.
In December 2007, the FASB issued accounting guidance that establishes principles and requirements for how an acquirer in a business combination recognizes and measures the identifiable assets acquired, the liabilities assumed, any non-controlling interest in the acquiree, and goodwill in the financial statements of the acquirer. The new guidance also establishes financial statement disclosure requirements to enable the evaluation of the nature and financial effects of the business combination. This guidance is effective as of the beginning of an entity’s fiscal year that begins after December 15, 2008. The Company adopted the guidance in the beginning of fiscal year 2009 and the adoption did not have a significant impact its consolidated financial statements.
2. Business Combinations and Dispositions
Pending Acquisition of Worldwide Compensation, Inc.
On September 14, 2009, the Company entered into an Amended and Restated Agreement and Plan of Merger (the “Merger Agreement”) to acquire Worldwide Compensation, Inc. (“WWC”), a private company with headquarters in California that provides compensation management solutions. In accordance with the terms of the Merger Agreement, the Company was to pay up to $16 million in cash, subject to adjustment for any outstanding debt, third-party expenses and certain other specified items, in exchange for all of the issued and outstanding capital stock, options and warrants of WWC that the Company did not already own. Fifteen percent (15%) of the consideration was to be placed into escrow for one year following the closing to be held as security for losses incurred by the Company in the event of certain breaches of the representations and warranties contained in the Merger Agreement or certain other events. Previously, in the third quarter of 2008, the Company made an investment of $2.5 million for a 16% equity investment in and an option to purchase WWC at a later date. In connection with the execution of the Merger Agreement, the Company negotiated more favorable terms than the purchase option and also terminated the purchase option. Accordingly, the Company wrote-off the $1.1 million carrying value of the purchase option in the third quarter of 2009.
On January 1, 2010, the Company completed the acquisition of WWC. Accordingly, the assets, liabilities and operating results of WWC will be reflected in the Company’s consolidated financial statements from the date of acquisition. The total consideration paid by the Company for the portion of WWC that it did not already own was approximately $14.1 million in cash. No contingent cash payments remain for this transaction.
Acquisition of Vurv Technology, Inc.
On May 5, 2008, the Company entered into an Agreement and Plan of Reorganization (the “Reorganization Agreement”) to purchase Vurv Technology, Inc. (“Vurv”), a private company with headquarters in Florida. Vurv is a provider of on demand talent management software. On July 1, 2008, the Company completed the acquisition of Vurv. Accordingly, the assets, liabilities and operating results of Vurv are reflected in the Company’s consolidated financial statements from the date of acquisition. The total consideration paid by the Company in connection with the acquisition was approximately $34.4 million in cash, $2.9 million in third party fees, and approximately 3.8 million shares of Class A common stock, of which approximately $33.8 million in cash and approximately 3.3 million shares of Class A common stock were paid on the closing date. Approximately 0.5 million shares were placed into escrow for one year following the closing to be held as
77
Table of Contents
TALEO CORPORATION
NOTES TO CONSOLIDATED FINANCIAL STATEMENTS—(Continued)
security for losses incurred by the Company in the event of certain breaches of the representations and warranties contained in the Reorganization Agreement or certain other events. Additionally, approximately $0.3 million was placed into escrow to pay for expenses incurred by the stockholder representative in connection with its duties under the Reorganization Agreement, and approximately $0.4 million was placed in escrow to compensate the Company in the event certain expenses are incurred in connection with payments to certain Vurv employees. In addition, the Company assumed obligations for outstanding options to purchase shares of Vurv common stock, which converted into options to purchase approximately 0.4 million shares of the Company’s common stock. Taleo also repaid approximately $9.0 million of Vurv debt on the closing date. No contingent cash payments remain for this transaction.
In November 2008, the Company entered in an agreement to sell our Optimize product offering (“Optimize”) and the associated assets and liabilities. The Company acquired Optimize in connection with the acquisition of Vurv on July 1, 2008 and the sale of Optimize represents the completion of a disposition plan initiated during the third quarter of 2008. The sale of Optimize did not result in a significant gain or loss.
In 2009, the Company settled the Vurv escrow account with the former shareholders of Vurv and received 111,167 shares of the Company’s Class A common stock while the former shareholders of Vurv received 366,732 shares. The 111,167 shares were valued at $2.5 million based on a market price per share of $22.23 on the settlement date, November 11, 2009. The Company has designated these shares as treasury stock for fulfillment of future employee stock purchases under the Company’s employee stock purchase plan. The $2.5 million value of the shares was recorded as other income during the fourth quarter of 2009. Additionally in 2009, the Company received $0.4 million as reimbursement for severance payments made to certain former Vurv employees, which was recorded as a reduction in operating expense in the first quarter of 2009. As of December 31, 2009, all escrow accounts related to the Vurv acquisition have been settled.
78
Table of Contents
TALEO CORPORATION
NOTES TO CONSOLIDATED FINANCIAL STATEMENTS—(Continued)
Under purchase accounting, the final purchase price allocated to the net identifiable intangible assets based on their estimated fair value at the date of acquisition. The determination of the value of these components required the Company to make various estimates and assumptions. Critical estimates in valuing certain of the intangible assets include but are not limited to future expected cash flows from product sales and services. The fair value of deferred revenue was determined based the estimated direct cost of fulfilling the obligation to the customer plus a normal profit margin while the fair value for all other assets and liabilities acquired was determined based on estimated future benefits or legal obligations associated with the respective asset or liability. The excess of the purchase price over the net identifiable intangible assets, other identifiable assets and liabilities acquired has been recorded to goodwill. The Company did not record any in-process research and development charges in connection with the acquisition.
Allocation of Purchase Price
| Amount | ||||
| (In thousands) | ||||
| Cash |
$ | 223 | ||
| Accounts receivable, net |
7,779 | |||
| Other current assets |
495 | |||
| Restricted Cash |
286 | |||
| Property and equipment |
4,844 | |||
| Goodwill |
82,425 | |||
| Intangible assets |
49,947 | |||
| Non-current assets |
101 | |||
| Accounts payable and accrued liabilities |
(11,080 | ) | ||
| Other current liabilities |
(1,254 | ) | ||
| Deferred revenue |
(7,332 | ) | ||
| Non-current liabilities |
(1,379 | ) | ||
| Total estimated purchase price |
$ | 125,055 | ||
Purchase Price
| Amount | |||
| (In thousands) | |||
| Cash |
$ | 46,542 | |
| Estimated fair value of common stock issued |
73,444 | ||
| Estimated fair value of stock options assumed |
1,745 | ||
| Accrued transaction cost |
3,324 | ||
| Total estimated purchase price |
$ | 125,055 | |
79
Table of Contents
TALEO CORPORATION
NOTES TO CONSOLIDATED FINANCIAL STATEMENTS—(Continued)
Unaudited pro forma results of operations to reflect the acquisition as if it had occurred on the first date of all periods presented are shown below.
| Year ended December 31, | ||||||||
| 2008 | 2007 | |||||||
| Consolidated Proforma | ||||||||
| (In thousands, except per share data) | ||||||||
| Revenue |
$ | 195,437 | $ | 177,099 | ||||
| Net loss attributable to Class A common stockholders |
$ | (22,226 | ) | $ | (13,263 | ) | ||
| Net loss attributable to Class A common stockholders — basic and diluted |
$ | (0.76 | ) | $ | (0.48 | ) | ||
| Weighted average Class A common shares — basic and diluted |
29,242 | 27,461 | ||||||
Acquisition of Wetfeet, Inc.
On June 26, 2007, the Company entered into an asset purchase agreement (the “Wetfeet Asset Purchase Agreement”) by and among the Company, Universum Communications Holdings, Inc, Wetfeet, Inc., (“Wetfeet”) and U.S. Bank National Association as escrow agent, for the acquisition by the Company of certain assets of Wetfeet relating to Wetfeet’s hiring management solutions business (the “Wetfeet Transaction”). Under the terms of the Wetfeet Transaction, the Company acquired a portion of Wetfeet’s intellectual property, technology and customer contracts. The Wetfeet Transaction closed on July 3, 2007. The net cash amount paid by the Company at closing in connection with the acquisition was approximately $0.3 million in cash, of which approximately $0.1 million was placed into escrow for one year following the closing to be held as partial security for certain losses that may be incurred by the Company in the event of certain breaches of the representations and warranties covered in the asset purchase agreement or certain other events. The Wetfeet Asset Purchase Agreement provided for additional payments of up to approximately $1.3 million to be made to Wetfeet in July 2008 upon the achievement of certain milestones by the first anniversary of the closing date (“Second Payment”). As of December 31, 2007, such milestones had been substantially achieved and the $1.3 million was fully accrued and included in the cost of the acquisition. As in the case of the payment placed in escrow, the Second Payment was subject to adjustment for certain breaches of the representations and warranties covered in the asset purchase agreement or certain other events. In 2008, the Company determined certain milestones were not achieved and reduced the Second Payment by $42,000 before making the final payment in the second half of 2008. The $42,000 difference between the amount accrued for the Second Payment and the amount paid was recorded as an adjustment to goodwill. Additionally, goodwill was reduced by $20,000 due to capitalized transaction costs being more than actual cost incurred. The total cost of the acquisition including legal, accounting, valuation and other professional fees was $1.7 million. The Company had substantially converted the Wetfeet customers to its products and discontinued the Wetfeet product in 2008.
80
Table of Contents
TALEO CORPORATION
NOTES TO CONSOLIDATED FINANCIAL STATEMENTS—(Continued)
Under purchase accounting, the purchase price has been allocated to the net identifiable intangible assets based on their estimated fair value at the date of acquisition. The Company also performed an allocation of the purchase price among the acquired identifiable intangible assets of Wetfeet. The excess of the purchase price over the net identifiable intangible assets has been recorded to goodwill. The Company did not record any in-process research and development charges in connection with the acquisition.
| Amounts | Assigned Life | |||||
| (In thousands) | ||||||
| Goodwill |
$ | 1,665 | ||||
| Customer relationship |
193 | 4 years | ||||
| Less: Net liabilities |
(177 | ) | ||||
| Total purchase price allocation |
$ | 1,681 | ||||
The Company has not presented pro forma financial statements for this acquisition, as the pre-acquisition operations of Wetfeet were not material.
Acquisition of JobFlash, Inc.
On March 2, 2007, the Company entered into an asset purchase agreement (the “JobFlash Asset Purchase Agreement”) by and among the Company, JobFlash, Inc. (“JobFlash”) and U.S. Bank National Association as escrow agent, for the acquisition by the Company of certain assets of JobFlash relating to JobFlash’s talent management and human resources solutions business (the “JobFlash Transaction”). The JobFlash Transaction closed on March 7, 2007. The total purchase price paid by the Company in connection with the JobFlash Transaction was approximately $3.1 million, of which $0.5 million was placed into escrow for one year following the closing to be held as partial security for certain losses that may be incurred by the Company in the event of certain breaches of the representations and warranties covered in the Asset Purchase Agreement or certain other events. In March 2008, the Company distributed the $0.5 million escrow balance to the former owners of JobFlash. The total cost of the acquisition including legal, accounting, valuation and other professional fees was $3.3 million. In 2008, JobFlash goodwill was reduced by $16,000 due to capitalized transaction costs being more than actual cost incurred. Under the terms of the JobFlash Transaction, the Company acquired substantially all of JobFlash’s intellectual property, technology and customer contracts. The Company hired the majority of JobFlash’s sales, services and development personnel. In addition, the Company assumed certain liabilities relating to the purchased assets. As of December 31, 2009, assets acquired in the JobFlash transaction have provided the basis for the Company’s Taleo Scheduling Center solution, Taleo Voice Response and hourly hiring management tools for the Company’s Taleo Business Edition solution.
Under purchase accounting, the purchase price has been allocated to the net identifiable intangible assets based on their estimated fair value at the date of acquisition. The Company also performed an allocation of the purchase price among the acquired identifiable intangible assets of JobFlash. The excess of the purchase price over the net identifiable intangible assets has been recorded to goodwill. The Company did not record any in-process research and development charges in connection with the acquisition.
| Amounts | Assigned Life | ||||
| (In thousands) | |||||
| Goodwill |
$ | 2,014 | |||
| Existing technology |
810 | 5 years | |||
| Customer relationship |
290 | 4 years | |||
| Tradename |
20 | 2 years | |||
| Net assets |
168 | ||||
| Total purchase price allocation |
$ | 3,302 | |||
81
Table of Contents
TALEO CORPORATION
NOTES TO CONSOLIDATED FINANCIAL STATEMENTS—(Continued)
Unaudited pro forma results of operations to reflect the acquisition as if it had occurred on the first date of all periods presented are shown below.
| Year ended December 31, 2007 | |||
| Consolidated Proforma per share data) | |||
| Revenue |
$ | 128,410 | |
| Net income attributable to Class A common stockholders |
$ | 2,285 | |
| Net income attributable to Class A common stockholders — basic |
$ | 0.09 | |
| Net income attributable to Class A common stockholders — diluted |
$ | 0.08 | |
| Weighted average Class A common shares — basic |
24,116 | ||
| Weighted average Class A common shares — diluted |
28,777 | ||
3. Intangible Assets and Goodwill
During the year ended December 31, 2009, goodwill decreased by $0.6 million as the Company reduced certain accrued liabilities, and or offset by other adjustments consisting of customer invoices and vendor payables in connection with the Company’s July 1, 2008 acquisition of Vurv. As of December 31, 2009, the Company had completed its purchase price allocation related to the Vurv acquisition. All goodwill is reported in our application operating segment.
On July 1, 2008, the Company completed its acquisition of Vurv and the related intangible assets are reflected in the table below. The $82.7 million of increase of goodwill relates to the acquisition of Vurv and has been assigned to the Company’s application operating segment. The Company also recorded a $49.9 million increase in intangible assets acquired in the transaction. During the third quarter of 2008 and as part of the review of the product portfolio acquired in the Vurv acquisition, the Company determined that it would not continue to sell and maintain a product offering referred to as Optimize. In addition, in the third quarter, the Company approved a plan for the sale or disposition of that product and the associated assets and liabilities. A newly acquired intangible asset that is expected to be sold shall be classified as held for sale at the acquisition date and shall not be amortized. As such, the Company classified the $0.7 million of intangible assets related to Optimize as held for sale and did not record amortization expense for these assets in its financial statements. The fair value of the intangible asset was determined based on the present value of the expected future cash flows from the Optimize product line. In November 2008, the Company entered in an agreement to sell our Optimize product offering and its associated assets and liabilities. The sale of Optimize represents the completion of a disposition plan initiated during the third quarter of 2008. See Footnote 2 — Business Combinations and Dispositions.
82
Table of Contents
TALEO CORPORATION
NOTES TO CONSOLIDATED FINANCIAL STATEMENTS—(Continued)
| December 31, 2009 | December 31, 2008 | |||||||||||||||||||
| Amortizable Intangible Assets |
Gross Carrying Amount |
Accumulated Amortization |
Net | Gross Carrying Amount |
Accumulated Amortization |
Net | ||||||||||||||
| Existing technology |
$ | 11,811 | $ | (7,088 | ) | $ | 4,723 | $ | 11,811 | $ | (3,904 | ) | $ | 7,907 | ||||||
| Customer relationships |
41,297 | (15,668 | ) | 25,629 | 41,297 | (4,906 | ) | 36,391 | ||||||||||||
| Trade name and other |
308 | (218 | ) | 90 | 280 | (83 | ) | 197 | ||||||||||||
| Non-compete agreements |
410 | (308 | ) | 102 | 410 | (103 | ) | 307 | ||||||||||||
| $ | 53,826 | $ | (23,282 | ) | $ | 30,544 | $ | 53,798 | $ | (8,996 | ) | $ | 44,802 | |||||||
| Goodwill |
January 1, 2009 Balance |
Adjustments | December 31, 2009 Balance |
|||||||||||||||||
| Vurv Technology |
$ | 83,024 | $ | (599 | ) | $ | 82,425 | |||||||||||||
| WetFeet |
1,665 | 1,665 | ||||||||||||||||||
| JobFlash |
2,014 | 2,014 | ||||||||||||||||||
| Recruitforce / White Amber |
4,923 | 4,923 | ||||||||||||||||||
| $ | 91,626 | $ | (599 | ) | $ | 91,027 | ||||||||||||||
The Company does not have a history of goodwill impairments.
Amortization expense for intangible assets was $14.3 million, $5.8 million and $0.4 million for the years ended December 31, 2009, 2008 and 2007, respectively. The estimated amortization expenses for intangible assets for the next five years and thereafter are as follows:
| Estimated Amortization Expense |
(In thousands) | ||
| 2010 |
$ | 11,311 | |
| 2011 |
6,239 | ||
| 2012 |
3,736 | ||
| 2013 |
3,705 | ||
| 2014 |
3,703 | ||
| Thereafter |
1,850 | ||
| Total |
$ | 30,544 | |
4. Property and Equipment
Property and equipment consists of the following at December 31, 2009 and 2008:
| 2009 | 2008 | |||||||
| (In thousands) | ||||||||
| Computer hardware and software |
$ | 59,699 | $ | 46,740 | ||||
| Furniture and equipment |
3,550 | 3,198 | ||||||
| Leasehold improvements |
4,036 | 3,498 | ||||||
| 67,285 | 53,436 | |||||||
| Less accumulated depreciation and amortization |
(43,775 | ) | (28,186 | ) | ||||
| Total |
$ | 23,510 | $ | 25,250 | ||||
Property and equipment included capital leases totaling $3.1 million at December 31, 2009 and 2008. All of the equipment purchased under capital leases are included in computer hardware and software. Accumulated
83
Table of Contents
TALEO CORPORATION
NOTES TO CONSOLIDATED FINANCIAL STATEMENTS—(Continued)
amortization relating to property and equipment under capital leases totaled $2.3 million and $1.3 million, respectively, at December 31, 2009 and 2008. Depreciation and amortization expense of property and equipment was $13.2 million, $10.7 million, and, $6.6 million for the years ended December 31, 2009, 2008, and 2007, respectively.
5. Prepaid Expenses and Other Assets
Prepaid expenses and other assets consist of the following at December 31, 2009 and 2008:
| 2009 | 2008 | |||||
| Prepaid Expenses and Other Current Assets |
(In thousands) | |||||
| Prepaid expenses |
$ | 4,390 | $ | 3,614 | ||
| Deferred tax asset net of valuation allowance |
602 | — | ||||
| Other |
5,134 | 7,363 | ||||
| Total |
$ | 10,126 | $ | 10,977 | ||
| 2009 | 2008 | |||||
| Long-term Other Assets |
(In thousands) | |||||
| Deferred tax asset net of valuation allowance |
$ | 3,339 | $ | 802 | ||
| Equity investment |
1,414 | 2,498 | ||||
| Receivable from sale of Optimize product offering |
920 | 875 | ||||
| Other |
1,222 | 607 | ||||
| Total |
$ | 6,895 | $ | 4,782 | ||
In the third quarter of 2008, the Company made an initial investment of $2.5 million for a 16% equity investment in WWC and an option to purchase WWC at a later date. The Company assigned $1.4 million to the 16% equity investment and $1.1 million of the initial investment to the purchase option. In connection with the execution of the Merger Agreement on September 14, 2009, the Company negotiated more favorable terms than the purchase option and also terminated the purchase option. Accordingly, the Company recognized an impairment charge for the $1.1 million carrying value of the purchase option in the third quarter of 2009.
6. Accounts Payable and Accrued Liabilities
Accounts payable and accrued expenses consist of the following at December 31, 2009 and 2008:
| 2009 | 2008 | |||||
| (In thousands) | ||||||
| Accounts payable |
$ | 5,352 | $ | 3,612 | ||
| Accrued compensation |
10,969 | 11,276 | ||||
| Accrued professional fees |
1,511 | 1,907 | ||||
| Accrued income taxes |
1,372 | 760 | ||||
| Accrued liabilities and other |
4,388 | 7,322 | ||||
| Total |
$ | 23,592 | $ | 24,877 | ||
7. Common Stock
On November 19, 2009, the Company completed its offering of 6,500,000 shares of common stock at a price of $20.25 per share. The Company sold 7,475,000 shares including 975,000 shares related to an
84
Table of Contents
TALEO CORPORATION
NOTES TO CONSOLIDATED FINANCIAL STATEMENTS—(Continued)
underwriter’s option to sell additional shares to cover over-allotments of shares. Upon the closing of the offering, the Company received net proceeds of $144.6 million, after deducting underwriting discounts and commissions. Additionally, the Company incurred $0.8 million of other costs in connection with the offering further reducing net proceeds to approximately $143.8 million.
The following describes the Company’s common stock and its stock plans.
Class A Common Stock
Holders of the Class A common stock are entitled to one vote for each share of Class A common stock held.
Class B Common Stock and Exchangeable Shares
In November 1999, the Company entered into an exchangeable share transaction with 9090-5415 Quebec Inc., formerly known as Viasite Inc., a corporation organized under the laws of Quebec, Canada. In connection with this transaction, the Company received 1,000 Class A common shares of 9090-5415 Quebec Inc. for nominal cash consideration. The remaining shares of 9090-5415 Quebec Inc. consist of two classes of non-voting exchangeable shares and one class of preferred voting shares which, although originally issued, were cancelled in January 2000.
The first class consisted of 17,879,362 Class A Preferred Exchangeable Shares (“Common Exchangeables”) entitling the holder to exchange each share for one sixth of a share of the Company’s Class A common stock. The second class consisted of 6,350,400 Class B Preferred Exchangeable Shares (“Preferred Exchangeables”) that entitled the holder to exchange each share for one sixth of a share of the Company’s Series A Preferred Shares.
Upon the closing of the Company’s initial public offering of its Class A Common Stock, the Preferred Exchangeables entitled the holders of these shares to exchange each share for one sixth of a share of the Company’s Class A common stock directly. In addition, holders of all classes of exchangeable shares were party to an agreement which entitles them to the economic equivalent of dividends declared on Class A common stock without requiring them to exchange their shares. However, until the time that such shares are exchanged for the Company’s Class A common stock, amounts associated with the Preferred Exchangeables were classified outside of stockholders equity.
The holders of exchangeable shares also held Class B common stock of the Company. The holders of Class B common stock are entitled to one vote for each share of Class B common stock held and vote as a single class with Class A common stock. The Class B common stock is redeemable for $0.00001 per share at the time that either the Common Exchangeables or Preferred Exchangeables are exchanged for Class A common stock. The redemption feature ensures that holders of exchangeable shares do not get double voting rights following an exchange of their shares, once by virtue of holding class B common shares, and once by virtue of holding class A common shares.
Class B common stock was created in order to allow holders of exchangeable shares the ability to vote as if they had exchanged their exchangeable shares without having to exchange such shares. Holders of Class B common stock are not entitled to any substantive rights, economic or otherwise, as a result of their ownership of Class B common stock without consideration of the exchangeable shares of 9090-5415 Quebec Inc. The holders of all classes of exchangeable shares could elect, or the Company could require them, to exchange their exchangeable shares. During the year ended December 31, 2008, exchangeable shares were exchanged for 655,652 shares of Class A common stock leaving no exchangeable shares exchangeable for Class A common stock in future years. As of December 31, 2009, shares of Class A common stock resulting from the exchange of exchangeable shares totaled 4,038,287.
85
Table of Contents
TALEO CORPORATION
NOTES TO CONSOLIDATED FINANCIAL STATEMENTS—(Continued)
Reserved Shares of Common Stock
On May 28, 2009, the Company’s stockholders approved the adoption of the 2009 Equity Incentive Plan (“EIP”) with a share reserve of 5,200,000. The 2009 EIP also assumes expired, unexercised options and forfeited or reacquired shares granted under the 1999 Stock Plan, 2004 Stock Plan and the 2005 Stock Plan and is currently the only stock plan used for issuance of future equity awards by the Company.
The Company has reserved the following number of shares of Class A common stock as of December 31, 2009 for the awarding of restricted stock awards, release of performance share awards, exercise of stock options and purchases under the employee stock purchase plan:
| Class A Common Stock Plans (excluding the White Amber Stock Option Plan and the Employee Stock Purchase Plan) |
8,370,951 | |
| White Amber Stock Option Plan |
10,263 | |
| Employee Stock Purchase Plan |
555,705 | |
| Total |
8,936,919 | |
Class A Common Stock Plans
As of December 31, 2009, the Company has reserved 8,370,951 shares of authorized but unissued Class A common stock for issuance under five stock plans. Of these shares, 8,029,248 shares were authorized but unissued under the four plans approved by stockholders, and 253,440 were authorized but unissued under a plan approved by the Board of Directors. Options to purchase Class A common stock may be granted to employees, directors, and certain consultants. Options issued prior to May 2009 are subject to the vesting provisions associated with each grant, generally vesting one-fourth on the first anniversary of the grant and ratably thereafter for the following 12 quarters. Options issued subsequent to May 2009 were granted from the EIP. Under the EIP, options are subject to the vesting provisions associated with each grant, and continue to generally vest one-fourth on the first anniversary of the grant, but then vest ratably on a quarterly basis thereafter for the following 12 quarters.
At December 31, 2009, 5,156,083 shares were available for future grants under all five plans. The following table presents a summary of the Class A common stock option activity since January 1, 2007, and related information:
| Number of Options |
Weighted-Average Exercise Price | |||||
| Outstanding — January 1, 2007 |
4,156,114 | $ | 10.52 | |||
| Granted |
969,457 | $ | 17.62 | |||
| Exercised |
(1,349,344 | ) | $ | 6.94 | ||
| Forfeited |
(252,813 | ) | $ | 13.71 | ||
| Outstanding — December 31, 2007 |
3,523,414 | $ | 13.61 | |||
| Granted |
978,327 | $ | 20.66 | |||
| Exercised |
(696,731 | ) | $ | 11.11 | ||
| Forfeited |
(525,748 | ) | $ | 19.30 | ||
| Outstanding — December 31, 2008 |
3,279,262 | $ | 15.33 | |||
| Granted |
337,000 | $ | 14.53 | |||
| Exercised |
(604,024 | ) | $ | 12.30 | ||
| Forfeited |
(286,904 | ) | $ | 21.34 | ||
| Outstanding — December 31, 2009 |
2,725,334 | $ | 15.27 | |||
86
Table of Contents
TALEO CORPORATION
NOTES TO CONSOLIDATED FINANCIAL STATEMENTS—(Continued)
The Company has granted stock options to employees during 2009, 2008, and 2007 at exercise prices greater than or equal to the fair value of the Class A common stock at the time of grant.
During 2001 and 2003, the Company awarded stock options to purchase 2,000 and 27,332 shares, respectively, of Class A common stock to certain of its consultants. The stock options have an exercise price of $3.00 per share and ten year terms from their issue dates. The options issued in 2001 were subject to a vesting period of three years and were fully vested in January 2004. The options issued in 2003 are subject to a vesting period of four years. Of the options issued in 2001, none were exercised in 2009, and 1,000 remain outstanding as of December 31, 2009. Of the options issued in 2003, 1,666 were exercised in 2009 and none remain outstanding as of December 31, 2009.
The following table summarizes stock options outstanding at December 31, 2009:
| Range of Exercise Prices |
Number of Options Outstanding |
Weighted- Average Remaining Contractual Life (Years) |
Number of Options Exercisable | ||||
| $ 3.00 - $11.05 |
277,491 | 5.14 | 183,006 | ||||
| 11.07 - 11.90 |
289,579 | 6.53 | 251,835 | ||||
| 12.00 - 13.50 |
297,334 | 5.83 | 257,935 | ||||
| 13.58 - 14.00 |
346,091 | 5.88 | 342,763 | ||||
| 14.10 - 15.87 |
442,413 | 8.03 | 166,662 | ||||
| 15.92 - 16.72 |
59,457 | 7.41 | 36,940 | ||||
| 17.28 - 17.28 |
286,857 | 8.34 | 104,067 | ||||
| 17.35 - 17.91 |
273,902 | 7.38 | 182,644 | ||||
| 18.00 - 22.86 |
286,698 | 6.06 | 192,600 | ||||
| $23.07 - $30.30 |
165,512 | 7.27 | 98,045 | ||||
| 2,725,334 | 6.76 | 1,816,497 | |||||
| Average exercise price per share |
$ | 14.68 | |||||
The aggregate intrinsic value of options outstanding at December 31, 2009 was $23.0 million. The total intrinsic value of options exercised during fiscal 2009 was $4.7 million. The Company had 2,581,092 options vested or expected to vest over four years with an aggregate value intrinsic value of $21.9 million. As of December 31, 2009, unamortized compensation cost related to Class A common stock options was $6.5 million, net of assumed forfeitures. The cost is expected to be recognized over a weighted-average period of 2.1 years. For stock options, the Company recorded stock-based compensation expense of $5.5 million, $7.4 million and $6.3 million for the years ended December 31, 2009, 2008 and 2007, respectively.
On April 17, 2009, 31,360 exercisable options held by terminated employees of the Company were modified to extend their expiration date to May 30, 2009, which was 30 days after the Company became current with its SEC filing requirements. The modification of these options resulted in an incremental stock-based compensation expense of $47,000 during the second quarter of 2009.
During the second quarter of 2008, two employees were terminated. Upon termination, their stock options and restricted stock awards that were scheduled to vest over the six months following their termination date, vested immediately upon termination. As a result of this accelerated vesting of stock options and restricted stock, the Company recorded shared-based compensation expense of $0.3 million based on the fair value of the stock options and restricted stock on the employee’s termination date using the Black-Scholes valuation model.
87
Table of Contents
TALEO CORPORATION
NOTES TO CONSOLIDATED FINANCIAL STATEMENTS—(Continued)
White Amber Stock Option Plan
The Company has reserved 113,811 shares of authorized but unissued Class A common stock for issuance under a stock option plan (the “White Amber Option Plan”) that was approved by the Board of Directors in 2003, in connection with the acquisition of White Amber. Options to purchase 206,487 shares at $0.78 per share were issued under the White Amber Option Plan in 2003. The fair value of these options was determined to be approximately $0.6 million utilizing the Black-Scholes valuation model, $0.2 million of which was recorded as part of the purchase price of White Amber and the balance of $0.4 million was recorded as deferred stock-based compensation to be amortized over the respective vesting period of the awards. No further issuances may be made from this plan. Options under the White Amber Option Plan have a ten year life, with 3.81 years remaining life as of December 31, 2009.
Options under the White Amber Stock Option Plan are subject to the vesting provisions associated with each grant, and generally calls for 25% vesting upon issuance, with future vesting over defined periods for the remaining shares. The following schedule summarizes the activity relating to the White Amber Option Plan:
| Number of Options |
Weighted- Average Exercise Price | |||||
| Outstanding — January 1, 2007 |
113,811 | $ | 0.78 | |||
| Exercised |
(89,266 | ) | $ | 0.78 | ||
| Outstanding — December 31, 2007 |
24,545 | $ | 0.78 | |||
| Exercised |
(1,500 | ) | $ | 0.78 | ||
| Outstanding — December 31, 2008 |
23,045 | $ | 0.78 | |||
| Exercised |
(12,782 | ) | $ | 0.78 | ||
| Outstanding — December 31, 2009 |
10,263 | $ | 0.78 | |||
At December 31, 2009, the number of options exercisable and the weighted-average exercise price per share of those exercisable options were 10,263 and $0.78, respectively.
The aggregate intrinsic value of the 10,263 fully vested options outstanding at December 31, 2009 related to the White Amber option Plan was $0.2 million. The total intrinsic value of options exercised during fiscal 2009 was $0.2 million.
For the White Amber Stock Option Plan, the Company recorded $0 of stock-based compensation expense for the years ended December 31, 2009, 2008 and 2007.
Restricted Stock and Performance Shares
On May 31, 2006, the Compensation Committee of the Board of Directors of the Company approved a form of restricted stock agreement and a form of performance share agreement for use under the Company’s 2004 Stock Plan pursuant to which the Company has granted restricted stock and performance shares through May 2009, when the Company began to grant restricted stock and performance shares under the EIP. The shares of restricted stock and performance share awards have a per share price of $0.00001 which equals the par value. The Company’s right to repurchase the restricted stock granted to employees lapses in accordance with a four year schedule and the performance shares granted to employees vest in accordance with a four year vesting
88
Table of Contents
TALEO CORPORATION
NOTES TO CONSOLIDATED FINANCIAL STATEMENTS—(Continued)
schedule. Restricted stock and performance shares granted prior to May 2009 were subject to quarterly vesting for the 16 quarters following the grant date. Beginning June 1, 2009, restricted stock and performance shares were granted from the EIP. Under the EIP restricted stock and performance shares generally vest one-fourth on the first anniversary of the grant then quarterly thereafter for the following 12 quarters. The Company’s outside directors, with the exception of the Lead Independent Director of the Company’s Board of Directors, receive 50%, and may elect to receive up to 100%, of their board compensation as restricted stock or performance shares in lieu of cash compensation. The Lead Independent Director of the Company’s Board of Directors may elect to receive his board compensation in any combination of cash and restricted stock. Restricted stock awards to directors made in lieu of cash compensation are granted on the first business day of each quarter and vest on the last day of each quarter. The fair value is measured based upon the closing Nasdaq market price of the underlying Company stock as of the date of grant. The Company uses historical and current data to estimate pre-vesting forfeitures and record share-based compensation expense only for those awards that are expected to vest. Restricted stock and performance share awards are amortized over the period using the straight-line method. The only performance condition for unvested performance shares outstanding as of December 31, 2009 is continued service to the Company. Upon vesting, performance share awards convert into an equivalent number of shares of common stock. As of December 31, 2009, the unamortized compensation cost was $10.4 million, net of assumed forfeitures. The cost is expected to be recognized over a weighted-average period of between 2.1 and 3.4 years. The following table presents a summary of the restricted stock awards and performance share awards for the years ended December 31, 2009, 2008 and 2007.
| Performance Share Awards |
Restricted Stock Awards |
Weighted- Average Grant-Date Fair Value per Share | |||||||
| Repurchasable/nonvested balance — January 1, 2007 |
53,750 | 234,375 | $ | 11.75 | |||||
| Awarded |
2,481 | 58,800 | 17.00 | ||||||
| Released/vested |
(24,356 | ) | (76,606 | ) | 10.56 | ||||
| Forfeited/cancelled |
(3,750 | ) | (16,193 | ) | 11.48 | ||||
| Repurchasable/nonvested balance — December 31, 2007 |
28,125 | 200,376 | 13.77 | ||||||
| Awarded |
29,227 | 440,582 | 18.53 | ||||||
| Released/vested |
(15,984 | ) | (126,505 | ) | 14.25 | ||||
| Forfeited/cancelled |
(2,090 | ) | (81,743 | ) | 15.65 | ||||
| Repurchasable/nonvested balance — December 31, 2008 |
39,278 | 432,710 | 18.12 | ||||||
| Awarded |
468,957 | 273,171 | 14.67 | ||||||
| Released/vested |
(27,421 | ) | (230,318 | ) | 16.09 | ||||
| Forfeited/cancelled |
(13,359 | ) | (8,751 | ) | 22.98 | ||||
| Repurchasable/nonvested balance — December 31, 2009 |
467,455 | 466,812 | $ | 17.01 | |||||
For restricted stock and performance share agreements, the Company recorded $4.6 million, $3.1 million and $1.1 million stock-based compensation expense for the years ended December 31, 2009, 2008 and 2007, respectively.
89
Table of Contents
TALEO CORPORATION
NOTES TO CONSOLIDATED FINANCIAL STATEMENTS—(Continued)
Employee Stock Purchase Plan
At December 31, 2005, the Company reserved shares for future issuance under the ESPP. Stock purchase rights are granted to eligible employees during six month offering periods with purchase dates at the end of each offering period. The offering periods generally commence each May 1 and November 1. Shares are purchased through employees’ payroll deductions, up to a maximum of 10% of employees’ compensation, at purchase prices equal to 85% of the lesser of the fair market value of the Company’s common stock at either the date of the employee’s entrance to the offering period or the purchase date. No participant may purchase more than 10,000 shares per offering or $25,000 worth of common stock in one calendar year. Unamortized compensation cost was $0.4 million at December 31, 2009. This cost is to be recognized over the four months ended April 30, 2010.
| Shares | Purchase Price | |||||
| Reserve for ESPP balance — January 1, 2007 |
435,487 | — | ||||
| Employees purchases |
(143,992 | ) | $ | 11.30 | ||
| ESPP balance — December 31, 2007 |
291,495 | — | ||||
| Employees purchases |
(175,669 | ) | 13.87 | |||
| ESPP balance — December 31, 2008 |
115,826 | — | ||||
| Increase in share reserve |
622,487 | — | ||||
| Employees purchases |
(182,608 | ) | $ | 12.06 | ||
| ESPP balance — December 31, 2009 |
555,705 | — | ||||
For the ESPP, the Company recorded stock-based compensation of $0.9 million for the years ended December 31, 2009 and 2008 and $0.6 million for the year ended December 31, 2007.
Stock-Based Compensation Expense
The following table summarizes the total stock-based compensation expense included in the Consolidated Statements of Operations for years ended December 31, 2009, 2008 and 2007.
| 2009 | 2008 | 2007 | |||||||
| (In thousands) | |||||||||
| Cost of revenues |
$ | 1,842 | $ | 1,525 | $ | 953 | |||
| Sales and marketing |
3,011 | 3,132 | 2,049 | ||||||
| Research and development |
1,516 | 1,465 | 1,391 | ||||||
| General and administrative |
4,660 | 5,311 | 3,579 | ||||||
| $ | 11,029 | $ | 11,433 | $ | 7,972 | ||||
The Company recorded $5.5 million in pre-tax share-based compensation expense for stock options, $4.6 million in share-based compensation expense for restricted stock awards and $0.9 million for purchase rights under the employee stock purchase plan during the year ended December 31, 2009. Additionally, the Company realized $0.3 million in excess tax benefits during the year ended December 31, 2009. As of December 31, 2009, there was $17.3 million in total unrecognized compensation cost, net of assumed forfeitures, related to non-vested share-based compensation arrangements granted under all equity compensation plans.
The Company received $9.6 million, $10.2 million and $11.1 million in cash from option exercises and issuances of stock under the employee stock purchase plan during the years ended December 31, 2009, 2008 and 2007, respectively.
90
Table of Contents
TALEO CORPORATION
NOTES TO CONSOLIDATED FINANCIAL STATEMENTS—(Continued)
Determining Fair Value
The Company estimates the fair value of its stock options granted using the Black-Scholes option valuation model. The Company estimates the expected volatility of common stock at the date of grant based on a combination of the Company’s historical volatility and the volatility of comparable companies, consistent with the standards established by the FASB and the SEC. The Company estimates the expected term consistent with the simplified method identified by the SEC. The Company elected to use the simplified method due to a lack of term length data as the Company completed its initial public offering in October 2005 and its options meet the criteria of the “plain-vanilla” options as defined by the SEC. The simplified method calculates the expected term as the average of the vesting and contractual terms of the award. The dividend yield assumption is based on historical dividend payouts. The risk-free interest rate assumption is based on observed interest rates appropriate for the expected term of employee options. The Company uses historical and current data to estimate pre-vesting option forfeitures and record share-based compensation expense only for those awards that are expected to vest. For options granted, the Company amortizes the fair value on a straight-line basis over the requisite service period of the options which is generally four years.
The weighted-average fair value of options granted is estimated on the date of grant using the Black-Scholes option-pricing model with the following weighted-average assumptions used for share-based payment awards during the years ended December 31, 2009, 2008 and 2007:
| Stock Options |
2009 | 2008 | 2007 | |||
| Expected volatility |
68 to 69% | 53 to 66% | 49 to 51% | |||
| Risk-free interest rate |
1.63 to 2.95 | 1.97 to 3.53% | 3.9 to 5.1% | |||
| Expected life (in years) |
4.75 to 6.25 | 5.5 to 6.25 | 5.5 to 6.25 | |||
| Weighted-average exercise price per share of options granted |
$14.53 | $18.00 | $17.62 | |||
| Weighted-average fair value per share of option granted |
$9.06 | $9.82 | $9.49 | |||
| Expected dividend yield |
0% | 0% | 0% | |||
| Employee Stock Purchase Plan |
2009 | 2008 | 2007 | |||
| Expected volatility |
59 to 78% | 44 to 59% | 44 to 53% | |||
| Risk-free interest rate |
0.17 to 0.29% | 1.07 to 3.49% | 3.49 to 5.09% | |||
| Expected life (in weeks) |
22 to 26 | 26 | 26 | |||
| Expected dividend yield |
0% | 0% | 0% | |||
8. Income Taxes
The domestic and foreign components of income (loss) before provision for income taxes were as follows:
| Year Ended December 31, | |||||||||||
| 2009 | 2008 | 2007 | |||||||||
| (In thousands) | |||||||||||
| Domestic |
$ | (1,288 | ) | $ | (7,228 | ) | $ | 4,668 | |||
| Foreign |
1,428 | 403 | 920 | ||||||||
| Total |
$ | 140 | $ | (6,825 | ) | $ | 5,588 | ||||
91
Table of Contents
TALEO CORPORATION
NOTES TO CONSOLIDATED FINANCIAL STATEMENTS—(Continued)
The provision for income taxes is as follows:
| Year Ended December 31, | ||||||||||
| 2009 | 2008 | 2007 | ||||||||
| (In thousands) | ||||||||||
| Current |
||||||||||
| Federal |
$ | 163 | $ | 313 | $ | 297 | ||||
| State |
666 | 192 | — | |||||||
| Foreign |
155 | 222 | 1,763 | |||||||
| Total |
$ | 984 | $ | 727 | $ | 2,060 | ||||
| Deferred |
||||||||||
| Federal |
$ | (251 | ) | $ | 519 | $ | 675 | |||
| State |
— | — | — | |||||||
| Foreign |
(1,886 | ) | 57 | 348 | ||||||
| Total |
(2,137 | ) | 576 | 1,023 | ||||||
| Total provision (benefit) for income taxes |
$ | (1,153 | ) | $ | 1,303 | $ | 3,083 | |||
A reconciliation of the U.S. federal statutory rate to the effective income tax is as follows:
| 2009 | 2008 | 2007 | |||||||
| Tax (benefit) at federal tax at statutory rate |
34 | % | -34 | % | 34 | % | |||
| State income taxes, net |
53 | % | 1 | % | 8 | % | |||
| U.S. Alternative Minimum Taxes |
0 | % | 0 | % | 3 | % | |||
| Foreign Taxes |
-1,578 | % | 5 | % | 32 | % | |||
| Non-deductible share based payments |
995 | % | 22 | % | 19 | % | |||
| Non-taxable Vurv escrow settlement |
-599 | % | 0 | % | 0 | % | |||
| Non-deductible other expenses |
206 | % | 1 | % | 1 | % | |||
| Unbenefitted losses/valuation allowance |
68 | % | 24 | % | -42 | % | |||
| Total |
-821 | % | 19 | % | 55 | % | |||
92
Table of Contents
TALEO CORPORATION
NOTES TO CONSOLIDATED FINANCIAL STATEMENTS—(Continued)
The components of the Company’s deferred tax assets and liabilities are as follows:
| 2009 | 2008 | |||||||
| (In thousands) | ||||||||
| Deferred tax assets: |
||||||||
| Tax loss carry forwards |
$ | 19,787 | $ | 23,469 | ||||
| Reserves and accruals |
— | 3,068 | ||||||
| Deferred revenue |
6,249 | 7,207 | ||||||
| Alternative Minimum Tax credit |
331 | 331 | ||||||
| Canadian investment credits |
5,863 | 1,666 | ||||||
| Stock based compensation |
3,166 | 3,179 | ||||||
| Other, net |
3,208 | 1,135 | ||||||
| Total deferred tax assets |
$ | 38,604 | $ | 40,055 | ||||
| Deferred tax liabilities: |
||||||||
| Transactional cost study |
$ | (487 | ) | $ | (491 | ) | ||
| Property and equipment |
(1,008 | ) | (1,252 | ) | ||||
| Acquired intangible assets |
(10,787 | ) | (17,067 | ) | ||||
| Reserves and accruals |
(677 | ) | — | |||||
| Total deferred tax liabilities |
$ | (12,959 | ) | $ | (18,810 | ) | ||
| Net deferred tax asset |
$ | 25,645 | $ | 21,245 | ||||
| Valuation allowance |
(21,704 | ) | (19,563 | ) | ||||
| Deferred tax asset, net |
$ | 3,941 | $ | 1,682 | ||||
As of December 31, 2009, the Company has available for future periods U.S. federal and California state tax loss carryforwards of approximately $54.7 million and $5.2 million, respectively, which begin to expire in 2021 and 2015, respectively. In addition, the Company has approximately $12.2 million of loss carryforwards associated with nonqualified stock option excess tax deductions that when realized, will be recorded as an increase to additional paid in capital. As of December 31, 2009, the Company had U.S. federal alternative minimum tax and Canadian federal tax credit carryforwards of approximately $0.3 and $6.0 million, respectively, available to offset future taxable income. The U.S. federal alternative minimum tax credits carryforwards do not expire and the Canadian tax credits begin to expire in 2024. Utilization of the Company’s net operating loss and tax credit carryforwards are subject to annual limitations pursuant to the Internal Revenue Code and similar state provisions. Such an annual limitation could result in the expiration of net operating loss and tax credit carryforwards before utilization.
Deferred income taxes are recorded in accordance with FASB-issued authoritative guidance and are determined based on the differences between financial reporting and the tax basis of assets and liabilities using the tax rates and laws in effect when the differences are expected to reverse. The guidance provides for recognition of deferred tax assets if the realization of such assets is more likely than not to occur. The Company has determined that it is more likely than not that its non-U.S. deferred tax assets and U.S. federal alternative minimum tax credits will be realized. Accordingly, the Company has recorded a net deferred tax asset of $3.9 million and $1.7 million, at December 31, 2009 and 2008, respectively.
Should the Company determine that it is more likely than not that our U.S deferred tax assets will be realized, it will adjust the related valuation allowance and recognize a material decrease to our income tax expense in the period that such determination is made. Significant management judgment is required in determining the period in which the reversal of a valuation allowance should occur. Accordingly, it has
93
Table of Contents
TALEO CORPORATION
NOTES TO CONSOLIDATED FINANCIAL STATEMENTS—(Continued)
determined that it is more likely than not that the U.S. deferred tax assets, excluding U.S. federal alternative minimum tax credits, will not be realized at this time. The Company will continue to evaluate the ability to realize, by jurisdiction, its deferred tax assets on a quarterly basis.
No provision has been made for U.S federal and state income taxes on the undistributed earnings of approximately $4.3 million relating to the Company’s foreign subsidiaries as such earnings are expected to be reinvested and are considered permanent in duration. If these earnings were ultimately distributed to the U.S. in the form of dividends or otherwise, or if the shares of the subsidiaries were sold or transferred, the Company would likely be subject to additional U.S. income taxes, net of the impact of any available foreign tax credits. It is not practicable to estimate the additional income taxes related to permanently reinvested earnings in the subsidiaries.
Effective January 1, 2007, the Company adopted the provisions of FASB-issued authoritative guidance to the accounting for uncertain tax positions.
A reconciliation of the beginning and ending amounts of uncertain tax benefits are as follows:
| Uncertain Tax Benefits | ||||||||||||
| (In millions) | ||||||||||||
| 2009 | 2008 | 2007 | ||||||||||
| Uncertain tax benefits at January 1, |
$ | 6.5 | $ | 6.9 | $ | 5.2 | ||||||
| Increases for uncertain tax benefits in current year |
— | 2.0 | 2.3 | |||||||||
| Increases for uncertain tax benefits of prior years |
0.8 | — | ||||||||||
| Decreases for uncertain tax benefits of prior years |
(1.2 | ) | (2.4 | ) | — | |||||||
| Settlements |
— | (0.8 | ) | (0.6 | ) | |||||||
| Lapse of statute of limitations |
(0.2 | ) | — | — | ||||||||
| Uncertain tax benefits at December 31, |
$ | 5.1 | $ | 6.5 | $ | 6.9 | ||||||
The Company recognizes interest and penalties related to uncertain tax positions in income tax expense. At December 31, 2009, accrued interest expense related to uncertain tax positions was less than $0.1 million. Approximately $4.5 million of the unrecognized tax benefit balance of $5.1 million as of December 31, 2009 would affect income tax expense if recognized. The remaining unrecognized tax benefits are subject to a full valuation allowance and, thus, if recognized will not affect the annual effective tax rate. As the Company has net operating loss carryforwards for U.S. federal and state purposes, the statute of limitation remains open for all tax years to the extent the tax attributes are carried forward into future tax years. With few exceptions, the Company is no longer subject to foreign income tax examinations by tax authorities for years before 2002.
In December 2008, the Company was notified by the federal Canada Revenue Agency (“CRA”) of their intention to audit tax years 2003 through 2007. CRA has issued proposed assessment notices for tax years 2002 and 2003 seeking increases to taxable income of CAD $3.8 million and CAD $6.9 million, respectively. These adjustments relate, principally, to the treatment of refundable Canadian Development Technology Incentives (“CDTI”) tax credits and income and expense allocations recorded between the Company and its Canadian subsidiary. The Company disagrees with the CRA’s basis for these adjustments and intends to appeal their decision through applicable administrative and judicial procedures.
There could be a significant impact to the Company’s uncertain tax positions over the next twelve months depending on the outcome of any audit. The Company anticipates it is reasonably possible that unrecognized tax benefits will decrease by less than $0.1 million relating to expiring statutes of limitations by the end of 2010.
94
Table of Contents
TALEO CORPORATION
NOTES TO CONSOLIDATED FINANCIAL STATEMENTS—(Continued)
9. Commitments and Contingencies
Operating Leases — The Company leases office space and has operating leases for computer equipment and third-party facilities that host its applications. Rental expenses under these agreements for the years ended December 31, 2009, 2008, and 2007 were approximately $9.7 million, $6.1 million, and $7.9 million, respectively.
Software Contracts — The Company has entered into software license and maintenance agreements for database software used in the production environment. Total payments related to these agreements are included in the software contract column below.
Capital Leases — See Note 4 “Property and Equipment” for additional information regarding capital leases.
The minimum non-cancelable scheduled payments under these agreements at December 31, 2009 are as follows:
| Operating Leases | ||||||||||||||||||||||
| Equipment Leases |
Facility Leases |
Third Party Hosting Facilities |
Total Operating Leases |
Software Contracts |
Capital Leases(1) |
Total | ||||||||||||||||
| (In thousands) | (In thousands) | (In thousands) | (In thousands) | |||||||||||||||||||
| 2010 |
$ | 90 | $ | 2,318 | $ | 1,282 | $ | 3,690 | $ | 3,923 | $ | 429 | $ | 8,042 | ||||||||
| 2011 |
59 | 1,793 | 391 | 2,243 | 1,425 | 66 | 3,734 | |||||||||||||||
| 2012 |
— | 1,634 | 126 | 1,760 | 53 | 41 | 1,854 | |||||||||||||||
| 2013 |
— | 671 | 11 | 682 | 4 | 6 | 692 | |||||||||||||||
| 2014 |
— | 156 | — | 156 | — | — | 156 | |||||||||||||||
| Total |
$ | 149 | $ | 6,572 | $ | 1,810 | $ | 8,531 | $ | 5,405 | $ | 542 | $ | 14,478 | ||||||||
| Less amounts representing interest |
(23 | ) | ||||||||||||||||||||
| Present value of minimum lease payments |
$ | 519 | ||||||||||||||||||||
| Less current portion |
(412 | ) | ||||||||||||||||||||
| Noncurrent portion |
$ | 107 | ||||||||||||||||||||
| (1) | amount includes interest. |
Litigation — Kenexa Litigations — Kenexa BrassRing, Inc., (“Kenexa”) filed suit against the Company in the United States District Court for the District of Delaware on August 27, 2007. Kenexa alleges that the Company infringed Patent Nos. 5,999,939 and 6,996,561, and seeks monetary damages and an order enjoining the Company from further infringement. The Company answered Kenexa’s complaint on January 28, 2008. On May 9, 2008, Kenexa filed a similar lawsuit against Vurv Technology, Inc. (now known as Vurv Technology LLC) (“Vurv”) in the United States District Court for the District of Delaware, alleging that Vurv has infringed Patent Nos. 5,999,939 and 6,996,561, and seeking monetary damages and an order enjoining further infringement. Vurv answered Kenexa’s complaint on May 29, 2008. The Company acquired Vurv on July 1, 2008. The Company’s management has reviewed these matters and believes that neither the Company’s nor Vurv’s software products infringe any valid and enforceable claim of the asserted patents. The Company has engaged in settlement discussions with Kenexa, but no settlement agreement has been reached. Litigation is ongoing with respect to these matters.
95
Table of Contents
TALEO CORPORATION
NOTES TO CONSOLIDATED FINANCIAL STATEMENTS—(Continued)
On June 30, 2008, the Company filed a reexamination request with the United States Patent and Trademark Office (“USPTO”), seeking reconsideration of the validity of Patent No. 6,996,561 based on prior art that the Company presented with the Company’s reexamination request. Finding that the Company’s reexamination request raised a “substantial new question of patentability,” the USPTO ordered reexamination of Patent No. 6,996,561 on September 5, 2008. On November 13, 2008, the USPTO issued an office action rejecting all of the claims of Patent No. 6,996,561 because they are either anticipated by or unpatentable over the prior art. After comments by both parties to the reexamination, on June 4, 2009 the USPTO issued a subsequent action standing by its determination that certain claims of Patent No. 6,996,561 are unpatentable, but indicating patentability of other claims. Both parties have since provided additional comments on this subsequent action and both parties have since filed notices of their intention to appeal elements of the reexamination to the USPTO’s Board of Patent Appeals and Interferences. Accordingly, the USPTO’s reexamination of Patent No. 6,996,561 is ongoing.
In a separate action filed on June 25, 2008 in the United States District Court for the District of Delaware, Kenexa’s parent, Kenexa Technology, Inc. (“Kenexa Technology”), asserted claims against the Company for tortious interference with contract, unfair competition, unfair trade practices, and unjust enrichment arising from the Company’s refusal to allow Kenexa Technology employees to access and use the Company’s proprietary applications to provide outsourcing services to a Taleo customer. Kenexa Technology seeks monetary damages and injunctive relief. The Company answered Kenexa Technology’s complaint on July 23, 2008. On October 16, 2008, the Company amended its answer and filed counterclaims against Kenexa Technology, alleging copyright infringement, misappropriation of trade secrets, interference with contractual relations, and unfair competition arising from Kenexa’s unauthorized access and use of the Taleo products in the course of providing outsourcing services to the Company’s customers, and seeking declaratory judgment, monetary damages, and injunctive relief. The Company filed a motion to dismiss Kenexa’s claims on July 21, 2009 and a motion for preliminary injunction to enjoin Kenexa employees from accessing the Company’s solutions deployed at joint customers of both companies on July 22, 2009. These motions are pending before the Court and this matter is ongoing.
On November 7, 2008, Vurv sued Kenexa, Kenexa Technology, and two of Vurv’s former employees (who now work for Kenexa and/or Kenexa Technology) in the United States District Court for the Northern District of Georgia. In this action, Vurv asserts claims for breach of contract, computer theft, misappropriation of trade secrets, tortious interference, computer fraud and abuse, and civil conspiracy. The defendants answered Vurv’s complaint on December 12, 2008 without asserting any counterclaims. This matter is ongoing.
On July 17, 2009, Kenexa and Kenexa Recruiter (together, the “Kenexa Plaintiffs”) filed suit against Taleo, a current Taleo employee and a former Taleo employee in Massachusetts Superior Court (Middlesex County). The Kenexa Plaintiffs amended the complaint on August 27, 2009 and added Vurv Technology LLC, two former employees of Taleo and two current employees of Taleo. The Kenexa Plaintiffs assert claims for breach of contract and the implied covenant of good faith and fair dealing, unfair trade practices, computer theft, misappropriation of trade secrets, tortious interference, unfair competition, unjust enrichment, computer fraud and abuse. Vurv removed the complaint to the United States District Court for the District of Massachusetts and Taleo and Vurv, along with two other defendants, answered the complaint on October 5, 2009. Additionally, four other defendants (current and former employees of Taleo) moved to dismiss for lack of jurisdiction on October 5 and October 26, 2009. The Kenexa Plaintiffs did not oppose the motion to dismiss for two of these four defendants, and the motion pertaining to the other two defendants is pending before the court and the matter is ongoing.
Securities Claims — On November 14, 2008, following the announcement that the Company was re-evaluating certain of the Company’s historical and then current accounting practices, a shareholder class action lawsuit entitled Brett Johnson v. Taleo Corporation, Michael Gregoire, Katy Murray, and Divesh
96
Table of Contents
TALEO CORPORATION
NOTES TO CONSOLIDATED FINANCIAL STATEMENTS—(Continued)
Sisodraker, CV-08-5182 SC, was filed in the United States District Court for the Northern District of California. The complaint alleged violations of §10(b) of the Exchange Act and SEC Rule 10b-5. The Johnson lawsuit was dismissed without prejudice on December 22, 2008. On December 17, 2008, a second substantially similar shareholder lawsuit entitled Terrence Popyk v. Taleo Corporation, Michael Gregoire, Katy Murray, and Divesh Sisodraker, CV 08-5634 PH, was filed in the Northern District of California; the Popyk lawsuit was dismissed without prejudice on January 20, 2009. On January 13, 2009, a third shareholder lawsuit entitled Scott Stemper v Taleo Corporation, Michael Gregoire, Katy Murray, and Divesh Sisodraker, CV 09-0151 JSW, was filed in the United States District Court for the Northern District of California. On February 9, 2009, the court renamed the Stemper action “In re Taleo Corporation Securities Litigation” and appointed the Greater Pennsylvania Carpenter’s Pension Fund as lead plaintiff (the “Plaintiff”). On June 15, 2009, the Plaintiff filed an amended complaint naming Taleo Corporation, Michael Gregoire, Katy Murray, and Divesh Sisodraker as defendants (the “Amended Complaint”).
The Amended Complaint alleges that defendants engaged in securities fraud in violation of §10(b) of the Exchange Act and SEC Rule 10b-5. The fraud allegations include a failure to apply GAAP in the reporting of quarterly and annual financial statements and securities prospectuses from the time of the Company’s initial public offering to recent filings with the SEC. The complaint seeks an unspecified amount of damages on behalf of a purported class of individuals or institutions who purchased or acquired shares of the Company’s common stock between September 29, 2005 and November 12, 2008. In response to the Amended Complaint, the defendants filed a motion to dismiss the lawsuit on July 31, 2009. On February 17, 2010, the Court granted defendants’ motion and dismissed the Amended Complaint. The Court also granted Plaintiff leave to amend and gave Plaintiff until March 12, 2010 to file a second amended complaint. A case management conference is currently set for May 14, 2010.
Other Matters — In addition to the matters described above, the Company is subject to various claims and legal proceedings that arise in the ordinary course of its business from time to time, including claims and legal proceedings that have been asserted against the Company by customers, former employees and advisors and competitors. The Company has accrued for estimated losses in the accompanying consolidated financial statements for matters where the Company believes the likelihood of an adverse outcome is probable and the amount of the loss is reasonably estimable. Based on currently available information, the Company’s management does not believe that the ultimate outcome of these unresolved matters, individually or in the aggregate, is likely to have a material adverse effect on the Company’s financial position or results of operations. However litigation is subject to inherent uncertainties and the Company’s views on these matters may change in the future. Were an unfavorable outcome to occur in any one or more of those matters or the matters described above, over and above the amount, if any, that has been estimated and accrued in the Company’s consolidated financial statements, it could have a material adverse effect on the Company’s business, financial condition, results of operations and/or cash flows in the period in which the unfavorable outcome occurs or becomes probable, and potentially in future periods.
10. Employee Benefit Plans
The Company maintains a 401(k) profit-sharing plan (the “401(k) Plan”) covering substantially all U.S. employees. Pursuant to the 401(k) Plan, the Company may elect to match employee contributions to the 401(k) Plan, not to exceed 6% of an employee’s compensation. The Company made no such election to match contributions to the 401(k) Plan for the year ended December 31, 2007. Effective January 1, 2008, the Company instituted a 401(k) matching program with the following specifics: (i) for employee contributions to the 401(k) Plan of up to 4% of each employee’s base salary up to a maximum of $245,000 the year ended December 31, 2009, the Company will match such employee contributions at a rate of $0.50 for every $1.00 contributed by the
97
Table of Contents
TALEO CORPORATION
NOTES TO CONSOLIDATED FINANCIAL STATEMENTS—(Continued)
employee; and (ii) the Company 401(k) matching program has a three year vesting period. The Company recorded $0.8 million and $0.4 million in employee related costs during the twelve months ended December 31, 2009 and 2008, respectively, as a result of the adoption of this program.
11. Other Income
| Year Ended December 31, 2009 |
||||
| (In thousands) | ||||
| Settlement of Vurv escrow account |
$ | 2,471 | ||
| Worlwide Compensation purchase option write-off |
(1,084 | ) | ||
| Other Income |
$ | 1,387 | ||
In 2009, the Company settled the Vurv escrow account with the former shareholders of Vurv and received 111,167 shares of the Company’s Class A common stock valued at $2.5 million based on a market price per share of $22.23 on the settlement date, November 11, 2009. The $2.5 million value of the shares was recorded as other income during the fourth quarter of 2009. See Note 2 “Business Combinations and Dispositions”.
In the third quarter of 2008, the Company made an initial investment of $2.5 million for a 16% equity investment in WWC and an option to purchase WWC at a later date. The Company assigned $1.4 million to the 16% equity investment and $1.1 million of the initial investment to the purchase option. In connection with the execution of the Merger Agreement on September 14, 2009, the Company negotiated more favorable terms than the purchase option and also terminated the purchase option. Accordingly, the Company wrote-off the $1.1 million carrying value of the purchase option in the third quarter of 2009.
12. Net Income/(Loss) Per Share
Basic and diluted net income (loss) per common share is calculated by dividing the net loss applicable to common stockholders by the weighted-average number of Class A common shares outstanding during the period. Given that the Class B common shares do not have any economic rights, the Company has determined that basic earnings per share should be calculated based only on the outstanding Class A common shares. Diluted net loss per common share is the same as basic net loss per common share, since the effects of potentially dilutive securities are antidilutive. However, during periods of net income, earnings per share is based on outstanding Class A common shares and exchangeable shares, since the latter are participating securities, but have no legal requirement to fund losses. Class B common shares are non-participating in periods of net income or net losses and as a result have no attribution of earnings or losses for the purposes of calculating earnings per share. Exchangeable shares, stock options, and warrants are included only if they are dilutive. These securities aggregated on a weighted-average share basis to 899,685, 3,823,137, and 4,661,113 for the years ended December 31, 2009, 2008, and 2007, respectively. They were not included in the diluted net loss per common share for the year ended December 31, 2008 since they were antidilutive for that period.
98
Table of Contents
TALEO CORPORATION
NOTES TO CONSOLIDATED FINANCIAL STATEMENTS—(Continued)
A summary of the loss or earnings applicable to each class of common shares is as follows:
| 2009 | 2008 | 2007 | ||||||||||||||
| Class A Common |
Class B Common(1) |
Class A Common |
Class B Common(1) |
Class A Common |
Class B Common(1) | |||||||||||
| (In thousands, except per share data) | ||||||||||||||||
| Allocation of net income/(loss) |
$ | 1,293 | — | $ | (8,128 | ) | — | $ | 2,505 | — | ||||||
| Weighted-average shares outstanding — basic |
31,507 | — | 27,569 | 455 | 24,116 | 1,108 | ||||||||||
| Weighted-average shares outstanding — diluted |
32,406 | — | 27,569 | 455 | 28,777 | 1,874 | ||||||||||
| Net income/(loss) per share — basic |
$ | 0.04 | — | $ | (0.29 | ) | — | $ | 0.10 | — | ||||||
| Net income/(loss) per share — diluted |
$ | 0.04 | — | $ | (0.29 | ) | — | $ | 0.09 | — | ||||||
| (1) | Class B common shares are non-participating in periods of net income or net losses and as a result have no attribution of earnings or losses for the purposes of calculating earnings per share. The corresponding exchangeable shares, discussed at Note 7. “Common Stock”, are participating securities but have no legal requirement to fund such losses, making them antidilutive for 2008. |
Effective for interim and annual periods beginning after December 15, 2008, and applied retrospectively, the FASB issued an accounting standard that requires use of the two-class method to calculate earnings per share when non-vested restricted stock awards are eligible to receive dividends (i.e., participating securities), even if the Company does not intend to declare dividends. Although the Company’s unvested restricted stock awards are eligible to receive dividends, they are not significant as compared with total weighted average diluted shares outstanding and there is no impact on the Company’s earnings per share calculation in applying the two-class method.
13. Segment and Geographic Information, International Operations, and Customer Concentrations
The Company reports information about operating segments in its annual financial statements and selected information about operating segments in its interim financial reports issued to stockholders. Operating segments are defined as components of an enterprise about which separate financial information is available that is evaluated regularly by the chief operating decision maker, or decision making group, in deciding how to allocate resources and in assessing performance. The Company’s chief operating decision maker is the Chief Executive Officer of the Company.
The Company is organized geographically and by line of business and based on this the Company has identified two major line of business operating segments: application and consulting services.
The application line of business is engaged in the development, marketing, hosting and support of the Company’s software applications. The consulting services line of business offers implementation, business process reengineering, change management, and education and training services.
The accounting policies of the line of business operating segments are the same as those described in the summary of significant accounting policies. The Company does not evaluate assets or capital expenditures by operating segments. Consequently, it is not practical to show assets, capital expenditures, depreciation or amortization by operating segment.
99
Table of Contents
TALEO CORPORATION
NOTES TO CONSOLIDATED FINANCIAL STATEMENTS—(Continued)
The following table presents a summary of operating segments:
| Application | Consulting | Total | |||||||
| (In thousands) | |||||||||
| 2009 |
|||||||||
| Revenue based on Taleo contracting entity |
$ | 173,495 | $ | 24,917 | $ | 198,412 | |||
| Contribution margin(1) |
$ | 97,170 | $ | 303 | $ | 97,473 | |||
| 2008 |
|||||||||
| Revenue based on Taleo contracting entity |
$ | 138,628 | $ | 29,791 | $ | 168,419 | |||
| Contribution margin(1) |
$ | 75,258 | $ | 4,522 | $ | 79,780 | |||
| 2007 |
|||||||||
| Revenue based on Taleo contracting entity |
$ | 105,032 | $ | 23,038 | $ | 128,070 | |||
| Contribution margin(1) |
$ | 59,193 | $ | 4,940 | $ | 64,133 | |||
| (1) | Contribution margins equals gross profit minus research and development expenses. The Contribution margins reported reflect only the expenses of the line of business and do not represent the actual margins for each operating segment since they do not contain an allocation for selling and marketing, general and administrative, and other corporate expenses incurred in support of the line of business. |
Profit Reconciliation
| Year Ended December 31, | ||||||||||||
| 2009 | 2008 | 2007 | ||||||||||
| (In thousands) | ||||||||||||
| Contribution margin for reportable segments |
$ | 97,473 | $ | 79,780 | $ | 64,133 | ||||||
| Sales and marketing |
(65,731 | ) | (53,827 | ) | (37,172 | ) | ||||||
| General and administrative |
(33,152 | ) | (32,382 | ) | (24,281 | ) | ||||||
| Restructuring charges |
— | (1,914 | ) | — | ||||||||
| Interest and other income, expense, net |
1,550 | 1,518 | 2,908 | |||||||||
| Income (loss) before provision for income taxes |
$ | 140 | $ | (6,825 | ) | $ | 5,588 | |||||
100
Table of Contents
TALEO CORPORATION
NOTES TO CONSOLIDATED FINANCIAL STATEMENTS—(Continued)
Geographic Information:
Revenue attributed to a country or region includes sales to multinational organizations and is based on the country of location of the Taleo legal entity that is the contracting party. The Company’s U.S. entity is the contracting party for all sales agreements in the United States and the Company’s Canadian entity is the contracting party for all Taleo Enterprise sales agreements in Canada. Prior to January 1, 2005, certain of the Company’s subsidiaries outside of North America were the contracting parties for sales transactions within their regions. After January 1, 2005, the Company’s U.S. entity has been the contracting party for all new sales agreements and renewals of existing sales agreements entered into with customers outside of North America. Revenues and assets and by legal contracting entity by region are as follows:
| United States | Canada | Europe | Other | Total | |||||||||||
| (In thousands) | |||||||||||||||
| Year ended December 31, 2009 — |
|||||||||||||||
| Revenues |
$ | 191,288 | $ | 7,036 | $ | 16 | $ | 72 | $ | 198,412 | |||||
| Assets |
$ | 430,371 | $ | 20,179 | $ | 5,099 | $ | 728 | $ | 456,377 | |||||
| Year ended December 31, 2008 — |
|||||||||||||||
| Revenues |
$ | 159,860 | $ | 7,919 | $ | 403 | $ | 237 | $ | 168,419 | |||||
| Assets |
$ | 263,268 | $ | 15,177 | $ | 4,304 | $ | 440 | $ | 283,189 | |||||
| Year ended December 31, 2007 — |
|||||||||||||||
| Revenues |
$ | 119,651 | $ | 6,795 | $ | 922 | $ | 702 | $ | 128,070 | |||||
| Assets |
$ | 143,945 | $ | 17,946 | $ | 2,371 | $ | 559 | $ | 164,821 | |||||
The geographic mix of application revenue based on the region of location of the customer’s contracting entity was as follows:
| Year Ended December 31, | |||||||||
| 2009 | 2008 | 2007 | |||||||
| United States |
81 | % | 83 | % | 85 | % | |||
| Canada |
4 | % | 5 | % | 6 | % | |||
| Europe |
11 | % | 8 | % | 6 | % | |||
| Rest of the world |
4 | % | 4 | % | 3 | % | |||
| 100 | % | 100 | % | 100 | % | ||||
Due to the nature of consulting services revenue recognition, it is impracticable to determine revenue by location of the customer.
During the years ended December 31, 2009, 2008, and 2007 there was no customer that individually represented greater than 10% of the Company’s total revenue, and at December 31, 2009 and 2008, no customer represented greater than 10% of the Company’s accounts receivable.
All goodwill and intangible assets for all reported years are located in the United States. Goodwill for all reported years relates to the applications reporting unit.
101
Table of Contents
TALEO CORPORATION
NOTES TO CONSOLIDATED FINANCIAL STATEMENTS—(Continued)
14. Severance and Exit Costs
Restructuring
During the second quarter of 2008, the Company initiated a restructuring plan (the “Plan”) to reorganize the Company as a result of the Vurv acquisition. The Plan was completed in the fourth quarter of 2008 and resulted in the termination of approximately 34 persons throughout the organization and the closure of certain U.S. and international facilities. During the year ended December 31, 2008 the Company incurred severance and facility closure expense of $1.9 million. No restructuring expense was incurred during the year ended December 31, 2009.
At December 31, 2009, the Company had no future liability related to restructuring charges in its consolidated balance sheet. The Company records a liability for restructuring costs when it has a payment obligation to an employee or external part
| Severance | Facility closure | Total liability |
|||||||||
| (In thousands) | |||||||||||
| Restructuring expense |
|||||||||||
| Liability at January 1, 2009 |
$ | 271 | $ | — | $ | 271 | |||||
| Cash payments in the first quarter of 2009 |
(271 | ) | — | (271 | ) | ||||||
| Liability at December 31, 2009 |
$ | — | $ | — | $ | — | |||||
Exit Cost — San Francisco Lease
During July 2006, the Company moved its corporate offices from San Francisco, California to Dublin, California. As a result of this relocation, the Company has recorded a provision for the exit from the San Francisco facility. As a part of this provision, the Company has taken into account that on October 19, 2006, it entered into an agreement to sublease its San Francisco facility, consisting of approximately 12,000 square feet. The total cost associated with the exit from the San Francisco facility was $0.4 million. As of December 31, 2009, the sublease and lease had expired and no future cash payments remain to be made related to this lease. Additionally, no expense was recorded for the San Francisco facility during the year ended December 31, 2009.
| Lease payments |
Sublease rental income |
Net liability | ||||||||||
| (In thousands) | ||||||||||||
| Liability for the Remaining Net Lease Payments for the San Francisco Facility |
||||||||||||
| Liability at January 1, 2009 |
$ | 227 | $ | (170 | ) | $ | 57 | |||||
| Cash receipts / (payments) |
(227 | ) | 170 | (57 | ) | |||||||
| Liability at December 31, 2009 |
$ | — | $ | — | $ | — | ||||||
102
Table of Contents
TALEO CORPORATION
NOTES TO CONSOLIDATED FINANCIAL STATEMENTS—(Continued)
| Costs Associated with the Exit from the San Francisco Facility |
Amount | |||
| (In thousands) | ||||
| Establishment of initial net liability for net lease payments at July 2006 |
$ | 469 | ||
| Reversal of accrued rent from original lease |
(237 | ) | ||
| Adjustment for tenant inducements from original lease |
(102 | ) | ||
| Write-off of fixed assets |
205 | |||
| Commissions and legal costs |
79 | |||
| Total cumulative exit expense |
$ | 414 | ||
Transition of Time and Expense Services Processing
As a result of the Company’s decision in 2007 to discontinue the time and expense processing services related to its Taleo Contingent solution, there were a total of approximately 38 full time positions that could have been terminated as part of this transition, which was completed in August 2008. As of the completion date, 34 positions were terminated and 4 were reassigned to other departments. If an employee was terminated and remained employed through the transition date, the terminated employee was entitled to an exit package. The total liability for exit packages of $0.7 million has been paid. No exit cost was incurred during the year ended December 31, 2009. Total costs for each of the years ended December 31, 2008 and 2007 was $0.1 million and $0.6 million, respectively. These costs were recorded as an operating expense.
15. Selected Quarterly Financial Data (Unaudited)
Selected summarized quarterly financial information for the years ended December 31, 2009 and 2008 is as follows:
| 2009 | 1st Quarter |
2nd Quarter |
3rd Quarter |
4th Quarter |
Fiscal Year |
||||||||||||||
| (In thousands, except per share data) |
|||||||||||||||||||
| Revenue |
$ | 48,083 | $ | 49,093 | $ | 50,736 | $ | 50,500 | $ | 198,412 | |||||||||
| Gross profit |
32,125 | 32,195 | 33,934 | 34,066 | 132,320 | ||||||||||||||
| Operating income (loss) |
(1,948 | ) | (1,516 | ) | 301 | 1,753 | (1,410 | ) | |||||||||||
| Net income (loss) |
(2,085 | ) | (113 | ) | (1,102 | ) | 4,593 | 1,293 | |||||||||||
| Net income (loss) attributable to Class A common stockholders per share — basic |
$ | (0.07 | ) | $ | (0.00 | ) | $ | (0.04 | ) | $ | 0.13 | $ | 0.04 | ||||||
| Net income (loss) attributable to Class A common stockholders per share — diluted |
$ | (0.07 | ) | $ | (0.00 | ) | $ | (0.04 | ) | $ | 0.13 | $ | 0.04 | ||||||
| Weighted average Class A common shares outstanding —basic |
30,262 | 30,417 | 30,883 | 34,425 | 31,507 | ||||||||||||||
| Weighted average Class A common shares outstanding —diluted |
30,262 | 30,417 | 30,883 | 35,594 | 32,406 | ||||||||||||||
103
Table of Contents
TALEO CORPORATION
NOTES TO CONSOLIDATED FINANCIAL STATEMENTS—(Continued)
| 2008 | 1st Quarter |
2nd Quarter |
3rd Quarter |
4th Quarter |
Fiscal Year |
|||||||||||||||
| (In thousands, except per share data) |
||||||||||||||||||||
| Revenue |
$ | 35,830 | $ | 37,902 | $ | 46,646 | $ | 48,041 | $ | 168,419 | ||||||||||
| Gross profit |
23,804 | 25,910 | 29,535 | 31,525 | 110,774 | |||||||||||||||
| Operating income |
(518 | ) | (863 | ) | (5,548 | ) | (1,414 | ) | (8,343 | ) | ||||||||||
| Net income (loss) |
518 | (217 | ) | (5,906 | ) | (2,523 | ) | (8,128 | ) | |||||||||||
| Net income (loss) attributable to Class A common stockholders per share — basic |
$ | 0.02 | $ | (0.01 | ) | $ | (0.20 | ) | $ | (0.08 | ) | $ | (0.29 | ) | ||||||
| Net income (loss) attributable to Class A common stockholders per share — diluted |
$ | 0.02 | $ | (0.01 | ) | $ | (0.20 | ) | $ | (0.08 | ) | $ | (0.29 | ) | ||||||
| Weighted average Class A common shares outstanding — basic |
25,369 | 25,708 | 29,388 | 29,805 | 27,569 | |||||||||||||||
| Weighted average Class A common shares outstanding — diluted |
28,899 | 25,708 | 29,388 | 29,805 | 27,569 | |||||||||||||||
Net income (loss) attributable to Class A common stockholder per share – basic and diluted for the four quarters of each fiscal year may not sum to the total for the fiscal year because of the different number of shares outstanding during each period.
16. Subsequent Events
The Company closed the transaction to purchase Worldwide Compensation Inc. on January 1, 2010. See Note 2. “Business Combination and Dispositions”.
17. Restatement
Previously Restated Consolidated Financial Statements for the fiscal years ended December 31, 2008 and 2007
The Company’s current Annual Report on Form 10-K contains financial information related to the fiscal years ended December 31, 2008 and 2007 which reflect previously restated financial information. The Company’s Annual Report on Form 10-K for the fiscal year ended December 31, 2008, originally filed with the Securities and Exchange Commission (“SEC”) on April 30, 2009 (the “Original Filing”) reflected a restatement related to revenue recognition (the “Restatement — Revenue Recognition”) and was subsequently amended on Form 10-K/A filed on October 27, 2009 (“Amended Filing”) to reflect the restatement that resulted from management’s determination subsequent to the issuance of the Company’s financial statements for the fiscal year ended December 31, 2008 that there was an error in its accounting for stock-based compensation expense (the “Restatement — Stock-based Compensation”). These previously reported restatements impacted the financial information included in the Company’s current Annual Report on Form 10-K with respect to the years ended December 31, 2008, and 2007 and as of December 31,2008.
Restatement — Revenue Recognition
Subsequent to the issuance of the Company’s 2007 consolidated financial statements, the Company, under the direction of its Audit Committee, re-evaluated its historical and then-current practices with respect to the timing for recognition of application and consulting revenues in accordance with accounting principles generally accepted in the United States and determined that recognition of consulting revenue as a separate unit of accounting in a multi-element arrangement was not appropriate in certain of its customer arrangements in which
104
Table of Contents
TALEO CORPORATION
NOTES TO CONSOLIDATED FINANCIAL STATEMENTS—(Continued)
application services and consulting services were sold in the same arrangement. The impact of this previously restated correction and other items is described below. The after tax effect to originally reported net income of all adjustments for the year ended December 31, 2007 was to decrease net income by $0.1 million.
Findings from the Company’s review of revenue recognition practices
Consulting Revenue—In the course of its review of revenue recognition practices, the Company determined that recognition of consulting revenue as a separate unit of accounting in a multi-element arrangement, as required under accounting guidance, was not appropriate in certain of its customer arrangements in which application services and consulting services were sold in the same arrangement. The Company determined that consulting revenue should have been recognized ratably over the term of the application services agreement (typically three years) versus the Company’s historical practice of recognizing such revenue as delivered or on the basis of proportional performance. The effect of correcting this matter as part of this Revenue Recognition Restatement was to reduce originally reported revenue by $0.1 million the year ended December 31, 2007.
Set-up Fees—Also in connection with the Company’s review, the Company determined that it should recognize revenue from set-up fees, an element of the Company’s application revenue, over the expected customer life of the arrangement versus the Company’s historical practice of recognizing such revenue over the term of the application services agreement. The effect of correcting this matter as part of this Revenue Recognition Restatement was to reduce originally reported revenue by less than $0.1 million for the year ended December 31, 2007.
Each of the corrections described above affect the timing of revenue but not the total amount of revenue ultimately to be recorded by the Company.
Other Adjustments
In addition to the revenue items described above, the Company also made other, less significant corrections, including certain corrections that had been previously identified but not recorded because they were not material, individually or in the aggregate, to the Company’s consolidated financial statements. The effect of correcting these other adjustments as part of this Revenue Recognition Restatement was to increase previously reported pre-tax income by $0.5 million for the year ended December 31, 2007.
Adjustments were made to income tax expense as a result of the adjustments described above to income before taxes, and in 2007 also reflects an adjustment to increase income tax expense and decrease goodwill by $0.7 million related to the utilization of net operating loss carryforwards from acquisitions as part of the Revenue Recognition Restatement.
In addition, as part of Revenue Recognition Restatement, the Statement of Cash Flows for the year ended December 31, 2007, reflects reclassifications made to correct presentation of certain activity related to stock-based employee incentive programs and has corrected for certain other minor items.
The corrections described above generally affect the timing of revenue and expense. As such, they do not change the cumulative revenues, expenses, pre-tax operating income, liquidity or cash flow of the Company.
Restatement—Stock-based Compensation
In October 2009, the Company identified an error in its accounting for stock-based compensation expense after upgrading to a new version of the equity program administration software that the Company licenses from a
105
Table of Contents
TALEO CORPORATION
NOTES TO CONSOLIDATED FINANCIAL STATEMENTS—(Continued)
third-party provider. The third-party provider has advised its users that the new version of the software corrects an error in the prior version with respect to the calculation of stock-based compensation expense. Specifically, the prior version of the software incorrectly calculated stock-based compensation expense by continuing to apply a weighted average forfeiture rate to the vested portion of stock option awards until the grant’s final vest date, rather that reflecting actual forfeitures as awards vested, resulting in an understatement of stock-based compensation expense in certain periods prior to the grant’s final vest date. The correction of the error by the Company resulted in changes to the timing of stock-based compensation expense over the vesting period of the awards during the relevant periods, but did not change the total stock-based compensation expense. As stock-based compensation expense is a non-cash item, there was no impact to net cash provided by operations in any period.
The effect of correcting this error was a decrease to net income of $1.3 million for the year ended December 31, 2007, and an increase to net income of $0.1 million for the year ended December 31, 2008 compared to amounts previously reported.
The cumulative effect of the stock-based compensation adjustments on the consolidated balance sheet as of the year ended 2008 was an increase in additional paid-in capital offset by a corresponding increase in accumulated deficit which resulted in no net effect on stockholders’ equity.
106
Table of Contents
| ITEM 9. | CHANGES IN AND DISAGREEMENTS WITH ACCOUNTANTS ON ACCOUNTING AND FINANCIAL DISCLOSURE |
None.
| ITEM 9A. |
(a) Evaluation of Disclosure Controls and Procedures
Our management, with the participation of our Chief Executive Officer and Chief Financial Officer, evaluated the effectiveness of our disclosure controls and procedures as of December 31, 2009. The term “disclosure controls and procedures,” as defined in Rules 13a-15(e) and 15d-15(e) under the Exchange Act, means controls and other procedures of a company that are designed to ensure that information required to be disclosed by a company in the reports that it files or submits under the Exchange Act is recorded, processed, summarized and reported within the time periods specified in the SEC’s rules and forms. Disclosure controls and procedures include, without limitation, controls and procedures designed to ensure that information required to be disclosed by a company in the reports that it files or submits under the Exchange Act is accumulated and communicated to the company’s management, including its principal executive and principal financial officers, as appropriate to allow timely decisions regarding required disclosure. Management recognizes that any controls and procedures, no matter how well designed and operated, can provide only reasonable assurance of achieving their objectives and management necessarily applies its judgment in evaluating the cost-benefit relationship of possible controls and procedures.
Our management, with the participation of the Chief Executive Officer and Chief Financial Officer, has evaluated the effectiveness of the Company’s disclosure controls and procedures as of the end of the period covered by this annual report on Form 10-K. Based upon that evaluation, our Chief Executive Officer and Chief Financial Officer have concluded that, as of December 31, 2009, our disclosure controls and procedures were effective at the reasonable assurance level.
Attestation report of the registered public accounting firm.
See “Report of Independent Registered Public Accounting Firm” on page 63.
Management’s report on internal control over financial reporting
See “Management’s Report on Internal Control Over Financial Reporting” on page 65.
Changes in internal control over financial reporting
The following changes in internal control over financial reporting that occurred during the quarter ended December 31, 2009 materially affected, or are reasonably likely to materially affect, our internal control over financial reporting.
Remediation of Material Weakness — Stock-Based Compensation Expense
In Management’s Report on Internal Control over Financial Reporting included in our restated Annual Report on Form 10-K/A for the year ended December 31, 2008, and as discussed in Item 4 in our quarterly report on Form 10-Q/A for the fiscal quarters ended March 31, 2009, June 30, 2009 and September 30, 2009, our management concluded that, as of December 31, 2008, March 31, 2009, June 30, 2009 and September 30, 2009, our internal control over financial reporting was not effective to provide reasonable assurance regarding the reliability of financial reporting and the preparation of financial statements for external reporting purposes in accordance with GAAP due to the following material weakness:
| • | We did not maintain effective controls to ensure the completeness and accuracy of stock-based compensation expense. Specifically, we did not maintain effective controls to ensure the proper |
107
Table of Contents
| application of forfeiture rates in the calculation of stock-based compensation expense in accordance with generally accepted accounting principles. In October 2009, the Company became aware of a recent alert from its third party software provider which noted that the new version of the software corrected an error in the prior version with respect to the calculation of stock-based compensation expense. Specifically, the prior version of the software incorrectly calculated stock-based compensation expense by continuing to apply a weighted average forfeiture rate to the vested portion of stock option awards until the grant’s final vest date, rather than reflecting actual forfeitures as awards vested, resulting in an understatement of stock-based compensation expense in certain periods prior to the grant’s final vest date |
Subsequent to the identification of the material weakness related to our accounting for stock-based compensation expense, we have taken remediation measures relating to the calculation of stock-based compensation expense and the application of the forfeiture rate, which included adding control procedures to:
| (i) | test the calculation of the third-party stock-based compensation software reports upon our upgrades to new versions of the software |
| (ii) | test the calculation of the third-party stock-based compensation software reports upon grants of new stock options, restricted stock awards and restricted stock units with new features |
| (iii) | re-perform calculations of cumulative stock-based compensation expense for a sample of stock options, restricted stock awards and restricted stock units to ensure that they are accurate and complete |
During the quarter ended December 31, 2009, management tested the design and operating effectiveness of the newly implemented controls and concluded that the material weakness described above has been remediated as of December 31, 2009.
Limitation on Effectiveness of Controls
Management does not expect that our disclosure controls and procedures or our internal control over financial reporting will prevent or detect all errors and fraud. Any control system, no matter how well designed and operated, is based upon certain assumptions and can provide only reasonable, not absolute, assurance that its objectives will be met. Further, no evaluation of controls can provide absolute assurance that misstatements due to error or fraud will not occur or that all control issues and instances of fraud, if any, within the Company have been detected.
| ITEM 9B. | OTHER INFORMATION |
None
108
Table of Contents
PART III
| ITEM 10. | DIRECTORS, EXECUTIVE OFFICERS AND CORPORATE GOVERNANCE |
The following table provides information concerning our executive officers as of February 28, 2009:
| Name |
Age | Position | ||
| Michael Gregoire |
44 | President, Chief Executive Officer and Director | ||
| Neil Hudspith |
52 | Executive Vice President, Worldwide Field Operations | ||
| Guy Gauvin |
42 | Executive Vice President, Global Services | ||
| Katy Murray |
41 | Executive Vice President and Chief Financial Officer |
Michael Gregoire has served as our president and chief executive officer since March 2005 and as Chairman of the Board of Directors since May 2008. Prior to joining us, Mr. Gregoire worked at PeopleSoft, an enterprise software company, from May 2000 to January 2005, most recently as executive vice president, global services. Prior to PeopleSoft, Mr. Gregoire served as managing director for the Global Financial Markets at Electronic Data Systems Corporation, a technology services provider, from 1996 to April 2000. Mr. Gregoire has a master’s degree from California Coast University, and holds a bachelor’s degree in physics and computing from Wilfred Laurier University in Ontario, Canada.
Neil Hudspith has served as our executive vice president, world wide field operations, since May 2008. Mr. Hudspith served as our senior vice president of International operations from June 2006 to April 2008. Mr. Hudspith served as our group vice president, EMEA from August 2005 to June 2006. Prior to joining us, Mr. Hudspith served as vice president and general manager for Candle Corporation, an enterprise systems management company, from June 2002 until January 2005. Prior to Candle, Mr. Hudspith spent 12 years at IBM/Lotus where he served in a variety of positions, including vice president, Asia Pacific. Prior to serving as vice president, Asia Pacific Mr. Hudspith served as vice president northern Europe general manager, emerging markets developing business in the Middle East, Africa, India, Eastern Europe and Russia.
Guy Gauvin has served as our executive vice president, global services, since April 2005. Prior to serving as our executive vice president, global services, Mr. Gauvin served as our executive vice president, worldwide operations, from March 2002 to April 2005. Prior to serving as executive vice president, worldwide operations, Mr. Gauvin served as our vice president, customer services, from August 1999 to March 2002. Prior to joining us, from May 1995 to August 1999, Mr. Gauvin served as vice president of global services at Baan Supply Chain Solutions. Mr. Gauvin holds a bachelor’s degree in mechanical engineering from Laval University in Canada.
Katy Murray has served as our executive vice president and chief financial officer since September 2006. Prior to joining us, Ms. Murray served as chief financial officer of EXL Services, Inc., a provider of value-added offshore business process outsourcing solutions, from June 2005 to August 2006. Prior to EXL, Ms. Murray served as executive vice president and chief financial officer at i2 Technologies, a multinational supply chain management software company from January 2004 to May 2005. Prior to serving as executive vice president and chief financial officer at i2 Technologies, Ms. Murray held various leadership positions within the finance and accounting organization at i2 Technologies, from February 1998 to December 2003. Prior to i2 Technologies, Ms. Murray worked for more than four years at Paymentech, a US based processor of internet transactions as a Director of Accounting. Ms. Murray holds a bachelor and master’s degree in accounting from Louisiana State University and is a Certified Public Accountant.
The information regarding our directors required by this item is included under the caption “Election of Directors” in our Proxy Statement for our 2010 Annual Meeting of Stockholders (the “2010 Proxy Statement”) and is incorporated herein by reference. The information regarding compliance with Section 16(a) of the Exchange Act required by this item is included under the caption “Section 16(a) Beneficial Ownership Reporting Compliance” in the 2010 Proxy Statement and is incorporated herein by reference. The information regarding our code of ethics, nominating committee and audit committee required by this item is included under the caption “Corporate Governance” in the 2010 Proxy Statement and is incorporated herein by reference.
109
Table of Contents
| ITEM 11. | EXECUTIVE COMPENSATION |
The information regarding executive compensation required by this item is included under the caption “Executive Compensation” in the 2010 Proxy Statement and is incorporated herein by reference.
| ITEM 12. | SECURITY OWNERSHIP OF CERTAIN BENEFICIAL OWNERS AND MANAGEMENT AND RELATED STOCKHOLDER MATTERS |
The information regarding securities authorized for issuance under equity compensation plans required by this item is included under the caption “Executive Compensation — Equity Compensation Plan Information” in the 2010 Proxy Statement and is incorporated herein by reference. The information regarding security ownership of certain beneficial owners and management required by this item is included under the caption “Security Ownership of Certain Beneficial Owners and Management” in the 2010 Proxy Statement and is incorporated herein by reference.
| ITEM 13. | CERTAIN RELATIONSHIPS AND RELATED TRANSACTIONS, AND DIRECTOR INDEPENDENCE |
The information regarding transactions with related persons required by this item is included under the caption “Certain Relationships and Related Party Transactions” in the 2010 Proxy Statement and is incorporated herein by reference. The information regarding director independence required by this item is included under the caption “Corporate Governance” in the 2010 Proxy Statement and is incorporated herein by reference.
| ITEM 14. | PRINCIPAL ACCOUNTING FEES AND SERVICES |
The information required by this item is included under the caption “Principal Accounting Fees and Services” in the 2010 Proxy Statement and is incorporated herein by reference.
PART IV
| ITEM 15. | EXHIBITS, FINANCIAL STATEMENT SCHEDULES |
(a) The following documents are filed as part of this Report:
1. Financial Statements. The information concerning our financial statements, and Report of PricewaterhouseCoopers LLP, Independent Registered Public Accounting Firm and Deloitte & Touche LLP, Independent Registered Public Accounting Firm required by this item is incorporated by reference herein to Item 8 — Financial Statement and Supplementary Data.
2. Financial Statement Schedules. The Financial Statement Schedules not listed have been omitted because they are not applicable or are not required or the information required to be set forth herein is included in Item 8 — Financial Statements and Supplementary Data.
3. Exhibits. We have filed, or incorporated into this report by reference, the exhibits listed on the accompanying Exhibit Index to Exhibits immediately following the signature page of this Form 10-K.
110
Table of Contents
Pursuant to the requirements of Section 13 or 15(d) of the Securities Exchange Act of 1934, the registrant has duly caused this report to be signed on its behalf by the undersigned, thereunto duly authorized.
| TALEO CORPORATION | ||
| By: |
/s/ Katy Murray | |
| Katy Murray | ||
| Executive Vice President and Chief Financial Officer | ||
Date: March 11, 2010
111
Table of Contents
POWER OF ATTORNEY
KNOW ALL PERSONS BY THESE PRESENTS, that each person whose signature appears below constitutes and appoints Michael Gregoire and Katy Murray, his attorney-in-fact, each with the power of substitution, for him in any and all capacities, to sign any amendments to this Annual Report on Form 10-K, and to file the same, with exhibits thereto and other documents in connections therewith, with the Securities and Exchange Commission, hereby ratifying and conforming all that each of said attorneys-in-fact, or his substitutes, may do or cause to be done by virtue of hereof.
Pursuant to the requirements of the Securities Exchange Act of 1934, this report has been signed below by the following persons on behalf of the registrant and in the capacities and on the dates indicated.
| Signature |
Title |
Date | ||
| /s/ Michael Gregoire Michael Gregoire |
Chairman of the Board and Chief Executive Officer (Principal Executive Officer) |
March 11, 2010 | ||
| /s/ Katy Murray Katy Murray |
Executive Vice President and Chief Financial Officer (Principal Financial Officer) |
March 11, 2010 | ||
| /s/ Carol Richwood Carol Richwood |
Vice President, Principal Accounting Officer (Principal Accounting Officer) |
March 11, 2010 | ||
| /s/ Eric Herr Eric Herr |
Lead Independent Director of the Board of Directors |
March 11, 2010 | ||
| /s/ Gary Bloom Gary Bloom |
Director |
March 11, 2010 | ||
| /s/ Patrick Gross Patrick Gross |
Director |
March 11, 2010 | ||
| /s/ Greg Santora Greg Santora |
Director |
March 11, 2010 | ||
| /s/ Jeffrey Schwartz Jeffrey Schwartz |
Director |
March 11, 2010 | ||
| /s/ Jeffrey Stiefler Jeffrey Stiefler |
Director |
March 11, 2010 | ||
| /s/ Michael Tierney Michael Tierney |
Director |
March 11, 2010 | ||
112
Table of Contents
EXHIBIT INDEX
| Exhibit Number |
Description | |
| 2.1 | Asset Purchase Agreement dated as of March 2, 2007, by and among Taleo Corporation, JobFlash, Inc., and, with respect to Articles X, XI and XII thereof only, U.S. Bank National Association as Escrow Agent (incorporated herein by reference to Exhibit 2.1 to the Registrant’s Current Report on Form 8-K, Commission File No. 000-51299, filed on March 8, 2007) | |
| 2.2 | Agreement and Plan of Reorganization dated as of May 5, 2008, by and among Taleo Corporation, Dolphin Acquisition Corporation, Porpoise Acquisition LLC, Vurv Technology, Inc., and, with respect to Articles VII, VIII and IX thereof only, Derek Mercer as Stockholder Representative and U.S Bank National Association as Escrow Agent (incorporated herein by reference to Exhibit 2.1 to the Registrant’s Current Report on Form 8-K, Commission File No. 000-51299, filed on May 7, 2008) | |
| 2.3 | Amended and Restated Agreement and Plan of Merger dated as of September 14, 2009, by and among Taleo Corporation, Wyoming Acquisition Corporation, Worldwide Compensation, Inc., and, with respect to Articles VII, VIII and IX thereof only, Dennis M. Rohan as Stockholder Representative and U.S. Bank National Association as Escrow Agent (incorporated herein by reference to Exhibit 2.1 to the Registrant’s Current Report on Form 8-K, Commission File No. 000-51299, filed on September 18, 2009) | |
| 3.1 | Amended and Restated Certificate of Incorporation (incorporated herein by reference to Exhibit 3.1 to the Registrant’s Registration Statement on Form S-1, Commission File No. 333-114093, filed on September 13, 2005) | |
| 3.2 | Bylaws (incorporated herein by reference to Exhibit 3.2 to the Registrant’s Registration Statement on Form S-1, Commission File No. 333-114093, filed on May 13, 2004) | |
| 4.1 | Form of Class A common stock certificate (incorporated herein by reference to Exhibit 4.1 to the Registrant’s Registration Statement on Form S-1, Commission File No. 333-114093, filed on September 13, 2005) | |
| 4.2 | Form of Class B common stock certificate (incorporated herein by reference to Exhibit 4.2 to the Registrant’s Registration Statement on Form S-1, Commission File No. 333-114093, filed on September 13, 2005) | |
| 4.3 | Second Amended and Restated Investor Rights Agreement, dated October 21, 2003 (incorporated herein by reference to Exhibit 4.3 to the Registrant’s Registration Statement on Form S-1, Commission File No. 333-114093, filed on March 31, 2004) | |
| 10.1* | 1999 Stock Plan and form of agreement thereunder (incorporated herein by reference to Exhibit 10.1 to the Registrant’s Registration Statement on Form S-1, Commission File No. 333-114093, filed on March 31, 2004) | |
| 10.2* | ViaSite Inc. Stock Plan (incorporated herein by reference to Exhibit 10.2 to the Registrant’s Registration Statement on Form S-1, Commission File No. 333-114093, filed on March 31, 2004) | |
| 10.3 | 2003 Series D Preferred Stock Plan and form of agreement thereunder (incorporated herein by reference to Exhibit 10.3 to the Registrant’s Registration Statement on Form S-1, Commission File No. 333-114093, filed on March 31, 2004) | |
| 10.4* | 2004 Stock Plan, as amended April 30, 2009 (incorporated herein by reference to Exhibit 10.1 to the Registrant’s Quarterly Report on Form 10-Q, Commission File No. 000-51299, filed on May 11, 2009) | |
| 10.5* | 2004 Stock Plan — Form of Restricted Stock Agreement (incorporated herein by reference to Exhibit 10.2 to the Registrant’s Quarterly Report on Form 10-Q, Commission File No. 000-51299, filed on May 11, 2009) | |
113
Table of Contents
| Exhibit Number |
Description | |
| 10.6* | 2004 Stock Plan — Form of Performance Share Agreement (U.S. service providers) (incorporated herein by reference to Exhibit 10.3 to the Registrant’s Quarterly Report on Form 10-Q, Commission File No. 000-51299, filed on May 11, 2009) | |
| 10.7* | 2004 Stock Plan — Form of Performance Share Agreement (Canada grantees) (incorporated herein by reference to Exhibit 10.2 to the Registrant’s Current Report on Form 8-K, Commission File No. 000-51299, filed on June 6, 2006) | |
| 10.8* | 2004 Employee Stock Purchase Plan (incorporated herein by reference to Exhibit 10.5 to the Registrant’s Registration Statement on Form S-1, Commission File No. 333-114093, filed on January 28, 2005) | |
| 10.9* | 2005 Stock Plan and form of agreement thereunder (incorporated herein by reference to Exhibit 10.24 to the Registrant’s Registration Statement on Form S-1, Commission File No. 333-114093, filed on September 13, 2005) | |
| 10.10 | Vurv Technology, Inc. Stock Option Plan, as amended and restated as of March 23, 2006 (incorporated herein by reference to Exhibit 99.4 to the Registrant’s Registration Statement on Form S-8, Commission File No. 333-152720, filed on August 1, 2008) | |
| 10.11 | Vurv Technology, Inc. Stock Option Plan — Form of Stock Option Agreement (incorporated herein by reference to Exhibit 99.5 to the Registrant’s Registration Statement on Form S-8, Commission File No. 333-152720, filed on August 1, 2008) | |
| 10.12* | 2009 Equity Incentive Plan (incorporated herein by reference to Exhibit 99.1 to the Registrant’s Registration Statement on Form S-8, Commission File No. 333-160707, filed on July 2, 2009) | |
| 10.13* | 2009 Equity Incentive Plan — Form of Stock Option Agreement (incorporated herein by reference to Exhibit 10.3 to the Registrant’s Quarterly Report on Form 10-Q, Commission File 004Eo. 000-51299, filed on August 6, 2009) | |
| 10.14* | 2009 Equity Incentive Plan — Form of Restricted Stock Agreement (incorporated herein by reference to Exhibit 10.4 to the Registrant’s Quarterly Report on Form 10-Q, Commission File No. 000-51299, filed on August 6, 2009) | |
| 10.15* | 2009 Equity Incentive Plan — Form of Performance Share Agreement (incorporated herein by reference to Exhibit 10.5 to the Registrant’s Quarterly Report on Form 10-Q, Commission File No. 000-51299, filed on August 6, 2009) | |
| 10.16* | Employment Agreement, dated March 14, 2005, between Taleo Corporation and Michael Gregoire (incorporated herein by reference to Exhibit 10.16 to the Registrant’s Registration Statement on Form 10-12G, Commission File No. 000-51299, filed on May 2, 2005) | |
| 10.17* | Amendment to Employment Agreement, dated December 26, 2008, between Taleo Corporation and Michael Gregoire (incorporated herein by reference to Exhibit 10.31 to the Registrant’s Annual Report on Form 10-K, Commission File No. 000-51299, filed on April 30, 2009) | |
| 10.18* | Employment Agreement, dated August 4, 2006, between Taleo Corporation and Katy Murray (incorporated herein by reference to Exhibit 10.1 to the Registrant’s Current Report on Form 8-K, Commission File No. 000-51299, filed on August 10, 2006) | |
| 10.19* | Amendment to Employment Agreement, dated December 26, 2008, between Taleo Corporation and Katy Murray (incorporated herein by reference to Exhibit 10.32 to the Registrant’s Annual Report on Form 10-K, Commission File No. 000-51299, filed on April 30, 2009) | |
| 10.20* | Employment Agreement, dated March 8, 2006, between Taleo (Canada) Inc. and Guy Gauvin (incorporated herein by reference to Exhibit 10.11 to the Registrant’s Annual Report on Form 10-K, Commission File No. 000-51299, filed on April 17, 2006) | |
114
Table of Contents
| Exhibit Number |
Description | |
| 10.21* | Amendment to Employment Agreement, dated December 24, 2008, between Taleo Corporation and Guy Gauvin (incorporated herein by reference to Exhibit 10.33 to the Registrant’s Annual Report on Form 10-K, Commission File No. 000-51299, filed on April 30, 2009) | |
| 10.22* | Employment Agreement, dated May 1, 2008, between Taleo Corporation and Neil Hudspith (incorporated herein by reference to Exhibit 10.14 to the Registrant’s Annual Report on Form 10-K, Commission File No. 000-51299, filed on April 30, 2009) | |
| 10.23* | Amendment to Employment Agreement, dated December 30, 2008, between Taleo Corporation and Neil Hudspith (incorporated herein by reference to Exhibit 10.34 to the Registrant’s Annual Report on Form 10-K, Commission File No. 000-51299, filed on April 30, 2009) | |
| 10.24* | Summary of the 2009 Executive Incentive Bonus Plan (incorporated herein by reference to Exhibit 10.1 to the Registrant’s Current Report on Form 8-K/A, Commission File No. 000-51299, filed on January 20, 2009) | |
| 10.25* | Form of Indemnification Agreement entered into by the Registrant and each of its directors and executive officers (incorporated herein by reference to Exhibit 10.6 to the Registrant’s Registration Statement on Form S-1, Commission File No. 333-114093, filed on March 31, 2004) | |
| 10.26 | Agreement, dated September 1, 2002, between the Registrant and Internap Network Services Corporation (incorporated herein by reference to Exhibit 10.13 to the Registrant’s Registration Statement on Form S-1, Commission File No. 333-114093, filed on January 28, 2005) | |
| 10.27 | Master Services Agreement, dated April 14, 2006, by and between the Registrant and Equinix Operating Co., Inc. (incorporated herein by reference to Exhibit 10.1 to the Registrant’s Current Report on Form 8-K, Commission File No. 000-51299, filed on April 20, 2006) | |
| 10.28 | Lease for 4140 Dublin Blvd., Suite 400, Dublin, California (incorporated herein by reference to Exhibit 10.1 to the Registrant’s Current Report on Form 8-K, Commission File No. 000-51299, filed on March 22, 2006) | |
| 10.29 | Master Services Agreement, dated as of June 27, 2008, by and between Taleo (Europe) B.V. and Equinix Netherlands B.V (incorporated herein by reference to Exhibit 10.1 to the Registrant’s Report on Form 10-Q, Commission File No. 000-51299, filed on August 11, 2008) | |
| 10.30‡ | Oracle License and Service Agreement, dated May 30, 2007, by and between Taleo Corporation and Oracle USA, Inc. (incorporated herein by reference to Exhibit 10.1 to the Registrant’s Quarterly Report on Form 10-Q, Commission File No. 000-51299, filed on August 9, 2007) | |
| 10.31‡ | Payment Schedule Agreement, dated May 30, 2007, by and between Taleo Corporation and Oracle Credit Corporation, (incorporated herein by reference to Exhibit 10.2 to the Registrant’s Quarterly Report on Form 10-Q, Commission File No. 000-51299, filed on August 9, 2007) | |
| 10.32‡ | Amendment One to Ordering Document, dated May 30, 2009, by and between Taleo Corporation and Oracle USA, Inc. ( incorporated herein by reference to Exhibit 10.1 to the Registrant’s Quarterly Report on Form 10-Q, Commission File No. 000-51299, filed on August 6, 2009) | |
| 10.33‡ | Payment Schedule Agreement, dated May 30, 2009, by and between Taleo Corporation and Oracle Credit Corporation, (incorporated herein by reference to Exhibit 10.2 to the Registrant’s Quarterly Report on Form 10-Q, Commission File No. 000-51299, filed on August 6, 2009) | |
| 21.1 | List of Subsidiaries as of March 9, 2010 | |
115
Table of Contents
| Exhibit Number |
Description | |
| 23.1 | Consent of Deloitte & Touche LLP, Independent Registered Public Accounting Firm | |
| 23.2 | Consent of PricewaterhouseCoopers LLP, Independent Registered Public Accounting Firm | |
| 24.1 | Power of Attorney (see the signature page of this Annual Report) | |
| 31.1 | Certification of Chief Executive Officer pursuant to Setion 302 of the Sarbanes-Oxley Act of 2002 | |
| 31.2 | Certification of Chief Financial Officer pursuant to Section 302 of the Sarbanes-Oxley Act of 2002 | |
| 32.1 | Certification of Chief Executive Officer and Chief Financial Officer pursuant to 18 U.S.C. Section 1350, as adopted pursuant to Section 906 of the Sarbanes-Oxley Act of 2002 | |
| * | Indicates management compensatory plan, contract or arrangement. |
| ‡ | Confidential treatment has been granted for portions of this exhibit. |
116