Attached files
Table of Contents
UNITED STATES
SECURITIES AND EXCHANGE COMMISSION
Washington, D.C. 20549
FORM 10-K
(Mark One)
| x | ANNUAL REPORT PURSUANT TO SECTION 13 OR 15(d) OF THE SECURITIES EXCHANGE ACT OF 1934 |
For the fiscal year ended December 31, 2009
or
| ¨ | TRANSITION REPORT PURSUANT TO SECTION 13 OR 15(d) OF THE SECURITIES EXCHANGE ACT OF 1934 |
For the transition period from to
Commission file number 000-23776
DARA BIOSCIENCES, INC.
(Exact name of registrant as specified in its charter)
| Delaware | 04-3216862 | |
| (State or other jurisdiction of incorporation or organization) |
(I.R.S. Employer Identification No.) |
| 8601 Six Forks Road, Suite 160 Raleigh, North Carolina |
27615 | |
| (Address of principal executive offices) | (Zip Code) |
Registrant’s telephone number, including area code: (919) 872-5578
Securities registered pursuant to Section 12(b) of the Act:
| Title of Each Class |
Name of Each Exchange on Which Registered | |
| Common Stock, Par Value $.01 Per Share | The NASDAQ Stock Market LLC |
Securities registered pursuant to Section 12(g) of the Act: None
(Title of Class)
Indicate by check mark if the registrant is a well-known seasoned issuer, as defined in Rule 405 of the Securities Act. Yes ¨ No x
Indicate by check mark if the registrant is not required to file reports pursuant to Section 13 or Section 15(d) of the Act. Yes ¨ No x
Indicate by check mark whether the registrant (1) has filed all reports required to be filed by Section 13 or 15(d) of the Securities Exchange Act of 1934 during the preceding 12 months (or for such shorter period that the registrant was required to file such reports) and (2) has been subject to such filing requirements for the past 90 days. Yes x No ¨
Indicate by check mark whether the registrant has submitted electronically and posted on its corporate Web site, if any, every Interactive Data File required to be submitted and posted pursuant to Rule 405 of Regulation S-T (§232.405 of this chapter) during the preceding 12 months (or for such shorter period that the registrant was required to submit and post such files). Yes ¨ No ¨
Indicate by check mark if disclosure of delinquent filers pursuant to Item 405 of Regulation S-K is not contained herein, and will not be contained, to the best of the registrant’s knowledge, in definitive proxy or information statements incorporated by reference in Part III of this Form 10-K or any amendment to this Form 10-K. ¨
Indicate by check mark whether the registrant is a large accelerated filer, an accelerated filer, a non-accelerated filer, and/or a smaller reporting company. See the definition of “large accelerated filer,” “accelerated filer” and “smaller reporting company” in Rule 12b-2 of the Exchange Act.
| Large accelerated filer | ¨ | Accelerated filer | ¨ | |||
| Non-accelerated filer | ¨ (Do not check if a smaller reporting company) | Smaller reporting company | x | |||
Indicate by check mark whether the registrant is a shell company (as defined in Rule 12b-2 of the Act). Yes ¨ No x
The aggregate market value of voting stock held by non-affiliates of the registrant as of June 30, 2009 was approximately $12,536,634.
The number of shares outstanding of the Registrant’s common stock as of March 5, 2010 was approximately 48,915,326.
Table of Contents
FORWARD-LOOKING STATEMENTS
2
Table of Contents
FORWARD-LOOKING STATEMENTS
This Form 10-K contains forward-looking statements within the meaning of Section 21E of the Securities Exchange Act of 1934, as amended, and Section 27A of the Securities Act of 1933, as amended. When used in this Form 10-K, the words “believe,” “anticipates,” “intends,” “plans,” “estimates,” and similar expressions are forward-looking statements. Such forward-looking statements contained in this Form 10-K are based on management’s current expectations. Forward-looking statements may address the following subjects: results of operations; development of drug candidates; operating expenses, including research and development expense; capital resources and access to financing; and results of clinical trials. We caution investors that there can be no assurance that actual results, outcomes or business conditions will not differ materially from those projected or suggested in such forward-looking statements as a result of various factors, including, among others, the potential risks and uncertainties described in “Part I, Item 1A — Risk Factors” below.
You should also carefully consider the factors set forth in other reports or documents that we file from time to time with the Securities and Exchange Commission (the “SEC”). Except as required by law, we undertake no obligation to update any forward-looking statements.
In this Form 10-K, we refer to information regarding potential markets for our drug candidates and other industry data. We believe that all such information has been obtained from reliable sources that are customarily relied upon by companies in our industry. However, we have not independently verified any such information.
PART I
Overview
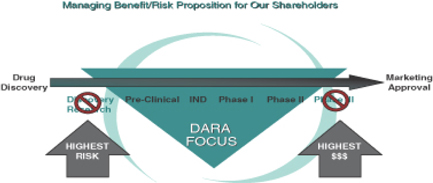
DARA BioSciences, Inc. (“DARA”) is a Raleigh, North Carolina-based development stage pharmaceutical company that acquires promising therapeutic molecules and medical technologies from third parties and advances their clinical development for later sale or license to pharmaceutical and biotechnology companies or other entities that have the potential to complete development, gain approval and commercialize the product. We focus our therapeutic development efforts on small molecules from late preclinical development through Phase 2 clinical trials.
Presently, we have two drug candidates in development with cleared Investigational New Drug applications (“INDs”) from the U.S. Food and Drug Administration:
| • | KRN5500 for the treatment of neuropathic pain in cancer patients has successfully completed Proof-of-Concept in Humans (Phase 2a); and |
| • | DB959 for the treatment of metabolic diseases including type 2 diabetes with initiation of a Phase 1 study planned for Q1 2010. |
3
Table of Contents
While in the past we were developing a broader pipeline of drug development programs, we are currently focusing all of our resources on our two most advanced drug development programs which are KRN5500 and DB959. We are holding our delayed development programs in inventory for potential future development and sale.
We generally in-license or otherwise acquire drug candidates that are prepared to enter pre-clinical studies prior to being submitted for an IND (which is part of the process to get approval from the FDA for marketing a new prescription drug in the U.S.). The next stage of development is to obtain FDA approval of an IND application and test the drug candidates in Phase 1 and Phase 2 clinical trials.
Our management team efficiently advances product candidates through clinical development, potentially yielding commercially and medically attractive therapeutics. Our strategy is designed to enhance and meet the pipeline needs of midsize and large pharmaceutical and biotechnology companies. The development and liquidity strategy for product candidates varies according to market conditions, stage of development, and competitive market dynamics. To best manage our risks, we utilize a stringent due diligence process anchored by knowledge of a drug or technology candidate’s attributes that will most likely yield commercial success. Our due diligence, development, and commercial expertise help us identify drug candidates to pursue. We then conduct focused research to improve the probability of clinical and commercial success.
We hire experts with strong pharmaceutical project management skills in specific disciplines we believe are important to maintain within our Company. We contract with and manage strong outsource partners to complete the necessary development work. This permits us to avoid incurring the cost of buying or building laboratories, manufacturing facilities or clinical research operation sites and allows us to control our annual expenses and to optimize our resources.
After we establish proof of concept for an innovative drug candidate, we seek to license or sell the drug candidate or find a strategic collaborative partner who would further the development of the compound in later stage trials and commercialize it after regulatory approval. Key indicators to evaluate our success are how our drug candidates advance through the drug development process, and ultimately, if we are successful in negotiating collaborations, licenses, or sales agreements for our drug candidates. The success of our business is highly dependent on the marketplace value of our drug candidates, the related patents we obtain and our ability to find strong commercial partners to successfully commercialize the drug candidates. In order to successfully achieve these goals, having sufficient liquidity is important since we do not have a recurring sales or revenue stream to provide such working capital.
Our executive offices are located at 8601 Six Forks Road, Suite 160, Raleigh, North Carolina 27615, and our telephone number is 919.872.5578.
Active Compounds/Programs
On January 6, 2009, we implemented a cost reduction plan to conserve our remaining cash balance. In connection with the cost reduction plan we have focused our resources entirely on our two most advanced drug development programs, KRN5500 for neuropathic pain in cancer patients and DB959 for type 2 diabetes.
KRN5500 is a drug candidate which is presently being developed for the treatment of neuropathic pain in cancer patients. An active component of KRN5500 has been shown to inhibit nerve cell pain signals. The primary segment of the market being targeted by this compound is chemotherapy-induced neuropathic pain (CINP). On May 12, 2009, we announced positive results from the completed Phase 2a clinical trial in cancer patients with neuropathic pain to assess the safety and efficacy of KRN5500. KRN5500 met its primary end-point of reduction of pain from baseline and performed statistically significantly better than placebo (p=0.03).
DB959 is a novel dual PPARd/g agonist for the treatment of type 2 diabetes. In March 2009, the FDA cleared our IND application for DB959, allowing us to commence Phase 1 studies in humans. This compound activates genes
4
Table of Contents
involved in the metabolism of sugars and fats thereby improving the body’s ability to regulate blood sugar. We are developing this drug candidate as a once-daily oral therapy. Our review of non-clinical data indicates that this drug candidate is a potential leading successor to Avandia® and Actos® because, among other indications, it increases good HDL cholesterol and lowers triglycerides better than Avandia® with greater cardiac safety and less weight gain.
The table below sets forth our current active compounds/programs, their target indications and the projected market size for the applicable lead indications. We can give no assurances that KRN5500 and DB959 will gain FDA approval or, even with FDA approval for such drugs, would capture meaningful market share for the stated indications.
| Compound/Program |
Target Indication(s) | Projected Market Size, Lead Indication Only, in billions (B); by the year |
|||||||
| KRN5500 |
Neuropathic Pain | $ | 7.0B | (2016 | ) | ||||
| DB959 |
Type 2 Diabetes, Dyslipidemia | $ | 21.0B | * | (2034 | ) | |||
| * | Oral Antidiabetics Only |
Peroxisome proliferator-activated receptors (PPARs) are ubiquitous in the human body and current medical literature has shown usefulness of PPAR agonists, such as DB959, for treating Alzheimer’s disease, ulcerative colitis, non-alcoholic fatty liver disease and other autoimmune diseases.
Delayed Programs
In connection with the implementation of the cost reduction plan we announced on January 6, 2009, we suspended the development of many of the compounds and programs that were previously in our pipeline. Presently, it is unknown whether the suspension of the development of these compounds and programs will be permanent or temporary. However, we continue to hold the rights to these compounds and may resume their development at any time we believe it is in the best interest of the Company to do so. The below table sets forth our inactive programs, their target indications and the projected market size for the applicable lead indications. We can give no assurances that our inactive programs would gain FDA approval if we resumed development or that even with FDA approval for such drugs would capture meaningful market share for the stated indications.
| Compound/Program |
Target Indication(s) | Projected Market Size, Lead Indication Only, in billions (B); by the year |
||||||
| DB160 |
Type 2 Diabetes | $ | 21.0B | (2034 | ) | |||
| DB900 |
Type 2 Diabetes, Dyslipidemia & Inflammatory Diseases |
$ | 30.0B | (2014 | ) | |||
| DB200 |
Topical for Psoriasis | $ | 3.9B | (2011 | ) | |||
Investments
Prior to our merger with Point Therapeutics, Inc. (“Point”) in February 2008, we made investments in several companies. As a result, we currently hold investments in the following companies:
5
Table of Contents
| • | SurgiVision, Inc. has developed “real-time” Visual Functional MRI Technology. The company is targeting clinical solutions in two areas: MRI-Guided Deep Brain Stimulation (DBS) and Cardiac Ablation to treat Atrial Fibrillation. On December 23, 2009, SurgiVision filed a registration statement on Form S-1 in anticipation of an initial public offering (IPO). |
| • | Medeikon Corporation has identified unmet needs in the diagnostics of several types of CVD that can be addressed with their core technology. |
Competition
The markets for our products are competitive and the intensity of competition is expected to increase. We primarily compete with other pharmaceutical companies, biotechnology companies and other research and academic institutions. Many of these companies and institutions have substantially greater financial and other resources and development capabilities than we have and have substantially greater experience in undertaking pre-clinical and clinical testing of products. In addition to competing with universities and other research institutions in the development of products, technologies and processes, we compete with other companies in acquiring rights to products or technologies from universities and other research institutions. Because of these factors, we seek to develop products that are more effective or otherwise have the potential to achieve greater market acceptance than competitive products.
Intellectual Property
Patent Portfolio
Our licensed patent rights, categorized by individual drug development programs, are summarized below.
| • | KRN5500 – one pending PCT application, six issued U.S. patents, and corresponding foreign patent applications and patents related to spicamycin and derivatives and analogs thereof (including KRN5500) and use of the same for treating pain. |
| • | DB959 and DB900 – four issued U.S. patents, one allowed U.S. patent application, and five pending U.S. patent applications with corresponding foreign patents and patent applications related to compounds and use thereof for treating type 2 diabetes, skin disorders, central nervous system disorders, and other diseases. |
| • | DB160 – one pending U.S. patent application with a corresponding foreign patent and patent applications related to DB160 and derivatives and analogs thereof and use of the same for treating type 2 diabetes and other diseases; one U.S. patent application in progress related to use of DB160 and derivatives and analogs thereof. |
| • | DB200 –one pending U.S. patent application and one pending PCT application related to DB200 and derivatives and analogs thereof, methods of making the same, and use of the same for treating dermatological conditions (including psoriasis) and other disorders. |
| • | Other –three granted U.S. patents with a corresponding foreign patent and patent application related to Stimulation of Hematopoietic Cells in Vitro; two granted U.S. patents related to Anti-Tumor Agents comprising Boroproline Compounds; and one issued U.S. patent related to Regulation of Substrate Activity. |
For information concerning the license agreements relating to these patents, see “Licenses” below.
Additionally, we own eight issued U.S. patents, twelve pending U.S. patent applications and corresponding foreign patents or patent applications in the major commercial markets, including North America, Europe and Japan relating to technologies developed by Point. Among these are patents or patent applications relating to treatment of cancer using talabostat as a single agent or combinations of talabostat with other anti-tumor agents,
6
Table of Contents
treatment of hematopoietic disorders, and treatment of infectious diseases in combination with antigens, as well as patents and patent applications covering our cyclic compositions.
The license from Tufts University School of Medicine (“Tufts”) (as described below) includes eight issued U.S. patents, four pending U.S. patent applications and, except for U.S. Patent No. 4935493 which expired in 2007, corresponding foreign patents or patent applications in major commercial markets, including North America, Europe, and Japan. Among these are composition of matter patents or patent applications covering our talabostat stereoisomer.
Licenses
We have licensed exclusive worldwide rights to compounds acting as DPP-IV inhibitors for the treatment of type 2 diabetes and other metabolic diseases from Nuada, LLC. This license was acquired December 22, 2006.
We have licensed exclusive worldwide rights (excluding Australia, New Zealand and Asia) to compounds from Kirin Brewery Co., Ltd. (now Kyowa Hakko Kirin Co., Ltd.) of Japan for the treatment of pain and central peripheral nervous system conditions or diseases. This license was effective July 1, 2004. We have also entered into an exclusive worldwide license with Massachusetts General Hospital related to the use of certain spicamycin derivatives for use in treating pain. The effective date of this agreement was May 3, 2004.
We have licensed exclusive worldwide rights to compounds from Bayer Pharmaceuticals, Corp. for the treatment of metabolic diseases, including type 2 diabetes. The license has no restrictions on disease indications for therapeutic use. Bayer retains certain commercialization rights. This license was acquired October 8, 2007.
We have licensed exclusive worldwide rights to a boroproline family of small molecule compounds, including talabostat, from Tufts. We entered into this license agreement in May 1997. The Tufts license agreement remains in effect until the later of the date of the last-to-expire patents, or 15 years from the date of initial commercial sale of a licensed product. Tufts also has the right to terminate the license if no licensed product is sold in the U.S. by May 2011.
Governmental Regulation
Our research, development and pre-clinical and clinical trials of most of our intended products are subject to an extensive regulatory approval process by the U.S. Food and Drug Administration (the “FDA”) and other regulatory agencies in the U.S. and abroad. The process of obtaining FDA and other required regulatory approvals for drug and biological products, including required pre-clinical and clinical testing, is lengthy, expensive and uncertain. Even if regulatory clearance is obtained, a marketed product is subject to continual review, and later discovery of previously unknown products or failure to comply with the applicable regulatory requirements may result in restrictions on a product’s marketing or withdrawal of the product from the market as well as possible criminal sanctions. Changes in existing regulations or adoption of new regulations or policies could prevent us from obtaining, or affect the timing of, future regulatory approvals or clearances. Noncompliance with applicable requirements can result in fines, injunctions, civil penalties, recall or seizure of products, total or partial suspension of production, refusal to authorize the marketing of new products or to allow us to enter into supply contracts and criminal prosecution.
Even if our proposed products are approved for market, we will be subject to continuing regulation. We and our collaborative partners will continuously be subject to routine inspection by the FDA and will have to comply with the host of regulatory requirements that usually apply to pharmaceutical products marketed in the U.S., including labeling regulations, Good Manufacturing Practices (“GMP”) requirements, adverse drug experience regulation, and the FDA’s regulations regarding promoting products for unapproved or “off-label” uses.
In addition, failure to comply with applicable international regulatory requirements can result in fines, injunctions, civil penalties, recalls or seizures of products, total or partial suspensions of production, refusals by foreign governments to permit product sales and criminal prosecution. Furthermore, changes in existing regulations or
7
Table of Contents
adoption of new regulations or policies could prevent us from obtaining, or affect the timing of, future regulatory approvals or clearances.
Research and Development Activities
Research and development costs associated with our products and technologies, as well as facilities costs, personnel costs, marketing programs and overhead account for a substantial portion of our operating expenses. Research and development costs include personnel costs, clinical and related drug manufacturing and testing costs, laboratory and animal supplies, outside services and contract laboratory costs. For a discussion of the amount spent on research and development activities, see “Item 7. Management’s Discussion and Analysis of Financial Condition and Results of Operations” below.
Employees
We currently have five full-time employees.
Available Information
Our Annual Report on Form 10-K, our Quarterly Reports on Form 10-Q and any Current Reports on Form 8-K that we may file or furnish to the SEC pursuant to Sections 13(a) or 15(d) of the Securities Exchange Act of 1934 as well as any amendments to any of those reports are available free of charge on or through our website as soon as reasonably practicable after we file them with or furnish them to the SEC electronically. Our website is located at www.darabiosciences.com. In addition, you may receive a copy of any of our reports free of charge by contacting our Investor Relations department at our corporate headquarters.
Our limited operating history may make it difficult to evaluate our business to date and our future viability.
We are in the early stage of operations and development and have only a limited operating history on which to base an evaluation of our current business and prospects. In addition, our operations and development are subject to all of the risks inherent in the growth of an early stage company. We will be subject to the risks inherent in the ownership and operation of a company with a limited operating history such as regulatory setbacks and delays, fluctuations in expenses, competition, the general strength of regional and national economies and governmental regulation. Any failure to successfully address these risks and uncertainties could seriously harm our business and prospects. We may not succeed given the technological, marketing, strategic and competitive challenges we face. The likelihood of our success must be considered in light of the expenses, difficulties, complications, problems and delays frequently encountered in connection with the growth of a new business, the continuing development of new drug development technology and the competitive and regulatory environment in which we operate or may choose to operate in the future.
Our drug candidates are at early stages of development, and we may not successfully develop a drug candidate that becomes a commercially viable drug.
The drug discovery and development process is highly uncertain, and we have not developed, and may never develop, a drug candidate that ultimately leads to a commercially viable drug. Our most advanced drug candidates are in the early stages of development, and we do not have any drugs approved for commercial sale. Before a drug product is approved by the FDA for commercial marketing, it is tested for safety and effectiveness in clinical trials that can take up to six years or longer. Promising results in preclinical development or clinical trials may not be predictive of results obtained in later clinical trials. A number of pharmaceutical companies have experienced significant setbacks in advanced clinical trials, even after obtaining promising results in earlier preclinical and clinical trials. At any time, the FDA may place a clinical trial on clinical hold, or temporarily or permanently stop the trial, for a variety of reasons, principally for safety concerns. We or our collaborators may experience
8
Table of Contents
numerous unforeseen events during, or as a result of, the clinical development process that could delay or prevent our drug candidates from being successfully commercialized, including:
| • | Failure to achieve clinical trial results that indicate a candidate is effective in treating a specified condition or illness in humans; |
| • | Safety issues, including the presence of harmful side effects; |
| • | Determination by the FDA that the submitted data do not satisfy the criteria for approval; |
| • | Lack of commercial viability of the drug; |
| • | Failure to acquire, on reasonable terms, intellectual property rights necessary for commercialization; and |
| • | Existence of therapeutics that are more effective. |
We expect to continue to incur losses.
We have incurred losses since inception and expect to continue to incur losses for the foreseeable future. Our losses are likely to be primarily attributable to personnel costs, working capital costs, research and development costs, and marketing costs. We may never achieve sustained profitability.
We will need additional financing.
We will need additional financing to maintain and expand our business, and such financing may not be available on favorable terms, if at all. We intend to finance our business, in part, through the private placement and public offering of equity and debt securities. We have historically financed our operations primarily from proceeds of registered direct offerings and private placements of equity securities and the sale of securities we acquired through investments made in other companies. In the event that we raise additional equity capital, investors’ interests in the Company will be diluted and investors may suffer dilution in their net book value per share depending on the price at which such securities are sold. If we issue any such additional equity securities, such issuances also will cause a reduction in the proportionate ownership and voting power of all other stockholders. Further, any such issuance may result in a change in control.
When we need additional financing, we cannot provide assurance that it will be available on favorable terms, if at all. If we need funds and cannot raise them on acceptable terms, we may not be able to:
| • | continue the development of our two active drug development programs; |
| • | resume development of any of our currently delayed drug development programs; |
| • | successfully out license or otherwise monetize any of our programs; or |
| • | continue operations. |
Our stock price could be volatile and our trading volume may fluctuate substantially.
The price of our common stock has been and may continue to be extremely volatile. Many factors could have a significant impact on the future price of our common stock, including:
| • | our inability to raise additional capital to fund our operations, whether through the issuance of equity securities or debt; |
9
Table of Contents
| • | our failure to successfully advance the development of our programs or otherwise implement our business objectives; |
| • | changes in our intellectual property portfolio or developments or disputes concerning the proprietary rights of our product candidates; |
| • | issuance of new or changed securities analysts’ reports or recommendations; |
| • | the degree of trading liquidity in our common stock; and |
| • | our ability to meet the minimum standards required for remaining listed on the NASDAQ Capital Market. |
Our business depends on collaborative arrangements.
Our strategy requires us to enter into licenses or other alliances and also to make dispositions of products that have reached a certain level of clinical development. We may be unable to identify profitable applications for our product candidates or demonstrate the potential benefits of such candidates, and we are unable to predict whether our product candidates will be accepted by potential licensing partners or purchasers. We may not be able to continue licensing or other partnering arrangements, and any such arrangements, even if completed successfully, may not be on terms favorable to us, may not perform as expected, may result in unexpected liabilities and may never contribute significant revenues or cash flow. We depend to a significant extent on the expertise of and dedication of sufficient resources by our licensors, licensees and corporate partners to develop and commercialize products. Each individual licensor, licensee or corporate partner will control the amount and timing of resources devoted by it to these activities. Moreover, the success of any such licenses or other alliances depends in part upon such partners’ own marketing and strategic considerations, including the relative advantages of alternative products and technologies being developed or marketed by such partners. Corporate partners may pursue alternative technologies or develop products that are competitive with our products. If any such partners are unsuccessful in developing or commercializing our product candidates, our business, financial condition and results of operations could be materially and adversely affected. Disputes may arise between us and one or more of our collaborative partners regarding their respective rights and obligations under collaborative arrangements. In such an event, we may be required to initiate or defend expensive litigation or arbitration proceedings or to seek and attempt to reach agreement with another collaborative partner. We may not be able to resolve successfully a dispute with a collaborative partner or to enter into a satisfactory arrangement with a replacement collaborative partner.
Our success depends on our ability to retain our managerial personnel and to attract additional personnel.
Our success depends largely on our ability to attract and retain managerial personnel. Competition for desirable personnel is intense, and there can be no assurance that we will be able to attract and retain the necessary staff. We currently have five full-time employees. The loss of members of managerial or scientific staff could have a material adverse effect on our future operations and on successful development of products for our target markets. The failure to maintain management, particularly our President and Chief Executive Officer, and to attract additional key personnel could materially adversely affect our business, financial condition and results of operations.
Competition from other pharmaceutical companies, biotechnology companies and other research and academic institutions is intense and expected to increase.
Competition from other pharmaceutical companies, biotechnology companies and other research and academic institutions is intense and expected to increase. Many of these companies have substantially greater financial and other resources and development capabilities than we have and have substantially greater experience in undertaking pre-clinical and clinical testing of products. In addition to competing with universities and other research institutions in the development of products, technologies and processes, we compete with other companies in acquiring rights to products or technologies from universities and other research institutions. There can be no assurance that we can develop products that are more effective or achieve greater market acceptance
10
Table of Contents
than competitive products, or that our competitors will not succeed in developing products and technologies that are more effective than those being developed by us that would render our products and technologies less competitive or obsolete.
The success of our business depends on our ability to develop and protect our intellectual property rights, which could be expensive.
Our success depends to a significant extent on our ability to obtain patent protection on technologies and products and preserve trade secrets and to operate without infringing the proprietary rights of others. There can be no assurance that any patent applications or patents we are able to license will afford any competitive advantages or will not be challenged or circumvented by third parties. Furthermore, there can be no assurance that others will not independently develop similar technologies or duplicate any technology developed by us. Because of the extensive time required for development, testing and regulatory review of a potential product, it is possible that before any of our potential products can be commercialized, any related patent may expire, or remain in existence for only a short period following commercialization, thus reducing any advantage of the patent.
We also rely on trademarks, copyrights, trade secrets and know-how to develop, maintain and strengthen our competitive positions. While we take steps to protect our proprietary rights to the extent possible, there can be no assurance that third parties will not know, discover or develop independently equivalent proprietary information or techniques, that they will not gain access to our trade secrets or disclose our trade secrets to the public. Therefore, we cannot guarantee that we can maintain and protect unpatented proprietary information and trade secrets. Misappropriation of our intellectual property would have an adverse effect on our competitive position and may cause us to incur substantial litigation costs.
We may be subject to claims that we infringe the intellectual property rights of others, and unfavorable outcomes could harm our business.
Our future operations may be subject to claims, and potential litigation, arising from our alleged infringement of patents, trade secrets or copyrights owned by other third parties. We intend to fully comply with the law in avoiding such infringements. However, within the drug development industry, established companies have actively pursued such infringements, and have initiated such claims and litigation, which has made the entry of competitive products more difficult. We may experience such claims or litigation initiated by existing, better-funded competitors. We could also become involved in disputes regarding the ownership of intellectual property rights that relate to our technologies. These disputes could arise out of collaboration relationships, strategic partnerships or other relationships. Any such litigation could be expensive, take significant time, and could divert management’s attention from other business concerns. Our failure to prevail in any such legal proceedings, or even the more occurrence of such legal proceedings, could substantially affect our ability to meet our expenses and continue operations.
Government regulation of our business is extensive and drug approvals are uncertain, expensive and time-consuming.
Our research, development, pre-clinical and clinical trials of most of our intended products are subject to an extensive regulatory approval process by the FDA and other regulatory agencies in the U.S. and abroad. The process of obtaining FDA and other required regulatory approvals for drug and biological products, including required pre-clinical and clinical testing, is lengthy, expensive and uncertain. Even if regulatory clearance is obtained, a marketed product is subject to continual review, and later discovery of previously unknown products or failure to comply with the applicable regulatory requirements may result in restrictions on a product’s marketing or withdrawal of the product from the market as well as possible criminal sanctions.
Due to resource constraints, currently we have only two drug candidates in development. A delay or setback in the clinical development of either of these candidates would likely have a material adverse effect on our business, financial condition and results of operations.
11
Table of Contents
Our business will always be strictly regulated by the federal and other governments, and there can be no assurance that we will remain in compliance with all applicable regulations.
Clinical testing and manufacture of our proposed products are subject to extensive regulation by numerous governmental authorities in the U.S., principally the FDA, and corresponding foreign regulatory agencies. Changes in existing regulations or adoption of new regulations or policies could prevent us from obtaining, or affect the timing of, future regulatory approvals or clearances. We cannot assure you that we will be able to obtain necessary regulatory clearances or approvals on a timely basis, or at all, or that we will not be required to incur significant costs in obtaining or maintaining such regulatory approvals. Delays in receipt of, or failure to receive, such approvals or clearances, the loss of previously obtained approvals or clearances or the failure to comply with existing or future regulatory requirements could have a material adverse effect on our business, financial condition and results of operations.
Any enforcement action by regulatory authorities with respect to past or future regulatory noncompliance could have a material adverse effect on our business, financial condition and results of operations. Noncompliance with applicable requirements can result in fines, injunctions, civil penalties, recall or seizure of products, total or partial suspension of production, refusal to authorize the marketing of new products and criminal prosecution.
Even if our proposed products are approved for market, we will be subject to continuing regulation. We and our collaborative partners will continuously be subject to routine inspection by the FDA and will have to comply with the host of regulatory requirements that usually apply to pharmaceutical products marketed in the U.S., including labeling regulations, GMP requirements, adverse drug experience regulation and the FDA’s regulations regarding promoting products for unapproved or “off-label” uses. Our failure to comply with applicable regulatory requirements could result in enforcement action by the FDA, which could have a material adverse effect on our business, financial condition and results of operations.
If the testing or use of our drug candidates harms people, we could face costly and damaging product liability claims far in excess of our liability coverage.
Our business exposes us to potential product liability risks that are inherent in the testing, manufacturing and marketing of pharmaceutical products, such as undesirable side effects or injury during clinical trials. In addition, the use in our clinical trials of drugs that we or our potential collaborators may develop and the subsequent sale of these drugs by us or our potential collaborators may expose us to liability risks relating to these drugs.
We have obtained limited product liability insurance coverage for our clinical trials. Claims or losses in excess of any product liability insurance coverage, however, could have a material adverse effect on our financial condition.
If the price of our common stock remains below $1.00 per share for a sustained period, our common stock may be delisted from the NASDAQ Capital Market.
Our common stock is currently traded on the NASDAQ Capital Market. The NASDAQ Capital Market imposes, among other requirements, listing maintenance standards including minimum bid and public float requirements. In particular, NASDAQ rules require us to maintain a minimum bid price of $1.00 per share of our common stock. Since November 2008, our common stock has traded below the $1.00 per share level. The closing price on March 5, 2010, was $0.54 per share. On September 15, 2009, we received a letter from NASDAQ stating that the minimum bid price of our common stock was below $1.00 per share for 30 consecutive business days and that we were therefore not in compliance with Marketplace Rule 5550(a)(2) (the “Minimum Bid Price Rule”). The notification letter stated that we had until March 15, 2010, to regain compliance with the Minimum Bid Price Rule. In accordance with Marketplace Rule 5810(c)(3)(a), to regain compliance the closing bid price of the our common stock must meet or exceed $1.00 per share for at least 10 consecutive business days.
We will not have regained compliance with the Minimum Bid Price Rule by March 15, 2010. Accordingly, we expect to receive a notice from NASDAQ on or about March 16, 2010 stating that due to our failure to so regain compliance with the Minimum Bid Price Rule our stock will be delisted unless we request a hearing before a
12
Table of Contents
NASDAQ Listing Qualifications Panel (the “Panel”). Should we receive such a notice we expect to request a hearing before the Panel. We are currently evaluating our alternatives to resolve the listing deficiency. There can be no assurance that the Panel will grant our request for continued listing, and if it does not, our common stock would be delisted from the NASDAQ Capital Market.
If our common stock were delisted from NASDAQ, among other things, it could lead to a number of negative implications, including reduced liquidity in our common stock, the loss of federal preemption of state securities laws, fewer business development opportunities and greater difficulty in obtaining financing.
We have never paid cash dividends and do not intend to do so.
We have never declared or paid cash dividends on our common stock. We currently plan to retain any earnings to finance the growth of our business rather than to pay cash dividends. Payments of any cash dividends in the future will depend on our financial condition, results of operations and capital requirements, as well as other factors deemed relevant by our board of directors.
Item 1B. Unresolved Staff Comments.
None.
Our principal property is our corporate headquarters located at 8601 Six Forks Road, Suite 160, Raleigh, North Carolina. We lease this office space (7,520 square feet) under a lease agreement with The Prudential Insurance Company of America that has a term that runs through March 31, 2013.
As of March 5, 2010, we had no outstanding material legal proceedings.
PART II
Item 5. Market for Registrant’s Common Equity, Related Stockholder Matters and Issuer Purchases of Equity Securities.
Market Information
The following table sets forth for the periods indicated the range of high and low reported sales price per share of our common stock as reported on The Nasdaq Capital Market, as adjusted for the one-for-forty stock split which occurred on February 12, 2008.
13
Table of Contents
| High ($) | Low ($) | |||
| 2009 |
||||
| First Quarter |
0.99 | 0.15 | ||
| Second Quarter |
1.00 | 0.27 | ||
| Third Quarter |
0.79 | 0.25 | ||
| Fourth Quarter |
0.55 | 0.23 | ||
| 2008 |
||||
| First Quarter |
6.65 | 1.70 | ||
| Second Quarter |
3.39 | 1.33 | ||
| Third Quarter |
2.02 | 1.01 | ||
| Fourth Quarter |
1.68 | 0.42 | ||
Stockholders
Our transfer Agent is American Stock Transfer and Trust Company. On March 5, 2010, the last reported sale price of our common stock on The Nasdaq Capital Market was $0.54 per share On March 5, 2010, there were approximately 4,157 holders of record of our common stock.
Dividend Policy
We have not declared or paid cash dividends on our common stock and do not anticipate paying any cash dividends in the foreseeable future. We expect to retain future earnings, if any, to fund the development and growth of our business. Our board of directors will determine future dividends, if any.
Item 6. Selected Financial Data.
Not applicable.
Item 7. Management’s Discussion and Analysis of Financial Condition and Results of Operations.
The following discussion and analysis should be read in conjunction with our Consolidated Financial Statements and related Notes included elsewhere in this Annual Report on Form 10-K. Some of the information contained in this Management’s Discussion and Analysis of Financial Condition and Results of Operations and elsewhere in this report includes forward-looking statements based on our current management’s expectations. There can be no assurance that actual results, outcomes or business conditions will not differ materially from those projected or suggested in such forward-looking statements as a result of various factors, including, among others, our limited operating history, unpredictability of future program dispositions and operating results, competitive pressures and the other potential risks and uncertainties discussed in the Risk Factors section of this Form 10-K.
Merger Transaction
On February 12, 2008, DARA BioSciences, Inc., formerly known as Point Therapeutics, Inc. (“we,” “us” and “our” or the “Company”), completed the merger transaction (the “Merger”) contemplated by the Agreement and Plan of Merger dated October 9, 2007, as amended December 19, 2007, among the Company, DP Acquisition Corp., a wholly-owned subsidiary of the Company (“Merger Sub”), and DARA BioSciences, Inc., a privately-held development stage pharmaceutical company based in Raleigh, North Carolina (“DARA”).
Pursuant to the Merger, each share of DARA common stock and preferred stock issued and outstanding immediately prior to the effective time of the Merger ceased to be outstanding and was converted into the right to receive 1.031406 shares of Company common stock, plus cash in lieu of any fractional shares. As a result of the transaction, the former DARA stockholders received 96.4% of the Company’s outstanding shares of common stock on a fully-diluted basis and Merger Sub merged with and into DARA, with DARA surviving as a wholly-
14
Table of Contents
owned subsidiary of the Company. Upon consummation of the Merger, the Company changed its name to DARA BioSciences, Inc.
For accounting purposes, the Merger was treated as a reverse acquisition with DARA being the accounting acquirer. Accordingly, the historical financial information in this Form 10-K prior to the Merger is that of DARA and its consolidated subsidiaries and all references to the “Company” in this Form 10-K relating to periods prior to the Merger refer to DARA.
Overview
We are a Raleigh, North Carolina-based development stage biopharmaceutical company that acquires promising therapeutic drug candidates from third parties and advances their clinical development for later sale or license to pharmaceutical and biotechnology companies or other entities that have the potential to complete development, gain approval and commercialize the product. We focus our therapeutic development efforts on small molecules from late preclinical development through Phase 2 clinical trials. We operate a business model that focuses on the following:
| • | Obtaining patents for innovative drug candidates which we believe have value in the marketplace; |
| • | Utilizing a small group of talented employees to develop those ideas through proof of concept in patients (generally through phase 2a clinical trials) by working with strategic outsource partners; and |
| • | Licensing the resulting product to a strong healthcare partner to commercialize. |
We do not intend to fully develop, obtain clearance from the U.S. Food and Drug Administration (“FDA”) or market the drug candidates we are developing.
While in the past we had a broader pipeline of drug development programs, we are currently focusing all of our resources on our two most advanced drug development programs which are KRN550 for the treatment of neuropathic pain in cancer patients and DB959 for the treatment of metabolic diseases including type 2 diabetes.
We have not generated any revenue from operations to date. We have liquidated or distributed to our stockholders some of our investments made in other companies. To date, we have received net proceeds from the sale of those assets in the amount of $178,124 in sale of marketable securities, $1,000,000 in net proceeds from the sale of an investment, of which $500,000 was originally a collateralized note payable that was cancelled with the sale of a portion of our investment. In addition, we raised $500,000 through direct sale of our investments. These proceeds together with capital raised from the sale of our securities have been our primary source of working capital.
We expect to continue to incur operating losses in the near-term. Our results may vary depending on many factors, including pre-clinical and clinical test results, the performance of our strategic outsource partners and the progress of licensing activities with pharmaceutical partners.
Status of our Drug Candidates
We currently have a portfolio of drug candidates for the treatment of neuropathic pain for patients with cancer, type II diabetes (including dyslipidemia), enhancement of homing and engraftment of stem cell transplantation and psoriasis. Our cost containment program announced on January 6, 2009, designed to reduce our cash burn rate, necessitated that we focus the majority of our working capital on advancing our two lead programs; the continued development of KRN5500 for the treatment of neuropathic pain for patients with cancer and DB959 for the treatment type II diabetes. Due to this allocation, we reduced our headcount by approximately 60 per cent and inventoried three programs, DB160, DB900 and DB200, for future development. Based on our present working capital and sharpened focus, we have sufficient working capital to advance KRN5500 and DB959 development through 2010. In the event that these two candidates are not monetized during 2010, additional funding will be required to continue development. A brief discussion of the status of each of our drug candidates follows.
15
Table of Contents
KRN5500
KRN5500 is a drug candidate for the treatment of neuropathic pain in cancer patients. An active component of KRN5500 has been shown to inhibit nerve cell pain signals. The primary segment of the market being targeted by KRN5500 is chemotherapy-induced neuropathic pain. On May 12, 2009, we announced positive results from the recently completed Phase 2a clinical trial in cancer patients with neuropathic pain to assess its safety and efficacy. A second larger Phase 2 trial is planned for mid 2010.
We incurred $438,962 in development costs associated with the development of KRN5500 during 2009, and we have incurred costs of $3,407,109 from inception to date. We estimate the market potential for chemotherapy-induced neuropathy to be roughly $1.6 billion in 2014.
DB959
DB959 is a PPARd/g agonist for the treatment of type 2 diabetes. In March 2009, the FDA cleared our IND application for DB959, allowing us to commence Phase 1 studies in humans. These clinical trials are expected to commence in March 2010 and we anticipate engaging a clinical research organization to assist with these trials. This compound activates genes involved in the metabolism of sugars and fats thereby improving the body’s ability to regulate blood sugar. We are developing this drug candidate as a once-daily oral therapy. Our review of non-clinical data indicates that this drug candidate is a potential leading successor to Avandia® and Actos® because, among other indications, it increases good HDL cholesterol and lowers triglycerides better than Avandia® with greater cardiac safety and less weight gain.
Our development work on DB959 is being conducted under an exclusive worldwide license to develop and commercialize the drug candidate from Bayer Pharmaceuticals Corp. This license, which was acquired in October 2007, gives us rights to over 2,000 compounds with agonist activities toward multiple PPAR sub-types. On October 24, 2008, in accordance with the terms of this license, we provided Bayer with written notice of our intent to pursue a sublicense of our rights under the agreement to a third party for purposes of enabling such third party to commercialize “Licensed Products” (as such term is defined in the agreement). Under the terms of the license agreement, unless Bayer exercises certain rights of first refusal provided to it under the agreement and we reach agreement with Bayer concerning commercialization of Licensed Products, we will be permitted to enter into an agreement with a third party concerning commercialization of Licensed Products.
We incurred $841,246 in direct outside development costs associated with the development of DB959 during 2009, and we have incurred costs of $4,207,646 from inception to date as this program started the latter part of 2007. We estimate the market potential for the PPAR agonist segment of type 2 Diabetes market to be roughly $21 billion in 2034.
Based on recently published literature, we are exploring the PPARs in our library for the treatment of Alzheimer’s disease, Multiple sclerosis (MS), liver disease, and autoimmune disease.
DB160
DB160 is a dipeptidylpeptidase (DPPIV) inhibitor for the treatment of type 2 diabetes. DDPIV is an enzyme that inactivates a key hormone involved in promoting control of blood sugar levels thus giving diabetics better control of their blood sugar levels. Prior to the implementation of our January 2009 cost reduction plan, we were developing this drug candidate as a once-daily oral therapy. We have currently suspended the development of DB160, but we will continue to evaluate the competitive environment for DB160 and potential positioning of the compound for other indications. If our evaluation concludes that further development is warranted, the next step in our development of this candidate would be to file an IND application with the FDA. Our development work with DB160 is pursuant to an exclusive worldwide license to develop and commercialize the drug candidate from Nuada, LLC.
16
Table of Contents
We incurred $42,173 in direct outside development costs associated with the development of DB160 during 2009, and we have incurred costs of $2,294,463 from inception to date. We estimate the market potential for the DPP-IV inhibitor segment of the type 2 diabetes market to be roughly $21 billion in 2034.
On August 4, 2009, we announced a collaboration with America Stem Cell to expand on observations from recent preclinical studies showing that DPPIV inhibitors improve the efficiency of hematopoietic stem cell (HSC) transplants. On October 12, 2009, we entered into an Addendum and First Amendment to Material Transfer Agreement with America Stem Cell, Inc. pursuant to which the Material Transfer Agreement between the Company and America Stem Cell was amended. Under the Material Transfer Agreement, the Company is providing America Stem Cell with DPPIV inhibitors from our proprietary library which America Stem Cell is using to further its research and development program related to HSC transplants.
Under the Material Transfer Agreement as amended, America Stem Cell is required to pay us a total of $250,000, in four equal installments over approximately three years, contingent upon America Stem Cell’s receipt of a specified amount of grant funding for its HSC research and development program.
DB900
DB900 is a series of compounds which are PPARg/a/d agonists for the treatment of type 2 diabetes. These compounds activate genes involved in the metabolism of sugars and fats thereby improving the body’s ability to regulate blood sugar. These compounds have the potential to raise good HDL cholesterol, lower bad LDL cholesterol and lower triglycerides with potential greater efficacy than DB959 as well as the potential to deliver weight loss. This program is currently not being resourced. Development will not be re-initiated until sufficient additional funding is secured. Should we decide to resume the development of DB900, a clinical candidate will be selected from a number of strong lead compounds. Our development work with DB900 is pursuant to an exclusive worldwide license to develop and commercialize the drug candidate from Bayer Pharmaceuticals Corp.
We incurred $14,264 in direct outside development costs associated with the development of DB900 series compounds during 2009, and we have incurred costs of $129,272 from inception to date. We estimate the market potential for the PPAR agonist segment of type 2 Diabetes market to be roughly $30.0 billion in 2014.
DB200
DB200 refers to a series of compounds that are inhibitors of CPT-1 for the topical treatment of psoriasis. This drug candidate has the potential to inhibit inflammation and the proliferation of skin cells thus resulting in decreased reddening and less flaking of the skin. Should development of DB200 resume, a clinical candidate will be selected from a number of strong lead compounds. This program is currently not being resourced. Development will not be re-initiated until sufficient additional funding is secured. Should we decide to resume the development of DB200, the next step in the process would be to file an IND application with the FDA. There are no third party licenses associated with this program.
We incurred $2,579 in direct development costs associated with the development of DB200 series compounds during 2009, and we have incurred costs of $379,219 from inception to date. We estimate the market potential for the topical agent segment of the psoriasis market to be roughly $3.9 billion in 2011.
Talabostat
We have no current plans to develop Talabostat as a therapy for lung cancer, the original indication for which it was studied at Point Therapeutics in humans. However, as we continue to receive requests for Talabostat material for other investigations, we recognize value in maintaining the patent estate, as potential future uses for this drug may be identified as a result of these other investigations. Therefore, we continue to keep these filings current by paying the various patent-related fees which become due.
17
Table of Contents
We incurred $35,492 in direct costs associated with Talabostat during 2009, and we have incurred costs of $71,325 from inception to date.
Critical Accounting Policies and Significant Judgments and Estimates
Critical Accounting Policies
Our management’s discussion and analysis of our financial condition and results of operations are based on our consolidated financial statements, which have been prepared in accordance with generally accepted accounting principles. The preparation of these financial statements requires us to make estimates and assumptions that affect the reported amounts of assets and liabilities and the disclosure of contingent assets and liabilities at the date of the financial statements as well as the reported revenues and expenses during the reporting periods. On an ongoing basis, we evaluate our estimates and judgments, including those related to clinical trial expenses, stock-based compensation and asset impairment and significant judgments and estimates. We base our estimates on historical experience and on various other factors that are believed to be appropriate under the circumstances, the results of which form the basis for making judgments about the carrying value of assets and liabilities that are not readily apparent from other sources. Actual results may differ from these estimates under different assumptions or conditions.
While our significant accounting policies are more fully described in Note 2 to our consolidated financial statements included in this report, we believe the following accounting policies are most critical to aid in fully understanding and evaluating our reported financial results.
Research and Development Expenses
We expense research and development expenses when incurred. The cost of certain research programs, such as patient recruitment and related supporting functions for clinical trials, are based on reports and invoices submitted by the contract research organization (“CRO”) assisting us in conducting the clinical trial. These expenses are based on patient enrollment as well as costs consisting primarily of payments made to the CRO, clinical centers, investigators, testing facilities and patients for participating in our clinical trials. Certain research and development costs must be prepaid which, if the research and development work ceases to progress for whatever reason, are not repayable to us. In such cases, those costs are expensed when paid.
Accrued Expenses
As part of the process of preparing financial statements, we are required to estimate accrued expenses. This process involves reviewing open contracts and purchase orders, communicating with applicable personnel to identify services that have been performed on our behalf and estimating the level of service performed and the associated cost incurred for the service when invoices have not yet been sent and we have not otherwise been notified of actual cost. The majority of our service providers invoice monthly in arrears for services performed. We make estimates of accrued expenses as of each balance sheet date in our financial statements based on facts and circumstances known to us. We periodically confirm the accuracy of our estimates with the service providers and makes adjustments if necessary. Examples of estimated accrued expenses include:
| • | fees paid to CROs in connection with preclinical and toxicology studies and clinical trials; |
| • | fees paid to investigative sites in connection with clinical trials; |
| • | fees paid to contract manufacturers in connection with the production of raw materials, drug substance and drug products; and |
| • | professional service fees. |
18
Table of Contents
Share-Based Compensation
Share-based compensation is accounted for using the fair value based method prescribed by Financial Accounting Standards Board Accounting Standards Codification 718 (formerly referred to as SFAS 123R) (“ASC 718, Compensation-Stock Compensation”). For stock and stock-based awards issued to employees, a compensation charge is recorded against earnings based on the fair value of the award. For transactions with non-employees in which services are performed in exchange for the Company’s common stock or other equity instruments, the transactions are recorded on the basis of the fair value of the service received or the fair value of the equity instruments issued, whichever is more readily measurable at the date of issuance. Please refer to Note 12 - Stock Based Compensation, included in the condensed consolidated financial statements appearing elsewhere in this report, for additional information regarding our adoption of ASC 718.
Significant Judgments and Estimates
The preparation of our consolidated financial statements in conformity with U.S. generally accepted accounting principles requires that we make estimates and assumptions that affect the reported amounts and disclosure of certain assets and liabilities at our balance sheet date. Such estimates include the carrying value of property and equipment and the value of certain liabilities. Actual results may differ from such estimates.
Results of Operations
Research and development expenses decreased from $7,323,304 for the year ended December 31, 2008 to $1,887,213 for the year ended December 31, 2009, primarily as a result of the implementation of our January 2009 cost reduction plan.
General and administrative expenses consist primarily of salaries and benefits, professional fees related to administrative, finance, human resource, legal and information technology functions and patent costs. In addition, general and administrative expenses include allocated facility, basic operational and support costs and insurance costs. General and administrative expenses decreased from $4,683,969 in 2008 to $2,848,162 in 2009, primarily as a result of the implementation of our January 2009 cost reduction plan. For 2009, our Chief Executive Officer did not receive a cash salary and all salary increases and 401k contributions were suspended. In addition, our non-employee directors received no cash compensation in 2009.
Other income (expense), net reflects non-operating activities associated with investments and dispositions on investments made in collaborations with other companies. Other income, net increased from income of $108,956 in 2008 to $1,173,421 in 2009. This increase was primarily because in 2008 there were no recognized gains on nonmonetary assets or from the sale of securities compared to in 2009 recognizing (1) a gain on nonmonetary assets of $91,910 as a result of our distribution of a dividend of 100,000 shares of SurgiVision stock to members of the board and our former Chief Financial Officer, (2) a gain from the sale of securities of $177,724 as a result of our sale of all of our 400,002 MiMedx shares and (3) the gain on sale of $952,791 from of our sale of a portion of our SurgiVision shares.
Liquidity and Capital Resources
Overview
From inception through December 31, 2009, we have financed our operations primarily from the net proceeds of (1) registered direct offerings and private placements of equity securities, through which we raised $30,395,433 in net proceeds and (2) the sale of securities held in subsidiary companies and marketable securities, through which we raised $4,405,692 and $1,951,211, respectively.
At December 31, 2009, our principal sources of liquidity were our cash and cash equivalents which totaled $3,167,302. As of December 31, 2009, we had net working capital of $2,650,872.
19
Table of Contents
Our cash resources have been used to acquire licenses and to fund research and development activities, capital expenditures and general and administrative expenses.
We have incurred significant net losses and have had negative cash flows from operations during each period from inception through December 31, 2009 and have a deficit accumulated during the development stage of $27,893,552 at December 31, 2009. Management expects operating losses and negative cash flows to continue through 2010 and the foreseeable future.
Cash Flows
During 2009, our cash and cash equivalents increased by $2,207,404 from December 31, 2008.
Our operating activities used net cash of $4,421,619 for the year ended December 31, 2009 primarily to fund our net loss of $3,561,954 and due to the gain on sale of investments and marketable securities of $1,130,515, a decrease in accounts payable of $491,516, the distribution of nonmonetary asset of $91,910 and a decrease in accrued expenses of $54,419, partially offset by non-cash share-based compensation of $503,062, depreciation and amortization of $157,171 and distribution of investment for compensation of $100,000.
Our investing activities provided net cash of $675,178 for the year ended December 31, 2009 primarily from the proceeds in the sale of marketable securities of $178,124 and the proceeds of $500,000 from our sale of 500,000 SurgiVision shares.
Our financing activities provided net cash of $5,953,845 for the year ended December 31, 2009 primarily as a result of $5,356,581 in total net proceeds from our June 2009 private placement and from three registered direct offerings in September and October 2009, from the cancellation of $500,000 of outstanding principal on our secured promissory note issued to SurgiVision in January 2009 and $110,750 in proceeds from the exercise of options.
Financial Condition
We believe we have sufficient working capital to pursue our current limited operations through the end of 2010. We will require additional funds to pursue our business plan. Our working capital requirements will depend upon numerous factors, including the progress of our research and development programs (which may vary as product candidates are added or abandoned), preclinical testing and clinical trials, timing and cost of seeking as well as the achievement of regulatory milestones, the status of competitive programs, and the ability to sell or license our technologies to third parties. In any event, we will require substantial funds in addition to those presently available to develop all of our programs to meet our business objectives. To ensure the continued level of research development and funding of our operations, we are currently exploring various possible financing options that may be available to us, which may include a sale of our securities or the sale of certain of our investments. We have no commitments to obtain any additional funds, and there can be no assurance such funds will be available on acceptable terms or at all. If we are unable to obtain such needed capital, we may not be able to:
| • | continue the development of our two active drug development programs; |
| • | resume development of any of our currently inactive drug development programs; |
| • | successfully out license or otherwise monetize any of our programs; or |
| • | remain in operation. |
Off-Balance Sheet Arrangements
We had no off-balance sheet arrangements as of December 31, 2009.
20
Table of Contents
NASDAQ Capital Market Listing
Our common stock is currently traded on the NASDAQ Capital Market. The NASDAQ Capital Market imposes, among other requirements, listing maintenance standards including minimum bid and public float requirements. In particular, NASDAQ rules require us to maintain a minimum bid price of $1.00 per share of our common stock. Since November 2008, our common stock has traded below the $1.00 per share level. The closing price on March 5, 2010, was $0.54 per share. On September 15, 2009, we received a letter from NASDAQ stating that the minimum bid price of our common stock was below $1.00 per share for 30 consecutive business days and that we were therefore not in compliance with Marketplace Rule 5550(a)(2) (the “Minimum Bid Price Rule”). The notification letter stated that we had until March 15, 2010, to regain compliance with the Minimum Bid Price Rule. In accordance with Marketplace Rule 5810(c)(3)(a), to regain compliance the closing bid price of the our common stock must meet or exceed $1.00 per share for at least 10 consecutive business days.
We will not have regained compliance with the Minimum Bid Price Rule by March 15, 2010. Accordingly, we expect to receive a notice from NASDAQ on or about March 16, 2010 stating that due to our failure to so regain compliance with the Minimum Bid Price Rule our stock will be delisted unless we request a hearing before a NASDAQ Listing Qualifications Panel (the “Panel”). Should we receive such a notice we expect to request a hearing before the Panel. We are currently evaluating our alternatives to resolve the listing deficiency. There can be no assurance that the Panel will grant our request for continued listing, and if it does not, our common stock would be delisted from the NASDAQ Capital Market.
New Accounting Pronouncements
In June, 2009, FASB issued and the Company adopted FASB ASC 105, Generally Accepted Accounting Principles. FASB ASC 105 approved the FASB ASC as the source of authoritative nongovernmental GAAP. All existing accounting standards have been superseded and all other accounting literature not included in the FASB ASC will be considered nonauthoritative. Accordingly, all references to accounting standards have been conformed to the new ASC hierarchy.
In May 2009, the FASB issued FASB ASC 855, Subsequent Events. FASB ASC 855 establishes principles and requirements for subsequent events, in particular: (i) the period after the balance sheet date during which management of a reporting entity shall evaluate events or transactions that may occur for potential recognition or disclosure in the financial statements; (ii) the circumstances under which an entity shall recognize events or transactions occurring after the balance sheet date in its financial statements; and (iii) the disclosures that an entity shall make about events or transactions that occurred after the balance sheet date. See Note 17 for further information.
In December 2007, the FASB issued FASB ASC 810, Consolidation. FASB ASC 810 requires that noncontrolling interests (previously referred to as minority interests) be clearly identified and presented as a component of equity, separate from the parent’s equity. FASB ASC 810 also requires that the amount of consolidated net income attributable to the parent and to the noncontrolling interest be clearly identified and presented on the face of the consolidated statement of income; that changes in ownership interest be accounted for as equity transactions; and that when a subsidiary is deconsolidated, any retained noncontrolling equity investment in that subsidiary and the gain or loss on the deconsolidation of that subsidiary be measured at fair value. FASB ASC 810 is to be applied prospectively, except for the presentation and disclosure requirements (which are to be applied retrospectively for all periods presented) and is effective for fiscal years beginning after December 15, 2008. Effective January 1, 2009, the Company adopted FASB ASC 810. The effect was an increase in total equity of $430,861 as of December 31, 2009 and $649,200 for December 31, 2008. There was no material effect to the Company’s consolidated results of operations.
FASB ASC 810 also requires retrospective application of its disclosure and presentation requirements for all periods presented. Accordingly, noncontrolling interests at December 31, 2008 which were previously reported as minority interest in subsidiary, have been reclassified as a separate component of equity. Furthermore, net earnings previously reported as minority interest in subsidiary for the year ended December 31, 2009 and for the
21
Table of Contents
period from June 22, 2002 (inception) through December 31, 2009 have been presented as attributable to noncontrolling interest.
In November 2007, the EITF ratified a consensus on FASB ASC 808, Collaborative Arrangements, which requires participants in a collaboration to make separate disclosures regarding the nature and purpose of an arrangement, their rights and obligations under the arrangement, the accounting policy for the arrangement and the income statement classification and amounts arising from the arrangement between participants for each period an income statement is presented. FASB ASC 808 is effective beginning January 1, 2009. The Company’s adoption of FASB ASC 808 did not have a material effect on the Company’s consolidated results of operations and financial position.
Item 7A. Quantitative and Qualitative Disclosure About Market Risk.
Not applicable.
22
Table of Contents
Item 8. Financial Statements and Supplementary Data.
DARA BioSciences, Inc.
(A Development Stage Company)
INDEX TO FINANCIAL STATEMENTS
| Page | ||
| 24 | ||
| 25 | ||
| 26 | ||
| 27 | ||
| 31 | ||
| 33 | ||
23
Table of Contents
DARA BIOSCIENCES, INC. AND SUBSIDIARIES
(A Development Stage Company)
REPORT OF INDEPENDENT REGISTERED PUBLIC ACCOUNTING FIRM
The Board of Directors and Shareholders of DARA BioSciences, Inc.
We have audited the accompanying consolidated balance sheets of DARA BioSciences, Inc. and subsidiaries, as of December 31, 2009 and 2008, and the related consolidated statements of operations, stockholders’ equity, and cash flows for each of the two years in the period ended December 31, 2009 and for the period from June 22, 2002 (date of inception) through December 31, 2009. These financial statements are the responsibility of the Company’s management. Our responsibility is to express an opinion on these financial statements based on our audits.
We conducted our audits in accordance with the standards of the Public Company Accounting Oversight Board (United States). Those standards require that we plan and perform the audit to obtain reasonable assurance about whether the financial statements are free of material misstatement. We were not engaged to perform an audit of the Company’s internal control over financial reporting. Our audits included consideration of internal control over financial reporting as a basis for designing audit procedures that are appropriate in the circumstances, but not for the purpose of expressing an opinion on the effectiveness of the Company’s internal control over financial reporting. Accordingly, we express no such opinion. An audit also includes examining, on a test basis, evidence supporting the amounts and disclosures in the financial statements, assessing the accounting principles used and significant estimates made by management, and evaluating the overall financial statement presentation. We believe that our audits provide a reasonable basis for our opinion.
In our opinion, the financial statements referred to above present fairly, in all material respects, the consolidated financial position of DARA BioSciences, Inc. and subsidiaries, at December 31, 2009 and 2008, and the consolidated results of their operations and their cash flows for each of the two years in the period ended December 31, 2009 and for the period from June 22, 2002 (date of inception) through December 31, 2009, in conformity with U.S. generally accepted accounting principles.
/s/ Ernst & Young LLP
Raleigh, North Carolina
March 9, 2010
24
Table of Contents
DARA BIOSCIENCES, INC. AND SUBSIDIARIES
(A Development Stage Company)
CONSOLIDATED BALANCE SHEETS
| December 31, | ||||||||
| 2009 | 2008 | |||||||
| Assets |
||||||||
| Current assets: |
||||||||
| Cash and cash equivalents |
$ | 3,167,302 | $ | 959,898 | ||||
| Marketable securities |
— | 1,656,408 | ||||||
| Prepaid expenses and other assets, current portion |
149,040 | 113,694 | ||||||
| Total current assets |
3,316,342 | 2,730,000 | ||||||
| Furniture, fixtures and equipment, net |
56,213 | 112,253 | ||||||
| Restricted cash |
78,757 | 78,105 | ||||||
| Prepaid expenses and other assets, net of current portion |
216,664 | 285,996 | ||||||
| Prepaid license fee, net |
340,000 | 460,000 | ||||||
| Investments |
130,468 | 222,479 | ||||||
| Total assets |
$ | 4,138,444 | $ | 3,888,833 | ||||
| Liabilities and stockholders’ equity |
||||||||
| Current liabilities: |
||||||||
| Accounts payable |
$ | 374,565 | $ | 866,081 | ||||
| Accrued liabilities |
284,567 | 328,117 | ||||||
| Capital lease obligation, current portion |
6,338 | 12,951 | ||||||
| Total current liabilities |
665,470 | 1,207,149 | ||||||
| Deferred lease obligation |
10,968 | 5,933 | ||||||
| Other liability |
268,622 | 253,174 | ||||||
| Capital lease obligation, net of current portion |
22,009 | 48,973 | ||||||
| Patent obligation |
17,895 | 20,261 | ||||||
| Total liabilities |
984,964 | 1,535,490 | ||||||
| Stockholders’ equity |
||||||||
| Common stock, $.01 par value, 75,000,000 shares authorized, 44,633,474 shares issued and outstanding at December 31, 2009, 30,113,829 issued and outstanding as of December 31, 2008. |
446,335 | 301,138 | ||||||
| Additional paid-in capital |
30,169,836 | 24,296,934 | ||||||
| Accumulated other comprehensive income |
— | 1,656,008 | ||||||
| Deficit accumulated during the development stage |
(27,893,552 | ) | (24,549,937 | ) | ||||
| Total stockholders’ equity before noncontrolling interest |
2,722,619 | 1,704,143 | ||||||
| Noncontrolling interest |
430,861 | 649,200 | ||||||
| Total stockholders’ equity |
3,153,480 | 2,353,343 | ||||||
| Total liabilities and stockholders’ equity |
$ | 4,138,444 | $ | 3,888,833 | ||||
The accompanying notes are an integral part of these consolidated financial statements.
25
Table of Contents
DARA BIOSCIENCES, INC. AND SUBSIDIARIES
(A Development Stage Company)
CONSOLIDATED STATEMENTS OF OPERATIONS
| Year Ended December 31, | Period from June 22, 2002 (inception) through December 31, |
|||||||||||
| 2009 | 2008 | 2009 | ||||||||||
| Operating expenses: |
||||||||||||
| Research and development |
$ | 1,887,213 | $ | 7,323,304 | $ | 19,258,284 | ||||||
| General and administrative |
2,848,162 | 4,683,969 | 19,455,686 | |||||||||
| Total operating expenses |
4,735,375 | 12,007,273 | 38,713,970 | |||||||||
| Loss from operations |
(4,735,375 | ) | (12,007,273 | ) | (38,713,970 | ) | ||||||
| Other income (expense): |
||||||||||||
| Gain on distribution of nonmonetary asset |
91,910 | — | 4,760,953 | |||||||||
| Gain on sale of marketable securities and nonmonetary assets |
1,130,515 | — | 6,780,147 | |||||||||
| Other (expense) income, net |
(9,575 | ) | (15,981 | ) | 110,343 | |||||||
| Interest (expense) income, net |
(39,429 | ) | 124,937 | 751,656 | ||||||||
| Total other income, net |
1,173,421 | 108,956 | 12,403,099 | |||||||||
| Loss before undistributed loss in equity method investments and net loss attributable to noncontrolling interests |
(3,561,954 | ) | (11,898,317 | ) | (26,310,871 | ) | ||||||
| Undistributed loss in equity method investments |
— | — | (2,374,422 | ) | ||||||||
| Consolidated net loss |
(3,561,954 | ) | (11,898,317 | ) | (28,685,293 | ) | ||||||
| Net loss attributable to noncontrolling interest |
218,339 | 328,975 | 1,011,088 | |||||||||
| Net loss attributable to controlling interest |
$ | (3,343,615 | ) | $ | (11,569,342 | ) | $ | (27,674,205 | ) | |||
| Basic and diluted net loss per common share attributable to controlling interest |
$ | (0.10 | ) | $ | (0.42 | ) | ||||||
| Shares used in computing basic and diluted net loss per common share attributable to controlling interest |
35,032,454 | 27,725,415 | ||||||||||
The accompanying notes are an integral part of these consolidated financial statements.
26
Table of Contents
DARA BIOSCIENCES, INC. AND SUBSIDIARIES
(A Development Stage Company)
CONSOLIDATED STATEMENTS OF STOCKHOLDERS’ EQUITY
| Series A Convertible Preferred Stock |
Series B Convertible Preferred Stock |
Common Stock | Additional Paid-In Capital |
Stock Subscription Receivable |
Deficit Accumulated During the Development Stage |
Accumulated Other Comprehensive Income |
Stockholders’ Equity (Deficit) Before Noncontrolling Interest |
Noncontrolling Interest |
Total Stockholders’ Equity |
|||||||||||||||||||||||||||||||
| Shares | Amount | Shares | Amount | Shares | Amount | |||||||||||||||||||||||||||||||||||
| Issuance of common stock to founders |
— | $ | — | — | $ | — | 1,040,000 | $ | 1,040 | $ | — | $ | — | $ | — | $ | — | $ | 1,040 | $ | — | $ | 1,040 | |||||||||||||||||
| Net loss |
— | — | — | — | — | — | — | — | (111,563 | ) | — | (111,563 | ) | — | (111,563 | ) | ||||||||||||||||||||||||
| Balance at December 31, 2002 |
— | — | — | — | 1,040,000 | 1,040 | — | — | (111,563 | ) | — | (110,523 | ) | — | (110,523 | ) | ||||||||||||||||||||||||
| Issuance of common stock |
— | — | — | — | 4,960,000 | 4,960 | — | — | — | — | 4,960 | — | 4,960 | |||||||||||||||||||||||||||
| Issuance of preferred stock, net of issuance costs of $176,959 |
3,335,000 | 3,335 | — | — | — | — | 3,158,041 | — | — | — | 3,161,376 | — | 3,161,376 | |||||||||||||||||||||||||||
| Share based compensation |
— | — | — | — | — | — | 57,000 | — | — | — | 57,000 | — | 57,000 | |||||||||||||||||||||||||||
| Net loss and comprehensive loss |
— | — | — | — | — | — | — | — | (589,010 | ) | — | (589,010 | ) | — | (589,010 | ) | ||||||||||||||||||||||||
| Balance at December 31, 2003 |
3,335,000 | 3,335 | — | — | 6,000,000 | 6,000 | 3,215,041 | — | (700,573 | ) | — | 2,523,803 | — | 2,523,803 | ||||||||||||||||||||||||||
| Issuance of common stock |
— | — | — | — | 292,400 | 293 | 174,707 | — | — | — | 175,000 | — | 175,000 | |||||||||||||||||||||||||||
| Issuance of preferred stock, net of issuance costs of $155,948 |
1,665,000 | 1,665 | 360,000 | 360 | — | — | 2,589,052 | — | — | — | 2,591,077 | — | 2,591,077 | |||||||||||||||||||||||||||
| Stock subscription receivable |
— | — | — | — | 262,500 | 262 | 242,238 | (242,500 | ) | — | — | — | — | — | ||||||||||||||||||||||||||
| Issuance of options for services |
— | — | — | — | — | — | 12,254 | — | — | — | 12,254 | — | 12,254 | |||||||||||||||||||||||||||
| Share based compensation |
— | — | — | — | — | — | 94,219 | — | — | — | 94,219 | — | 94,219 | |||||||||||||||||||||||||||
| Net loss and comprehensive loss |
— | — | — | — | — | — | — | — | (3,949,039 | ) | — | (3,949,039 | ) | — | (3,949,039 | ) | ||||||||||||||||||||||||
| Balance at December 31, 2004 |
5,000,000 | $ | 5,000 | 360,000 | $ | 360 | 6,554,900 | $ | 6,555 | $ | 6,327,511 | $ | (242,500 | ) | $ | (4,649,612 | ) | $ | — | $ | 1,447,314 | $ | — | $ | 1,447,314 | |||||||||||||||
The accompanying notes are an integral part of these consolidated financial statements.
27
Table of Contents
DARA BIOSCIENCES, INC. AND SUBSIDIARIES
(A Development Stage Company)
CONSOLIDATED STATEMENTS OF STOCKHOLDERS’ EQUITY (continued)
| Series A Convertible Preferred Stock |
Series B Convertible Preferred Stock |
Common Stock | Additional Paid-In Capital |
Stock Subscription Receivable |
Deficit Accumulated During the Development Stage |
Accumulated Other Comprehensive Income |
Stockholders’ Equity (Deficit) Before Noncontrolling Interest |
Noncontrolling Interest |
Total Stockholders’ Equity |
||||||||||||||||||||||||||||||||
| Shares | Amount | Shares | Amount | Shares | Amount | ||||||||||||||||||||||||||||||||||||
| Balance at December 31, 2004 |
5,000,000 | $ | 5,000 | 360,000 | $ | 360 | 6,554,900 | $ | 6,555 | $ | 6,327,511 | $ | (242,500 | ) | $ | (4,649,612 | ) | $ | — | $ | 1,447,314 | $ | — | $ | 1,447,314 | ||||||||||||||||
| Common stock dividend |
— | — | — | — | 6,878,264 | 6,878 | (6,878 | ) | — | — | — | — | — | — | |||||||||||||||||||||||||||
| Issuance of common stock |
— | — | — | — | 126,310 | 126 | 67,474 | — | — | — | 67,600 | — | 67,600 | ||||||||||||||||||||||||||||
| Issuance of preferred stock, net of issuance costs of $88,877 |
— | — | 1,715,334 | 1,715 | — | 4,793,625 | — | — | — | 4,795,340 | — | 4,795,340 | |||||||||||||||||||||||||||||
| Issuance of options for services |
— | — | — | — | — | — | 16,304 | — | — | — | 16,304 | — | 16,304 | ||||||||||||||||||||||||||||
| Share based compensation |
— | — | — | — | — | — | 1,224,805 | — | — | — | 1,224,805 | — | 1,224,805 | ||||||||||||||||||||||||||||
| Dividend of Medivation, Inc. stock |
— | — | — | — | — | — | (2,532,600 | ) | — | — | — | (2,532,600 | ) | — | (2,532,600 | ) | |||||||||||||||||||||||||
| Comprehensive loss: |
|||||||||||||||||||||||||||||||||||||||||
| Net loss |
— | — | — | — | — | — | — | — | (4,618,654 | ) | — | (4,618,654 | ) | — | (4,618,654 | ) | |||||||||||||||||||||||||
| Unrealized gain on investments |
— | — | — | — | — | — | — | — | — | 647,572 | 647,572 | — | 647,572 | ||||||||||||||||||||||||||||
| Comprehensive loss |
$ | (3,971,082 | ) | $ | — | $ | (3,971,082 | ) | |||||||||||||||||||||||||||||||||
| Balance at December 31, 2005 |
5,000,000 | 5,000 | 2,075,334 | 2,075 | 13,559,474 | 13,559 | 9,890,241 | (242,500 | ) | (9,268,266 | ) | 647,572 | 1,047,681 | 1,047,681 | |||||||||||||||||||||||||||
| Issuance of common stock |
— | — | — | — | 50 | — | 50 | — | — | — | 50 | — | 50 | ||||||||||||||||||||||||||||
| Non-cash exercise of options |
— | — | — | — | 160,833 | 161 | (161 | ) | — | — | — | — | — | — | |||||||||||||||||||||||||||
| Issuance of preferred stock, net of issuance costs of $487,987 |
— | — | 4,274,999 | 4,275 | — | — | 12,332,739 | — | — | — | 12,337,014 | — | 12,337,014 | ||||||||||||||||||||||||||||
| Non-cash exercise of warrants |
— | — | — | — | 334,133 | 334 | (334 | ) | — | — | — | — | — | — | |||||||||||||||||||||||||||
| Issuance of common stock warrants |
— | — | — | — | 26,667 | 27 | 79,974 | — | — | — | 80,001 | — | 80,001 | ||||||||||||||||||||||||||||
| Share based compensation |
— | — | — | — | — | — | 339,505 | — | — | — | 339,505 | — | 339,505 | ||||||||||||||||||||||||||||
| Distribution of Surgi-vision, Inc. stock |
— | — | — | — | — | — | (3,083,156 | ) | — | — | — | (3,083,156 | ) | — | (3,083,156 | ) | |||||||||||||||||||||||||
| Comprehensive loss: |
|||||||||||||||||||||||||||||||||||||||||
| Net loss |
— | — | — | — | — | — | — | — | (1,965,290 | ) | — | (1,965,290 | ) | — | (1,965,290 | ) | |||||||||||||||||||||||||
| Unrealized gain on investments |
— | — | — | — | — | — | — | — | 4,799,964 | 4,799,964 | — | 4,799,964 | |||||||||||||||||||||||||||||
| Comprehensive loss |
$ | 2,834,674 | $ | — | $ | 2,834,674 | |||||||||||||||||||||||||||||||||||
| Balance at December 31, 2006 |
5,000,000 | $ | 5,000 | 6,350,333 | $ | 6,350 | 14,081,157 | $ | 14,081 | $ | 19,558,858 | $ | (242,500 | ) | $ | (11,233,556 | ) | $ | 5,447,536 | $ | 13,555,769 | $ | — | $ | 13,555,769 | ||||||||||||||||
The accompanying notes are an integral part of these consolidated financial statements.
28
Table of Contents
DARA BIOSCIENCES, INC. AND SUBSIDIARIES
(A Development Stage Company)
CONSOLIDATED STATEMENTS OF STOCKHOLDERS’ EQUITY (continued)
| Series A Convertible Preferred Stock |
Series B Convertible Preferred Stock |
Common Stock |
Additional Paid-In Capital |
Stock Subscription Receivable |
Deficit Accumulated During the Development Stage |
Accumulated Other Comprehensive Income |
Stockholders’ Equity (Deficit) Before Noncontrolling Interest |
Noncontrolling Interest |
Total Stockholders’ Equity |
||||||||||||||||||||||||||||||||||||||||
| Shares | Amount | Shares | Amount | Shares | Amount | ||||||||||||||||||||||||||||||||||||||||||||
| Balance at December 31, 2006 |
5,000,000 | $ | 5,000 | 6,350,333 | $ | 6,350 | 14,081,157 | $ | 14,081 | $ | 19,558,858 | $ | (242,500 | ) | $ | (11,233,556 | ) | $ | 5,447,536 | $ | 13,555,769 | $ | — | $ | 13,555,769 | ||||||||||||||||||||||||
| Increase in reserves for uncertain tax positions per FIN 48 adoption |
— | — | — | — | — | — | — | — | (219,348 | ) | — | (219,348 | ) | — | (219,348 | ) | |||||||||||||||||||||||||||||||||
| Non-controlling interest upon consolidation |
— | — | — | — | — | — | — | — | — | — | — | 1,441,949 | 1,441,949 | ||||||||||||||||||||||||||||||||||||
| Issuance of common stock |
— | — | — | — | 6,667 | 7 | 15,993 | — | — | — | 16,000 | — | 16,000 | ||||||||||||||||||||||||||||||||||||
| Share based compensation |
— | — | — | — | — | — | 590,125 | — | — | — | 590,125 | — | 590,125 | ||||||||||||||||||||||||||||||||||||
| Cancellation of subscription receivable |
— | — | — | — | — | — | — | 242,500 | — | — | 242,500 | — | 242,500 | ||||||||||||||||||||||||||||||||||||
| Comprehensive loss: |
|||||||||||||||||||||||||||||||||||||||||||||||||
| Net loss |
— | — | — | — | — | — | — | — | (1,527,691 | ) | — | (1,527,691 | ) | (463,774 | ) | (1,991,465 | ) | ||||||||||||||||||||||||||||||||
| Reversal of unrealized gain on investment and marketable securities |
— | — | — | — | — | — | — | — | — | (5,447,536 | ) | (5,447,536 | ) | — | (5,447,536 | ) | |||||||||||||||||||||||||||||||||
| Comprehensive loss |
$ | (6,975,227 | ) | $ | (463,774 | ) | $ | (7,439,001 | ) | ||||||||||||||||||||||||||||||||||||||||
| Balance at December 31, 2007 |
5,000,000 | 5,000 | 6,350,333 | 6,350 | 14,087,824 | 14,088 | 20,164,976 | — | (12,980,595 | ) | — | 7,209,819 | 978,175 | 8,187,994 | |||||||||||||||||||||||||||||||||||
| Conversion of DARA Shares |
(5,000,000 | ) | (5,000 | ) | (6,350,333 | ) | (6,350 | ) | (14,087,824 | ) | (14,088 | ) | 25,438 | — | — | — | — | — | — | ||||||||||||||||||||||||||||||
| Exchange of common stock |
— | — | — | — | 14,530,586 | 145,305 | (145,305 | ) | — | — | — | — | — | — | |||||||||||||||||||||||||||||||||||
| Exchange of preferred stock |
— | — | — | — | 11,706,802 | 117,068 | (117,068 | ) | — | — | — | — | — | — | |||||||||||||||||||||||||||||||||||
| Merger/Reverse stock split Point Therapeutics |
— | — | — | — | 982,780 | 9,828 | 430,875 | — | — | — | 440,703 | — | 440,703 | ||||||||||||||||||||||||||||||||||||
| Shares issued to directors |
— | — | — | — | 127,686 | 1,277 | 119,263 | — | — | — | 120,540 | — | 120,540 | ||||||||||||||||||||||||||||||||||||
| Share based compensation |
— | — | — | — | 220,000 | 2,200 | 1,538,526 | — | — | — | 1,540,726 | — | 1,540,726 | ||||||||||||||||||||||||||||||||||||
| Issuance of common stock |
— | — | — | — | 290,083 | 2,901 | 185,653 | — | — | — | 188,554 | — | 188,554 | ||||||||||||||||||||||||||||||||||||
| Shares issued for deferred payment |
— | — | — | — | 892 | 9 | 1,055 | — | — | — | 1,064 | — | 1,064 | ||||||||||||||||||||||||||||||||||||
| Shares issued to placement agent |
— | — | — | — | 2,255,000 | 22,550 | 1,910,307 | — | — | — | 1,932,857 | — | 1,932,857 | ||||||||||||||||||||||||||||||||||||
| Warrants issued |
— | — | — | — | — | — | 183,214 | — | — | — | 183,214 | — | 183,214 | ||||||||||||||||||||||||||||||||||||
| Comprehensive loss: |
|||||||||||||||||||||||||||||||||||||||||||||||||
| Net loss |
— | — | — | — | — | — | — | — | (11,569,342 | ) | — | (11,569,342 | ) | (328,975 | ) | (11,898,317 | ) | ||||||||||||||||||||||||||||||||
| Unrealized gain on marketable securities |
— | — | — | — | — | — | — | — | — | 1,656,008 | 1,656,008 | — | 1,656,008 | ||||||||||||||||||||||||||||||||||||
| Comprehensive loss |
$ | (9,913,334 | ) | $ | (328,975 | ) | $ | (10,242,309 | ) | ||||||||||||||||||||||||||||||||||||||||
| Balance at December 31, 2008 |
— | $ | — | — | $ | — | 30,113,829 | $ | 301,138 | $ | 24,296,934 | $ | — | $ | (24,549,937 | ) | $ | 1,656,008 | $ | 1,704,143 | $ | 649,200 | $ | 2,353,343 | |||||||||||||||||||||||||
The accompanying notes are an integral part of these consolidated financial statements.
29
Table of Contents
DARA BIOSCIENCES, INC. AND SUBSIDIARIES
(A Development Stage Company)
CONSOLIDATED STATEMENTS OF STOCKHOLDERS’ EQUITY (continued)
| Series A Convertible Preferred Stock |
Series B Convertible Preferred Stock |
Common Stock | Additional Paid-In Capital |
Stock Subscription Receivable |
Deficit Accumulated During the Development Stage |
Accumulated Other Comprehensive Income |
Stockholders’ Equity (Deficit) Before Noncontrolling Interest |
Noncontrolling Interest |
Total Stockholders’ Equity |
||||||||||||||||||||||||||||||||||
| Shares | Amount | Shares | Amount | Shares | Amount | ||||||||||||||||||||||||||||||||||||||
| Balance at December 31, 2008 |
— | $ | — | — | $ | — | 30,113,829 | $ | 301,138 | $ | 24,296,934 | $ | — | $ | (24,549,937 | ) | $ | 1,656,008 | $ | 1,704,143 | $ | 649,200 | $ | 2,353,343 | |||||||||||||||||||
| Shares issued to directors |
— | — | — | — | (30,417 | ) | (304 | ) | 33,006 | — | — | — | 32,702 | — | 32,702 | ||||||||||||||||||||||||||||
| Share-based compensation |
— | — | — | — | 512,195 | 5,122 | 465,238 | — | — | — | 470,360 | — | 470,360 | ||||||||||||||||||||||||||||||
| Issuance of common stock |
— | — | — | — | 14,037,868 | 140,379 | 5,326,952 | — | — | — | 5,467,331 | — | 5,467,331 | ||||||||||||||||||||||||||||||
| Warrants issued to placement agent |
— | — | — | — | — | — | 47,706 | — | — | — | 47,706 | — | 47,706 | ||||||||||||||||||||||||||||||
| Comprehensive loss: |
|||||||||||||||||||||||||||||||||||||||||||
| Net loss |
— | — | — | — | — | — | — | — | (3,343,615 | ) | — | (3,343,615 | ) | (218,339 | ) | (3,561,954 | ) | ||||||||||||||||||||||||||
| Unrealized gain on marketable securities |
— | — | — | — | — | — | — | — | — | (1,656,008 | ) | (1,656,008 | ) | — | (1,656,008 | ) | |||||||||||||||||||||||||||
| Comprehensive loss |
$ | (4,999,623 | ) | $ | (218,339 | ) | $ | (5,217,962 | ) | ||||||||||||||||||||||||||||||||||
| Balance at December 31, 2009 |
— | $ | — | — | $ | — | 44,633,475 | $ | 446,335 | $ | 30,169,836 | $ | — | $ | (27,893,552 | ) | $ | — | $ | 2,722,619 | $ | 430,861 | $ | 3,153,480 | |||||||||||||||||||
The accompanying notes are an integral part of these consolidated financial statements.
30
Table of Contents
DARA BIOSCIENCES, INC. AND SUBSIDIARIES
(A Development Stage Company)
CONSOLIDATED STATEMENTS OF CASH FLOWS
| Year Ended December 31, | Period From June 22, 2002 (inception) through December 31, |
|||||||||||
| 2009 | 2008 | 2009 | ||||||||||
| Operating activities |
||||||||||||
| Consolidated net loss |
$ | (3,561,954 | ) | $ | (11,898,317 | ) | $ | (28,685,292 | ) | |||
| Adjustments to reconcile net loss to net cash used in operating activities: |
||||||||||||
| Depreciation and amortization |
157,171 | 157,486 | 415,831 | |||||||||
| Forgiveness of stock subscription receivable |
— | — | 242,500 | |||||||||
| Recognition of expense related to nonmonetary asset |
— | — | 1,035,589 | |||||||||
| Loss from equity investment |
— | — | 2,374,422 | |||||||||
| Accretion of debt discount |
— | — | 406,359 | |||||||||
| Share-based compensation |
503,062 | 1,662,330 | 4,515,604 | |||||||||
| Expense of warrants issued with convertible notes |
— | — | 4,860 | |||||||||
| Expense of warrants issued to placement agent |
47,706 | 183,214 | 230,920 | |||||||||
| Loss on disposal of capital assets |
19,930 | — | 19,930 | |||||||||
| Gain on extinguishment of capital lease obligation |
(12,240 | ) | — | (12,240 | ) | |||||||
| Loss on disposal of furniture, fixtures and equipment, net |
1,885 | 15,981 | 35,905 | |||||||||
| Sale of investment as payment of interest expense |
36,712 | — | 36,712 | |||||||||
| Distribution of investment for compensation |
100,000 | — | 100,000 | |||||||||
| Gain on distribution of nonmonetary asset |
(91,910 | ) | — | (4,760,953 | ) | |||||||
| Gain on sale of marketable securities and nonmonetary assets |
(1,130,515 | ) | — | (6,780,147 | ) | |||||||
| Deferred lease obligation |
5,035 | 1,015 | 10,969 | |||||||||
| Changes in operating assets and liabilities: |
||||||||||||
| Prepaid expenses and other assets |
33,986 | 160,034 | (485,067 | ) | ||||||||
| Accounts payable |
(491,516 | ) | 521,484 | 44,565 | ||||||||
| Accrued liabilities |
(54,419 | ) | (915,421 | ) | (431,679 | ) | ||||||
| Other liability |
15,448 | 15,626 | 31,074 | |||||||||
| Net cash used in operating activities |
(4,421,619 | ) | (10,096,568 | ) | (31,650,138 | ) | ||||||
| Investing activities |
||||||||||||
| Purchases of furniture, fixtures and equipment |
(3,996 | ) | (28,592 | ) | (193,059 | ) | ||||||
| Proceeds from sale of furniture, fixtures and equipment |
1,050 | 3,358 | 5,366 | |||||||||
| Issuance of notes receivable |
— | — | (1,400,000 | ) | ||||||||
| Proceeds from sale of marketable securities |
178,124 | — | 1,951,211 | |||||||||
| Payments on notes receivable |
— | — | 711,045 | |||||||||
| Cash received in the Point merger |
— | 771,671 | 771,671 | |||||||||
| Purchase of investments in affiliates |
— | — | (2,471,400 | ) | ||||||||
| Proceeds from sale of investments in affiliates |
500,000 | — | 4,405,692 | |||||||||
| Net cash provided by investing activities |
675,178 | 746,437 | 3,780,526 | |||||||||
The accompanying notes are an integral part of these consolidated financial statements.
31
Table of Contents
DARA BIOSCIENCES, INC. AND SUBSIDIARIES
(A Development Stage Company)
CONSOLIDATED STATEMENTS OF CASH FLOWS (continued)
| Year Ended December 31, | Period From June 22, 2002 (inception) through December 31, |
|||||||||||
| 2009 | 2008 | 2009 | ||||||||||
| Financing activities |
||||||||||||
| Proceeds from issuance of notes payable |
$ | 500,000 | $ | — | $ | 605,000 | ||||||
| Principal payments on notes payable |
— | — | (255,000 | ) | ||||||||
| Payments on capital lease |
(21,337 | ) | 3,717 | (17,620 | ) | |||||||
| Establishment of other financing |
18,559 | — | 18,559 | |||||||||
| Repayments on other financing |
(10,056 | ) | — | (10,056 | ) | |||||||
| Proceeds from exercise of options and warrants |
110,750 | 188,554 | 379,355 | |||||||||
| Proceeds from issuance of common stock and warrants, net of issuance costs |
5,356,581 | 1,932,857 | 30,395,433 | |||||||||
| Establishment of restricted cash |
(652 | ) | (78,105 | ) | (78,757 | ) | ||||||
| Net cash provided by financing activities |
5,953,845 | 2,047,023 | 31,036,914 | |||||||||
| Net increase (decrease) in cash and cash equivalents |
2,207,404 | (7,303,108 | ) | 3,167,302 | ||||||||
| Cash and cash equivalents at beginning of period |
959,898 | 8,263,006 | — | |||||||||
| Cash and cash equivalents at end of period |
$ | 3,167,302 | $ | 959,898 | $ | 3,167,302 | ||||||
| Supplemental disclosure of non-cash financing activity |
||||||||||||
| Equipment purchased through financing |
$ | — | $ | 71,158 | $ | 91,676 | ||||||
| Advances to stockholders for stock issued |
— | — | 1,040 | |||||||||
| Payable accrued for stock issuance |
— | — | 350,000 | |||||||||
| Note issued for stock issuance |
— | — | 150,000 | |||||||||
| Note issued for prepaid license fee |
— | — | 1,000,000 | |||||||||
| Note received for stock issuance |
— | — | (242,500 | ) | ||||||||
| Stock received for consideration of outstanding loans |
— | — | (427,280 | ) | ||||||||
| Forgiveness of stock subscription receivable |
— | — | 242,500 | |||||||||
| Shares issued to employees & non-employee directors |
109,557 | 120,540 | 246,097 | |||||||||
| Shares issued to third party for services |
41,667 | 322,261 | 363,928 | |||||||||
| Exchange of investment for cancellation of note payable |
36,712 | — | 36,712 | |||||||||
| Exchange of investment for cancellation of accrued interest |
500,000 | — | 500,000 | |||||||||
| Conversion of note into equity of subsidiary |
— | — | 1,441,948 | |||||||||
The accompanying notes are an integral part of these consolidated financial statements.
32
Table of Contents
DARA BIOSCIENCES, INC. AND SUBSIDIARIES
(A Development Stage Company)
NOTES TO CONSOLIDATED FINANCIAL STATEMENTS
1. Basis of Presentation
The Company
DARA BioSciences, Inc. (the “Company”), headquartered in Raleigh, North Carolina, was incorporated on June 22, 2002. The Company is a development stage company that acquires therapeutic drug candidates for development and subsequent licensing or sale to healthcare companies.
The activities of the Company have primarily consisted of establishing offices, recruiting personnel, conducting research and development, performing business and financial planning and raising capital. Accordingly, the Company is considered to be a biopharmaceutical development stage company. The Company has incurred losses since inception through December 31, 2009 of $27,674,205 and expects to continue to incur losses and require additional financial resources to achieve monetization of its product candidates.
On February 12, 2008, the Company, formerly known as Point Therapeutics, Inc. (the “Company”), completed the merger transaction (the “Merger”) contemplated by the Agreement and Plan of Merger dated October 9, 2007, as amended December 19, 2007 (the “Merger Agreement”), among the Company, DP Acquisition Corp., a wholly-owned subsidiary of the Company (“Merger Sub”), and DARA BioSciences, Inc., a privately held development stage pharmaceutical company based in Raleigh, North Carolina (“DARA”). Pursuant to the Merger, each share of DARA common stock and preferred stock issued and outstanding immediately prior to the effective time of the Merger ceased to be outstanding and was converted into the right to receive 1.031406 shares of Company common stock, plus cash in lieu of any fractional shares. As a result of the transaction, the former DARA stockholders received 96.4% of the Company’s outstanding shares of common stock on a fully-diluted basis and Merger Sub merged with and into DARA, with DARA surviving as a wholly-owned subsidiary of the Company. Upon consummation of the Merger, the Company changed its name to DARA BioSciences, Inc.
For accounting purposes, the Merger was treated as a reverse acquisition with DARA being the accounting acquirer. Accordingly, the historical financial information in these financial statements prior to the Merger is that of DARA and its consolidated subsidiaries and all references to the “Company” in these financial statements relating to periods prior to the Merger refer to DARA (see Note 3).
The Company’s business is subject to significant risks consistent with specialty pharmaceutical and biotechnology companies that are developing technologies and eventually products for human therapeutic use. These risks include, but are not limited to, uncertainties regarding research and development, access to capital, obtaining and enforcing patents, receiving regulatory approval and competition with other biotechnology and pharmaceutical companies.
2. Significant Accounting Policies
Principles of Consolidation
The consolidated financial statements include the accounts of DARA BioSciences, Inc. and its majority-owned subsidiaries: DARA Pharmaceuticals, Inc., (which is wholly owned by the Company), DARA Therapeutics, Inc. (which holds the Company’s assets related to its KRN5500 program and is owned 75% by the Company), and Point Therapeutics Massachusetts, Inc., (which is wholly owned by the Company). The Company has control of all subsidiaries, and as such, they are all consolidated in the presentation of the consolidated financial statements. All significant intercompany transactions have been eliminated in the consolidation.
33
Table of Contents
Use of Estimates
The preparation of financial statements in conformity with GAAP requires management to make estimates and assumptions that affect the amounts reported in the financial statements and accompanying notes. Actual amounts could differ from those estimates.
Cash and Cash Equivalents
The Company considers all highly liquid investments with a maturity of three months or less when purchased to be cash equivalents. The carrying amounts reported in the consolidated balance sheets for cash and cash equivalents approximate their fair value.
Investments and Marketable Securities
The Company accounts for its investment in marketable securities in accordance with Financial Accounting Standards Board (FASB) Accounting Standards Codification (ASC) 320, Investments – Debt and Equity Securities. See Note 4 for further information. This statement requires certain securities to be classified into three categories:
Held-to-maturity – Debt securities that the entity has the positive intent and ability to hold to maturity are reported at amortized cost.
Trading Securities – Debt and equity securities that are bought and held primarily for the purpose of selling in the near term are reported at fair value, with unrealized gains and losses included in earnings.
Available for Sale – Debt and equity securities not classified as either securities held-to-maturity or trading securities are reported at fair value with unrealized gains or losses excluded from earnings and reported as a separate component of stockholders’ equity.
Investments in marketable securities with maturities beyond one year may be classified as short-term based on their highly liquid nature and because such marketable securities represent the investment of cash that is available for current operations.
In accordance with FASB ASC 320, the Company reassesses the appropriateness of the classification of its investments as of the end of each reporting period. To date, all marketable securities have been classified as available-for-sale, and are carried at fair value with unrealized gains and losses reported as a component of accumulated other comprehensive income (loss) in stockholders’ equity (deficit).
The Company utilizes FASB ASC 820, Fair Value Measurements and Disclosures, to value its financial assets and liabilities. FASB ASC 820’s valuation techniques are based on observable and unobservable inputs. Observable inputs reflect readily obtainable data from independent sources, while unobservable inputs reflect our market assumptions. FASB ASC 820 classifies these inputs into the following hierarchy:
Level 1 Inputs– Quoted prices for identical instruments in active markets.
Level 2 Inputs– Quoted prices for similar instruments in active markets; quoted prices for identical or similar instruments in markets that are not active; and model-derived valuations whose inputs are observable or whose significant value drivers are observable.
Level 3 Inputs– Instruments with primarily unobservable value drivers.
In determining fair value, the Company utilizes techniques to optimize the use of observable inputs, when available, and minimize the use of unobservable inputs to the extent possible. As such, the Company uses valuation models in determining fair value. Based on this valuation technique, the Company utilizes certain
34
Table of Contents
assumptions that market participants would use in pricing the asset or liability, including assumptions about risk and or risks inherent in the inputs.
The Company’s other investments include investments in privately-held companies. Pursuant to FASB ASC 323, Investments – Equity Method and Joint Ventures, the Company accounts for these investments either at historical cost, or if the Company has significant influence over the investee, the Company accounts for these investments using the equity method of accounting. The Company reviews all investments for indicators of impairment at least annually, or whenever events or changes in circumstances indicate the carrying amount of the assets may not be recoverable. In making impairment determinations for investments in privately-held companies, the Company considers certain factors, including each company’s cash position, financing needs, earnings, revenue outlook, operational performance, management or ownership changes as well as competition. In making impairment determinations for investments of available-for-sale securities, the Company also reviews the current market price for other-than-temporary declines in values following the guidance required by FASB ASC 320, Investments – Debt and Equity Securities.
Concentration of Credit Risk
Financial instruments that potentially subject the Company to concentrations of credit risk consist primarily of cash and cash equivalents and marketable securities. The Company maintains cash deposits with a federally insured bank that may at times exceed federally insured limits. The majority of funds in excess of the federally insured limits are held in sweep investment accounts collateralized by the securities in which the funds are invested. As of December 31, 2009 and 2008, the Company had balances of $2,917,302 and $709,898, respectively, in excess of federally insured limits ($250,000) held in non-investment accounts.
Furniture, Fixtures and Equipment, net
Furniture, fixtures and equipment, net are recorded at cost and depreciated over the estimated useful lives of the assets (three to five years) using the straight-line method.
Research and Development Costs
The Company expenses research and development costs as incurred. Research and development costs include personnel and personnel related costs, costs associated with clinical trials, including amounts paid to contract research organizations and clinical investigators, manufacturing, process development and clinical product supply costs, research costs and other consulting and professional services, and allocated facility and related expenses.
Share-Based Compensation Valuation and Expense
The Company measures compensation cost for share-based payment awards granted to employees and non-employee directors at fair value using the Black-Scholes option-pricing model. Compensation expense is recognized on a straight-line basis over the service period for awards expected to vest. Stock-based compensation cost related to share-based payment awards granted to non-employees is adjusted each reporting period for changes in the fair value of the Company’s stock until the measurement date. The measurement date is generally considered to be the date when all services have been rendered or the date that options are fully vested. See Note 14 for further information.
Comprehensive Income
FASB ASC 220, Comprehensive Income, requires components of other comprehensive income, including gains and losses on available-for-sale investments, to be included as part of total comprehensive income. The Company’s comprehensive income consists of net loss and unrealized gains and losses on available-for-sale investments. The Company displays comprehensive income and its components as part of the statement of equity and comprehensive income in its consolidated financial statements.
35
Table of Contents
Income Taxes
The Company uses the liability method in accounting for income taxes as required by FASB ASC 740, Income Taxes. Under this method, deferred tax assets and liabilities are recognized for operating loss and tax credit carry forwards and for the future tax consequences attributable to the differences between the financial statement carrying amounts of existing assets and liabilities and their respective tax bases. Deferred tax assets and liabilities are measured using enacted tax rates expected to apply to taxable income in the years in which those temporary differences are expected to be recovered or settled. The effect on deferred tax assets and liabilities of a change in tax rates is recognized in the results of operations in the period that includes the enactment date. A valuation allowance is recorded to reduce the carrying amounts of deferred tax assets unless it is more likely than not that such assets will be realized.
Net Loss Per Common Share
The Company calculates its basic loss per share in accordance with FASB ASC 260, Earnings Per Share, by dividing the earnings or loss applicable to common stockholders by the weighted-average number of common shares outstanding for the period less the weighted average unvested common shares subject to forfeiture and without consideration for common stock equivalents. Diluted earnings per share is computed by dividing the earnings applicable to common stockholders by the weighted-average number of common share equivalents outstanding for the period less the weighted average unvested common shares subject to forfeiture and dilutive common stock equivalents for the period determined using the treasury-stock method. For purposes of this calculation, options and warrants to purchase common stock are considered to be common stock equivalents and have been excluded from the years ended December 31, 2009 and 2008 as their effect is anti-dilutive.
| Year ended December 31, | ||||||||
| 2009 | 2008 | |||||||
| Net loss attributable to controlling interest |
$ | (3,343,615 | ) | $ | (11,569,342 | ) | ||
| Basic and diluted net loss per common share attributable to controlling interest: |
||||||||
| Weighted-average shares used in computing basic and diluted net loss per common share |
35,032,454 | 27,725,415 | ||||||
| Basic and diluted net loss per common share attributable to controlling interest |
$ | (0.10 | ) | $ | (0.42 | ) | ||
Recently Issued Accounting Pronouncements
In June, 2009, FASB issued and the Company adopted FASB ASC 105, Generally Accepted Accounting Principles. FASB ASC 105 approved the FASB ASC as the source of authoritative nongovernmental GAAP. All existing accounting standards have been superseded and all other accounting literature not included in the FASB ASC will be considered nonauthoritative. Accordingly, all references to accounting standards have been conformed to the new ASC hierarchy.
In May 2009, the FASB issued FASB ASC 855, Subsequent Events. FASB ASC 855 establishes principles and requirements for subsequent events, in particular: (i) the period after the balance sheet date during which management of a reporting entity shall evaluate events or transactions that may occur for potential recognition or disclosure in the financial statements; (ii) the circumstances under which an entity shall recognize events or transactions occurring after the balance sheet date in its financial statements; and (iii) the disclosures that an entity shall make about events or transactions that occurred after the balance sheet date. See Note 17 for further information.
In December 2007, the FASB issued FASB ASC 810, Consolidation. FASB ASC 810 requires that noncontrolling interests (previously referred to as minority interests) be clearly identified and presented as a
36
Table of Contents
component of equity, separate from the parent’s equity. FASB ASC 810 also requires that the amount of consolidated net income attributable to the parent and to the noncontrolling interest be clearly identified and presented on the face of the consolidated statement of income; that changes in ownership interest be accounted for as equity transactions; and that when a subsidiary is deconsolidated, any retained noncontrolling equity investment in that subsidiary and the gain or loss on the deconsolidation of that subsidiary be measured at fair value. FASB ASC 810 is to be applied prospectively, except for the presentation and disclosure requirements (which are to be applied retrospectively for all periods presented) and is effective for fiscal years beginning after December 15, 2008. Effective January 1, 2009, the Company adopted FASB ASC 810. The effect was an increase in total equity of $430,861 and $649,200 at December 31, 2009 and 2008, respectively. There was no material effect to the Company’s consolidated results of operations.
FASB ASC 810 also requires retrospective application of its disclosure and presentation requirements for all periods presented. Accordingly, noncontrolling interests at December 31, 2008 which were previously reported as minority interest in subsidiary, have been reclassified as a separate component of equity. Furthermore, net earnings previously reported as minority interest in subsidiary for the period from June 22, 2002 (inception) through December 31, 2009 have been presented as attributable to noncontrolling interest.
In November 2007, the EITF ratified a consensus on FASB ASC 808, Collaborative Arrangements, which requires participants in a collaboration to make separate disclosures regarding the nature and purpose of an arrangement, their rights and obligations under the arrangement, the accounting policy for the arrangement and the income statement classification and amounts arising from the arrangement between participants for each period an income statement is presented. FASB ASC 808 is effective beginning January 1, 2009. The Company’s adoption of FASB ASC 808 did not have a material effect on the Company’s consolidated results of operations and financial position.
Reclassifications
Certain reclassifications have been made to the 2008 financial statements and accompanying notes to conform with the 2009 presentation. These reclassifications had no effect on net loss or total stockholders’ equity as previously presented.
3. Merger
On February 12, 2008, DARA and Point Therapeutics, Inc. (“Point”) completed the Merger as described in Note 1. The Directors of Point and DARA, respectively, believed that by combining Point and DARA, the combined company would generate improved long-term operating and financial results and establish a stronger competitive position in the industry by gaining access to greater resources, diversification and increased access to capital. In merging with Point, the DARA board also considered the potential for increased liquidity for its stockholders expected as the result of the Merger.
Following the effectiveness of the Merger, Point changed its corporate name to DARA BioSciences, Inc. and changed its ticker symbol on the NASDAQ Capital Market to “DARA”. The Merger was intended, among other things, to allow the business of privately-held DARA to be conducted by the Company given that DARA’s business became the primary business of the Company following the Merger.
The Merger was accounted for as a reverse acquisition under the purchase method of accounting for business combinations in accordance with GAAP. Under this method of accounting, Point is treated as the acquired company for financial reporting purposes. On February 12, 2008, Point had $761,671 in cash. Under the terms of the Merger Agreement, as of the closing of the Merger, the former holders of DARA equity securities acquired 96.4% of the capital stock of the Company (on a fully diluted basis). Immediately following the Merger, the Board of Directors of the Company consisted of six directors, all of whom were former directors of DARA. In addition, the senior management team of DARA manages the operations of the Company, with the exception of the Chairman of the Board of Directors and Chief Executive Officer who resigned from the Company as of March 21, 2008. In accordance with guidance applicable to these circumstances, the Merger was considered to be a capital transaction in substance. Accordingly, for accounting purposes, the Merger was treated as the equivalent
37
Table of Contents
of the Company issuing stock for the net assets of Point. The net assets of Point were stated at fair value, which approximates historical cost, with no goodwill or other intangible assets recorded. The Company’s deficit accumulated in the development stage was carried forward after the Merger. Following is the allocation of the purchase price to the net assets of Point based on fair values:
| Cash |
$ | 771,671 | ||
| Other current assets |
480,638 | |||
| Fixed assets, net of depreciation |
56,307 | |||
| Accrued liabilities |
(837,652 | ) | ||
| Merger transaction cost expensed |
1,271,950 | |||
| Total purchase price |
$ | 1,742,914 | ||
The Merger had no effect on loss per share.
4. Investments
MiMedx (NASDAQ: OTC BB:MDXG.OB)
The Company’s marketable securities classified as available-for-sale consists entirely of equity securities in MiMedx Group, Inc. (OTC BB:MDXG.OB), formerly Spine Medica, Inc. MiMedx became a publicly traded company on February 8, 2008. The Company had carried the investment at cost of $400 and classified it as a long-term investment in fiscal years prior to that date.
The Company was restricted from selling the shares until February 9, 2009 upon which date the Company became able to sell shares to improve its cash position. Utilizing ASC 820, the valuation of MiMedx was based upon Level 3 inputs which included applying a lack-of-marketability discount to the quoted market price of MiMedx common stock as of December 31, 2008. This resulted in a fair value of $1,656,408 as of December 31, 2008 which represented an unrealized gain of $1,656,008 for the year.
During 2009, following the removal of the restriction allowing the sale of MiMedx shares, the market value of these shares declined. Between February 9, 2009 and April 20, 2009 the Company sold all its 400,002 shares of MiMedx realizing a gain on the sale of marketable securities of $177,724. At December 31, 2009, the Company no longer held an investment in MiMedx.
The Company does not have any other assets measured at fair value that would require non-recurring fair value adjustments (for example, where there is evidence of impairment).
SurgiVision, Inc.
SurgiVision, Inc. (SVI) is developing “real-time” devices to be used with Functional MRI Technology. The Company is targeting clinical solutions in areas such as MRI-guided deep brain stimulation and cardiac ablation to treat atrial fibrillation. The Company’s initial investment of $2,000,000 for 9,094,970 shares was in 2004. In 2006, the Company distributed a dividend of 6,166,312 and 178,688 shares of SVI common stock to all investors and vested stock option holders, respectively. The remaining investment of 2,749,970 shares was carried at cost of $222,479 at December 31, 2008.
In January 2009, the Company entered into a stock purchase and loan agreement and related agreements (the “Purchase and Loan Agreement”) with SVI in which the Company received $1,000,000 of total proceeds. The Company sold 500,000 of its 2,749,970 shares of SVI at $1.00 per share. In addition the Company entered into a loan agreement secured by 500,000 shares of the Company’s SVI stock. The Company recorded a gain of $459,500 on the sale.
Also in January 2009, the board of directors distributed 25,000 SVI shares to each of three independent members of the board valued at $1.00 per share. The Company distributed an additional 25,000 SVI shares valued at $1.00
38
Table of Contents
per share as severance to its former Chief Financial Officer. The Company recorded compensation expense of $100,000 and a gain of $91,910 on distribution of nonmonetary asset.
On December 31, 2009, the Company entered into a Stock Purchase Agreement with SVI pursuant to which the Company sold 536,712 shares of SVI common stock to SVI. The purchase price for the shares was paid through cancellation of outstanding principal of $500,000 and accrued interest of $36,712 on the January 2009 secured promissory note issued by the Company to SVI. The Company recorded a gain of $493,291 on the sale of marketable securities.
As of December 31, 2009, the remaining investment of 1,613,258 shares was carried at cost of $130,468. In addition, the Company is the holder of a warrant to acquire 405,000 shares of common stock in SVI that has an exercise price of $.80 per share.
Medeikon
During fiscal 2004, the Company acquired 1,171,944 shares of Medeikon for $600,000 representing a 15% ownership. The Company did not have the ability to exercise significant influence over the management of the investee company, and therefore the investment was carried at its original cost and accounted for using the cost method of accounting for investments in accordance with APB 18. During 2005, the Company invested an additional $350,000 in Medeikon resulting in an increase in ownership to 23.8%. In accordance with APB 18, the Company re-evaluated its ownership interest and whether it had the ability to exercise significant influence over the operation of Medeikon and determined that the additional investment triggered a change in accounting for the investment from the cost method to the equity method, which the Company adopted in 2005. As required by APB 18, the investment and results of operations for the prior periods presented have been retroactively adjusted and restated to reflect the application of the equity method. During 2006, the Company invested an additional $100,000 in Medeikon resulting in an increase in ownership to approximately 25.4%.
The Company’s share of Medeikon’s loss for the year ended December 31, 2006 exceeded its basis. The loss of a noncontrolling interest is limited to the extent of equity capital. Application of the equity method resulted in an equity method loss in Medikon for the years ended December 31, 2004, 2005 and 2006 of $22,552, $734,327 and $293,121, respectively, and $1,050,000 for the period from June 22, 2002 (inception) through December 31, 2007. The carrying value at December 31, 2009 and 2008 of the investment in Medeikon was $0.
5. Furniture, Fixtures and Equipment, net
Furniture, fixtures and equipment, net consists of the following at December 31:
| 2009 | 2008 | |||||||
| Furniture and fixtures |
$ | 87,009 | $ | 87,195 | ||||
| Equipment |
52,025 | 114,166 | ||||||
| Computer software |
7,852 | 7,852 | ||||||
| Leasehold improvements |
11,634 | 11,634 | ||||||
| Total |
158,520 | 220,847 | ||||||
| Less accumulated depreciation |
(102,307 | ) | (108,594 | ) | ||||
| Furniture, fixtures, & equipment |
$ | 56,213 | $ | 112,253 | ||||
The Company recognized a total loss of $21,185 on disposal of fixed assets. The Company had terminated a capital lease in 2009 which resulted in a loss on disposal of equipment of $19,930. The Company also sold equipment with a net book value of zero for a gain of $1,050, and disposed of equipment for a net loss of $2,935. The loss on the disposal of equipment was a loss of $9,786 that was offset by cash received of $6,851.
39
Table of Contents
Depreciation expense, including depreciation related to assets held under capital leases, was $37,171 and $37,486 for the years ended December 31, 2009 and 2008, respectively.
6. Note Payable
On January 30, 2009, the Company entered into the Purchase and Loan Agreement with SVI pursuant to which the Company received $1,000,000 of total proceeds. The Company sold 500,000 of its 2,749,970 shares of SVI at $1.00 per share. The Company also entered into a loan agreement for $500,000 at 8% interest per annum due July 30, 2010. As collateral security for this loan, DARA pledged to SVI 500,000 additional SVI shares owned by the Company (See Note 4).
On December 31, 2009, the Company entered into a Stock Purchase Agreement with SVI pursuant to which the Company sold 536,712 shares of SVI common stock to SVI. The purchase price for the shares was paid through cancellation of outstanding principal of $500,000 and accrued interest of $36,712 on the January 2009 secured promissory note issued by the Company to SVI.
7. License Agreements
On May 4, 2004, the Company entered into a license agreement with a third party which the Company received a worldwide non-exclusive license to develop and commercialize licensed products based on patents and technological information in exchange for a promissory note and a royalty agreement related to future products and processes resulting from the technology as defined in the agreement. The Company recorded $1,035,000 in research and development expense during 2004 related to the license.
On July 1, 2004 the Company entered into a license agreement for a compound for the treatment of pain and central and peripheral nervous system conditions or diseases. The Company made a $100,000 license fee payment in 2004 which was recorded in research and development expense. In addition, the Company will be obligated to make future payments upon achievement of certain milestones.
On October 8, 2007, the Company entered into an exclusive license agreement under which the Company received certain intellectual property rights. The Company made a $600,000 license fee payment in October 2007. The Company has capitalized this asset and is amortizing the license over a 5 year period. The Company amortized $120,000 for each of the years ended December 31, 2009 and 2008, respectively. In addition, the Company will be obligated to make future payments upon achievement of certain milestones as well as royalty payments as defined in the agreement. Estimated amortization expense for the fiscal years ended 2010, 2011, and 2012 is $120,000, $120,000, and $100,000, respectively.
On May 7, 1997, DARA (formerly Point Therapeutics Massachusetts, Inc.) entered into a license agreement (the “Agreement”) with Tufts University School of Medicine (“Tufts”). This Agreement was amended in May 1999. Under the Agreement, DARA received a worldwide license to certain patent and patent applications in exchange for a nonrefundable license fee of $50,000.
Under the Agreement, the Company is also required to pay $20,000 per year to Tufts. One-half of this payment is offset against the Company’s patent liability through 2012. Thereafter, each payment will be credited against royalties due to Tufts. At December 31, 2009, amounts due to Tufts per the Agreement are as follows:
| Year ended December 31: |
||||
| 2010 |
$ | 20,000 | ||
| 2011 |
10,000 | |||
| 2012 |
7,895 | |||
| 37,895 | ||||
| Less current portion |
(20,000 | ) | ||
| Patent obligation |
$ | 17,895 | ||
40
Table of Contents
8. Noncontrolling Interest
On May 3, 2004, the Company issued a promissory note (the 2004 Note) to a third party organization in consideration for the license of the patents and technological information related to the therapeutic application of a certain compound for neuropathic pain. The principal amount of the 2004 Note was $1,000,000 and was settled through issuance of $1,000,000 in common stock of DARA Therapeutics, Inc. (formerly DARA Pharmaceuticals, Inc.), a wholly owned subsidiary of the Company at the maturity date, or due and payable in two equal payments of $500,000 at May 3, 2006 and May 3, 2007, as well as an additional $500,000 if the full face of the note was repaid in cash. The original 2004 Note had no stated interest rate.
The Company accounted for the 2004 Note in accordance with APB 14, Accounting for Convertible Debt and Debt Issued with Stock Purchase Warrants (“APB 14”), and utilized a discounted cash flow model with an incremental borrowing rate of 15% to determine the fair value of the 2004 Note. At May 3, 2004, the Company determined that the fair value of the 2004 Note was approximately $1,035,000 and recorded a discount of $465,000. Also, as part of the original agreement, if the Company elected to settle the debt through issuance of shares of common stock DARA Therapeutics common stock (at a price per share as defined in the agreement), a repurchase put feature would be triggered. Under this repurchase feature, if DARA Therapeutics completed a sub-licensing or commercialization agreement with a third party using the compound technology, the third party would have the ability to require DARA Therapeutics to repurchase its shares of common stock at a price based upon the third party’s percentage of equity ownership in DARA Therapeutics as defined in the agreement.
On March 3, 2006, the promissory note was amended to extend the payment dates to March 3, 2007 and September 3, 2007 and accrue interest at 5% annually on $500,000 beginning March 3, 2006 and 5% annually on the remaining $500,000 beginning March 3, 2007.
Interest expense of $0 for the years ended December 31, 2009 and 2008, and $411,660 for the period from June 22, 2002 (inception) through December 31, 2009 was attributable to the amortization of the debt discount and accrued interest on the 2004 Note.
On March 1, 2007, DARA Therapeutics settled the 2004 Note through the issuance of 333,334 shares of common stock of DARA Therapeutics representing 25% of the then outstanding stock of DARA Therapeutics. The Company recorded the issuance of DARA Therapeutics shares as noncontrolling interest in subsidiary in the amount of $1,441,948. Net loss attributable to the third party’s noncontrolling interest was $218,339 and $328,975 for the years ended December 31, 2009 and 2008, respectively, and $1,011,088 for the period from June 22, 2002 (inception) through December 31, 2009; which has reduced the noncontrolling interest in the subsidiary to $430,861 at December 31, 2009.
9. Leases and Other Financing Arrangements
Operating leases
On November 30, 2007, DARA entered into a lease agreement with the Prudential Insurance Company of America for 7,520 square feet of office space at 8601 Six Forks Road, Raleigh, North Carolina, known as Forum I. DARA relocated its corporate headquarters from 4505 Falls of the Neuse Road, Raleigh, North Carolina to Forum I in April 2008. The lease term began on April 1, 2008 and expires on March 31, 2013 with the option to terminate earlier for cause or to extend. DARA is recording expenses related to the lease evenly over the term of the lease and as a result has recorded a liability at December 31, 2009 for the deferred lease obligation of $10,968.
In connection with this lease, DARA issued a letter of credit in the amount of $77,080 on December 11, 2007. The letter of credit is renewable annually for the term of the lease with the landlord and is collateralized by cash held in an interest-bearing time deposit at DARA’s financial institution.
DARA also has in place various operating leases related to office equipment. Total rent expense for the years ended December 31, 2009 and 2008 was $162,071 and $137,820, respectively.
41
Table of Contents
In July 2009, the Company entered into a financing agreement related to its product liability insurance in the amount of $18,559. The balance outstanding pursuant to this financing agreement as of December 31, 2009 was $8,503.
At December 31, 2009, future minimum commitments, under leases with non-cancelable terms of more than one year are as follows:
| Operating Leases | |||
| Year: |
|||
| 2010 |
$ | 163,490 | |
| 2011 |
165,683 | ||
| 2012 |
169,144 | ||
| 2013 |
42,544 | ||
| Total |
$ | 540,861 | |
Capital Leases
As part of the merger with Point during 2008, the Company acquired office equipment under a capital lease agreement of $34,328. Additionally during 2008, the Company entered into a capital lease agreement of $35,801 for additional office equipment. This capital lease agreement was terminated in 2009 and the Company recorded a net loss of $19,930 on the capital lease assets and a gain on the extinguishment of the capital lease obligation of $12,240 in connection therewith which is recorded as other income (expense), net on the consolidated statements of operations for the year ended December 31, 2009. The cost of capital lease assets is included under property and equipment in the balance sheet at December 31, 2009 and 2008, respectively. Accumulated depreciation of the leased equipment was $10,079 and $10,778 at December 31, 2009 and 2008, respectively.
The future minimum lease payments required under capital leases and the present values of the net minimum lease payments as of December 31, 2009 are as follows:
| Capital Leases | ||||
| Year: |
||||
| 2010 |
$ | 12,342 | ||
| 2011 |
12,342 | |||
| 2012 |
12,342 | |||
| 2013 |
4,114 | |||
| Total |
41,140 | |||
| Less amount representing interest |
(12,793 | ) | ||
| Present value of minimum lease payments |
$ | 28,347 | ||
10. Commitments and Contingencies
On October 9, 2009, DARA entered into an Addendum and First Amendment to Material Transfer Agreement (the “Amendment”) with America Stem Cell, Inc. pursuant to which the Material Transfer Agreement between the Company and America Stem Cell dated March 24, 2008 (the “Agreement”) was amended. Under the Agreement, the Company is providing America Stem Cell with dipeptidylpeptidase (DPP-IV) inhibitors from its proprietary library which America Stem Cell is using to further its research and development program related to hematopoietic stem cell (HSC) transplants (the “Program”). Under the Agreement as amended by the Amendment, America Stem Cell is required to pay the Company a total of $250,000, in four equal installments
42
Table of Contents
over approximately three years, contingent upon America Stem Cell’s receipt of at least $3 million in grant funding for the Program. As of December 31, 2009 America Stem Cell has not received grant funding.
11. Stockholders’ Equity
Pursuant to the Merger Agreement, each share of DARA common stock and preferred stock issued and outstanding immediately prior to the effective time of the merger ceased to be outstanding and was converted into the right to receive 1.031406 shares of post-merger Company common stock, plus cash in lieu of any fractional shares. Additionally, outstanding options and warrants to purchase shares of DARA common stock became options and warrants to purchase shares of post-merger Company common stock adjusted as follows: the number of shares acquirable upon exercise was multiplied by 1.031406 and the exercise price per share was divided by 1.031406. As a result of the transaction, the former DARA stockholders received 96.4% of the Company’s outstanding shares of common stock on a fully-diluted basis and Merger Sub merged with and into DARA, with DARA surviving as a wholly-owned subsidiary of the Company.
Common Stock
On February 12, 2008, upon completion of the merger, the Company authorized issuance of 75,000,000 shares of common stock with a par value of $.01 per share. At December 31, 2008 there were 30,113,829 shares issued and 30,101,328 outstanding. At December 31, 2009 there were 44,633,474 shares issued and outstanding.
On October 21, 2008, the Company entered into a Securities Purchase Agreement with certain investors in connection with a registered direct offering (the “Offering”) of up to 8,500,000 shares of the Company’s common stock and up to 13,600,000 warrants (less 850,000 Class A Warrants to Gilford Securities, Inc., the placement agent), to purchase shares of the Company’s common stock. The terms of the Offering provide for the common stock and warrants to be sold in units for $1.00 per unit, with each unit consisting of (1) one share of common stock, (2) a Class A Warrant to purchase one share of common stock for each unit purchased at the greater of (a) the consolidated bid price on NASDAQ Capital Market on the trading day immediately preceding the applicable closing date plus $.01 and (b) $1.30 or, if higher, the exercise price for Class A Warrants set at an earlier closing and (3) a Class B Warrant to purchase one-half of a share of common stock for each unit purchased at $2.25 per share. Class A Warrants are exercisable beginning six months after the date of issuance and expire five years after they first become exercisable. Class B Warrants are exercisable beginning 12 months after the date of issuance and expire five years after they first become exercisable. The shares of common stock and Warrants in the Offering were offered pursuant to an effective shelf registration statement on Form S-3, which was initially filed with the SEC on April 9, 2008 and declared effective on April 18, 2008 (File No.333-150150).
The Company sold 2,255,000 units of common stock, 2,255,000 Class A warrants to purchase common stock, and 1,127,500 Class B warrants to purchase common stock at an initial closing that was completed on October 21, 2008 for gross proceeds of $2,255,000. After placement agent fees of $249,000 and legal expenses of $73,000 the cash proceeds to DARA were $1,933,000.
On June 15, 2009, the Company entered into a Securities Purchase Agreement with certain accredited investors in connection with the private issuance and sale to such investors of 3,433,884 units. Gross proceeds to the Company from this sale were $1,397,000, and net proceeds after placement agent fees were $1,298,180. Each unit consisted of (1) one share of common stock and (2) one warrant to purchase one share of common stock. The units were issued and sold to investors at a price per unit equal to the average of the closing sales price on the NASDAQ Capital Market for one share of common stock for the period of twenty (20) trading days ending on the last trading day prior to the date the investor executed the securities purchase agreement and deposited the purchase price. With this pricing mechanism, different investors paid different prices in the Private Placement depending on when they signed the Purchase Agreement and submitted their funds. Purchase prices ranged from $0.39 to $0.55 per unit. Each warrant has an exercise price equal to $0.46, which was the consolidated closing bid price on the trading day prior to the closing date. The warrants are exercisable beginning twelve months after the date of issuance with an expiration date of five years after the date of issuance. In addition to the warrants issued to investors, the placement agents received a total of 151,848 warrants.
43
Table of Contents
The Company sold the units to certain accredited investors without registration under the Securities Act of 1933, as amended (the “Act”), or state securities laws, in reliance on the exemptions provided by Section 4(2) of the Act and/or Regulation D promulgated thereunder and in reliance on similar exemptions under applicable state laws. Since the units have not been registered, they may not be offered or sold by investors absent registration or an applicable exemption from registration requirements, such as the exemption afforded by Rule 144 under the Act. Subject to the volume limit, manner of sale and other requirements of Rule 144, investors who are not affiliates of the Company would be able to re-sell the shares of the Company’s common stock acquired in the Private Placement following a six month holding period.
On September 10, 2009, the Company entered into a Securities Purchase Agreement with certain accredited investors in connection with a registered direct offering by the Company of 6,578,947 shares of the Company’s common stock and 4,934,210 warrants to purchase shares of common stock. The common stock and warrants were issued and sold in units for $0.38 per unit, with each unit consisting of one share of common stock and three-fourths of a warrant to purchase one share of common stock for each unit purchased. Under the securities purchase agreement, the units were sold at a closing that was completed on September 14, 2009 for gross proceeds of $2,500,000 and net proceeds after placement agent fees were $2,300,000. In connection with the September 18, 2009 transaction described above, the number of shares covered by these warrants increased by ten percent to 5,427,630 as the result of the operation of applicable anti-dilution provisions. Each warrant entitles the holder to purchase shares of common stock for an exercise price per share equal to $0.56. The warrants are exercisable beginning March 15, 2010 and expire September 14, 2012.
On September 16, 2009, DARA entered into a Securities Purchase Agreement with certain accredited investors in connection with a registered direct offering by the Company of 2,200,000 shares of the Company’s common stock and 1,100,000 warrants to purchase shares of common stock. In the offering, the common stock and warrants were sold in units for $0.5525 per unit, with each unit consisting of one share of common stock and one-half of a warrant to purchase one share of common stock for each unit purchased. The closing of the sale of units under the Purchase Agreement took place on September 18, 2009 for gross proceeds of $1,215,500 and net proceeds after placement agent fees were $1,118,260. Each warrant entitles the holder to purchase shares of common stock for an exercise price per share equal to $0.49. The warrants are immediately exercisable and expire September 18, 2014.
On October 13, 2009, DARA entered into a Securities Purchase Agreement with certain accredited investors in connection with a registered direct offering by the Company of 1,400,037 shares of the Company’s common stock and 700,018 warrants to purchase shares of common stock. In the offering, the common stock and warrants were sold in units for $0.5357 per unit, with each unit consisting of one share of common stock and one-half of a warrant to purchase one share of common stock for each unit purchased. Under the securities purchase agreement, the units were sold at a closing that was completed on October 14, 2009 for gross proceeds of $750,000 and net proceeds after placement agent fees were $690,000. Each warrant entitles the holder to purchase shares of common stock for an exercise price per share equal to $0.4732. The warrants are immediately exercisable and expire October 14, 2014.
Preferred Stock
On February 12, 2008, upon completion of the merger the Company authorized 1,000,000 shares of preferred stock with a par value of $.01 per share. At December 31, 2009 and 2008 there were no outstanding preferred shares.
Prior to the merger, the Company had authorized the issuance of 25,000,000 shares of preferred stock with a par value of $.001 per share. The 5,000,000 shares of Series A Preferred Stock and 6,350,333 shares of Series B Preferred Stock that were issued and outstanding at the time of the merger were converted into 11,706,802 shares of common stock per the exchange ratio of 1.031406.
44
Table of Contents
Stock Dividend
On April 28, 2005, the board of directors approved a three for two (3:2) stock split in the form of a stock dividend. Stockholders of record on April 28, 2005 received a stock dividend of one share of common stock for every two shares of capital stock (preferred or common) owned on that date.
Warrants
The Company has a total of 14,973,676 warrants at a weighted-average price of $0.92 to purchase its common stock outstanding as of December 31, 2009. These warrants are summarized as follows:
| Date |
Price | Number of shares | Life | Expiration | |||||
| October 13, 2009 |
$ | 0.47 | 700,018 | 5 year | October 13, 2014 | ||||
| September 18, 2009 |
$ | 0.49 | 1,100,000 | 5 year | September 18, 2014 | ||||
| September 14, 2009 |
$ | 0.56 | 5,427,630 | 5 year | September 14, 2014 | ||||
| June 15, 2009 |
$ | 0.46 | 3,585,732 | 5 year | June 15, 2014 | ||||
| October 21, 2008 |
$ | 1.00 | 225,500 | 5 year | October 21, 2013 | ||||
| October 21, 2008 |
$ | 1.30 | 2,255,000 | 5 year | October 21, 2013 | ||||
| October 21, 2008 |
$ | 2.25 | 1,127,500 | 5 year | October 21, 2013 | ||||
| August 7, 2008 |
$ | 40.00 | 34,247 | 5 year | August 7, 2012 | ||||
| March 31, 2006 |
$ | 2.91 | 100,596 | 5 year | March 31, 2011 | ||||
| May 25, 2005 |
$ | 1.94 | 224,064 | 5 year | May 25, 2010 | ||||
| February 21, 2005 |
$ | 1.94 | 193,389 | 5 year | February 21, 2010 | ||||
| 14,973,676 | |||||||||
Common Stock Reserved for Future Issuance
The Company has reserved authorized shares of common stock for future issuance at December 31, 2009 as follows:
| Outstanding stock options |
1,431,550 | |
| Possible future issuance under stock option plan |
2,688,806 | |
| Outstanding warrants |
14,973,676 | |
| 19,094,032 | ||
12. Share-Based Compensation
DARA has two sharebased compensation plans, the 2008 Employee, Director, and Consultant Plan, and the 2003 Amended and Restated Employee, Director, and Consultant Plan, together referred to herein as the “Stock Plans”.
During 2008, the Company adopted a share-based compensation plan which provides for the granting of incentive stock options, non-qualified stock options, stock appreciation rights, and stock grants (the “2008 Plan”). The 2008 plan provides for the granting by the board of directors of incentive stock options to employees and non-qualified stock options to employees, directors, and consultants of the Company or its subsidiaries. Options granted and shares underlying stock purchase rights issued under the 2008 Plan vest over periods determined by the board of directors, generally over three years, with 25% vested upon issuance and an additional 25% vested upon each of the successive three anniversary dates of the grant.
During 2003, the Company adopted a share-based compensation plan which provides for the granting of incentive stock options, non-qualified stock options, and stock grants. In 2008, this plan was amended and restated (the
45
Table of Contents
“2003 Plan”). The 2003 Plan provides for the granting by the board of directors of incentive stock options to employees and non-qualified stock options to employees, directors, and consultants of the Company or its subsidiaries. Options granted and shares underlying stock purchase rights issued under the 2003 Plan vest over periods determined by the board of directors, generally over three years, with 25% vested upon issuance and an additional 25% vested upon each of the successive three anniversary dates of the grant. Any outstanding options under the 2003 Plan that term or expire will be forfeited and not returned to the 2003 Plan for issuance.
Under the Stock Plans, exercise prices and life terms of stock option grants are determined based on the participant’s total combined voting power of all classes of stock of the Company or its affiliate. For participants who own 10% or less of the total combined voting power of all classes of stock of the Company or its affiliate, an incentive stock option’s exercise price must not be less than estimated fair value and its maximum term is ten years. For participants who own more than 10% of the total combined voting power of all classes of stock of the Company or its affiliate, an incentive stock option’s exercise price must not be less than 110% of estimated fair value and its maximum term is five years. The exercise price of non-qualified stock options is determined by the administrator; provided, that the exercise price per share shall be not less than the fair market value per share on the date the Stock Option is granted and the maximum term of non-qualified stock options is determined by the administrator of the plan, which is the board of directors.
Incentive stock options, non-qualified stock options and restricted share awards were granted through December 31, 2009. The options are exercisable for a period not to exceed ten years and vesting for the options and restricted shares granted to date range from being 100% fully vested to 25% immediately vested and the remainder vesting over a three year period.
As of December 31, 2009, a total of 7,366,072 shares have been authorized for grants of options or shares under the Stock Plans, of which 2,688,806 are available for future grant. As of December 31, 2009 there were 543,334 and 0 restricted shares outstanding under the 2008 and 2003 Plans, respectively. As of December 31, 2009, a total of 893,161 and 538,389 stock options were outstanding under the 2008 Plan and 2003 Plans, respectively.
The following table summarizes the Company’s stock plan activity under all of the Company’s stock based compensation plans from March 12, 2003 (plan inception) through December 31, 2009:
46
Table of Contents
| Shares Available for Grant |
Shares Subject to Outstanding Options |
Weighted Average Exercise Price | |||||||
| Shares authorized at March 12, 2003 |
1,000,000 | — | $ | — | |||||
| Options granted |
(100,000 | ) | 100,000 | 0.53 | |||||
| Balance at December 31, 2003 |
900,000 | 100,000 | 0.53 | ||||||
| Options granted |
(605,000 | ) | 605,000 | 0.64 | |||||
| Options exercised |
— | (393,750 | ) | 0.62 | |||||
| Options forfeited |
— | — | — | ||||||
| Balance at December 31, 2004 |
295,000 | 311,250 | 0.63 | ||||||
| Shares authorized on January 25, 2005 |
1,000,000 | — | — | ||||||
| Options granted through April 28, 2005 |
(390,000 | ) | 390,000 | 1.93 | |||||
| Additional authorized shares due to stock dividend on April 28, 2005 |
1,000,000 | — | — | ||||||
| Options granted as result of stock dividend on April 28, 2005 |
(547,500 | ) | 547,500 | 1.93 | |||||
| Options granted after April 28, 2005 |
(410,000 | ) | 410,000 | 1.93 | |||||
| Options exercised |
— | (33,000 | ) | 0.53 | |||||
| Options forfeited |
179,500 | (179,500 | ) | 1.38 | |||||
| Balance at December 31, 2005 |
1,127,000 | 1,446,250 | 1.43 | ||||||
| Options granted |
(460,000 | ) | 460,000 | 2.40 | |||||
| Options exercised |
— | (240,050 | ) | 0.75 | |||||
| Options forfeited |
97,500 | (97,500 | ) | 1.09 | |||||
| Balance at December 31, 2006 |
764,500 | 1,568,700 | 1.84 | ||||||
| Shares authorized on January 16, 2007 |
1,000,000 | — | — | ||||||
| Options granted |
(1,159,540 | ) | 1,159,540 | 2.60 | |||||
| Options forfeited |
61,450 | (61,450 | ) | 2.30 | |||||
| Balance at December 31, 2007 |
666,410 | 2,666,790 | 2.14 | ||||||
| Adjustment to beginning balance from merger ratio |
20,942 | 79,052 | — | ||||||
| Balance at February 12, 2008 |
687,352 | 2,745,842 | — | ||||||
| Options authorized under the 2008 plan |
4,606,246 | — | — | ||||||
| Reduction to options available to be issued under the 2003 plan |
(671,881 | ) | — | — | |||||
| Options granted |
(475,309 | ) | 475,309 | 1.46 | |||||
| Shares issued to directors |
(105,000 | ) | — | — | |||||
| Options exercised |
— | (290,083 | ) | 0.65 | |||||
| Shares cancelled and forfeited |
— | (702,855 | ) | 2.08 | |||||
| Balance at December 31, 2008 |
4,041,408 | 2,228,213 | 2.15 | ||||||
| Options granted |
(1,150,000 | ) | 1,150,000 | 0.27 | |||||
| Shares issued to directors |
(11,251 | ) | — | — | |||||
| Shares issued as compensation |
(512,195 | ) | — | — | |||||
| Options exercised |
— | (425,000 | ) | 0.26 | |||||
| Shares cancelled and forfeited |
320,844 | (1,521,663 | ) | 2.20 | |||||
| Balance at December 31, 2009 |
2,688,806 | 1,431,550 | $ | 1.15 | |||||
Effective with the adoption of FASB ASC 718, Compensation-Stock Compensation, as of January 1, 2006, the Company has elected to use the Black-Scholes option pricing model to determine the fair value of options
47
Table of Contents
granted. The Company has not paid and does not anticipate paying cash dividends; therefore the expected dividend rate is assumed to be 0%. Stock price volatility is based on an analysis of historical stock price data reported for a peer group of public companies. The expected life is the length of time options are expected to be outstanding before being exercised. The Company estimates expected life using the “simplified method” as allowed under the provision of the Securities and Exchange Commission’s Staff Accounting Bulletin No. 107, Share-Based Payment. The simplified method uses an average of the option vesting period and the option’s original contractual term. The Company uses the implied yield of U. S. Treasury instruments with terms consistent with the expected life of options as the risk-free interest rate. FASB ASC 718 requires companies to estimate a forfeiture rate for options and accordingly reduce the compensation expense reported. The Company used historical data among other factors to estimate the forfeiture rate.
The fair value of stock options granted to employees and non-employee directors was estimated using a Black-Scholes option-pricing model and the following weighted-average assumptions:
| 2009 | 2008 | |||||||
| Estimated dividend yield |
— | — | ||||||
| Expected stock price volatility |
81.88 | % | 77.43 | % | ||||
| Expected life of option (in years) |
5.32 | 5.75 | ||||||
| Risk-free interest rate |
2.02 | % | 3.02 | % | ||||
| Weighted average fair value per share |
$ | 0.48 | $ | 0.98 | ||||
The Company accounts for equity instruments issued to non-employees in accordance with the provisions of ASC 505, Equity, using a fair-value approach. The equity instruments, consisting of shares of restricted stock, stock options and warrants granted to lenders and consultants, are valued using the Black-Scholes valuation model. Measurement of share-based compensation is subject to periodic adjustments as the underlying equity instruments vest and is recognized as an expense over the term of the related financing or the period over which services are received.
Using the Black-Scholes option pricing model, the weighted average grant-date fair value of options granted during the years ended December 31, 2009 and 2008 were $0.19 and $0.98, respectively. The total intrinsic values of stock options exercised during the years ended December 31, 2009 and 2008 were $123,000 and $290,000, respectively. The amount of cash received from the exercise of stock options was $110,750 and $188,554 during the years ended December 31, 2009 and 2008, respectively. The Company did not realize a tax benefit from stock options exercised during the years ended December 31, 2009 and 2008.
The following summarizes certain information about fully vested stock options and stock options expected to vest as of December 31, 2009:
| Number of options |
Weighted Average Remaining Contractual Life (in years) |
Weighted Average Exercise Price |
Aggregate Intrinsic Value | |||||||
| Outstanding |
1,403,185 | 8.12 | $ | 1.16 | $ | 104,270 | ||||
| Exercisable |
645,498 | 7.05 | $ | 1.84 | $ | 875 | ||||
48
Table of Contents
The following table summarizes certain information about the Company’s stock options outstanding as of December 31, 2009:
| Exercise Price |
Number of shares outstanding |
Weighted Average Remaining Contractual Life (in years) |
Number of Options Exercisable | ||||
| $ | 0.25 | 600,000 | 9.17 | — | |||
| $ | 0.43 | 125,000 | 9.34 | 87,500 | |||
| $ | 1.40 | 158,161 | 8.69 | 79,078 | |||
| $ | 1.55 | 170,181 | 5.07 | 170,181 | |||
| $ | 2.19 | 10,000 | 8.33 | 5,000 | |||
| $ | 2.33 | 115,516 | 5.87 | 114,226 | |||
| $ | 2.62 | 252,692 | 7.77 | 189,513 | |||
| 1,431,550 | 8.13 | 645,498 | |||||
The Company recognized stock option compensation expense for employees and non-employee directors as follows:
| Year Ended December 31, | Period from | ||||||||
| 2009 | 2008 | June 22, 2002 (inception) | |||||||
| Research and development |
$ | 98,770 | $ | 497,570 | $ | 1,138,274 | |||
| General and administrative |
227,064 | 721,469 | 2,110,238 | ||||||
| Total stock-based compensation to employees and non-employee directors |
$ | 325,834 | $ | 1,219,039 | $ | 3,248,512 | |||
Stock option compensation expense for non-employees in exchange for services during the years ended December 31, 2009 and 2008 were $26,004 and $0, respectively, and $657,064 for the period from June 22, 2002 (inception) through December 31, 2009.
As of December 31, 2009, there was $112,702 of total unrecognized compensation cost for non-vested share-based stock option compensation arrangements which is expected to be recognized over a weighted average period of 0.36 years.
49
Table of Contents
Restricted Stock Activity
During 2009 the Company issued 500,000 restricted shares to five employees. The Chief Executive Officer/President was awarded 300,000 restricted shares and four employees each were awarded 50,000 restricted shares. The shares will vest 100% on the anniversary of the grant, September 24, 2010. The Company recognized $61,485 and $15,370 stock-based compensation expense in general and administrative and research and development, respectively, for the year ended December 31, 2009. There was no restricted share expense for employees prior to this period.
The Company recognized share-based compensation expense related to issuance of restricted stock to certain members of the board of directors in general and administrative expense of $32,702 and $120,540 for the years ended December 31, 2009 and 2008, respectively, and $169,242 for the period from June 22, 2002 (inception) through December 31, 2009.
The Company recognized share-based compensation related to issuance of restricted stock to nonemployees in exchange for services totaling $41,667 and $322,261 for the years ended December 31, 2009 and 2008, respectively, and $363,928 for the period from June 22, 2002 (inception) through December 31, 2009.
| Outstanding Shares |
Weighted Average Grant Date Fair Value | |||||
| Nonvested restricted stock at December 31, 2007 |
— | $ | — | |||
| Restricted stock granted |
105,000 | 1.98 | ||||
| Restricted stock vested |
(26,250 | ) | 1.98 | |||
| Nonvested restricted stock at December 31, 2008 |
78,750 | 1.98 | ||||
| Restricted stock granted |
538,445 | 0.57 | ||||
| Restricted stock vested |
(163,942 | ) | 0.26 | |||
| Restricted stock cancelled (forfeited) |
(44,166 | ) | 1.12 | |||
| Nonvested restricted stock at December 31, 2009 |
409,087 | $ | 0.71 | |||
As of December 31, 2009, there was $290,211, of total unrecognized compensation cost related to nonvested restricted stock arrangements which is expected to be recognized over a weighted average period of 0.78 years.
13. Employee Benefit Plan
During 2005, the Company adopted a defined contribution employee benefit plan that covers all qualifying employees. The plan provides for voluntary employee contributions and a discretionary matching employer contribution equal to amounts that do not exceed the maximum amounts allowed by the Internal Revenue Service. As part of the Company’s cost reduction program, effective April 1, 2009 the Company amended its contribution to the employee benefit plan to remove the Safe Harbor Cash or Deferred Arrangement provisions. The plan provides for voluntary employee contributions and a discretionary matching employer contribution equal to amounts that do not exceed the maximum amounts allowed by the Internal Revenue Service.
Defined contribution plan expense prior to the effective date of the amendment was $6,524 and $53,204 for the years ended December 31, 2009 and 2008, respectively, and $179,359 for the period from June 22, 2002 (inception) through December 31, 2009.
50
Table of Contents
14. Related Party Transactions
The Company incurred expenses of $15,200 during the year ended December 31, 2008 related to aircraft usage from an entity owned by the former Co-Chairman of the Board, Mr. Steve Gorlin. Mr. Gorlin resigned from his position January 2009. There were no related party transactions during the year ended December 31, 2009.
15. Subsidiaries
During 2004, the Company organized several subsidiaries: Signum Pharmaceuticals, OnsetThera, Inc., and MIKKO Pharmaceuticals. Upon formation, the Company acquired 1,000,000 shares of each of the subsidiaries which represented 100% equity ownership. OnsetThera, Inc. and Signum Pharmaceuticals obtained licensing rights for certain patents and technologies during 2004 in exchange for certain payments and the sale to the licensors of a 40% and 25% equity ownership in the respective entities. These transactions reduced the Company’s ownership in OnsetThera, Inc. to 60% and its ownership in Signum Pharmaceuticals to 75%.
During 2005, the Company was issued 1,333,333 additional shares of Signum Pharmaceuticals, Inc. and 1,666,667 additional shares of OnsetThera, Inc. in consideration for expenses incurred and monies spent (or committed to be spent) for the benefit of Signum Pharmaceuticals, Inc. and OnsetThera, Inc. by the Company. The additional shares increased the Company’s investment in Signum Pharmaceuticals, Inc. and OnsetThera, Inc. from 75% and 60% to 87.5% and 80%, respectively.
During 2005, the Board of Directors authorized the creation of a new subsidiary, NYVARA Pharmaceuticals, Inc. Upon formation, the Company acquired 1,000,000 shares of the subsidiary representing 100% equity ownership. NYVARA obtained licensing rights for certain patents and technologies during 2005 in exchange for certain payments and the sale to the licensors of a 15% equity ownership in the entity. This transaction reduced the Company’s ownership in NYVARA Pharmaceuticals, Inc. to 85%.
As a result of the Company’s merger with Point Therapeutics, Inc. February 12, 2008, the Company acquired Point Therapeutics’ wholly owned subsidiary, Point Massachusetts, Inc.
Effective December 18, 2006, the Company filed certificates of dissolution for both Onset Thera, Inc. and NYVARA Pharmaceuticals, Inc. Effective December 16, 2008, the company filed a certificate of dissolution for Mikko Pharmaceuticals, Inc. Effective December 8, 2009, the company filed a certificate of dissolution for Signum Pharmaceuticals, Inc.
16. Income Taxes
Deferred income taxes reflect the net tax effects of temporary differences between the carrying amounts of assets and liabilities for financial reporting purposes and the amounts used for income tax purposes. Significant components of the Company’s deferred tax assets and liabilities for federal income tax purposes are as follows at December 31:
| 2009 | 2008 | |||||||
| Deferred tax assets (liabilities): |
||||||||
| Net operating loss carryforwards |
$ | 74,719,342 | $ | 74,063,406 | ||||
| Tax credits |
3,797,106 | 4,314,264 | ||||||
| Investments and other |
1,416,807 | 1,467,186 | ||||||
| Total deferred tax assets |
79,933,255 | 79,844,856 | ||||||
| Valuation allowance |
(79,933,255 | ) | (79,844,856 | ) | ||||
| Net deferred tax assets |
$ | — | $ | — | ||||
51
Table of Contents
The Company has provided a valuation allowance against the deferred tax assets recorded as of December 31, 2009 and 2008, due to uncertainties as to their ultimate realization. The increase in the valuation allowance in each period resulted primarily from the additional net operating loss carryforward generated.
As of December 31, 2009 and 2008, respectively, the Company had an estimated $205,448,031 and $201,437,222 of U.S. Federal net operating loss carryforwards that begin to expire in 2015. The Company also has an estimated $82,759,138 and $93,155,436 of state net economic loss carryforwards that have already started to expire. Additionally, the Company has research and development credits of $2,875,039 and $922,112 for federal and state tax purposes, respectively, which begin to expire in 2015.
The Internal Revenue Code provides limitations on utilization of existing net operating losses and tax credit carryforwards against future taxable income based upon changes in share ownership. If these changes have occurred, the ultimate realization of the net operating loss and R&D credit carryforwards could be permanently impaired.
Income tax computed at the statutory federal income tax rate of 34% is reconciled to the provision (benefit) for income taxes for the years ended December 31 as follows:
| 2009 | 2008 | |||||||
| Expected federal tax benefit |
$ | (1,137,146 | ) | $ | (3,933,576 | ) | ||
| State income taxes, net of federal benefit |
(152,177 | ) | (518,945 | ) | ||||
| Other permanent differences |
160,185 | 422,833 | ||||||
| Tax credits |
(81,593 | ) | (498,770 | ) | ||||
| Expired tax credits |
936,527 | — | ||||||
| Other |
16,725 | 474,304 | ||||||
| Change in valuation allowance |
390,900 | 4,054,154 | ||||||
| Income tax benefit |
$ | — | $ | — | ||||
On January 1, 2007, the Company adopted ASC 740-10 (formerly FIN 48). There was a cumulative effect adjustment of $219,338 upon adoption and included in this amount is $24,893 related to penalties and interest. An additional $18,220, $15,616 and $15,448 of penalties and interest on these liabilities was accrued in 2007, 2008 and 2009, respectively. Since the Company has incurred cumulative operating losses since inception, all tax years remain open to examination by major jurisdictions.
The following is a rollforward of gross unrecognized tax positions:
| Gross tax liability at December 31, 2008 |
$ | 194,445 | |
| Changes in the current year |
— | ||
| Gross tax liability at December 31, 2009 |
$ | 194,445 | |
52
Table of Contents
17. Subsequent Event
On February 26, 2010 and March 5, 2010, the Company entered into two Securities Purchase Agreements with certain accredited investors in connection with the private issuance and sale to such investors of 3,652,136 units and 106,383 units, respectively. Aggregate proceeds to the Company from these sale were $1,766,504. Each unit consists of (1) one share of common stock and (2) one-half of a warrant to purchase one share of common stock. The units were issued and sold to investors for $0.47 per unit. The warrants have an exercise price of $0.47 and are exercisable beginning six months after the date of issuance with an expiration date of five years after the date of issuance.
Item 9. Changes in and Disagreements with Accountants on Accounting and Financial Disclosure.
Not applicable.
Item 9A(T). Controls and Procedures.
(a) Evaluation of Disclosure Controls and Procedures
As required by Rule 13a-15(b) under the Securities Exchange Act of 1934 (the “Exchange Act”), our management, including our Chief Executive Officer and Chief Accounting Officer, conducted an evaluation as of the end of the period covered by this report, of the effectiveness of our disclosure controls and procedures as defined in Rule 13a-15(e) under the Securities Exchange Act of 1934. Based on that evaluation, the Chief Executive Officer and Chief Accounting Officer have concluded that these disclosure controls and procedures were effective to provide reasonable assurance that information required to be disclosed by us in reports that we file under the Securities and Exchange Act of 1934 is recorded, processed, summarized, and reported, within the time periods specified in Securities and Exchange Commission rules and forms. It should be noted that in designing and evaluating the disclosure controls and procedures, management recognized that any controls and procedures, no matter how well designed and operated, can provide only reasonable assurance of achieving the desired control objectives, and management necessarily is required to apply its judgment in evaluating the cost-benefit relationship of possible controls and procedures. We have designed our disclosure controls and procedures to reach a level of reasonable assurance of achieving desired control objectives and, based on the evaluation described above, our Chief Executive Officer and Chief Accounting Officer concluded that our disclosure controls and procedures were effective at reaching that level of reasonable assurance.
(b) Management’s Report on Internal Control Over Financial Reporting
Our management is responsible for establishing and maintaining adequate internal control over financial reporting, as such term is defined in Rules 13a-15(f) and 15d-15(f) under the Exchange Act. Internal control over financial reporting is a process designed under the supervision of our principal executive and principal financial officers to provide reasonable assurance regarding the reliability of financial reporting and the preparation of financial statements for external purposes in accordance with generally accepted accounting principles. All internal control systems, no matter how well designed, have inherent limitations. Even those systems determined to be effective can provide only reasonable assurance with respect to financial statement preparation and presentation.
Under the supervision and with the participation of our management, including our principal executive officer and principal financial officer, we conducted an evaluation of the effectiveness of our internal control over financial reporting as of December 31, 2009 based on the framework established in Internal Control — Integrated Framework issued by the Committee of Sponsoring Organizations of the Treadway Commission (COSO).” Based on management’s assessment, management concluded that, as of December 31, 2009, the Company’s internal control over financial reporting was effective.
53
Table of Contents
This Annual Report does not include an attestation report of the Company’s registered public accounting firm regarding internal control over financial reporting. Management’s report was not subject to attestation by the Company’s registered public accounting firm pursuant to temporary rules of the Securities and Exchange Commission that permit the Company to provide only management’s report in this Annual Report.
(c) Changes in Internal Control Over Financial Reporting
During the fourth quarter of 2009, there were no changes in our internal control over financial reporting that have materially affected, or are reasonably likely to materially affect, our internal control over financial reporting.
None.
PART III
Item 10. Directors, Executive Officers and Corporate Governance.
Executive Officers
The following is a list of our executive officers and their principal positions with us as of.
| Name |
Age | Position | ||
| Richard A. Franco, Sr., R. Ph. | 68 | President, Chief Executive Officer, Director | ||
| Ann A. Rosar | 57 | Chief Accounting Officer |
Richard A. Franco, Sr., R. Ph. has served as our Chief Executive Officer and a member of our board of directors since January 1, 2009 and our President since February 6, 2009. Previously, Mr. Franco served as our Chairman of the Board from October 2007 until March 2008, as President, Chief Executive Officer from January 1, 2007 until March 2008 and as President and a member of our board of directors from 2005 until March 2008. Mr. Franco has been a leader in the pharmaceutical and medical industry for more than 35 years. Prior to joining our management team, Mr. Franco co-founded LipoScience, Inc., a private medical technology and diagnostics company, and served as president, CEO and director of that company. Prior to founding LipoScience, Inc., Mr. Franco served as president, CEO and director of Trimeris, Inc., a biopharmaceutical company (TRMS-NASDAQ). Mr. Franco was employed for more than a decade with Glaxo Inc. (now GlaxoSmithKline), where he served as a member of the Executive Committee, vice president and general manager of Glaxo Dermatology and the Cerenex Division and vice president of Commercial Development and Marketing. Mr. Franco currently is a director of Salix Pharmaceuticals, Ltd. (SLXP-NASDAQ), a specialty pharmaceutical company; NeoMatrix, LLC, a private medical technology company commercializing screening systems for breast cancer detection; and Chapter President and Director of the Research Triangle Chapter of the National Association of Corporate Directors (NACD). Mr. Franco earned a Bachelor of Science degree in pharmacy from St. John’s University and did his graduate work in pharmaceutical marketing and management at Long Island University.
Mr. Franco brings to our board of directors a vital understanding and appreciation of the Company’s business and history acquired through his service with the Company, as well as significant knowledge of and experience in the pharmaceutical and medical industries. Mr. Franco has extensive business, managerial, executive and leadership experience that further qualify him to serve as a member of the board. His educational background in pharmacy, pharmaceutical marketing and management also provides the board with an essential perspective. Mr. Franco has a valuable understanding of the role played by the board of directors acquired through service on the boards of several companies.
54
Table of Contents
Ann A. Rosar has served as our Chief Accounting Officer since January 9, 2009 and as our Controller since November 2007. Ms. Rosar has over twenty years experience in finance with publicly held companies and more than ten years experience regarding regulatory reporting requirements. Prior to joining the Company, Ms. Rosar was the Manager of Financial Reporting and Accounting with Cicero, Inc. (formerly Level 8 Systems) where she was responsible for Security Exchange Commission reporting, audits and budget analysis. Prior to that position, she served as Senior Financial Analyst-Business Operations for Nextel Communications. Ms. Rosar received a MBA in Finance from the University of Houston and received her undergraduate degree from North Carolina State University.
Directors
The following table sets forth certain information concerning our non-employee directors as of March 5, 2010:
| Name |
Age | Board Committees | ||
| Haywood Cochrane | 61 | Audit; Compensation | ||
| David Drutz | 71 | Audit; Compensation | ||
| Gail F. Lieberman | 66 | Audit; Compensation |
Haywood Cochrane has served as a member of DARA’s board of directors since February 2008. Mr. Cochrane served as Vice Chairman and a director of I-Trax, Inc. (AMEX: DMX), a publicly traded, total population health management and productivity company, from 2004 to 2008. He joined I-trax when I-trax acquired CHD Meridian Healthcare where he served as Chairman and Chief Executive Officer from 1997 to 2004. Mr. Cochrane has over 20 years of healthcare experience in executive and senior management positions, including Senior Vice President and Chief Operating Officer of Roche Biomedical Laboratories, President and Chief Executive Officer of Allied Clinical Laboratories and Executive Vice President and Chief Financial Officer of Laboratory Corporation of America. Mr. Cochrane earned an A.B. degree in Political Science from the University of North Carolina at Chapel Hill where he was a Morehead Scholar.
Mr. Cochrane brings to our board his extensive executive and senior management experience in the healthcare industry. He is further qualified for service on our board because of his relevant business expertise and leadership experience acquired through his experience serving as Vice Chairman and Chairman of the boards of directors of other healthcare-related companies.
David J. Drutz, M.D. has served as a member of DARA’s board of directors since February 2008. Dr. Drutz currently serves as Chairman of the board of directors of Tranzyme Inc. and as a director of MethylGene Inc. (TSX: MYG), a biopharmaceuticals company. He has been a General Partner with Pacific Rim Ventures (Tokyo, Japan) since 1999. Pacific Rim Ventures (PRV) is focused on global biotechnology investment opportunities in the area of the life sciences. He has also been President of Pacific Biopharma Associates, a biotechnology consulting firm, since 1999. Dr. Drutz was formerly Vice President Biological Sciences (Drug Discovery) and Vice President Clinical Research (AIDS therapeutics) at Smith Kline and French Laboratories in King of Prussia, PA, and Vice President Clinical Development, Daiichi Pharmaceutical Corporation, Ft. Lee, NJ. At Daiichi he was responsible for the development of five anti-infective and oncology products. Dr. Drutz left Daiichi in 1990 to enter the biotechnology industry. Before joining PRV he was President and Chief Executive Officer of Inspire Pharmaceuticals, Inc. (NASDAQ: ISPH), a company specializing in therapeutics for diseases of the respiratory tract and other mucus membrane surfaces. Dr. Drutz received his M.D. degree at the University of Louisville, and postgraduate medical training at Vanderbilt University, following which he served as a U.S. Navy medical officer in Taiwan, Vietnam and the Philippines. He held senior faculty positions at the University of California, San Francisco, University of Texas and the University of Pennsylvania. He is board-certified in Internal Medicine, and a Fellow of the American College of Physicians and the Infectious Diseases Society of America.
Dr. Drutz’s experience as a medical doctor board-certified in Internal Medicine is extremely valuable to our board. In addition to his medical background, Dr. Drutz provides an essential understanding of the drug development process which was acquired through holding a position in which he was responsible for the
55
Table of Contents
development of several pharmaceutical products. Dr. Drutz brings to his service on our board a deep knowledge and understanding of the biotechnology industry, and a unique perspective acquired through his experience with investment and consulting firms and as a senior faculty member at several universities.
Gail F. Lieberman has served as a member of DARA’s board of directors since April 2009. Ms. Lieberman is the founder and Managing Partner of Rudder Capital, LLC, which provides financial and strategic advisory services for middle-market companies including M&A advisory and strategic consulting. She has been a Chief Financial Officer for several Fortune 500 companies, including Thomson Corporation’s Financial & Professional Publishing division, Moody’s Investor Service (D&B) and Scali, McCabe, Sloves (Ogilvy Group). Ms. Lieberman has recently served as a Director for three public companies in the healthcare and aerospace sectors: I-Trax Inc. (Amex: DMX); TriPath Imaging Inc. (NASDQ: TPTH); and Breeze-Eastern Corporation (Amex: BZC). In addition, she sits on several advisory boards and non-profit boards including NY Report and Urban Glass. Ms. Lieberman holds a BA in Mathematics and Physics and an MBA in Finance from Temple University.
Ms. Lieberman has a significant understanding of the role played by the board of directors which was acquired through her service on the boards of several companies, including public companies in the healthcare and aerospace industries. She provides the board with financial expertise acquired through experience as the CFO of several Fortune 500 companies and as the founder and managing partner of a financial and strategic advisory consulting firm. Ms. Lieberman’s educational background in Math, Physics and Business Administration also provides our board with a unique and valuable perspective.
Audit Committee
The board of directors has an Audit Committee whose current members are Messrs. Cochrane (Chairman) and Drutz and Ms. Lieberman. The primary purpose of the Audit Committee is to act on behalf of the board of directors in its oversight of all material aspects of our accounting and financial reporting processes, internal controls and audit functions, including our compliance with Section 404 of the Sarbanes-Oxley Act of 2002. The board of directors has determined that Mr. Cochrane is an “audit committee financial expert” as that term is defined under Regulation S-K, Item 407 (d)(5)(ii), and that he is independent under the current rules of the NASDAQ Stock Market and SEC rules and regulations.
Section 16(a) Beneficial Ownership Reporting Compliance
Section 16(a) of the Exchange Act requires our officers and directors, and persons who beneficially own more than 10% of our outstanding common stock, to file initial reports of ownership and reports of changes in ownership with the SEC. Such persons are required by SEC regulations to furnish us with all copies of Section 16(a) forms they file.
Based solely on our review of the copies of such forms received by us, we believe that during the fiscal year ended December 31, 2009, all filing requirements were timely satisfied except that Messrs. Cochrane, Drutz and Cauwenbergh, a former director of the company, each filed a late Form 4 with respect to a restricted stock grant, and Mr. Franco and Ms. Rosar each filed a late Form 4 with respect to an option grant.
Code of Ethics and Conduct
Our board of directors adopted a code of business ethics and conduct (the “Code of Ethics”), applicable to all of our executives, directors and employees. The Code of Ethics is available in print to any shareholder that requests a copy. Copies may be obtained by contacting Investor Relations at our corporate headquarters. Our Code of Ethics is also available in the Investor Relations section of our website at http://www.darabiosciences.com. We intend to make any disclosures regarding amendments to, or waivers from, the Code of Business Conduct required under Form 8-K by posting such information on our website.
56
Table of Contents
Item 11. Executive Compensation.
Executive Officer Compensation
The following table sets forth information concerning the compensation earned by the individuals that served as our Principal Executive Officer during 2009 and our most highly compensated executive officer other than the individuals who served as our Principal Executive Officer during 2009 (collectively, the “named executive officers”):
2009 Summary Compensation Table
| Name and Principal Position |
Year | Salary ($) | Bonus ($) | Stock Awards ($)(1) |
Option Awards ($)(2) |
All Other Compensation ($) |
Total ($) | ||||||||
| Richard A. Franco, Sr., R.Ph. |
2009 2008 |
— 133,333 |
150,000 — |
171,000 — |
250,000 — |
— — |
|
571,000 133,333 | |||||||
| Ann A. Rosar (3) |
2009 | 120,000 | 2,000 | 28,500 | 10,750 | — | 161,250 | ||||||||
| John Didsbury, Ph.D. |
2009 2008 |
31,923 294,359 |
— — |
— — |
350,000 |
275,000 — |
(4)
|
306,923 644,359 | |||||||
| (1) | The amounts shown in this column indicate the grant date fair value of stock awards granted in the subject year computed in accordance with FASB ASC Topic 718. For additional information regarding the assumptions made in calculating these amounts, see Note 12 to our audited, consolidated financial statements included elsewhere herein. |
| (2) | The amounts shown in this column indicate the grant date fair value of option awards granted in the subject year computed in accordance with FASB ASC Topic 718. For additional information regarding the assumptions made in calculating these amounts, see Note 12 to our audited, consolidated financial statements included elsewhere herein. |
| (3) | Ms. Rosar was appointed Chief Accounting Officer in January 2009. |
| (4) | Represents severance payments pursuant to Dr. Didsbury’s employment agreement. |
Richard A. Franco, Sr., R.Ph. returned to serve as our Chief Executive Officer and President as well as a member of our Board of Directors in January 2009. At that time and in light of the Company’s limited cash resources, the Compensation Committee approved the following compensation for Mr. Franco:
| • | No cash salary; |
| • | A stock option award covering 1,000,000 shares of our Common Stock; and |
| • | A bonus opportunity to be determined following the completion of 2009 based on the achievement of certain Company performance goals. |
57
Table of Contents
In March 2009, Mr. Franco was appointed as Board Chairman.
In May 2009, the Compensation Committee approved a stock option award for Ms. Rosar covering 25,000 shares.
In September 2009 and in recognition of the Company’s success in raising funds and advancing the Company’s development programs and the fact that Mr. Franco did not receive a cash salary in 2009 and that Ms. Rosar did not receive a raise in 2009 or a bonus in 2008, the Compensation Committee approved:
| • | restricted stock awards of 300,000 shares and 50,000 shares for Mr. Franco and Ms. Rosar, respectively; |
| • | accelerated vesting of 66,667 of Mr. Franco’s unvested options effective on September 24, 2009 and of the balance on January 1, 2010; and |
| • | accelerated vesting of Ms. Rosar’s May 2009 option grant. |
Both Mr. Franco and Ms. Rosar exercised options in the amounts of 400,000 and 25,000 respectively in 2009.
Outstanding Equity Awards at 2009 Fiscal Year-End
The following table provides information regarding equity awards held by the named executive officers as of December 31, 2009. The market value of all restricted stock awards is based on the closing price of our common stock as of December 31, 2009 ($0.44).
| Options Awards | Stock Awards | |||||||||||||
| Name |
Number of Securities Underlying Unexercised Options (#) Exercisable |
Number of Securities Underlying Unexercised Options (#) Unexercisable |
Option Exercise Price ($) |
Option Expiration Date |
Number of Shares or Units of Stock that Have Not Vested (#) |
Market Value of Shares or Units of Stock That Have Not Vested ($) | ||||||||
| Richard A. Franco, Sr. |
— | 600,000 | (1) | 0.25 | 03/03/19 | 300,000 | (2) | 132,000 | ||||||
| Ann Rosar |
38,678 | 12,893 | (3) | 2.62 | 11/26/17 | 50,000 | (2) | 22,000 | ||||||
| 12,893 | 12,893 | (4) | 1.40 | 09/09/18 | ||||||||||
| (1) | Reflects the unvested portion of an option grant, which vested in full on January 1, 2010. |
| (2) | Represents shares of restricted stock that will vest in full on September 24, 2010. |
| (3) | Reflects the unvested portion of an option grant which will vest in full on November 26, 2010. |
| (4) | Reflects the unvested portion of an option grant which will vest in two equal annual installments beginning September 9, 2010. |
Compensation of Directors
The following table sets forth information concerning the compensation earned by the individuals serving as non-employee directors during 2009:
58
Table of Contents
| Name |
Fees Earned or Paid in Cash ($) |
Stock Awards ($) (1)(3) |
Option Awards ($)(2)(3) |
All Other Compensation ($)(4) |
Total ($) | |||||
| David J. Drutz |
— | 2,084 | — | 25,000 | 27,084 | |||||
| Haywood D. Cochrane, Jr. |
— | 2,084 | — | 25,000 | 27,084 | |||||
| Geert Cauwenbergh |
— | — | — | 25,000 | 25,000 | |||||
| Steve Gorlin |
— | — | — | — | — | |||||
| Gail F. Lieberman |
25,000 | — | 18,000 | — | 43,000 |
| (1) | The amounts shown in this column indicate the grant date fair value of stock awards granted in the subject year computed in accordance with FASB ASC Topic 718. For additional information regarding the assumptions made in calculating these amounts, see Note 12 to our audited, consolidated financial statements included elsewhere herein. |
| (2) | The amounts shown in this column indicate the grant date fair value of option awards granted in the subject year computed in accordance with FASB ASC Topic 718. For additional information regarding the assumptions made in calculating these amounts, see Note 12 to our audited, consolidated financial statements included elsewhere herein. |
| (3) | The table below sets forth the aggregate number of unvested shares of restricted stock and the aggregate number of stock options held by each non-employee director as of December 31, 2009. |
| Name |
Aggregate Option Awards (#) |
Aggregate Stock Awards (#) | ||
| Haywood D. Cochrane, Jr. |
— | 21,667 | ||
| David J. Drutz |
— | 21,667 | ||
| Gail F. Lieberman |
50,000 | — | ||
| (4) | Reflects distribution of shares of Surgivision common stock valued at the per share amount carried on the Company’s balance sheet, see Note 4 to our audited, consolidated financial statements included elsewhere herein. |
In light of cash constraints, in December 2008, the cash components of our non-employee director compensation program were eliminated. In order to compensate for the elimination of the cash components of non-employee director compensation, each non-employee director was awarded a grant of 25,000 shares of SurgiVision stock in January 2009.
In addition, in January 2009, Messrs. Cauwenbergh, Cochrane and Drutz received grants of 2,917, 4,167 and 4,167 shares of restricted common stock, respectively, representing an annual award prorated for the portion of 2009 during which he served as a director.
Upon Ms. Lieberman’s appointment to the board on April 27, 2009, she received a cash award of $25,000 and grant of 50,000 stock options in lieu of an initial grant of 35,000 shares of restricted common stock.
59
Table of Contents
Item 12. Security Ownership of Certain Beneficial Owners and Management and Related Stockholder Matters.
Stock Ownership Table
The following table sets forth, as of March 5, 2010 certain information concerning beneficial ownership of our common stock (as determined under the rules of the SEC) by (1) each of our directors, (2) each of our executive officers, (3) all directors and executive officers as a group and (4) each person known by us to be the beneficial owner of more than five percent (5%) of our common stock.
Except as otherwise indicated, the address for each person is to the care of DARA BioSciences, Inc., 8601 Six Forks Road, Suite 160, Raleigh, North Carolina 27609.
| Amount and Nature of Beneficial Ownership | ||||||||||
| Name of Beneficial Owner |
Common Stock |
Shares Subject to Options(1) |
Total | Percentage of Class |
||||||
| Directors |
||||||||||
| Haywood D. Cochrane, Jr. |
49,167 | — | 49,167 | * | ||||||
| David J. Drutz |
49,167 | — | 49,167 | * | ||||||
| Gail F. Lieberman |
3,333 | 12,500 | (2) | 15,833 | * | |||||
| Executive Officers |
||||||||||
| Richard A. Franco, Sr. |
1,547,820 | 450,000 | 1,997,820 | 4.4 | % | |||||
| Ann A. Rosar |
25,000 | 51,570 | 76,570 | * | ||||||
| John Didsbury |
— | — | — | * | ||||||
| Directors and Executive Officers as a group (6 persons) |
1,674,487 | 514,070 | 2,188,557 | 4.8 | % | |||||
| * | Less than one percent. |
| (1) | Represents shares subject to options which are exercisable within 60 days. |
| (2) | Represents shares held for the benefit of Rudder Capital, LLC. |
Equity Compensation Plan Information
The following table summarizes the number of outstanding options granted to employees, directors and consultants, as well as the number of securities remaining available for future issuance our equity compensation plans as of December 31, 2009.
60
Table of Contents
| Plan Category |
Number of securities to be issued upon exercise of outstanding options, warrants and rights |
Weighted average exercise price of outstanding option warrants and rights |
Number of securities remaining available for future issuance under equity compensation plans (excluding securities reflected in the first column) | ||||
| Equity compensation plans approved by security holders |
1,431,550 | $ | 1.15 | 2,688,806 | |||
| Equity compensation plans not approved by security holders |
— | — | — | ||||
| Total |
1,431,550 | $ | 1.15 | 2,688,806 | |||
Item 13. Certain Relationships and Related Transactions and Director Independence.
During the 2009 fiscal year, the following individuals served as members of our board of directors: Geert Cauwenbergh, Haywood D. Cochrane, David Drutz, Richard Franco, Steve Gorlin and Gail Lieberman. Each of such directors, other than Mr. Franco and Mr. Gorlin, was “independent” as such term is defined in the listing standards of The Nasdaq Stock Market and the applicable rules of the SEC.
Item 14. Principal Accounting Fees and Services.
The following table presents fees for professional audit services rendered by Ernst & Young LLP for the audit of our consolidated financial statements for the fiscal years ended December 31, 2009 and December 31, 2008 and fees billed for other services rendered by Ernst & Young LLP during those periods.
The aggregate fees billed for professional services by Ernst & Young LLP in 2009 and 2008 for these various services were:
| 2009 | 2008 | |||||
| Audit fees (1) |
$ | 200,000 | $ | 352,985 | ||
| Audit-related fees (2) |
2,000 | 6,500 | ||||
| Tax fees (3) |
10,000 | 15,000 | ||||
| All other fees |
— | — | ||||
| Total |
$ | 212,000 | $ | 374,485 | ||
| (1) | Audit Fees consist of the aggregate fees billed for professional services rendered for the audit of the Company’s annual financial statements and reviews of the financial statements included in the Company’s Quarterly Reports on Form 10-Q and also includes fees billed for consents, comfort letters and assistance with and review of documents filed with the SEC. |
| (2) | Audit-related fees consist of assurance and related services relating to concerning financial accounting and reporting standards not classified as audit fees. |
| (3) | Tax fees principally included review of and consultation regarding the Company’s federal and state tax returns and tax planning. |
61
Table of Contents
Appointment of Registered Public Accounting Firm and Pre-Approval of Audit and Non-Audit Services
The Audit Committee pre-approves all audit and other permitted non-audit services provided by our independent auditors. Pre-approval is generally provided for up to one year, is detailed as to the particular category of services and is subject to a monetary limit. Our independent auditors and senior management periodically report to the Audit Committee the extent of services provided by the independent auditors in accordance with the pre-approval, and the fees for the services performed to date. The Audit Committee may also pre-approve particular services on a case-by-case basis.
62
Table of Contents
PART IV
Item 15. Exhibits and Financial Statement Schedules.
The following documents are included as part of this Annual Report on Form 10-K.
| (a)(1) | The Consolidated Financial Statements and related Notes filed as part of this Report are listed and indexed on Page 24. | |
| (a)(2) | Financial Statement Schedules: | |
| All schedules are omitted because they are inapplicable, not required or the information is included in the Consolidated Financial Statements or the related Notes. | ||
| (a)(3) | Exhibits: | |
| The Exhibits listed in the Exhibit Index immediately preceding the Exhibits are filed as part of this Annual Report on Form 10-K. | ||
| (b) | The Exhibits are set forth on the following exhibit index. Management contracts, compensatory plans and arrangements are identified in the exhibit index with an asterisk “*.” | |
| (c) | Not applicable. | |
63
Table of Contents
SIGNATURES
Pursuant to the requirements of Section 13 or 15(d) of the Securities Exchange Act of 1934, the registrant has duly caused this report to be signed on its behalf by the undersigned, thereunto duly authorized, on March 9, 2010.
| DARA BIOSCIENCES, INC. | ||
| By: | /s/ Richard A. Franco | |
| Richard A. Franco | ||
| President and Chief Executive Officer | ||
POWER OF ATTORNEY
We, the undersigned directors and executive officers of DARA BioSciences, Inc., hereby severally constitute and appoint Ann A. Rosar our true and lawful attorney and agent, with full power to her to sign for us, and in our names in the capacities indicated below, any and all amendments to the Annual Report on Form 10-K of DARA BioSciences, Inc. filed with the Securities and Exchange Commission, hereby ratifying and confirming our signatures as they may be signed by our said attorney to any and all amendments to said Annual Report on Form 10-K.
Pursuant to the requirements of the Securities and Exchange Act of 1934, this report has been signed below by the following persons on behalf of the registrant and in the capacities indicated on dates indicated.
| Signature |
Title |
Date | ||
| /s/ Richard A. Franco |
President and Chief Executive Officer (Principal Executive Officer) |
March 9, 2010 | ||
| Richard A. Franco | ||||
| /s/ Ann A. Rosar |
Chief Accounting Officer | March 9, 2010 | ||
| Ann A. Rosar | (Principal Financial Officer and Principal Accounting Officer) |
|||
| /s/ Haywood Cochrane |
Director | March 9, 2010 | ||
| Haywood Cochrane | ||||
| /s/ David Drutz |
Director | March 9, 2010 | ||
| David Drutz | ||||
| /s/ Gail Lieberman |
Director | March 9, 2010 | ||
| Gail Lieberman | ||||
64
Table of Contents
EXHIBIT INDEX
| Exhibit |
Description |
Incorporated by Reference to | ||
| 2.1 | Agreement and Plan of Merger, dated October 9, 2007 by and among DARA BioSciences, Inc., Point Therapeutics, Inc. and DP Acquisition Corp. | Incorporated by reference to the Company’s Report on Form 8-K filed on October 10, 2007 | ||
| 2.2 | Amendment to Agreement and Plan of Merger, dated December 14, 2007 by and among DARA BioSciences, Inc., Point Therapeutics, Inc. and DP Acquisition Corp. | Incorporated by reference to the Company’s Registration Statement on Form S-4/A filed on December 17, 2007 | ||
| 3.1 | Restated Certificate of Incorporation of DARA BioSciences, Inc. | Incorporated by reference to the Company’s Report on Form 8-K filed on February 12, 2008 | ||
| 3.2 | Amended and Restated By-Laws of DARA BioSciences, Inc. | Incorporated by reference to the Company’s Report on Form 8-K filed on February 12, 2008 | ||
| 4.1 | Specimen stock certificate for common stock | Incorporated by reference to the Company’s Report on Form 8-K filed on February 12, 2008 | ||
| 4.2 | Form of Warrant for Point Therapeutics, Inc. | Incorporated by reference to the Company’s Quarterly Report on Form 10-Q for the quarter ended March 31, 2002 | ||
| 4.3 | Form of Investor Warrant for Point Therapeutics, Inc. dated as of September 24, 2003 | Incorporated by reference to the Company’s Registration Statement on Form S-1 filed on November 18, 2003 | ||
| 4.4 | Form of Paramount Warrant for Point Therapeutics, Inc. dated as of September 24, 2003 | Incorporated by reference to the Company’s Registration Statement on Form S-1 filed on November 18, 2003 | ||
| 4.5 | Form of Investor Warrant for Point Therapeutics, Inc. dated as of March 24, 2004 | Incorporated by reference to the Company’s Report on Form 8-K filed on April 1, 2004 | ||
| 4.8 | Form of Investor Securities Purchase Agreement dated as of March 24, 2004 | Incorporated by reference to the Company’s Report on Form 8-K filed on April 1, 2004 | ||
| 4.9 | Form of Class A Common Stock Purchase Warrant | Incorporated by reference to the Company’s Report on Form 8-K filed on October 21, 2008 | ||
| 4.10 | Form of Class B Common Stock Purchase Warrant | Incorporated by reference to the Company’s Report on Form 8-K filed on October 21, 2008 | ||
| 4.11 | Form of Common Stock Purchase Warrant | Incorporated by reference to the Company’s Report on Form 8-K filed on June 16, 2009 | ||
| 4.12 | Form of Common Stock Purchase Warrant | Incorporated by reference to the Company’s Report on Form 8-K filed on September 14, 2009 | ||
65
Table of Contents
| Exhibit |
Description |
Incorporated by Reference to | ||
| 4.12 |
Form of Common Stock Purchase Warrant | Incorporated by reference to the Company’s Report on Form 8-K filed on September 18, 2009 | ||
| 4.13 |
Form of Common Stock Purchase Warrant | Incorporated by reference to the Company’s Report on Form 8-K filed on October 15, 2009 | ||
| 10.1 |
Amended and Restated License Agreement dated January 12, 1999 by and between Point Therapeutics, Inc. and Tufts University** | Incorporated by reference to the Company’s Quarterly Report on Form 10-Q for the quarter ended March 31, 2002 | ||
| 10.2 |
DARA BioSciences, Inc. Amended and Restated 2003 Employee, Director and Consultant Stock Plan * | Incorporated by reference to the Company’s Report on Form 8-K filed on February 12, 2008 | ||
| 10.3 |
DARA BioSciences, Inc. 2008 Employee, Director and Consultant Stock Plan * | Incorporated by reference to the Company’s Report on Form 8-K filed on February 12, 2008 | ||
| 10.4 |
Lease Agreement dated November 30, 2007, by and between DARA BioSciences, Inc. and The Prudential Insurance Company of America | Incorporated by reference to the Company’s Quarterly Report on Form 10-Q for the quarter ended March 31, 2008 | ||
| 10.5 |
Employment Agreement with John Didsbury, dated November 28, 2005 * | Incorporated by reference to the Company’s Quarterly Report on Form 10-Q for the quarter ended March 31, 2008 | ||
| 10.6 |
Form of Stock Option Award for 2008 Employee, Director and Consultant Stock Plan (Incentive Stock Options) * | Incorporated by reference to the Company’s Registration Statement on Form S-8 filed on April 8, 2008 | ||
| 10.7 |
Form of Stock Option Award for 2008 Employee, Director and Consultant Stock Plan (Non-Qualified Options) * | Incorporated by reference to the Company’s Registration Statement on Form S-8 filed on April 8, 2008 | ||
| 10.8 |
Form of Restricted Stock Award Agreement for 2008 Employee, Director and Consultant Stock Plan * | Incorporated by reference to the Company’s Registration Statement on Form S-8 filed on April 8, 2008 | ||
| 10.9 |
Form of Restricted Stock Unit Award Agreement for 2008 Employee, Director and Consultant Stock Plan * | Incorporated by reference to the Company’s Registration Statement on Form S-8 filed on April 8, 2008 | ||
| 10.10 |
License Agreement dated May 3, 2004, by and between The General Hospital Corporation d/b/a Massachusetts General Hospital and DARA Pharmaceuticals, Inc.** | Incorporated by reference to the Company’s Quarterly Report on Form 10-Q for the quarter ended March 31, 2008 | ||
| 10.11 |
Exclusive License Agreement effective July 1, 2004, by and between Kirin Brewery Company, Limited and DARA Therapeutics, Inc.** | Incorporated by reference to the Company’s Quarterly Report on Form 10-Q for the quarter ended March 31, 2008 | ||
| 10.12 |
Exclusive License Agreement effective December 22, 2006, by and between Nuada, LLC and DARA BioSciences, Inc.** | Incorporated by reference to the Company’s Quarterly Report on Form 10-Q for the quarter ended March 31, 2008 | ||
66
Table of Contents
| Exhibit |
Description |
Incorporated by Reference to | ||
| 10.13 |
Exclusive License Agreement dated October 8, 2007, by and between Bayer Pharmaceuticals Corporation and DARA BioSciences, Inc.** | Incorporated by reference to the Company’s Quarterly Report on Form 10-Q for the quarter ended March 31, 2008 | ||
| 10.14 |
Securities Purchase Agreement dated October 21, 2008, DARA BioSciences, Inc. and the purchasers identified therein | Incorporated by reference to the Company’s Report on Form 8-K filed on October 21, 2008 | ||
| 10.15 |
Placement Agent Agreement dated October 21, 2008, by and between DARA BioSciences, Inc. and Gilford Securities Incorporated | Incorporated by reference to the Company’s Report on Form 8-K filed on October 21, 2008 | ||
| 10.16 |
Stock Purchase and Loan Agreement dated January 30, 2009, by and between DARA BioSciences, Inc. and SurgiVision, Inc. | Incorporated by reference to the Company’s Report on Form 8-K filed on January 30, 2009 | ||
| 10.17 |
Secured Promissory Note dated January 30, 2009, by and between DARA BioSciences, Inc. and SurgiVision, Inc. | Incorporated by reference to the Company’s Report on Form 8-K filed on January 30, 2009 | ||
| 10.18 |
Form of Securities Purchase Agreement | Incorporated by reference to the Company’s Report on Form 8-K filed on June 16, 2009 | ||
| 10.19 |
Form of Securities Purchase Agreement | Incorporated by reference to the Company’s Report on Form 8-K filed on September 14, 2009 | ||
| 10.20 |
Placement Agent Agreement, dated August 21, 2009, by and between DARA BioSciences, Inc. and Moody Capital Solutions, Inc. | Incorporated by reference to the Company’s Report on Form 8-K filed on September 14, 2009 | ||
| 10.21 |
Form of Securities Purchase Agreement | Incorporated by reference to the Company’s Report on Form 8-K filed on September 18, 2009 | ||
| 10.22 |
Material Transfer Agreement, dated March 24, 2008, by and between DARA BioSciences, Inc. and America Stem Cell, Inc. | Incorporated by reference to the Company’s Report on Form 8-K filed on October 13, 2009 | ||
| 10.23 |
Addendum and First Amendment to Material Transfer Agreement, dated October 9, 2009, by and between DARA BioSciences, Inc. and America Stem Cell, Inc. | Incorporated by reference to the Company’s Report on Form 8-K filed on October 13, 2009 | ||
| 10.24 |
Form of Securities Purchase Agreement | Incorporated by reference to the Company’s Report on Form 8-K filed on October 15, 2009 | ||
| 10.25 |
Stock Purchase Agreement, dated December 31, 2009, by and between DARA Pharmaceuticals, Inc. and SurgiVision, Inc. | Filed herewith | ||
| 21 |
Subsidiaries of DARA BioSciences, Inc. | |||
| 23 |
Consent of Ernst & Young LLP | |||
| 24 |
Power of Attorney | Included on signature page | ||
| 31.1 |
Certification of Richard A. Franco, Sr., R.Ph. pursuant to Section 302 of the Sarbanes-Oxley | |||
67
Table of Contents
| Exhibit |
Description |
Incorporated by Reference to | ||
| Act of 2002, dated March 9, 2010 | ||||
| 31.2 |
Certification of Ann A. Rosar pursuant to Section 302 of the Sarbanes-Oxley Act of 2002, dated March 9, 2010 | |||
| 32 |
Certification pursuant to 18 U.S.C. Section 1350, as adopted pursuant to Section 906 of the Sarbanes-Oxley Act of 2002, dated March 9, 2010 | |||
| * | Management Contract or Compensatory Plan or Arrangement. |
| ** | Confidential Treatment requested for certain portions of this Agreement. |
68