Attached files
| file | filename |
|---|---|
| EX-31.1 - CERTIFICATION PURSUANT TO RULES 13A-14(A) AND 15D-14(A) - STRATASYS INC | exhibit_31-1.htm |
| EX-32.1 - CERTIFICATION PURSUANT TO 18 U.S.C. SECTION 1350 - STRATASYS INC | exhibit_32-1.htm |
| EX-31.2 - CERTIFICATION PURSUANT TO RULES 13A-14(A) AND 15D-14(A) - STRATASYS INC | exhibit_31-2.htm |
| EX-23.1 - CONSENT OF GRANT THORNTON LLP - STRATASYS INC | exhibit_23-1.htm |
| EX-32.2 - CERTIFICATION PURSUANT TO 18 U.S.C. SECTION 1350 - STRATASYS INC | exhibit_32-2.htm |
UNITED STATES
SECURITIES AND EXCHANGE COMMISSION
Washington, D.C. 20549
SECURITIES AND EXCHANGE COMMISSION
Washington, D.C. 20549
FORM 10-K
| (Mark One) | |
| [ü] | ANNUAL REPORT PURSUANT TO SECTION 13 OR 15(D) OF THE SECURITIES EXCHANGE ACT OF 1934 |
| For the fiscal year ended December 31, 2009 | |
| OR | |
| [ ] | TRANSITION REPORT PURSUANT TO SECTION 13 OR 15(D) OF THE SECURITIES EXCHANGE ACT OF 1934 |
| For the transition period from _______ to _______ | |
Commission file number 1-13400
STRATASYS, INC.
(Exact name of registrant as specified in its charter)
(Exact name of registrant as specified in its charter)
| Delaware | 36-3658792 |
| State or other jurisdiction of | (I.R.S. Employer |
| incorporation or organization | Identification No.) |
| 7665 Commerce Way, Eden Prairie, Minnesota | 55344 |
| (Address of Principal Executive Offices) | (Zip Code) |
| Registrant’s telephone number, including area code | (952) 937-3000 |
| Securities registered pursuant to Section 12(b) of the Act: | |
| Title of each class | Name of each exchange on which registered |
| Common stock, $.01 par value | NASDAQ Global Select Market |
Securities registered pursuant section 12(g) of
the Act:
None
None
Indicate by check mark
if the registrant is a well-known seasoned issuer, as defined in Rule 405 of the
Securities Act.
Yes [ ] No [ü]
Yes [ ] No [ü]
Indicate by check mark
if the registrant is not required to file reports pursuant to Section 13 or
Section 15(d) of the Act.
Yes [ ] No [ü]
Yes [ ] No [ü]
Indicate by check mark whether the registrant: (1) has filed all reports
required to be filed by Section 13 or 15(d) of the Securities Exchange Act of
1934 during the preceding 12 months (or for such shorter period that the
registrant was required to file such reports), and (2) has been subject to such
filing requirements for past 90 days. Yes [ü] No [ ]
Indicate by check mark whether the registrant has submitted
electronically and posted on its corporate Web site, if any, every Interactive
Data File required to be submitted and posted pursuant to Rule 405 of Regulation
S-T during the preceding 12 months (or for such shorter period than the
registrant was required to submit and post such files). Yes [ ] No
[ ]
Indicate by check mark if disclosure of delinquent filers pursuant to
Item 405 of Regulation S-K is not contained herein, and will not be contained,
to the best of registrant’s knowledge, in definitive proxy or information
statements incorporated by reference in Part III of this Form 10-K or any
amendment to this Form 10-K. [ü]
Indicate by check mark whether the registrant is a large accelerated
filer, an accelerated filer, a non-accelerated filer, or a smaller reporting
company. See the definitions of “large accelerated filer”, “accelerated filer”
and “smaller reporting company” in Rule 12b-2 of the Exchange Act. (Check
one):
| Large accelerated filer [ ] | Accelerated filer [ü] |
| Non-accelerated filer [ ] | Smaller reporting company [ ] |
| (Do not check if a smaller reporting company) |
Indicate by check mark whether the registrant is a shell company (as
defined in Rule 12b-2 of the Exchange Act). Yes [ ] No [ü]
The aggregate market value of the
registrant’s Common Stock held by non-affiliates of the registrant as of June
30, 2009, the last business day of the registrant’s most recently completed
second quarter, was approximately $206,000,000. On such date, the closing price
of the Registrant’s Common Stock, as quoted on the Nasdaq Global Select Market
was $10.91.
The registrant had 20,453,277 shares
of common stock outstanding as of March 1, 2010.
DOCUMENTS INCORPORATED BY REFERENCE
Portions of the registrant’s Definitive Proxy Statement to be filed with
the Securities and Exchange Commission with respect to the registrant’s Annual
Meeting of Stockholders scheduled to be held on May 6, 2010 are incorporated by
reference into Part III of this Annual Report.
TABLE OF CONTENTS
| Page | |||
| Part I | |||
| Item 1. | Business | 1 | |
| Item 1A. | Risk Factors | 13 | |
| Item 1B. | Unresolved Staff Comments | 17 | |
| Item 2. | Properties | 17 | |
| Item 3. | Legal Proceedings | 18 | |
| Item 4. | Reserved | 18 | |
| Part II | |||
| Item 5. | Market for Registrant’s Common Equity, Related Stockholder Matters and Issuer | ||
| Purchases of Equity Securities | 19 | ||
| Item 6. | Selected Financial Data | 21 | |
| Item 7. | Management’s Discussion and Analysis of Financial Condition and | ||
| Results of Operation | 22 | ||
| Item 7A. | Quantitative and Qualitative Disclosures About Market Risk | 40 | |
| Item 8. | Financial Statements and Supplementary Data | 40 | |
| Item 9. | Changes in and Disagreements with Accountants on Accounting and | ||
| Financial Disclosure | 40 | ||
| Item 9A. | Controls and Procedures | 40 | |
| Item 9B. | Other Information | 41 | |
| Part III | |||
| Item 10. | Directors, Executive Officers and Corporate Governance | 42 | |
| Item 11. | Executive Compensation | 42 | |
| Item 12. | Security Ownership of Certain Beneficial Owners and Management and | ||
| Related Stockholder Matters | 42 | ||
| Item 13. | Certain Relationships and Related Transactions, and Director Independence | 42 | |
| Item 14. | Principal Accountant Fees and Services | 42 | |
| Part IV | |||
| Item 15. | Exhibits and Financial Statement Schedules | 43 | |
| Signatures | |||
PART I
Item 1. Business.
General Development of Business
We are a worldwide leading manufacturer of three-dimensional (“3D”)
printers and high-performance rapid prototyping (“RP”) systems for the
office-based RP and direct digital manufacturing (“DDM”) markets. Our 3D
printers and high-performance RP systems provide 3D computer-aided design
(“CAD”) users a fast, office-friendly, and low-cost alternative for building
functional 3D parts. We develop, manufacture and sell a broad product line of 3D
printers and DDM systems (and related proprietary consumable materials) that
create physical models from CAD designs. We also offer rapid prototyping and
production part manufacturing services through our centers located in North
America, Europe and Australia.
We were incorporated in Delaware in 1989
and our executive offices are located in Eden Prairie, Minnesota. Our systems
are based on our core patented fused deposition modeling (“FDM®”) technology and on
our patented Genisys® technology, which we
purchased from IBM in 1994. We sold our first commercial product in April 1992
and in February 2002, we introduced the first 3D printer in our Dimension® product line. The
Dimension line offers modeling capabilities in durable ABS plastic using a
desktop 3D printer platform. In May 2007, we began offering high-performance
systems that were specifically designed for DDM, which is the production of end
use parts and assembly tools. Other recent significant developments in our
business are set forth below:
- In January 2010, we signed a master original equipment manufacturer agreement (the “Agreement”) with Hewlett-Packard Company (“HP”) to develop and manufacture an HP-branded 3D printer. During the initial term of the Agreement, which expires September 30, 2011, we will manufacture a line of FDM 3D printers and related accessories and consumables exclusively for HP for resale under the HP brand in France, Germany, Italy, Spain and the United Kingdom.
HP has agreed not to sell any other 3D
printers manufactured by other companies throughout the world for the term of
the Agreement. The term of the Agreement will be extended for additional
one-year periods unless terminated on advance notice by either party. During the
term of the Agreement, we have agreed not to sell comparable products covered by
the Agreement directly or indirectly in the territory covered by the Agreement.
The Agreement does not require HP to purchase any minimum quantity of products.
We have also entered into a Protective Rights
Agreement with HP in which we have agreed to notify HP if (i) the we decide to
engage in negotiations in response to an acquisition offer, (ii) we decide to
investigate a potential acquisition of our company, or (iii) we become aware of
an offer to purchase securities that would result in our acquisition. The
Protective Rights Agreement will terminate on the earlier of three months after
termination of the Agreement or our acquisition. In connection with the
Agreement and the Protective Rights Agreement, we issued a warrant to HP to
purchase 500,000 shares of common stock at an exercise price of $17.78 per
share, which vests immediately.
We expect that the first products will be
available to be shipped to HP customers in the first half of 2010. After the
initial term, or by mutual agreement, the territory in which HP will have the
exclusive right to sell the 3D printers covered by the Agreement may be expanded
to additional countries worldwide.
- In January 2010, we expanded the Dimension uPrint product line by introducing the uPrint Plus. This system offers the same small footprint as the previously introduced uPrint but offers a 33% larger build envelop. It also allows the user to print in seven additional colors and offers two resolution settings. Concurrent with the launch of the uPrint Plus, we also introduced two support-material enhancements. The first, Smart Supports, is a software feature that can reduce support material usage by 40%. The second is a new soluble support material called SR-30, which can dissolve 69% faster than the current soluble support material.
1
- In 2009, we continued
working with a Fortune 500 global manufacturing company to advance our
proprietary FDM®
technology for DDM applications and offset approximately $2.2 million of
R&D expenses with monies received from this customer. As a result of prior
collaborations with this Fortune 500 company, we introduced the Fortus 900mc
in August 2008, which has the largest build envelop in our current product
line. It is capable of building parts up to 4.5 feet measured on the diagonal,
nine times larger than parts built by the Fortus 400mc introduced in 2007. The
Fortus 900mc uses ball-screw technology, which improves part accuracy and
repeatability and can hold tighter tolerances.
- In February 2009, we announced the
rebranding of our high-performance RP and DDM products as Fortus 3D Production
Systems. Since we introduced Dimension and RedEye as individual brands several
years before, there had been some confusion about the identity of our
flag-ship product line. Informally it had been called the FDM Group or
the High-End Systems line. By branding this line as Fortus, we have aimed to
give it a distinct and powerful brand name.
- In January 2009, we introduced the
uPrint Personal 3D Printer priced at $14,900. Designed for the desktop, uPrint
requires only a 25 x 26 inch footprint and features an 8 x 6 x 6 inch build
envelope. Using our proven FDM technology, uPrint builds models with
ABSplus — a material that on average is 40 percent stronger
than our standard ABS material, making it ideally suited for testing the form,
fit and function of models and prototypes. The uPrint also features a soluble
support removal system, allowing for hands-free removal of the model support
material.
- In January 2009, we began offering
a new high-performance thermoplastic for direct digital manufacturing and
rapid prototyping called ULTEM 9085 (a trademark of SABIC Innovative Plastics
IP BV). ULTEM 9085 is a strong, lightweight, flame-retardant thermoplastic
widely used in aircraft interiors and was originally developed to help the
aerospace industry boost fuel efficiency and safety. It offers strength and
flexibility while producing 5 to 15 percent lighter interior parts than other
aerospace plastics.
- In December 2008, we announced that we will sell our Fortus 3D Production Systems through a select group of North American resellers from our established reseller channel, which had previously distributed only the Dimension 3D printer product line. This sales strategy has leveraged our success with a network of independent regional resellers that we believe is the strongest sales channel in the industry. This strategy more than tripled our sales support for high-end systems.
Description of Business
We develop, manufacture, market, and service a family of 3D printers and
3D Production Systems that enable engineers and designers to create physical
models, tooling and prototypes out of plastic and other materials directly from
a CAD workstation. Our high-performance systems are used both to create
prototype models as well as to produce parts for end-user, or DDM, applications.
Our 3D printers and high-performance systems can be used in office environments
without expensive facility modification. In many industries, the models and
prototypes required in product development are produced laboriously by
hand-sculpting or machining, a traditional process that can take days or weeks.
Our computerized modeling systems use our proprietary technology to make models
and prototypes as well as end-use parts directly from a designer’s 3D CAD in a
matter of hours. In addition to selling RP systems and 3D printers, our RedEye
paid parts service makes and sells physical models, tooling and prototypes for
RP and DDM applications based on our customers’ CAD files. We estimate that
approximately 40% of our Fortus high-performance RP systems are used for DDM
applications with some frequency.
We believe that the 3D printers and
Fortus 3D Production Systems using our FDM technology are the only systems
commercially available that can produce prototypes and parts from industry
product-grade plastic without relying on lasers. This affords our products a
number of significant advantages over other commercially available 3D rapid
prototyping technologies that rely primarily on lasers to create models. Such
benefits include:
- the ability to use the device in
an office environment due to the absence of hazardous emissions
- little or no
post-processing
- ease of use
- the need for relatively little system set up
- the availability of a variety of plastic materials
- modeling in product-grade plastics for functional testing
- no need for costly replacement lasers and laser
parts
- higher reliability
2
Our systems can also run virtually unattended, producing models while
designers perform other tasks.
The process involved in the development
of a 3D model using our systems begins with the creation of a 3D geometric
design on a CAD workstation. The design is then imported into our proprietary
software program, which mathematically slices the CAD design into horizontal
layers that are automatically downloaded into the system. A spool of thin
thermoplastic modeling material feeds into a moving FDM extrusion head, which
heats the material to a semi-liquid state. This semi-liquid material is
extruded, deposited and bonded, one ultra-thin layer at a time, on a base (the
“X-Y Stage”) in a thermally-controlled modeling chamber. As the material is
directed into place by the computer-controlled head, layer upon layer, the
material bonds and solidifies, creating a precise and strong model.
Based upon data and estimates furnished
in the 2009 Wohlers Report, through 2008 we shipped approximately 36% of all RP
systems since the industry’s inception in 1987. The 2009 Wohlers Report also
states that we shipped 43% of all RP systems globally in 2008 and 50% of all 3D
printers shipped globally in 2008.
Applications for High-Performance Systems and
3D Printers
Both high-performance systems and 3D
printers allow for the physical modeling of a design using a special class of
machine technology. These systems take data created from CAD data, CT and MRI
scan data or 3D digitized data to quickly produce models, using an additive
approach. Traditionally, RP and 3D printing have been used by organizations to
accelerate product development. Many companies use RP and 3D printing models to
test form, fit and function to help improve the time to market.
Frequently, users report rapid pay-back
times by using RP and 3D printing, as they accelerate their product development
cycle and reduce post-design flaws through more extensive design verification
and testing.
We also have opportunities for DDM. DDM
involves the use of our systems for the direct manufacture of parts that are
subsequently incorporated into the user’s end product or process. DDM is
particularly attractive in applications that require short-run or low-volume
parts that require rapid turn-around, and for which tooling would not be
appropriate due to small volumes. Our Fortus 360mc, 400mc, and 900mc systems are
well suited for these types of applications.
An emerging portion of the DDM market
segment is the production of manufacturing tools that aid in the customer’s
production and assembly process. We believe this fabrication and assembly tool
market is substantially larger than the $1.2 billion additive fabrication market
that we currently serve. In addition, we have seen a growing number of
applications for end-use parts.
During the past five years, the largest
growth segment of the additive fabrication market has been 3D printers. 3D
printers are low-cost RP systems (typically under $40,000) that reside in the
design/engineering office environment, allowing product development
organizations quick access to a modeling system.
We have shipped over 13,000 systems since
our inception. A wide variety of design and manufacturing organizations use our
systems. Current markets and applications include:
|
|
3
Additional future applications
include:
|
|
Among potential medical applications,
rapid prototyping is being used to produce accurate models of internal organs,
bones and skulls for pre-operative evaluations or modeling of prostheses. In
such uses, our RP systems serve as a peripheral device for CT and MRI devices.
Products
3D Printers and High-Performance
Systems
We have been developing and improving our
line of products since our inception in 1989. Since our first commercial product
was introduced in 1992, we have enhanced and expanded our product line. We have
improved both the speed and the accuracy of our Fortus systems, expanded their
build envelopes, introduced a number of new modeling materials and developed and
introduced a low-cost 3D printer. We have also enhanced and upgraded the
software that our systems use to read CAD files and build parts.
Each of our products is based upon our
patented FDM process, and our 3D printers also employ technology acquired from
IBM. Our products are sold as integrated systems, consisting of an RP machine,
the software to convert the CAD designs into a machine compatible format and
modeling and support materials. Each of our products is compatible with an
office environment and does not require an operator to be present while it is
running.
Our family of 3D printers and
high-performance systems affords a customer’s product development team,
including engineers, designers and managers, the ability to create prototypes
through all stages of the development cycle. Our products meet the needs of a
very demanding and diverse industrial base by offering a wide range of
capability and price from which to choose. The domestic list prices of our
systems range from $14,900 for the uPrint Personal 3D Printer to $400,000 for
our high performance Fortus 900mc.
The Dimension line of 3D printers allows users
to create parts in ABSplus plastic. ABS usually offers
the part strength required for true form, fit and functional testing. Dimension
3D printers operate in an office environment and offer speed, ease of use and
networking capabilities at a competitive price. They feature our Catalyst
EX® software,
which offers a single push-button operation by automating all of the required
build procedures. We introduced the uPrint Personal 3D Printer in January 2009
at a list price of $14,900 and expanded this line by releasing the uPrint Plus a
year later with a larger build envelop than the uPrint, more features and a
slightly higher price. Using Dimension’s proven FDM technology, the uPrint and
uPrint Plus build models with Stratasys ABSplus — a material that is on average 40 percent stronger
than our standard ABS material, making it ideally suited for testing the form,
fit and function of models and prototypes. The Dimension 1200es SST, introduced
in January 2008 and priced at $32,900, offers the ability to build larger parts
and creates parts from our ABSplus material as well.
The Fortus line of high-performance FDM
systems incorporates our WaterWorks soluble support system and InSight Software.
The patented WaterWorks process allows for the easy removal of supports from a
completed prototype by simple immersion into a water-based solution. Because our
support materials dissolve in a solution, most post-processing steps required in
our competitors’ systems are not required with our systems. The InSight software
used by our Fortus systems offers the customer an array of features that is more
flexible than Catalyst EX, ranging from a fully automated build process to one
that allows the user to customize each step. With the combination of ABS,
WaterWorks and InSight software, the Fortus line offers the customer “hands
free” operation of the entire prototype building process.
The Fortus 400mc was introduced in July
2007 and represents an increase in repeatability, part accuracy and material
strength over the Maxum, Vantage and Titan systems, which have been
discontinued. In addition, in January 2008, we introduced the Fortus 360mc,
which offers similar part quality to the Fortus 400mc, but fewer material
choices and slower build speeds. Both of these systems can be configured to meet
specific customer needs. Prices for these systems range from $75,000 to $225,000
depending on the configuration and needs of the customer.
4
In December 2007, we introduced the Fortus 900mc, which represents our
largest system ever. It is capable of building parts up to 4.5 feet measured on
the diagonal, nine times larger than parts built by the Fortus 400mc. The Fortus
900mc uses ball-screw technology, which improves part accuracy, positional
repeatability and tolerances. This new product is the direct result of a $3.6
million order from a Fortune 500 global manufacturing company entered into in
September 2005 to advance our proprietary FDM® technology for direct
digital manufacturing applications.
We periodically discontinue
manufacturing older products. We discontinued the Prodigy Plus system in 2007,
the Vantage and Titan systems during 2008, and the Fortus 200mc and Maxum
systems during 2009. Although we have discontinued the manufacture of these
systems, we continue to provide service support in the field.
Part Build Material
We believe that FDM technology
allows the use of a greater variety of production grade thermoplastic building
materials than other RP technologies. We continue to develop filament modeling
materials that meet our customers’ needs for increased speed, strength,
accuracy, surface resolution, chemical and heat resistance, and color. These
materials are processed into our patented filament form, which is then fed into
the FDM systems. Our spool-based system has proven to be a significant advantage
for our products over ultraviolet (“UV”) polymer systems or powder based
systems, because our system allows the user to quickly change material by simply
mounting the spool and feeding the desired filament into the FDM devices. Spools
weigh from one pound to ten pounds, and the creation of a model may require from
0.1 pound to more than one pound of filament. The spool-based system also
compares favorably with stereo lithography (“SLA”) UV polymer systems, because
the spool-based system allows the customer to use it in an office environment
and to purchase a single spool, as compared to an entire vat of SLA UV polymer,
thereby reducing the customer’s up-front costs.
Currently, we have nine modeling
materials commercially available for use with our FDM technology:
- ABS is an engineering
thermoplastic material (named for its three initial monomers, acrylonitrile,
butadiene, and styrene), which offers a balance of strength, toughness and
thermal resistance and is used commercially to make products such as cell
phones, computer cases and toys.
- Polycarbonate (“PC”) is an
engineering thermoplastic material, which is used commercially for demanding
applications in a number of industries. PC offers superior impact strength
coupled with resistance to heat and corrosive agents.
- PC-ABS is a blend of PC and ABS
plastic. The blend combines the strength of PC with the flexibility of
ABS.
- Polyphenylsufone (“PPSF”) is a
specialty thermoplastic material that offers excellent mechanical properties
while being subjected to demanding thermal and chemical environments. PPSF is
used to make prototype parts for numerous industries, including automotive,
fluid and chemical handling, aerospace, and medical sterilization.
- PC-ISO, a derivative of PC that is
translucent and can be sterilized for medical device or surgical jig and
fixture production or prototyping.
- ABS-M30i is a biocompatible
material ideal for direct digital manufacturing applications in the medical,
food and pharmaceutical equipment industries with ISO 10993 certification or
ethylene oxide sterilization requirements.
- ABSplus and M-30, like ABS, are thermoplastic materials
with all the associated benefits. ABSplus
has the added benefit of creating additional part strength. Parts built with
these materials are on average 40% stronger than our standard ABS
parts.
- ABSi is a higher grade translucent
ABS, which features greater impact strength than our standard ABS. It can also
be used in medical applications, including gamma-ray sterilization.
- ULTEM 9085™ (our newest material) is a strong, light weight, flame and chemically resistant thermoplastic material that is frequently used in aerospace, automotive and military applications.
5
In addition to the modeling materials, we offer a proprietary
water-soluble material, WaterWorks, used for support during the build process,
which is later dissolved from the finished part. Other proprietary release
materials are used for support and are removed from the final model by hand.
Each material has specific
characteristics that make it appropriate for various applications. The ability
to use different materials allows the user to match the material to the end use
application of the prototype, whether it is a pattern for tooling, a concept
model, a functional prototype, a DDM manufacturing tool, or a DDM end use part.
ABS and ABSplus are
also offered in numerous colors, including white, black, red, blue, yellow,
olive, nectarine and dark grey. We also offer a service to create custom colors
for unique customer needs.
The modeling and support filament used in
the RP and DDM systems and 3D printers that we sell are consumable products that
generate recurring revenue.
Operating Software
Our high-performance systems and 3D
printers use one of two software products that convert the three-dimensional CAD
databases into the appropriate code to operate our FDM system. The software
products also provide a wide range of features, including automatic support
generation, part scaling, positioning and nesting, as well as geometric editing
capabilities. The software is not sold as a stand-alone product.
Catalyst EX, our entry-level software
product, enables users to build prototype parts at the push of a button. It was
introduced in 2000 and is used on Dimension 1200es SST and BST, Dimension Elite,
Dimension 768 BST and SST, and uPrint.
Our InSight preprocessing software is
used on the remainder of our Fortus products – Fortus 360mc, 400mc, and 900mc.
It increases build speed and improves the design engineer’s control and
efficiency over the entire build process. It has a broad set of features that
facilitate the demanding applications ranging from a single “push button” for
automatic preprocessing to individual editing and manipulation tools for each
process step.
We continuously improve both software
products to meet the demands of our sophisticated customers. Our latest software
enhancement was the release of Smart Supports, a software feature that
reconfigures the way support material is structured in the build process in
order to reduce support material usage by as much as 40%. Throughput
enhancements, advanced build algorithms and features such as Smart Supports are
intended to keep pace with complex industrial geometric designs while saving
valuable operator time.
Services
Maintenance, Leasing, Training and
Contract Engineering
We also provide a number of services in
relation to our rapid prototyping business. We provide maintenance to our
customers under our standard warranties and separate maintenance contracts. In
the United States, we lease or rent Fortus 3D Production Systems and Dimension
3D printers under operating agreements to customers that do not desire to
purchase them or enter into sales-type leases. We offer training to our
customers, particularly on our high-performance systems. Finally, from time to
time we offer contract engineering services to third parties in connection with
the strategic development of our systems and services incorporating our
proprietary technology.
RedEye Paid Parts
Our RedEye paid parts service offers
customers the ability to purchase prototypes and end-use parts that we make for
them from CAD files that they provide to us. We have a facility near our
corporate headquarters dedicated to RedEye operations. Our RedEye on Demand
website service, www.redeyeondemand.com, enables our customers to obtain quotes
and order parts around the clock, seven days a week. RedEye on Demand offers
unmatched expertise and production capacity using the latest in proven rapid
prototyping and direct digital manufacturing technologies and
processes.
6
Marketing, Distribution and Customers
Marketing and Customers
The focus of our marketing begins with the identification of customer
needs. We feature a broad array of products that allow us to meet the precise
needs of engineers, designers, educators, marketers and manufacturers. Our
products range from uPrint, priced at $14,900, to a high productivity Fortus
900mc, priced up to $400,000. We currently offer eight systems between these
price points meeting a variety of material, size and performance
criteria.
We have sold systems to the following
representative customers:
|
|
|
No
customer accounted for more than 10% of sales in 2009, 2008, or
2007.
We use a variety of tactical marketing methods to reach potential
customers:
|
|
In addition, we have developed domestic and international on-site
demonstration capabilities.
Sales Field
Reorganization
Beginning in 2009, we converted the existing Fortus and 3D printing sales
organizations to a new structure that is divided into two groups based on
geographical areas. The Americas sales organization covers North, Central and
South America and the International sales organization covers all other areas of
the world. In conjunction with this reorganization, we replaced our Fortus
direct sales channel in the United States with a select group of existing
resellers as further described below. This reorganization serves to better align
our sales and marketing resources with our diverse customer base and,
specifically in the United States, more than triples our sales support for
high-end systems.
7
Americas Sales
Organization
The Americas sales organization provides sales support to a network of
over 100 reseller locations in North, Central and South America. On January 1,
2009, we began selling our Fortus 3D Production Systems through a select group
of North American resellers that had previously distributed only the Dimension
3D printer product line. This sales strategy leverages our success with a
network of independent regional resellers that we believe is the strongest sales
channel in the industry and is similar to the structure that we have used
outside of the Americas for several years. By replacing our Fortus 3D Production
Systems direct sales channel with our existing reseller channel, we have
converted a significant portion of our fixed selling costs to a variable cost
structure.
International Sales Organization
The International sales organization
uses a worldwide network of over 100 resellers to market, sell, and service our
3D printers and Fortus 3D Production Systems. Our International sales
organization supports all major regions of the world outside of the Americas
including Europe, the Middle East, Korea, Taiwan and China. We also operate
international sales and service centers located in Frankfurt, Germany; Bologna,
Italy; Bangalore, India; Hong Kong, Japan; and Shanghai, China.
Reseller Network
We use an extensive world-wide
reseller network to market, sell and service our 3D printers, Fortus 3D
Production Systems, consumable materials, maintenance service contracts and
service parts. Almost all of the reseller outlets have 3D Printers available for
tradeshows, product demonstrations, and other promotional activities. Many of
them also enjoy a long-term presence in their respective territories making this
distribution model highly effective relative to a direct sales model. In
addition to our 3D Printers and 3D production systems, most resellers also sell
and service a third-party 3D solid CAD software package.
The uPrint maintenance and servicing
is performed by a third-party service organization or by selected resellers in
certain international locations. In 2009, we added a new type of reseller that
will resell only the uPrint 3D printer, allowing us to broaden our overall
distribution of that product.
In January 2010, we signed a master
original equipment manufacturer agreement (the “Agreement”) with Hewlett-Packard
(“HP”) to develop and manufacture an HP-branded 3D printer. During the initial
term of the Agreement, which expires September 30, 2011, we will manufacture a
line of FDM (“Fused Deposition Modeling”) 3D printers and related accessories
and consumables exclusively for HP for resale under the HP brand in France,
Germany, Italy, Spain and the United Kingdom.
HP has agreed not to sell 3D
printers manufactured themselves or any other 3D printers manufactured by other
companies throughout the world for the term of the Agreement. The term of the
Agreement will be extended for additional one-year periods unless terminated on
advance notice by either party. During the term of the Agreement, we have agreed
not to sell comparable products covered by the Agreement directly or indirectly
in the territory covered by the Agreement. The Agreement does not require HP to
purchase any minimum quantity of products.
We expect that the first products
will be available to be shipped to HP customers in the first half of 2010. After
the initial term, or by mutual agreement, the territory in which HP will have
the exclusive right to sell the 3D printers covered by the Agreement may be
expanded to additional countries worldwide. Ultimately, our mutual intention is
for HP to sell our 3D printers globally.
RedEye Paid Parts
In 2006, we established a dedicated
internal sales channel to offer our RedEye paid parts services through our
RedEye on Demand instant Internet quoting system. This team is responsible for
growing our paid parts service and nurturing customers who have RP and DDM part
needs. Their objective is to insure the customer has a favorable experience when
solving their internal part requirements. Besides a commitment to customer
satisfaction, an essential objective of this operation is to increase the number
of quality FDM parts in the marketplace, which, in turn, we believe will also
support the expansion of our system sales. In 2007, we launched Redeye RPM,
later rebranded as Redeye on Demand, in both Europe and Australia. In addition,
in February 2008, we launched RedeyeArc.com specifically aimed at serving the
architectural market.
In December 2008, we announced that AutoCAD users can order digitally
manufactured prototypes and production parts quickly and easily through an
on-demand 3D printing capability supported by our RedEye paid parts service.
AutoCAD 2009 subscription customers had access to this functionality via a bonus
pack. Included in the bonus pack was on-line ordering capability, giving
designers and engineers the ability to get instant quotes and place orders from
our RedEye paid parts service. AutoCAD 2010 subscription customers continue to
have access to this functionality.
8
Customer Support
Our Customer Support department provides on-site system installation and
maintenance services and remote technical support to users of our products. We
offer services on a time and material basis as well as through a number of
post-warranty maintenance contracts with varying levels of support and pricing.
Our help desk provides technical support via phone, fax, and e-mail to
international customers, resellers, and to our field service personnel. We
supply a toll-free telephone number that our domestic customers can utilize to
request technical assistance, schedule service visits, order parts and supplies,
or directly contact a manager within the Customer Support department.
For our high performance systems, we
employ a field service organization that performs system installation, basic
operation training and maintenance training, and a full range of maintenance and
repair services at customer sites. Field representatives have been trained and
certified to service all of our products. Representatives are strategically
located in regional offices across North America and are equipped with cellular
phones and laptop computers. They have secure remote access to a customer
service database containing service history and technical documentation to aid
in troubleshooting and repairing systems.
Customer Support is represented on all
cross-functional product development teams within Stratasys to ensure that
products are designed for serviceability and to provide our internal design and
engineering departments with feedback on field issues. Failure analysis,
corrective action, and continuation engineering efforts are driven by data
collected in the field. Ongoing customer support initiatives include development
of advanced diagnostic and troubleshooting techniques and comprehensive
preventative maintenance programs, an expanded training and certification
program for technical personnel, and improved communication between the field
and the factory.
The uPrint maintenance and servicing will
be performed by a third-party service organization or by selected resellers in
certain international locations.
Warranty and Service
We offer a one-year warranty on Fortus 3D
Production Systems and uPrint systems worldwide. In addition we offer a one-year
warranty on all systems sold internationally and systems sold into the education
market domestically. All other domestically sold systems have a 90-day warranty.
We also offer annual and multiple-year service and maintenance contracts for our
systems. Annual service contracts for our systems are priced from approximately
$2,000 to $49,000 per year domestically.
Manufacturing
Our manufacturing process consists of
assembling systems using purchased components from our proprietary designs and
producing consumable filament to be used by our systems. We currently operate on
a build-to-forecast basis and obtain all parts used in the manufacturing process
either from distributors of standard electrical or mechanical parts or from
custom fabricators of our proprietary designs. Our suppliers are measured by
on-time performance and quality.
We purchase major component parts for our
Fortus 3D Production Systems and 3D printing systems from various outside
suppliers, subcontractors and other sources and assemble them in our Minnesota
facilities. Our production floor has been organized using demand-flow techniques
(“DFT”) in order to maximize efficiency and quality. Using DFT, our production
lines are balanced and as capacity constraints arise, we can avoid the
requirements of reconfiguring our production floor.
Computer-based Material Requirements
Planning (“MRP”) is used for reordering to ensure on-time delivery of forecasted
parts. All operators and assemblers are certified and trained on up-to-date
assembly and test procedures including Assembly Requirement Documents, which
originate in engineering. The assembly process includes semiautomated functional
tests of key subassemblies. Key functional characteristics are verified through
these tests and the results are stored in a statistical database. At the
completion of assembly, we perform a complete power up and final quality tests
to ensure the quality of our products before shipment to customers. The complete
final quality tests must be run error free before the system can be cleared for
shipment. We maintain a history log on all products that shows revision level
configuration and a complete history during the manufacturing and test process.
All issues on the system during the manufacturing process are logged, tracked
and used to make continuous process improvements of our production processes.
Other manufacturing strengths that are incorporated into our new designs are the
commonality of designs among our different products as well as the incorporation
of Six Sigma concepts. Our filament production utilizes Factory Physics® techniques to manage critical buffers of time,
capacity and inventory to ensure product availability. We also utilize the “5S”
method (Sort, Set-in-order, Shine, Standardize and Sustain) as part of our lean
manufacturing initiatives to improve organization and efficiency. Additionally,
we recycle many used filament cartridge parts.
9
We maintain an inventory of parts to facilitate the timely assembly of
products required by the production plan. While most components are available
from multiple suppliers, certain components used in our systems and consumables
are only available from single or limited sources. We consider these
single-source suppliers to be very reliable, but the loss of one of these
suppliers could result in the delay of the manufacture and delivery of those
materials and compounds. This type of delay could require us to find and
re-qualify the product supplied by one or more new vendors. Although we consider
our relationships with our suppliers to be good, we continue to develop risk
management plans for these critical suppliers.
Research, Development and Engineering
We believe that ongoing research,
development and engineering efforts are essential to our continued success.
Accordingly, our engineering development efforts will continue to focus on
improvements to the FDM technology and development of new modeling processes,
materials, software, user applications and products. We have devoted significant
time and resources to the development of a universally compatible and
user-friendly software system. We are committed to designing products using the
principles of Six Sigma. We continue to standardize our product platforms,
leveraging each new design so that it will result in multiple product offerings
that are developed faster and at reduced expense. The Fortus 360mc, 400mc,
900mc, Dimension, and uPrint products as well as the Catalyst and InSight
software products are examples of this successful strategic initiative. For the
years ended December 31, 2009, 2008 and 2007, our research, development and
engineering expenses were approximately $7.7 million, $9.0 million and $7.5
million, respectively.
Our filament development and production
operation is located at our facilities in Eden Prairie, MN. We regard the
filament formulation and manufacturing process as a trade secret and hold patent
claims on filament usage in our products. We purchase raw
material plastics for our consumable filament production from various large
plastic suppliers.
Intellectual Property
We consider our proprietary technology to
be material to the development, manufacture, and sale of our products and
services and seek to protect our technology through a combination of patents and
confidentiality agreements with our employees and others. All patents and patent
applications for rapid prototyping processes and apparatuses associated with the
Stratasys FDM processes have been assigned to us by their inventors. As part of
our purchase of rapid prototyping technology assets from IBM, we were also
assigned the rights and title to three patents developed by IBM, which are used
in several of our current product lines. We recorded these patents domestically
and are in the process of recording them in certain foreign countries. The terms
of two of these patents extend until April 12, 2011, and May 17, 2011, while the
third patent has expired. The United States patents covering our proprietary FDM
technology expire at various times between 2010 and 2030. In total, we currently
own over 280 U.S. and international patents and patent
applications.
Our registered trademarks include:
|
|
|
10
Other trademarks include:
|
|
|
Each of the registered trademarks has a duration of 10 years and may be
renewed every 10 years while it is in use. Trademark applications have also been
filed in Japan and the European Community.
We have also registered
a number of Internet domain names, including the following:
|
|
|
Backlog
Our total backlog of system orders at
December 31, 2009 was approximately $6.3 million, as compared with approximately
$2.6 million at December 31, 2008. We estimate that most of our backlog will
ship in the first half of 2010.
Seasonality
Historically, our results of operations
have been subject to seasonal factors. Stronger demand for our products has
occurred in our fourth quarter primarily due to our customers’ capital
expenditure budget cycles and our sales compensation incentive programs. Our
first and third quarters have historically been our weakest quarters. Although
the first quarter has been muted in recent years by the successful introduction
of new products, it is typically a slow quarter for capital expenditures in
general. The third quarter is typically when we see our largest volume of
educational related sales, which normally qualify for special discounts as part
of our long-term market penetration strategy.
Competition
We compete in a marketplace that is still
dominated by conventional methods of model-making and prototype development.
Machinists and engineers working from blueprints or CAD files and using
machining or manual methods generally perform the prototype development and
fabrication. We believe that there is currently no other commercial producer of
3D modeling devices that uses a single-step, non-toxic technology similar to our
FDM technology. Most of the 3D printing and other RP systems manufactured by our
competitors involve additional post-processing steps, such as curing the part
after construction of the model or prototype. Our FDM technology does not rely
on the laser or light technology used by other commercial manufacturers in the
RP industry.
11
Our competitors employ a number of
different technologies in their RP devices. 3D Systems and CMET use stereo
lithography (“SLA”) in their products. 3D Systems and EOS GmbH produce machines
that use selective laser sintering (“SLS”) to harden powdered material. Z Corp.
uses inkjet technology to bond powdered materials such as starch. Solidscape, 3D
Systems and Objet Geometries have developed prototyping systems that use inkjet
technology to deposit resin material layer by layer. A smoothing or milling
process is often required between each deposited layer to maintain accuracy in
these processes, which reduces material yields. Envisiontec utilizes a
photopolymer mask and a light process to build models and Solido uses a plastic
sheet lamination technique. We believe that our FDM technology has important
advantages over our competitors’ products. These advantages include:
- the ability to be used in an
office environment
- the availability of multiple production-grade modeling
materials
- a one-step modeling process
- low acquisition price
- ease of use
- hands free support removal
- higher reliability
Based on data and estimates presented in
the 2009 Wohlers Report, in 2008 we shipped more units globally than any other
company in the RP industry, and we were the second largest in terms of revenue.
Wohlers reports that we shipped 43% of total units shipped in the industry in
2008. We believe that this trend continued in 2009 as well.
Employees
As of March 1, 2010, we had 361 full-time
employees and 42 contractors or temporary employees. While we have separate
internal departments, such as manufacturing, marketing, engineering and sales,
many employees perform overlapping functions within the organization. No
employee is represented by a union, and we have not experienced any work
stoppages. We believe our employee relations are good.
Governmental Regulation
We are subject to various local, state
and federal laws, regulations and agencies that affect businesses generally.
These include:
- regulations promulgated by federal
and state environmental and health agencies
- the federal Occupational Safety and Health
Administration
- laws pertaining to the hiring, treatment, safety and
discharge of employees
- export control regulations for U.S. made
products
- CE regulations for the European market
Environmental Regulation
In the European marketplace, electrical
and electronic equipment is required to comply with the Directive on Waste
Electrical and Electronic Equipment (“WEEE”) and the Directive on Restriction of
Use of Certain Hazardous Substances (“RoHS”). WEEE aims to prevent waste by
encouraging reuse and recycling and RoHS restricts the use of six hazardous
substances in electrical and electronic products. Our products and certain
components of such products “put on the market” in the EU (whether or not
manufactured in the EU) are potentially subject to WEEE and RoHS. We are
actively monitoring the development of such directives and believe we are well
positioned to comply with such directives in the required time
frames.
Available Information
We file annual, quarterly and current
reports, proxy statements and other information with the Securities and Exchange
Commission. You may read and copy any document we file at the SEC’s public
reference room at 100 F Street, N.E., Washington, D.C. 20549. Please call the
SEC at 1-800-SEC-0330 for information on the public reference room. The SEC
maintains a website that contains annual, quarterly and current reports, proxy
statements and other information that issuers (including Stratasys) file
electronically with the SEC. The SEC’s website is www.sec.gov.
12
Our website is www.stratasys.com.
We make available free of charge through our Internet site, via a link to the
SEC’s website at www.sec.gov, our annual reports on Form 10-K; quarterly
reports on Form 10-Q; current reports on Form 8-K; Forms 3, 4 and 5 filed on
behalf of our directors and executive officers; and any amendments to those
reports filed or furnished pursuant to the Securities Exchange Act of 1934 as
soon as reasonably practicable after such material is electronically filed with,
or furnished to, the SEC.
We make available on www.stratasys.com
our most recent annual report on Form 10-K, our quarterly reports on Form 10-Q
for the current fiscal year and our most recent proxy statement, although in
some cases these documents are not available on our site as soon as they are
available on the SEC’s site. You will need to have on your computer the Adobe
Acrobat Reader software to view these documents, which are in PDF format. If you
do not have Adobe Acrobat, a link to Adobe’s Internet site, from which you can
download the software, is provided. The information on our website is not
incorporated by reference into this report.
Financial Information About Operations In the
United States and Other Countries
The information required by this item is
incorporated by reference to our Financial Statements included elsewhere in this
report. (See Part IV, Item 15, Note 19.)
Item 1A. Risk Factors.
Many of the factors that affect our
business and operations involve risk and uncertainty. The following describes
the principal risks affecting us and our business. Additional risks and
uncertainties, not presently known to us or currently deemed material, could
negatively impact our results of operations or financial condition in the
future.
We may not be able to introduce new
high-performance systems and 3D printing systems and materials acceptable to the
market or to improve the technology and software used in our current
systems.
Our ability to compete in the high-performance and 3D printing market
depends, in large part, on our success in enhancing our existing product lines
and in developing new products. Even if we successfully enhance existing systems
or create new systems, it is likely that new systems and technologies that we
develop will eventually supplant our existing systems or our competitors will
create systems that will replace ours. The RP industry is subject to rapid and
substantial innovation and technological change. We may be unsuccessful at
enhancing existing systems or developing new systems or materials on a timely
basis, and any of our products may be rendered obsolete or uneconomical by our
or others’ technological advances.
If the 3D printing market does not continue to
accept our systems, or if our Fortus high-performance systems do not meet the
needs for DDM applications, our revenues may stagnate or
decline.
We derive a substantial portion of our
sales from the sale of 3D printers and Fortus 3D Production Systems. If the
market for 3D printers or 3D production systems declines or if competitors
introduce products that compete successfully against ours, we may not be able to
sustain the sales of those products. If that happens, our revenues may not
increase and could decline.
If we are unable to maintain revenues and
gross margins from sales of our existing products, our profitability will be
adversely affected.
Our current strategy is to attempt to
manage the prices of our high-performance systems and 3D printers to expand the
market and increase sales. In conjunction with that strategy, we are constantly
seeking to reduce our direct manufacturing costs as well. Our engineering and
selling, general and administrative expenses, however, generally do not vary
substantially in relation to our sales. Accordingly, if our strategy is
successful and we increase our revenues while maintaining our gross margins, our
operating profits generally will increase faster as a percentage of revenues
than the percentage increase in revenues. Conversely, if our revenues or gross
margins decline, our operating profits generally will decline faster than the
decline in revenues or gross margins. Therefore, declines in our revenues may
lead to disproportionate reductions in our operating profits.
Hewlett-Packard may not expand distribution
under our OEM Agreement beyond its initial territory of five European countries,
and the OEM Agreement may not continue beyond its initial term ending on
September 30, 2011.
Our Agreement with HP has an initial term
that ends on September 30, 2011, and has an initial territory of five European
countries. There can be no assurance that HP will expand the
territory in which they sell our 3D printers and other
products. Furthermore, even though the Agreement will automatically
be renewed for one-year terms unless either party terminates it on advance
written notice, there can be no assurance that the Agreement will continue
beyond its initial term or any renewal term. If HP does not expand
the territory or the Agreement is terminated, we will not achieve the
anticipated benefits of entering into the Agreement, which include substantial
additional revenue and profits as well as validation of our products in the
market place.
Since we will be selling our 3D printers and
related products to HP on an OEM basis, our margins on those products will be
lower than those on the products that we presently sell, which may reduce our
overall profitability.
HP will be selling our 3D printers and
related products through its own reseller network. Accordingly, the
prices we charge to HP for those products will be less than the prices we
presently charge to our own reseller network. As a result, our
margins will be smaller on our sales to HP. We intend to compensate
for these smaller margins by expanding the market for our 3D printers, thereby
substantially increasing the number of 3D printers sold and our overall revenues
and profits. However, there can be no assurance that we will be able to increase
our revenue sufficiently to maintain or increase our profitability.
13
If our present single or limited source
suppliers become inadequate, our results of operations and financial condition
may be adversely affected.
We maintain an inventory of most of our necessary supplies, which
facilitates the assembly of products required for production. While most
components are available from multiple suppliers, certain components used in our
systems and consumables are only available from single or limited sources.
Should our present single or limited source suppliers become inadequate, we
would be required to spend a significant amount of time and money researching
alternate sources. We consider these suppliers to be very reliable. Although we
believe we maintain adequate inventories of vendor-specific materials, the loss
of a supplier of such vendor-specific materials or compounds could result in the
delay in the manufacture and delivery of those materials and compounds. The
delay could require us to find an alternate source, which would require us to
re-qualify the product supplied by one or more new vendors. The loss of a single
or limited source supplier could adversely affect our results of operations and
financial condition.
If other manufacturers were to successfully
develop and market consumables for use in our systems, our revenues and profits
could be adversely affected.
We presently sell substantially all of
the consumables that our customers use in our systems. However, even though we
attempt to protect against replication of our consumables through patents and
trade secrets and we provide that our warranties are valid only if customers use
consumables that we certify, it is possible that other manufacturers could
develop consumables that could be used successfully in our systems. If our
customers were to purchase consumables from our competitors, we would lose some
of our sales and could be forced to reduce prices, which would impair our
overall revenue and profitability.
If we fail to grow our RedEye paid parts
service as anticipated, our net sales and profitability will be adversely
affected.
We are attempting to grow our RedEye paid
parts service substantially. To this end, we have made significant
infrastructure, technological and sales and marketing investments. These
investments include a dedicated facility, increased staffing, use of a
substantial number of our Fortus 3D Production Systems exclusively for Paid
Parts, and the development and launch of our RedEye on Demand service, which
enables customers to obtain quotes for and order parts over the Internet. If our
RedEye paid parts service does not generate the level of sales required to
support our investment, our net sales and profitability will be adversely
affected.
A loss of a significant number of our
resellers or channel managers would impair our ability to sell our products and
services and could result in a reduction of sales and net
income.
We sell all of our products through
resellers. We rely heavily on these resellers to sell our products to end users
in their respective geographic regions. If a significant number of those
resellers were to terminate their relationship with us or otherwise fail or
refuse to sell our products, we may not be able to find replacements that are as
qualified or as successful in selling our products. If we are unable to find
qualified and successful replacements, our sales will suffer, which would have a
material adverse effect on our net income.
We may not be able to adequately protect or
enforce our intellectual property rights, which could harm our competitive
position.
Our success and future revenue growth
will depend, in part, on our ability to protect our intellectual property. We
rely primarily on patents, trademarks and trade secrets, as well as
non-disclosure agreements and other methods, to protect our proprietary
technologies and processes. Despite our efforts to protect our proprietary
technologies and processes, it is possible that competitors or other
unauthorized third parties may obtain, copy, use or disclose our technologies
and processes. We cannot assure you that any of our existing or future patents
will not be challenged, invalidated or circumvented. As such, any rights granted
under these patents may not provide us with meaningful protection. We may not be
able to obtain foreign patents or pending applications corresponding to our U.S.
patent applications. Even if foreign patents are granted, effective enforcement
in foreign countries may not be available. If our patents do not adequately
protect our technology, our competitors may be able to offer products similar to
ours.
14
Our competitors may also be able to develop similar
technology independently or design around our patents. Any of the foregoing
events would lead to increased competition and lower revenue or gross margins,
which would adversely affect our net income.
If our intangible assets become impaired, we
may be required to record a significant charge to earnings.
As of December 31, 2009, the net book
value of our intangible assets was approximately $7.7 million. Accounting rules
require us to take a charge against our earnings to the extent that any of these
intangible assets are impaired. Accordingly, invalidation of our patents,
trademarks or other intellectual property or the impairment of other intangible
assets due to litigation, obsolescence, competitive factors or other reasons
could result in a material charge against our earnings and have a material
adverse effect on our results of operations.
If our investments become impaired, we may be
required to record a significant charge to earnings.
Our investments include tax-free Auction
Rate Securities (ARS) and municipal government bonds, all of which are insured.
Given the current volatility in interest rates and the potential impact of
higher interest rates on the issuers of these securities, a significant increase
in interest rates could impair the ability of one or more issuers to pay
interest on, or principal of, these obligations. Defaults by these issuers or
their insurers could cause an impairment of the value of our investments,
resulting in a charge against our earnings. Any such charge could have a
material adverse effect on our results of operations.
We operate a global business that exposes us
to additional risks.
Our sales outside of the United States
accounted for approximately 44% of our consolidated net sales in 2009. We
continue to expand into international markets. The future growth and
profitability of our foreign market is subject to a variety of risks and
uncertainties. Any of the following factors could adversely affect our sales to
customers located outside of the United States:
- An increase in relative strength
of the US dollar against foreign currencies could make our products more
expensive and would reduce our profit margins on sales to foreign
customers.
- If we are unable to protect our
intellectual property in foreign countries, competitors could use it to
compete against us, adversely affecting our sales and
profits.
- Political or economic instability
in regions where we sell our products could reduce or eliminate sales to
customers located in those regions.
- Seasonal fluctuations in business
activity in certain countries could result in significant fluctuations in
sales from quarter to quarter.
- Changes in export controls and tariffs could make it more difficult for us to sell our products outside of the United States.
Our operating results and financial condition
may fluctuate.
Our operating results and financial
condition may fluctuate from quarter-to-quarter and year-to-year and are likely
to continue to vary due to a number of factors, many of which are not within our
control. If our operating results do not meet the expectations of securities
analysts or investors, who may derive their expectations by extrapolating data
from recent historical operating results, the market price of our common stock
will likely decline. Fluctuations in our operating results and financial
condition may be due to a number of factors, including, but not limited to,
those listed below and those identified throughout this “Risk Factors”
section:
- changes in the amount that we
spend to develop, acquire or license new products, consumables, technologies
or businesses;
- changes in the
amount we spend to promote our products and services;
- changes in the
cost of satisfying our warranty obligations and servicing our installed base
of systems;
- delays between
our expenditures to develop and market new or enhanced systems and consumables
and the generation of sales from those products;
- development of
new competitive systems by others;
- changes in
accounting rules and tax laws;
- the mix of high-performance systems, 3D printers and consumables that we sell during any period;
15
- the geographic distribution of our
sales;
- our responses to price competition;
- market acceptance of our products;
- general economic and industry conditions that affect customer
demand;
- changes in interest rates that affect returns on our cash
balances and short-term investments;
- failure of a development partner to continue supporting
certain product development efforts it is funding; and
- our level of research and development activities.
Due to all of the
foregoing factors, and the other risks discussed in this report, you should not
rely on quarter-to-quarter comparisons of our operating results as an indicator
of future performance.
Default in payment by one or more resellers
that have large account receivable balances could adversely impact our results
of operations and financial condition.
From time to time, accounts receivable balances have been concentrated
with certain resellers. Default by one or more of these resellers or customers
could result in a significant charge against our current reported earnings. We
have reviewed our policies that govern credit and collections, and will continue
to monitor them in light of current payment status and economic
conditions. Default by one or more of these resellers
would result in a significant charge against our earnings and adversely affect
our results of operations and financial condition.
If we are unable to retain our key operating
personnel and attract additional skilled operating personnel, our development of
new products will be delayed and our personnel costs will
increase.
Our growth plans require us to retain key
employees in, and to hire additional skilled employees for, our operating
departments, such as engineering and computer programming, to enhance existing
products and develop new products. Our inability to retain and hire key
engineers and other employees could have the effect of delaying our development
and introduction of new products, which would adversely affect our revenues. In
addition, a possible shortage of such personnel in the Minneapolis region could
require us to pay more to retain and hire such employees, thereby increasing our
costs.
Our common stock price has been and may
continue to be highly volatile.
During 2009, our common stock traded at
prices ranging between $7.70 and $18.98. Investors may have difficulty selling
our common stock following periods of volatility, because of the market’s
adverse reaction to such volatility. Factors that we believe have caused or may
cause this volatility include, among other things:
- the volatile global
economy;
- actual or anticipated variations
in quarterly or annual operating results;
- our announcements of the issuance
of patents or other technological innovations;
- our announcements of new
products;
- our competitors' announcements of
new products;
- changes in financial estimates or
recommendations by securities analysts;
- the employment and termination of
key personnel; and
- sales or repurchases of our common stock by our Company
Many of these factors are beyond our control. These factors may have a material
adverse affect on the market price of our common stock, regardless of our
operating performance.
If our internal controls over financial
reporting do not comply with the requirements of the Sarbanes-Oxley Act, our
business and stock price could be adversely affected.
Section 404 of the Sarbanes-Oxley Act of 2002 requires us to evaluate the
effectiveness of our internal controls over financial reporting as of the end of
each year, and to include a management report assessing the effectiveness of our
internal controls over financial reporting in all annual reports. Section 404
also requires our independent registered public accounting firm to report on the
effectiveness of our internal controls over financial reporting.
16
Our management, including our CEO and CFO, does not expect that our
internal controls over financial reporting will prevent all error and fraud. A
control system, no matter how well designed and operated, can provide only
reasonable, not absolute, assurance that the control system’s objectives will be
met. Further, the design of a control system must reflect the fact that there
are resource constraints, and the benefits of controls must be considered
relative to their costs. Because of the inherent limitations in all control
systems, no evaluation of controls can provide absolute assurance that all
control issues and instances of fraud, if any, involving Stratasys have been, or
will be detected. These inherent limitations include the realities that
judgments in decision-making can be faulty and that breakdowns can occur because
of simple error or mistake. The design of any system of controls is based in
part on certain assumptions about the likelihood of future events, and we cannot
assure you that any design will succeed in achieving its stated goals under all
potential future conditions. Over time, our controls may become inadequate
because of changes in conditions or deterioration in the degree of compliance
with policies or procedures. Because of the inherent limitations in a
cost-effective control system, misstatements due to error or fraud may occur and
not be detected.
Although our management has determined,
and our independent registered public accounting firm has concluded in its
audit, that our internal controls over financial reporting were effective as of
December 31, 2009, we cannot assure you that our independent registered
accounting firm will not identify a material weakness in our internal controls
in the future. A material weakness in our internal controls over financial
reporting would require management and our independent registered public
accounting firm to evaluate our internal controls as ineffective. If our
internal controls over financial reporting are not considered adequate, we may
experience a loss of public confidence, which could have an adverse effect on
our business and our stock price.
The foregoing list is not exhaustive.
There can be no assurance that we have correctly identified and appropriately
assessed all factors affecting our business or that the publicly available and
other information with respect to these matters is complete and correct.
Additional risks and uncertainties not presently known to us or that we
currently believe to be immaterial also may adversely impact our business.
Should any risks or uncertainties develop into actual events, these developments
could have material adverse effects on our business, financial condition, and
results of operations.
We assume no obligation (and specifically
disclaim any such obligation) to update these Risk Factors or any other
forward-looking statements contained in this Annual Report to reflect actual
results, changes in assumptions or other factors affecting such forward-looking
statements.
Item 1B. Unresolved Staff Comments.
None.
Item 2. Properties.
Our executive offices and production
facilities presently comprise approximately 198,000 available square feet in
three buildings in Eden Prairie, Minnesota, near Minneapolis.
On August 1, 2001, we purchased our Eden
Prairie manufacturing facility and land for approximately $3.0 million. The
facility consists of 62,100 square feet, and is used for machine assembly,
inventory storage, operations and sales support.
In March 2004, we purchased an additional
43,900 square foot manufacturing facility for approximately $1.2 million. The
facility is located near our manufacturing facility in Eden Prairie, Minnesota,
and is used for our RedEye paid parts service.
In November 2005, we purchased an
additional 91,800 square foot manufacturing facility for approximately $5.1
million. By the end of 2008, we had substantially completed the improvements
needed to make this facility suitable for our specific usage and had spent
approximately $3.3 million. This facility is used for R&D, administrative,
marketing and sales activities and is adjacent to our manufacturing facility in
Eden Prairie, Minnesota. We expect it to accommodate our intermediate expansion
requirements.
17
We occupy a 40,835 square foot warehouse in Eden Prairie, Minnesota, for
shipping and storage under a lease that expires in March 2012. We also occupy a
9,070 square foot facility in Minneapolis, Minnesota, for research and
development under a lease that expires in September 2012. We are also
responsible for real estate taxes, insurance, utilities, trash removal, and
maintenance expenses at these facilities.
We have two North American sales offices
and one service office. We occupy 2,700 square feet of space in Novi, Michigan,
a Detroit suburb, under a lease that expires in July 2010. We also occupy a
2,500 square foot sales office under a lease that expires in August 2011 and a
1,440 square foot service office under a lease that expires in August 2011, both
of which are located in Ontario, California. We are also responsible for real
estate taxes, insurance, utilities, trash removal, and maintenance expenses at
these facilities.
We have four international sales and
service offices under lease. Our German subsidiary leases 8,041 square feet of
space in Frankfurt, Germany under a lease that expires in June 2011. Our Italian
subsidiary leases 1,300 square feet in Bologna, Italy under a lease that expires
in December 2010. We occupy a 500 square foot sales office located in Hong Kong
under a lease that expires in March 2011. We have a 1,100 square foot sales
office in Bangalore, India, under a lease that expired in January 2010. We
continue to occupy the space while we proceed with negotiations for a lease
extension and believe that we will be able to renew the lease.
Item 3. Legal Proceedings.
We are party to various legal matters,
the outcome of which, in the opinion of management, will not have a material
adverse effect on the Company’s financial position.
Item 4. Reserved.
18
PART II
Item 5. Market for Registrant’s Common Equity,
Related Stockholder Matters and Issuer Purchases of Equity Securities.
Market Information
Our common stock is traded on the
Nasdaq Global Select Market under the symbol SSYS.
The following table sets forth the
high and low closing sale prices of our common stock for each quarter from
January 1, 2008 through the fiscal year ended December 31, 2009 reported on the
Nasdaq Global Select Market.
| High | Low | |||||
| Closing Sale Prices | ||||||
| Fiscal Year Ended December 31, 2008 | ||||||
| January 1, 2008 – March 31, 2008 | $ | 27.32 | $ | 17.63 | ||
| April 1, 2008 – June 30, 2008 | 22.99 | 18.46 | ||||
| July 1, 2008 – September 30, 2008 | 21.28 | 15.29 | ||||
| October 1, 2008 – December 31, 2008 | 17.71 | 9.30 | ||||
| Fiscal Year Ended December 31, 2009 | ||||||
| January 1, 2009 – March 31, 2009 | $ | 12.70 | $ | 7.70 | ||
| April 1, 2009 – June 30, 2009 | 13.94 | 8.60 | ||||
| July 1, 2009 – September 30, 2009 | 17.21 | 10.32 | ||||
| October 1, 2009 – December 31, 2009 | 18.98 | 14.85 | ||||
Holders
There were approximately 97 record
and 7,694 beneficial owners of our common stock as of March 1, 2010.
Dividends
We have not paid or declared any
cash dividends to date. We intend to retain earnings, if any, to support the
growth of our business.
19
Securities Authorized for Issuance Under
Equity Compensation Plans
The following table sets forth the number of securities to be issued upon
the exercise of, and the weighted-average exercise price of, outstanding
options, warrants and rights, and the number of securities remaining available
for future issuance, under our equity compensation plans as of December 31,
2009:
| Number of securities | ||||||
| Weighted average | remaining available for | |||||
| Number of securities | exercise price of | future issuance under | ||||
| to be issued upon | outstanding | compensation plans | ||||
| exercise of outstanding | options, warrants | (excluding securities | ||||
| options, warrants and rights | and rights | reflected in column (a)) | ||||
| (a) | (b) | (c) | ||||
| Equity compensation plans | ||||||
| approved by security holders | 735,478 | $ 14.49 | 1,112,366 |
Note: We do not have any
equity compensation plans that have not been approved by security
holders.
Performance Graph
The following graph compares on a
cumulative basis the yearly percentage change, assuming dividend reinvestment,
over the last five fiscal years in (a) the total stockholder return on our
Common Stock with (b) the total return on the Nasdaq (US) Composite Index, and
(c) the total return on the information technology sector of the Standard &
Poor’s SmallCap 600 Index (“S&P 600 Info Tech Index”). The S&P 600 Info
Tech Index consists of 125 of the 600 stocks comprising the Standard &
Poor’s SmallCap 600 Index, a capitalization-weighted index of domestic stocks
chosen for market size, liquidity and industry representation. We are a
component company of the S&P 600 Info Tech Index. The following graph
assumes that $100 had been invested in each of Stratasys, the Nasdaq (US)
Composite Index, and the S&P 600 Info Tech Index on December 31,
2004.
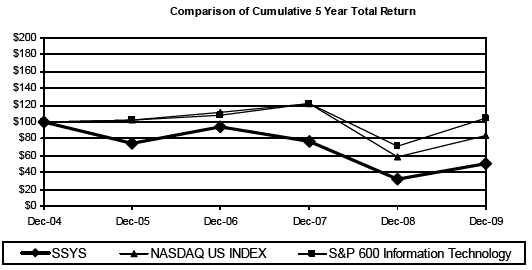
20
Item 6. Selected Financial
Data.
The selected consolidated financial
data as of and for the five-year period ended December 31, 2009, should be read
in conjunction with the Consolidated Financial Statements and related Notes for
the year ended December 31, 2009, and the Management’s Discussion and Analysis
of Financial Condition and Results of Operations.
| Years Ended December 31, | |||||||||||||||
| (In Thousands, Except Per Share Amounts) | |||||||||||||||
| 2009 | 2008 | 2007 | 2006 | 2005 | |||||||||||
| Statement of Operations Data: | |||||||||||||||
| Net sales | $ | 98,356 | $ | 124,495 | $ | 112,243 | $ | 103,809 | $ | 82,844 | |||||
| Gross profit | 46,384 | 66,412 | 59,708 | 51,441 | 43,755 | ||||||||||
| Research and development | 7,737 | 8,973 | 7,465 | 6,699 | 6,354 | ||||||||||
| Selling, general and administrative | |||||||||||||||
| expenses | 32,823 | 36,843 | 33,770 | 29,105 | 23,243 | ||||||||||
| Operating income | 5,824 | 20,596 | 18,473 | 15,637 | 14,157 | ||||||||||
| Net income | 4,116 | 13,615 | 14,324 | 11,164 | 10,603 | ||||||||||
| Net income per basic common share | 0.20 | 0.66 | 0.69 | 0.55 | 0.50 | ||||||||||
| Weighted average basic shares | |||||||||||||||
| outstanding | 20,236 | 20,676 | 20,772 | 20,240 | 21,056 | ||||||||||
| Net income per diluted common | |||||||||||||||
| share | $ | 0.20 | $ | 0.65 | $ | 0.66 | $ | 0.54 | $ | 0.49 | |||||
| Weighted average diluted shares | |||||||||||||||
| outstanding | 20,268 | 21,079 | 21,567 | 20,723 | 21,489 | ||||||||||
| Balance Sheet Data: | |||||||||||||||
| Working capital | $ | 82,838 | $ | 63,296 | $ | 64,100 | $ | 55,311 | $ | 47,524 | |||||
| Total assets | 153,137 | 147,743 | 148,757 | 118,004 | 104,680 | ||||||||||
| Long term debt | --- | --- | --- | --- | --- | ||||||||||
| Stockholders’ equity | $ | 129,583 | $ | 122,562 | $ | 123,834 | $ | 97,792 | $ | 86,269 | |||||
21
Item 7. Management’s Discussion and Analysis
of Financial Condition and Results of Operation.
Introduction
Management’s Discussion and Analysis
of Financial Condition and Results of Operations is intended to facilitate an
understanding of our business and results of operations. It should be read in
conjunction with our Consolidated Financial Statements and the accompanying
Notes to Consolidated Financial Statements included elsewhere in this report.
All amounts in the following discussions are stated in thousands, except
employees, share and per share data, prices for systems, or as otherwise
indicated.
General
We develop, manufacture, and market
a family of 3D printing, rapid prototyping (“RP”) and direct digital
manufacturing (“DDM”) systems, which enable engineers and designers to create
physical models, tooling, jigs, fixtures, prototypes, and end use parts out of
production grade thermoplastic directly from a computer aided design (“CAD”)
workstation.
Our Market Strategy
Our strategy in 2009 was three-fold:
- Continue expanding our market
position in the 3D printing market by introducing new products and expanding
our distribution channel for our Dimension products. In January 2010,
we signed a master original equipment manufacturer agreement (the “Agreement”)
with Hewlett-Packard (“HP”) to develop and manufacture an HP-branded 3D
printer. During the initial term of the Agreement, which expires September 30, 2011, we will manufacture a
line of FDM (“Fused Deposition Modeling”) 3D printers and related accessories
and consumables exclusively for HP for resale under the HP brand in France,
Germany, Italy, Spain and the United Kingdom.
HP has agreed not to sell 3D printers manufactured by themselves or any other 3D printers manufactured by other companies throughout the world for the term of the Agreement. The term of the Agreement will be extended for additional one-year periods unless terminated on advance notice by either party. During the term of the Agreement, we have agreed not to sell comparable products covered by the Agreement directly or indirectly in the territory covered by the Agreement. The Agreement does not require HP to purchase any minimum quantity of products.We expect that the first products will be available to be shipped to HP customers in the first half of 2010. After the initial term, or by mutual agreement, the territory in which HP will have the exclusive right to sell the 3D printers covered by the Agreement may be expanded to additional countries worldwide. Ultimately, our mutual intention is for HP to sell our 3D printers globally.Also in January 2010, we expanded the Dimension uPrint product line by introducing the uPrint Plus. This system offers the same small footprint as the previously introduced uPrint but offers a 33% larger build envelop. It also allows the user to print in seven additional colors and offers two resolution settings. Concurrent with the launch of the uPrint Plus, we also introduced two support-material enhancements. The first, Smart Supports, is a software feature that can reduce support material usage by 40%. The second is a new soluble support material called SR-30, which can dissolve 69% faster than the current soluble support material.In January 2009, we introduced the world’s first personal 3D printer, the uPrint, priced at $14,900. We also reduced the prices on some of our existing models, creating a new price range for the Dimension product line from $14,900 to $32,900. We believe the 3D printer market is price elastic and we can grow the volume of 3D printers, related consumables and maintenance as we continue to introduce lower cost 3D printers. According to the 2009 Wohler’s Report (“Wohlers”), we shipped more 3D printers than other company in the world in 2008, and based on our results in 2009, we believe that we have continued that trend.
22
- Expand our position in the RP and
DDM markets through new proprietary product introductions, including the
Fortus 360mc, Fortus 400mc and Fortus 900mc. We have built a leadership
position in the RP and DDM markets by helping customers build stable, strong,
and durable parts for testing and end-use. Our Fortus 3D Production Systems
are ideally suited for DDM applications such as the production of
manufacturing tools and low-volume end-use parts. We plan to expand our
presence in this area by offering improved system capabilities and new and
improved material properties. During the year, we continued to collaborate
with a Fortune 500 global manufacturing company to advance our proprietary FDM
technology for direct digital manufacturing applications and will maintain
this collaboration into 2010 for the fifth consecutive year.
- Expand our RedEye paid parts service of producing parts for customers. We believe this is a fragmented global market dominated by numerous small companies generating less than $1 million each in annual sales. Sales from our RedEye paid parts service have been somewhat volatile quarter-to-quarter as we work to identify the most effective ways of reaching customers. In the fall of 2005, we launched RedEye RPM™, later rebranded as Redeye on Demand, as an internet site allowing customers to obtain instant quotes and then order their parts over the Internet via the submission of a standard 3D CAD STL file. In December 2008, we announced that AutoCAD users can order digitally manufactured prototypes and production parts quickly and easily through an on-demand 3D printing capability supported by our RedEye paid parts service. AutoCAD has continued offer this capability in 2010. As customers continue to increase their volume of parts ordered, we are often successful in selling them systems to produce their own parts.
Description of
Current Conditions
Our revenue declined 21.0% in 2009
due primarily to the world-wide economic slow down that took hold in late 2008
and continued to soften demand for our products and services during 2009. The
reduction in our revenue from systems, other products and other services was
mainly attributable to both lower volume and prices. We shipped 1,918 units in
2009, a decrease of 266 units, or 12.2% from 2,184 in 2008. We also saw a
decrease in the average selling price of our systems as a result of our
long-term pricing strategy and to a lesser extent, from general market
conditions that have resulted from constricted capital spending budgets amongst
our customer base. Over the last three years, we believe that we have been the
price leaders in the 3D printer market and have followed a strategy of
continuing to move down the price elasticity curve as evidenced by our
introduction of the uPrint in January 2009. The market environment for our high
performance systems, while more competitive than the 3D printing market, has
been driven mainly by system and material performance capabilities rather than
price.
As our installed base of systems has
increased, the capacity to derive an increasing amount of revenue from sales of
consumables, maintenance contracts, and other services has also increased. In
2009, total non-system revenue decreased by 6.1% as compared to the prior year
due principally to the world-wide economic slow down. The decline in the other
products and services revenue categories is closely related to the 34.0% decline
in systems sales during 2009. Although a much smaller decline, revenue from our
RedEye paid parts service declined due to an aggressive service bureau pricing
environment. Revenue from maintenance contracts grew slightly in 2009 as this
revenue is less susceptible to the economic environment given that most of it
results from contracts signed in prior periods.
Due to the weakness in the world economy, in early 2009 we reevaluated
our fixed and variable cost structure in light of current sales expectations. As
a result, we took certain cost-saving measures that lowered our fixed costs and
curtailed some discretionary spending while maintaining a focus on the key goals
and objectives of our long-term strategy. These cost-saving measures resulted in
a first quarter charge of approximately $779,000, consisting primarily of
severance costs related to a reduction in force. We estimate that these measures
had an annualized cost savings of approximately $2.7 million.
Given our strong cash position and
no debt, we believe that we have adequate liquidity to fund our growth strategy
in 2010. We plan on continuing to make investments in fixed assets, process
improvements, information technology (“IT”), and human resource development
activities that will be required for future growth. Our expense levels are based
in part on our expectations of future sales and we will make adjustments as we
consider appropriate. While we
have adjusted, and will continue to adjust, our expense levels based on both
actual and anticipated sales, fluctuations in sales in a particular period could
adversely impact our operating results. Whereas our backlog as of December 31,
2009 was $6.3 million, it would not be sufficient to meet our budgeted sales
targets should 2010 system orders further decline beyond the 2009
levels.
23
We expect growth to be largely
dependent upon our ability to penetrate new markets and develop and market new
RP, DDM and 3D printing systems, materials, applications, and services that meet
the needs of our current and prospective customers. Our ability to implement our
strategy for 2010 is subject to numerous uncertainties, many of which are
described under “Risk Factors,” above, in this Management’s Discussion and
Analysis of Financial Condition and Results of Operations and in the section
below captioned “Forward Looking Statements and Factors That May Affect Future
Results of Operations.” We cannot ensure that our efforts will be successful.
Results of Operations
The following table sets forth
certain statement of operations data as a percentage of net sales for the
periods indicated. All items are included in or derived from our consolidated
statement of operations.
| For the twelve months ended December 31, | 2009 | 2008 | 2007 | ||||||
| Net sales | 100.0 | % | 100.0 | % | 100.0 | % | |||
| Cost of sales | 52.8 | % | 46.7 | % | 46.8 | % | |||
| Gross profit | 47.2 | % | 53.3 | % | 53.2 | % | |||
| Research & development | 7.9 | % | 7.2 | % | 6.7 | % | |||
| Selling, general and administrative | 33.4 | % | 29.6 | % | 30.1 | % | |||
| Operating income | 5.9 | % | 16.5 | % | 16.5 | % | |||
| Other income (expense) | 0.4 | % | 0.1 | % | 1.7 | % | |||
| Income before taxes | 6.3 | % | 16.7 | % | 18.2 | % | |||
| Income taxes | 2.1 | % | 5.7 | % | 5.4 | % | |||
| Net income | 4.2 | % | 10.9 | % | 12.8 | % | |||
Net Sales
Net sales of our products and
services for the last three years, as well as the percentage change were as
follows:
| Year-over- | Year-over- | ||||||||||||||
| 2009 | Year Change | 2008 | Year Change | 2007 | |||||||||||
| Products | $ | 73,210 | -26.0 | % | $ | 98,969 | 10.9 | % | $ | 89,280 | |||||
| Services | 25,146 | -1.5 | % | 25,526 | 11.2 | % | 22,963 | ||||||||
| $ | 98,356 | -21.0 | % | $ | 124,495 | 10.9 | % | $ | 112,243 | ||||||
Product
Revenue
Revenues derived from products (including systems, consumable materials and other products) decreased $25.8 million in 2009, or 26.0%, as compared to the prior year. The number of systems shipped decreased by 12.2%, or 266 units, to 1,918 as compared to 2,184 units shipped in 2008. This decrease in both revenue and number of systems shipped was primarily attributable to the worldwide economic slowdown that constricted capital spending budgets across all industries. Revenue derived from products decreased at a greater rate than system shipments due to a product mix that favored the lower-priced uPrint. Consumable revenue in 2009 decreased 4.3%, which was a much lower decline as compared to the decline in our system revenue. Consumable revenue is directly related to our installed base and is less susceptible to current market conditions than our revenue from system sales.
Revenues derived from products (including systems, consumable materials and other products) decreased $25.8 million in 2009, or 26.0%, as compared to the prior year. The number of systems shipped decreased by 12.2%, or 266 units, to 1,918 as compared to 2,184 units shipped in 2008. This decrease in both revenue and number of systems shipped was primarily attributable to the worldwide economic slowdown that constricted capital spending budgets across all industries. Revenue derived from products decreased at a greater rate than system shipments due to a product mix that favored the lower-priced uPrint. Consumable revenue in 2009 decreased 4.3%, which was a much lower decline as compared to the decline in our system revenue. Consumable revenue is directly related to our installed base and is less susceptible to current market conditions than our revenue from system sales.
During 2008, sales of Fortus systems
grew with new product introductions and our focus on new applications within the
DDM market. As we increased our installed base of systems in the field, we
continued to see solid growth in consumables and maintenance revenue. Our
Dimension systems sales were flat in 2008 due to the weak global economy.
24
The primary drivers of the 2008
year-over-year growth in proprietary product sales were:
- 41% increase in Fortus high
productivity system sales
- 12% increase in consumable sales
In 2007 and the beginning of 2008,
we discontinued distribution of Eden and Arcam products. We recognized
approximately $0.2 million and $4.0 million of distributed sales in 2008 and
2007, respectively. We had no sales of these two distributed products in 2009.
Adjusting for the impact of the terminated distributed agreements, net sales of
our products and services for 2008 and 2007, and changes in net sales, were as
follows:
| Year-over- | |||||||||
| 2008 | 2007 | Year Change | |||||||
| Products | $ | 98,782 | $ | 86,255 | 14.5 | % | |||
| Services | 25,526 | 22,002 | 16.0 | % | |||||
| Net sales | $ | 124,308 | $ | 108,257 | 14.8 | % | |||
Service
Revenue
Service revenues predominately consist of the following components: maintenance, RedEye paid parts, and rentals. The 13% decrease in our RedEye paid parts service revenue in 2009 was partially offset by growth in our maintenance contract revenue. In 2008, we saw a 12% increase in our RedEye paid parts service as we continued to invest in reaching customers through trade shows, direct mailings and our RedEye on Demand™ website, which allows customers to order their parts over the Internet. In addition, in February, 2008 we launched RedEye.arc in an effort to reach the architectural market. Revenues from maintenance services on our proprietary systems saw revenue growth in 2008 of 10% as we continued to increase our installed base of systems.
Service revenues predominately consist of the following components: maintenance, RedEye paid parts, and rentals. The 13% decrease in our RedEye paid parts service revenue in 2009 was partially offset by growth in our maintenance contract revenue. In 2008, we saw a 12% increase in our RedEye paid parts service as we continued to invest in reaching customers through trade shows, direct mailings and our RedEye on Demand™ website, which allows customers to order their parts over the Internet. In addition, in February, 2008 we launched RedEye.arc in an effort to reach the architectural market. Revenues from maintenance services on our proprietary systems saw revenue growth in 2008 of 10% as we continued to increase our installed base of systems.
Revenue by
Region
Net sales and the percentage of net sales by region for the last three years, as well as the percentage change were as follows:
Net sales and the percentage of net sales by region for the last three years, as well as the percentage change were as follows:
| Year-over- | Year-over- | |||||||||||||||||||||||
| 2009 | Year Change | 2008 | Year Change | 2007 | ||||||||||||||||||||
| North America | $ | 55,156 | 56 | % | -17.3 | % | $ | 66,698 | 54 | % | 6.7 | % | $ | 62,525 | 56 | % | ||||||||
| Europe | 26,309 | 27 | % | -29.7 | % | 37,430 | 30 | % | 37.9 | % | 27,144 | 24 | % | |||||||||||
| Asia Pacific | 15,814 | 16 | % | -14.7 | % | 18,534 | 15 | % | -6.4 | % | 19,806 | 18 | % | |||||||||||
| Other | 1,077 | 1 | % | -41.2 | % | 1,833 | 1 | % | -33.8 | % | 2,768 | 2 | % | |||||||||||
| $ | 98,356 | 100 | % | -21.0 | % | $ | 124,495 | 100 | % | 10.9 | % | $ | 112,243 | 100 | % | |||||||||
Sales in all regions declined in
2009 due to lower volumes as a result of the economic slow down combined with an
overall lower average selling price that resulted primarily from our
introduction of the uPrint in January 2009 as part of our strategy of continuing
to move down the price elasticity curve.
Revenues in the North America
region, accounted for approximately 56% of total revenue in 2009. The slight
increase in sales percentage as compared to the prior year was primarily due to
the launch of a our newest system, the uPrint, which had an earlier domestic
launch than it did internationally.
Revenues outside of North America
accounted for approximately 44% of total revenue in 2009. The international
decrease was led by lower system volumes in both the high-performance systems as
well as 3D Printers, particularly in the first half of 2009.
North American sales grew in 2008
primarily due to significant growth in our high-performance systems, higher
maintenance revenue from a growing installed base and continued growth in our
RedEye paid parts service. This growth was partially off-set by a $3.8 million
decline in distributed product revenue that resulted from the discontinuation of
our distributed products agreements in 2007.
25
European sales grew dramatically during
2008 as a result of growth in our high-performance systems, expansion of our
reseller network and a favorable US Dollar exchange rate through the first three
quarters of 2008.
Asia Pacific sales declined in 2008 as a
result of weak sales within the Japanese market due to a decrease in overall
demand. We believe sales in certain Asia Pacific countries were impacted by weak
global economic conditions.
Gross Profit
Gross profit and gross profit as a
percentage of sales for our products and services for 2009, 2008 and 2007, as
well as the percentage changes in gross profit were as follows:
| Year-over- | Year-over- | |||||||||||||||||
| 2009 | Year Change | 2008 | Year Change | 2007 | ||||||||||||||
| Products | $ | 32,285 | -37.1 | % | $ | 51,297 | 5.2 | % | $ | 48,739 | ||||||||
| Services | 14,099 | -6.7 | % | 15,116 | 37.8 | % | 10,969 | |||||||||||
| $ | 46,384 | -30.2 | % | $ | 66,413 | 11.2 | % | $ | 59,708 | |||||||||
| Percentage of Sales | ||||||||||||||||||
| Products | 44.1 | % | 51.8 | % | 54.6 | % | ||||||||||||
| Services | 56.1 | % | 59.2 | % | 47.8 | % | ||||||||||||
| Total | 47.2 | % | 53.3 | % | 53.2 | % | ||||||||||||
Product gross profit decreased by $19.0
million, or 37.1%, to $32.3 million in 2009 as compared with $51.3 million in
2008. This decrease is primarily attributable to lower system revenues. The
decrease was also attributable to the launch of our new uPrint system, which has
a lower direct margin than our other systems and added to our fixed
manufacturing overhead. In 2008, product gross profit increased by $2.6 million,
or 5.2%, to $51.3 million in 2008 as compared with $48.7 million in 2007 despite
a 10.9% increase in product revenue. Product gross margin as a percentage of
sales declined in 2008 due to a less favorable product mix and increased
software amortization.
Gross profit from services decreased by
6.7% in 2009. This decrease is primarily attributable to an aggressive pricing
environment experienced by our Paid Parts service. In 2008, service gross profit
increased primarily from the following:
- 12% growth in our high margin
RedEye paid parts service;
- Discontinuation of service on
distributed products. This service business had negligible
margins;
- Improved quality and reliability of our proprietary systems resulting in reduced service costs and higher service margins.
Operating Expenses
Operating expenses and operating expense
as a percentage of sales for 2009, 2008 and 2007, as well as the percentage
change in operating expenses, were as follows:
| Year-over- | Year-over- | |||||||||||||||||
| 2009 | Year Change | 2008 | Year Change | 2007 | ||||||||||||||
| Research and development | $ | 7,737 | -13.8 | % | $ | 8,973 | 20.2 | % | $ | 7,465 | ||||||||
| Selling, general & administrative | 32,823 | -10.9 | % | 36,843 | 9.1 | % | 33,770 | |||||||||||
| $ | 40,560 | -11.5 | % | $ | 45,816 | 11.1 | % | $ | 41,235 | |||||||||
| Percentage of Sales | 41.2 | % | 36.8 | % | 36.7 | % | ||||||||||||
Research and development expenses
decreased by 13.8% during 2009, as a result of a lower spending due to economic
concerns, reduced headcount and higher joint development reimbursements. During
2008, research and development expenses increased by 20.2% as we remained
committed to designing new products and materials, reducing costs on existing
products, and improving the quality and reliability of all of our platforms.
This spending was focused on accelerating our development efforts to address
both the 3D printer and DDM market opportunities. Increases were primarily the
result of increases in engineering headcount, partially offset by an increase in
internally capitalized software. In 2009, 2008 and 2007, capitalized software
additions were approximately $1.4 million, $2.1 million and $2.0 million,
respectively.
26
In 2008, we satisfied our
responsibilities under a three-year, $3.6 million agreement with a Fortune 500
global manufacturing company to jointly advance our proprietary FDM technology
for rapid manufacturing applications. This effort was focused around our
high-performance systems and resulted in the commercial release of the Fortus
900mc. The agreement entitled us to receive reimbursement payments as we
achieved specific milestones stated in the agreement. During 2009, 2008 and
2007, we offset approximately $2.2 million, $0.3 million and $1.0 million,
respectively, of R&D expenses with monies received from this customer. Due
to the success of this initial arrangement, we are continuing this relationship
under similar terms and objectives.
Selling, general and administrative
expenses decreased by 10.9% in 2009. This decrease was primarily attributable
to: 1) a reduction in our direct sales force in January of 2009, which converted
some of our selling expenses to a variable cost structure; 2) additional
headcount reductions made in the first quarter of 2009; and 3) a continued
effort to lower discretionary spending.
In 2008, selling, general and
administrative expenses increased 9.1% due to the growth in sales. These 2008
costs include approximately $545,000 in restructuring charges related to sales
strategy for our Fortus high-end systems. Effective January 1, 2009, we began
selling Fortus 3D Production Systems through a select group of North American
resellers from our established reseller channel, which had previously
distributed only the Dimension 3D printer product line. This sales strategy
leverages our success with a network of independent regional resellers that we
believe is the strongest sales channel in the industry and more than triples our
sales support for high-end systems. This restructuring of our sales organization
included costs related to workforce reductions, closure of certain leased
facilities, rebranding expenses, and other contract termination charges that
were recognized in 2008 and were settled during the first quarter of
2009.
In addition, we took certain cost-saving
measures in the first quarter of 2009 that lowered fixed costs and curtailed
some discretionary spending while maintaining a focus on the key goals and
objectives of our long-term strategy. These cost-saving measures resulted in a
charge of $779,000 in the first quarter of 2009, consisting primarily of
severance costs related to a reduction in workforce. Final severance payments
were completed during the third quarter of 2009 and the unused portion of the
provision, noted as “adjustments” in the table below, was recorded in income for
the current period.
A summary of the activity of these
restructuring and other costs recognized in the Statement of Operations caption
“Selling, general and administrative” are as follows:
| Employee- | Contract | |||||||||||
| Related Items | Terminations | |||||||||||
| and Benefits | and Other | Total | ||||||||||
| Accrued balance as of December 31, 2008 | $ | 306,014 | $ | 66,881 | $ | 372,895 | ||||||
| Expenses incurred | 779,000 | - | 779,000 | |||||||||
| Cash payments | (810,707 | ) | (66,881 | ) | (877,588 | ) | ||||||
| Adjustments | (274,307 | ) | - | (274,307 | ) | |||||||
| Accrued balance as of December 31, 2009 | $ | - | $ | - | $ | - | ||||||
27
Operating Income
Operating income and operating income as
a percentage of sales for 2009, 2008 and 2007, as well as the percentage change
in operating income were as follows:
| Year-over- | Year-over- | |||||||||||||||||
| 2009 | Year Change | 2008 | Year Change | 2007 | ||||||||||||||
| Operating income | $ | 5,824 | -71.7 | % | $ | 20,596 | 11.5 | % | $ | 18,473 | ||||||||
| Percentage of Sales | 5.9 | % | 16.5 | % | 16.5 | % | ||||||||||||
Operating income in 2009 declined by
$14.8 million, primarily due to the significant drop in revenue, partially
offset by reductions of indirect spending. Operating income as a percentage of
sales in 2008 remained flat to 2007 but increased in dollar amount due to higher
sales volume.
Other Income (Expenses)
Other income and other income as a
percentage of sales for 2009, 2008 and 2007, as well as the percentage change in
operating income were as follows:
| Year-over- | Year-over- | |||||||||||||||||
| 2009 | Year Change | 2008 | Year Change | 2007 | ||||||||||||||
| Interest income | $ | 990 | -51.4 | % | $ | 2,037 | -12.0 | % | $ | 2,316 | ||||||||
| Foreign currency transaction losses, net | (233 | ) | -72.1 | % | (835 | ) | 66.0 | % | (503 | ) | ||||||||
| Other | (398 | ) | -62.6 | % | (1,065 | ) | -1501.3 | % | 76 | |||||||||
| $ | 359 | 162.0 | % | $ | 137 | -92.7 | % | $ | 1,889 | |||||||||
| Percentage of Sales | 0.4 | % | 0.1 | % | 1.7 | % | ||||||||||||
While the 2009 cash and investment
balance increased over 2008, interest income was lower as a result of a higher
percentage of our holdings invested in low-yield government securities.
We invoice sales to certain European
distributors in Euros and reported results are therefore subject to fluctuations
in the exchange rates of that currency in relation to the United States dollar.
Our strategy is to hedge most of our Euro-denominated accounts receivable
positions by entering into 30-day foreign currency forward contracts on a
month-to-month basis to reduce the risk that our earnings will be adversely
affected by changes in currency exchange rates. We do not use derivative
financial instruments for speculative or trading purposes.
We will continue to monitor exposure to
currency fluctuations. Instruments to hedge risks may include foreign currency
forward, swap, and option contracts. These instruments will be used to
selectively manage risks, but there can be no assurance that we will be fully
protected against material foreign currency fluctuations.
In 2008, our hedging strategy resulted in
a larger transaction loss due to the volatility of the US dollar relative to the
euro. At December 31, 2009 we had approximately €4.7 million or $6.8 million net
in Euro-denominated receivables and a €3.8 million or $5.5 million 30-day
forward contract.
Other income (expense) for 2009 includes
a $350,000 reduction in the assessed fair value of an equity investment in
another company that was considered to be other than temporary. The 2008 amount
includes an impairment charge of approximately $1.3 million related to a $2.6
million investment in a Jefferson County, Alabama, municipal bond. In February
2008, the auction for this auction rate security failed and its rating has been
reduced from AAA to CCC. With the assistance of outside consultants, we
determined this investment has incurred both a temporary and
other-than-temporary impairment loss.
28
Income Taxes
Income taxes and income taxes as a
percentage of net income before taxes for 2008 and 2007, as well as the
percentage change were as follows:
| Year-over- | Year-over- | |||||||||||||||||
| 2009 | Year Change | 2008 | Year Change | 2007 | ||||||||||||||
| Income taxes | $ | 2,066 | -71.0 | % | $ | 7,118 | 17.9 | % | $ | 6,038 | ||||||||
| As a percent of income before income taxes | 33.4 | % | 34.3 | % | 29.6 | % | ||||||||||||
The following is a reconciliation of the
2009 effective income tax rate compared with the 2008 and the 2008 effective
income tax rate compared with the 2007 rate:
| 2009 Effective income tax rate | 33.4 | % |
| 2009 percentage increase in research and development credits | 2.8 | % |
| 2009 percentage increase in tax contingency reserve | (1.5 | %) |
| Other, net | (0.4 | %) |
| 2008 Effective income tax rate | 34.3 | % |
| 2007 income tax benefit recognized from prior year | ||
| amendments for state research and development credits | (3.7 | %) |
| Other, net | (1.0 | %) |
| 2007 Effective income tax rate | 29.6 | % |
Net Income
Net income and net income as a percentage
of sales for 2009, 2008 and 2007, as well as the percentage change in net income
were as follows:
| Year-over- | Year-over- | |||||||||||||||||
| 2009 | Year Change | 2008 | Year Change | 2007 | ||||||||||||||
| Net income | $ | 4,116 | -69.8 | % | $ | 13,615 | -4.9 | % | $ | 14,324 | ||||||||
| Percentage of Sales | 4.2 | % | 10.9 | % | 12.8 | % | ||||||||||||
For the reasons cited previously in this
management discussion and analysis section, our net income for the year ended
December 31, 2009 and 2008 was lower than the previous year.
29
Liquidity and Capital Resources
A summary of our statement of cash flows for the three years ended
December 31, 2009 is as follows:
| 2009 | 2008 | 2007 | |||||||||
| Net income | $ | 4,116 | $ | 13,615 | $ | 14,324 | |||||
| Depreciation and amortization | 8,256 | 7,004 | 4,974 | ||||||||
| Stock-based compensation | 1,137 | 1,322 | 955 | ||||||||
| Change in working capital and other | 11,981 | (7,450 | ) | 916 | |||||||
| Net cash provided by operating and other activities | 25,490 | 14,491 | 21,169 | ||||||||
| Net cash provided by (used in) investing activities | (6,831 | ) | 13,290 | (23,841 | ) | ||||||
| Net cash provided by (used in) in financing activities | 1,583 | (15,856 | ) | 9,321 | |||||||
| Effect of exchange rate changes on cash | 128 | (191 | ) | 260 | |||||||
| Net increase in cash and cash equivalents | 20,370 | 11,734 | 6,909 | ||||||||
| Cash and cash equivalents, beginning of year | 27,946 | 16,212 | 9,303 | ||||||||
| Cash and cash equivalents, end of year | $ | 48,316 | $ | 27,946 | $ | 16,212 | |||||
Our cash and cash equivalents balance
increased by $20.4 million to $48.3 million at December 31, 2009, from $27.9
million at December 31, 2008. The increase is primarily due to $25.5 million of
cash flows from operations partially offset by $6.8 million spent for
acquisitions of investments, property and equipment, and intangible assets.
The net cash provided by our operating
activities over the past three years has amounted to approximately $61.2
million, principally derived from $32.1 million in net income, plus $20.2
million in depreciation and amortization, $3.4 million in stock-based
compensation, and $5.4 million attributable to changes in net working capital
and other items.
In 2009, the principal source of cash
from our operating activities was our net income, as adjusted to exclude the
effects of non-cash charges. Our 2009 net accounts receivable balance decreased
by $7.3 million as compared to 2008. Although we continue to offer 180-day
extended terms to our 3D printer resellers for demo units, we have seen a
continued reduction in our days sales outstanding (“DSO”) as a result of
increase collection efforts. DSO’s were 68 days in 2009, 78 days in 2008 and 86
days in 2007. We believe that adequate allowances have been established for any
collectibility issues in our accounts receivable balance.
For the years ended December 31, 2009,
2008, and 2007, our inventory balances were $14.6 million, $19.9 million, and
$12.8 million, respectively. The decrease in inventory from 2008 to 2009 was
principally due to increased focus on inventory management and lower overall
demand for our product. The increase from 2007 to 2008 was principally due to
last time buys for legacy systems, higher finished goods inventory required to
support the launch of new products in late 2008 and early 2009, and increased
consumable raw material inventory due to strategic buys and to support our
increasing installed base.
We have instituted better inventory
management, but recognize that we have opportunities to make considerably more
improvement in order to reduce overall inventory levels and improve turns. A
significant portion of our inventory is dedicated to the fulfillment of our
service contract and warranty obligations. As we have introduced new products
over the past few years, there are more platforms and models to service than in
the past, which increases the requirements to maintain spare parts inventory.
With the introduction of these new products, older products have been
discontinued, but a certain level of inventory is still required to fulfill our
ongoing service contracts. Our procedures for dealing with this inventory are
more fully explained in the section below captioned “Critical Accounting
Policies.”
Investments in sales-type leases provided
cash of $1.3 million in 2009 and used cash of $1.1 million in 2008 and $1.2
million in 2007. In mid-2003 we introduced a U.S. leasing program that was
principally designed for the Dimension systems. The program now includes
customers in both our 3D printer and our Fortus high-performance system product
lines and we plan to continue this leasing program for the foreseeable future.
30
Accounts payable and other current accrued liabilities provided cash of
$0.5 million and $5.6 million in 2009 and 2007, respectively, and used cash of
$2.1 million in 2008. In 2009, the increase was related to the timing of
payments for inventory purchases and employee compensation.
Unearned revenue, principally consisting
of purchased maintenance contracts and implied maintenance contracts, used cash
of $2.1 million in 2009 and provided cash of $1.8 million in 2008 and $1.1
million in 2007. The decrease in the unearned revenue balance in 2009 was due to
an increase in warranty periods from 90 days to one year for domestic Fortus
systems, thereby reducing the amount of the original sale price that is deferred
as an implied maintenance contract.
Our investing activities used cash of
$6.8 million in 2009 and $23.8 million in 2007 and provided cash of $13.3
million in 2008. In 2009, the purchase of investments, net of proceeds from
sales of investments, used cash of $2.9 million. In 2008, the sale of
investments provided approximately $23.9 million in cash from investing
activities, whereas purchases of investments, net of proceeds, utilized cash of
approximately $10.0 million in 2007.
At December 31, 2009, our investments
included:
- approximately $9.2 million in
municipal government bonds maturing between April 2010 and February 2026, all
of which had ratings between Aa2 and Baa1 at December 31,
2009;
- approximately $9.9 million in certificates of deposit
maturing between February 2010 and February 2011.
- approximately $2.4 million of a tax-free ARS, which
re-prices approximately every 35 days. The ARS had a rating of A1 at December
31, 2009; and
- approximately $1.1 million of a tax-free ARS, which does not currently have an active trading market and matures in February 2042. This ARS had a rating of Caa3 at December 31, 2009 and is further explained below.
The balance sheet caption titled “Long-term investments – available for
sale securities” consisted of approximately $1.1 million of a tax-free ARS. This
balance represents the current estimated fair value of an ARS issued by
Jefferson County, Alabama with a face value of $2.6 million. The investment is
part of a multi-billion series of bonds issued by Jefferson County to build its
sewer and water treatment system (“system”). The County entered into interest
rate swaps to protect itself from rising interest rates, but the swaps proved
ineffective and the revenue from the system will not adequately support the
higher interest rates. The bond is insured by Financial Guaranty Insurance
Company (“FGIC”) and matures in 2042. However, with the collapse of the ARS
market, the weakened financial condition of FGIC, and the County’s financial
condition, the rating of this ARS has gone from Aaa to Caa3. We have received
$25,000 in principal payments on this ARS and no additional principal payments
have become due. We have received all scheduled interest payments on this ARS
through December 31, 2009. Due to the current financial condition of the County
and the absence of an active market for this security, we only record interest
income as cash payments are received.
With the assistance of outside consultants, we have reviewed this ARS,
including expected cash flows, assessed the credit risk, analyzed and
extrapolated yield information on comparable composites, and reviewed
independent research from various public sources concerning the ARS market. From
that assessment, we concluded that during 2008 it had incurred both a temporary
and other-than-temporary impairment and recognized impairments of $195,000 and
$1,270,750, respectively. Based upon a reevaluation that occurred in late 2009,
a portion of the temporary impairment is now considered other-than-temporary and
an additional portion of the net carrying amount has also been considered as
impaired on an other-than-temporary basis.
At December 31, 2009, we recorded a $350,000 impairment related to a $1.4
million equity investment that is accounted for under the cost method as
prescribed by ASC Topic 325-20 “Cost Method Investments”. During the fourth
quarter, we considered the entity’s current and projected decreases in revenue
to be an impairment indicator and consequently performed a fair value analysis.
The resulting impairment of $350,000 was considered to be other-than-temporary
and was recognized as a charge to other income.
31
Property and equipment acquisitions totaled $2.3 million, $8.5 million,
and $10.2 million in 2009, 2008, and 2007, respectively. Over the three-year
period ended December 31, 2009, our principal property and equipment
acquisitions were for manufacturing or engineering development equipment,
tooling, leasehold improvements, and the acquisition of computer systems and
software applications. Payments for intangible assets, including patents and
capitalized software, amounted to $1.7 million, $2.4 million and $3.7 million in
2009, 2008, and 2007, respectively.
Proceeds from the exercise of stock
options provided cash of $1.6 million, $3.2 million and $8.5 million in 2009,
2008 and 2007, respectively. Financing activity included the repurchase of
1,089,575 shares of common stock for $19.1 million during the year ended
December 31, 2008. There were no common stock repurchases during the years ended
December 31, 2009 and 2007. As of December 31, 2009, the Company has
authorization to repurchase approximately $10.9 million of additional common
stock.
For 2010, we expect to use our cash as
follows;
- for improvements to our
facilities;
- for the continuation of our
leasing program;
- for working capital
purposes;
- for information systems and
infrastructure enhancements;
- for new product and materials
development;
- for sustaining
engineering;
- for the acquisition of equipment,
including production equipment, tooling, and computers;
- for the purchase or development of
intangible assets, including patents;
- for increased selling and
marketing activities, especially as they relate to the continued market and
channel development;
- for acquisitions and/or strategic
alliances; and
- for our common stock buyback program.
While we believe that the primary source
of liquidity during 2010 will be derived from current cash balances and cash
flows from operations, we have maintained a line of credit from a financial
institution of $1.0 million as of December 31, 2009. The credit line bears
interest at defined rates based upon two different indexes and expires in July,
2010. To date, we have not borrowed against this credit facility, but we do
expect to renew upon expiration.
Our total current assets amounted to
$106.4 million at December 31, 2009, most of which consisted of cash and cash
equivalents, investments, inventories and accounts receivable. Total current
liabilities amounted to $23.6 million and we have no debt. We estimate that we
will spend between approximately $8.0 million and $10.0 million in 2010 for
property and equipment. We also estimate that as of December 31, 2009, we had
approximately $13.6 million of purchase commitments for inventory from selected
vendors. In addition to purchase commitments for inventory, we have future
commitments for leased facilities. We intend to finance our purchase commitments
from existing cash or from cash flows from operations. The future contractual
cash obligations related to these commitments are as follows:
| Year ending December 31, | Facilities | Inventory | Total | ||||||
| 2010 | $ | 585,000 | $ | 13,557,000 | $ | 14,142,000 | |||
| 2011 | 470,000 | - | 470,000 | ||||||
| 2012 | 130,000 | - | 130,000 | ||||||
| $ | 1,185,000 | $ | 13,557,000 | $ | 14,742,000 | ||||
We have no contractual obligations beyond
2012. In addition to the above disclosed contractual obligations, the reserve
for tax contingencies was $1.2 million at December 31, 2009. Based on the
uncertainties associated with the settlement of these items, we are unable to
make reasonably reliable estimates of the period of potential settlements, if
any, with taxing authorities.
32
Inflation
We believe that inflation has not
had a material effect on our operations or on our financial condition during the
three most recent fiscal years.
Foreign Currency Transactions
We invoice sales to certain European distributors in Euros and reported
results are therefore subject to fluctuations in the exchange rates of that
currency in relation to the United States dollar. Our strategy is to hedge most
of our Euro-denominated accounts receivable positions by entering into 30-day
foreign currency forward contracts on a month-to-month basis to reduce the risk
that our earnings will be adversely affected by changes in currency exchange
rates. We do not use derivative financial instruments for speculative or trading
purposes. We enter into 30-day foreign currency forward contracts on the last
day of each month and therefore the notional value of the contract equals the
fair value at the end of the reporting period. As such, there is no related
asset or liability or unrealized gains or losses recorded on the Balance Sheet
as of the end of the period. All realized gains and losses related to hedging
activities are recorded in current period earnings under the Statement of
Operations caption “Foreign currency transaction losses, net”.
We hedged between €2.8 million and €5.0 million during the year ended
December 31, 2009 and between €2.5 million and €5.1 million during the year
ended December 31, 2008 related to accounts receivable that were denominated in
Euros. The foreign currency forward contracts resulted in a currency transaction
loss of approximately $115,000 for the year ended December 31, 2009 and a gain
of approximately $235,000 for the year ended December 31, 2008.
We will continue to monitor exposure to currency fluctuations.
Instruments that may be used to hedge future risks may include foreign currency
forward, swap, and option contracts. These instruments may be used to
selectively manage risks, but there can be no assurance that we will be fully
protected against material foreign currency fluctuations.
Critical Accounting Policies
We have prepared our consolidated
financial statements and related disclosures in conformity with accounting
principles generally accepted in the United States of America. This has required
us to make estimates, judgments, and assumptions that affected the amounts we
reported. Note 1 of Notes to Consolidated Financial Statements contains the
significant accounting principles that we used to prepare our consolidated
financial statements.
We have identified several critical
accounting policies that required us to make assumptions about matters that were
uncertain at the time of our estimates. Had we used different estimates and
assumptions, the amounts we recorded could have been significantly different.
Additionally, if we had used different assumptions or different conditions
existed, our financial condition or results of operations could have been
materially different. The critical accounting policies that were affected by the
estimates, assumptions, and judgments used in the preparation of our
consolidated financial statements are listed below.
Revenue Recognition
We derive revenue from sales of 3D printing, rapid prototyping (“RP”) and
direct digital manufacturing (“DDM”) systems, consumables, and services. We
recognize revenue when (1) persuasive evidence of a final agreement exists, (2)
delivery has occurred or services have been rendered, (3) the selling price is
fixed or determinable, and (4) collectibility is reasonably assured. Our
standard terms are FOB shipping point, and as such most of the revenue from the
sale of RP machines and consumables is recognized when shipped. Exceptions to
this policy occur only if a customer’s purchase order indicates an alternative
term or provides that the equipment sold would be subject to certain
contingencies, such as formal acceptance. In these instances, revenues would be
recognized only upon satisfying the conditions established by the customer as
contained in its purchase order to us. Revenue from sales-type leases for our
high-performance systems is recognized at the time of lessee acceptance, which
follows installation. Revenue from sales-type leases for our Dimension systems
is recognized at the time of shipment, since either the customer or the reseller
performs the installation. We recognize revenue from sales-type leases at the
net present value of future lease payments. Revenue from operating leases is
recognized ratably over the lease period.
33
We derive service revenue from sales of maintenance contracts,
installation services, training, and our RedEye paid parts service. Service
revenue from maintenance contracts is recognized ratably over the term of the
contract, typically one to two years. We offer warranty periods ranging from 90
days to one year. On certain sales that require a one-year warranty, the
extended warranty is treated for revenue recognition purposes as a maintenance
agreement. The fair value of this maintenance agreement is deferred and
recognized ratably over the period of the extended warranty as an implied
maintenance contract. Installation service revenues are recognized upon
completion of the installation. Training revenues are recognized upon completion
of the training.
In accordance with ASC 605, Revenue Recognition, when two or more product offerings are contained in a single
arrangement, revenue is allocated between the elements based on their relative
fair value, provided that each element meets the criteria for treatment as a
separate unit of accounting. An item is considered a separate unit of accounting
if it has value to the customer on a stand-alone basis and there is objective
and reliable evidence of the fair value of the undelivered items. Fair value is
generally determined based upon the price charged when the element is sold
separately. In the absence of fair value for a delivered element, revenue is
allocated first to the fair value of the undelivered elements and then the
residual revenue is allocated to the delivered elements. In the absence of fair
value for an undelivered element, the arrangement is accounted for as a single
unit of accounting, resulting in a delay of revenue recognition for the
delivered elements until all undelivered elements have been fulfilled.
Revenues from training and installation are unbundled and are recognized
after the services have been performed. Most of our products are sold through
distribution channels, with training and installation services offered by the
resellers. We do not offer training or installation for our Dimension products.
The equipment that we manufacture and sell is subject to factory testing that
replicates the conditions under which the customers intend to use the equipment.
All of the systems are sold subject to published specifications, and all systems
sales involve standard models.
We assess collectibility as part of the revenue recognition process. This
assessment includes a number of factors such as an evaluation of the
creditworthiness of the customer, past payment history, and current economic
conditions. If it is determined that collectibility cannot be reasonably
assured, we will decline shipment, request a down payment, or defer recognition
of revenue until ultimate collectibility is reasonably assured.
We also record a provision for estimated product returns and allowances
in the period in which the related revenue is recorded. This provision against
current gross revenue is based principally on historical rates of sales returns,
but also factors in changes in the customer base, geographic economic
conditions, and changes in the financial conditions of our customers. There was
no provision for product returns and allowances at December 31, 2009 and the
provision for product returns and allowances was approximately $122,000 as of
December 31, 2008.
Stock-Based Compensation
We calculate the fair value of stock-based option awards on the date of
grant using the Black-Scholes option pricing model. The computation of expected
volatility is based on historical volatility from traded options on our stock.
The expected option term is calculated in accordance with ASC 718, Compensation – Stock Compensation. The interest rate for periods within the
contractual life of the award is based on the U.S. Treasury yield curve in
effect at the time of grant. Each of the three factors requires us to use
judgment and make estimates in determining the percentages and time periods used
for the calculation. If we were to use different percentages or time periods,
the fair value of stock-based option awards could be materially different.
Allowance for Doubtful Accounts
While we evaluate the collectibility
of a sale as part of our revenue recognition process, we must also make
judgments regarding the ultimate realization of our accounts receivable. A
considerable amount of judgment is required in assessing the realization of
these receivables, including the aging of the receivables and the
creditworthiness of each customer. We may not be able to accurately and timely
predict changes to a customer’s financial condition. If a customer’s financial
condition should suddenly deteriorate, calling into question our ability to
collect the receivable, our estimates of the realization of our receivables
could be adversely affected. We might then have to record additional allowances
for doubtful accounts, which could have an adverse effect on our results of
operations in the period affected.
34
Our allowance for doubtful accounts is adjusted quarterly using two
methods. First, our overall reserves are based on a percentage applied to
certain aged receivable categories that are predominately based on historical
bad debt write-off experience. Then, we make an additional evaluation of overdue
customer accounts, for which we specifically reserve. In our evaluation we use a
variety of factors, such as past payment history, the current financial
condition of the customer, and current economic conditions. We also evaluate our
overall concentration risk, which assesses the total amount owed by each
customer, regardless of its current status. As of December 31, 2009 and 2008,
our allowance for doubtful accounts amounted to $0.9 and $1.0 million,
respectively. The decrease in the reserve was primarily due to increased
collection efforts and a maturing reseller network.
Inventories
Our inventories are recorded at the lower
of cost or market, with cost based on a first-in, first-out basis. We
periodically assess this inventory for obsolescence and potential excess by
reducing the difference between our cost and the estimated market value of the
inventory based on assumptions about future demand and historical sales
patterns. Our inventories consist of materials and products that are subject to
technological obsolescence and competitive market conditions. If market
conditions or future demand are less favorable than our current expectations,
additional inventory write downs or reserves may be required, which could have
an adverse effect on our reported results in the period the adjustments are
made. Additionally, engineering or field change orders (“ECO” and “FCO”,
respectively) introduced by our engineering group could suddenly create
extensive obsolete and/or excess inventory. Although our engineering group
considers the estimated effect that an ECO or FCO would have on our inventories,
a mandated ECO or FCO could have an immediate adverse affect on our reported
financial condition if it they required the use of different materials in either
new production or our service inventory.
Some of our inventory is returned to us
by our customers and refurbished. This refurbished inventory, once fully
repaired and tested, is functionally equivalent to new production and is
utilized to satisfy many of our requirements under our warranty and service
contracts. Upon receipt of the returned material, this inventory is recorded at
a discount from original cost, and further reduced by estimated future
refurbishment expense. While we evaluate this service material in the same way
as our stock inventory (i.e., we periodically test for obsolescence and excess),
this inventory is subject to changing demand that may not be immediately
apparent. Adjustments to this service inventory, following an obsolescence or
excess review, could have an adverse effect on our reported financial condition
in the period when the adjustments are made. We review the requirements for
service inventory for discontinued products using the number of active
maintenance contracts per product line as the key determinant for inventory
levels and composition. A sudden decline in the number of customers renewing
service agreements in a particular period could lead to an unanticipated write
down of this service inventory for a particular product line.
Intangible Assets
Intangible assets are capitalized and amortized over their estimated
useful or economic lives using the straight-line method in conformity with ASC
350, Intangibles – Goodwill and Other, as follows:
| RP technology | 11 years | |
| Capitalized software development costs | 3 years | |
| Patents | 10 years | |
| Trademarks | 5 years |
The costs of software development, including significant product
enhancements, incurred subsequent to establishing technological feasibility have
been capitalized in accordance with ASC 985-20, Costs of Software to be Sold, Leased or Marketed. Costs incurred prior to establishment of
technological feasibility are charged to research and development
expense.
Income Taxes
We comply with ASC 740, Income Taxes, which
requires an asset and liability approach to financial reporting of income taxes.
Deferred income tax assets and liabilities are computed for differences between
the financial statement and tax basis of assets and liabilities that will result
in taxable or deductible amounts in the future, based on enacted tax laws and
rates applicable to the periods in which the differences are expected to affect
taxable income. Valuation allowances are established, when necessary, to reduce
the deferred income tax assets to the amount expected to be realized.
35
In accordance with ASC 740, Income Taxes, we
take a two-step approach to recognizing and measuring uncertain tax positions
(tax contingencies). The first step is to evaluate the tax position for
recognition by determining if the weight of available evidence indicates it is
more likely than not that the position will be sustained on audit, including
resolution of related appeals or litigation processes, if any. The second step
is to measure the tax benefit as the largest amount which is more than 50%
likely of being realized upon ultimate settlement. We reevaluate these tax
positions quarterly and make adjustments as required.
Impairment of Long-Lived Assets
We adhere to ASC 360, Property, Plant, and Equipment, and annually assess the recoverability of
the carrying amounts of long-lived assets, including intangible assets, at
year-end. An impairment loss would be recognized if expected undiscounted future
cash flows are less than the carrying amount of the asset. This loss would be
determined by calculating the difference by which the carrying amount of the
asset exceeds its fair value. Based on our assessment as of December 31, 2009,
no long-lived assets were determined to be impaired.
Recently Issued Accounting Pronouncements
In June 2009, the Financial Accounting Standards Board (“FASB”) issued a
standard that established the FASB Accounting Standards CodificationTM (“ASC”) and amended the hierarchy of
accounting principles generally accepted in the United States of America (U.S.
GAAP) such that the ASC became the single source of authoritative
nongovernmental U.S. GAAP. The ASC did not change current U.S. GAAP, but was
intended to simplify user access to all authoritative U.S. GAAP by providing all
the authoritative literature related to a particular topic in one place. All
previously existing accounting standard documents were superseded and all other
accounting literature not included in the ASC is considered non-authoritative.
New accounting standards issued subsequent to June 30, 2009 are communicated by
the FASB through Accounting Standards Updates (“ASUs”). This standard did not
have an impact on our consolidated results of operations or financial condition.
However, throughout the notes to the consolidated financial statements
references that were previously made to various former authoritative U.S. GAAP
pronouncements have been changed to coincide with the appropriate section of the
ASC.
In October 2009, the FASB issued ASU No. 2009-13, Multiple-Deliverable Revenue Arrangements—a consensus of the FASB
Emerging Issues Task Force, that provides amendments to the criteria for separating consideration in
multiple-deliverable arrangements. As a result of these amendments,
multiple-deliverable revenue arrangements will be separated in more
circumstances than under existing U.S. GAAP. The ASU does this by establishing a
selling price hierarchy for determining the selling price of a deliverable. The
selling price used for each deliverable will be based on vendor-specific
objective evidence (“VSOE”) if available, third-party evidence if VSOE is not
available, or estimated selling price if neither VSOE nor third-party evidence
is available. A vendor will be required to determine its best estimate of
selling price in a manner that is consistent with that used to determine the
price to sell the deliverable on a standalone basis. This ASU also eliminates
the residual method of allocation and will require that arrangement
consideration be allocated at the inception of the arrangement to all
deliverables using the relative selling price method, which allocates any
discount in the overall arrangement proportionally to each deliverable based on
its relative selling price. Expanded disclosures of qualitative and quantitative
information regarding application of the multiple-deliverable revenue
arrangement guidance are also required under the ASU. The ASU does not apply to
arrangements for which industry specific allocation and measurement guidance
exists, such as long-term construction contracts and software transactions. ASU
No. 2009-13 is effective for us beginning January 1, 2011. We are currently
evaluating the impact of this standard on the consolidated results of operations
and financial condition.
In May 2009, the FASB issued a new accounting standard regarding
subsequent events. This standard incorporates into authoritative accounting
literature certain guidance that already existed within generally accepted
auditing standards, with the requirements concerning recognition and disclosure
of subsequent events remaining essentially unchanged. This guidance addresses
events which occur after the balance sheet date but before the issuance of
financial statements. Under the new standard, as under previous practice, an
entity must record the effects of subsequent events that provide evidence about
conditions that existed at the balance sheet date and must disclose but not
record the effects of subsequent events which provide evidence about conditions
that did not exist at the balance sheet date. The guidance was effective for
fiscal years and interim periods ended after June 15, 2009. We have evaluated
any subsequent events through the date of this filing.
36
In April 2009, the FASB issued an accounting standard which provides
guidance on (1) estimating the fair value of an asset or liability when the
volume and level of activity for the asset or liability have significantly
declined; and (2) identifying transactions that are not orderly. The standard
also amended certain disclosure provisions for fair value measurements and
disclosures in ASC 820, Fair Value Measurements and Disclosures, to require, among other things, disclosures
in interim periods of the inputs and valuation techniques used to measure fair
value as well as disclosure of the hierarchy of the source of underlying fair
value information on a disaggregated basis by specific major category of
investment. This standard was effective for us prospectively beginning April 1,
2009. The adoption of this standard did not have a material impact on our
consolidated results of operations or financial condition.
In April 2009, the FASB issued an accounting standard which modifies the
requirements for recognizing other-than-temporarily impaired debt securities and
changes the existing impairment model for such securities. The standard also
requires additional disclosures for both annual and interim periods with respect
to both debt and equity securities. Under the standard, impairment of debt
securities will be considered other-than-temporary if an entity (1) intends to
sell the security, (2) more likely than not will be required to sell the
security before recovering its cost, or (3) does not expect to recover the
security’s entire amortized cost basis (even if the entity does not intend to
sell). The standard further indicates that, depending on which of the above
factor(s) causes the impairment to be considered other-than-temporary, (1) the
entire shortfall of the security’s fair value versus its amortized cost basis or
(2) only the credit loss portion would be recognized in earnings while the
remaining shortfall (if any) would be recorded in other comprehensive income.
The standard requires entities to initially apply its provisions to previously
other-than-temporarily impaired debt securities existing as of the date of
initial adoption by making a cumulative-effect adjustment to the opening balance
of retained earnings in the period of adoption. The cumulative-effect adjustment
potentially reclassifies the noncredit portion of a previously
other-than-temporarily impaired debt security held as of the date of initial
adoption from retained earnings to accumulated other comprehensive income. This
standard was effective for us beginning April 1, 2009. The adoption of this
standard did not have a material impact on our consolidated results of
operations or financial condition.
In April 2009, the FASB issued an accounting standard regarding interim
disclosures about fair value of financial instruments. The standard essentially
expands the disclosure about fair value of financial instruments that was
previously required only annually to also be required for interim period
reporting. In addition, the standard requires certain additional disclosures
regarding the methods and significant assumptions used to estimate the fair
value of financial instruments. This standard was effective for us beginning
April 1, 2009 on a prospective basis. The adoption of this standard did not have
a material impact on our consolidated results of operations or financial
condition.
In April 2008, the FASB issued an accounting standard which amended the
list of factors an entity should consider in developing renewal or extension
assumptions used in determining the useful life of recognized intangible assets
under ASC 350, Intangibles - Goodwill and
Other. This new standard
applies to (1) intangible assets that are acquired individually or with a group
of other assets; and (2) intangible assets acquired in both business
combinations and asset acquisitions. Under this standard, entities estimating
the useful life of a recognized intangible asset must consider their historical
experience in renewing or extending similar arrangements or, in the absence of
historical experience, must consider assumptions that market participants would
use about renewals or extensions. The guidance was effective for us beginning
January 1, 2009 and did not have a material impact on the consolidated results
of operations or financial condition.
In March 2008, the FASB issued an accounting standard related to
disclosures about derivative instruments and hedging activities in ASC 815,
Derivatives and Hedging, which requires additional disclosures about
an entity’s strategies and objectives for using derivative instruments, the
location and amounts of derivative instruments in an entity’s financial
statements, how derivative instruments and related hedged items are accounted
for under ASC 815 and how derivative instruments and related hedged items affect
its financial position, financial performance, and cash flows. Certain
disclosures are also required with respect to derivative features that are
credit risk related. The standard was effective for us beginning January 1, 2009
on a prospective basis. The adoption of this standard did not have a material
impact on our consolidated results of operations or financial
condition.
37
In December 2007, the FASB ratified a standard related to accounting for
collaborative arrangements which discusses how parties to a collaborative
arrangement (that does not establish a legal entity within such arrangement)
should account for various activities. The standard indicates that costs
incurred and revenues generated from transactions with third parties (i.e.
parties outside of the collaborative arrangement) should be reported by the
collaborators on the respective line items in their income statements
pursuant to ASC 605-45, Principal Agent Considerations. Additionally, the guidance provides that
income statement characterization of payments between the participants in a
collaborative arrangement should be based upon existing authoritative standards,
analogy to such standards if not within their scope, or a reasonable, rational,
and consistently applied accounting policy election. The guidance was effective
for us beginning January 1, 2009 and was required to be applied retrospectively
to all periods presented for collaborative arrangements that existed as of the
date of adoption. This adoption did not have a material impact on the
consolidated results of operations or financial condition and the required
disclosures are provided in Note 14 – Accounting for Collaborative Arrangements.
In September 2006, the FASB issued an accounting standard codified in ASC
820, Fair Value Measurements and
Disclosures. This standard
established a single definition of fair value and a framework for measuring fair
value, set out a fair value hierarchy to be used to classify the source of
information used in fair value measurements and required disclosures of assets
and liabilities measured at fair value based on their level in the hierarchy.
This standard applies under other accounting standards that require or permit
fair value measurements. The Company adopted the standard as amended by
subsequent FASB standards beginning January 1, 2008 on a prospective basis. One
of the amendments deferred the effective date for one year relative to
nonfinancial assets and liabilities that are measured at fair value, but are
recognized or disclosed at fair value on a nonrecurring basis. This deferral
applied to such items as nonfinancial assets and liabilities initially measured
at fair value in a business combination (but not measured at fair value in
subsequent periods) or nonfinancial long-lived asset groups measured at fair
value for an impairment assessment. We adopted these remaining aspects of the
fair value measurement standard prospectively beginning January 1, 2009. This
adoption did not have a material impact on our consolidated results of
operations or financial condition and the disclosures required by it are
provided in Note 11 – Fair Value Measurements.
38
Forward-looking Statements and Factors That
May Affect Future Results of Operations
All statements herein that are not
historical facts or that include such words as “expects”, “anticipates”,
“projects”, “estimates”, “vision”, “could”, “potential”, “planning” or
“believes” or similar words constitute forward-looking statements that we deem
to be covered by and to qualify for the safe harbor protection covered by the
Private Securities Litigation Reform Act of 1995 (the “1995 Act”). Investors and
prospective investors in our Company should understand that several factors
govern whether any forward-looking statement herein will be or can be achieved.
Any one of these factors could cause actual results to differ materially from
those projected herein.
These forward-looking statements
include the expected increases in net sales of RP, DDM, and 3D printing systems,
services and consumables, and our ability to maintain our gross margins on these
sales. The forward-looking statements include projected revenue and income in
future quarters; the size of the 3D printing market; our objectives for the
marketing and sale of our DimensionTM 3D printers and our FortusTM 3D Production Systems, particularly for use
in direct digital manufacturing (DDM); the demand for our proprietary
consumables; the expansion of our RedEye paid parts service; and our beliefs
with respect to the growth in the demand for our products. They include our
plans and objectives to introduce new products, to control expenses, to improve
the quality and reliability of our systems, to respond to new or existing
competitive products, and to improve profitability. The forward-looking
statements included herein are based on current expectations that involve a
number of risks and uncertainties, some of which are described in Item 1A, “Risk
Factors” above. These forward-looking statements are based on assumptions, among
others, that we will be able to:
- continue to introduce new
high-performance and 3D printing systems and materials acceptable to the
market, and to continue to improve our existing technology and software in our
current product offerings;
- successfully develop the 3D printing market with our
Dimension BST, Dimension SST, Dimension Elite, and uPrint systems, and that
the market will accept these systems;
- successfully develop the DDM market with our Fortus 360mc,
400mc and 900mc, and that the market will accept these
systems;
- maintain our revenues and gross margins on our present
products;
- control our operating expenses;
- expand our manufacturing capabilities to meet the expected
demand generated by our uPrint, Dimension BST, Dimension SST and Dimension
Elite systems, our consumable products and our Paid Parts
service;
- successfully commercialize new materials and gain market
acceptance for these new materials; and
- recruit, retain, and develop employees with the necessary skills to produce, create, commercialize, market, and sell our products.
Assumptions relating to the
foregoing involve judgments with respect to, among other things, future
economic, geo-political, competitive, market and technological conditions, and
future business decisions, all of which are difficult or impossible to predict
accurately and many of which are beyond our control. Although we believe that
the assumptions underlying the forward-looking statements contained herein are
reasonable, any of those assumptions could prove inaccurate, and therefore there
is and can be no assurance that the results contemplated in any such
forward-looking statement will be realized. The impact of actual experience and
business developments may cause us to alter our marketing plans, our capital
expenditure budgets, or our engineering, selling, manufacturing or other
budgets, which may in turn affect our results of operations or the success of
our new product development and introduction. We may not be able to alter our
plans or budgets in a timely manner, resulting in reduced profitability or
losses.
Due to the factors noted above and
elsewhere in this Management’s Discussion and Analysis of Financial Condition
and Results of Operations, our future earnings and stock price may be subject to
significant volatility, particularly on a quarterly basis. Additionally, we may
not learn of revenue or earnings shortfalls until late in a fiscal quarter,
since we frequently receive a significant number of orders very late in a
quarter. This could result in an immediate and adverse effect on the trading
price of our common stock. Past financial performance should not be considered a
reliable indicator of future performance, and investors should not use
historical trends to anticipate results or trends in future
periods.
39
Item 7A. Quantitative and Qualitative
Disclosures About Market Risk.
Interest Rate Risk
Our cash and cash equivalent investments are exclusively in short-term
money market and sweep instruments with maturities of less than 90 days. These
are subject to limited interest rate risk. A 10% change in interest rates would
not have a material effect on our financial condition or results of operations.
Our short- and long-term investments are invested in Auction Rate Securities and
municipal government bonds that bear interest at rates of 1.4% to 6.0%. An
immediate 10% change in interest rates would have no material effect on our
financial condition or results of operations.
Foreign Currency Exchange Rate Risk
We have not historically hedged sales from or expenses incurred by our
European operations that have a functional currency in Euros. Therefore, a
hypothetical 10% change in the exchange rates between the U.S. dollar and the
Euro could increase or decrease our income before taxes by less than $0.4
million for the continued maintenance of our European facility. We hedged
between €2.8 million and €5.0 million during the year ended December 31, 2009
and between €2.5 million and €5.1 million during the year ended December 31,
2008 of accounts receivable denominated in Euros. A hypothetical 10% change in
the exchange rates between the US dollar and the Euro could increase or decrease
income before taxes by between $0.7 million and $1.2 million.
Item 8. Financial Statements and Supplementary
Data.
This information appears following
Item 15 of this report and is incorporated herein by reference.
Item 9. Changes In and Disagreements With
Accountants on Accounting and Financial Disclosure.
None.
Item 9A. Controls and Procedures.
Disclosure Controls and Procedures
Under the supervision and with the
participation of our management, including our Chief Executive Officer and Chief
Financial Officer, we conducted an evaluation of the effectiveness of the design
and operation of our disclosure controls and procedures (as defined in Rules
13a-15(e) and 15d-15(e) under the Securities Exchange Act of 1934) as of the end
of the period covered by this report (the “Evaluation Date”). Based on this
evaluation, our Chief Executive Officer and Chief Financial Officer concluded as
of the Evaluation Date that our disclosure controls and procedures were
effective. Disclosure controls and procedures require that the information
relating to us required to be disclosed in our Securities and Exchange
Commission (“SEC”) reports (i) is recorded, processed, summarized and reported
within the time periods specified in SEC rules and forms, and (ii) is
accumulated and communicated to our management, including our Chief Executive
Officer and Chief Financial Officer, as appropriate to allow timely decisions
regarding required disclosure.
Internal Control over Financial Reporting
Under the supervision and with the
participation of our management, including our Chief Executive Officer and Chief
Financial Officer, we are responsible for establishing and maintaining an
effective system of internal control over financial reporting (as defined in
Rule 13a-15(f) and 15d-15(f) under the Securities Exchange Act of 1934). Our
management has conducted an assessment of our internal control over financial
reporting based on the framework established by the Committee of Sponsoring
Organizations of the Treadway Commission in Internal Control – Integrated
Framework. Our management has prepared an annual report on internal control over
financial reporting. Management’s report is included in this Annual Report on
Form 10-K on page F-3. In addition, Grant Thornton, LLP, our independent
registered public accounting firm, has prepared its report on the effectiveness
of our internal control over financial reporting and such report is included on
pages F-4 to F-5 of the consolidated financial statements.
40
Changes in Internal Control over Financial
Reporting
There have not been any changes in our internal control over financial
reporting identified in connection with the assessment that occurred during the
fourth quarter of 2009 that have materially affected, or are reasonably likely
to materially affect, our internal control over financial reporting. Our
management has prepared an annual report on internal control over financial
reporting.
Item 9B. Other Information.
None.
41
PART III
Item 10. Directors, Executive Officers and
Corporate Governance.
Incorporated herein by reference to our
Definitive Proxy Statement with respect to our Annual Meeting of Stockholders
scheduled to be held May 6, 2010.
Item 11. Executive
Compensation.
Incorporated herein by reference to our
Definitive Proxy Statement with respect to our Annual Meeting of Stockholders
scheduled to be held May 6, 2010.
Item 12. Security Ownership of Certain
Beneficial Owners and Management and Related Stockholder
Matters.
Incorporated herein by reference to our
Definitive Proxy Statement with respect to our Annual Meeting of Stockholders
scheduled to be held May 6, 2010.
Item 13. Certain Relationships and Related
Transactions, and Director Independence.
Incorporated herein by reference to our
Definitive Proxy Statement with respect to our Annual Meeting of Stockholders
scheduled to be held May 6, 2010.
Item 14. Principal Accountant Fees and
Services.
Incorporated herein by reference to our
Definitive Proxy Statement with respect to our Annual Meeting of Stockholders
scheduled to be held May 6, 2010.
42
PART IV
Item 15. Exhibits and Financial Statement
Schedules.
| (a) | Documents | ||
| 1. Financial Statements -- | |||
| Management’s Report on Internal Control Over Financial Reporting | F-3 | ||
| Reports of Independent Registered Public Accounting Firm | F-4 to F-6 | ||
| Consolidated Balance Sheets December 31, 2009 and 2008 | F-7 | ||
| Consolidated Statements of Operations Years Ended December 31, 2009, 2008 and 2007 | F-8 | ||
| Consolidated Statements of Changes in Stockholders’ Equity and Comprehensive | |||
| Income Years Ended December 31, 2009, 2008 and 2007 | F-9 | ||
| Consolidated Statements of Cash Flows Years Ended December 31, 2009, 2008 and 2007 | F-10 | ||
| Notes to Consolidated Financial Statements | F-11 to F-32 | ||
| 2. Financial Statement Schedule -- | |||
| Schedule II -- Valuation and Qualifying Accounts and Reserves | F-33 | ||
43
STRATASYS, INC. AND SUBSIDIARIES
CONSOLIDATED FINANCIAL
STATEMENTS
AND
REPORTS OF INDEPENDENT REGISTERED
PUBLIC ACCOUNTING FIRM
AND
REPORTS OF INDEPENDENT REGISTERED
PUBLIC ACCOUNTING FIRM
DECEMBER 31, 2009 AND
2008
F-1
CONTENTS
| Management’s Report on Internal Controls over Financial Reporting | F-3 |
| Reports of Independent Registered Public Accounting Firms | F-4-F-6 |
| Consolidated Financial Statements | |
| Balance Sheets | F-7 |
| Statements of Operations | F-8 |
| Statements of Changes in Stockholders' Equity and Comprehensive Income | F-9 |
| Statements of Cash Flows | F-10 |
| Notes to Financial Statements | F-11-F-32 |
| Schedule II - Valuation and Qualifying Accounts and Reserves | F-33 |
F-2
MANAGEMENT’S RESPONSIBILITY FOR FINANCIAL
REPORTING
Management of the Company is responsible for establishing and maintaining
adequate internal control over financial reporting (as such term is defined in
Rule 13a-15(f) under the Securities Exchange Act of 1934). The Company’s
internal control over financial reporting includes those policies and procedures
that (i) pertain to the maintenance of records that, in reasonable detail,
accurately and fairly reflect the transactions and dispositions of the assets of
the Company; (ii) provide reasonable assurance that transactions are recorded as
necessary to permit preparation of financial statements in accordance with
accounting principles generally accepted in the United States, and that receipts
and expenditures of the Company are being made only in accordance with
authorizations of management and directors of the Company; and (iii) provide
reasonable assurance regarding prevention or timely detection of unauthorized
acquisition, use, or disposition of the Company’s assets that could have a
material effect on the financial statements.
Internal control over financial reporting is designed to provide
reasonable assurance to the Company’s management and board of directors
regarding the preparation of reliable financial statements for external purposes
in accordance with accounting principles generally accepted in the United
States. Internal control over financial reporting includes self-monitoring
mechanisms and actions taken to correct deficiencies as they are identified.
Because of the inherent limitations in any internal control, no matter how well
designed, misstatements may occur and not be prevented or detected. Accordingly,
even effective internal control over financial reporting can provide only
reasonable assurance with respect to financial statement preparation. Further,
the evaluation of the effectiveness of internal control over financial reporting
was made as of a specific date, and continued effectiveness in future periods is
subject to the risks that controls may become inadequate because of changes in
conditions or that the degree of compliance with the policies and procedures may
decline.
MANAGEMENT’S REPORT ON INTERNAL CONTROLS OVER
FINANCIAL REPORTING
Management conducted an evaluation of the effectiveness of the Company’s
system of internal control over financial reporting as of December 31, 2009
based on the framework set forth in “Internal Control — Integrated Framework”
issued by the Committee of Sponsoring Organizations of the Treadway Commission.
Based on its evaluation, management concluded that, as of December 31, 2009, the
Company’s internal control over financial reporting was effective.
| /s/ S. SCOTT CRUMP |
| S. Scott Crump |
| Chief Executive Officer |
| /s/ ROBERT F. GALLAGHER |
| Robert F. Gallagher |
| Chief Financial Officer |
| Date: March 8, 2010 |
F-3
REPORT OF INDEPENDENT REGISTERED PUBLIC
ACCOUNTING FIRM
Board of Directors and
Shareholders
Stratasys, Inc.
Stratasys, Inc.
We have audited the
accompanying consolidated balance sheets of Stratasys, Inc. (a Delaware
Corporation) and subsidiaries (collectively, the “Company”) as of December 31,
2009 and 2008, and the related consolidated statements of operations,
stockholders’ equity and comprehensive income, and cash flows for each of the
three years in the period ended December 31, 2009. Our audits of the basic
financial statements included the financial statement schedule listed in the
index appearing under Item 15. These financial statements and financial
statement schedule are the responsibility of the Company’s management. Our
responsibility is to express an opinion on these financial statements and
financial schedule based on our audits.
We conducted our audits
in accordance with the standards of the Public Company Accounting Oversight
Board (United States). Those standards require that we plan and perform the
audit to obtain reasonable assurance about whether the financial statements are
free of material misstatement. An audit includes examining, on a test basis,
evidence supporting the amounts and disclosures in the financial statements. An
audit also includes assessing the accounting principles used and significant
estimates made by management, as well as evaluating the overall financial
statement presentation. We believe that our audit provides a reasonable basis
for our opinion.
In our opinion, the
consolidated financial statements referred to above present fairly, in all
material respects, the financial position of Stratasys, Inc. and subsidiaries as
of December 31, 2009 and 2008, and the results of their operations and their
cash flows for each of the three years in the period ended December 31, 2009 in
conformity with accounting principles generally accepted in the United States of
America. Also in our opinion, the related financial statement schedule, when
considered in relation to the basic financial statements taken as a whole,
presents fairly, in all material respects, the information set forth therein.
We also have audited, in
accordance with the standards of the Public Company Accounting Oversight Board
(United States), Stratasys, Inc.’s internal control over financial reporting as
of December 31, 2009, based on criteria established in Internal Control—Integrated Framework issued by the Committee of Sponsoring
Organizations of the Treadway Commission (COSO) and our report dated March __,
2010 expressed an unqualified opinion on the effectiveness of the Company’s
internal control over financial reporting.
| /s/ GRANT THORNTON LLP |
| Minneapolis, Minnesota |
| March 8, 2010 |
F-4
REPORT OF INDEPENDENT REGISTERED PUBLIC
ACCOUNTING FIRM
Board of Directors and
Shareholders
Stratasys, Inc.
Stratasys, Inc.
We have audited
Stratasys, Inc. (a Delaware Corporation) and subsidiaries (collectively, the
“Company”) internal control over financial reporting as of December 31, 2009,
based on criteria established in Internal Control—Integrated Framework issued by the Committee of Sponsoring
Organizations of the Treadway Commission (“COSO”). The Company’s management is
responsible for maintaining effective internal control over financial reporting
and for its assessment of the effectiveness of internal control over financial
reporting, included in the accompanying Management’s Report on Internal Control
over Financial Reporting. Our responsibility is to express an opinion on
Stratasys, Inc.’s internal control over financial reporting based on our audit.
We conducted our audit
in accordance with the standards of the Public Company Accounting Oversight
Board (United States). Those standards require that we plan and perform the
audit to obtain reasonable assurance about whether effective internal control
over financial reporting was maintained in all material respects. Our audit
included obtaining an understanding of internal control over financial
reporting, assessing the risk that a material weakness exists, testing and
evaluating the design and operating effectiveness of internal control based on
the assessed risk, and performing such other procedures as we considered
necessary in the circumstances. We believe that our audit provides a reasonable
basis for our opinion.
A company’s internal
control over financial reporting is a process designed to provide reasonable
assurance regarding the reliability of financial reporting and the preparation
of financial statements for external purposes in accordance with generally
accepted accounting principles. A company’s internal control over financial
reporting includes those policies and procedures that (1) pertain to the
maintenance of records that, in reasonable detail, accurately and fairly reflect
the transactions and dispositions of the assets of the company; (2) provide
reasonable assurance that transactions are recorded as necessary to permit
preparation of financial statements in accordance with generally accepted
accounting principles, and that receipts and expenditures of the company are
being made only in accordance with authorizations of management and directors of
the company; and (3) provide reasonable assurance regarding prevention or timely
detection of unauthorized acquisition, use, or disposition of the company’s
assets that could have a material effect on the financial statements.
Because of its inherent
limitations, internal control over financial reporting may not prevent or detect
misstatements. Also, projections of any evaluation of effectiveness to future
periods are subject to the risk that controls may become inadequate because of
changes in conditions, or that the degree of compliance with the policies or
procedures may deteriorate.
In our opinion,
Stratasys, Inc. maintained, in all material respects, effective internal control
over financial reporting as of December 31, 2009, based on criteria established
in Internal Control – Integrated
Framework issued by COSO.
F-5
We also have audited, in
accordance with the standards of the Public Company Accounting Oversight Board
(United States), the consolidated balance sheets of Stratasys, Inc. and
subsidiaries as of December 31, 2009 and 2008, and the related consolidated
statements of operations, changes in stockholders’ equity and comprehensive
income, and cash flows for each of the three years in the period ended December
31, 2009, and our report dated March __, 2010 expressed an unqualified opinion
on those financial statements.
| /s/ GRANT THORNTON LLP |
| Minneapolis, Minnesota |
| March 8, 2010 |
F-6
STRATASYS, INC. AND
SUBSIDIARIES
CONSOLIDATED FINANCIAL STATEMENTS
CONSOLIDATED FINANCIAL STATEMENTS
| Consolidated Balance Sheets | ||||||||
| December 31, | 2009 | 2008 | ||||||
| ASSETS | ||||||||
| Current assets | ||||||||
| Cash and cash equivalents | $ | 48,315,926 | $ | 27,945,799 | ||||
| Short-term investments - held to maturity | 16,073,718 | 4,835,055 | ||||||
| Accounts receivable, less allowance for doubtful | ||||||||
| accounts of $903,101 at December 31, 2009 | ||||||||
| and $1,017,521 at December 31, 2008 | 19,249,813 | 26,539,733 | ||||||
| Inventories | 14,608,014 | 19,889,351 | ||||||
| Net investment in sales-type leases, less allowance | ||||||||
| for doubtful accounts of $222,011 at December 31, | ||||||||
| 2009 and $324,642 at December 31, 2008 | 3,618,876 | 3,870,472 | ||||||
| Prepaid expenses and other current assets | 2,247,612 | 2,608,080 | ||||||
| Deferred income taxes | 2,277,000 | 2,168,000 | ||||||
| Total current assets | 106,390,959 | 87,856,490 | ||||||
| Property and equipment, net | 26,326,012 | 29,749,921 | ||||||
| Other assets | ||||||||
| Intangible assets, net | 7,653,269 | 8,347,200 | ||||||
| Net investment in sales-type leases | 3,477,039 | 4,545,977 | ||||||
| Deferred income taxes | 688,000 | - | ||||||
| Long-term investments - available for sale | 1,055,750 | 1,109,250 | ||||||
| Long-term investments - held to maturity | 5,467,318 | 13,825,981 | ||||||
| Other non-current assets | 2,078,165 | 2,308,214 | ||||||
| Total other assets | 20,419,541 | 30,136,622 | ||||||
| Total assets | $ | 153,136,512 | $ | 147,743,033 | ||||
| LIABILITIES AND STOCKHOLDERS' EQUITY | ||||||||
| Current liabilities | ||||||||
| Accounts payable and other current liabilities | $ | 12,874,798 | $ | 11,795,238 | ||||
| Unearned revenues | 10,678,427 | 12,765,396 | ||||||
| Total current liabilities | 23,553,225 | 24,560,634 | ||||||
| Non-current liabilities | ||||||||
| Deferred tax liabilities | - | 620,000 | ||||||
| Total non-current liabilities | - | 620,000 | ||||||
| Total liabilities | 23,553,225 | 25,180,634 | ||||||
| Commitments and contingencies | ||||||||
| Stockholders' equity | ||||||||
| Common stock, $.01 par value, authorized 30,000,000 shares; | ||||||||
| 26,053,318 and 25,909,603 issued as of 2009 and | ||||||||
| 2008, respectively | 260,533 | 259,096 | ||||||
| Capital in excess of par value | 94,329,398 | 91,611,078 | ||||||
| Retained earnings | 74,015,940 | 69,899,669 | ||||||
| Accumulated other comprehensive loss | (18,159 | ) | (203,019 | ) | ||||
| Less cost of treasury stock, 5,687,631 shares | ||||||||
| as of 2009 and 2008 | (39,004,425 | ) | (39,004,425 | ) | ||||
| Total stockholders' equity | 129,583,287 | 122,562,399 | ||||||
| Total liabilities and stockholders' equity | $ | 153,136,512 | $ | 147,743,033 | ||||
| See accompanying notes to consolidated financial statements. | ||||||||
F-7
STRATASYS, INC. AND
SUBSIDIARIES
CONSOLIDATED FINANCIAL STATEMENTS
CONSOLIDATED FINANCIAL STATEMENTS
| Consolidated Statements of Operations | ||||||||||||
| Years Ended December 31, | 2009 | 2008 | 2007 | |||||||||
| Net sales | ||||||||||||
| Products | $ | 73,210,550 | $ | 98,969,152 | $ | 89,280,009 | ||||||
| Services | 25,145,682 | 25,525,860 | 22,962,572 | |||||||||
| 98,356,232 | 124,495,012 | 112,242,581 | ||||||||||
| Cost of sales | ||||||||||||
| Products | 40,925,443 | 47,672,443 | 40,540,564 | |||||||||
| Services | 11,047,217 | 10,410,249 | 11,993,906 | |||||||||
| 51,972,660 | 58,082,692 | 52,534,470 | ||||||||||
| Gross profit | 46,383,572 | 66,412,320 | 59,708,111 | |||||||||
| Operating expenses | ||||||||||||
| Research and development | 7,737,125 | 8,973,203 | 7,465,334 | |||||||||
| Selling, general and administrative | 32,822,727 | 36,842,665 | 33,769,880 | |||||||||
| 40,559,852 | 45,815,868 | 41,235,214 | ||||||||||
| Operating income | 5,823,720 | 20,596,452 | 18,472,897 | |||||||||
| Other income (expense) | ||||||||||||
| Interest income, net | 989,922 | 2,037,257 | 2,316,001 | |||||||||
| Foreign currency transaction losses, net | (232,767 | ) | (834,762 | ) | (503,309 | ) | ||||||
| Other | (398,603 | ) | (1,065,460 | ) | 76,468 | |||||||
| 358,552 | 137,035 | 1,889,160 | ||||||||||
| Income before income taxes | 6,182,272 | 20,733,487 | 20,362,057 | |||||||||
| Income taxes | 2,066,001 | 7,118,000 | 6,037,999 | |||||||||
| Net income | $ | 4,116,271 | $ | 13,615,487 | $ | 14,324,058 | ||||||
| Net income per common share | ||||||||||||
| Basic | $ | 0.20 | $ | 0.66 | $ | 0.69 | ||||||
| Diluted | 0.20 | 0.65 | 0.66 | |||||||||
| Weighted average commons shares outstanding | ||||||||||||
| Basic | 20,235,747 | 20,676,436 | 20,771,656 | |||||||||
| Diluted | 20,267,999 | 21,079,265 | 21,565,618 | |||||||||
See accompanying notes to consolidated
financial statements.
F-8
STRATASYS, INC. AND SUBSIDIARIES
CONSOLIDATED FINANCIAL STATEMENTS
CONSOLIDATED FINANCIAL STATEMENTS
Stratasys, Inc. and
Subsidiaries
Consolidated Statements of Changes in Stockholders' Equity and Comprehensive Income
Consolidated Statements of Changes in Stockholders' Equity and Comprehensive Income
| Years Ended December 31, 2009, 2008, and 2007 | ||||||||||||||||||||||||||||
| Accumulated | ||||||||||||||||||||||||||||
| Other | ||||||||||||||||||||||||||||
| Capital in | Comprehensive | Total | ||||||||||||||||||||||||||
| Common Stock | Excess of | Retained | Income | Treasury | Stockholders' | Comprehensive | ||||||||||||||||||||||
| Shares | Amount | Par Value | Earnings | (Loss) | Stock | Equity | Income | |||||||||||||||||||||
| Balances, January 1, 2007 | 24,889,760 | $ | 248,898 | $ | 75,602,267 | $ | 41,960,124 | $ | (116,995 | ) | $ | (19,902,375 | ) | $ | 97,791,919 | |||||||||||||
| Exercise of stock options and warrants | 720,894 | 7,210 | 8,501,055 | 8,508,265 | ||||||||||||||||||||||||
| Income tax reductions relating to | ||||||||||||||||||||||||||||
| exercise of stock options | 1,965,436 | 1,965,436 | ||||||||||||||||||||||||||
| Stock based compensation | 954,783 | 954,783 | ||||||||||||||||||||||||||
| Net income | 14,324,058 | 14,324,058 | $ | 14,324,058 | ||||||||||||||||||||||||
| Other comprehensive income, | ||||||||||||||||||||||||||||
| foreign currency translation adjustment | 289,068 | 289,068 | 289,068 | |||||||||||||||||||||||||
| Total comprehensive income | $ | 14,613,126 | ||||||||||||||||||||||||||
| Balances, December 31, 2007 | 25,610,654 | 256,108 | 87,023,541 | 56,284,182 | 172,073 | (19,902,375 | ) | 123,833,529 | ||||||||||||||||||||
| Exercise of stock options and warrants | 298,949 | 2,988 | 3,224,060 | 3,227,048 | ||||||||||||||||||||||||
| Income tax reductions relating to | ||||||||||||||||||||||||||||
| exercise of stock options | 41,881 | 41,881 | ||||||||||||||||||||||||||
| Purchase of 1,087,575 shares of treasury stock | (19,102,050 | ) | (19,102,050 | ) | ||||||||||||||||||||||||
| Stock based compensation | 1,321,596 | 1,321,596 | ||||||||||||||||||||||||||
| Net income | 13,615,487 | 13,615,487 | $ | 13,615,487 | ||||||||||||||||||||||||
| Other comprehensive income, | ||||||||||||||||||||||||||||
| unrealized loss on securities | (128,000 | ) | (128,000 | ) | (128,000 | ) | ||||||||||||||||||||||
| foreign currency translation adjustment | (247,092 | ) | (247,092 | ) | (247,092 | ) | ||||||||||||||||||||||
| Total comprehensive income | $ | 13,240,395 | ||||||||||||||||||||||||||
| Balances, December 31, 2008 | 25,909,603 | 259,096 | 91,611,078 | 69,899,669 | (203,019 | ) | (39,004,425 | ) | 122,562,399 | |||||||||||||||||||
| Exercise of stock options and warrants | 143,715 | 1,437 | 1,664,061 | 1,665,498 | ||||||||||||||||||||||||
| Tax benefit shortfall relating to | ||||||||||||||||||||||||||||
| exercise of stock options | (82,811 | ) | (82,811 | ) | ||||||||||||||||||||||||
| Stock based compensation | 1,137,070 | 1,137,070 | ||||||||||||||||||||||||||
| Net income | 4,116,271 | 4,116,271 | $ | 4,116,271 | ||||||||||||||||||||||||
| Other comprehensive income, | ||||||||||||||||||||||||||||
| unrealized loss on securities adjustment | 26,500 | 26,500 | 26,500 | |||||||||||||||||||||||||
| foreign currency translation adjustment | 158,360 | 158,360 | 158,360 | |||||||||||||||||||||||||
| Total comprehensive income | $ | 4,301,131 | ||||||||||||||||||||||||||
| Balances, December 31, 2009 | 26,053,318 | $ | 260,533 | $ | 94,329,398 | $ | 74,015,940 | $ | (18,159 | ) | $ | (39,004,425 | ) | $ | 129,583,287 | |||||||||||||
F-9
STRATASYS, INC. AND SUBSIDIARIES
CONSOLIDATED FINANCIAL STATEMENTS
CONSOLIDATED FINANCIAL STATEMENTS
| Consolidated Statements of Cash Flows | ||||||||||||
| Years ended December 31, | 2009 | 2008 | 2007 | |||||||||
| Cash flows from operating activities | ||||||||||||
| Net income | $ | 4,116,271 | $ | 13,615,487 | $ | 14,324,058 | ||||||
| Adjustments to reconcile net income to net cash | ||||||||||||
| provided by (used in) operating activities: | ||||||||||||
| Deferred income taxes | (1,431,000 | ) | (51,000 | ) | (56,000 | ) | ||||||
| Depreciation | 5,827,113 | 4,810,237 | 3,608,601 | |||||||||
| Amortization | 2,428,540 | 2,193,609 | 1,365,735 | |||||||||
| Stock-based compensation | 1,137,070 | 1,321,597 | 954,783 | |||||||||
| Loss (gain) on disposal of property and equipment | 314,414 | (61,784 | ) | 7,379 | ||||||||
| Loss on write-down of investment | 444,000 | 1,270,750 | - | |||||||||
| Increase (decrease) in cash attributable to changes in | ||||||||||||
| operating assets and liabilities: | ||||||||||||
| Accounts receivable, net | 7,289,920 | (233,037 | ) | (1,271,388 | ) | |||||||
| Inventories | 4,810,441 | (6,875,415 | ) | (2,423,068 | ) | |||||||
| Net investment in sales-type leases | 1,320,534 | (1,057,814 | ) | (1,229,566 | ) | |||||||
| Prepaid expenses | 360,468 | (100,764 | ) | 861,270 | ||||||||
| Other assets | (119,951 | ) | (964 | ) | (836,268 | ) | ||||||
| Accounts payable and other current liabilities | 1,079,560 | (2,121,903 | ) | 5,588,851 | ||||||||
| Unearned revenues | (2,086,969 | ) | 1,800,925 | 1,087,752 | ||||||||
| Excess tax benefit from stock options | - | (18,747 | ) | (812,766 | ) | |||||||
| Net cash provided by operating activities | 25,490,411 | 14,491,177 | 21,169,373 | |||||||||
| Cash flows from investing activities | ||||||||||||
| Proceeds from sale of investments | 7,022,607 | 23,875,909 | 14,475,022 | |||||||||
| Purchase of investments | (9,920,000 | ) | - | (24,459,978 | ) | |||||||
| Proceeds from sale of property and equipment | 38,445 | 315,726 | 63,630 | |||||||||
| Acquisition of property and equipment | (2,284,676 | ) | (8,494,145 | ) | (10,237,990 | ) | ||||||
| Acquisition of intangible and other assets | (1,687,126 | ) | (2,407,221 | ) | (3,682,017 | ) | ||||||
| Net cash provided by (used in) investing activities | (6,830,750 | ) | 13,290,269 | (23,841,333 | ) | |||||||
| Cash flows from financing activities | ||||||||||||
| Proceeds from exercise of stock options and warrants | 1,582,687 | 3,229,259 | 8,508,265 | |||||||||
| Excess tax benefit from stock options | - | 18,747 | 812,766 | |||||||||
| Purchase of treasury stock | - | (19,104,261 | ) | - | ||||||||
| Net cash provided by (used in) financing activities | 1,582,687 | (15,856,255 | ) | 9,321,031 | ||||||||
| Effect of exchange rate changes on cash | 127,779 | (191,163 | ) | 259,855 | ||||||||
| Net increase in cash and cash equivalents | 20,370,127 | 11,734,028 | 6,908,926 | |||||||||
| Cash and cash equivalents, beginning of year | 27,945,799 | 16,211,771 | 9,302,845 | |||||||||
| Cash and cash equivalents, end of year | $ | 48,315,926 | $ | 27,945,799 | $ | 16,211,771 | ||||||
| Supplemental Disclosures of cash flow information: | ||||||||||||
| Cash paid for taxes | $ | 626,407 | $ | 8,133,189 | $ | 3,011,834 | ||||||
| Transfer of fixed assets to inventory | 245,329 | 242,701 | 422,950 | |||||||||
| Transfer of inventory to fixed assets | 716,225 | 3,118,720 | 740,388 | |||||||||
See accompanying notes to consolidated
financial statements.
F-10
STRATASYS, INC. AND
SUBSIDIARIES
NOTES TO CONSOLIDATED FINANCIAL STATEMENTS
NOTES TO CONSOLIDATED FINANCIAL STATEMENTS
Note 1. Nature of Operations and Summary of
Significant Accounting Policies
Nature of Operations
Stratasys, Inc. and
subsidiaries (collectively the "Company") develops, manufactures, distributes
and markets a family of rapid prototyping (“RP”), three-dimensional (“3D”)
printing and direct digital manufacturing (“DDM”) systems that permit engineers
and designers to create physical models and prototypes, made of various
materials, utilizing three dimensional Computer Aided Design ("3D CAD") files at
a CAD workstation. The Company sells these systems and the related consumable
materials and maintenance worldwide. In addition, the Company offers both
existing and potential customers the ability to purchase prototypes and parts
that it makes for them from CAD files that they provide to the Company.
Principles of Consolidation
The accompanying
consolidated financial statements include the accounts of Stratasys, Inc. and
its wholly owned subsidiaries. All intercompany accounts and transactions have
been eliminated in consolidation.
Use of Estimates
The preparation of
financial statements in conformity with accounting principles generally accepted
in the United States of America requires management to make estimates and
assumptions that affect the reported amounts of assets and liabilities and
disclosure of contingent assets and liabilities at the date of the financial
statements and the reported amounts of revenues and expenses during the
reporting period. Actual results could differ from those estimates.
Reclassifications
Certain
reclassifications have been made to the prior years’ financial statements to
conform to the current year presentation. These reclassifications had no effect
on previously reported results of operations.
Cash and Cash Equivalents
The Company considers
all highly-liquid debt instruments purchased with maturities of three months or
less when acquired to be cash equivalents. At December 31, 2009 and 2008, cash
equivalents consisted of money market accounts aggregating approximately $46.1
million and $26.1 million, respectively. As of December 31, 2009 and 2008, and
at various times during those years, balances of cash at financial institutions
exceeded the federally insured limit. The Company has not experienced any losses
in such accounts and believes it is not subject to any significant credit risk
on cash and cash equivalents. At December 31, 2009 and 2008, cash balances held
in foreign bank accounts were approximately $0.3 million and $0.9 million,
respectively. Cash balances held in foreign accounts are subject to local
banking laws and may bear higher or lower risk than cash deposited in the United
States.
Short-term and Long-term Investments
Classification of
investments as current or non-current is dependent upon management’s intended
holding period, the investment’s maturity date and liquidity considerations
based on market conditions. These investments are then evaluated and classified
as available-for-sale or held-to-maturity in accordance with the provisions of
the
Accounting Standards Codification (“ASC”) 320, Investments – Debt
and Equity Securities. This evaluation
takes into consideration the Company’s past history of holding investments until
maturity, projected cash flow estimates, future capital requirements, the
existence of credit deterioration of the issuer and the Company’s overall
investment strategy as established by management and approved by its Board of
Directors.
If management has the
positive intent and ability to hold its debt securities until maturity, they are
classified as “held-to-maturity” and accounted for using the amortized-cost
method. All other securities are classified as “available-for-sale” and
accounted for at fair value with the realized gain or loss, net of tax, reported
in current period income and unrealized gain or loss, net of tax, reported in
other comprehensive income. The Company does not hold any investments for
trading purposes and had no unrecognized gains or losses related to
held-to-maturity investments at December 31, 2009 or 2008, as the fair value of
those investments approximated cost.
F-11
STRATASYS, INC. AND
SUBSIDIARIES
NOTES TO CONSOLIDATED FINANCIAL STATEMENTS
NOTES TO CONSOLIDATED FINANCIAL STATEMENTS
Fair Value of Financial Instruments
The fair value of the
Company's assets and liabilities, which qualify as financial instruments under
ASC 820, Fair Value Measurements and
Disclosures, approximate
the carrying amounts presented in the consolidated balance sheets.
Accounts Receivable
The Company carries its
accounts receivable at cost less an allowance for returns and doubtful accounts.
On a periodic basis, the Company evaluates its accounts receivable and
establishes an allowance for doubtful accounts based on a history of past
write-offs and collections and current credit conditions. The Company evaluates
a number of factors to assess collectibility, including an evaluation of the
creditworthiness of the customer, past payment history, and current economic
conditions. It is reasonably possible that the Company’s estimate of the
allowance for doubtful accounts will change. Accounts are written-off against
the reserve when management deems the accounts are no longer collectible. The
Company also records a provision for estimated product returns and allowances in
the period in which the related revenue is recorded. This provision against
current gross revenue is based principally on historical rates of sales returns,
but also factors in changes in the customer base, geographic economic
conditions, and changes in the financial conditions of the Company’s
customers.
Inventories
Inventories are stated
on the first-in, first-out method, at the lower of cost or market. Inventory
costs consist of material, direct labor and overhead. The Company periodically
assesses inventory for obsolescence and excess by reducing the carrying amount
by an amount equal to the difference between its cost and the estimated market
value based on assumptions about future demand and historical sales patterns.
Impairment of Long-Lived Assets
The Company complies
with ASC 360, Property, Plant, and
Equipment, and annually
assesses the recoverability of the carrying amounts of long-lived assets,
including intangible assets, at year-end. An impairment loss would be recognized
if expected undiscounted future cash flows are less than the carrying amount of
the asset. This loss would be determined by calculating the difference by which
the carrying amount of the asset exceeds its fair value. Based on the Company’s
assessment as of December 31, 2009, no long-lived assets were determined to be
impaired.
Property and Equipment
Property and equipment
is stated at cost less accumulated depreciation and amortization. Depreciation
and amortization are computed using the straight-line method over the estimated
useful lives of the assets ranging from two to 30 years. The Company recorded
depreciation expense not included in cost of sales of approximately $2.0
million, $1.7 million, and $1.1 million for the years ended December 31, 2009,
2008, and 2007, respectively. Maintenance and repairs are charged to operations,
while betterments and improvements are capitalized.
Intangible Assets
Intangible assets are
capitalized and amortized over their estimated useful or economic lives using
the straight-line method in conformity with ASC 350, Intangibles – Goodwill and Other, as follows:
| RP technology | 11 years | |
| Capitalized software development costs | 3 years | |
| Patents | 10 years | |
| Trademarks | 5 years |
F-12
STRATASYS, INC. AND
SUBSIDIARIES
NOTES TO CONSOLIDATED FINANCIAL STATEMENTS
NOTES TO CONSOLIDATED FINANCIAL STATEMENTS
The costs of software
development, including significant product enhancements, incurred subsequent to
establishing technological feasibility have been capitalized in accordance with
ASC 985-20, Costs of Software to be Sold, Leased or
Marketed. Costs incurred
prior to establishment of technological feasibility are charged to research and
development expense.
Unearned Revenues
The Company services and
supports customers by providing warranties and selling maintenance agreements
for its products. Unearned revenues are comprised of purchased and implied
maintenance agreements covering future periods. Implied maintenance is the
portion of revenue received at the time of a system sale that represents
maintenance coverage commitments that were included in the sale that extend
beyond the stated warranty period. Maintenance revenue is recognized in equal
installments over the period of the agreement. The purchased maintenance is
deferred in whole and amortized over the period of coverage ranging from one to
five years.
Revenue Recognition
The Company derives
revenue from sales of 3D printing, rapid prototyping (“RP”) and direct digital
manufacturing (“DDM”) systems, consumables, and services. The Company recognizes
revenue when (1) persuasive evidence of a final agreement exists, (2) delivery
has occurred or services have been rendered, (3) the selling price is fixed or
determinable, and (4) collectibility is reasonably assured. The Company’s
standard terms are FOB shipping point, and as such most of the revenue from the
sale of RP machines and consumables is recognized when shipped. Exceptions to
this policy occur only if a customer’s purchase order indicates an alternative
term or provides that the equipment sold would be subject to certain
contingencies, such as formal acceptance. In these instances, revenues would be
recognized only upon satisfying the conditions established by the customer as
contained in its purchase order to the Company. Revenue from sales-type leases
for the Company’s high-performance systems is recognized at the time of lessee
acceptance, which follows installation. Revenue from sales-type leases for the
Company’s Dimension systems is recognized at the time of shipment, since either
the customer or the reseller performs the installation. The Company recognizes
revenue from sales-type leases at the net present value of future lease
payments. Revenue from operating leases is recognized ratably over the lease
period.
Service revenue is
derived from sales of maintenance contracts, installation services, and
training. Service revenue from maintenance contracts is recognized ratably over
the term of the contract, typically one to two years. The Company offers
warranty periods ranging from 90 days to one year. On certain sales that require
a one-year warranty, the extended warranty is treated for revenue recognition
purposes as a maintenance agreement. The fair value of this maintenance
agreement is deferred and recognized ratably over the period of the extended
warranty as an implied maintenance contract. Installation service revenues are
recognized upon completion of the installation. Training revenues are recognized
upon completion of the training.
In accordance with ASC
605, Revenue Recognition, when two or more product offerings are
contained in a single arrangement, revenue is allocated between the elements
based on their relative fair value, provided that each element meets the
criteria for treatment as a separate unit of accounting. An item is considered a
separate unit of accounting if it has value to the customer on a stand-alone
basis and there is objective and reliable evidence of the fair value of the
undelivered items. Fair value is generally determined based upon the price
charged when the element is sold separately. In the absence of fair value for a
delivered element, revenue is allocated first to the fair value of the
undelivered elements and then the residual revenue is allocated to the delivered
elements. In the absence of fair value for an undelivered element, the
arrangement is accounted for as a single unit of accounting, resulting in a
delay of revenue recognition for the delivered elements until all undelivered
elements have been fulfilled.
Revenues from training
and installation are unbundled and are recognized after the services have been
performed. Most of the Company’s products are sold through distribution
channels, with training and installation services offered by the resellers. For
the Dimension product neither installation nor training is offered by the
Company. The equipment manufactured and sold by the Company is subject to
factory testing that replicates the conditions under which the customers intend
to use the equipment. All of the systems are sold subject to published
specifications, and all systems sales involve standard models.
F-13
STRATASYS, INC. AND
SUBSIDIARIES
NOTES TO CONSOLIDATED FINANCIAL STATEMENTS
NOTES TO CONSOLIDATED FINANCIAL STATEMENTS
The Company assesses
collectibility as part of the revenue recognition process. This assessment
includes a number of factors such as an evaluation of the creditworthiness of
the customer, past payment history, and current economic conditions. If it is
determined that collectibility cannot be reasonably assured, the Company will
decline shipment, request a down payment, or defer recognition of revenue until
ultimate collectibility is reasonably assured.
The Company also records
a provision for estimated product returns and allowances in the period in which
the related revenue is recorded. This provision against current gross revenue is
based principally on historical rates of sales returns, but also factors in
changes in the customer base, geographic economic conditions, and changes in the
financial conditions of the Company’s customers. There was no provision for
product returns and allowances at December 31, 2009, and the provision for
product returns and allowances was approximately $122,000 as of December 31,
2008.
Foreign Currency Hedge
The Company invoices
sales to certain European distributors in Euros and reported results are
therefore subject to fluctuations in the exchange rates of that currency in
relation to the United States dollar. The Company’s strategy is to hedge most of
its Euro-denominated accounts receivable positions by entering into 30-day
foreign currency forward contracts on a month-to-month basis to reduce the risk
that its earnings will be adversely affected by changes in currency exchange
rates. The Company does not use derivative financial instruments for speculative
or trading purposes. The Company enters into 30-day foreign currency forward
contracts on the last day of each month and therefore the notional value of the
contract equals the fair value at the end of each reporting period. As such,
there is no related asset or liability or unrealized gains or losses recorded on
the Balance Sheet as of the end of the period. All realized gains and losses
related to hedging activities are recorded in current period earnings under the
Statement of Operations caption “Foreign currency transaction losses,
net”.
Advertising
Advertising costs are
charged to operations as incurred and were approximately $3.4 million, $4.0
million, and $3.5 million, for 2009, 2008 and 2007, respectively.
Research and Development Costs
The Company complies
with ASC 730, Research and Development. Expenditures for research, development and
engineering of products and manufacturing processes are expensed as incurred.
Sales Tax
Taxes collected from
customers and remitted to governmental authorities are recorded on a net basis
(excluded from revenues) in the Company’s Consolidated Statement of Operations.
Income Taxes
The Company complies
with ASC 740, Income Taxes, which requires an asset and liability
approach to financial reporting of income taxes. Deferred income tax assets and
liabilities are computed for differences between the financial statement and tax
basis of assets and liabilities that will result in taxable or deductible
amounts in the future, based on enacted tax laws and rates applicable to the
periods in which the differences are expected to affect taxable income.
Valuation allowances are established, when necessary, to reduce the deferred
income tax assets to the amount expected to be realized.
In accordance with ASC
740, Income Taxes, the Company takes a two-step approach to
recognizing and measuring uncertain tax positions (tax contingencies). The first
step is to evaluate the tax position for recognition by determining if the
weight of available evidence indicates it is more likely than not that the
position will be sustained on audit, including resolution of related appeals or
litigation processes, if any. The second step is to measure the tax benefit as
the largest amount which is more than 50% likely of being realized upon ultimate
settlement. The Company reevaluates these tax positions quarterly and makes
adjustments as required.
F-14
STRATASYS, INC. AND
SUBSIDIARIES
NOTES TO CONSOLIDATED FINANCIAL STATEMENTS
NOTES TO CONSOLIDATED FINANCIAL STATEMENTS
Earnings Per Share
The Company complies
with ASC 260, Earnings Per Share, which requires dual presentation of basic
and diluted income per common share for all periods presented. Basic net income
per share excludes dilution and is computed by dividing net income by the
weighted average number of shares outstanding for the periods that have net
income. Diluted net income per share reflects the potential dilution that could
occur if securities or other contracts to issue common stock were exercised or
converted into common stock or resulted in the issuance of common stock that
then share in the income of the Company. The difference between the number of
common shares used to compute basic net income per share and diluted net income
per share relates to additional common shares that would be issued upon the
assumed exercise of stock options and warrants, net of the common shares that
would hypothetically be repurchased using the proceeds received from the
original exercise. The additional common shares amounted to 32,252 in 2009,
402,829 in 2008 and 793,962 in 2007. A total of 812,000, 265,000 and 258,000
shares were excluded from the dilution calculation for the years ended December
31, 2009, 2008 and 2007, respectively, since their inclusion would have an
anti-dilutive effect.
Stock-Based Compensation
The Company calculates
the fair value of stock-based option awards on the date of grant using the
Black-Scholes option pricing model. The computation of expected volatility is
based on historical volatility from traded options on our stock. The expected
option term is calculated in accordance with ASC 718, Compensation – Stock Compensation. The interest rate for periods within the
contractual life of the award is based on the U.S. Treasury yield curve in
effect at the time of grant. Each of the three factors requires the Company to
use judgment and make estimates in determining the percentages and time periods
used for the calculation. If the Company were to use different percentages or
time periods, the fair value of stock-based option awards could be materially
different.
Accrued Product Warranties
The Company’s products
are covered by a warranty with periods ranging from ninety days to one year from
the date of sale to the end customer. A liability is recorded for future
warranty costs in the same period in which related revenue is recognized. The
liability is based on anticipated parts and labor costs utilizing historical
experience. The Company periodically assesses the adequacy of the warranty
reserves based on changes in these factors and records any necessary adjustments
if actual experience indicates that adjustments are necessary. Future claims
experience could be materially different from prior results because of the
introduction of new, more complex products, a change in our warranty policy in
response to industry trends, competition or other external forces, or
manufacturing changes that could impact product quality. In the event that the
Company determines that our current or future product repair and replacement
costs exceed estimates, an adjustment to these reserves would be charged to
earnings in the period such a determination is made. As of December 31, 2009 and
2008, the Company had $0.7 million and $0.3 million, respectively, accrued for
future estimated warranty claims.
Comprehensive Income
The Company complies
with ASC 220, Comprehensive Income, which establishes rules for the reporting
and display of comprehensive income (loss) and its components. The Company
reports the financial impact of translating its foreign subsidiaries’ financial
statements from local currency to reporting currency as a component of
comprehensive income (loss).
F-15
STRATASYS, INC. AND
SUBSIDIARIES
NOTES TO CONSOLIDATED FINANCIAL STATEMENTS
NOTES TO CONSOLIDATED FINANCIAL STATEMENTS
Recently Issued Accounting Pronouncements
In October 2009, the
Financial Accounting Standards Board (“FASB”) issued ASU No. 2009-13, Multiple-Deliverable Revenue
Arrangements—a consensus of the FASB Emerging Issues Task Force, that
provides amendments to the criteria for separating consideration in
multiple-deliverable arrangements. As a result of these amendments,
multiple-deliverable revenue arrangements will be separated in more
circumstances than under existing U.S. GAAP. The ASU does this by establishing a
selling price hierarchy for determining the selling price of a deliverable. The
selling price used for each deliverable will be based on vendor-specific
objective evidence (“VSOE”) if available, third-party evidence if VSOE is not
available, or estimated selling price if neither VSOE nor third-party evidence
is available. A vendor will be required to determine its best estimate of
selling price in a manner that is consistent with that used to determine the
price to sell the deliverable on a standalone basis. This ASU also eliminates
the residual method of allocation and will require that arrangement
consideration be allocated at the inception of the arrangement to all
deliverables using the relative selling price method, which allocates any
discount in the overall arrangement proportionally to each deliverable based on
its relative selling price. Expanded disclosures of qualitative and quantitative
information regarding application of the multiple-deliverable revenue
arrangement guidance are also required under the ASU. The ASU does not apply to
arrangements for which industry specific allocation and measurement guidance
exists, such as long-term construction contracts and software transactions. ASU
No. 2009-13 is effective for the Company beginning January 1, 2011. The Company
is currently evaluating the impact of this standard on the consolidated results
of operations and financial condition.
In June 2009, the FASB
issued a standard that established the FASB Accounting Standards Codification™
(“ASC”) and amended the hierarchy of accounting principles generally accepted in
the United States of America (U.S. GAAP) such that the ASC became the single
source of authoritative nongovernmental U.S. GAAP. The ASC did not change
current U.S. GAAP, but was intended to simplify user access to all authoritative
U.S. GAAP by providing all the authoritative literature related to a particular
topic in one place. All previously existing accounting standard documents were
superseded and all other accounting literature not included in the ASC is
considered non-authoritative. New accounting standards issued subsequent to June
30, 2009 are communicated by the FASB through Accounting Standards Updates
(“ASUs”). This standard did not have an impact on the Company’s consolidated
results of operations or financial condition. However, throughout the notes to
the consolidated financial statements references that were previously made to
various former authoritative U.S. GAAP pronouncements have been changed to
coincide with the appropriate section of the ASC.
In May 2009, the FASB
issued a new accounting standard regarding subsequent events. This standard
incorporates into authoritative accounting literature certain guidance that
already existed within generally accepted auditing standards, with the
requirements concerning recognition and disclosure of subsequent events
remaining essentially unchanged. This guidance addresses events which occur
after the balance sheet date but before the issuance of financial statements.
Under the new standard, as under previous practice, an entity must record the
effects of subsequent events that provide evidence about conditions that existed
at the balance sheet date and must disclose but not record the effects of
subsequent events which provide evidence about conditions that did not exist at
the balance sheet date. The guidance was effective for fiscal years and interim
periods ended after June 15, 2009. The Company has evaluated any subsequent events through the date of this
filing.
In April 2009, the FASB
issued an accounting standard which provides guidance on (1) estimating the fair
value of an asset or liability when the volume and level of activity for the
asset or liability have significantly declined; and (2) identifying transactions
that are not orderly. The standard also amended certain disclosure provisions
for fair value measurements and disclosures in ASC 820, Fair Value Measurements and Disclosures, to require, among other things, disclosures
in interim periods of the inputs and valuation techniques used to measure fair
value as well as disclosure of the hierarchy of the source of underlying fair
value information on a disaggregated basis by specific major category of
investment. This standard was effective for the Company prospectively beginning
April 1, 2009. The adoption of this standard did not have a material impact on
the Company’s consolidated results of operations or financial
condition.
F-16
STRATASYS, INC. AND
SUBSIDIARIES
NOTES TO CONSOLIDATED FINANCIAL STATEMENTS
NOTES TO CONSOLIDATED FINANCIAL STATEMENTS
In April 2009, the FASB
issued an accounting standard which modifies the requirements for recognizing
other-than-temporarily impaired debt securities and changes the existing
impairment model for such securities. The standard also requires additional
disclosures for both annual and interim periods with respect to both debt and
equity securities. Under the standard, impairment of debt securities will be
considered other-than-temporary if an entity (1) intends to sell the security,
(2) more likely than not will be required to sell the security before recovering
its cost, or (3) does not expect to recover the security’s entire amortized cost
basis (even if the entity does not intend to sell). The standard further
indicates that, depending on which of the above factor(s) causes the impairment
to be considered other-than-temporary, (1) the entire shortfall of the
security’s fair value versus its amortized cost basis or (2) only the credit
loss portion would be recognized in earnings while the remaining shortfall (if
any) would be recorded in other comprehensive income. The standard requires
entities to initially apply its provisions to previously other-than-temporarily
impaired debt securities existing as of the date of initial adoption by making a
cumulative-effect adjustment to the opening balance of retained earnings in the
period of adoption. The cumulative-effect adjustment potentially reclassifies
the noncredit portion of a previously other-than-temporarily impaired debt
security held as of the date of initial adoption from retained earnings to
accumulated other comprehensive income. This standard was effective for the
Company beginning April 1, 2009. The adoption of this standard did not have a
material impact on the Company’s consolidated results of operations or financial
condition.
In April 2009, the FASB
issued an accounting standard regarding interim disclosures about fair value of
financial instruments. The standard essentially expands the disclosure about
fair value of financial instruments that was previously required only annually
to also be required for interim period reporting. In addition, the standard
requires certain additional disclosures regarding the methods and significant
assumptions used to estimate the fair value of financial instruments. This
standard was effective for the Company beginning April 1, 2009 on a prospective
basis. The adoption of this standard did not have a material impact on the
Company’s consolidated results of operations or financial condition.
In April 2008, the FASB
issued an accounting standard which amended the list of factors an entity should
consider in developing renewal or extension assumptions used in determining the
useful life of recognized intangible assets under ASC 350, Intangibles - Goodwill and Other. This new standard applies to (1) intangible
assets that are acquired individually or with a group of other assets; and (2)
intangible assets acquired in both business combinations and asset acquisitions.
Under this standard, entities estimating the useful life of a recognized
intangible asset must consider their historical experience in renewing or
extending similar arrangements or, in the absence of historical experience, must
consider assumptions that market participants would use about renewals or
extensions. The guidance was effective for the Company beginning January 1, 2009
and did not have a material impact on the consolidated results of operations or
financial condition.
In March 2008, the FASB
issued an accounting standard related to disclosures about derivative
instruments and hedging activities in ASC 815, Derivatives and Hedging, which requires additional disclosures about an entity’s strategies and
objectives for using derivative instruments, the location and amounts of
derivative instruments in an entity’s financial statements, how derivative
instruments and related hedged items are accounted for under ASC 815 and how
derivative instruments and related hedged items affect its financial position,
financial performance, and cash flows. Certain disclosures are also required
with respect to derivative features that are credit risk related. The standard
was effective for the Company beginning January 1, 2009 on a prospective basis.
The adoption of this standard did not have a material impact on the Company’s
consolidated results of operations or financial condition.
In December 2007, the
FASB ratified a standard related to accounting for collaborative arrangements
which discusses how parties to a collaborative arrangement (that does not
establish a legal entity within such arrangement) should account for various
activities. The standard indicates that costs incurred and revenues generated
from transactions with third parties (i.e. parties outside of the collaborative
arrangement) should be reported by the collaborators on the respective line
items in their income statements pursuant to ASC 605-45, Principal Agent Considerations. Additionally, the guidance provides that
income statement characterization of payments between the participants in a
collaborative arrangement should be based upon existing authoritative standards,
analogy to such standards if not within their scope, or a reasonable, rational,
and consistently applied accounting policy election. The guidance was effective
for the Company beginning January 1, 2009 and was required to be applied
retrospectively to all periods presented for collaborative arrangements that
existed as of the date of adoption. This adoption did not have a material impact
on the consolidated results of operations or financial condition and the
required disclosures are provided in Note 14 – Accounting for Collaborative
Arrangements.
F-17
STRATASYS, INC. AND
SUBSIDIARIES
NOTES TO CONSOLIDATED FINANCIAL STATEMENTS
NOTES TO CONSOLIDATED FINANCIAL STATEMENTS
In September 2006, the
FASB issued an accounting standard codified in ASC 820, Fair Value Measurements and Disclosures. This standard established a single
definition of fair value and a framework for measuring fair value, set out a
fair value hierarchy to be used to classify the source of information used in
fair value measurements and required disclosures of assets and liabilities
measured at fair value based on their level in the hierarchy. This standard
applies under other accounting standards that require or permit fair value
measurements. The Company adopted the standard as amended by subsequent FASB
standards beginning January 1, 2008 on a prospective basis. One of the
amendments deferred the effective date for one year relative to nonfinancial
assets and liabilities that are measured at fair value, but are recognized or
disclosed at fair value on a nonrecurring basis. This deferral applied to such
items as nonfinancial assets and liabilities initially measured at fair value in
a business combination (but not measured at fair value in subsequent periods) or
nonfinancial long-lived asset groups measured at fair value for an impairment
assessment. These remaining aspects of the fair value measurement standard were
adopted by the Company prospectively beginning January 1, 2009. This adoption
did not have a material impact on the consolidated results of operations or
financial condition and the disclosures required by it are provided in Note 11 –
Fair Value Measurements.
Note 2. Investments
Classification of
investments as current or non-current is dependent upon management’s intended
holding period, the investment’s maturity date and liquidity considerations
based on market conditions. These investments are then evaluated and classified
as available-for-sale or held-to-maturity in accordance with the provisions of
ASC 320, Investments - Debt and Equity
Securities. This
evaluation takes into consideration the Company’s past history of holding
investments until maturity, projected cash flow estimates, future capital
requirements, the existence of credit deterioration of the issuer and the
Company’s overall investment strategy as established by management and approved
by the Company’s Board of Directors.
If management has the
positive intent and ability to hold its debt securities until maturity, they are
classified as “held-to-maturity” and accounted for using the amortized-cost
method. All other securities are classified as “available-for-sale” and
accounted for at fair value with the unrealized gain or loss, net of tax,
reported in other comprehensive income. The Company does not hold any
investments for trading purposes and had no unrecognized gains or losses related
to held-to-maturity investments at December 31, 2009 or December 31, 2008, as
the fair value of those investments approximated cost.
The Company invests in
certificates of deposit, tax-free auction rate securities, government bonds, and
municipal notes, all of which are insured. The following is a summary of amounts
recorded on the Consolidated Balance Sheet for marketable securities (current
and non-current) at December 31, 2009 and 2008.
| 2009 | 2008 | ||||
| Government bonds | $ | 8,113,361 | $ | 4,834,698 | |
| Other securities | 357 | 357 | |||
| Certificates of deposit | 7,960,000 | - | |||
| Short-term investments - held to maturity | 16,073,718 | 4,835,055 | |||
| Auction rate securities | 1,055,750 | 1,109,250 | |||
| Long-term investments - available for sale securities | 1,055,750 | 1,109,250 | |||
| Auction rate securities | 2,400,000 | 2,400,000 | |||
| Government bonds | 1,107,318 | 11,425,981 | |||
| Certificates of deposit | 1,960,000 | - | |||
| Long-term investments - held to maturity | 5,467,318 | 13,825,981 | |||
| Total investments | $ | 22,596,786 | $ | 19,770,286 | |
F-18
STRATASYS, INC. AND
SUBSIDIARIES
NOTES TO CONSOLIDATED FINANCIAL STATEMENTS
NOTES TO CONSOLIDATED FINANCIAL STATEMENTS
Short-term and long-term
investments consist of certificates of deposit, tax-free government bonds, and
Auction Rate Securities (“ARS”). At December 31, 2009, the Company’s investments
included:
- approximately $9.2 million in
municipal government bonds maturing between April 2010 and February 2026, all
of which have ratings between Aa2 and Baa1 at December 31, 2009;
- approximately $9.9 million in
certificates of deposit maturing between February 2010 and February
2011.
- approximately $2.4 million of a
tax-free ARS, which re-prices approximately every 35 days. The ARS had a
rating of A1 at December 31, 2009; and
- approximately $1.1 million of a tax-free ARS, which does not currently have an active trading market and matures in February 2042. This ARS had a rating of Caa3 at December 31, 2009 and is further explained below.
The balance sheet
caption titled “Long-term investments – available for sale securities” consisted
of approximately $1.1 million of a tax-free ARS. This balance represents the
current estimated fair value of an ARS issued by Jefferson County, Alabama with
a face value of $2.6 million. The investment is part of a multi-billion series
of bonds issued by Jefferson County to build its sewer and water treatment
system (“system”). The County entered into interest rate swaps to protect itself
from rising interest rates, but the swaps proved ineffective and the revenue
from the system will not adequately support the higher interest rates. The bond
is insured by Financial Guaranty Insurance Company (“FGIC”) and matures in 2042.
However, with the collapse of the ARS market, the weakened financial condition
of FGIC, and the County’s financial condition, the rating of this ARS has gone
from Aaa to Caa3. The Company has received $25,000 in principal payments on this
ARS and no additional principal payments have become due. The Company has
received all scheduled interest payments on this ARS through December 31, 2009.
Due to the current financial condition of the County and the absence of an
active market for this security, the Company only records interest income as
cash payments are received.
With the assistance of
outside consultants, the Company has reviewed this ARS, including expected cash
flows, assessed the credit risk, analyzed and extrapolated yield information on
comparable composites, and reviewed independent research from various public
sources concerning the ARS market. From that assessment, the Company has
concluded that during 2008 it had incurred both a temporary and
other-than-temporary impairment and recognized impairments of $195,000 and
$1,270,750, respectively. Based upon a reevaluation that occurred in late 2009,
a portion of the temporary impairment is now considered other-than-temporary and
an additional portion of the net carrying amount has also been considered as
impaired on an other-than-temporary basis. The following table summarizes the
activity of this investment from December 31, 2007 to December 31, 2009.
| Face value of investment as of December 31, 2007 | $ | 2,600,000 | |
| Principal payment | (25,000 | ) | |
| Temporary impairment - recognized in other comprehensive income | (195,000 | ) | |
| Other-than-temporary impairment - recognized in other income | (1,270,750 | ) | |
| Net carrying value at December 31, 2008 | 1,109,250 | ||
| Temporary impairment transferred to other-than-temporary impairment | 40,500 | ||
| Other-than-temporary impairment - recognized in other income | (94,000 | ) | |
| Net carrying value at December 31, 2009 | $ | 1,055,750 |
Note 3. Inventories
Inventories consisted of
the following at December 31:
| 2009 | 2008 | ||||
| Finished goods | $ | 6,288,314 | $ | 11,968,337 | |
| Raw materials | 8,319,700 | 7,921,014 | |||
| $ | 14,608,014 | $ | 19,889,351 | ||
F-19
STRATASYS, INC. AND
SUBSIDIARIES
NOTES TO CONSOLIDATED FINANCIAL STATEMENTS
NOTES TO CONSOLIDATED FINANCIAL STATEMENTS
Note 4. Net Investment in Sales-type
Leases
The Company leases
certain of its systems under agreements accounted for as sales-type leases.
Included in revenues for the years ended December 31, 2009, 2008 and 2007 are
approximately $1.7 million, $3.1 million and $2.3 million, respectively, of
revenues related to sales-type leases. These non-cancelable leases expire over
the next one to five years.
The following lists the
components of the net investment in sales-type leases as of December 31, 2009
and 2008:
| 2009 | 2008 | |||||||
| Future minimum lease payments receivable | $ | 7,713,133 | $ | 8,741,091 | ||||
| Less allowance for doubtful accounts | (222,011 | ) | (324,642 | ) | ||||
| Net future minimum lease payment receivable | 7,491,122 | 8,416,449 | ||||||
| Less unearned interest income | (395,207 | ) | (625,442 | ) | ||||
| Net investment in sales-type leases | $ | 7,095,915 | $ | 7,791,007 | ||||
Future minimum lease
payments due from customers under sales-type leases as of December 31, 2009 were
as follows:
| Year ending December 31, | ||||
| 2010 | $ | 4,061,405 | ||
| 2011 | 1,938,656 | |||
| 2012 | 881,936 | |||
| 2013 | 618,297 | |||
| 2014 | 212,839 | |||
| $ | 7,713,133 | |||
The interest income for
sales-type leases amounted to approximately $405,000, $444,000, and $329,000 for
the years ended December 31, 2009, 2008 and 2007, respectively.
Note 5. Property and
Equipment
Property and equipment
consisted of the following at December 31:
| 2009 | 2008 | |||||
| Machinery and equipment | $ | 23,933,169 | $ | 22,390,912 | ||
| Building and improvements | 11,780,928 | 10,974,508 | ||||
| Land and improvements | 3,120,619 | 3,120,618 | ||||
| Computer equipment and software | 10,305,828 | 9,650,394 | ||||
| Office equipment | 2,473,521 | 2,472,412 | ||||
| Furniture and fixtures | 2,213,695 | 2,160,242 | ||||
| Capital work-in-progress | 1,851,158 | 2,847,798 | ||||
| 55,678,918 | 53,616,884 | |||||
| Accumulated depreciation and amortization | 29,352,906 | 23,866,963 | ||||
| $ | 26,326,012 | $ | 29,749,921 | |||
F-20
STRATASYS, INC. AND
SUBSIDIARIES
NOTES TO CONSOLIDATED FINANCIAL STATEMENTS
NOTES TO CONSOLIDATED FINANCIAL STATEMENTS
Note 6. Intangible
Assets
Intangible assets
consisted of the following at December 31:
| 2009 | 2008 | |||||||||||
| Gross | Gross | |||||||||||
| Carrying | Accumulated | Carrying | Accumulated | |||||||||
| Amount | Amortization | Amount | Amortization | |||||||||
| RP technology | $ | 5,548,417 | $ | 3,709,907 | $ | 5,523,255 | $ | 3,400,011 | ||||
| Capitalized software development costs | 12,263,654 | 8,578,822 | 10,932,766 | 6,760,199 | ||||||||
| Patents | 3,304,396 | 2,066,802 | 3,012,685 | 1,838,149 | ||||||||
| Trademarks | 287,682 | 263,049 | 271,254 | 232,010 | ||||||||
| 21,404,149 | $ | 14,618,580 | 19,739,960 | $ | 12,230,369 | |||||||
| Accumulated amortization | 14,618,580 | 12,230,369 | ||||||||||
| Net book value of amortizable intangible assets | 6,785,569 | 7,509,591 | ||||||||||
| Goodwill | 867,700 | 837,609 | ||||||||||
| Net book value intangible assets | $ | 7,653,269 | $ | 8,347,200 | ||||||||
For the years ended
December 31, 2009, 2008 and 2007, amortization of intangible assets charged to
operations was approximately $2.4 million, $2.1 million and $1.3 million,
respectively. The weighted average remaining amortization period for intangible
assets as of December 31, 2009 and 2008 was approximately 2.8 and 3.6 years,
respectively. The change in goodwill between 2009 and 2008 is due to translation
as this amount is denominated in a foreign currency.
Estimated amortization
expense, for all intangible assets, for the five years subsequent to December
31, 2009 is as follows:
| Year ending December 31, | ||||
| 2010 | $ | 2,295,000 | ||
| 2011 | 1,751,000 | |||
| 2012 | 939,000 | |||
| 2013 | 633,000 | |||
| 2014 | 423,000 |
Note 7. Line of
Credit
The Company had an
available line of credit from a financial institution of $1.0 million as of
December 31, 2009. The credit line bears interest at defined rates based upon
two different indexes and expires in July, 2010. No amounts were outstanding at
December 31, 2009 and 2008. The company expects to renew this line of credit
upon expiration.
F-21
STRATASYS, INC. AND
SUBSIDIARIES
NOTES TO CONSOLIDATED FINANCIAL STATEMENTS
NOTES TO CONSOLIDATED FINANCIAL STATEMENTS
Note 8. Accounts Payable and Other Current
Liabilities
Accounts payable and
other current liabilities consisted of the following at December 31:
| 2009 | 2008 | |||||
| Trade | $ | 4,833,992 | $ | 6,002,138 | ||
| Compensation, commissions and related benefits | 2,993,844 | 3,962,650 | ||||
| Reserve for warranty expenses | 677,757 | 321,874 | ||||
| Taxes | 2,686,979 | 20,067 | ||||
| Other | 1,682,226 | 1,488,509 | ||||
| $ | 12,874,798 | $ | 11,795,238 | |||
A summary of warranty
activity for the years ended December 31, 2009 and 2008 is as follows:
| 2009 | 2008 | |||||||
| Beginning balance | $ | 321,874 | $ | 270,858 | ||||
| Accruals for warranties issued during the period | 1,280,163 | 454,007 | ||||||
| Warranty costs incurred during the period | (924,280 | ) | (402,991 | ) | ||||
| Ending balance | $ | 677,757 | $ | 321,874 | ||||
Note 9. Unearned
Revenues
Unearned revenues
consisted of the following at December 31:
| 2009 | 2008 | |||||
| Maintenance contracts | $ | 9,223,806 | $ | 9,058,501 | ||
| Implied maintenance contracts | 566,377 | 2,990,228 | ||||
| Other | 888,244 | 716,667 | ||||
| $ | 10,678,427 | $ | 12,765,396 | |||
F-22
STRATASYS, INC. AND
SUBSIDIARIES
NOTES TO CONSOLIDATED FINANCIAL STATEMENTS
NOTES TO CONSOLIDATED FINANCIAL STATEMENTS
Note 10. Income
Taxes
The components of the
Company's deferred tax assets (liabilities) at December 31, 2009 and 2008 were
as follows:
| 2009 | 2008 | |||||||
| Current deferred tax assets: | ||||||||
| Inventory reserves | $ | 700,000 | $ | 713,000 | ||||
| Deferred maintenance revenue | 551,000 | 729,000 | ||||||
| Allowance for doubtful accounts | 330,000 | 307,000 | ||||||
| State research and development | ||||||||
| credit carryforward | 158,000 | 224,000 | ||||||
| Reserve for warranty expenses | 252,000 | 102,000 | ||||||
| Vacation accrual | 239,000 | 167,000 | ||||||
| Reserve for sales returns, net | - | 46,000 | ||||||
| Current deferred tax assets | 2,230,000 | 2,288,000 | ||||||
| Current deferred tax liabilities: | ||||||||
| Unrealized gain on foreign currency | 47,000 | (120,000 | ) | |||||
| Net current deferred tax assets | $ | 2,277,000 | $ | 2,168,000 | ||||
| Long-term deferred tax assets: | ||||||||
| Stock compensation expense | 458,000 | 530,000 | ||||||
| Investment reserves | 694,000 | 551,000 | ||||||
| Amortization | 820,000 | 228,000 | ||||||
| Long-term deferred tax assets | 1,972,000 | 1,309,000 | ||||||
| Long-term deferred tax liabilities: | ||||||||
| Depreciation | (1,047,000 | ) | (1,673,000 | ) | ||||
| Software capitalization | (237,000 | ) | (256,000 | ) | ||||
| Net long-term deferred tax assets (liabilities) | $ | 688,000 | $ | (620,000 | ) | |||
Income (loss) before
income taxes for the years ended December 31, 2009, 2008 and 2007 was as
follows:
| 2009 | 2008 | 2007 | |||||||
| United States | $ | 5,994,420 | $ | 20,270,134 | $ | 19,915,766 | |||
| Foreign | 187,852 | 463,353 | 446,291 | ||||||
| $ | 6,182,272 | $ | 20,733,487 | $ | 20,362,057 | ||||
F-23
STRATASYS, INC. AND
SUBSIDIARIES
NOTES TO CONSOLIDATED FINANCIAL STATEMENTS
NOTES TO CONSOLIDATED FINANCIAL STATEMENTS
The components of income
tax expense for the years ended December 31, 2009, 2008 and 2007 were as
follows:
| 2009 | 2008 | 2007 | |||||||||
| Current | |||||||||||
| Federal | $ | 3,143,000 | $ | 5,976,000 | $ | 6,547,184 | |||||
| State | 416,000 | 878,000 | (718,749 | ) | |||||||
| Foreign | 130,000 | 121,000 | 153,564 | ||||||||
| 3,689,000 | 6,975,000 | 5,981,999 | |||||||||
| Deferred | |||||||||||
| Federal | (1,604,000 | ) | 133,000 | (157,000 | ) | ||||||
| State | (19,000 | ) | 10,000 | 213,000 | |||||||
| (1,623,000 | ) | 143,000 | 56,000 | ||||||||
| Total Income taxes | $ | 2,066,000 | $ | 7,118,000 | $ | 6,037,999 | |||||
During the year ended
December 31, 2009, approximately $83,000 was subtracted from additional paid-in
capital in accordance with ASC 740, Income Taxes,
reflecting the permanent book to tax difference in accounting for tax benefits
related to employee stock option transactions. During the years ended December
31, 2008, and 2007, approximately $42,000, and $1,965,000, respectively, was
added to additional paid-in capital to reflect the permanent book to tax
difference in accounting for tax benefits related to employee stock option
transactions.
A reconciliation of the
statutory federal income tax rate and the effective tax rate for the years ended
December 31, 2009, 2008 and 2007 is set forth below:
| 2009 | 2008 | 2007 | |||||||
| Federal statutory rate | 35.0 | % | 35.0 | % | 35.0 | % | |||
| State income taxes, net of | |||||||||
| federal benefit | 2.6 | 2.5 | 1.9 | ||||||
| Prior year amendments for state | |||||||||
| research and development credits | - | - | (3.7 | ) | |||||
| Tax exempt interest income | (2.6 | ) | (2.0 | ) | (3.2 | ) | |||
| Stock compensation expense | 2.0 | 1.3 | 0.7 | ||||||
| Manufacturing deduction | (2.0 | ) | (1.4 | ) | (1.8 | ) | |||
| Federal research and | |||||||||
| development tax credit | (4.9 | ) | (2.1 | ) | (1.8 | ) | |||
| Tax contingencies | 2.4 | 0.9 | 2.2 | ||||||
| Other | 0.9 | 0.1 | 0.3 | ||||||
| Effective income tax rate | 33.4 | % | 34.3 | % | 29.6 | % | |||
At December 31, 2009 the
Company had Minnesota tax credit carry-forwards of approximately $158,000. The
Company expects to utilize its state research and development tax credit
carry-forwards that would otherwise expire from 2018 through 2023.
Significant judgment is
required in evaluating the Company’s tax positions and determining its provision
for income taxes. During the ordinary course of business, there are many
transactions and calculations for which the ultimate tax determination is
uncertain. The Company establishes reserves for tax-related uncertainties based
on estimates of whether, and the extent to which, additional taxes will be due.
These reserves are established when the Company believes that certain positions
might be challenged despite its belief that its tax return positions are fully
supportable. The Company adjusts these reserves in light of changing facts and
circumstances, such as the outcome of a tax audit or changes in the tax law. The
provision for income taxes includes the impact of reserve provisions and changes
to reserves that are considered appropriate. Accruals for tax contingencies are
provided for in accordance with the requirements of ASC 740.
F-24
STRATASYS, INC. AND
SUBSIDIARIES
NOTES TO CONSOLIDATED FINANCIAL STATEMENTS
NOTES TO CONSOLIDATED FINANCIAL STATEMENTS
The Company is subject
to income taxes in the U.S., various states and certain foreign jurisdictions.
It may be subject to examination by the Internal Revenue Service (“IRS”) for
calendar years 2006 through 2009. Its Federal income tax returns are closed for
all tax years up to and including 2005. The expiration of the statute of
limitations related to the various state income tax returns that the Company and
subsidiaries file varies by state and foreign jurisdiction.
At December 31, 2009 and
2008, the Company had unrecognized tax benefits of $1.2 million and $1.2
million, respectively. If recognized, these benefits would favorably impact the
effective tax rate. A reconciliation of the beginning and ending amount of
unrecognized tax benefits is as follows:
| 2009 | 2008 | |||||||
| Balance at beginning of year | $ | 1,223,000 | $ | 1,021,593 | ||||
| Additions for tax positions related to the current year | 95,000 | 244,208 | ||||||
| Reduction of reserve for reassessment position | (86,000 | ) | (42,801 | ) | ||||
| Balance at end of year | $ | 1,232,000 | $ | 1,223,000 | ||||
The increase in tax
liabilities is primarily due to potential U.S. federal and state adjustments
taken in the Company’s 2009 income tax provision. The Company’s policy is to
include interest and penalties related to its tax contingencies in income tax
expense. The Company currently estimates that unrecognized tax benefits will not
change materially in the next twelve months.
Note 11. Fair Value
Measurements
As discussed in Note 1 -
Recently Issued Accounting Pronouncements, the Company adopted the provisions of
ASC 820, Fair Value Measurements, on January 1, 2008 for financial assets and
liabilities and for non-financial assets and non-financial liabilities measured
on a non-recurring basis on January 1, 2009. Fair value is defined as the exit
price, or the amount that would be received to sell an asset or paid to transfer
a liability in an orderly transaction between market participants as of the
measurement date. A hierarchy has been established for inputs used in measuring
fair value that maximizes the use of observable inputs and minimizes the use of
unobservable inputs by requiring that the most observable inputs be used when
available.
Observable inputs are
inputs market participants would use in valuing the asset or liability developed
based on market data obtained from sources independent of the Company.
Unobservable inputs are inputs that reflect the Company’s assumptions about the
factors market participants would use in valuing the asset or liability
developed based upon the best information available in the circumstances. The
hierarchy is broken down into three levels. Level 1 inputs are quoted prices
(unadjusted) in active markets for identical assets or liabilities. Level 2
inputs include quoted prices for similar assets or liabilities in active
markets, quoted prices for identical or similar assets or liabilities in markets
that are not active, and inputs (other than quoted prices) that are observable
for the asset or liability, either directly or indirectly. Level 3 inputs are
unobservable inputs for the asset or liability. Categorization within the
valuation hierarchy is based upon the lowest level of input that is significant
to the fair value measurement.
Assets and Liabilities that are Measured at Fair Value on a Recurring
Basis:
For financial assets
held by the Company, fair value principally applies to available-for-sale
marketable securities. These items were previously, and will continue to be,
marked-to-market at each reporting period. The information in the following
paragraphs and tables primarily addresses matters relative to these financial
assets. The Company does not have any financial liabilities that are subject to
fair value measurements. Separately, there were no material fair value
measurements with respect to non-financial assets or liabilities that are
recognized or disclosed at fair value in the Company’s financial statements on a
recurring basis subsequent to the effective date of such accounting
guidance.
F-25
STRATASYS, INC. AND
SUBSIDIARIES
NOTES TO CONSOLIDATED FINANCIAL STATEMENTS
NOTES TO CONSOLIDATED FINANCIAL STATEMENTS
The Company uses various
valuation techniques, which are primarily based upon the market approach, with
respect to its financial assets. As discussed in Note 3, a portion of the
auction rate securities held by the Company experienced a significant credit
rating reduction since their acquisition. As a result, investments in auction
rate securities are valued utilizing a quantitative and qualitative third-party
analysis. The Company therefore classifies these securities as Level 3.
The following table
provides a reconciliation of the beginning and ending balances of items measured
at fair value on a recurring basis that used significant unobservable inputs at
December 31:
| Auction rate securities | 2009 | 2008 | ||||||
| Beginning balance | $ | 3,509,250 | $ | 18,800,000 | ||||
| Total gains or (losses): | ||||||||
| Included in earnings | (94,000 | ) | (1,270,750 | ) | ||||
| Included in other comprehensive income | 40,500 | (195,000 | ) | |||||
| Settlements | - | (13,825,000 | ) | |||||
| Ending balance | 3,455,750 | 3,509,250 | ||||||
| Classified as long-term investments - held to maturity | (2,400,000 | ) | (2,400,000 | ) | ||||
| Classified as long-term investments - available for sale securities | $ | 1,055,750 | $ | 1,109,250 | ||||
Assets and Liabilities that are Measured at Fair Value on a Nonrecurring
Basis:
The aspects of ASC 820
for which the effective date was deferred until January 1, 2009 relate to
non-financial assets and liabilities that are measured at fair value but are
recognized or disclosed at fair value on a nonrecurring basis.
At December 31, 2009,
the Company recorded a $350,000 impairment related to a $1.4 million equity
investment that is accounted for under the cost method as prescribed by ASC
Topic 325-20 “Cost Method Investments”. During the fourth quarter, the Company
considered the entity’s current and projected decreases in revenue to be an
impairment indicator and consequently performed a fair value analysis. The
resulting impairment of $350,000 was considered to be other-than-temporary and
was recognized as a charge to other income.
Note 12. Material
Commitments
The Company estimates
that at December 31, 2009 and 2008, it had approximately $13.6 million and $16.3
million, respectively, of purchase commitments for inventory from vendors. The
Company also rents certain of its facilities under non-cancellable operating
leases, which expire through 2011. The Company intends to finance its purchase
commitments from existing cash and investments or from cash flows from
operations.
Aggregate future minimum
annual rental payments in the years subsequent to December 31, 2009 are
approximately as follows:
| Year ending December 31, | ||||
| 2010 | $ | 585,000 | ||
| 2011 | 470,000 | |||
| 2012 | 130,000 |
Rent expense for the
years ended December 31, 2009, 2008 and 2007 was approximately $589,000,
$598,000 and $894,000, respectively.
F-26
STRATASYS, INC. AND SUBSIDIARIES
NOTES TO CONSOLIDATED FINANCIAL STATEMENTS
NOTES TO CONSOLIDATED FINANCIAL STATEMENTS
Note 13. Restructuring
Activities
Beginning January 1,
2009, in North America the Company began selling its Fortus 3D Production
Systems through a select group of resellers from its established reseller
channel, which formerly distributed only the Dimension 3D Printer line. This
restructuring of the Company’s sales organization included costs related to
workforce reductions, closure of certain leased facilities, rebranding expenses,
and other contract termination charges that were recognized in 2008 and were
settled during the first quarter of 2009.
In addition, the Company
took certain cost-saving measures in the first quarter of 2009 that lowered
fixed costs and curtailed some discretionary spending while maintaining a focus
on the key goals and objectives of the Company’s long-term strategy. These
cost-saving measures resulted in a charge of $779,000 in the first quarter of
2009, consisting primarily of severance costs related to a reduction in force.
Final severance payments were completed during the third quarter of 2009 and the
unused portion of the provision, noted as “adjustments” in the table below, was
recorded in income for the current period.
A summary of the
activity of these restructuring and other costs recognized in the Statement of
Operations caption “Selling, general and administrative” is as follows:
| Employee- | Contract | |||||||||||
| Related Items and | Terminations and | |||||||||||
| Benefits | Other | Total | ||||||||||
| Accrued balance as of December 31, 2008 | $ | 306,014 | $ | 66,881 | $ | 372,895 | ||||||
| Expenses incurred | 779,000 | - | 779,000 | |||||||||
| Cash payments | (810,707 | ) | (66,881 | ) | (877,588 | ) | ||||||
| Adjustments | (274,307 | ) | - | (274,307 | ) | |||||||
| Accrued balance as of December 31, 2009 | $ | - | $ | - | $ | - | ||||||
Note 14. Accounting for Collaborative
Arrangements
In 2008, the Company
fulfilled its responsibilities under a three-year, $3.6 million agreement with a
Fortune 500 global manufacturing company to jointly advance its proprietary FDM
technology for rapid manufacturing applications. This agreement entitled the
Company to receive reimbursement payments as it achieved specific milestones
stated in the agreement. This effort was focused around the Company’s
high-performance systems and resulted in the commercial release of the Fortus
900mc. Because receipt of these payments represent reimbursements of costs
actually incurred under this joint development project, all payments received
were recorded as offsets to the research and development expenditures and are
therefore not recognized as revenue.
Due to the success of
this initial arrangement, the Company is continuing this relationship under
similar terms and objectives. During the years ended December 31, 2009, 2008,
and 2007, approximately $2.2 million, $0.3 million, and 1.0 million,
respectively, of research and development expenses were offset by payments that
were received from this company.
Note 15. Foreign Currency
Hedge
The Company invoices
sales to certain European distributors in Euros and reported results are
therefore subject to fluctuations in the exchange rates of that currency in
relation to the United States dollar. The Company’s strategy is to hedge most of
its Euro-denominated accounts receivable positions by entering into 30-day
foreign currency forward contracts on a month-to-month basis to reduce the risk
that its earnings will be adversely affected by changes in currency exchange
rates. The Company does not use derivative financial instruments for speculative
or trading purposes. The Company enters into 30-day foreign currency forward
contracts on the last day of each month and therefore the notional value of the
contract equals the fair value at the end of the reporting period. As such,
there is no related asset or liability or unrealized gains or losses recorded on
the Balance Sheet as of the end of the period. All realized gains and losses
related to hedging activities are recorded in current period earnings under the
Statement of Operations caption “Foreign currency transaction losses,
net”.
F-27
STRATASYS, INC. AND
SUBSIDIARIES
NOTES TO CONSOLIDATED FINANCIAL STATEMENTS
NOTES TO CONSOLIDATED FINANCIAL STATEMENTS
The Company hedged
between €2.8 million and €5.0 million during the year ended December 31, 2009
and between €2.5 million and €5.1 million during the year ended December 31,
2008 related to accounts receivable that were denominated in Euros. The foreign
currency forward contracts resulted in a currency translation loss of
approximately $115,000 for the year ended December 31, 2009 and a gain of
approximately $235,000 for the year ended December 31, 2008.
The Company will
continue to monitor exposure to currency fluctuations. Instruments that may be
used to hedge future risks may include foreign currency forward, swap, and
option contracts. These instruments may be used to selectively manage risks, but
there can be no assurance that we will be fully protected against material
foreign currency fluctuations.
Note 16. Common
Stock
In August 2007, the
Company effected a two-for-one stock split of the Company’s common stock in the
form of a common stock dividend. Prior year share and per-share information has
been retroactively adjusted to reflect the stock split.
The Company has a common
stock repurchase program and repurchased no shares during the year ended
December 31, 2009. The Company repurchased 1,089,575 shares of common stock
during the year ended December 31, 2008. As of December 31, 2009, the Company
had authorization to repurchase approximately $10.9 million of additional common
stock.
F-28
STRATASYS, INC. AND
SUBSIDIARIES
NOTES TO CONSOLIDATED FINANCIAL STATEMENTS
NOTES TO CONSOLIDATED FINANCIAL STATEMENTS
Note 17. Stock Options and
Warrants
The Company has various
stock option plans that have been approved by stockholders. After giving effect
to the Company’s two-for-one stock split, the plans provided for the granting of
options to purchase up to 4,825,000 shares of the Company’s common stock to
qualified employees of the Company, independent contractors, consultants, and
other persons. Of those 4,825,000 shares approved for grant, 3,712,634 have been
granted, leaving 1,112,366 shares available to be granted by the Company as of
December 31, 2009. Options principally vest immediately or ratably over five
years and are exercisable over a period ranging from five years to six years and
one-month. The information presented below has been adjusted to reflect the
Company’s two-for-one stock split.
| Weighted | |||||||||||||||
| Number | Average | ||||||||||||||
| of Options | Per Share | Exercise | |||||||||||||
| Outstanding | Exercise Price | Price | |||||||||||||
| Shares under option | |||||||||||||||
| at January 1, 2007 | 2,305,822 | $ | 0.92 | - | $ | 17.92 | $ | 13.01 | |||||||
| Granted in 2007 | 260,000 | 20.75 | - | 26.15 | 23.11 | ||||||||||
| Exercised in 2007 | (720,894 | ) | 1.02 | - | 14.66 | 11.81 | |||||||||
| Expired in 2007 | (15,900 | ) | 1.00 | - | 2.83 | 1.84 | |||||||||
| Forfeited in 2007 | (27,000 | ) | 1.02 | - | 14.43 | 13.16 | |||||||||
| Shares under option | |||||||||||||||
| at December 31, 2007 | 1,802,028 | 1.02 | 26.15 | 15.02 | |||||||||||
| Granted in 2008 | 281,500 | 9.30 | - | 22.06 | 11.67 | ||||||||||
| Exercised in 2008 | (234,300 | ) | 1.67 | - | 14.43 | 13.78 | |||||||||
| Expired in 2008 | (53,050 | ) | 1.02 | - | 14.30 | 11.78 | |||||||||
| Forfeited in 2008 | (60,800 | ) | 12.49 | - | 23.04 | 15.05 | |||||||||
| Shares under option | |||||||||||||||
| at December 31, 2008 | 1,735,378 | 2.54 | - | 26.15 | 14.42 | ||||||||||
| Granted in 2009 | 283,750 | 8.27 | - | 9.90 | 9.82 | ||||||||||
| Exercised in 2009 | (294,400 | ) | 4.35 | - | 14.53 | 12.90 | |||||||||
| Expired in 2009 | (122,800 | ) | 3.81 | - | 14.43 | 14.30 | |||||||||
| Forfeited in 2009 | (82,300 | ) | 9.30 | - | 23.04 | 14.68 | |||||||||
| Shares under option | |||||||||||||||
| at December 31, 2009 | 1,519,628 | $ | 8.27 | - | $ | 26.15 | $ | 14.08 | |||||||
F-29
STRATASYS, INC. AND SUBSIDIARIES
NOTES TO CONSOLIDATED FINANCIAL STATEMENTS
NOTES TO CONSOLIDATED FINANCIAL STATEMENTS
A summary of stock
options exercisable at December 31, 2009, 2008 and 2007 is as
follows:
| Weighted | |||||||||||||
| Number | Average | ||||||||||||
| of | Per Share | Exercise | |||||||||||
| Shares | Exercise Price | Price | |||||||||||
| Options exercisable at | |||||||||||||
| December 31, 2009 | 735,478 | $ | 8.27 | - | $ | 26.15 | $ | 14.49 | |||||
| Options exercisable at | |||||||||||||
| December 31, 2008 | 1,199,078 | $ | 2.54 | - | $ | 26.15 | $ | 13.57 | |||||
| Options exercisable at | |||||||||||||
| December 31, 2007 | 1,411,978 | $ | 1.67 | - | $ | 17.92 | $ | 14.34 | |||||
The following table
summarizes information about stock options outstanding at December 31, 2009:
| Options Outstanding | Options Exercisable | |||||||||||||
| Number | Weighted- | Number | ||||||||||||
| Outstanding | Average | Weighted- | Exercisable | Weighted- | ||||||||||
| at | Remaining | Average | at | Average | ||||||||||
| Exercise | December 31, | Contractual | Exercise | December 31, | Exercise | |||||||||
| Prices | 2009 | Life in Years | Price | 2009 | Price | |||||||||
| 8.27 - 9.90 | 414,250 | 5.1 | $ | 9.57 | 38,700 | $ | 8.93 | |||||||
| 10.92 - 13.22 | 421,200 | 2.7 | 12.63 | 257,200 | 12.43 | |||||||||
| 14.17 - 14.48 | 424,178 | 0.9 | 14.44 | 350,178 | 14.44 | |||||||||
| 16.17 - 26.15 | 260,000 | 3.9 | 22.82 | 89,400 | 23.01 | |||||||||
| 1,519,628 | 14.08 | 735,478 | 14.49 | |||||||||||
| Aggregate | ||||||||||||||
| intrinsic value | $ | 6,257,438 | $ | 2,554,579 | ||||||||||
The weighted average
life remaining on vested options is 1.6 years. The weighted average grant date
fair value based on the Black-Scholes model was $3.59 for options granted in
2009. The Company issues new shares of common stock upon exercise of stock
options. The total intrinsic value of options exercised was approximately $3.1
million in 2009, $1.1 million in 2008 and $5.8 million in 2007.
The Company used the
Black-Scholes option-pricing model to determine the fair value of grants made in
2009, 2008 and 2007. The following assumptions were applied in determining the
pro forma compensation cost:
| 2009 | 2008 | 2007 | ||||
| Risk-free interest rate | 2.0% | 3.9% | 3.3% | |||
| Expected option term | 4.5 years | 4.5 years | 4.5 years | |||
| Expected price volatility | 40% | 43% | 47% | |||
| Dividend yield | - | - | - |
F-30
STRATASYS, INC. AND
SUBSIDIARIES
NOTES TO CONSOLIDATED FINANCIAL STATEMENTS
NOTES TO CONSOLIDATED FINANCIAL STATEMENTS
The Company’s
computation of expected volatility is based on a combination of historical and
market-based implied volatility from traded options on the Company’s stock. The
expected option term was calculated in accordance with ASC 718, Compensation – Stock
Compensation. The interest rate for periods within the contractual life
of the award is based on the U.S. Treasury yield curve in effect at the time of
grant.
There were no
outstanding warrants to purchase the Company’s common stock at December 31,
2009. As part of the sale of common stock and of other agreements, the Company
had issued warrants to purchase the Company’s common stock. During 2008, 59,639
net shares were issued as a result of the exercise of warrants. Stock warrants
totaling 139,500 shares were exercised at an average price of $11.99 per share;
79,861 shares were surrendered as payment, in lieu of cash, at an average price
of $20.95 per share. As of December 31, 2008, the Company had 310,500 warrants
outstanding with exercise prices ranging from $11.56 to $13.82 with a weighted
average price per share of $12.34. These remaining warrants expired on February
22, 2009 without being exercised.
As of December 31, 2007,
the Company had 450,000 warrants outstanding with at average per share price of
$12.23. No warrants were issued or exercised in 2007.
As of December 31, 2009,
there was approximately $3.1 million of total unrecognized compensation expense
related to unvested share-based compensation granted under the Company’s plans.
That cost is expected to be recognized over a weighted-average period of 2.3
years. The fair value of options shares vested during the year 2009 was
approximately $1.1 million.
Note 18. Litigation
The Company is a party
to various legal matters, the outcome of which, in the opinion of management,
will not have a material adverse effect on the financial position, results of
operations or cash flows of the Company.
Note 19. Export
Sales
Export sales were as
follows for the years ended December 31:
| 2009 | 2008 | 2007 | |||||||
| Europe | $ | 26,308,543 | $ | 37,430,146 | $ | 27,144,055 | |||
| Asia Pacific | 15,814,405 | 18,533,549 | 19,806,049 | ||||||
| Other | 1,076,828 | 1,883,206 | 2,767,662 | ||||||
| $ | 43,199,776 | $ | 57,846,901 | $ | 49,717,766 | ||||
At December 31, 2009 and
2008, accounts receivable included balances due from foreign customers of
approximately $11.7 million and $13.8 million, respectively.
Note 20. Retirement
Plan
The Company has a
defined contribution retirement plan (the “Plan”) under the provisions of
Section 401(k) of the Internal Revenue Code (“IRC”) that covers all eligible
employees as defined in the Plan. Participants may elect to contribute up to 50%
of pre-tax annual compensation, as defined by the Plan, up to a maximum amount
prescribed by the IRC. The Company, at its discretion, makes matching
contributions equal to the lesser of $3,000 or 3% of the participant’s annual
compensation. The Company, at its discretion, may make additional contributions,
also subject to IRC limitations. Due to the weak economy, the company suspended
making discretionary matching contributions in February 2009. For the years
ended December 31, 2009, 2008 and 2007 the Company made 401(k) Plan
contributions of approximately $112,000, $578,000 and $506,000,
respectively.
F-31
STRATASYS, INC. AND
SUBSIDIARIES
NOTES TO CONSOLIDATED FINANCIAL STATEMENTS
NOTES TO CONSOLIDATED FINANCIAL STATEMENTS
Note 21. Quarterly Results
(unaudited)
| First | Second | Third | Fourth | ||||||||||
| Quarter | Quarter | Quarter | Quarter | ||||||||||
| 2009 | |||||||||||||
| Net sales | $ | 23,144,801 | $ | 24,648,277 | $ | 24,329,396 | $ | 26,233,758 | |||||
| Gross profit | 9,572,352 | 11,573,221 | 11,868,254 | 13,369,745 | |||||||||
| Net income (loss) | (703,929 | ) | 849,571 | 1,578,800 | 2,391,829 | ||||||||
| Net income (loss) per common share: | |||||||||||||
| Basic | $ | (0.03 | ) | $ | 0.04 | $ | 0.08 | $ | 0.12 | ||||
| Diluted | (0.03 | ) | 0.04 | 0.08 | 0.12 | ||||||||
| 2008 | |||||||||||||
| Net sales | $ | 30,707,689 | $ | 31,274,922 | $ | 30,569,428 | $ | 31,942,973 | |||||
| Gross profit | 17,363,877 | 17,308,370 | 15,814,438 | 15,925,634 | |||||||||
| Net income | 3,798,569 | 4,096,056 | 3,709,567 | 2,011,295 | |||||||||
| Net income per common share: | |||||||||||||
| Basic | $ | 0.18 | $ | 0.20 | $ | 0.18 | $ | 0.10 | |||||
| Diluted | 0.18 | 0.19 | 0.18 | 0.10 | |||||||||
Note 22. Subsequent
Events
On January 18, 2010, the
Company entered into a Master OEM Agreement (the “Agreement”) with
Hewlett-Packard Company (“HP”). During the initial term of the Agreement, which
expires September 30, 2011, the Company will develop and manufacture a line of
FDM (“Fused Deposition Modeling”) 3D printers and related accessories and
consumables exclusively for HP for resale under the HP brand in France, Germany,
Italy, Spain and the United Kingdom. HP has agreed not to sell any other 3D
printers manufactured by other companies throughout the world for the term of
the Agreement. The term of the Agreement will be extended for additional
one-year periods unless terminated on advance notice by either party. During the
term of the Agreement, the Company has agreed not to sell comparable products
covered by the Agreement directly or indirectly in the territory covered by the
Agreement. The Agreement does not require HP to purchase any minimum quantity of
products.
The Company expects the
first products will be available to be shipped to HP customers in the first half
of 2010. After the initial term or by mutual agreement, the territory in which
HP will have the exclusive right to sell the 3D printers covered by the
Agreement may be expanded to additional countries worldwide.
The Company also entered
into a Protective Rights Agreement with HP in which the Company has agreed to
notify HP if (i) the Company decides to engage in negotiations in response to an
acquisition offer, (ii) the Company decides to investigate a potential
acquisition of the Company, or (iii) the Company becomes aware of an offer
to purchase securities that would result in an acquisition of the Company. The
Protective Rights Agreement will terminate on the earlier of three months after
termination of the Agreement or an acquisition of the Company.
On January 18, 2010, in
connection with the Agreement and the Protective Rights Agreement, the Company
issued a warrant to HP to purchase 500,000 shares of common stock at an exercise
price of $17.78 per share (the “Warrant”), which vests immediately. The Company
relied on the exemption from registration contained in Section 4(2) of the
Securities Act of 1933, as amended, and Regulation D, Rule 506 thereunder, for
the issuance of the Warrant. The Company expects to take a non-cash charge of
approximately $5.0 million during the first quarter of 2010 related to the value
of these warrants.
F-32
|
SCHEDULE II
|
|||||||||||||||
|
VALUATION AND QUALIFYING ACCOUNTS AND
RESERVES
|
|||||||||||||||
|
Years Ended
December 31, 2009, 2008, and 2007
|
|||||||||||||||
| COLUMN A | Column B | Column C - Additions | Column D | Column E | |||||||||||
| Balances at | Charged to | Balances | |||||||||||||
| beginning | costs and | Charged to | at end | ||||||||||||
| Description | of period | expenses | other accounts | Deductions | of period | ||||||||||
| 2009 | |||||||||||||||
| Reserve for bad debts and allowances | $ | 1,225,606 | $ | 672,241 | $ | - | $ | 772,735 | 1,125,112 | ||||||
| Reserve for sales returns and other allowances | 121,556 | - | - | 121,556 | - | ||||||||||
| 2008 | |||||||||||||||
| Reserve for bad debts and allowances | 1,169,464 | 441,321 | - | 385,179 | 1,225,606 | ||||||||||
| Reserve for sales returns and other allowances | 191,006 | - | - | 69,450 | 121,556 | ||||||||||
| 2007 | |||||||||||||||
| Reserve for bad debts and allowances | 1,097,193 | 749,977 | - | 677,706 | 1,169,464 | ||||||||||
| Reserve for sales returns and other allowances | 168,644 | 170,700 | - | 148,338 | 191,006 | ||||||||||
F-33
(b) Exhibits
| EXHIBIT | ||
| NO. | DESCRIPTION | |
| 3.1 | Restated Certificate of Incorporation of the Company.(8) | |
| 3.2 | Amended and Restated By-Laws of the Company.(7) | |
| 10.1 | Non-Competition Agreement between the Company and S. Scott Crump, dated October 15, 1990.(1) | |
| 10.2 | Employee Confidentiality Agreement between the Company and S. Scott Crump, dated October 15, 1990.(1) | |
| 10.3 | Stratasys, Inc. 1998 Incentive Stock Option Plan.(4)* | |
| 10.4 | Stratasys, Inc. 2000 Incentive Stock Option Plan.(5)* | |
| 10.5 | Stratasys, Inc. 2002 Long-Term Performance and Incentive Plan.(6)* | |
| 10.6 | Stratasys, Inc. 2008 Long-Term Performance and Incentive Plan.(9)* | |
| 10.7 | Form of Option Agreement for employees.(9)* | |
| 10.8 | Form of Option Agreement for directors.(9)* | |
| 10.9 | Assignment, dated October 23, 1989, from S. Scott Crump to the Company with respect to a patent application for an apparatus and method for creating three-dimensional objects.(3) | |
| 10.10 | Assignment, dated June 5, 1992, from S. Scott Crump to the Company with respect to a patent application for a modeling apparatus for three dimensional objects.(3) | |
| 10.11 | Assignment, dated June 1, 1994, from S. Scott Crump, James W. Comb, William R. Priedeman, Jr., and Robert Zinniel to the Company with respect to a patent application for a process and apparatus of support removal for three-dimensional modeling.(3) | |
| 10.12 | Asset Purchase Agreement between the Company and IBM dated January 1, 1995.(2) | |
| 14.1 | Code of Business Conduct and Ethics.(9) | |
| 21.1 | Subsidiaries of the Company.(8) | |
| 23.1 | Consent of Grant Thornton LLP.(10) | |
| 31.1 | Certification pursuant to Rules 13a-14(a) and 15d-14(a) under the Securities Exchange Act of 1934, as adopted pursuant to Section 302 of the Sarbanes-Oxley Act of 2002.(10) | |
| 31.2 | Certification pursuant to Rules 13a-14(a) and 15d-14(a) under the Securities Exchange Act of 1934, as adopted pursuant to Section 302 of the Sarbanes-Oxley Act of 2002.(10) |
| EXHIBIT | ||
| NO. | DESCRIPTION | |
| 32.1 | Certification pursuant to 18 U.S.C. Section 1350, as adopted pursuant to Section 906 of the Sarbanes-Oxley Act of 2002.(10) | |
| 32.2 | Certification pursuant to 18 U.S.C. Section 1350, as adopted pursuant to Section 906 of the Sarbanes-Oxley Act of 2002.(10) |
| (1) | Incorporated by reference from the Company’s Registration Statement on Form SB-2 (File No. 33- 83638-C) filed September 2, 1994. |
| (2) | Incorporated by reference from the Company’s Form 8-K, Amendment No. 2, dated January 1, 1995. |
| (3) | Incorporated by reference from Amendment No. 1 to the Registration Statement on Form SB-2 (File No. 33-99108) filed December 20, 1995. |
| (4) | Incorporated by reference from the Company’s definitive Proxy Statement on Schedule 14A with respect to the Company’s 1998 Annual Meeting of Stockholders. |
| (5) | Incorporated by reference from the Company’s Registration Statement on Form S-8 (File No. 333- 32782) filed March 17, 2000. |
| (6) | Incorporated by reference from the Company’s definitive Proxy Statement on Schedule 14A with respect to the Company’s 2002 Annual Meeting of Stockholders. |
| (7) | Incorporated by reference from the Company’s Form 8-K filed July 31, 2007. |
| (8) | Incorporated by reference from the Company’s Form 10-K for the year ended December 31, 2007. |
| (9) | Incorporated by reference from the Company’s Form 10-K for the year ended December 31, 2008. |
| (10) | Filed herewith. |
|
*
|
Compensatory plan
or arrangement.
|
(c) Other required financial
statements
All other
schedules called for under Regulation S-X are not submitted because they are not
applicable or not required, or because the required information is included in
the financial statements or notes thereto.
Separate financial statements of the
Registrant have been omitted because the Registrant is primarily an operating
company. All subsidiaries included in the consolidated financial statements are
majority owned, and none of the subsidiaries have indebtedness that is not
guaranteed by the Registrant.
SIGNATURES
Pursuant to the requirements of
Section 13 or 15(d) of the Securities Exchange Act of 1934, the registrant has
duly caused this report to be signed on its behalf by the undersigned, thereunto
duly authorized.
|
STRATASYS,
INC.
|
|||
| By: | /s/ S. SCOTT CRUMP | ||
| S. Scott Crump | |||
| President | |||
| Dated: | March 8, 2010 | ||
Pursuant to the requirements of the
Securities Exchange Act of 1934, this report has been signed below by the
following persons on behalf of the registrant and in the capacities and on the
dates indicated.
| Chairman of the Board of Directors, | ||||
| /s/ S. SCOTT CRUMP | President, Chief Executive Officer, | March 8, 2010 | ||
| S. Scott Crump | Treasurer (Principal Executive | |||
| Officer) | ||||
| /s/ ROBERT F. GALLAGHER | Chief Financial Officer (Principal | March 8, 2010 | ||
| Robert F. Gallagher | Financial and Accounting Officer) | |||
| /s/ RALPH E. CRUMP | Director | March 8, 2010 | ||
| Ralph E. Crump | ||||
| /s/ EDWARD J. FIERKO | Director | March 8, 2010 | ||
| Edward J. Fierko | ||||
| /s/ JOHN J. MCELENEY | Director | March 8, 2010 | ||
| John J. McEleney | ||||
| /s/ CLIFFORD H. SCHWIETER | Director | March 8, 2010 | ||
| Clifford H. Schwieter | ||||
| /s/ GREGORY L. WILSON | Director | March 8, 2010 | ||
| Gregory L. Wilson |