Attached files
UNITED STATES
SECURITIES AND EXCHANGE COMMISSION
WASHINGTON, D.C. 20549
FORM 10-K
| x | ANNUAL REPORT PURSUANT TO SECTION 13 OR 15(d) OF THE SECURITIES EXCHANGE ACT OF 1934 |
For the fiscal year ended December 31, 2009
or
| ¨ | TRANSITION REPORT PURSUANT TO SECTION 13 OR 15(d) OF THE SECURITIES EXCHANGE ACT OF 1934 |
For transition period from to
Commission File Number 0-51331
BANKFINANCIAL CORPORATION
(Exact Name of Registrant as Specified in Charter)
| Maryland | 75-3199276 | |
| (State or Other Jurisdiction of Incorporation) |
(I.R.S. Employer Identification No.) |
| 15W060 North Frontage Road, Burr Ridge, Illinois | 60527 | |
| (Address of Principal Executive Offices) | (Zip Code) |
Registrant’s telephone number, including area code: (800) 894-6900
Securities registered pursuant to Section 12(b) of the Act:
| Title of Each Class: | Name of Each Exchange on Which Registered: | |
| Common Stock, par value $0.01 per share | The NASDAQ Stock Market LLC |
Securities registered pursuant to Section 12(g) of the Act:
None
Indicate by check mark whether the issuer is a well-known seasoned issuer as defined in Rule 405 of the Securities Act. Yes ¨ No x.
Indicate by check mark if the registrant is not required to file reports pursuant to Section 13 or Section 15(d) of the Act. Yes ¨ No x.
Indicate by check mark whether the registrant (1) has filed all reports required to be filed by Section 13 or 15(d) of the Securities Exchange Act of 1934 during the preceding 12 months (or for such shorter period that the registrant was required to file such reports), and (2) has been subject to such filing requirements for the past 90 days. Yes x No ¨.
Indicate by check mark whether the registrant has submitted electronically and posted on its corporate Web site, if any, every Interactive Data File required to be submitted and posted pursuant to Rule 405 of Regulation S-T during the preceding 12 months (or for such shorter period that the registrant was required to submit and post such files). Yes ¨ No x
Indicate by check mark whether the registrant is a large accelerated filer, an accelerated filer, or a non-accelerated filer, or a smaller reporting company. See definitions of “large accelerated filer,” “accelerated filer” and “smaller reporting company” in Rule 12b-2 of the Exchange Act. (Check one):
| Large accelerated filer | ¨ | Accelerated filer | x | |||
| Non-accelerated filer | ¨ | Smaller reporting company | ¨ | |||
Indicate by check mark whether the registrant is a shell company (as defined in Rule 12b-2 of the Exchange Act). Yes ¨ No x.
The aggregate market value of the registrant’s outstanding voting common stock held by non-affiliates on June 30, 2009, determined using a per share closing price on that date of $8.86, as quoted on The Nasdaq Stock Market, was $181.2 million.
At March 5, 2010, there were 21,416,377 shares of common stock, $0.01 par value, outstanding.
DOCUMENTS INCORPORATED BY REFERENCE
None
PART I
| ITEM 1. | BUSINESS |
Forward Looking Statements
This Annual Report on Form 10-K contains, and other periodic and current reports and press releases of BankFinancial Corporation may contain, forward-looking statements within the meaning of Section 21E of the Securities Exchange Act of 1934, as amended, that involve significant risks and uncertainties. We intend such forward-looking statements to be covered by the safe harbor provisions for forward-looking statements contained in the Private Securities Litigation Reform Act of 1995, and are including this statement for the purpose of invoking these safe harbor provisions. Forward-looking statements are based on certain assumptions or describe our future plans, strategies and expectations, and are generally identifiable by use of the words “believe,” “expect,” “intend,” “anticipate,” “estimate,” “project,” “plan,” or similar expressions. Our ability to predict results or the actual effect of plans or strategies is inherently uncertain, and actual results or effects may differ from those predicted. Factors that could have a material adverse effect on operations and could affect management’s outlook or our future prospects include, but are not limited to: higher than expected overhead, infrastructure and compliance costs, changes in market interest rates, changes in the yield curve, balance sheet shrinkage or less than anticipated balance sheet growth, lack of demand for loan products, illiquidity and changes in financial markets, including the market for mortgage backed securities and other debt obligations, declining demand for real estate and real estate valuations, increasing unemployment levels, deposit flows, pricing, underwriting and other forms of competition, adverse federal or state legislative or regulatory developments, monetary and fiscal policies of the U.S. Government, including policies of the U.S. Treasury and Federal Reserve Board, adverse economic conditions that could result in increased delinquencies in our loan portfolio or a decline in the value of our investment securities and the collateral for our loans, the quality or composition of our loan or investment portfolios, demand for financial services and multi-family, commercial and residential real estate loans in our market areas, the possible dilutive effect of potential acquisitions or de novo branches, if any, changes in accounting principles, policies and guidelines, increased costs of federal deposit insurance, and future adverse developments concerning the Federal Home Loan Bank of Chicago. These risks and uncertainties, as well as the Risk Factors set forth in Item 1A below, should be considered in evaluating forward-looking statements and undue reliance should not be placed on such statements. We do not undertake any obligation to update any forward-looking statement in the future, or to reflect circumstances and events that occur after the date on which the forward-looking statement was made.
BankFinancial Corporation
BankFinancial Corporation, a Maryland corporation headquartered in Burr Ridge, Illinois (the “Company”), became the owner of all of the issued and outstanding capital stock of BankFinancial, F.S.B. (the “Bank”) on June 23, 2005, when we consummated a plan of conversion and reorganization that the Bank and its predecessor holding companies, BankFinancial MHC, Inc. (“BankFinancial MHC”) and BankFinancial Corporation, a federal corporation, adopted on August 25, 2004. BankFinancial Corporation, the Maryland corporation, was organized in 2004 to facilitate the mutual-to-stock conversion and to become the holding company for the Bank upon its completion.
As part of the mutual-to-stock conversion, BankFinancial Corporation, the Maryland corporation, sold 24,466,250 shares of common stock in a subscription offering for $10.00 per share. The separate corporate existences of BankFinancial MHC and BankFinancial Corporation, the federal corporation, ceased upon the completion of the mutual-to-stock conversion. For a further discussion of the mutual-to-stock conversion, see our Prospectus as filed on April 29, 2005 with the Securities and Exchange Commission (“SEC”) pursuant to Rule 424(b)(3) of the Rules and Regulations of the Securities Act of 1933 (File Number 333-119217).
BankFinancial Corporation, the Maryland corporation, did not engage in any business prior to the completion of the mutual-to-stock conversion on June 23, 2005. Consequently, this Annual Report on Form 10-K reflects the financial condition and operating results of BankFinancial MHC and BankFinancial Corporation, the federal corporation, and their subsidiaries, including the Bank, until June 23, 2005, and of BankFinancial Corporation, the Maryland corporation, and its subsidiaries, including the Bank, thereafter. The words “Company,” “we” and “our” thus are intended to refer to BankFinancial MHC, BankFinancial Corporation, the federal corporation, and their subsidiaries with respect to matters and time periods occurring on or before June 23, 2005, and to BankFinancial Corporation, the Maryland corporation, and its subsidiaries, with respect to matters and time periods occurring thereafter.
2
We manage our operations as one unit, and thus do not have separate operating segments. Our chief operating decision-makers use consolidated results to make operating and strategic decisions.
BankFinancial, F.S.B.
The Bank is a full-service, community-oriented savings bank principally engaged in the business of commercial, family and personal banking, and offers our customers a broad range of loan, deposit, and other financial products and services through 18 full-service banking offices and three Express Branch facilities located in Cook, DuPage, Lake and Will Counties, Illinois, and through our Internet Branch, www.bankfinancial.com.
The Bank’s primary business is making loans and accepting deposits. The Bank also offers our customers a variety of financial products and services that are related or ancillary to loans and deposits, including cash management, funds transfers, bill payment and other online banking transactions, automated teller machines, safe deposit boxes, wealth management, and general insurance agency services.
The Bank’s primary lending area consists of the counties where our branch offices are located, and contiguous counties in the State of Illinois. We derive the most significant portion of our revenues from these geographic areas. Through our Wholesale Commercial Lending and National Commercial Leasing Departments, we also engage in multi-family lending activities in selected metropolitan areas outside our primary lending area and in commercial leasing activities on a nationwide basis. The Bank’s primary market for deposits is concentrated around the areas where our full-service banking offices and Express Branch facilities are located.
Lending Activities
Our loan portfolio consists primarily of investment and business loans (multi-family, nonresidential real estate, commercial, construction and land loans, and commercial leases), which represent 76.4% of our loan portfolio. At December 31, 2009, $329.2 million, or 26.7%, of our total loan portfolio consisted of multi-family mortgage loans; $316.6 million, or 25.6%, of our total loan portfolio consisted of nonresidential real estate loans; $88.1 million, or 7.1%, of our total loan portfolio consisted of commercial loans; $176.8 million, or 14.3%, of our total loan portfolio consisted of commercial leases; and $32.6 million, or 2.6%, of our total loan portfolio consisted of construction and land loans. $289.6 million, or 23.4%, of our total loan portfolio consisted of one-to-four family residential mortgage loans (of which $81.1 million, or 6.6%, were loans to investors in non-owner-occupied single-family homes), including home equity loans and lines of credit and other second mortgage loans.
Deposit Activities
Our deposit accounts consist principally of savings accounts, NOW accounts, checking accounts, money market accounts, certificates of deposit, and IRAs and other qualified plan accounts. We provide commercial checking accounts and related services such as cash management. We also provide low-cost checking account services. We rely on our favorable locations, customer service, competitive pricing, our Internet Branch and related deposit services such as cash management to attract and retain deposit accounts.
At December 31, 2009, our deposits totaled $1.233 billion. Interest-bearing deposits totaled $1.125 billion and noninterest-bearing demand deposits totaled $108.3 million, which included $4.9 million in internal checking accounts such as bank cashier checks and money orders. Savings, money market and NOW account deposits totaled $721.5 million, and certificates of deposit totaled $403.6 million, of which $327.6 million had maturities of one year or less.
3
Related Products and Services
The Bank’s Wealth Management Group provides investment, financial planning and other wealth management services to our customers through arrangements with a third-party broker-dealer. The Bank’s wholly-owned subsidiary, Financial Assurance Services, Inc. (“Financial Assurance”), sells life insurance, fixed annuities, property and casualty insurance and other insurance products on an agency basis. On March 15, 2008, Financial Assurance completed the sale of its title insurance agency business to a newly formed, third-party title insurance agency. The sale of the title insurance agency business does not affect the Bank’s other insurance businesses. During the year ended December 31, 2009, Financial Assurance Services reported net income of $184,000, and had five full-time employees. The Bank’s other wholly-owned subsidiary, BF Asset Recovery Corporation, is in the business of holding title to and selling certain Bank-owned multi-family and commercial real estate, and reported a loss of $551,000 for the year ended December 31, 2009.
Website and Stockholder Information
The website for the Company and the Bank is www.bankfinancial.com. Information on this website does not constitute part of this Form 10-K.
The Company makes available, free of charge, its Form 10-K, its quarterly reports on Form 10-Q, its current reports on Form 8-K and amendments to such reports filed or furnished pursuant to Section 13(a) or 15(d) of the Securities Exchange Act of 1934, as amended (the “Exchange Act”), as soon as reasonably practicable after such forms are filed with or furnished to the SEC. Copies of these documents are available to stockholders at BankFinancial’s web site, www.bankfinancial.com, under Stockholder Information and at the SEC’s web site, www.sec.gov.
Competition
We face significant competition in both originating loans and attracting deposits. The Chicago metropolitan area and some other areas in which we operate have a high concentration of financial institutions, many of which are significantly larger institutions that have greater financial resources than we have, and many of which are our competitors to varying degrees. Our competition for loans and leases comes principally from commercial banks, savings banks, mortgage banking companies, credit unions, leasing companies, insurance companies, real estate conduits and other companies that provide financial services to businesses and individuals. Our most direct competition for deposits has historically come from commercial banks, savings banks and credit unions. We face additional competition for deposits from online financial institutions and non-depository competitors such as the mutual fund industry, securities and brokerage firms and insurance companies.
We seek to meet this competition by emphasizing personalized service and efficient decision-making tailored to individual needs. In addition, we reward long-standing relationships with preferred rates and terms on deposit products based on existing and prospective lending business. We do not rely on any individual, group or entity for a material portion of our loans or our deposits.
Employees
At December 31, 2009, we had 358 full-time employees and 27 part-time employees. The employees are not represented by a collective bargaining unit and we consider our working relationship with our employees to be good.
Supervision and Regulation
General
As a federally chartered savings bank, the Bank is regulated and supervised primarily by the Office of Thrift Supervision (“OTS”). The Bank is also subject to regulation by the Federal Deposit Insurance Corporation (“FDIC”) in more limited circumstances because the Bank’s deposits are insured by the FDIC. This regulatory and supervisory structure establishes a comprehensive framework of activities in which a financial institution may engage, and is intended primarily for the protection of the FDIC’s deposit insurance funds, depositors and the banking system. Under this system of federal regulation, financial institutions are periodically examined to ensure that they satisfy applicable standards with respect to their capital adequacy, assets, management, earnings, liquidity and sensitivity to market interest rates. After completing an examination, the OTS critiques the financial institution’s operations in a report of examination and assigns its rating (known as an institution’s CAMELS rating). Under federal law, an institution may not disclose its CAMELS rating to the public.
4
The Bank is a member of, and owns stock in, the Federal Home Loan Bank of Chicago (“FHLBC”), which is one of the 12 regional banks in the Federal Home Loan Bank System. The Bank also is regulated to a lesser extent by the Board of Governors of the Federal Reserve System with regard to reserves it must maintain against deposits and other matters. The OTS examines the Bank and prepares reports for the consideration of its Board of Directors on any identified operating deficiencies. The Bank’s relationship with its depositors and borrowers also is regulated to a great extent by both federal and state laws, especially in matters concerning the ownership of deposit accounts, the form and content of the Bank’s loan documents and compliance with consumer and banking laws.
There can be no assurance that laws, rules and regulations will not change in the future, which could make compliance more difficult or expensive or otherwise adversely affect our business, financial condition, results of operations or prospects. Any change in these laws or regulations, or in regulatory policy, whether by the FDIC, the OTS, the Board of Governors of the Federal Reserve System or Congress, could have a material adverse impact on the Company, the Bank and their respective operations.
Proposed Regulatory Changes
In response to the recent financial crisis, the U.S. Senate and House of Representatives and the Executive Branch of the U.S. government are considering numerous proposals relating to long-term regulatory reform of the U.S. banking system and financial markets. Among other things, legislation has been introduced that would implement sweeping changes to the current bank regulatory structure described in this section, including the elimination of the OTS and the consolidation of its supervisory and regulatory authority into one or more new or different regulatory agencies. Some of these proposals would impose stricter capital and prudential standards, reporting, disclosure, operational and compliance requirements on financial institutions. Accordingly, it is possible that there will be significant changes to the manner and method in which the Company and the Bank will be regulated in the future.
Federal Banking Regulation
Business Activities. As a federal savings bank, the Bank derives its lending and investment powers from the Home Owners’ Loan Act, as amended, and the regulations of the OTS. Under these laws and regulations, the Bank may invest in mortgage loans secured by residential and nonresidential real estate, commercial business and consumer loans, certain types of securities and certain other loans and assets. Specifically, the Bank may originate, invest in, sell, or purchase unlimited loans on the security of residential real estate, while loans on nonresidential real property generally may not exceed, in the aggregate, 400% of the Bank’s total capital. In addition, secured and unsecured commercial loans and certain types of commercial personal property leases may not exceed 20% of the Bank’s assets; however, amounts in excess of 10% of assets may only be used for small business loans. Further, the Bank may generally invest up to 35% of its assets in consumer loans, corporate debt securities and commercial paper on a combined basis, and up to the greater of its capital or 5% of its assets in unsecured construction loans. The Bank may invest up to 10% of its assets in tangible personal property, for rental or sale. Certain leases on tangible personal property are not aggregated with commercial or consumer loans for the purposes of determining compliance with the limitations set forth for those investment categories. The Bank also may establish subsidiaries that may engage in activities not otherwise permissible for the Bank directly, including real estate investment and insurance agency activities. A violation of the lending and investment limitations may be subject to the same enforcement mechanisms of the primary federal regulator as other violations of a law or regulation.
Capital Requirements. The regulations of the OTS require savings banks to meet three minimum capital standards: a ratio of tangible capital to adjusted total assets of 1.5%, a ratio of Tier 1 (core) capital to adjusted total assets of 4.0% (3% for institutions receiving the highest rating on the CAMELS rating system), and a ratio of total capital to total risk-adjusted assets of 8.0%. The prompt corrective action standards discussed below, in effect, establish a minimum 2% tangible capital standard.
The risk-based capital standard for savings banks requires the maintenance of Tier 1, or core capital, and total capital (which is defined as core capital and supplementary capital) to risk-weighted assets of at least 4% and 8%, respectively. In determining the amount of risk-weighted assets, all assets, including certain off-balance sheet assets, are multiplied by a risk-weight factor of 0% to 100%, assigned by the OTS capital regulation based on the risks inherent in the type of asset. Core capital is defined as common stockholders’ equity (including retained earnings), certain noncumulative perpetual preferred stock and related surplus and minority interests in equity accounts of consolidated subsidiaries, less intangibles other than certain mortgage servicing rights and credit card relationships. The components of supplementary capital currently include cumulative perpetual preferred stock, long-term preferred stock, mandatory convertible securities, subordinated debt and intermediate-term preferred stock, allowance for loan and lease losses up to a maximum of 1.25% of risk-weighted assets and up to 45% of net unrealized gains on available-for-sale equity securities with readily determinable fair market values. Overall, the amount of supplementary capital included as part of total capital cannot exceed 100% of core capital.
5
At December 31, 2009, the Bank’s capital exceeded all applicable requirements.
Loans-to-One-Borrower. A federal savings bank generally may not make a loan or extend credit to a single or related group of borrowers in excess of 15% of unimpaired capital and surplus. An additional amount may be loaned, equal to 10% of unimpaired capital and surplus, if the loan is secured by readily marketable collateral, which generally does not include real estate. As of December 31, 2009, the Bank was in compliance with the loans-to-one-borrower limitations.
Qualified Thrift Lender Test. As a federal savings bank, the Bank is subject to a qualified thrift lender, or “QTL,” test. Under the QTL test, the Bank must maintain at least 65% of its “portfolio assets” in “qualified thrift investments” in at least nine months of the most recent 12-month period. “Portfolio assets” generally means total assets of a savings institution, less the sum of specified liquid assets up to 20% of total assets, goodwill and other intangible assets, and the value of property used in the conduct of the savings bank’s business.
“Qualified thrift investments” include various types of loans made for residential and housing purposes, investments related to those purposes, including certain mortgage-backed and related securities, and loans for personal, family, household and certain other purposes up to a limit of 20% of portfolio assets. “Qualified thrift investments” also include 100% of an institution’s credit card loans, education loans and small business loans. The Bank also may satisfy the QTL test by qualifying as a “domestic building and loan association” as defined in the Internal Revenue Code of 1986. At December 31, 2009, the Bank maintained approximately 78.17% of its portfolio assets in qualified thrift investments, and as of that date, satisfied the QTL test. A savings bank that fails the QTL test must either convert to a bank charter or operate under specified restrictions, including limits on growth, branching, new investment, FHLBC advances and dividends.
Capital Distributions. The regulations of the OTS govern capital distributions by a federal savings bank, which include cash dividends, stock repurchases and other transactions charged to the institution’s capital account. A savings bank must file an application for approval of a capital distribution if:
| • | the total capital distributions for the applicable calendar year exceed the sum of the savings bank’s net income for that year to date plus the savings bank’s retained net income for the preceding two years; |
| • | the savings bank would not be at least adequately capitalized following the distribution; |
| • | the distribution would violate any applicable statute, regulation, agreement or OTS-imposed condition; or |
| • | the savings bank is not eligible for expedited treatment of its filings. |
Even if an application is not otherwise required, every savings bank that is a subsidiary of a holding company must still file a notice with the OTS at least 30 days before the board of directors declares a dividend or approves a capital distribution. At December 31, 2009, the Bank would be required to file an application for approval of a capital distribution from BankFinancial, FSB.
The OTS may disapprove a notice or application if:
| • | the savings bank would be undercapitalized following the distribution; |
| • | the proposed capital distribution raises safety and soundness concerns; or |
6
| • | the capital distribution would violate a prohibition contained in any statute, regulation or agreement. |
Liquidity. A federal savings bank is required to maintain a sufficient amount of liquid assets to ensure its safe and sound operation.
Community Reinvestment Act and Fair Lending Laws. All savings banks have a responsibility under the Community Reinvestment Act (“CRA”) and related regulations of the OTS to help meet the credit needs of their communities, including low and moderate income neighborhoods. In connection with its examination of a federal savings bank, the OTS is required to evaluate and rate the savings bank’s record of compliance with the CRA. In addition, the Equal Credit Opportunity Act and the Fair Housing Act prohibit lenders from discriminating in their lending practices on the basis of characteristics specified in those statutes. A savings bank’s failure to comply with the provisions of the CRA could, at a minimum, result in regulatory restrictions on its activities. The failure to comply with the Equal Credit Opportunity Act and the Fair Housing Act could result in enforcement actions by the OTS, as well as other federal regulatory agencies and the Department of Justice. The OTS has rated the Bank’s CRA performance as “Outstanding,” the highest possible rating, in all CRA Performance Evaluations the OTS has completed on the Bank since 1999.
Privacy Standards. Financial institutions are subject to regulations implementing the privacy protection provisions of the Gramm-Leach-Bliley Act. These regulations require the Bank to disclose its privacy policy, including identifying with whom it shares “nonpublic personal information” to customers at the time of establishing the customer relationship and annually thereafter. In addition, the Bank is required to provide its customers with the ability to “opt-out” of or consent to having the Bank share their nonpublic personal information with unaffiliated third parties before it can disclose such information, subject to certain exceptions. The implementation of these regulations did not have a material adverse effect on the Bank. The Gramm-Leach-Bliley Act also allows each state to enact legislation that is more protective of consumers’ personal information.
The OTS and other federal banking agencies have adopted guidelines establishing standards for safeguarding customer information to implement certain provisions of the Gramm-Leach-Bliley Act. The guidelines describe the agencies’ expectations for the creation, implementation and maintenance of an information security program, which would include administrative, technical and physical safeguards appropriate to the size and complexity of a financial institution and the nature and scope of its activities. The standards set forth in the guidelines are intended to ensure the security and confidentiality of customer records and information, to protect against any anticipated threats or hazards to the security or integrity of such records, and to protect against unauthorized access to or use of such records or other information that could result in substantial harm or inconvenience to any customer. The Bank has implemented these guidelines, and such implementation has not had a material adverse effect on our operations.
Transactions with Related Parties. A federal savings bank’s authority to engage in transactions with its “affiliates” is limited by OTS regulations and by Sections 23A and 23B of the Federal Reserve Act and its implementing Regulation W. The term “affiliates” for these purposes generally means any company that controls or is under common control with an insured depository institution, although subsidiaries of federal savings banks are generally not considered affiliates for the purposes of Sections 23A and 23B of the Federal Reserve Act. The Company is an affiliate of the Bank. In general, transactions with affiliates must be on terms that are as favorable to the savings bank as comparable transactions with non-affiliates. In addition, certain types of these transactions are restricted to an aggregate percentage of the savings bank’s capital. Collateral in specified amounts must usually be provided by affiliates in order to receive loans from the savings bank. OTS regulations also prohibit a savings bank from lending to any of its affiliates that are engaged in activities that are not permissible for bank holding companies, and from purchasing the securities of any affiliate, other than a subsidiary.
The Bank’s authority to extend credit to its directors, executive officers and 10% stockholders, as well as to entities controlled by such persons, is currently governed by the requirements of Sections 22(g) and 22(h) of the Federal Reserve Act and Regulation O of the Federal Reserve Board. Among other things, these provisions require that extensions of credit to insiders be made on terms that are substantially the same as, and follow credit underwriting procedures that are not less stringent than, those prevailing for comparable transactions with unaffiliated persons and that do not involve more than the normal risk of repayment or present other unfavorable features, and not exceed certain limitations on the amount of credit extended to such persons, individually and in the aggregate, which limits are based, in part, on the amount of the Bank’s capital. In addition, extensions of credit in excess of certain limits must be approved by the Bank’s Board of Directors.
7
Enforcement. The OTS has primary enforcement responsibility over federal savings institutions, and has the authority to bring enforcement action against the Bank and all “institution-affiliated parties,” including stockholders, attorneys, appraisers and accountants who knowingly or recklessly participate in wrongful action likely to have an adverse effect on an insured institution. Formal enforcement action may range from the issuance of a capital directive or cease and desist order to removal of officers and/or directors of the institution, receivership, conservatorship or the termination of deposit insurance. Civil monetary penalties cover a wide range of violations and actions, and range up to $25,000 per day, unless a finding of reckless disregard is made, in which case penalties may be as high as $1 million per day. The FDIC also has the authority to recommend to the Director of the OTS that enforcement action be taken with respect to a particular savings institution. If action is not taken by the Director, the FDIC has authority to take action under specified circumstances.
Standards for Safety and Soundness. Federal law requires each federal banking agency to prescribe certain standards for all insured depository institutions. These standards relate to, among other things, internal controls, information systems and audit systems, loan documentation, credit underwriting, interest rate risk exposure, asset growth, compensation and other operational and managerial standards as the agency deems appropriate. The federal banking agencies adopted Interagency Guidelines Prescribing Standards for Safety and Soundness to implement the safety and soundness standards required under federal law. The guidelines set forth the safety and soundness standards that the federal banking agencies use to identify and address problems at insured depository institutions before capital becomes impaired. The guidelines address internal controls and information systems, internal audit systems, credit underwriting, loan documentation, interest rate risk exposure, asset growth, compensation, fees and benefits. If the appropriate federal banking agency determines that an institution fails to meet any standard prescribed by the guidelines, the agency may require the institution to submit to the agency an acceptable plan to achieve compliance with the standard.
Prompt Corrective Action Regulations. Under the prompt corrective action regulations, the OTS is required and authorized to take supervisory actions against undercapitalized savings banks. For this purpose, a savings bank is placed in one of the following five categories based on the savings bank’s capital:
| • | well-capitalized (at least 5% leverage capital, 6% tier 1 risk-based capital and 10% total risk-based capital); |
| • | adequately capitalized (at least 4% leverage capital, 4% tier 1 risk-based capital and 8% total risk-based capital); |
| • | undercapitalized (less than 3% leverage capital, 4% tier 1 risk-based capital or 8% total risk-based capital); |
| • | significantly undercapitalized (less than 3% leverage capital, 3% tier 1 risk-based capital or 6% total risk-based capital); and |
| • | critically undercapitalized (less than 2% tangible capital). |
Generally, the banking regulator is required to appoint a receiver or conservator for a savings bank that is “critically undercapitalized.” The regulation also provides that a capital restoration plan must be filed with the OTS within 45 days of the date a bank receives notice that it is “undercapitalized,” “significantly undercapitalized” or “critically undercapitalized.” In addition, numerous mandatory supervisory actions become immediately applicable to the savings bank, including, but not limited to, restrictions on growth, investment activities, capital distributions and affiliate transactions. The OTS may also take any one of a number of discretionary supervisory actions against undercapitalized savings banks, including the issuance of a capital directive and the replacement of senior executive officers and directors.
At December 31, 2009, the Bank met the criteria for being considered “well-capitalized.”
8
Insurance of Deposit Accounts. In October 2008, FDIC deposit insurance coverage was increased to a maximum of $250,000 per depositor. On January 1, 2014, the maximum insurance amount will return to $100,000 per depositor for all deposit accounts except certain retirement accounts, which will remain at $250,000 per depositor. In addition, under the FDIC’s Transaction Account Guarantee Program, most of our non-interest-bearing transaction accounts are guaranteed regardless of amount until June 30, 2010.
Pursuant to the Federal Deposit Insurance Reform Act of 2005 (the “Reform Act”), the Federal Deposit Insurance Corporation is authorized to set the reserve ratio for the Deposit Insurance Fund annually at between 1.15% and 1.5% of estimated insured deposits. As of June 30, 2008, the reserve ratio had decreased to 1.01% as a result of bank failures. As part of a plan to restore the reserve ratio to 1.15%, the FDIC imposed a special assessment equal to five basis points of assets less Tier 1 capital as of June 30, 2009, which was payable on September 30, 2009. In addition, the FDIC increased its quarterly assessment rates and amended the method by which rates are calculated. Beginning in the second quarter of 2009, insured depository institutions are assigned an initial base assessment rate ranging from 12 to 45 basis points of deposits depending on their risk category. The initial base assessment is then adjusted based upon the level of unsecured debt, secured liabilities and brokered deposits to establish a total base assessment rate ranging from seven to 77.5 basis points.
On November 12, 2009, the FDIC approved a final rule requiring insured depository institutions to prepay on December 30, 2009, their estimated quarterly risk-based assessments for the fourth quarter of 2009, and for all of 2010, 2011, and 2012. Estimated assessments for the fourth quarter of 2009 and for all of 2010 are based upon the assessment rate in effect on September 30, 2009, with three basis points added for the 2011 and 2012 assessment rates. In addition, a 5% annual growth in the assessment base is assumed. Prepaid assessments are to be applied against the actual quarterly assessments until exhausted, and may not be applied to any special assessments that may occur in the future. Any unused prepayments will be returned to the institution on June 30, 2013. On December 30, 2009, the Bank paid the estimated assessment fees for the fourth quarter of 2009 and prepaid $6.8 million in estimated assessment fees through 2012. Because the prepaid assessments represent the prepayment of future expense, they do not affect the Bank’s capital (the prepaid asset will have a risk-weighting of 0%) or tax obligations.
Insurance of deposits may be terminated by the FDIC upon a finding that an institution has engaged in unsafe or unsound practices, is in an unsafe or unsound condition to continue operations or has violated any applicable law, regulation, rule, order or condition imposed by the FDIC. We do not currently know of any practice, condition or violation that might lead to termination of our deposit insurance.
In addition to the FDIC assessments, the Financing Corporation (“FICO”) is authorized to impose and collect, with the approval of the Federal Deposit Insurance Corporation, assessments for anticipated payments, issuance costs and custodial fees on bonds issued by the FICO in the 1980s to recapitalize the former Federal Savings and Loan Insurance Corporation. The bonds issued by the FICO are due to mature in 2017 through 2019. For the quarter ended December 31, 2009, the annualized FICO assessment was equal to 1.10 basis points for each $100 in domestic deposits maintained at an institution.
9
Temporary Liquidity Guarantee Program. On October 14, 2008, the FDIC announced the Temporary Liquidity Guarantee Program. This program has two components – The Debt Guarantee Program and the Transaction Account Guarantee Program. The Debt Guarantee Program guarantees newly issued senior unsecured debt of a participating organization, up to certain limits established for each institution, issued between October 14, 2008 and June 30, 2009. The FDIC will pay the unpaid principal and interest on an FDIC-guaranteed debt instrument upon the uncured failure of the participating entity to make a timely payment of principal or interest in accordance with the terms of the instrument. The guarantee will remain in effect until June 30, 2012. In return for the FDIC’s guarantee, participating institutions will pay the FDIC a fee based on the amount and maturity of the debt. The Bank and the Company did not participate in the Debt Guarantee Program.
The Transaction Account Guarantee Program provides full federal deposit insurance coverage for non-interest bearing transaction deposit accounts, regardless of dollar amount, until June 30, 2010. The Bank participates in the Transaction Account Guarantee Program. Beginning January 1, 2010, quarterly fees for this program are based on an institution’s risk category rating assigned with respect to regular Federal Deposit Insurance Corporation assessments. Institutions in Risk Category I (generally well-capitalized institutions with composite CAMELS 1 or 2 ratings) will pay an annualized assessment rate of 15 basis points. Institutions in Risk Category II (generally adequately capitalized institutions with composite CAMELS 3 or better) will pay an annualized assessment rate of 20 basis points. Institutions in Risk Category III or IV (generally under capitalized or composite CAMELS 4 or 5) will pay an annualized assessment rate of 25 basis points.
U.S. Treasury’s Troubled Asset Relief Program Capital Purchase Program. The Emergency Economic Stabilization Act of 2008 (“EESA”) provides the U.S. Secretary of the Treasury with broad authority to implement certain actions to help restore stability and liquidity to U.S. markets. One of the provisions resulting from the legislation is the Troubled Asset Relief Program Capital Purchase Program (“TARP”), which provides direct equity investment in perpetual preferred stock by the U.S. Treasury Department in qualified financial institutions. The TARP program was voluntary, was subject to regulatory approval, and required participating institutions to comply with a number of restrictions and provisions, including limits on executive compensation, stock redemptions and declaration of dividends. The Company did not participate in TARP.
Prohibitions Against Tying Arrangements. Federal savings banks are prohibited, subject to some exceptions, from extending credit to or offering any other service, or fixing or varying the consideration for such extension of credit or service, on the condition that the customer obtain some additional service from the institution or its affiliates or not obtain services of a competitor of the institution.
Federal Home Loan Bank System. The Bank is a member of the Federal Home Loan Bank System, which consists of 12 regional Federal Home Loan Banks. The Federal Home Loan Bank System provides a central credit facility primarily for member institutions. As a member of the FHLBC, the Bank is required to acquire and hold shares of capital stock in the FHLBC in an amount at least equal to 1% of the aggregate principal amount of its unpaid residential mortgage loans and similar obligations at the beginning of each year, or 1/20 of its borrowings from the FHLBC, whichever is greater. As of December 31, 2009 the Bank was in compliance with this requirement.
Federal Reserve System
Federal Reserve Board regulations require savings banks to maintain noninterest-earning reserves against their transaction accounts, such as negotiable order of withdrawal and regular checking accounts. At December 31, 2009 the Bank was in compliance with these reserve requirements. The balances maintained to meet the reserve requirements imposed by the Federal Reserve Board may be used to satisfy liquidity requirements imposed by the OTS.
The USA PATRIOT Act and the Bank Secrecy Act
The USA PATRIOT Act and the Bank Secrecy Act require financial institutions to develop programs to detect and report money-laundering and terrorist activities, as well as suspicious activities. The USA PATRIOT Act also gives the federal government powers to address terrorist threats through enhanced domestic security measures, expanded surveillance powers, increased information sharing and broadened anti-money laundering requirements. The federal banking agencies are required to take into consideration the effectiveness of controls designed to combat money-laundering activities in determining whether to approve a merger or other acquisition application of a member institution. Accordingly, if we engage in a merger or other acquisition, our controls designed to combat money laundering would be considered as part of the application process. In addition, non-compliance with these laws and regulations could result in fines, penalties and other enforcement measures. We have developed policies and continue to augment procedures and systems designed to comply with these laws and regulations.
10
Holding Company Regulation
The Company is a unitary savings and loan holding company, subject to regulation and supervision by the OTS. The OTS has enforcement authority over the Company and its non-savings institution subsidiaries. Among other things, this authority permits the OTS to restrict or prohibit activities that are determined to be a risk to the Bank.
The Company’s activities are limited to the activities permissible for financial holding companies or for multiple savings and loan holding companies. A financial holding company may engage in activities that are financial in nature, including underwriting equity securities and insurance, incidental to financial activities or complementary to a financial activity. A multiple savings and loan holding company is generally limited to activities permissible for bank holding companies under Section 4(c) (8) of the Bank Holding Company Act, subject to the prior approval of the OTS, and certain additional activities authorized by OTS regulations.
Federal law prohibits a savings and loan holding company, directly or indirectly, or through one or more subsidiaries, from acquiring control of another savings institution or holding company thereof, without prior written approval of the OTS. It also prohibits the acquisition or retention of, with specified exceptions, more than 5% of the equity securities of a company engaged in activities that are not closely related to banking or financial in nature or acquiring or retaining control of an institution that is not federally insured. In evaluating applications by holding companies to acquire savings institutions, the OTS must consider the financial and managerial resources and future prospects of the savings institution involved, the effect of the acquisition on the risk to the insurance fund, the convenience and needs of the community and competitive factors.
Sarbanes-Oxley Act of 2002
The Sarbanes-Oxley Act of 2002 was enacted in response to public concerns regarding corporate accountability in connection with certain accounting scandals. The stated goals of the Sarbanes-Oxley Act are to increase corporate responsibility, to provide for enhanced penalties for accounting and auditing improprieties at publicly traded companies, and to protect investors by improving the accuracy and reliability of corporate disclosures pursuant to the securities laws. The Sarbanes-Oxley Act generally applies to all companies that file or are required to file periodic reports with the Securities and Exchange Commission, under the Exchange Act.
The Sarbanes-Oxley Act includes specific additional disclosure requirements, requires the Securities and Exchange Commission and national securities exchanges to adopt extensive additional disclosure, corporate governance and other related rules, and mandates further studies of certain issues by the Securities and Exchange Commission. The Sarbanes-Oxley Act represents significant federal involvement in matters traditionally left to state regulatory systems, such as the regulation of the accounting profession, and to state corporate law, such as the relationship between a board of directors and management and between a board of directors and its committees.
Federal Securities Laws
The Company’s common stock is registered with the Securities and Exchange Commission under the Exchange Act. The Company is subject to the information, proxy solicitation, insider trading restrictions and other requirements of the Exchange Act.
Taxation
Federal Taxation. The Company and the Bank are subject to federal income taxation in the same general manner as other corporations, with some exceptions discussed below. The following discussion of federal taxation is intended only to summarize material federal income tax matters and is not a comprehensive description of the tax rules applicable to the Company and the Bank.
11
Method of Accounting. For federal income tax purposes, the Company currently reports its income and expenses on the accrual method of accounting and uses a tax year ending December 31 for filing its consolidated federal income tax returns. The Small Business Protection Act of 1996 eliminated the use of the reserve method of accounting for bad debt reserves by savings institutions, effective for taxable years beginning after 1995.
Bad Debt Reserves. Prior to the Small Business Protection Act of 1996, the Bank was permitted to establish a reserve for bad debts for tax purposes and to make annual additions to the reserve. These additions could, within specified formula limits, be deducted in arriving at the Bank’s taxable income. As a result of the Small Business Protection Act of 1996, the Bank must use the specific charge off method in computing its bad debt deduction for tax purposes.
Taxable Distributions and Recapture. Prior to the Small Business Protection Act of 1996, bad debt reserves created prior to 1988 were subject to recapture into taxable income if the Bank failed to meet certain thrift asset and definition tests. The Small Business Protection Act of 1996 eliminated these thrift-related recapture rules. However, under current law, pre-1988 reserves remain subject to tax recapture should the Bank make certain distributions from its tax bad debt reserve or cease to maintain a financial institution charter. At December 31, 2009 the Bank’s total federal pre-1988 reserve was $14.9 million. This reserve reflects the cumulative effects of federal tax deductions by the Bank for which no federal income tax provision has been made.
Alternative Minimum Tax. The Internal Revenue Code of 1986, as amended, imposes an alternative minimum tax at a rate of 20% on a base of regular taxable income plus certain tax preferences, referred to as “alternative minimum taxable income.” The alternative minimum tax is payable to the extent alternative minimum taxable income is in excess of an exemption amount. Net operating losses can, in general, offset no more than 90% of alternative minimum taxable income unless resulting from a loss carryback from 2008 or 2009 pursuant to the special provisions of the Worker, Homeownership & Business Assistance Act of 2009.
Net Loss Carryovers. A financial institution may carry back net operating losses to the preceding two taxable years (up to five years for losses incurred in 2008 or 2009 pursuant to the special provisions of the Worker, Homeownership & Business Assistance Act of 2009) and forward to the succeeding 20 taxable years. At December 31, 2009, the Company had a federal net operating loss of $6.3 million which will expire in 2029. At December 31, 2009, the Company had a state net operating loss for the State of Illinois of $32.0 million which will expire in 2021. Based upon projections of future taxable income, management believes that it is more likely than not that the deferred tax assets will be fully realized and thus a valuation allowance is not needed.
Corporate Dividends. We may exclude from our income 100% of dividends received from the Bank as a member of the same affiliated group of corporations.
State and Local Taxation. We pay income tax to the State of Illinois. As a Maryland business corporation, we are required to file annual returns and pay annual fees to the State of Maryland, but these fees are not material in amount. At December 31, 2009, the Company had a state net operating loss for the State of Illinois of $32.0 million which will expire in 2021. Beginning in 2009, the Company and its subsidiary are subject to income taxes in the State of New Jersey.
| ITEM 1A. | RISK FACTORS |
The risks set forth below may adversely affect our business, financial condition and operating results. In addition to the risks set forth below and the other risks described in Item 1, Business, Forward-Looking Statements, and Item 7, Management’s Discussion and Analysis of Financial Condition and Results of Operations, there may also be additional risks and uncertainties that are not currently known to us or that we currently deem to be immaterial that could materially and adversely affect our business, financial condition or operating results. As a result, past financial performance may not be a reliable indicator of future performance, and historical trends should not be used to anticipate results or trends in future periods.
12
Current Economic Conditions Present Higher Risks to Our Loan Portfolio
At December 31, 2009 our loan portfolio included $329.2 million in multi-family mortgage loans, or 26.7% of total loans; $316.6 million in nonresidential real estate loans, or 25.6% of total loans; $176.8 million in commercial leases, or 14.3% of total loans; $88.1 million in commercial loans, or 7.1% of total loans; and $81.1 million in residential loans to income property investors, or 6.6% of total loans; and $32.6 million in construction and land loans, or 2.6% of total loans. Current economic conditions, including high unemployment rates, weakened consumer and business spending and materially declining real estate values, all present higher risks to our loan portfolio. Our historical loan underwriting standards presumed a reasonable range of economic and operating conditions for our borrowers and their underlying business or personal circumstances. The depth and speed of the decline in economic activity exceeded, and will continue to exceed, the financial and management capabilities of certain borrowers to meet their credit obligations. Furthermore, the decline in real estate values in all market segments not only diminishes an important source of repayment but also diminishes the borrower’s economic interest in investing additional financial resources into their businesses or residences. Though the risk of a sudden and catastrophic event in financial markets appears to have receded, weak economic growth in the U.S. and its trading partners will continue to depress the operating results of certain commercial lessees. Finally, the foregoing factors and conditions and prudent loan portfolio management will combine to reduce the overall level of acceptable credit exposures available in the market, resulting in lower loan portfolio balances and reduced interest income from the loan portfolio.
If Our Allowance for Loan Losses is Not Sufficient to Cover Actual Loan Losses, Our Earnings Could Decrease
In the event that our loan customers do not repay their loans according to the terms of the loans, and the collateral securing the repayment of these loans is insufficient to cover any remaining loan balance, we could experience significant loan losses or increase our provision for loan losses or both, which could have a material adverse effect on our operating results. We make various assumptions and judgments about the collectability of our loan portfolio, including the creditworthiness of our borrowers and the value of the real estate and other assets, if any, serving as collateral for the repayment of our loans. At December 31, 2009, our allowance for loan losses was $18.6 million, representing 1.51% of total loans and 37.6% of nonperforming loans as of that date. In determining the amount of our allowance for loan losses, we rely on our loan quality reviews, our experience and our evaluation of economic conditions, among other factors. We also make assumptions concerning our legal positions and the priority of our interests in contested legal or bankruptcy proceedings, and at times, we may lack sufficient information to establish specific reserves for loans involved in such proceedings.
Our Concentration of Loans within Certain Segments of the Healthcare Industry Exposes Us to Increased Credit Risk
At December 31, 2009, we had $46.4 million of loans to healthcare providers, including loans to nursing homes and hospice care companies and leases to hospitals for equipment. These loans represented 3.8% of our total loan portfolio as of that date. Of these loans, $6.5 million, or 13.9%, were collateralized by real estate. The remainder consisted of working capital lines of credit secured by government accounts receivable, of which we are a joint payee, or by leased equipment. Loans to healthcare providers have unique credit risks. A healthcare provider’s income stream is subject to many factors beyond the control of the healthcare provider, including the risk that the provider will not be reimbursed for all services provided. The State of Illinois has experienced budget shortfalls in recent years, causing delays in state reimbursement for healthcare costs. Government reimbursement rates are also subject to change, including retroactive adjustments. For example, a significant overpayment to a healthcare provider can result in the provider owing significant governmental repayments to the federal or state government. A healthcare provider’s profitability also depends on its ability to maintain certain levels of occupancy. Unexpected declines in occupancy rates can restrict a provider’s cash flow. Any of these factors can impair the ability of our healthcare provider borrowers to make loan repayments, which could result in significant loss to us.
13
We Hold Certain Intangible Assets that Could Be Classified as Impaired in the Future. If These Assets Are Considered to Be Either Partially or Fully Impaired in the Future, Our Earnings and the Book Values of These Assets Would Decrease
The Company tests its goodwill and core deposit intangible assets for impairment on a periodic basis. The impairment testing incorporates the current market price of the Company’s common shares, the estimated net present value of the Company’s assets and liabilities, and information concerning the terminal valuation of similarly-situated insured depository institutions. In addition, we evaluate the presence or absence of significant risk indicators related to the impairment of goodwill and core deposit intangible assets. Our most recent impairment testing indicated that the only significant risk factor was the fact that the Company’s market capitalization was below its book value during 2009. We concluded from our analysis that, at the time of the respective impairment testing, the market value of the Company’s net assets was sufficient to support the carrying value of its goodwill, and the fair value of its core deposit intangible exceeded their carrying value. However, because the Company’s market capitalization was below its tangible book value at December 31, 2009, and the trading prices of the common shares of similarly-situated and other financial institutions that has declined due to, among other things, current economic conditions, instability in global financial systems and markets, and a decline in merger and acquisition activity due to asset valuation difficulties and the supply of assets and liabilities that is expected to result from FDIC liquidation activities, it is possible that future impairment testing could result in a partial or full impairment of the value of the Company’s goodwill or core deposit intangible assets, or both. If the Company determines that an impairment exists at a given point in time, the Company’s earnings and the book value of the related intangible asset(s) will be reduced by the amount of the impairment. Notwithstanding the foregoing, the results of impairment testing on goodwill and core deposit intangible assets will have little or no impact on the Company’s tangible book value or regulatory capital levels.
Changes in Market Interest Rates Could Adversely Affect Our Financial Condition and Results of Operations
Our financial condition and results of operations are significantly affected by changes in market interest rates because our assets, primarily loans, and our liabilities, primarily deposits, are monetary in nature. Our results of operations depend substantially on our net interest income, which is the difference between the interest income that we earn on our interest-earning assets and the interest expense that we pay on our interest-bearing liabilities. We are unable to predict changes in market interest rates that are affected by many factors beyond our control, including inflation, recession, unemployment, money supply, domestic and international events and changes in the United States and other financial markets. Our net interest income is affected not only by the level and direction of interest rates, but also by the shape of the yield curve and relationships between interest sensitive instruments and key driver rates, including credit risk spreads, and by balance sheet growth, customer loan and deposit preferences and the timing of changes in these variables which themselves are impacted by changes in market interest rates. As a result, changes in market interest rates can significantly impact our net interest income as well as the fair market valuation of our assets and liabilities.
Since Our Business is Concentrated in the Chicago Metropolitan Area, Local Economic Conditions May Adversely Affect Our Business
Although we make certain types of loans and leases to borrowers located in other states, our lending and deposit gathering activities are concentrated primarily in the Chicago metropolitan area. Our success depends on the general economic conditions of this area and surrounding areas. In addition, many of the loans in our loan portfolio are secured by real estate located in the Chicago metropolitan area. Negative conditions in the real estate markets where collateral for a mortgage loan is located could adversely affect the borrower’s ability to repay the loan and the value of the collateral securing the loan. Real estate values are affected by various other factors, including real estate supply and demand, changes in general or regional economic conditions and unemployment rates, interest rates, governmental rules or policies and natural disasters. Adverse changes in the regional and general economy could also reduce our growth rate, impair our ability to collect loans and generally have a negative effect on our financial condition and results of operations.
Difficult Economic Conditions Have Adversely Affected the Banking Industry
The capital, credit and financial markets have experienced significant volatility and disruption in recent years. These conditions have had significant adverse effects on our national and local economies, including declining real estate values, a widespread tightening of the availability of credit, illiquidity in certain securities markets, increasing loan delinquencies, mortgage foreclosures, personal and business bankruptcies, rising unemployment rates, declining consumer confidence and spending, significant write-downs of asset values by financial institutions and government-sponsored entities, and a reduction of manufacturing and service business activity and international trade. These conditions have also adversely affected the stock market generally, and have contributed to significant declines in the trading prices of financial institution stocks that have not fully recovered. We do not expect these difficult market conditions to improve over the short term, and a continuation or worsening of these conditions could exacerbate their adverse effects. The adverse effects of these conditions could include increases in loan delinquencies and charge-offs, increases to the portion of our loan loss reserve that we base on national and local economic factors, increases to our specific loan loss reserves due to the impact of these conditions on specific borrowers or the collateral for their loans, declines in the value of our investment securities, increases in our cost of funds due to continued aggressive deposit pricing by local and national competitors with liquidity needs, increases in regulatory and compliance costs, core deposit attrition due to this aggressive deposit pricing and/or consumer concerns about the safety of their deposits, and declines in the trading price of our common stock.
14
If Our Investment in the Federal Home Loan Bank of Chicago is Classified as Other-Than-Temporarily Impaired, Our Earnings Could Decrease
We own FHLBC common stock to qualify for membership in the Federal Home Loan Bank System and to be eligible to borrow funds under the FHLBC’s advance program. The aggregate cost of our FHLBC common stock as of December 31, 2009 was $15.6 million based on its par value. There is no market for our FHLBC common stock. Due to our receipt of stock dividends and a reduction of our outstanding FHLBC advances, we owned shares of FHLBC common stock at December 31, 2009 with a par value that was $8.9 million more than we were required to own to maintain our membership, in the Federal Home Loan Bank System and to be eligible to obtain advances (“excess” or “voluntary” capital stock).
On October 10, 2007, the FHLBC entered into a consensual cease and desist order with the Federal Housing Finance Board, now known as the Federal Housing Finance Agency (“the FHFA”). Under the terms of the order, and subject to certain exceptions that are not applicable to the FHLBC common stock that we own, capital stock repurchases and redemptions, including redemptions upon membership withdrawal or other termination, are prohibited unless the FHLBC receives the prior approval of the Director of the Office of Supervision of the FHFA (the “Director”). The order also provides that dividend declarations are subject to the prior written approval of the Director and required the FHLBC to submit a Capital Structure Plan to the FHFA. The FHLBC has not declared any dividends since the order was issued and it has not received formal approval of a Capital Structure Plan.
Published reports indicate that certain member banks of the Federal Home Loan Bank System could have materially lower regulatory capital levels due to asset quality issues. In an extreme situation, it is possible that the capitalization of a Federal Home Loan Bank, including the FHLBC, could be substantially diminished or reduced to zero. Current accounting guidance for our FHLBC common stock provides that, for impairment testing purposes, the value of long-term investments such as our FHLBC common stock is based on the “ultimate recoverability” of the par value of the security without regard to temporary declines in value. Consequently, if events occur that give rise to substantial doubt about the ultimate recoverability of the par value of our FHLBC common stock, this investment could be deemed to be other-than-temporarily impaired, and the impairment loss that we would be required to record would cause our earnings to decrease by the after-tax amount of the impairment loss.
Our Future Success is Dependent on Our Ability to Compete Effectively in the Highly Competitive Banking Industry
We face substantial competition in all phases of our operations from a variety of different competitors. Our future growth and success will depend on our ability to compete effectively in this highly competitive environment. To date, we have grown our business successfully by focusing on our geographic markets and emphasizing the high level of service and responsiveness desired by our customers. We compete for loans, deposits and other financial services with other commercial banks, thrifts, credit unions, brokerage houses, mutual funds, insurance companies, real estate conduits, and specialized finance companies. Many of our competitors offer products and services that we do not offer, and many have substantially greater resources and lending limits, name recognition and market presence that benefit them in attracting business. In addition, larger competitors may be able to price loans and deposits more aggressively than we do, and smaller newer competitors may also be more aggressive in pricing loans and deposits in order to increase their market share. Some of the financial institutions and financial services organizations with which we compete are not subject to the extensive regulations imposed on savings banks and their holding companies. As a result, these nonbank competitors have certain advantages over us in accessing funding and in providing various financial services.
15
Our Business May Be Adversely Affected by the Highly Regulated Environment in Which We Operate
We are subject to extensive federal and state legislation, regulation, examination and supervision. Recently enacted, proposed and future legislation and regulations could have an adverse effect on our business and operations. Our success depends on our continued ability to comply with these laws and regulations. Some of these regulations may increase our costs. While we cannot predict what effect any future changes in these laws or regulations or their interpretations would have on us, these changes or interpretations may adversely affect our future operations.
Trading Activity in the Company’s Common Stock Could Result in Material Price Fluctuations
It is possible that trading activity in the Company’s common stock, including short-selling or significant sales by current stockholders, could result in material price fluctuations of the price per share of the Company’s common stock. In addition, such trading activity and the resultant volatility could make it more difficult for the Company to sell equity or equity-related securities in the future at a time and price it deems appropriate, or to use its stock as consideration for an acquisition. See “Our Ability to Successfully Conduct Acquisitions Will Affect Our Ability to Grow Our Franchise and Compete Effectively in Our Marketplace”.
Our Return on Stockholders’ Equity Will Continue to Be Low Due to Our High Capital Level
Net income divided by average stockholders’ equity, known as return on equity, is a ratio that many investors use to compare the performance of a financial institution to its peers. Our capital remains relatively high by industry standards pending a more optimal deployment of the additional capital raised in our 2005 mutual-to-stock conversion. Until we can increase our net interest income and noninterest income, we expect our return on equity to continue to be below the historical industry average, which may negatively affect the value of our shares of common stock.
The Bank’s Ability to Pay Dividends is Subject to Regulatory Limitations Which, to the Extent the Company Requires Such Dividends in the Future, May Affect the Company’s Ability to Pay Dividends
The Company is a separate legal entity from its subsidiaries and does not have significant operations of its own. Dividends from the Bank provide a significant source of cash for the Company. The availability of dividends from the Bank is limited by various statutes and regulations. Under the rules of the OTS, the Bank is not permitted to pay dividends on its capital stock to the Company, its sole stockholder, if the dividend would reduce the Bank’s stockholder’s equity below the amount of the liquidation account established in connection with the mutual-to-stock conversion. The Bank may pay dividends without the approval of the OTS only if the Bank meets its applicable regulatory capital requirements before and after the payment of the dividends and its total dividends do not exceed its net income to date over the calendar year plus retained net income over the preceding two years. As of December 31, 2009, the Bank had no net income available to pay a dividend to the Company without the prior approval of the OTS. It is possible, depending upon the financial condition of the Bank and other factors, that the OTS could assert that the payment of dividends or other payments by the Bank are an unsafe or unsound practice or refuse to issue any required prior approvals. In the event the Bank is unable to pay dividends to the Company, the Company may not be able to pay dividends on its common stock. Consequently, the potential inability to receive dividends from the Bank could adversely affect the Company’s financial condition, results of operations and prospects.
We Continually Encounter Technological Change, and May Have Fewer Resources Than Many of Our Competitors to Continue to Invest in Technological Improvements
The financial services industry is undergoing rapid technological changes, with frequent introductions of new technology-driven products and services. The effective use of technology increases efficiency and enables financial institutions to better serve customers and to reduce costs. Our future success will depend, in part, upon our ability to address the needs of our customers by using technology to provide products and services that will satisfy customer demands for convenience, as well as to create additional efficiencies in our operations. Many of our competitors have substantially greater resources to invest in technological improvements. We may not be able to effectively implement new technology-driven products and services or be successful in marketing these products and services to our customers.
16
Our Ability to Successfully Conduct Acquisitions Will Affect Our Ability to Grow Our Franchise and Compete Effectively in Our Marketplace
We consider the possible acquisition of other banks, thrifts and other financial services companies in private or FDIC-assisted transactions to supplement internal growth. Our efforts to acquire other financial institutions and financial service companies may not be successful. Other potential acquirors exist for most acquisition candidates, creating competition that can affect the purchase price for which the institution can be acquired. In many cases, our competitors have significantly greater resources than we have, and greater flexibility to structure the consideration for the transaction. We may not participate in specific acquisition opportunities if we consider the proposed transaction unacceptable, including the current or potential future terms, conditions and limitations imposed by an FDIC-assisted transaction. We also may not be the successful bidder in acquisition opportunities that we pursue due to the willingness or ability of other potential acquirors to propose a higher purchase price or more attractive terms and conditions than we are willing or able to propose. The results of a merger or acquisition could change materially based on future changes in applicable accounting principles and regulatory requirements related to acquired assets and liabilities. If we are unable to or do not conduct acquisitions to supplement internal growth, our ability to deploy effectively the capital we raised in the offering, expand our geographic presence and improve our results of operations could be adversely affected.
The Risks Presented by the Acquisition of Other Institutions Could Adversely Affect Our Financial Condition and Results of Operations
If we are successful in conducting acquisitions, we will be presented with many risks that could have a material adverse effect on our financial condition and results of operations. An institution that we acquire may have unknown asset quality issues or unknown or contingent liabilities that we did not discover or fully recognize in the due diligence process, thereby resulting in unanticipated losses, particularly in the case of FDIC-assisted transactions due to the highly restrictive due diligence available to potential bidders. The acquisition of other institutions typically requires the integration of different corporate cultures, loan and deposit products, pricing strategies, data processing systems and other technologies, accounting, internal audit and financial reporting systems, operational processes, policies, procedures and internal controls, marketing programs and personnel of the acquired institution in order to make the transaction economically advantageous. The integration process is complicated and time consuming, and could divert our attention from other business concerns and be disruptive to our customers and the customers of the acquired institution. Our failure to successfully integrate an acquired institution could result in the loss of key customers and employees, and prevent us from achieving expected synergies and cost savings. Acquisitions also result in professional fees, purchase price adjustments, the amortization of core deposit intangibles and other expenses that could adversely affect our earnings, and in goodwill that could become impaired, requiring us to recognize further charges. We may finance acquisitions with borrowed funds, thereby increasing our leverage and reducing our liquidity, or with potentially dilutive issuances of equity securities.
FDIC Deposit Insurance Premiums Have Increased and May Increase Further in the Future
The Federal Deposit Insurance Act, as amended, requires the FDIC to maintain a reserve ratio between 1.15% and 1.50%. The FDIC’s board of directors must establish a designated reserve ratio within that range and sets assessment rates to meet that target within a time-frame that the board deems appropriate. If the reserve ratio falls below 1.15%, the FDIC’s board is required to establish a restoration plan to bring the reserve ratio back to 1.15% within five years. The FDIC’s reserve ratio declined over the past several years due to costs associated with bank failures and FDIC-assisted transactions, and the reserve ratio is expected to remain under duress due to future bank failures and FDIC-assisted transactions. As part of a plan to restore the reserve ratio to 1.15%, the FDIC imposed a special assessment equal to five basis points of assets less Tier 1 capital as of June 30, 2009, which was payable on September 30, 2009. In addition, the FDIC increased its quarterly assessment rates and amended the method by which rates are calculated. On November 12, 2009, the FDIC approved a final rule requiring insured depository institutions to prepay on December 30, 2009, their estimated quarterly risk-based assessments for the fourth quarter of 2009, and for all of 2010, 2011, and 2012. Prepaid assessments are to be applied against the actual quarterly assessments until exhausted, and may not be applied to any special assessments that may occur in the future. Any unused prepayments will be returned to the institution on June 30, 2013. See “Supervision and Regulation – Insurance of Deposit Accounts.” On December 30, 2009, the Bank paid the estimated assessment fees for the fourth quarter of 2009 and prepaid $6.8 million in estimated assessment fees through 2012. These increased assessments have had an adverse impact on our results of operations in 2009 and will continue to have an adverse impact in future years. If circumstances require the FDIC to impose additional special assessments or further increase its quarterly assessment rates, the adverse impact will be exacerbated.
17
Various Factors May Make Takeover Attempts That You Want to Succeed More Difficult to Achieve, Which May Affect the Value of Shares of Our Common Stock
Provisions of our articles of incorporation and bylaws, federal regulations, Maryland law and various other factors may make it more difficult for companies or persons to acquire control of the Company without the consent of our board of directors. You may want a takeover attempt to succeed because, for example, a potential acquiror could offer a premium over the then prevailing price of our shares of common stock. The OTS regulations prohibit the direct or indirect acquisition of more than 10% of any class of equity security of a converted savings institution without the prior approval of the OTS. Provisions of our articles of incorporation and bylaws also may make it difficult to remove our current board of directors or management if our board of directors opposes the removal. We have elected to be subject to the Maryland Business Combination Act, which places restrictions on mergers and other business combinations with large stockholders. In addition, our articles of incorporation provide that certain mergers and other similar transactions, as well as amendments to our articles of incorporation, must be approved by stockholders owning at least two-thirds of our shares of common stock entitled to vote on the matter unless first approved by at least two-thirds of the number of our authorized directors, assuming no vacancies. If approved by at least two-thirds of the number of our authorized directors, assuming no vacancies, the action must still be approved by a majority of our shares entitled to vote on the matter. In addition, a director can be removed from office, but only for cause, if such removal is approved by stockholders owning at least two-thirds of our shares of common stock entitled to vote on the matter. However, if at least two-thirds of the number of our authorized directors, assuming no vacancies, approves the removal of a director, the removal may be with or without cause, but must still be approved by a majority of our voting shares entitled to vote on the matter. Additional provisions include limitations on the voting rights of any beneficial owners of more than 10% of our common stock. Our bylaws, which can only be amended by the board of directors, also contain provisions regarding the timing, content and procedural requirements for stockholder proposals and nominations.
Non-Compliance with USA PATRIOT Act, Bank Secrecy Act, Real Estate Settlement Procedures Act, Truth-in-Lending Act or Other Laws and Regulations Could Result in Fines or Sanctions, and Curtail Expansion Opportunities
Financial institutions are required under the USA PATRIOT and Bank Secrecy Acts to develop programs to prevent financial institutions from being used for money-laundering and terrorist activities. Financial institutions are also obligated to file suspicious activity reports with the U.S. Treasury Department’s Office of Financial Crimes Enforcement Network if such activities are detected. These rules also require financial institutions to establish procedures for identifying and verifying the identity of customers seeking to open new financial accounts. Failure or the inability to comply with these regulations could result in fines or penalties, curtailment of expansion opportunities, intervention or sanctions by regulators and costly litigation or expensive additional controls and systems. During the last few years, several banking institutions have received large fines for non-compliance with these laws and regulations. In addition, the U.S. Government imposed and will continue to expand laws and regulations relating to residential and consumer lending activities that create significant new compliance burdens and financial risks. We have developed policies and continue to augment procedures and systems designed to assist in compliance with these laws and regulations.
| ITEM 1B. | UNRESOLVED STAFF COMMENTS |
None.
18
| ITEM 2. | PROPERTIES |
As of December 31, 2009 the net book value of our properties was $29.5 million. The following is a list of our offices:
| Burr Ridge (Executive Office) 15W060 North Frontage Road Burr Ridge, IL 60527 |
Deerfield 630 N. Waukegan Road Deerfield, IL 60015 |
Northbrook 1368 N. Shermer Road Northbrook, IL 60062 | ||
| Calumet City 1901 Sibley Boulevard Calumet City, IL 60409 |
Hazel Crest 3700 W. 183rd Street Hazel Crest, IL 60429 |
Olympia Fields 21110 S. Western Avenue Olympia Fields, IL 60461 | ||
| Calumet Park 1333 W. 127th Street Calumet Park, IL 60827 |
Joliet 1401 N. Larkin Joliet, IL 60435 |
Orland Park 48 Orland Square Drive Orland Park, IL 60462 | ||
| Chicago - Hyde Park 1354 East 55th Street Chicago, IL 60615 |
Lincolnshire One Marriott Drive Lincolnshire, IL 60069 |
Schaumburg 1005 W. Wise Road Schaumburg, IL 60193 | ||
| Chicago - Hyde Park East 55th at Lake Park Avenue Chicago, IL 60615 |
Lincolnwood 3443 W. Touhy Lincolnwood, IL 60712 |
South Libertyville 1123 S. Milwaukee Avenue Libertyville, IL 60048 | ||
| Chicago Ridge 6415 W. 95th Street Chicago Ridge, IL 60415 |
Naperville 1200 E. Ogden Avenue Naperville, IL 60563 |
|||
| Chicago - Lincoln Park 2424 N. Clark Street Chicago, IL 60614 |
North Libertyville 1409 W. Peterson Road Libertyville, IL 60048 |
|||
Except for our Chicago-Lincoln Park, Northbrook, and Hyde Park East offices, which are leased, all of our offices are owned. In addition to the above listed properties, we also operate three Express Branch facilities, a satellite national commercial leasing office and two remote ATMs on sites where we do not have a full service banking office.
| ITEM 3. | LEGAL PROCEEDINGS |
The Company and its subsidiaries are subject to various legal actions arising in the normal course of business. In the opinion of management, based on currently available information, the resolution of these legal actions is not expected to have a material adverse effect on the Company’s results of operations.
19
| ITEM 4. | [RESERVED] |
PART II
| ITEM 5. | MARKET FOR REGISTRANT’S COMMON EQUITY, RELATED STOCKHOLDER MATTERS AND ISSUER PURCHASES OF EQUITY SECURITIES |
Our shares of common stock are traded on the Nasdaq Global Select Market under the symbol “BFIN.” The approximate number of holders of record of the Company’s common stock as of December 31, 2009 was 1,906. Certain shares of the Company’s common stock are held in “nominee” or “street” name, and accordingly, the number of beneficial owners of such shares is not known or included in the foregoing number.
The following table presents quarterly market information provided by the Nasdaq Stock Market for the Company’s common stock and cash dividends paid for the periods ended December 31, 2009 and 2008.
| 2008 and 2009 Quarterly Periods |
High | Low | Close | Cash Dividends Paid | ||||||||
| Quarter ended December 31, 2009 |
$ | 10.40 | $ | 9.07 | $ | 9.90 | $ | 0.07 | ||||
| Quarter ended September 30, 2009 |
11.04 | 8.75 | 9.60 | 0.07 | ||||||||
| Quarter ended June 30, 2009 |
11.10 | 8.07 | 8.86 | 0.07 | ||||||||
| Quarter ended March 31, 2009 |
11.10 | 7.19 | 9.97 | 0.07 | ||||||||
| Quarter ended December 31, 2008 |
$ | 14.99 | $ | 9.07 | $ | 10.19 | $ | 0.07 | ||||
| Quarter ended September 30, 2008 |
15.98 | 12.70 | 14.68 | 0.07 | ||||||||
| Quarter ended June 30, 2008 |
16.16 | 13.00 | 13.01 | 0.07 | ||||||||
| Quarter ended March 31, 2008 |
16.44 | 13.66 | 15.91 | 0.07 | ||||||||
The Company is subject to state law limitations on the payment of dividends. Maryland law generally limits dividends to an amount equal to the excess of our capital surplus over payments that would be owed upon dissolution to stockholders whose preferential rights upon dissolution are superior to those receiving the dividend, and to an amount that would not make us insolvent. Dividends from the Bank provide a significant source of cash for the Company. The availability of dividends from the Bank is limited by various statutes and regulations. For a discussion of the Bank’s ability to pay dividends, see Part I, Item I, Business - “Supervision and Regulation—Federal Banking Regulation—Capital Distributions.”
Recent Sales of Unregistered Securities
The Company had no sales of unregistered stock during the quarter ended December 31, 2009.
Repurchases of Equity Securities
Our Board of Directors has authorized the repurchase of up to 5,047,423 shares of our common stock. In accordance with this authorization, we had repurchased 3,882,723 shares of our common stock as of December 31, 2009. There were no share repurchases conducted in the fourth quarter of 2009. The current share repurchase authorization will expire on May 17, 2010, unless extended.
20
Stock Performance Graph
The following Performance Graph and related information shall not be deemed “soliciting material” or to be “filed” with the Securities and Exchange Commission, nor shall such information be incorporated by reference into any future filing under the Securities Act of 1933 or Securities Exchange Act of 1934, each as amended, except to the extent that the Company specifically incorporates it by reference into such filing.
We completed our mutual-to-stock conversion on June 23, 2005, in connection with which the Company sold an aggregate of 24,466,250 shares of common stock at a price of $10.00 per share. The Company’s common stock began trading on the Nasdaq Stock Market under the symbol “BFIN” on June 24, 2005, and the per share closing price of one share of the Company’s common stock on that date was $13.60. The following graph represents $100 invested in our common stock at the $13.60 per share closing price on June 24, 2005. The graph illustrates the comparison of the cumulative total returns for the common stock of the Company, the Russell 2000 Index, the NASDAQ Bank Index and the America’s Community Bankers NASDAQ Index for the periods indicated.
There can be no assurance that our stock performance will continue in the future with the same or similar trend depicted in the graph below. We will not make or endorse any predictions as to future stock performance.
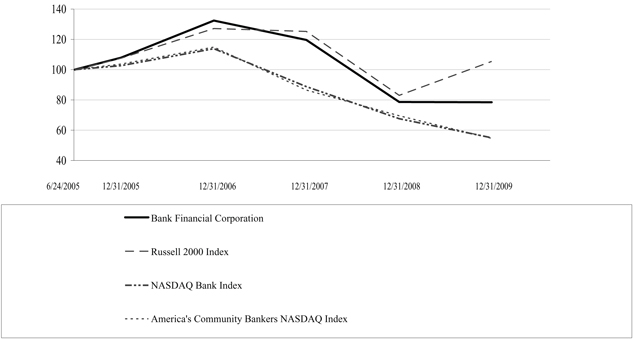
| 6/24/2005 | 12/31/2005 | 12/31/2006 | 12/31/2007 | 12/31/2008 | 12/31/2009 | |||||||
| BankFinancial Corporation |
100.00 | 107.94 | 132.36 | 119.65 | 78.58 | 78.45 | ||||||
| Russell 2000 Index |
100.00 | 107.49 | 127.24 | 125.24 | 82.93 | 105.46 | ||||||
| NASDAQ Bank Index |
100.00 | 102.58 | 113.88 | 88.74 | 67.51 | 55.02 | ||||||
| America’s Community Bankers NASDAQ Index |
100.00 | 103.69 | 114.92 | 86.43 | 69.51 | 54.65 |
21
| ITEM 6. | SELECTED FINANCIAL DATA |
The following information is derived from the audited consolidated financial statements of the Company or, prior to June 24, 2005, BankFinancial MHC, Inc. For additional information, reference is made to “Management’s Discussion and Analysis of Financial Condition and Results of Operations” and the Consolidated Financial Statements of the Company and related notes included elsewhere in this Annual Report.
| At December 31, | ||||||||||||||||||
| 2009 | 2008 | 2007 | 2006 | 2005 | ||||||||||||||
| (Dollars in thousands) | ||||||||||||||||||
| Selected Financial Condition Data: |
||||||||||||||||||
| Total assets |
$ | 1,566,890 | $ | 1,554,701 | $ | 1,480,544 | $ | 1,613,298 | $ | 1,614,436 | ||||||||
| Loans, net |
1,218,467 | 1,267,968 | 1,253,999 | 1,330,091 | 1,231,891 | |||||||||||||
| Loans held-for-sale |
— | 872 | 173 | 298 | 375 | |||||||||||||
| Securities, at fair value |
102,126 | 124,919 | 77,049 | 117,853 | 248,238 | |||||||||||||
| Goodwill |
22,566 | 22,566 | 22,566 | 22,579 | 10,865 | |||||||||||||
| Core deposit intangible |
4,295 | 5,985 | 7,769 | 9,648 | 8,248 | |||||||||||||
| Deposits |
1,233,395 | 1,069,855 | 1,073,650 | 1,129,585 | 1,067,874 | |||||||||||||
| Borrowings |
50,784 | 200,350 | 96,433 | 138,148 | 191,388 | |||||||||||||
| Equity |
263,603 | 266,791 | 291,137 | 326,015 | 328,777 | |||||||||||||
| Years Ended December 31, | ||||||||||||||||||
| 2009 | 2008 | 2007 | 2006 | 2005 | ||||||||||||||
| (Dollars in thousands, except per share data) | ||||||||||||||||||
| Selected Operating Data: |
||||||||||||||||||
| Interest and dividend income |
$ | 74,109 | $ | 77,960 | $ | 91,953 | $ | 94,086 | $ | 80,212 | ||||||||
| Interest expense |
20,557 | 25,667 | 38,304 | 37,489 | 28,802 | |||||||||||||
| Net interest income |
53,552 | 52,293 | 53,649 | 56,597 | 51,410 | |||||||||||||
| Provision (credit) for loan losses |
8,811 | 5,092 | 697 | (136 | ) | 518 | ||||||||||||
| Net interest income after provision (credit) for loan losses |
44,741 | 47,201 | 52,952 | 56,733 | 50,892 | |||||||||||||
| Noninterest income |
7,239 | 10,418 | 9,665 | 10,554 | 8,661 | |||||||||||||
| Noninterest expense (1) |
52,731 | 89,056 | 52,499 | 52,415 | 44,202 | |||||||||||||
| Income (loss) before income tax expense |
(751 | ) | (31,437 | ) | 10,118 | 14,872 | 15,351 | |||||||||||
| Income tax expense (benefit) |
(13 | ) | (12,048 | ) | 2,963 | 4,826 | 4,278 | |||||||||||
| Net income (loss) |
$ | (738 | ) | $ | (19,389 | ) | $ | 7,155 | $ | 10,046 | $ | 11,073 | ||||||
| Basic earnings (loss) per common share |
$ | (0.04 | ) | $ | (0.98 | ) | $ | 0.35 | $ | 0.45 | $ | 0.29 | ||||||
| Diluted earnings (loss) per common share |
$ | (0.04 | ) | $ | (0.98 | ) | $ | 0.35 | $ | 0.45 | $ | 0.29 | ||||||
(footnotes on following page)
22
| At or For the Years Ended December 31, | ||||||||||||||||||||
| 2009 | 2008 | 2007 | 2006 | 2005 | ||||||||||||||||
| Selected Financial Ratios and Other Data: |
||||||||||||||||||||
| Performance Ratios: |
||||||||||||||||||||
| Return on assets (ratio of net income (loss) to average total assets) |
(0.05 | )% | (1.33 | )% | 0.47 | % | 0.61 | % | 0.70 | % | ||||||||||
| Return on equity (ratio of net income (loss) to average equity) |
(0.28 | ) | (6.84 | ) | 2.30 | 3.02 | 5.18 | |||||||||||||
| Net interest rate spread (2) |
3.36 | 3.35 | 2.94 | 2.89 | 3.04 | |||||||||||||||
| Net interest margin (3) |
3.69 | 3.88 | 3.78 | 3.68 | 3.44 | |||||||||||||||
| Efficiency ratio (4) |
86.74 | 142.01 | 82.92 | 78.06 | 73.58 | |||||||||||||||
| Noninterest expense to average total assets |
3.36 | 6.09 | 3.42 | 3.19 | 2.79 | |||||||||||||||
| Average interest-earning assets to average interest-bearing liabilities |
123.43 | 127.85 | 130.95 | 132.67 | 120.45 | |||||||||||||||
| Dividends declared per share |
$ | 0.28 | $ | 0.28 | $ | 0.28 | $ | 0.18 | $ | — | ||||||||||
| Dividend payout ratio |
N.M. | N.M. | 90.6 | % | 44.3 | % | — | |||||||||||||
| Asset Quality Ratios: |
||||||||||||||||||||
| Nonperforming assets to total assets |
3.42 | % | 0.94 | % | 0.87 | % | 0.57 | % | 0.36 | % | ||||||||||
| Nonperforming loans to total loans |
4.01 | 1.07 | 0.95 | 0.69 | 0.46 | |||||||||||||||
| Allowance for loan losses to nonperforming loans |
37.63 | 107.97 | 91.65 | 115.13 | 201.19 | |||||||||||||||
| Allowance for loan losses to total loans |
1.51 | 1.15 | 0.87 | 0.79 | 0.93 | |||||||||||||||
| Net charge-offs to average loans outstanding |
0.39 | 0.11 | 0.02 | 0.07 | 0.00 | |||||||||||||||
| Capital Ratios: |
||||||||||||||||||||
| Equity to total assets at end of period |
16.82 | % | 17.16 | % | 19.66 | % | 20.21 | % | 20.36 | % | ||||||||||
| Average equity to average assets |
17.02 | 19.39 | 20.32 | 20.25 | 13.48 | |||||||||||||||
| Tier 1 leverage ratio (Bank only) |
12.44 | 12.08 | 13.95 | 15.05 | 13.82 | |||||||||||||||
| Other Data: |
||||||||||||||||||||
| Number of full-service offices |
18 | 18 | 18 | 18 | 16 | |||||||||||||||
| Employees (full-time equivalents) |
372 | 393 | 425 | 438 | 451 | |||||||||||||||
| (1) | Noninterest expense for the years ended December 31, 2009 and 2008 includes $401,000, and $35.9 million, respectively, of impairment loss on securities. |
| (2) | The net interest rate spread represents the difference between the yield on average interest-earning assets and the cost of average interest-bearing liabilities for the period. |
| (3) | The net interest margin represents net interest income divided by average total interest-earning assets for the period. |
| (4) | The efficiency ratio represents noninterest expense divided by the sum of net interest income and noninterest income. |
| (5) | Nonperforming assets include nonperforming loans and real estate owned. |
N.M. Not Meaningful
23
| ITEM 7. | MANAGEMENT’S DISCUSSION AND ANALYSIS OF FINANCIAL CONDITION AND RESULTS OF OPERATIONS |
The discussion and analysis that follows focuses on the factors affecting our consolidated financial condition at December 31, 2009 and 2008, and our consolidated results of operations for the three years ended December 31, 2009. The consolidated financial statements and related notes and the discussion of our critical accounting policies appearing elsewhere in this Annual Report should be read in conjunction with this discussion and analysis.
Overview
Loans. Net loans receivable decreased $49.5 million, or 3.9%, to $1.218 billion at December 31, 2009, from $1.268 billion at December 31, 2008. The decrease in net loans receivable was primarily due to reductions in construction and land loans, non-residential real estate loans, and one-to-four family residential mortgage loans. Construction and land loans decreased by $18.1 million, non-residential real estate loans by $26.0 million and one-to-four family residential mortgage loans by $22.8 million. The reductions in these loan categories were partially offset by growth in multi-family real estate loans and commercial leases. Multi-family real estate loans increased by $23.9 million and commercial leases increased by $2.2 million due to increased originations in these targeted loan categories. Commercial loans decreased by $4.6 million primarily due to reduced loan demand, declines in healthcare loan exposures and diminished line of credit usage by business customers. Future loan growth could be adversely affected by our unwillingness to compete for loans by relaxing our historical underwriting standards.
Securities. Securities decreased $22.8 million, or 18.2%, to $102.1 million at December 31, 2009, from $124.9 million at December 31, 2008. The primary reason for the decrease was $25.6 million of principal repayments, sales and maturities on securities.
Deposits. Deposits increased $163.5 million, or 15.3%, to $1.233 billion at December 31, 2009, from $1.070 billion at December 31, 2008. We increased our core deposits (savings, money market, noninterest-bearing demand and NOW accounts) by $134.4 million and reduced our balances of wholesale deposits by $20.0 million during the year. Core deposits increased as a percentage of total deposits, representing 67.3% of total deposits at December 31, 2009, compared to 65.0% of total deposits at December 31, 2008.
Borrowings. Borrowings decreased $149.6 million, or 74.7%, to $50.8 million at December 31, 2009, from $200.4 million at December 31, 2008, due to our reduction of outstanding FHLBC advances.
Stockholders’ Equity. Total stockholders’ equity was $263.6 million at December 31, 2009, compared to $266.8 million at December 31, 2008. The decrease in total stockholders’ equity was primarily due to the combined impact of our repurchase of 277,800 shares of our common stock during 2009 for a total cost of $2.5 million, the declaration and payment of cash dividends totaling $6.0 million, and the $738,000 net loss that we recorded for 2009. These items were partially offset by a $2.5 million increase in accumulated other comprehensive income, and a $3.5 million increase in additional paid in capital resulting from the vesting of stock-based compensation and Employee Stock Ownership Plan (“ESOP”) shares earned. The unallocated shares of common stock that our ESOP owns were reflected as a $15.2 million reduction to stockholders’ equity at December 31, 2009, compared to a $16.1 million reduction to stockholders’ equity at December 31, 2008.
Net Loss. We recorded a net loss of $738,000 for the year ended December 31, 2009, compared to a net loss of $19.4 million for 2008 and net income of $7.2 million for 2007. The net loss in 2009 was due in substantial part to our recording an $8.8 million provision for loan losses, a $2.1 million increase in FDIC expense and $1.4 million in combined pre-tax losses that we recorded in connection with the impairment and subsequent sale of our Freddie Mac preferred stocks. The impact of these items was partially offset by a $1.3 million gain that we recognized on the sale of our merchant processing operations in 2009. The net loss in 2008 was due in substantial part to a $35.9 million pre-tax impairment loss that we recorded on our Freddie Mac preferred stocks after Freddie Mac was placed into conservatorship. Our basic loss per common share was $0.04 and $0.98 for the years ended December 31, 2009 and 2008, respectively, compared to basic earnings per common share of $0.35 for the year ended December 31, 2007.
Net Interest Income. We recorded net interest income of $53.6 million for the year ended December 31, 2009, compared to $52.3 million for 2008 and $53.6 million for 2007. The increase in net interest income for 2009 reflected a $5.1 million decrease in interest expense, which was partially offset by a $3.9 million decrease in interest income. Our net interest rate spread improved by one basis point to 3.36% for the year ended December 31, 2009, from 3.35% for the year ended December 31, 2008.
24
Provision for Loan Losses. We recorded a provision for loan losses of $8.8 million for the year ended December 31, 2009, compared to $5.1 million for 2008 and $697,000 for 2007. The 2009 provision for loan losses reflects the combined impact of a $2.4 million increase in the portion of the specific allowance for loan losses that we allocate to impaired loans, a $1.5 million increase in the unallocated portion of the allowance for loan losses, and $4.9 million in net charge offs.
Noninterest Income. Noninterest income for the year ended December 31, 2009 was $7.2 million, compared to $10.4 million for 2008 and $9.7 million for 2007. Our noninterest income for 2009 included a $988,000 loss on the sale of our Freddie Mac preferred stocks and a $1.3 million gain on the sale of our merchant processing operations. Our noninterest income for 2008 included a $1.4 million pre-tax gain on the sale of shares of Visa, Inc. Class B common stock that we received in connection with Visa, Inc.’s initial public offering, and a $1.2 million pre-tax gain on additional shares of Visa. Inc. Class B common stock that were allocated to us in the initial public offering and are currently held in a litigation escrow under Visa, Inc.’s retrospective responsibility plan. The gain that we recorded on the escrowed shares of the Visa. Inc. Class B common stock represents a reduction of our obligation to indemnify Visa USA under Visa, Inc.’s retrospective responsibility plan.
Noninterest Expense. Noninterest expense for the year ended December 31, 2009 was $52.7 million, compared to $89.1 million for 2008 and $52.5 million for 2007. Noninterest expense from 2008 included a $35.9 million pre-tax impairment loss that we recorded on our holdings of Freddie Mac preferred stocks, compared to a $401,000 pre-tax impairment loss that we recorded on the same securities in 2009. Our expense for FDIC deposit insurance increased to $2.2 million during the year ended December 31, 2009, compared to $162,000 for 2008 and $133,000 for 2007. The increase in our 2009 expense for FDIC deposit insurance was due to the combined effect of the FDIC’s increase in its quarterly assessment rate, the FDIC’s imposition of a special assessment against all insured depository institutions and the full utilization of the FDIC assessment credits that we previously had available to offset or reduce FDIC quarterly assessments. Noninterest expense for 2008 also included a $2.0 million pre-tax loss on the early extinguishment of borrowings that we recorded in connection with the prepayment of a $25 million FHLBC term advance. Noninterest expense for 2007 included a $1.2 million pre-tax charge reflecting the proportionate share of the estimated litigation obligations that was allocated to us under Visa Inc.’s retrospective responsibility plan.
Income Taxes. We recorded an income tax benefit of $13,000 for the year ended December 31, 2009, compared to an income tax benefit of $12.0 million for 2008 and income tax expense of $3.0 million for 2007. For 2009, the difference between the GAAP basis (fair market value at the date of grant) and the tax basis (fair market value at the date of vesting) of equity based compensation granted in prior years reduced our income tax benefit. The income tax benefit for 2008 was due in substantial part to the recording of an impairment loss on our Freddie Mac preferred stocks.
Key Strategic Initiatives And Events
Stock Repurchase Program. Our Board of Directors has authorized the repurchase of up to 5,047,423 shares of our common stock. The authorization permits shares to be repurchased in open market or negotiated transactions, and pursuant to any trading plan that may be adopted in accordance with Rule 10b5-1 of the Securities and Exchange Commission. The authorization may be utilized at management's discretion, subject to the limitations set forth in Rule 10b-18 of the Securities and Exchange Commission and other applicable legal requirements, and to price and other internal limitations established by the Board of Directors. The repurchase authorization will expire on May 17, 2010, unless extended by the Board of Directors. As of December 31, 2009, the Company had repurchased 3,882,723 shares of its common stock pursuant to the repurchase authorization.
Quarterly Cash Dividends. Our Board of Directors declared four quarterly cash dividends of $0.07 per share during 2009. Cash dividends totaling $6.0 million were paid in 2009. On January 29, 2010, the Board of Directors declared a quarterly cash dividend of $0.07 per share that is payable on March 5, 2010.
25
Economic and Competitive Conditions
General U.S. financial market conditions stabilized during the course of 2009, but national and local economic conditions further deteriorated with respect to unemployment levels, consumer and business spending and investment activity. Pricing and underwriting for multi-family and commercial real estate loans and commercial leases were favorable due in part to diminished competition and overall higher credit risk spreads, but we expect these trends to reverse modestly in 2010. Demand for the Bank’s traditional adjustable-rate residential portfolio assets remained low due to the overwhelming market preference for fixed-rate mortgage loans given market interest rates and our underwriting standards. Pricing conditions for local deposits, whether low-balance core deposits, certificates of deposits or high-balance, high-yield transaction accounts, steadily improved during the year due to very low market yields, lower industry-wide loan demand and the disappearance of several aggressive deposit competitors from the Chicago metropolitan market.
We experienced modest growth in our multi-family loan portfolio in 2009, principally due to the careful continued expansion of our multi-family lending geographic market. Our research and experience indicate that certain markets outside our traditional market exhibit more favorable pricing and underwriting conditions for multi-family lending than those available in the Chicago metropolitan market; accordingly, we have gradually established relationships with market participants in selected metropolitan markets within reasonable travel distance from Chicago. We expect to continue this gradual expansion within the existing markets and in new markets based on our ongoing internal and third-party due diligence results as long as the required pricing and underwriting conditions remain available.
We experienced a modest contraction in our commercial real estate loan portfolio in 2009, principally due to low loan demand, a reduction in our exposure to health care-related real estate loans and deliberate action to exit certain credit exposures. Given economic conditions, however, we do not expect material growth in this portfolio absent a significant favorable shift in market conditions within our local Chicago metropolitan market.
Our construction and land loan portfolio continued to decline due to project sales activity and the conversion of some projects to income-producing properties. We continued to restrict new residential or commercial construction and land loans. We expect the balances in all construction loan categories to decline further in 2010.
We experienced continued strong growth in commercial lease originations due principally to continuing demand for technology assets and the impact of credit market disruption on non-bank competitors. The strong level of originations translated into only modest net growth due to the relatively short average life of the commercial leases in our portfolio. We experienced a slight decline in commercial loans due to reduced loan demand, declines in healthcare exposures and diminished line of credit usage by business customers. We will continue to focus on expanding our commercial lending to our commercial lease customers and local businesses to the extent that economic and credit conditions are favorable.
Our overall loan portfolio quality declined in 2009 consistent with the overall economic environment. The net increase in non-accrual loans and a related increase in loan loss reserves resulted primarily from materially weaker occupancies and effective rents on single-family, multi-family and retail commercial investment properties and a corresponding material decline in the valuations of the underlying collateral. In addition, there has been a marked increase in overall borrower insouciance to credit obligations, which seems to be directly correlated to the decline in equity positions in business assets and an increase in bankruptcy filings by business owners. General market conditions and the glacial pace of local judicial action also slowed our resolution of classified assets. We believe that unemployment, consumer spending and borrower perceptions of residential and commercial real estate valuations will be the primary factors affecting loan portfolio quality in 2010.
As we expected, our general loan loss reserves continued to increase materially. As part of our computation of the required level for our general loan loss reserve, our model incorporates the changes in national and local economic risk factors, the changes in the levels of classified loans by loan type, and the impact of the additional specific valuation allowances or charge-offs recorded on classified loans. Our underwriting standards remain consistent with our historical standards, although our credit analyses incorporate somewhat more pessimistic assumptions given the negative trends in the applicable credit risk factors.
26
Deposits increased in 2009 as many institutions retreated from their aggressive pricing practices, certain customers sought the greatest possible safety for their liquid assets and our core deposit marketing efforts continued to enjoy reasonable success. We expect a similar competitive environment for the first half of 2010, and we will continue our marketing efforts to further enhance the depth and quality of our deposit portfolio.
Though our net interest spread remained essentially constant in 2009, our net interest margin declined modestly as the impact of loans placed on non-accrual status offset the benefits of a favorable yield curve and improved credit spreads. Given the quantity and volatility of the variables affecting our net interest margin and net interest spread, we are unable to confidently predict our net interest margin and net interest spread in 2010.
Non-interest income decreased in 2009 due to a loss on the sale of our remaining Freddie Mac preferred shares, materially reduced income from our bank owned life insurance portfolio and a slight decrease in customer loan and deposit income. Wealth management performed consistently with our expectations for 2009. Income from gains on sales of fixed-rate loans increased, but the net income from loan servicing rights decreased slightly. We expect that non-interest income will be relatively constant in 2010, as income from gains on sales of fixed-rate loans are likely to be offset by decreases in deposit fees due to the potential impact of new regulatory restrictions on overdrafts by retail deposit customers.
Non-interest expense decreased in 2009 as we continued our focus on improving efficiency through operational reviews and technology deployments. The most significant expense increases involved classified asset management expense and FDIC premium expense, both of which we expect to continue at similar levels in 2010. We expect expenses related to multi-state loan originations, commercial lease originations and deposit marketing to increase, but we also expect continued expense offsets arising from the implementation of our functional reviews.
Critical Accounting Policies
Critical accounting policies are defined as those that are reflective of significant judgments and uncertainties, and could potentially result in materially different results under different assumptions and conditions. We believe that the most critical accounting policies upon which our financial condition and results of operation depend, and which involve the most complex subjective decisions or assessments, are as follows:
Allowance for Loan Losses. Arriving at an appropriate level of allowance for loan losses involves a high degree of judgment. Our allowance for loan losses provides for probable incurred losses based upon evaluations of known and inherent risks in the loan portfolio. We review the level of the allowance on a quarterly basis and establish the provision for loan losses based upon historical loan loss experience, the nature and volume of the loan portfolio, information about specific borrower situations, estimated collateral values, economic conditions and other factors to assess the adequacy of the allowance for loan losses. Among the material estimates that we must make to establish the allowance are: loss exposure at default; the amount and timing of future cash flows on affected loans; value of collateral; and determination of loss factors to be applied to the various elements of the portfolio. All of these estimates are susceptible to significant change. Although we believe that we use the best information available to us to establish the allowance for loan losses, future adjustments to the allowance may be necessary if borrower financial, collateral valuation or economic conditions differ substantially from the information and assumptions used in making the evaluation. In addition, as an integral part of their examination process, our regulatory agencies periodically review the allowance for loan losses. These agencies may require us to recognize additions to the allowance based on their judgments of information available to them at the time of their examination. A large loss could deplete the allowance and require increased provisions to replenish the allowance, which would negatively affect earnings.
Intangible Assets. Acquisitions accounted for under purchase accounting requires us to record as assets on our financial statements both goodwill, an intangible asset which is equal to the excess of the purchase price which we pay for another company over the estimated fair value of the net assets acquired, and identifiable intangible assets such as core deposit intangibles and non-compete agreements. We evaluate goodwill at least annually, or when business conditions suggest an impairment may have occurred and we will reduce its carrying value through a charge to earnings if impairment exists. Core deposit and other identifiable intangible assets are amortized to expense over their estimated useful lives and are reviewed for impairment at least annually, or whenever events or changes in circumstances indicate that the carrying amount of the asset may not be recoverable. The valuation techniques used by us to determine the carrying value of tangible and intangible assets acquired in acquisitions and the estimated lives of identifiable intangible assets involve estimates for discount rates, projected future cash flows and time period calculations, all of which are susceptible to change based on changes in economic conditions and other factors. Future events or changes in the estimates that we used to determine the carrying value of our goodwill and identifiable intangible assets or which otherwise adversely affect their value or estimated lives could have a material adverse impact on our results of operations. As of December 31, 2009, our intangible assets consisted of goodwill of $22.6 million and core deposit intangibles of $4.3 million.
27
Mortgage Servicing Rights. Mortgage servicing rights represent the present value of the future servicing fees from the right to service loans in our loan servicing portfolio. Mortgage servicing rights are recognized as assets for the allocation value of retained servicing rights on loans sold. The most critical accounting policy associated with mortgage servicing is the methodology used to determine the fair value of capitalized mortgage servicing rights, which requires a number of estimates, the most critical of which is the mortgage loan prepayment speed assumption. The mortgage loan prepayment speed assumption is significantly affected by interest rates. In general, during periods of falling interest rates, mortgage loans prepay faster and the value of our mortgage servicing assets declines. Conversely, during periods of rising rates, the value of mortgage servicing rights generally increases due to slower rates of prepayments. The amount and timing of mortgage servicing rights amortization is adjusted monthly based on actual results. In addition, on a quarterly basis, we perform a valuation review of mortgage servicing rights for potential declines in value. This quarterly valuation review entails applying current assumptions to the portfolio classified by interest rates and, secondarily, by geographic and prepayment characteristics. Based on the significance of any changes in assumptions since the preceding appraisal, this valuation may include an independent appraisal of the fair value of our servicing portfolio.
Income Taxes. We consider accounting for income taxes a critical accounting policy due to the subjective nature of certain estimates that are involved in the calculation. We use the asset/liability method of accounting for income taxes in which deferred tax assets and liabilities are established for the temporary differences between the financial reporting basis and the tax basis of our assets and liabilities. We must assess the realization of the deferred tax asset and, to the extent that we believe that recovery is not likely, a valuation allowance is established. Adjustments to increase or decrease the valuation allowance are charged or credited, respectively, to income tax expense. No valuation allowance was required at December 31, 2009. Although we have determined a valuation allowance is not required for any deferred tax assets at December 31, 2009, there is no guarantee that a valuation allowance will not be required in the future.
Statement of Financial Condition at December 31, 2009 and December 31, 2008
Total assets increased $12.2 million, or 0.8%, to $1.567 billion at December 31, 2009, from $1.555 billion at December 31, 2008, primarily due to a $78.9 million increase in net cash and cash equivalents to $108.2 million at December 31, 2009, from $29.3 million at December 31, 2008.
Our loan portfolio consists primarily of investment and business loans (multi-family, nonresidential real estate, commercial, construction and land loans, and commercial leases), which together make up 76.4% of gross loans. Net loans receivable decreased $49.5 million, or 3.9%, to $1.218 billion at December 31, 2009, from $1.268 billion at December 31, 2008. The decrease was due in substantial part to a net decrease in one-to-four family residential mortgage loans, nonresidential real estate loans, construction and land loans and commercial loans. One-to-four family residential mortgage loans decreased $22.8 million, or 7.3%, primarily due to refinancings that were not replaced with new originations. Construction and land loans decreased $18.1 million, or 35.7%, primarily due to principal payments of $16.7 million resulting from project sales activities, which were partially offset by $4.6 million in draws on existing credit commitments. Nonresidential real estate loans decreased $26.0 million, or 7.6%, primarily due to principal payments of $53.6 million, which were partially offset by $15.5 million in draws on existing credit commitments. Commercial loans decreased by $4.6 million, or 5.0%, due in part to reduced loan demand, declines in healthcare credit exposures and diminished line of credit usage by business customers. These reductions were partially offset by a net increase in multi-family loans and commercial leases. Multi-family real estate loans increased by $23.9 million, or 7.8%, and commercial leases increased by $2.2 million, or 1.2%, due to increased originations in these targeted loan categories.
Our allowance for loan losses increased by $3.9 million, to $18.6 million at December 31, 2009, from $14.7 million at December 31, 2008. The increase reflects the combined impact of a $2.4 million increase in the portion of the specific allowance for loan losses that we allocate to impaired loans, a $1.5 million increase in the general portion of the allowance for loan losses, and $4.9 million in net charge offs. Increases in the specific portion of the allowance for loan losses occurred principally in the following areas: investor owned one-to-four family residential loans ($973,000); multi-family loans ($569,000); non-residential real estate loans ($513,000); commercial loans ($254,000); and construction and land loans ($107,000). Net decreases in the specific portion of the allowance for loan losses that we allocate to impaired loans occurred in consumer loans and commercial leases.
28
Securities decreased by $22.8 million, or 18.3%, to $102.1 million at December 31, 2009, from $124.9 million at December 31, 2008. The primary reason for the decrease was $25.6 million in principal repayments, sales and maturities of securities.
We owned common stock of the FHLBC with a stated par value of $15.6 million at December 31, 2009 and 2008. The FHLBC has not declared any dividends on its common stock since the third quarter of 2007 due to the combined effect of the FHLBC’s financial condition and a cease and desist order that prohibits the FHLBC from declaring dividends without the prior approval of the Director of the Federal Housing Finance Agency. The cease and desist order imposes a similar prior approval requirement on the FHLBC’s repurchase or redemption of common stock from existing and withdrawn members, subject to certain exceptions that are not applicable to the shares of FHLBC common stock that we own. The FHLBC has stated in its recent public filings that it cannot predict when it will resume paying dividends or repurchasing or redeeming common shares that are subject to the restrictions imposed by the cease and desist order.
Pursuant to the FDIC final rule requiring insured depository institutions to prepay their estimated quarterly risk-based assessments for the fourth quarter of 2009, and for all of 2010, 2011, and 2012, we paid $457,000 in estimated assessments for the fourth quarter of 2009 and prepaid $6.8 million in estimated assessments through 2012.
In conjunction with the sale of our Freddie Mac preferred stocks in 2009, we recorded an income tax receivable of $11.7 million at December 31, 2009. Other assets decreased $11.5 million to $12.2 million at December 31, 2009, from $23.7 million at December 31, 2008, primarily due to an $8.9 million decrease in deferred tax assets.
Deposits increased $163.5 million, or 15.3%, to $1.233 billion at December 31, 2009, from $1.070 billion at December 31, 2008, primarily due to increased money market account and certificate of deposit balances. Money market accounts increased $116.4 million, or 56.5%, to $322.1 million at December 31, 2009, from $205.8 million at December 31, 2008. Certificates of deposit increased $29.1 million, or 7.8%, to $403.6 million at December 31, 2009, from $374.5 million at December 31, 2008. Total core deposits (savings, money market, noninterest-bearing demand and interest-bearing NOW accounts) increased as a percentage of total deposits, representing 67.3% of total deposits at December 31, 2009, compared to 65.0% of total deposits at December 31, 2008.
Borrowings decreased $149.6 million, or 74.7%, to $50.8 million at December 31, 2009, from $200.4 million at December 31, 2008, due to our reductions of outstanding FHLBC advances.
Total stockholders’ equity was $263.6 million at December 31, 2009, compared to $266.8 million at December 31, 2008. The decrease in total stockholders’ equity was primarily due to the combined impact of our repurchase of 277,800 shares of our common stock for a total cost of $2.5 million, the declaration and payment of cash dividends totaling $6.0 million, and the $738,000 net loss that we recorded for the year ended 2009. These items were partially offset by a $2.5 million increase in accumulated other comprehensive income, and a $3.5 million increase in additional paid in capital resulting from the vesting of stock-based compensation and ESOP shares earned. The unallocated shares of common stock that our ESOP owns were reflected as a $15.2 million reduction to stockholders’ equity at December 31, 2009, compared to a $16.1 million at December 31, 2008.
Loans
We originate multi-family mortgage loans, nonresidential real estate loans, commercial loans, commercial leases, and construction and land loans. In addition, we originate one-to-four family residential mortgage loans and consumer loans, and purchase and sell loan participations from time-to-time. The following briefly describes our principal loan products.
Multi-family Mortgage Loans. Loans secured by multi-family mortgage loans totaled $329.2 million, or 26.7%, of our total loan portfolio, at December 31, 2009. At December 31, 2009, $65.2 million of our multi-family mortgage loan portfolio consisted of loans originated in carefully selected metropolitan markets outside the Bank’s primary lending area, and these loans represented 19.8% of our multi-family mortgage loan portfolio and 5.3% of our total loan portfolio. Multi-family mortgage loans generally are secured by multi-family rental properties such as apartment buildings, including subsidized apartment units. The majority of our multi-family mortgage loans have adjustable interest rates following an initial fixed-rate period, typically between three and five years.
29
Nonresidential Real Estate Loans. Loans secured by nonresidential real estate totaled $316.6 million, or 25.6%, of our total loan portfolio, at December 31, 2009. We emphasize nonresidential real estate loans with initial principal balances between $1.0 million and $5.0 million. The nonresidential real estate properties securing these loans are predominantly office buildings, light industrial buildings, shopping centers and mixed-use developments, and to a lesser extent, more specialized properties such as nursing homes and other healthcare facilities. Substantially all of our nonresidential real estate loans are secured by properties located in our primary market area. Our nonresidential real estate loans are typically written as three- or five-year adjustable-rate mortgage loans or mortgage loans with balloon maturities of three or five years. Amortization of these loans is typically based on 20- to 25-year payout schedules. We also originate some 15-year fixed-rate, fully amortizing loans.
Commercial Loans. Commercial loans totaled $88.1 million, or 7.1%, of our total loan portfolio, at December 31, 2009. This total includes unsecured commercial loans with an aggregate outstanding balance of $8.0 million. We generally make commercial loans to customers in our primary market area to finance equipment acquisition, expansion, working capital and other general business purposes. The terms of these loans generally range from less than one year to five years. The loans either are negotiated on a fixed-rate basis, or carry adjustable interest rates indexed to a lending rate that is determined internally or based on a short-term market rate index.
Commercial Leases. Commercial leases totaled $176.8 million, or 14.3%, of our total loan portfolio, at December 31, 2009. Our commercial leases primarily involve technology equipment, material handling equipment, and other capital equipment. The transactions are generally structured as a non-recourse assignment by the leasing company of the payment stream on the lease supplemented by the grant of a security interest in the lease and the leased equipment. Consequently, we underwrite leases by examining the creditworthiness of the lessee rather than the lessor. The lessee generally agrees to send the lease payments directly to us. As of December 31, 2009, 58.6% of our commercial lease portfolio involved lessees with investment-grade rated public debt, 36.0% involved publicly-traded lessees with no public debt and thus no public debt rating, and 5.4% involved privately-held lessees or lessees with a below investment-grade public debt rating. Debt ratings are determined by Moody’s, Standard & Poors, Fitch, A.M. Best or an equivalent rating firm. Commercial leases typically have a maximum maturity of seven years and we limit our maximum outstanding credit exposure to $10.0 million to any single entity. Leases to companies with no public debt ratings generally involve companies with a net worth in excess of $25.0 million and typically have a maximum maturity of five years.
Construction and Land Loans. Construction and land loans totaled $32.6 million, or 2.6%, of our total loan portfolio at December 31, 2009. These loans generally consist of land acquisition loans to help finance the purchase of land intended for further development, including single-family homes, multi-family housing and commercial income property, development loans to builders in our market area to finance improvements to real estate, consisting mostly of single-family subdivisions, typically to finance the cost of utilities, roads, sewers and other development costs. Builders generally rely on the sale of single-family homes to repay development loans, although in some cases the improved building lots may be sold to another builder, often in conjunction with development loans. In general, the maximum loan-to-value ratio for raw land acquisition loan is 65% of the appraised value of the property, and the maximum term of these loans is two years. The maximum amount loaned on a development loan is generally limited to the cost of the land and public improvements, and advances are made in accordance with a schedule reflecting the cost of the improvements. Advances are generally limited to 90% of actual construction costs and, as required by applicable regulations, a 75% loan to completed appraised value ratio. We have discouraged new construction lending for the past several years and have had only limited interest in site acquisition loans for future construction.
One- to-Four Family Residential Mortgage Lending. Conforming and non-conforming fixed-rate and adjustable-rate residential mortgage loans totaled $289.6 million, or 23.4%, of our total loan portfolio at December 31, 2009. Our residential mortgage loan portfolio includes traditional one-to-four family residential mortgage loans, home equity loans and home equity lines of credit that are secured by the borrower’s primary residence, and loans to investors in non-owner-occupied single-family homes. At December 31, 2009, home equity loans totaled $12.5 million, or 1.0%, of total loans, home equity lines of credit totaled $85.0 million, or 6.9%, of total loans, and loans to investors in non-owner-occupied single-family homes totaled $81.1 million, or 6.6% of total loans. We generally originate both fixed- and adjustable-rate loans in amounts up to the maximum conforming loan limits as established by Fannie Mae, which is currently $417,000 for single-family homes. Private mortgage insurance is required for first mortgage loans with loan-to-value ratios in excess of 80%. At December 31, 2009, our adjustable-rate residential mortgage loan portfolio totaled $149.5 million, and included $30.9 million in loans that reprice once a year and $118.6 million in loans that reprice periodically after an initial fixed-rate period of three years or more.
30
We also originate loans above conforming limits, referred to as “jumbo loans,” that are underwritten to the credit standards of Fannie Mae given the demand for these loans in the Chicago metropolitan area. We also originate loans that do not fully meet the credit standards of Fannie Mae if they are deemed to be acceptable risks given their favorable compensating risk factors. In general, we do not originate or purchase loans with underwriting characteristics that, taken together, are materially lower than the credit standards of Fannie Mae, and as part of the underwriting process, consider the availability of purchasers for jumbo and other nonconforming loans.
31
Loan Portfolio Composition
The following table sets forth the composition of our loan portfolio, excluding loans held for sale, by type of loan at the dates indicated.
| At December 31, | |||||||||||||||||||||||||||||||||||
| 2009 | 2008 | 2007 | 2006 | 2005 | |||||||||||||||||||||||||||||||
| Amount | Percent | Amount | Percent | Amount | Percent | Amount | Percent | Amount | Percent | ||||||||||||||||||||||||||
| (Dollars in thousands) | |||||||||||||||||||||||||||||||||||
| One- to-four family residential |
$ | 289,623 | 23.44 | % | $ | 312,390 | 24.39 | % | $ | 345,245 | 27.33 | % | $ | 397,545 | 29.71 | % | $ | 404,196 | 32.63 | % | |||||||||||||||
| Multi-family mortgage |
329,227 | 26.65 | 305,318 | 23.84 | 291,395 | 23.07 | 297,131 | 22.20 | 280,238 | 22.62 | |||||||||||||||||||||||||
| Nonresidential real estate |
316,607 | 25.62 | 342,583 | 26.74 | 325,885 | 25.80 | 320,729 | 23.97 | 275,418 | 22.23 | |||||||||||||||||||||||||
| Construction and land |
32,577 | 2.64 | 50,687 | 3.96 | 64,483 | 5.10 | 85,222 | 6.37 | 80,705 | 6.53 | |||||||||||||||||||||||||
| Commercial loans |
88,067 | 7.13 | 92,679 | 7.23 | 87,777 | 6.95 | 94,305 | 7.05 | 74,207 | 5.99 | |||||||||||||||||||||||||
| Commercial leases |
176,821 | 14.31 | 174,644 | 13.63 | 144,841 | 11.47 | 139,164 | 10.40 | 121,898 | 9.84 | |||||||||||||||||||||||||
| Consumer |
2,539 | 0.21 | 2,655 | 0.21 | 3,506 | 0.28 | 4,045 | 0.30 | 2,022 | 0.16 | |||||||||||||||||||||||||
| Total loans |
1,235,461 | 100.00 | % | 1,280,956 | 100.00 | % | 1,263,132 | 100.00 | % | 1,338,141 | 100.00 | % | 1,238,684 | 100.00 | % | ||||||||||||||||||||
| Loans in process |
(73 | ) | (154 | ) | (168 | ) | 148 | 2,180 | |||||||||||||||||||||||||||
| Net deferred loan origination costs |
1,701 | 1,912 | 2,086 | 2,424 | 2,541 | ||||||||||||||||||||||||||||||
| Allowance for loan losses |
(18,622 | ) | (14,746 | ) | (11,051 | ) | (10,622 | ) | (11,514 | ) | |||||||||||||||||||||||||
| Total loans, net |
$ | 1,218,467 | $ | 1,267,968 | $ | 1,253,999 | $ | 1,330,091 | $ | 1,231,891 | |||||||||||||||||||||||||
32
Loan Portfolio Maturities
The following table summarizes the scheduled repayments of our loan portfolio at December 31, 2009. Demand loans, loans having no stated repayment schedule or maturity and overdraft loans are reported as being due in one year or less.
| Within One Year |
One Year Through Five Years |
Beyond Five Years |
Total | |||||||||
| (Dollars in thousands) | ||||||||||||
| Scheduled Repayments of Loans: |
||||||||||||
| One- to-four family residential |
$ | 32,948 | $ | 67,439 | $ | 189,236 | $ | 289,623 | ||||
| Multi-family mortgage |
66,601 | 85,298 | 177,328 | 329,227 | ||||||||
| Nonresidential real estate |
122,659 | 181,907 | 12,041 | 316,607 | ||||||||
| Construction and land |
31,330 | 1,103 | 144 | 32,577 | ||||||||
| Commercial loans and leases |
151,411 | 110,431 | 3,046 | 264,888 | ||||||||
| Consumer |
1,434 | 653 | 452 | 2,539 | ||||||||
| Total loans |
$ | 406,383 | $ | 446,831 | $ | 382,247 | $ | 1,235,461 | ||||
| Total | ||||||||||||
| Loans Maturing After One Year: |
||||||||||||
| Predetermined (fixed) interest rates |
$ | 421,483 | ||||||||||
| Adjustable interest rates |
407,595 | |||||||||||
| Total loans |
$ | 829,078 | ||||||||||
Nonperforming Loans and Assets
We review loans on a regular basis, and generally place loans on nonaccrual status when either principal or interest is 90 days or more past due. In addition, we place loans on nonaccrual status when we do not expect to receive full payment of interest or principal. Interest accrued and unpaid at the time a loan is placed on nonaccrual status is reversed from interest income. Interest payments received on nonaccrual loans are recognized in accordance with our significant accounting polices. We may have loans classified as 90 days or more delinquent and still accruing. Generally, we do not utilize this category of loan classification unless: (1) the loan is repaid in full shortly after the period end date; (2) the loan is well secured and there are no asserted or pending legal barriers to its collection; or (3) the borrower has remitted all scheduled payments and is otherwise in substantial compliance with the terms of the loan, but the processing of loan payments actually received or the renewal of the loan has not occurred for administrative reasons. At December 31, 2009, we had two loans totaling $148,000 in this category.
At December 31, 2009, we had nonaccrual loans of $49.5 million, an increase of $35.8 million from December 31, 2008. Increases in nonaccrual loans occurred principally in the following areas: multi-family loans ($11.9 million); one-to-four family residential loans ($9.2 million); non-residential real estate loans ($8.1 million); construction and land loans ($3.7 million); and commercial loans ($3.0 million). Decreases in non-accrual loans occurred in commercial leases ($105,000). At December 31, 2009 no accrued interest on nonaccrual loans had been recognized.
The increase in nonaccrual loans was primarily due to the deterioration of local economic conditions in our primary Chicago metropolitan market territory. Significant increases in unemployment created materially higher levels of vacancies for rental housing and a decline in effective rents. In addition, the decline in consumer and business spending negatively impacted the cash flow of retail commercial real estate tenants, owners and certain commercial borrowers, resulting in higher levels of vacancies, business closures and business bankruptcies. Of particular note was a considerable increase in the number of borrowers or guarantors who chose not to meet their credit obligations due to diminished or negative equity in their assets.
Real estate acquired through foreclosure or deed in lieu of foreclosure is classified as real estate owned until it is sold. When real estate is acquired through foreclosure or by deed in lieu of foreclosure, it is recorded at its fair value, less the estimated costs of disposal. If the fair value of the property is less than the loan balance, the difference is charged against the allowance for loan losses.
We typically obtain new third-party appraisals or collateral valuations when we commence formal collection action unless the existing valuation information for the collateral is sufficiently current to comply with the requirements of our Appraisal and Collateral Valuation (ACV) Policy. We use updated valuations when time constraints do not permit a full appraisal process or when ACV Policy-compliant appraisals must be updated to reflect rapidly changing market conditions. Because appraisals and updated valuations utilize historical data in reaching valuation conclusions, the appraised or updated value may or may not reflect the actual sales price that we will receive at the time of sale.
33
Real estate appraisals typically include up to three approaches to value: the sales comparison approach, the income approach (for income-producing property) and the cost approach. Not all appraisals utilize all three approaches to value. Depending on the nature of the collateral and market conditions, we may emphasize one approach over another in determining the fair value of collateral.
Appraisals may also contain different estimates of value based on the level of occupancy or future improvements. “As-is” valuations represent an estimate of value based on current market conditions with no changes to the collateral’s use or condition. “As-stabilized” or “as-completed” valuations assume that the collateral is improved to a stated standard or achieves its highest and best use in terms of occupancy. “As-stabilized” valuations may be subject to a present value adjustment for market conditions or the schedule for improvements.
In connection with the valuation process, we will typically develop an exit strategy for the collateral by assessing overall market conditions, the current condition and use of the asset and its highest and best use. For most income-producing real estate, investors value most highly a stable income stream from the asset; consequently, we conduct a comparative evaluation to determine whether conducting a sale on an “as-is” basis or on an “as-stabilized” basis is most likely to produce the highest net realizable value.
Our estimates of the net realizable value of collateral include a deduction for the expected costs to sell the collateral or such other deductions from the cash flows resulting from the liquidation of cash flows as may be appropriate. For most real estate collateral, we apply a ten percent deduction to the value of real estate collateral to determine its expected costs to sell the asset. This estimate includes real estate commissions, one year of real estate taxes and miscellaneous repair and closing costs. If we receive a purchase offer that requires unbudgeted repairs, or if the expected holding period for the asset exceeds one year, then we include the additional real estate taxes and repairs or other holdings costs in the expected costs to sell the collateral on a case-by-case basis.
The following table below sets forth the amounts and categories of our nonperforming loans and nonperforming assets at the dates indicated.
| At December 31, | ||||||||||||||||||||
| 2009 | 2008 | 2007 | 2006 | 2005 | ||||||||||||||||
| (Dollars in thousands) | ||||||||||||||||||||
| Nonaccrual loans: |
||||||||||||||||||||
| One-to-four family residential |
$ | 11,453 | $ | 2,205 | $ | 2,196 | $ | 2,212 | $ | 1,484 | ||||||||||
| Multi-family mortgage |
13,961 | 2,101 | 4,186 | 1,165 | 477 | |||||||||||||||
| Nonresidential real estate |
11,074 | 2,961 | 2,823 | 4,378 | 2,464 | |||||||||||||||
| Construction and land |
8,841 | 5,145 | 988 | — | — | |||||||||||||||
| Commercial loans |
4,160 | 1,141 | 1,751 | 1,419 | 1,159 | |||||||||||||||
| Commercial leases |
— | 105 | 112 | 47 | 139 | |||||||||||||||
| Consumer |
— | — | 2 | 5 | — | |||||||||||||||
| Total nonperforming loans |
49,489 | 13,658 | 12,058 | 9,226 | 5,723 | |||||||||||||||
| Real estate owned: |
||||||||||||||||||||
| One-to-four family residential |
601 | 588 | 252 | — | 153 | |||||||||||||||
| Multi-family mortgage |
976 | 133 | — | — | — | |||||||||||||||
| Nonresidential real estate |
1,416 | — | 568 | — | — | |||||||||||||||
| Construction and land |
1,091 | 234 | — | — | — | |||||||||||||||
| Total real estate owned |
4,084 | 955 | 820 | — | 153 | |||||||||||||||
| Total nonperforming assets |
$ | 53,573 | $ | 14,613 | $ | 12,878 | $ | 9,226 | $ | 5,876 | ||||||||||
| Ratios: |
||||||||||||||||||||
| Nonperforming loans to total loans |
4.01 | % | 1.07 | % | 0.95 | % | 0.69 | % | 0.46 | % | ||||||||||
| Nonperforming assets to total assets |
3.42 | 0.94 | 0.87 | 0.57 | 0.36 | |||||||||||||||
34
Risk Classification of Assets
Our policies, consistent with regulatory guidelines, provide for the classification of loans and other assets that are considered to be of lesser quality as substandard, doubtful, or loss assets. An asset is considered substandard if it is inadequately protected by the current net worth and paying capacity of the obligor or the collateral pledged, if any. Substandard assets include those characterized by the distinct possibility that we will sustain some loss if the deficiencies are not corrected. Assets classified as doubtful have all of the weaknesses inherent in assets classified as substandard with the added characteristic that the weaknesses present also make collection or liquidation in full, on the basis of currently existing facts, conditions and values, highly questionable and improbable. Assets classified as loss are those considered uncollectible and of such little value that their continuance as assets is not warranted.
Based on a review of our assets at December 31, 2009, classified assets consisted of substandard assets of $48.9 million and doubtful assets of $1.1 million, and we had no loans classified as loss assets. As of December 31, 2009, we had $37.2 million of assets designated as special mention. Of the assets designated as special mention, the largest single asset is a $5.7 million commercial construction loan secured by a retail shopping center. The retail shopping center is now 92% occupied by businesses related to one of the investors in the entity that owns the shopping center. The loan is further secured by additional collateral pledged by the investors, and is supported by the personal guarantees of the investors. It appears that the business operations of the existing tenants, together with supplementary personal resources of the guarantors, will be sufficient to make the scheduled loan payments until the project reaches full occupancy. However, it is possible that future payment performance, tenant business results or changes in the financial condition and capability of the guarantors could result in a future adverse risk classification.
Allowance for Loan Losses
We establish provisions for loan losses, which are charged to operations in order to maintain the allowance for loan losses at a level we consider necessary to absorb probable incurred credit losses in the loan portfolio. In determining the level of the allowance for loan losses, we consider past and current loss experience, evaluations of real estate collateral, current economic conditions, volume and type of lending, adverse situations that may affect a borrower’s ability to repay a loan and the levels of nonperforming and other classified loans. The amount of the allowance is based on estimates and the ultimate losses may vary from such estimates as more information becomes available or later events change.
We provide for loan losses based on the allowance method. Accordingly, all loan losses are charged to the related allowance and all recoveries are credited to it. Additions to the allowance for loan losses are provided by charges to income based on various factors that, in our judgment, deserve current recognition in estimating probable incurred losses. We review the loan portfolio on an ongoing basis and make provisions for loan losses on a quarterly basis to maintain the allowance for loan losses in accordance with accounting principles generally accepted in the United States of America. The allowance for loan losses consists of two components:
| • | specific allowances established for any impaired multi-family mortgage, nonresidential real estate, construction and land, commercial, and commercial lease loans for which the recorded investment in the loan exceeds the measured value of the loan; and |
| • | general allowances for loan losses for each loan type based on historical loan loss experience; and adjustments to historical loss experience (general allowances), maintained to cover uncertainties that affect our estimate of probable incurred losses for each loan type. |
The adjustments to historical loss experience are based on our evaluation of several factors, including levels of, and trends in, past due and classified loans; levels of, and trends in, charge-offs and recoveries; trends in volume and terms of loans, including any credit concentrations in the loan portfolio; experience, ability, and depth of lending management and other relevant staff; and national and local economic trends and conditions.
We evaluate the allowance for loan losses based upon the combined total of the specific and general components. Generally, when the loan portfolio increases, absent other factors, the allowance for loan loss methodology results in a higher dollar amount of estimated probable incurred losses than would be the case without the increase. Conversely, when the loan portfolio decreases, absent other factors, the allowance for loan loss methodology generally results in a lower dollar amount of estimated probable losses than would be the case without the decrease.
35
We review our loan portfolio on an ongoing basis to determine whether any loans require classification and impairment testing in accordance with applicable regulations and accounting principles. When we classify loans as either substandard or doubtful and in certain other cases, we review the collateral and future cash flow projections to determine if a specific reserve is necessary. The allowance for loan losses represents amounts that have been established to recognize incurred losses in the loan portfolio that are both probable and reasonably estimable at the date of the financial statements. When we classify problem loans as loss, we charge-off such amounts. While we use the best information available to make evaluations, future adjustments to the allowance may be necessary if conditions differ substantially from the information used in making the evaluations. Our determination as to the risk classification of our loans and the amount of our loss allowances are subject to review by our regulatory agencies, which can require that we establish additional loss allowances.
The following table sets forth activity in our allowance for loan losses for the years indicated.
| At or For the Years Ended December 31, | ||||||||||||||||||||
| 2009 | 2008 | 2007 | 2006 | 2005 | ||||||||||||||||
| (Dollars in thousands) | ||||||||||||||||||||
| Balance at beginning of year |
$ | 14,746 | $ | 11,051 | $ | 10,622 | $ | 11,514 | $ | 11,019 | ||||||||||
| Charge-offs: |
||||||||||||||||||||
| One-to-four family residential |
(461 | ) | (248 | ) | (10 | ) | — | — | ||||||||||||
| Multi-family mortgage |
(297 | ) | (169 | ) | — | — | — | |||||||||||||
| Nonresidential real estate |
(1,518 | ) | (605 | ) | — | — | — | |||||||||||||
| Construction and land |
(2,262 | ) | (115 | ) | — | — | — | |||||||||||||
| Commercial loans |
(463 | ) | (130 | ) | (237 | ) | (946 | ) | (49 | ) | ||||||||||
| Commercial leases |
(22 | ) | — | — | — | — | ||||||||||||||
| Consumer |
(42 | ) | (146 | ) | (58 | ) | (26 | ) | (66 | ) | ||||||||||
| Total charge-offs |
(5,065 | ) | (1,413 | ) | (305 | ) | (972 | ) | (115 | ) | ||||||||||
| Recoveries: |
||||||||||||||||||||
| One-to-four family residential |
82 | 1 | — | — | — | |||||||||||||||
| Multi-family mortgage |
— | — | — | — | — | |||||||||||||||
| Nonresidential real estate |
36 | 4 | — | — | — | |||||||||||||||
| Construction and land |
— | — | — | — | — | |||||||||||||||
| Commercial loans |
3 | 1 | 14 | — | 88 | |||||||||||||||
| Commercial leases |
6 | — | — | — | — | |||||||||||||||
| Consumer |
3 | 10 | 23 | 4 | 4 | |||||||||||||||
| Total recoveries |
130 | 16 | 37 | 4 | 92 | |||||||||||||||
| Net charge-offs |
(4,935 | ) | (1,397 | ) | (268 | ) | (968 | ) | (23 | ) | ||||||||||
| Allowance of acquired bank |
— | — | — | 212 | — | |||||||||||||||
| Provision (credit) for loan losses |
8,811 | 5,092 | 697 | (136 | ) | 518 | ||||||||||||||
| Balance at end of year |
$ | 18,622 | $ | 14,746 | $ | 11,051 | $ | 10,622 | $ | 11,514 | ||||||||||
| Ratios: |
||||||||||||||||||||
| Net charge-offs to average loans outstanding |
0.39 | % | 0.11 | % | 0.02 | % | 0.07 | % | 0.00 | % | ||||||||||
| Allowance for loan losses to nonperforming loans |
37.63 | 107.97 | 91.65 | 115.13 | 201.19 | |||||||||||||||
| Allowance for loan losses to total loans |
1.51 | 1.15 | 0.87 | 0.79 | 0.93 | |||||||||||||||
Net Charge-offs and Recoveries
Net charge-offs and total charge-offs were $4.9 million and $5.1 million, respectively, for the year ended December 31, 2009, compared to $1.4 million in net charge-offs and total charge-offs for the year ended December 31, 2008, and $268,000 in net charge-offs and $305,000 in total charge-offs for the year ended December 31, 2007. Total recoveries were $130,000 in 2009, compared to $16,000 in 2008 and $37,000 in 2007.
We recorded a provision for loan losses of $8.8 million in 2009, compared to $5.1 million in 2008 and $697,000 in 2007. Of the $8.8 million provision for loan losses that we recorded in 2009, $2.4 million is attributable to the specific portion of the allowance for loan losses that we allocate to impaired loans, $1.5 million is attributable to the general portion of the allowance for loan losses, and the remainder is attributable to the replenishment of amounts that were charged-off during 2009.
36
Allocation of Allowance for Loan Losses
The following table sets forth our allowance for loan losses allocated by loan category. The allowance for loan losses allocated to each category is not necessarily indicative of future losses in any particular category and does not restrict the use of the allowance to absorb losses in other categories.
| At December 31, | |||||||||||||||||||||||||||
| 2009 | 2008 | 2007 | |||||||||||||||||||||||||
| Allowance for Loan Losses |
Loan Balances by Category |
Percent of Loans in Each Category to Total Loans |
Allowance for Loan Losses |
Loan Balances by Category |
Percent of Loans in Each Category to Total Loans |
Allowance for Loan Losses |
Loan Balances by Category |
Percent of Loans in Each Category to Total Loans |
|||||||||||||||||||
| (Dollars in thousands) | |||||||||||||||||||||||||||
| One-to-four family residential |
$ | 3,333 | $ | 289,623 | 23.44 | % | $ | 2,040 | $ | 312,390 | 24.39 | % | $ | 1,823 | $ | 345,245 | 27.33 | % | |||||||||
| Multi-family mortgage |
3,597 | 329,227 | 26.65 | 2,370 | 305,318 | 23.84 | 2,206 | 291,395 | 23.07 | ||||||||||||||||||
| Nonresidential real estate |
5,696 | 316,607 | 25.62 | 4,659 | 342,583 | 26.74 | 3,055 | 325,885 | 25.80 | ||||||||||||||||||
| Construction and land |
1,861 | 32,577 | 2.64 | 1,899 | 50,687 | 3.96 | 937 | 64,483 | 5.10 | ||||||||||||||||||
| Commercial loans |
2,520 | 88,067 | 7.13 | 2,058 | 92,679 | 7.23 | 1,799 | 87,777 | 6.95 | ||||||||||||||||||
| Commercial leases |
1,591 | 176,821 | 14.31 | 1,668 | 174,644 | 13.63 | 1,174 | 144,841 | 11.47 | ||||||||||||||||||
| Consumer |
24 | 2,539 | 0.21 | 52 | 2,655 | 0.21 | 57 | 3,506 | 0.28 | ||||||||||||||||||
| Total |
$ | 18,622 | $ | 1,235,461 | 100.00 | % | $ | 14,746 | $ | 1,280,956 | 100.00 | % | $ | 11,051 | $ | 1,263,132 | 100.00 | % | |||||||||
| At December 31, | ||||||||||||||||||
| 2006 | 2005 | |||||||||||||||||
| Allowance for Loan Losses |
Loan Balances by Category |
Percent of Loans in Each Category to Total Loans |
Allowance for Loan Losses |
Loan Balances by Category |
Percent of Loans in Each Category to Total Loans |
|||||||||||||
| (Dollars in thousands) | ||||||||||||||||||
| One-to-four family residential |
$ | 1,855 | $ | 397,545 | 29.71 | % | $ | 1,418 | $ | 404,196 | 32.63 | % | ||||||
| Multi-family mortgage |
1,908 | 297,131 | 22.20 | 2,102 | 280,238 | 22.62 | ||||||||||||
| Nonresidential real estate |
2,846 | 320,729 | 23.97 | 3,423 | 275,418 | 22.23 | ||||||||||||
| Construction and land |
1,120 | 85,222 | 6.37 | 1,210 | 80,705 | 6.53 | ||||||||||||
| Commercial loans |
1,741 | 94,305 | 7.05 | 2,466 | 74,207 | 5.99 | ||||||||||||
| Commercial leases |
1,112 | 139,164 | 10.40 | 718 | 121,898 | 9.84 | ||||||||||||
| Consumer |
40 | 4,045 | 0.30 | 17 | 2,022 | 0.16 | ||||||||||||
| Unallocated |
— | — | — | 160 | — | — | ||||||||||||
| Total |
$ | 10,622 | $ | 1,338,141 | 100.00 | % | $ | 11,514 | $ | 1,238,684 | 100.00 | % | ||||||
37
Securities
Our investment policy is established by our Board of Directors. The policy emphasizes safety of the investment, liquidity requirements, potential returns, cash flow targets, and consistency with our interest rate risk management strategy.
At December 31, 2009, our mortgage-backed securities and collateralized mortgage obligations (“CMOs”) reflected in the following table were issued by U.S. government-sponsored entities and agencies, Freddie Mac, Fannie Mae and Ginnie Mae, and are obligations which the government has affirmed its commitment to support. The equity securities reflected in the 2007 and 2008 columns in the table consist of Freddie Mac preferred stocks. All securities reflected in the table were classified as available-for-sale at December 31, 2009, 2008 and 2007.
We hold the FHLBC common stock to qualify for membership in the Federal Home Loan Bank System and to be eligible to borrow funds under the FHLBC’s advance program. The aggregate cost of our FHLBC common stock as of December 31, 2009 was $15.6 million based on its par value. There is no market for FHLBC common stock. Due to our receipt of stock dividends in prior years and the amount of our outstanding FHLBC advances, we owned shares of FHLBC common stock at December 31, 2009 with a par value that was $8.9 million more than we were required to own to maintain our membership in the Federal Home Loan Bank System and to be eligible to obtain advances (“excess” or “voluntary” capital stock).
The following table sets forth the composition, amortized cost and fair value of our securities at the dates indicated.
| At December 31, | ||||||||||||||||||
| 2009 | 2008 | 2007 | ||||||||||||||||
| Amortized Cost |
Fair Value | Amortized Cost |
Fair Value | Amortized Cost |
Fair Value | |||||||||||||
| (Dollars in thousands) | ||||||||||||||||||
| Securities: |
||||||||||||||||||
| Certificate of deposits |
$ | — | $ | — | $ | 500 | $ | 500 | $ | — | $ | — | ||||||
| Municipal securities |
1,225 | 1,303 | 1,735 | 1,811 | 2,210 | 2,272 | ||||||||||||
| SBA guaranteed loan participation certificates |
114 | 115 | 131 | 125 | 595 | 592 | ||||||||||||
| Equity securities: |
||||||||||||||||||
| Freddie Mac |
— | — | 2,356 | 353 | 38,275 | 31,225 | ||||||||||||
| Total securities |
1,339 | 1,418 | 4,722 | 2,789 | 41,080 | 34,089 | ||||||||||||
| Mortgage-backed Securities: |
||||||||||||||||||
| Mortgage-backed securities |
33,008 | 34,057 | 41,865 | 41,976 | 39,307 | 39,277 | ||||||||||||
| CMOs and REMICs |
64,791 | 66,651 | 79,425 | 80,154 | 3,649 | 3,683 | ||||||||||||
| Total mortgage-backed securities |
97,799 | 100,708 | 121,290 | 122,130 | 42,956 | 42,960 | ||||||||||||
| Total securities |
$ | 99,138 | $ | 102,126 | $ | 126,012 | $ | 124,919 | $ | 84,036 | $ | 77,049 | ||||||
The fair values of marketable equity securities are generally determined by quoted prices, in active markets, for each specific security. If quoted market prices are not available for a marketable equity security, we determine its fair value based on the quoted price of a similar security traded in an active market. The fair values of debt securities are generally determined by matrix pricing, which is a mathematical technique widely used in the industry to value debt securities without relying exclusively on quoted prices for the specific securities, but rather by relying on the securities’ relationship to other benchmark quoted securities. The fair value of a security is used to determine the amount of any unrealized losses that must be reflected in our other comprehensive income and the net book value of our securities.
The Company evaluates marketable investment securities with significant declines in fair value on a quarterly basis to determine whether they should be considered other-than-temporarily impaired under current accounting guidance, which generally provides that if a marketable security is in an unrealized loss position, whether due to general market conditions or industry or issuer-specific factors, the holder of the securities must assess whether the impairment is other-than-temporary.
38
Portfolio Maturities and Yields
The composition and maturities of the securities portfolio and the mortgage-backed securities portfolio at December 31, 2009 are summarized in the following table. Maturities are based on the final contractual payment dates, and do not reflect the impact of prepayments or early redemptions that may occur. Municipal securities yields have not been adjusted to a tax-equivalent basis as the amount is immaterial.
| One Year or Less | More than One Year through Five Years |
More than Five Years through Ten Years |
More than Ten Years | Total Securities | |||||||||||||||||||||||||||||
| Amortized Cost |
Weighted Average Yield |
Amortized Cost |
Weighted Average Yield |
Amortized Cost |
Weighted Average Yield |
Amortized Cost |
Weighted Average Yield |
Amortized Cost |
Weighted Average Yield |
Fair Value | |||||||||||||||||||||||
| (Dollars in thousands) | |||||||||||||||||||||||||||||||||
| Mortgage-backed Securities: |
|||||||||||||||||||||||||||||||||
| Pass-through securities: |
|||||||||||||||||||||||||||||||||
| Fannie Mae |
$ | — | — | % | $ | 303 | 4.50 | % | $ | 961 | 5.87 | % | $ | 24,296 | 4.01 | % | $ | 25,560 | 4.09 | % | $ | 26,308 | |||||||||||
| Freddie Mac |
— | — | 131 | 4.15 | 643 | 2.92 | 6,494 | 5.03 | 7,268 | 4.82 | 7,565 | ||||||||||||||||||||||
| Ginnie Mae |
— | — | — | — | — | — | 180 | 3.63 | 180 | 3.63 | 184 | ||||||||||||||||||||||
| CMOs and REMICs |
143 | 5.00 | — | — | 2,584 | 2.95 | 62,064 | 4.34 | 64,791 | 4.29 | 66,651 | ||||||||||||||||||||||
| Total |
143 | 5.00 | 434 | 4.39 | 4,188 | 3.62 | 93,034 | 4.30 | 97,799 | 4.27 | 100,708 | ||||||||||||||||||||||
| Securities: |
|||||||||||||||||||||||||||||||||
| Municipal securities |
550 | 4.46 | 675 | 4.39 | — | — | — | — | 1,225 | 4.42 | 1,303 | ||||||||||||||||||||||
| SBA guaranteed loan participation certificates |
— | — | — | — | 114 | 1.75 | — | — | 114 | 1.75 | 115 | ||||||||||||||||||||||
| Total |
550 | 4.46 | 675 | 4.39 | 114 | 1.75 | — | — | 1,339 | 4.20 | 1,418 | ||||||||||||||||||||||
| Total securities |
$ | 693 | 4.57 | % | $ | 1,109 | 4.39 | % | $ | 4,302 | 3.57 | % | $ | 93,034 | 4.30 | % | $ | 99,138 | 4.22 | % | $ | 102,126 | |||||||||||
39
Sources of Funds
Deposits. At December 31, 2009, our deposits totaled $1.233 billion. Interest-bearing deposits totaled $1.125 billion and noninterest-bearing demand deposits totaled $108.3 million. NOW, savings and money market accounts totaled $721.5 million. Noninterest-bearing demand deposits at December 31, 2009 included $4.9 million in internal checking accounts, such as accounts for Bank cashier’s checks and money orders. At December 31, 2009, we had $403.6 million of certificates of deposit outstanding, of which $327.6 million had maturities of one year or less. Although we have a significant portion of our deposits in shorter-term certificates of deposit, we believe, based on historical experience and our current pricing strategy, that we will retain a significant portion of these accounts upon maturity.
We originate deposits predominantly from the areas where our branch offices are located. We rely on our favorable locations, customer service, competitive pricing, our Internet Branch and related deposit services such as cash management to attract and retain these deposits. While we accept certificates of deposit in excess of the FDIC’s deposit insurance limits and in some cases may provide preferential rates for these certificates of deposits, we generally do not solicit such deposits because they are more difficult to retain than core deposits and at times are more costly than brokered deposits.
The following table sets forth the distribution of total deposit accounts, by account type, for the periods indicated.
| Years Ended December 31, | |||||||||||||||||||||||||||
| 2009 | 2008 | 2007 | |||||||||||||||||||||||||
| Average Balance |
Percent | Weighted Average Rate |
Average Balance |
Percent | Weighted Average Rate |
Average Balance |
Percent | Weighted Average Rate |
|||||||||||||||||||
| (Dollars in thousands) | |||||||||||||||||||||||||||
| Non-interest bearing demand: |
|||||||||||||||||||||||||||
| Retail |
$ | 28,058 | 2.39 | % | — | % | $ | 25,617 | 2.45 | % | — | % | $ | 29,936 | 2.74 | % | — | % | |||||||||
| Commercial |
77,279 | 6.55 | — | 79,099 | 7.53 | — | 86,620 | 7.91 | — | ||||||||||||||||||
| Total non-interest bearing demand |
105,337 | 8.94 | — | 104,716 | 9.98 | — | 116,556 | 10.65 | — | ||||||||||||||||||
| Savings deposits |
97,187 | 8.24 | 0.51 | 98,171 | 9.35 | 0.73 | 106,870 | 9.76 | 0.78 | ||||||||||||||||||
| Money market accounts |
270,583 | 22.94 | 1.66 | 210,857 | 20.08 | 2.56 | 260,256 | 23.77 | 4.25 | ||||||||||||||||||
| Interest-bearing NOW accounts |
284,583 | 24.13 | 0.77 | 311,886 | 29.71 | 1.55 | 282,670 | 25.82 | 2.42 | ||||||||||||||||||
| Certificates of deposit |
421,640 | 35.75 | 2.69 | 324,239 | 30.88 | 3.42 | 328,371 | 30.00 | 4.48 | ||||||||||||||||||
| Total deposits |
$ | 1,179,330 | 100.00 | % | $ | 1,049,869 | 100.00 | % | $ | 1,094,723 | 100.00 | % | |||||||||||||||
The following table sets forth certificates of deposit by time remaining until maturity at December 31, 2009.
| Maturity | |||||||||||||||
| 3 Months or Less |
Over 3 to 6 Months |
Over 6 to 12 Months |
Over 12 Months |
Total | |||||||||||
| (Dollars in thousands) | |||||||||||||||
| Certificates of deposit less than $100,000 |
$ | 70,823 | $ | 62,294 | $ | 76,654 | $ | 52,720 | $ | 262,491 | |||||
| Certificates of deposit of $100,000 or more |
23,560 | 43,826 | 50,420 | 23,338 | 141,144 | ||||||||||
| Total certificates of deposit |
$ | 94,383 | $ | 106,120 | $ | 127,074 | $ | 76,058 | $ | 403,635 | |||||
40
Borrowings. Our borrowings consist primarily of Federal Home Loan Bank advances and repurchase agreements. The following table sets forth information concerning balances and interest rates on our borrowings at the dates and for the periods indicated.
| At or For the Years Ended December 31, | ||||||||||||
| 2009 | 2008 | 2007 | ||||||||||
| (Dollars in thousands) | ||||||||||||
| Balance at end of year |
$ | 50,784 | $ | 200,350 | $ | 96,433 | ||||||
| Average balance during year |
101,785 | 110,039 | 104,782 | |||||||||
| Maximum outstanding at any month end |
141,970 | 200,350 | 139,366 | |||||||||
| Weighted average interest rate at end of year |
2.44 | % | 1.33 | % | 4.71 | % | ||||||
| Average interest rate during year |
2.02 | % | 3.30 | % | 4.64 | % | ||||||
At December 31, 2009, we had the ability to borrow an additional $257.9 million under our credit facilities with the FHLBC. Furthermore, we had unpledged securities that could be used to support in excess of $27.0 million of additional FHLBC borrowings.
At December 31, 2009, we had a pre-approved overnight federal funds borrowing capacity of $28.0 million and a line of credit with the Federal Reserve Bank of Chicago for $574,000. At December 31, 2009, there were no outstanding federal funds borrowings and there was no outstanding balance on the line of credit.
Statement of Operating Results for the Years Ended December 31, 2009, 2008 and 2007
Net Income
Comparison of Year 2009 to 2008. We recorded a net loss of $738,000 for the year ended December 31, 2009, compared to net loss of $19.4 million for the year ended December 31, 2008. The net loss for 2009 was attributable in substantial part to the combined impact of an $8.8 million provision for loan losses, a $401,000 pre-tax impairment loss on our Freddie Mac preferred stocks, and a $998,000 pre-tax loss that we recognized upon the subsequent sale of these securities. In addition, we recorded a $2.2 million expense, compared to $162,000 in 2008, for FDIC quarterly and special assessments in 2009 due to the combined effect of the FDIC’s increase it its quarterly assessment rate, the FDIC’s imposition of a special assessment against all insured depository institutions and the full utilization of the FDIC assessment credits that we previously had available to offset or reduce FDIC quarterly assessments. The impact of these items was partially offset by a $1.3 million gain that we recognized on the sale of our merchant processing operations in 2009. The net loss for 2008 was primarily due to a $35.9 million pre-tax impairment loss that we recorded on our Freddie Mac preferred stocks. Our loss per share of common stock for year ended December 31, 2009 was $0.04 per share, compared to a loss of $0.98 per share for the year ended December 31, 2008.
Comparison of Year 2008 to 2007. We recorded a net loss of $19.4 million for the year ended December 31, 2008, compared to net income of $7.2 million for the year ended December 31, 2007. The net loss was primarily due to a $35.9 million pre-tax impairment loss that we recorded on our Freddie Mac preferred stocks based on our determination that the unrealized loss that existed with respect to these securities constituted an other-than-temporary impairment following the placement of Freddie Mac into conservatorship. Additional factors affecting the change in net income from year to year included a $1.4 million, or 2.5%, decrease in our net interest income, a $2.0 million pre-tax loss on the early extinguishment of borrowings that we recorded in connection with the prepayment of a $25 million FHLBC term advance, and a $4.4 million increase in our provision for loan losses. These reductions to net income were offset by a $13.6 million decrease in income tax expense primarily relating to the impairment loss on our Freddie Mac preferred stocks. Our operating results for 2008 were favorably impacted by a $1.4 million pre-tax gain on the sale of the 32,398 shares of Visa, Inc. Class B common stock that we received in connection with Visa, Inc.’s initial public offering, and a $1.2 million pre-tax gain on additional shares of Visa. Inc. Class B common stock that were allocated to us in the initial public offering and are currently held in a litigation escrow under Visa Inc.’s retrospective responsibility plan. The gain recorded on the shares held in the litigation escrow represents a reduction of our obligation to indemnify Visa USA under the retrospective responsibility plan. Our operating results for 2007 included a pre-tax charge of $1.2 million to reflect this indemnification obligation. Our loss per share of common stock for year ended December 31, 2008 was $0.98 per share, compared to earnings per share of $0.35 for the year ended December 31, 2007.
41
Net Interest Income
Comparison of Year 2009 to 2008. Net interest income increased by $1.3 million, or 2.4%, to $53.6 million for the year ended December 31, 2009, from $52.3 million for the year ended December 31, 2008. Our net interest rate spread improved by one basis point to 3.36% for the year ended December 31, 2009, from 3.35% for the year ended December 31, 2008. Our net interest margin decreased by 19 basis points to 3.69% for the year ended December 31, 2009, from 3.88% for the year ended December 31, 2008. Our average interest-earning assets increased $102.2 million to $1.451 billion in 2009, from $1.349 billion in 2008, and our average interest-bearing liabilities increased $120.6 million to $1.176 billion in 2009, from $1.055 billion in 2008.
Interest income decreased by $3.9 million, or 5.0%, to $74.0 million for the year ended December 31, 2009, from $78.0 million for the year ended December 31, 2008. The decrease in interest income resulted primarily from a 68 basis point decrease in the average yield on interest earning assets to 5.10% for the year ended December 31, 2009, from 5.78% for the year ended December 31, 2008. This decrease was partially offset by a $102.2 million increase in total average interest-earning assets to $1.451 billion for the year ended December 31, 2009, from $1.349 billion for the year ended December 31, 2008.
Interest income on loans, the most significant portion of interest income, decreased by $4.8 million, or 6.5%, to $69.2 million for the year ended December 31, 2009, from $74.0 million for the year ended December 31, 2008. Interest income on loans and the average yield on loans were reduced by a net increase of $1.7 million in the reserve for uncollected interest that we established for loans that were placed on nonaccrual status during the year ended December 31, 2009. This increase accounts for 34.4% of the decrease in interest income from loans. In addition, the average yield on loans decreased 52 basis points to 5.44% for the year ended December 31, 2009, from 5.96% for the year ended December 31, 2008. These decreases were partially offset by a $29.5 million, or 2.4%, increase in the average balance of loans outstanding to $1.271 billion for the year ended December 31, 2009, from $1.242 billion for the year ended December 31, 2008.
Interest income on securities increased $955,000, or 24.7%, to $4.8 million for the year ended December 31, 2009, from $3.9 million for the year ended December 31, 2008. The increase in interest income on securities resulted primarily from a $29.5 million, or 35.0%, increase in the average balance of securities to $112.7 million for the year ended December 31, 2009, from $83.5 million for the year ended December 31, 2008. This increase was partially offset by a 35 basis point decrease in the average yield on securities to 4.28% for the year ended December 31, 2009, from 4.63% for the year ended December 31, 2008.
The FHLBC did not pay dividends on it common stock in 2009 or 2008.
Interest income on interest-bearing deposits in other financial institutions increased $7,000, or 6.0%, to $123,000 for the year ended December 31, 2009, from $116,000 for the year ended December 31, 2008. The increase was primarily due to a $43.5 million increase in the average balance of our interest bearing deposits to $52.0 million for the year ended December 31, 2009, from $8.5 million for 2008. This increase was partially offset by a decrease of 113 basis points in the average yield on our interest-bearing deposits to 0.24% for the year ended December 31, 2009, from 1.37% for the year ended December 31, 2008.
Interest expense decreased by $5.1 million, or 19.9%, to $20.6 million for the year ended December 31, 2009, from $25.7 million for the year ended December 31, 2008. The decrease was due to decreased interest expense on deposits and borrowings.
Interest expense on deposits decreased by $3.5 million, or 16.0%, to $18.5 million for the year ended December 31, 2009, from $22.0 million for the year ended December 31, 2008. The decrease in interest expense on deposits was primarily due to a 61 basis point decrease in the average rates paid on deposits, partially offset by a $128.8 million, or 13.6%, net increase in the average balance of deposits. The average cost of deposits was 1.72% for the year ended December 31, 2009, compared to 2.33% for the year ended December 31, 2008. The average rate on savings accounts decreased 22 basis points to 0.51% from 0.73%. On a year over year basis, the average cost of money market accounts decreased 90 basis points to 1.66%, from 2.56%, the average cost of NOW accounts decreased 78 basis points to 0.77%, from 1.55%, and the average cost of certificates of deposit decreased 73 basis points to 2.69% from 3.42%. The average balances of money market accounts increased $59.7 million, or 28.3%, and the average balance of certificates of deposit increased $97.4 million, or 30.0%, for the year ended December 31, 2009. These increases were partially offset by a decrease in the average balances of NOW accounts of $27.3 million, or 8.8%, and a decrease in the average balances of savings accounts of $984,000, or 1.0% for the year ended December 31, 2009.
42
Interest expense on borrowings decreased by $1.6 million, or 43.4%, to $2.1 million for the year ended December 31, 2009, from $3.6 million for the year ended December 31, 2008. This decrease was due in substantial part to a 128 basis point decrease in the average cost of such borrowings to 2.02% for the year ended December 31, 2009, from 3.30% for the year ended December 31, 2008, and a decrease in the average balance of borrowings of $8.3 million, or 7.5%, to $101.8 million at December 31, 2009, from $110.0 million at December 31, 2008.
Comparison of Year 2008 to 2007. Net interest income decreased by $1.4 million, or 2.5%, to $52.3 million for the year ended December 31, 2008, from $53.6 million for the year ended December 31, 2007. Our net interest rate spread increased by 41 basis points to 3.35% for the year ended December 31, 2008, from 2.94% for the year ended December 31, 2007. Our net interest margin increased by 10 basis points to 3.88% for the year ended December 31, 2008, from 3.78% for the year ended December 31, 2007. Our average interest-earning assets decreased $69.0 million to $1.349 billion in 2008, from $1.418 billion in 2007, and our average interest-bearing liabilities decreased $28.0 million to $1.055 billion in 2008, from $1.083 billion in 2007.
Interest income decreased by $14.0 million, or 15.2%, to $78.0 million for the year ended December 31, 2008, from $92.0 million for the year ended December 31, 2007. The decrease in interest income resulted primarily from a $69.0 million decrease in total average interest-earning assets to $1.349 billion for the year ended December 31, 2008, from $1.418 billion for the year ended December 31, 2007, and a 70 basis point decrease in the average yield on interest earning assets to 5.78% for the year ended December 31, 2008, from 6.48% for the year ended December 31, 2007.
Interest income on loans decreased by $11.6 million, or 13.6%, to $74.0 million for the year ended December 31, 2008, from $85.6 million for the year ended December 31, 2007. The decrease in interest income on loans resulted primarily from a 64 basis point decrease in the average yield on loans to 5.96% for the year ended December 31, 2008, from 6.60% for the year ended December 31, 2007, and a $55.8 million, or 4.3%, decrease in the average balance of loans outstanding to $1.242 billion for the year ended December 31, 2008, from $1.297 billion for the year ended December 31, 2007.
Interest income on securities decreased $1.2 million, or 23.0%, to $3.9 million for the year ended December 31, 2008, from $5.1 million for the year ended December 31, 2007. The decrease in interest income from securities was due in substantial part to Freddie Mac’s suspension of dividends on its preferred stocks beginning in the third quarter of 2008. Interest income for the year ended December 31, 2007 included $2.4 million in dividends on our investment in Freddie Mac preferred stock, compared to $1.0 million in 2008.
Income from cash dividends on our FHLBC common stock totaled $359,000 for the year ended December 31, 2007. The FHLBC suspended dividends on its common stock beginning in the fourth quarter of 2007, and did not pay any dividends in 2008.
Interest income on interest-bearing deposits in other financial institutions decreased $853,000, or 91.0%, to $84,000 for the year ended December 31, 2008, from $937,000 for the year ended December 31, 2007. The decrease was primarily due to a $13.4 million decrease in the average balance of our interest bearing deposits to $4.9 million for the year ended December 31, 2008, from $18.2 million for the same period in 2007, and a decrease in the average yield on our interest-bearing deposits to 1.72% for the year ended December 31, 2008, from 5.14% for the year ended December 31, 2007, due to declining market interest rates.
Interest expense decreased by $12.6 million, or 33.0%, to $25.7 million for the year ended December 31, 2008, from $38.3 million for the year ended December 31, 2007. The decrease was due to decreased interest expense on deposits and borrowings.
43
Interest expense on deposits decreased by $11.4 million, or 34.1%, to $22.0 million for the year ended December 31, 2008, from $33.4 million for the year ended December 31, 2007. The decrease in interest expense on deposits was primarily due to a 109 basis point decrease in the average rates paid on deposits, and a $33.0 million, or 3.4%, net decrease in the average balance of deposits. The average balance of money market accounts decreased $49.4 million, or 19.0%, for the year ended December 31, 2008, due primarily to our decision to encourage, through pricing changes, the migration of indexed money market accounts to other account types. The average balances of savings accounts decreased $8.7 million, or 8.1%, and the average balances of certificates of deposit decreased $4.1 million, or 1.3%, respectively, for the year ended December 31, 2008. These decreases were partially offset by a $29.2 million, or 10.3%, increase in the average balance of NOW accounts. The average cost of deposits was 2.33% for the year ended December 31, 2008, compared to 3.42% for the year ended December 31, 2007. The average rate on savings accounts decreased five basis points to 0.73% from 0.78%. On a year over year basis, the average cost of money market accounts decreased 169 basis points to 2.56%, from 4.25%, the average cost of NOW accounts decreased 87 basis points to 1.55%, from 2.42%, and the average cost of certificates of deposit decreased 106 basis points to 3.42% from 4.48%.
Interest expense on borrowings decreased by $1.2 million, or 25.2%, to $3.6 million for the year ended December 31, 2008, from $4.9 million for the year ended December 31, 2007. This decrease was due in principal part to a 134 basis point decrease in the average cost of such borrowings to 3.30% for the year ended December 31, 2008, from 4.64% for the year ended December 31, 2007. This decrease in the average cost of borrowings was partially offset by a $5.3 million, or 5.0%, increase in the average balance of borrowings to $110.0 million at December 31, 2008, from $104.8 million at December 31, 2007.
44
Average Balance Sheets
The following table sets forth average balance sheets, average yields and costs, and certain other information for the periods indicated. No tax-equivalent yield adjustments were made, as the effect of these adjustments would not be material. Average balances are daily average balances. Nonaccrual loans were included in the computation of average balances, but have been reflected in the table as loans carrying a zero yield. The yields set forth below include the effect of deferred fees and expenses, discounts and premiums, purchase accounting adjustments that are amortized or accreted to interest income or expense.
| Years Ended December 31, | ||||||||||||||||||||||||||||||
| 2009 | 2008 | 2007 | ||||||||||||||||||||||||||||
| Average Outstanding Balance |
Interest | Yield/Rate | Average Outstanding Balance |
Interest | Yield/Rate | Average Outstanding Balance |
Interest | Yield/Rate | ||||||||||||||||||||||
| (Dollars in thousands) | ||||||||||||||||||||||||||||||
| Interest-earning Assets: |
||||||||||||||||||||||||||||||
| Loans |
$ | 1,271,024 | $ | 69,170 | 5.44 | % | $ | 1,241,518 | $ | 73,983 | 5.96 | % | $ | 1,297,299 | $ | 85,601 | 6.60 | % | ||||||||||||
| Securities |
112,645 | 4,816 | 4.28 | 83,455 | 3,861 | 4.63 | 86,946 | 5,056 | 5.82 | |||||||||||||||||||||
| Stock in FHLBC |
15,598 | — | — | 15,598 | — | — | 15,598 | 359 | 2.30 | |||||||||||||||||||||
| Other |
52,032 | 123 | 0.24 | 8,487 | 116 | 1.37 | 18,245 | 937 | 5.14 | |||||||||||||||||||||
| Total interest-earning assets |
1,451,299 | 74,109 | 5.110 | 1,349,058 | 77,960 | 5.78 | 1,418,088 | 91,953 | 6.48 | |||||||||||||||||||||
| Noninterest-earning assets |
115,876 | 113,957 | 114,668 | |||||||||||||||||||||||||||
| Total assets |
$ | 1,567,175 | $ | 1,463,015 | $ | 1,532,756 | ||||||||||||||||||||||||
| Interest-bearing Liabilities: |
||||||||||||||||||||||||||||||
| Savings deposits |
$ | 97,187 | 495 | 0.51 | $ | 98,171 | 715 | 0.73 | $ | 106,870 | 833 | 0.78 | ||||||||||||||||||
| Money market accounts |
270,583 | 4,503 | 1.66 | 210,857 | 5,397 | 2.56 | 260,256 | 11,072 | 4.25 | |||||||||||||||||||||
| NOW accounts |
284,583 | 2,178 | 0.77 | 311,886 | 4,844 | 1.55 | 282,670 | 6,837 | 2.42 | |||||||||||||||||||||
| Certificates of deposit |
421,640 | 11,325 | 2.69 | 324,239 | 11,077 | 3.42 | 328,371 | 14,704 | 4.48 | |||||||||||||||||||||
| Total deposits |
1,073,993 | 18,501 | 1.72 | 945,153 | 22,033 | 2.33 | 978,167 | 33,446 | 3.42 | |||||||||||||||||||||
| Borrowings |
101,785 | 2,056 | 2.02 | 110,039 | 3,634 | 3.30 | 104,782 | 4,858 | 4.64 | |||||||||||||||||||||
| Total interest-bearing liabilities |
1,175,778 | 20,557 | 1.75 | 1,055,192 | 25,667 | 2.43 | 1,082,949 | 38,304 | 3.54 | |||||||||||||||||||||
| Noninterest-bearing deposits |
105,337 | 104,716 | 116,556 | |||||||||||||||||||||||||||
| Noninterest-bearing liabilities |
19,288 | 19,447 | 21,831 | |||||||||||||||||||||||||||
| Total liabilities |
1,300,403 | 1,179,355 | 1,221,336 | |||||||||||||||||||||||||||
| Equity |
266,772 | 283,660 | 311,420 | |||||||||||||||||||||||||||
| Total liabilities and equity |
$ | 1,567,175 | $ | 1,463,015 | $ | 1,532,756 | ||||||||||||||||||||||||
| Net interest income |
$ | 53,552 | $ | 52,293 | $ | 53,649 | ||||||||||||||||||||||||
| Net interest rate spread (1) |
3.36 | % | 3.35 | % | 2.94 | % | ||||||||||||||||||||||||
| Net interest-earning assets (2) |
$ | 275,521 | $ | 293,866 | $ | 335,139 | ||||||||||||||||||||||||
| Net interest margin (3) |
3.69 | % | 3.88 | % | 3.78 | % | ||||||||||||||||||||||||
| Ratio of interest-earning assets to interest-bearing liabilities |
123.43 | % | 127.85 | % | 130.95 | % | ||||||||||||||||||||||||
| (1) | Net interest rate spread represents the difference between the yield on average interest-earning assets and the cost of average interest-bearing liabilities. |
| (2) | Net interest-earning assets represents total interest-earning assets less total interest-bearing liabilities. |
| (3) | Net interest margin represents net interest income divided by average total interest-earning assets. |
45
Rate/Volume Analysis
The following table presents the dollar amount of changes in interest income and interest expense for the major categories of our interest-earning assets and interest-bearing liabilities. Information is provided for each category of interest-earning assets and interest-bearing liabilities with respect to changes attributable to changes in volume (i.e., changes in average balances multiplied by the prior-period average rate), and changes attributable to rate (i.e., changes in average rate multiplied by prior-period average balances). For purposes of this table, changes attributable to both rate and volume that cannot be segregated have been allocated proportionately to the change due to volume and the change due to rate.
| Years Ended December 31, | ||||||||||||||||||||||||
| 2009 vs. 2008 | 2008 vs. 2007 | |||||||||||||||||||||||
| Increase (Decrease) Due to | Total Increase (Decrease) |
Increase (Decrease) Due to | Total Increase (Decrease) |
|||||||||||||||||||||
| Volume | Rate | Volume | Rate | |||||||||||||||||||||
| (Dollars in thousands) | ||||||||||||||||||||||||
| Interest-earning assets: |
||||||||||||||||||||||||
| Loans |
$ | 1,725 | $ | (6,538 | ) | $ | (4,813 | ) | $ | (3,571 | ) | $ | (8,047 | ) | $ | (11,618 | ) | |||||||
| Securities |
1,266 | (311 | ) | 955 | (196 | ) | (999 | ) | (1,195 | ) | ||||||||||||||
| Stock in FHLBC |
— | — | — | — | (359 | ) | (359 | ) | ||||||||||||||||
| Other |
171 | (164 | ) | 7 | (346 | ) | (475 | ) | (821 | ) | ||||||||||||||
| Total interest-earning assets |
3,162 | (7,013 | ) | (3,851 | ) | (4,113 | ) | (9,880 | ) | (13,993 | ) | |||||||||||||
| Interest-bearing liabilities: |
||||||||||||||||||||||||
| Savings deposits |
(7 | ) | (213 | ) | (220 | ) | (65 | ) | (53 | ) | (118 | ) | ||||||||||||
| Money market accounts |
1,289 | (2,183 | ) | (894 | ) | (1,831 | ) | (3,844 | ) | (5,675 | ) | |||||||||||||
| NOW accounts |
(392 | ) | (2,274 | ) | (2,666 | ) | 650 | (2,644 | ) | (1,994 | ) | |||||||||||||
| Certificates of deposit |
2,912 | (2,664 | ) | 248 | (183 | ) | (3,443 | ) | (3,626 | ) | ||||||||||||||
| Borrowings |
(255 | ) | (1,323 | ) | (1,578 | ) | 233 | (1,457 | ) | (1,224 | ) | |||||||||||||
| Total interest-bearing liabilities |
3,547 | (8,657 | ) | (5,110 | ) | (1,196 | ) | (11,441 | ) | (12,637 | ) | |||||||||||||
| Change in net interest income |
$ | (385 | ) | $ | 1,644 | $ | 1,259 | $ | (2,917 | ) | $ | 1,561 | $ | (1,356 | ) | |||||||||
Provision for Loan Losses
We establish provisions for loan losses, which are charged to operations in order to maintain the allowance for loan losses at a level we consider necessary to absorb probable incurred credit losses in the loan portfolio. In determining the level of the allowance for loan losses, we consider past and current loss experience, evaluations of real estate collateral, current economic conditions, volume and type of lending, adverse situations that may affect a borrower’s ability to repay a loan and the levels of nonperforming and other classified loans. The amount of the allowance is based on estimates and the ultimate losses may vary from such estimates as more information becomes available or later events change. We assess the allowance for loan losses on a quarterly basis and make provisions for loan losses in order to maintain the allowance.
Comparison of Year 2009 to 2008. We recorded a provision for loan losses of $8.8 million for the year ended December 31, 2009, compared to a provision for loan losses of $5.1 million for the year ended December 31, 2008. The 2009 provision for loan losses reflects a $2.4 million increase in the specific portion of the allowance for loan losses that we allocate to impaired loans, a $1.5 million increase in the general portion of the allowance for loan losses, and $4.9 million in net charge offs. We increased the general portion of the allowance by $1.5 million based on the continued deterioration in national and local economic risk factors included in our model for determining the proper level of general reserves.
Net loan charge-offs for 2009 were $4.9 million, or 0.39% of average loans, compared to $1.4 million, or 0.11% of average loans, in 2008. Our allowance for loan losses was $18.6 million, or 1.51% of total loans, at December 31, 2009, compared to $14.7 million, or 1.15% of total loans, at December 31, 2008. The allowance for loan losses represented 37.6% of nonperforming loans at December 31, 2009. To the best of our knowledge, we have recorded all losses that are both probable and reasonable to estimate for each reporting period.
46
Comparison of Year 2008 to 2007. We recorded a provision for loan losses of $5.1 million for the year ended December 31, 2008, compared to a provision for loan losses of $697,000 for the year ended December 31, 2007. The 2008 provision for loan losses reflects a $1.8 million increase in the general portion of the allowance for loan losses, a $1.9 million increase in the specific portion of the allowance for loan losses that we allocate to impaired loans, and $1.4 million in net charge offs. Of the net $1.9 million increase in the specific allocations to impaired loans, $1.1 million relates to the loan obligations of the estate of a deceased construction loan borrower and $714,000 relates to two healthcare-related real estate loans.
Despite the overall lower credit risk profile and credit exposures of our loan portfolio, we increased the general portion of the allowance by $1.8 million based on adverse changes to the national and local economic data that we use in our model for determining the proper level of general reserves.
Net loan charge-offs for 2008 were $1.4 million, or 0.11% of average loans, compared to $268,000, or 0.02% of average loans, in 2007. Our allowance for loan losses was $14.7 million, or 1.15% of total loans, at December 31, 2008, compared to $11.1 million, or 0.87% of total loans, at December 31, 2007. The allowance for loan losses represented 107.97% of nonperforming loans at December 31, 2008, and 91.65% of nonperforming loans at December 31, 2007. To the best of our knowledge, we have recorded all losses that are both probable and reasonable to estimate for each reporting period.
Noninterest Income
| Years Ended December 31, | Change | |||||||||||||||||||
| 2009 | 2008 | 2007 | 2009/2008 | 2008/2007 | ||||||||||||||||
| (Dollars in thousands) | ||||||||||||||||||||
| Noninterest Income: |
||||||||||||||||||||
| Deposit service charges and fees |
$ | 3,363 | $ | 3,571 | $ | 3,606 | $ | (208 | ) | $ | (35 | ) | ||||||||
| Other fee income |
1,816 | 1,944 | 1,939 | (128 | ) | 5 | ||||||||||||||
| Insurance commissions and annuities income |
715 | 794 | 1,007 | (79 | ) | (213 | ) | |||||||||||||
| Gain on sale of loans, net |
699 | 118 | 126 | 581 | (8 | ) | ||||||||||||||
| Gain (loss) on sales of securities |
(988 | ) | 1,385 | 399 | (2,373 | ) | 986 | |||||||||||||
| Gain on unredeemed VISA stock |
— | 1,240 | — | (1,240 | ) | 1,240 | ||||||||||||||
| Gain (loss) on disposition of premises and equipment |
(40 | ) | (302 | ) | 9 | 262 | (311 | ) | ||||||||||||
| Loan servicing fees |
653 | 771 | 811 | (118 | ) | (40 | ) | |||||||||||||
| Amortization and impairment of servicing assets |
(446 | ) | (524 | ) | (396 | ) | 78 | (128 | ) | |||||||||||
| Earnings (loss) on bank owned life insurance |
(20 | ) | 586 | 585 | (606 | ) | 1 | |||||||||||||
| Other |
1,487 | 835 | 1,579 | 652 | (744 | ) | ||||||||||||||
| Total noninterest income |
$ | 7,239 | $ | 10,418 | $ | 9,665 | $ | (3,179 | ) | $ | 753 | |||||||||
Comparison of Year 2009 to 2008. Our noninterest income decreased by $3.2 million to $7.2 million for the year ended December 31, 2009, from $10.4 million for the year ended December 31, 2008. Our noninterest income for 2009 included a $988,000 pre-tax loss relating to the sale of our Freddie Mac preferred stocks, compared to $2.6 million in pre-tax gains relating to the redeemed and unredeemed shares of Visa, Inc. Class B common stock that were allocated to us in the initial public offering that Visa, Inc. conducted in March of 2008. Additional factors affecting the change in noninterest income from year to year included a $208,000, or 5.8%, decrease in deposit service charges and fees to $3.3 million, from $3.6 million for 2008. Other fee income decreased $128,000, or 6.6%, to $1.8 million, compared to $1.9 million for 2008. Income from insurance commissions and annuities decreased by $79,000, or 10.0%, to $715,000 for the year ended December 31, 2009, compared to $794,000 for 2008, due to decreased sales activity. Gains on sale of loans increased by $581,000 to $699,000, compared to $118,000 for 2008. We recognized a net loss of $40,000 on the disposition of premises and equipment during 2009, compared to a net loss of $302,000 in 2008. Loan servicing fees decreased $118,000, or 15.3%, to $653,000 for the year ended December 31, 2009, from $771,000 for 2008. Mortgage servicing rights amortization expense increased $68,000 or 16.4%, to $482,000 for the year ended December 31, 2009, compared to $414,000 for 2008. We recorded a reserve recovery of $36,000 on our mortgage servicing rights in 2009, compared to a $110,000 reserve that we recorded for 2008. Bank-owned life insurance produced a loss of $20,000 for 2009, compared to income of $586,000 for 2008, due to our decision to temporarily move investable policy funds into a low-yielding money market sub-account at the end of 2008 as a means of protecting the underlying value of the policy. Other income totaled $1.5 million for the year ended December 31, 2009, compared to $835,000 for 2008, due primarily to the recording of a $1.3 million gain on the sale of our merchant processing operations in the fourth quarter of 2009.
47
Comparison of Year 2008 to 2007. Our noninterest income increased by $753,000 to $10.4 million for the year ended December 31, 2008, from $9.7 million for the year ended December 31, 2007. Income from insurance commissions and annuities decreased by $213,000, or 21.2%, to $794,000 for the year ended December 31, 2008, compared to $1.0 million for 2007, due to decreased sales activity. Noninterest income for 2008 included $2.6 million in pre-tax gains relating to the redeemed and unredeemed shares of Visa, Inc. Class B common stock that were allocated to us in the initial public offering that Visa, Inc. conducted in March of 2008. Gains on sale of securities amounted to $399,000 for the year ended December 31, 2007. We recognized a $302,000 net loss on the disposition of premises and equipment during 2008, compared to a $9,000 net gain in 2007. Loan servicing fees decreased $40,000, or 4.9%, to $771,000 for the year ended December 31, 2008, from $811,000 for 2007. Mortgage servicing rights amortization expense increased $18,000 or 4.6%, to $414,000 for the year ended December 31, 2009, compared to $396,000 for the same period in 2008. We recorded a $110,000 valuation reserve for the year ended December 31, 2008 based on accelerating prepayment speeds. No mortgage servicing rights valuation reserve was established for 2007. Other income totaled $835,000 for the year ended December 31, 2008, compared to $1.6 million for 2007, due in substantial part to the decrease in title insurance agency commissions and fees that resulted from the sale of our title insurance agency business in March of 2008.
Noninterest Expense
| Years Ended December 31, | Change | ||||||||||||||||
| 2009 | 2008 | 2007 | 2009/2008 | 2008/2007 | |||||||||||||
| (Dollars in thousands) | |||||||||||||||||
| Noninterest Expense: |
|||||||||||||||||
| Compensation and benefits |
$ | 29,046 | $ | 30,535 | $ | 32,276 | $ | (1,489 | ) | $ | (1,741 | ) | |||||
| Office occupancy and equipment |
6,845 | 6,874 | 5,949 | (29 | ) | 925 | |||||||||||
| Advertising and public relations |
1,321 | 1,361 | 1,412 | (40 | ) | (51 | ) | ||||||||||
| Information technology |
3,637 | 3,662 | 3,241 | (25 | ) | 421 | |||||||||||
| Supplies, telephone and postage |
1,819 | 2,070 | 2,109 | (251 | ) | (39 | ) | ||||||||||
| Amortization of intangibles |
1,690 | 1,784 | 1,879 | (94 | ) | (95 | ) | ||||||||||
| Operations of real estate owned |
1,273 | 434 | 17 | 839 | 417 | ||||||||||||
| Visa litigation |
— | — | 1,240 | — | (1,240 | ) | |||||||||||
| Loss on impairment of securities |
401 | 35,919 | — | (35,518 | ) | 35,919 | |||||||||||
| Loss on early extinguishment of borrowings |
— | 1,975 | — | (1,975 | ) | 1,975 | |||||||||||
| FDIC insurance premiums |
2,225 | 162 | 133 | 2,063 | 29 | ||||||||||||
| Other |
4,474 | 4,280 | 4,243 | 194 | 37 | ||||||||||||
| Total noninterest expense |
$ | 52,731 | $ | 89,056 | $ | 52,499 | $ | (36,325 | ) | $ | 36,557 | ||||||
Comparison of Year 2009 to 2008. For the year ended December 31, 2009, noninterest expense decreased by $36.3 million, or 40.8%, to $52.7 million, from $89.1 million for the year ended December 31, 2008. Noninterest expense for 2008 included a $35.9 million pre-tax impairment loss that we recorded on our holdings of Freddie Mac preferred stocks and a $2.0 million pre-tax expense that we recorded in connection with the prepayment of a $25 million FHLBC term advance. Additional factors affecting the change in noninterest expense from year to year included a $1.5 million, or 4.9%, decrease in compensation expense to $29.0 million for the year ended December 31, 2009, from $30.5 million for the year ended December 31, 2008. The decrease was due in part to a decrease of 21 full-time equivalent employees from 393 in 2008 to 372 in 2009, resulting from the implementation of functional staffing reviews. Expense relating to equity-based compensation and benefits totaled $3.0 million in 2009, compared to $4.6 million during 2008. Supplies, telephone and postage expenses decreased $251,000, or 12.1%, to $1.8 million, and intangible amortization expense decreased by $94,000. These expense reductions were partially offset by an increase in our net expense from real estate owned operations to $1.3 million for the year ended December 31, 2009, compared to $434,000 for 2008. Net operations from real estate owned for the current year included $973,000 in write-downs or losses on real estate owned, compared to $289,000 in write-downs or losses in 2008. Our expense for FDIC deposit insurance increased to $2.2 million during the year ended December 31, 2009, compared to $162,000 during the same period of 2008. The increase in our expense for FDIC deposit insurance was due to the combined effect of the FDIC’s increase in its quarterly assessment rate, the FDIC’s imposition of a special assessment against all insured depository institutions and the full utilization of the FDIC assessment credits that we previously had available to offset or reduce FDIC quarterly assessments. Other expenses increased by $194,000, or 4.5%, to $4.5 million in 2009.
48
Comparison of Year 2008 to 2007. For the year ended December 31, 2008, noninterest expense increased by $36.6 million, or 69.6%, to $89.1 million, from $52.5 million for the year ended December 31, 2007. The increase was primarily due to a $35.9 million pre-tax impairment loss that we recorded on our holdings of Freddie Mac preferred stocks and a $2.0 million pre-tax expense that we recorded in connection with the prepayment of a $25 million FHLBC term advance. Compensation expense decreased by $1.7 million, or 5.4%, to $30.5 million for the year ended December 31, 2008, from $32.3 million for the year ended December 31, 2007. The decrease was due in part to a decrease of 32 full time equivalent employees from 425 in 2007 to 393 in 2008, resulting from the implementation of functional staffing reviews and the sale of our title insurance agency business. Expense relating to equity-based compensation and benefits totaled $4.6 million in 2008, compared to $5.1 million during 2007. Occupancy and equipment increased $925,000, or 15.5%, to $6.9 million for 2008, from to $5.9 million for 2007, due in substantial part to the write-off of $277,000 in feasibility and design costs related to a possible remodeling project and repair work performed at several branches, and $179,000 related to the establishment of our fully automated Express Branch facilities. Information technology expenses increased by $421,000, or 13.0%, to $3.7 million for 2008, compared to $3.2 million for 2007, primarily due to increased system maintenance costs and software upgrades. Intangible amortization expense decreased by $95,000, or 5.1% to $1.8 million for the year ended December 31, 2008. Net expense from real estate owned operations was $434,000 for the year ended December 31, 2008, compared to $17,000 for the same period in 2007. Net operations from real estate owned for the current year included $289,000 in write-downs or losses on real estate owned, compared to none in 2007. Other expenses increased by $37,000, or 0.9%, to $4.3 million in 2008.
Income Tax Expense
Comparison of Year 2009 to 2008. For the year ended December 31, 2009, we recorded an income tax benefit of $13,000, compared to an income tax benefit of $12.0 million for the year ended December 31, 2008. For 2009, the difference between the GAAP basis (fair market value at the date of grant) and the tax basis (fair market value at the date of vesting) of equity based compensation granted in prior years reduced our income tax benefit. The income tax benefit for 2008 was primarily due to the impairment loss that we recorded on our Freddie Mac preferred stocks.
Comparison of Year 2008 to 2007. For the year ended December 31, 2008, we recorded an income tax benefit of $12.0 million, compared to income tax expense of $3.0 million for the year ended December 31, 2007, primarily due to the impairment loss that we recorded on our Freddie Mac preferred stocks in 2008. The effective tax rate for 2007 was 29.3%. Items that caused the effective tax rate to be less than the statutory tax rate included the dividends received deduction on preferred stock dividends received, income earned on bank owned life insurance and interest income on municipal bonds and municipal loans, respectively.
Impact of Inflation and Changing Prices
The financial statements and related notes of the Company have been prepared in accordance with accounting principles generally accepted in the United States of America (“GAAP”). GAAP generally requires the measurement of financial position and operating results in terms of historical dollars without consideration for changes in the relative purchasing power of money over time due to inflation. The impact of inflation, if any, is reflected in the increased cost of our operations. Unlike industrial companies, our assets and liabilities are primarily monetary in nature. As a result, changes in market interest rates have a greater impact on performance than the effects of inflation.
Management of Interest Rate Risk
Qualitative Analysis. A significant form of market risk is interest rate risk. Interest rate risk results from timing differences in the maturity or repricing of our assets, liabilities and off balance sheet contracts (i.e., forward loan commitments), the effect of loan prepayments and deposit withdrawals, the difference in the behavior of lending and funding rates arising from the use of different indices and “yield curve risk” arising from changing rate relationships across the spectrum of maturities for constant or variable credit risk investments. In addition to directly affecting net interest income, changes in market interest rates can also affect the amount of new loan originations, the ability of borrowers to repay variable rate loans, the volume of loan prepayments and refinancings, the carrying value of investment securities classified as available-for-sale and the flow and mix of deposits.
49
The general objective of our interest rate risk management is to determine the appropriate level of risk given our business strategy and then manage that risk in a manner that is consistent with our policy to reduce, to the extent possible, the exposure of our net interest income to changes in market interest rates. Our Asset/Liability Management Committee (“ALCO”), which consists of certain members of senior management, evaluates the interest rate risk inherent in certain assets and liabilities, our operating environment and capital and liquidity requirements, and modifies our lending, investing and deposit gathering strategies accordingly. The Board of Directors’ Asset/Liability Management Committee then reviews the ALCO’s activities and strategies, the effect of those strategies on our net interest margin, and the effect that changes in market interest rates would have on the economic value of our loan and securities portfolios as well as the intrinsic value of our deposits and borrowings, and reports to the full Board of Directors.
We actively evaluate interest rate risk in connection with our lending, investing and deposit activities. In an effort to better manage interest-rate risk, we have de-emphasized the origination residential mortgage loans, and have increased our emphasis on the origination of nonresidential real estate loans, multi-family mortgage loans, commercial loans and commercial leases. In addition, depending on market interest rates and our capital and liquidity position, we generally sell all or a portion of our longer-term, fixed-rate residential loans, usually on a servicing-retained basis. Further, we primarily invest in shorter-duration securities, which generally have lower yields compared to longer-term investments. Shortening the average maturity of our interest-earning assets by increasing our investments in shorter-term loans and securities, as well as loans with variable rates of interest, helps to better match the maturities and interest rates of our assets and liabilities, thereby reducing the exposure of our net interest income to changes in market interest rates. Finally, we have classified all of our investment portfolio as available-for-sale so as to provide flexibility in liquidity management.
We utilize a combination of analyses to monitor the Bank’s exposure to changes in interest rates. The economic value of equity analysis is a model that estimates the change in net portfolio value (“NPV”) over a range of interest rate scenarios. NPV is the discounted present value of expected cash flows from assets, liabilities and off-balance sheet contracts. In calculating changes in NPV, we assume estimated loan prepayment rates, reinvestment rates and deposit decay rates that seem most likely based on historical experience during prior interest rate changes.
Our net interest income analysis utilizes the data derived from the dynamic GAP analysis, described below, and applies several additional elements, including actual interest rate indices and margins, contractual limitations such as interest rate floors and caps and the US Treasury yield curve as of the balance sheet date. In addition, we apply consistent parallel yield curve shifts (in both directions) to determine possible changes in net interest income if the theoretical yield curve shifts occurred instantaneously. Net interest income analysis also adjusts the dynamic GAP repricing analysis based on changes in prepayment rates resulting from the parallel yield curve shifts.
Our dynamic GAP analysis determines the relative balance between the repricing of assets and liabilities over multiple periods of time (ranging from overnight to five years). Dynamic GAP analysis includes expected cash flows from loans and mortgage-backed securities, applying prepayment rates based on the differential between the current interest rate and the market interest rate for each loan and security type. This analysis identifies mismatches in the timing of asset and liability repricing but does not necessarily provide an accurate indicator of interest rate risk because it omits the factors incorporated into the net interest income analysis.
50
Quantitative Analysis. The following table sets forth, as of December 31, 2009, the estimated changes in the Bank’s NPV and net interest income that would result from the designated instantaneous parallel shift in the US Treasury yield curve. Computations of prospective effects of hypothetical interest rate changes are based on numerous assumptions including relative levels of market interest rates, loan prepayments and deposit decay, and should not be relied upon as indicative of actual results.
| Estimated Increase (decrease) in NPV |
Decrease in Estimated Net Interest Income |
||||||||||||
| Change in Interest Rates (basis points) |
Amount | Percent | Amount | Percent | |||||||||
| +400 |
$ | 9,241 | 3.82 | % | $ | (3,943 | ) | (7.27 | )% | ||||
| +300 |
6,677 | 2.76 | (2,941 | ) | (5.42 | ) | |||||||
| +200 |
4,650 | 1.92 | (2,063 | ) | (3.80 | ) | |||||||
| +100 |
2,942 | 1.22 | (1,078 | ) | (1.99 | ) | |||||||
| 0 |
— | — | — | — | |||||||||
The Company has opted not to include an estimate for a decrease in rates at December 31, 2009 as the results are not relevant given the current targeted fed funds rate of the Federal Open Market Committee. The table set forth above indicates that at December 31, 2009, in the event of an immediate 200 basis point increase in interest rates, the Bank would be expected to experience a 1.92% increase in NPV and a $2.1 million decrease in net interest income. This data does not reflect any actions that we may undertake in response to changes in interest rates, such as changes in rates paid on certain deposit accounts based on local competitive factors, which could reduce the actual impact on NPV and net interest income, if any.
Certain shortcomings are inherent in the methodology used in the above interest rate risk measurements. Modeling changes in NPV and net interest income requires that we make certain assumptions that may or may not reflect the manner in which actual yields and costs respond to changes in market interest rates. The NPV and net interest income table presented above assumes that the composition of our interest-rate-sensitive assets and liabilities existing at the beginning of a period remains constant over the period being measured and, accordingly, the data does not reflect any actions that we may undertake in response to changes in interest rates, such as changes in rates paid on certain deposit accounts based on local competitive factors. The table also assumes that a particular change in interest rates is reflected uniformly across the yield curve regardless of the duration to maturity or the repricing characteristics of specific assets and liabilities. Accordingly, although the NPV and net interest income table provides an indication of our sensitivity to interest rate changes at a particular point in time, such measurements are not intended to and do not provide a precise forecast of the effect of changes in market interest rates on our net interest income and will differ from actual results.
Liquidity Management
Liquidity Management - Bank. The overall objective of our liquidity management is to ensure the availability of sufficient cash funds to meet all financial commitments and to take advantage of investment opportunities. We manage liquidity in order to meet deposit withdrawals on demand or at contractual maturity, to repay borrowings as they mature, and to fund new loans and investments as opportunities arise.
Our primary sources of funds are deposits, principal and interest payments on loans and securities, and, to a lesser extent, wholesale borrowings, the proceeds from maturing securities and short-term investments, and the proceeds from the sales of loans and securities. The scheduled amortization of loans and securities, as well as proceeds from borrowings, are predictable sources of funds. Other funding sources, however, such as deposit inflows, mortgage prepayments and mortgage loan sales are greatly influenced by market interest rates, economic conditions and competition.
Our cash flows are derived from operating activities, investing activities and financing activities as reported in the Consolidated Statements of Cash Flows in our Consolidated Financial Statements. Our primary investing activities are the origination for investment or sale of one-to-four family residential mortgage loans, the origination for investment of multi-family mortgage, nonresidential real estate, commercial leases, construction and land, and commercial loans and the purchase of investment securities and mortgage-backed securities. During the years ended December 31, 2009, 2008 and 2007, our loans originated for sale totaled $40.8 million, $23.4 million and $26.6 million, respectively. During the years ended December 31, 2009, 2008 and 2007, our loans originated for investment totaled $796.3 million, $818.7 million and $752.8 million, respectively. Purchases of loans totaled $19.4 million, $12.7 million and $3.8 million for the years ended December 31, 2009, 2008 and 2007, respectively. There were no purchases of securities for the years ended December 31, 2009 and 2007, compared to $103.0 million for the year ended December 31, 2008.
51
These activities were funded primarily by principal repayments on loans and securities, and the sale of loans and securities. During the years ended December 31, 2009, 2008 and 2007, principal repayments on loans totaled $852.1 million, $810.6 million and $807.7 million, respectively. During the years ended December 31, 2009, 2008 and 2007, principal repayments on securities totaled $22.7 million, $9.1 million and $5.9 million, respectively. During the years ended December 31, 2009, 2008 and 2007, proceeds from maturities on securities totaled $1.9 million, $16.1 million and $46.7 million, respectively. During the years ended December 31, 2009, 2008 and 2007, the proceeds from the sale of loans totaled $42.4 million, $22.8 million and $26.9 million, respectively. In addition, during the year ended December 31, 2007 we securitized $23.5 million of conforming adjustable-rate residential mortgage loans.
Loan origination commitments totaled $11.2 million at December 31, 2009, and consisted of $2.3 million of fixed-rate loans and $8.9 million of adjustable-rate loans. Unused lines of credit and standby letters of credit granted to customers totaled $149.8 million and $2.2 million, respectively, at December 31, 2009. At December 31, 2009, commitments to sell mortgages totaled $1.3 million.
Deposit flows are generally affected by the level of market interest rates, the interest rates and other terms and conditions on deposit products offered by our banking competitors, and other factors. We had net deposit increase of $163.5 million for the year ended December 31, 2009, compared to net outflows of $3.8 million and $56.0 million for the years ended December 31, 2008 and 2007, respectively. At times during recent periods, we have not actively competed for higher cost deposit accounts, including certificates of deposit, choosing instead to fund loan growth from the loan and lease repayments. Certificates of deposit that are scheduled to mature in one year or less from December 31, 2009 totaled $327.6 million. Based upon prior experience and our current pricing strategy, we believe that we will retain a significant portion of these deposits upon their maturities.
We anticipate that we will have sufficient funds available to meet current loan commitments and lines of credit and maturing certificates of deposit that are not renewed or extended. We generally remain fully invested and utilize additional sources of funds through FHLBC advances, of which $43.6 million were outstanding at December 31, 2009. At December 31, 2009 we had the ability to borrow an additional $257.9 million under our credit facilities with the FHLBC. Furthermore, we have unpledged securities that could be used to support borrowings in excess of $27.0 million. Finally, at December 31, 2009 we had available pre-approved overnight federal funds borrowing lines of $28.0 million and a line of credit available with the Federal Reserve Bank of Chicago of $574,000. At December 31, 2009, there was no outstanding balance on these credit lines.
We minimize the funds required to originate one-to-four family residential mortgage loans in two ways. We sell in the secondary market virtually all of our eligible fixed-rate one-to-four family residential mortgage loans. From time to time, we also securitize the conforming adjustable-rate one-to-four family residential mortgage loans that we originate and hold the securities we receive in exchange. The resulting mortgage-backed securities that we retain on our balance sheet can be sold more readily to meet our liquidity or interest rate management needs. Because the securities carry a lower risk-weighting than the underlying loans, the securitizations also lower our regulatory capital requirements. During 2009, we did not securitize any loans.
Liquidity Management - Company. The liquidity needs of the Company on an unconsolidated basis consist primarily of operating expenses, dividends to stockholders and stock repurchases. The primary sources of liquidity for the Company currently are $25.8 million of cash and cash equivalents and periodic cash dividends from the Bank.
Under the rules of the OTS, the Bank is not permitted to pay dividends on its capital stock to the Company, its sole stockholder, if the dividend would reduce the Bank’s stockholder’s equity below the amount of the liquidation account established in connection with the Company’s mutual-to-stock conversion. The Bank may pay dividends without the approval of the OTS only if the Bank meets its applicable regulatory capital requirements before and after the payment of the dividends and its total dividends do not exceed its net income to date over the calendar year in which the dividend is paid plus retained net income over the preceding two years. The OTS has discretion to prohibit permissible capital distributions on general safety and soundness grounds and must be given 30 days advance notice of all capital distributions from the Bank to the Company, including dividends.
52
During 2009, we used $2.5 million of existing cash and cash equivalents to repurchase shares of our common stock and $6.0 million of existing cash and cash equivalents to pay cash dividends to our stockholders.
As of December 31, 2009, we were not aware of any known trends, events or uncertainties that had or were reasonably likely to have a material impact on our liquidity. As of December 31, 2009, we had no other material commitments for capital expenditures.
Capital Management
Capital Management – Bank. The overall objectives of our capital management are to ensure the availability of sufficient capital to support loan, deposit and other asset and liability growth opportunities and to maintain capital to absorb unforeseen losses or write-downs that are inherent in the business risks associated within the banking industry. We seek to balance the need for higher capital levels to address such unforeseen risks and the goal to achieve an adequate return on the capital invested by our stockholders.
The Bank is subject to regulatory capital requirements administered by the federal banking agencies. Failure to meet minimum capital requirements can initiate certain mandatory, and possibly additional discretionary, actions by the OTS that, if undertaken, could have a direct material effect on the Bank’s financial statements. Under capital adequacy guidelines and the regulatory framework for prompt corrective action, the Bank must meet specific capital guidelines that involve quantitative measures of the Bank’s assets, liabilities, and certain off-balance-sheet items as calculated under regulatory accounting practices. The Bank’s capital amounts and classification are also subject to qualitative judgments by regulators about components, risk weightings, and other factors.
The prompt corrective action regulations provide five classifications, including well capitalized, adequately capitalized, undercapitalized, significantly undercapitalized, and critically undercapitalized, although these terms are not used to represent overall financial condition. Adequately capitalized institutions require regulatory approval to accept brokered deposits. If undercapitalized, a financial institution’s capital distributions, asset growth and expansion are limited, and for the submission of a capital restoration is required.
At year-end, actual capital ratios and minimum required ratios for the Bank were:
| Actual Ratio |
Minimum Required for Capital Adequacy Purposes |
Minimum Required to Be Well Capitalized Under Prompt Corrective Action Provisions |
|||||||
| December 31, 2009 |
|||||||||
| Total capital (to risk-weighted assets) |
16.40 | % | 8.00 | % | 10.00 | % | |||
| Tier 1 (core) capital (to risk-weighted assets) |
15.31 | 4.00 | 6.00 | ||||||
| Tier 1 (core) capital (to adjusted total assets) |
12.44 | 4.00 | 5.00 | ||||||
| December 31, 2008 |
|||||||||
| Total capital (to risk-weighted assets) |
14.69 | % | 8.00 | % | 10.00 | % | |||
| Tier 1 (core) capital (to risk-weighted assets) |
13.79 | 4.00 | 6.00 | ||||||
| Tier 1 (core) capital (to adjusted total assets) |
12.08 | 4.00 | 5.00 | ||||||
See Note 11 – Regulatory Matters in our Consolidated Financial Statements for a reconciliation of the Bank’s equity under GAAP to regulatory capital.
As of December 31, 2009 and 2008, the OTS categorized the Bank as well capitalized under the regulatory framework for prompt corrective action. There are no conditions or events since those notifications that management believes have changed the institution’s capitalization category.
53
Capital Management - Company. On June 23, 2005, the Company completed its mutual-to-stock conversion and sold 24,466,250 shares of common stock in a subscription offering at $10.00 per share and raised $240.3 million in offering proceeds, net of offering expenses. The Company contributed $120.9 million of the net proceeds to the Bank, paid off $30 million of term borrowings, loaned $19.6 million to our ESOP and retained the remaining net proceeds of $72 million. As a result of the offering, the Company has capital levels substantially above those required to support the current size and risk profile of the Company and its subsidiary, the Bank.
Total stockholders’ equity totaled $263.6 million at December 31, 2009, compared to $266.8 million at December 31, 2008. The decrease on total stockholders’ equity was primarily due to our repurchase of 277,800 shares of our common stock at an aggregate cost of $2.5 million, the declaration and payment of cash dividends totaling $6.0 million, and a $738,000 net loss that we recorded for 2009. These items were partially offset by a $2.5 million increase in accumulated other comprehensive income, and a $3.5 million increase in additional paid in capital resulting from the vesting of stock-based compensation and ESOP shares earned.
The OTS has no specific quantitative capital regulations for savings and loan holding companies on either a consolidated or unconsolidated basis. There are several capital measurements that the OTS uses to evaluate the adequacy of a savings and loan holding company’s capital. One measurement is the tangible capital ratio. The tangible capital ratio (the ratio of tangible capital to tangible total assets (stockholders’ equity less goodwill and intangible assets divided by total assets less goodwill and intangible assets)) for the Company on a consolidated basis measures the percentage of consolidated tangible equity capital supporting our consolidated tangible total assets. The Company’s tangible capital ratio was 15.14% at December 31, 2009, compared to 15.48% at December 31, 2008.
As stated in our Prospectus dated April 15, 2005, our strategy for utilizing the capital raised in the offering encompasses several components, including debt reduction, funding our ESOP, financing acquisitions, paying dividends to stockholders, repurchasing shares of our common stock and for other general corporate purposes.
Our Board of Directors has authorized the repurchase of up to 5,047,423 shares of our common stock. The authorization permits shares to be repurchased in open market or negotiated transactions, and pursuant to any trading plan that may be adopted in accordance with Rule 10b5-1 of the Securities and Exchange Commission. The authorization may be utilized at management’s discretion, subject to the limitations set forth in Rule 10b-18 of the Securities and Exchange Commission and other applicable legal requirements, and to price and other internal limitations established by the Board of Directors. The repurchase authorization will expire on May 17, 2010, unless extended by the Board of Directors. As of December 31, 2009, the Company had repurchased 3,882,723 shares of its common stock out of the 5,047,423 shares that have been authorized for repurchase.
Off-Balance Sheet Arrangements and Aggregate Contractual Obligations
Commitments. As a financial services provider, we routinely are a party to various financial instruments with off-balance-sheet risks, such as commitments to extend credit, standby letters of credit, unused lines of credit and commitments to sell loans. While these contractual obligations represent our future cash requirements, a significant portion of commitments to extend credit may expire without being drawn upon. Such commitments are subject to the same credit policies and approval process afforded to loans that we make. Although we consider commitments to extend credit in determining our allowance for loan losses, at December 31, 2009, we had made no provision for losses on commitments to extend credit, and had no specific or general allowance for losses on such commitments, as we have had no historical loss experience with commitments to extend credit and we believed that no probable and reasonably estimable losses were inherent in our portfolio as a result of our commitments to extend credit. For additional information, see Note 14, “Loan Commitments and Other Off-Balance Sheet Activities,” to our Consolidated Financial Statements.
Contractual Obligations. In the ordinary course of our operations, we enter into certain contractual obligations. Such obligations include operating leases for premises and equipment.
54
The following table summarizes our significant fixed and determinable contractual obligations and other funding needs by payment date at December 31, 2009. The payment amounts represent those amounts due to the recipient and do not include any unamortized premiums or discounts or other similar carrying amount adjustments.
| Payments Due by Period | |||||||||||||||
| Contractual Obligations |
Less than One Year |
One to Three Years |
Three to Five Years |
More than Five Years |
Total | ||||||||||
| (Dollars in thousands) | |||||||||||||||
| Certificates of deposit |
$ | 327,577 | $ | 69,758 | $ | 6,300 | $ | — | $ | 403,635 | |||||
| Borrowings |
34,784 | 13,000 | 3,000 | — | 50,784 | ||||||||||
| Standby letters of credit |
2,005 | 165 | — | — | 2,170 | ||||||||||
| Operating leases |
533 | 937 | 881 | 6,982 | 9,333 | ||||||||||
| Total |
$ | 364,899 | $ | 83,860 | $ | 10,181 | $ | 6,982 | $ | 465,922 | |||||
| Commitments to extend credit |
$ | 161,036 | $ | — | $ | — | $ | — | $ | 161,036 | |||||
| ITEM 7A. | QUANTITATIVE AND QUALITATIVE DISCLOSURE ABOUT MARKET RISK |
For information regarding market risk see Item 7- “Management’s Discussion and Analysis of Financial Conditions and Results of Operation” - Management of Interest Rate Risk.
55
| ITEM 8. | FINANCIAL STATEMENTS AND SUPPLEMENTARY DATA |
REPORT OF MANAGEMENT ON INTERNAL CONTROL OVER FINANCIAL REPORTING
Management of BankFinancial Corporation is responsible for establishing and maintaining effective internal control over financial reporting.
Management evaluates the effectiveness of internal control over financial reporting and tests for reliability of recorded financial information through a program of ongoing internal audits. Any system of internal control, no matter how well designed, has inherent limitations, including the possibility that a control can be circumvented or overridden and misstatements due to error or fraud may occur and not be detected. Also, because of changes in conditions, internal control effectiveness may vary over time. Accordingly, even an effective system of internal control will provide only reasonable assurance with respect to financial statement preparation.
The Company’s internal control over financial reporting is a process designed to provide reasonable assurance regarding the reliability of financial reporting and the preparation of financial statements for external purposes in accordance with accounting principles generally accepted in the United States of America. The Company’s internal control over financial reporting includes those policies and procedures that (i) pertain to the maintenance of records that, in reasonable detail, accurately and fairly reflect the transactions and dispositions of the assets of the Company; (ii) provide reasonable assurance that transactions are recorded as necessary to permit preparation of financial statements in accordance with accounting principles generally accepted in the United States of America, and that receipts and expenditures of the Company are being made only in accordance with authorizations of management and directors of the Company; and (iii) provide reasonable assurance regarding prevention or timely detection of unauthorized acquisition, use, or disposition of the Company’s assets that could have a material effect on the financial statements.
Management assessed the Company’s internal control over financial reporting as of December 31, 2009, as required by Section 404 of the Sarbanes-Oxley Act of 2002, based on the criteria for effective internal control over financial reporting described in the “Internal Control-Integrated Framework,” adopted by the Committee of Sponsoring Organizations of the Treadway Commission (COSO). Based on this assessment, management concludes that, as of December 31, 2009, the Company’s internal control over financial reporting is effective.
The Company’s independent registered public accounting firm has issued their report on the effectiveness of the Company’s internal control over financial reporting. That report follows under the heading, Report of Independent Registered Public Accounting Firm.
| /s/ F. Morgan Gasior |
/s/ Paul A. Cloutier | |||
| F. Morgan Gasior | Paul A. Cloutier | |||
| Chairman of the Board, Chief Executive |
Executive Vice President and |
56
REPORT OF INDEPENDENT REGISTERED PUBLIC ACCOUNTING FIRM
We have audited the accompanying statements of financial condition of BankFinancial Corporation (the Company) as of December 31, 2009 and 2008, and the related statements of operations, changes in stockholders’ equity and comprehensive income (loss), and cash flows for each of the years in the three-year period ended December 31, 2009. We also have audited the Company’s internal control over financial reporting as of December 31, 2009, based on criteria established in Internal Control—Integrated Framework issued by the Committee of Sponsoring Organizations of the Treadway Commission (COSO). The Company’s management is responsible for these financial statements, for maintaining effective internal control over financial reporting, and for its assessment of the effectiveness of internal control over financial reporting, included in the accompanying Management’s Report on Internal Control Over Financial Reporting. Our responsibility is to express an opinion on these financial statements and an opinion on the Company’s internal control over financial reporting based on our audits.
We conducted our audits in accordance with the standards of the Public Company Accounting Oversight Board (United States). Those standards require that we plan and perform the audits to obtain reasonable assurance about whether the financial statements are free of material misstatement and whether effective internal control over financial reporting was maintained in all material respects. Our audits of the financial statements included examining, on a test basis, evidence supporting the amounts and disclosures in the financial statements, assessing the accounting principles used and significant estimates made by management, and evaluating the overall financial statement presentation. Our audit of internal control over financial reporting included obtaining an understanding of internal control over financial reporting, assessing the risk that a material weakness exists, and testing and evaluating the design, and operating effectiveness of internal control based on the assessed risk. Our audits also included performing such other procedures as we considered necessary in the circumstances. We believe that our audits provide a reasonable basis for our opinions.
A company’s internal control over financial reporting is a process designed to provide reasonable assurance regarding the reliability of financial reporting and the preparation of financial statements for external purposes in accordance with generally accepted accounting principles. A company’s internal control over financial reporting includes those policies and procedures that (1) pertain to the maintenance of records that, in reasonable detail, accurately and fairly reflect the transactions and dispositions of the assets of the company; (2) provide reasonable assurance that transactions are recorded as necessary to permit preparation of financial statements in accordance with generally accepted accounting principles, and that receipts and expenditures of the company are being made only in accordance with authorizations of management and directors of the company; and (3) provide reasonable assurance regarding prevention or timely detection of unauthorized acquisition, use, or disposition of the company’s assets that could have a material effect on the financial statements.
Because of its inherent limitations, internal control over financial reporting may not prevent or detect misstatements. Also, projections of any evaluation of effectiveness to future periods are subject to the risk that controls may become inadequate because of changes in conditions, or that the degree of compliance with the policies or procedures may deteriorate.
In our opinion, the financial statements referred to above present fairly, in all material respects, the financial position of BankFinancial Corporation as of December 31, 2009 and 2008, and the results of its operations and its cash flows for each of the years in the three-year period ended December 31, 2009 in conformity with accounting principles generally accepted in the United States of America. Also in our opinion, the Company maintained, in all material respects, effective internal control over financial reporting as of December 31, 2009, based on criteria established in Internal Control—Integrated Framework issued by the Committee of Sponsoring Organizations of the Treadway Commission (COSO).
Crowe Horwath LLP
Oak Brook, Illinois
March 5, 2010
57
BANKFINANCIAL CORPORATION
CONSOLIDATED STATEMENTS OF FINANCIAL CONDITION
December 31, 2009 and 2008
(In thousands, except share and per share data)
| December 31, | December 31, | |||||||
| 2009 | 2008 | |||||||
| ASSETS |
||||||||
| Cash and due from other financial institutions |
$ | 20,355 | $ | 29,213 | ||||
| Interest-bearing deposits in other financial institutions |
87,843 | 116 | ||||||
| Cash and cash equivalents |
108,198 | 29,329 | ||||||
| Securities, at fair value |
102,126 | 124,919 | ||||||
| Loans held-for-sale |
— | 872 | ||||||
| Loans receivable, net of allowance for loan losses: |
||||||||
| December 31, 2009, $18,622; and December 31, 2008, $14,746 |
1,218,467 | 1,267,968 | ||||||
| Real estate owned |
4,084 | 955 | ||||||
| Stock in Federal Home Loan Bank, at cost |
15,598 | 15,598 | ||||||
| Premises and equipment, net |
34,614 | 34,565 | ||||||
| Accrued interest receivable |
6,111 | 6,732 | ||||||
| Goodwill |
22,566 | 22,566 | ||||||
| Core deposit intangible |
4,295 | 5,985 | ||||||
| Bank owned life insurance |
20,151 | 20,171 | ||||||
| FDIC prepaid expense |
6,777 | — | ||||||
| Income tax receivable |
11,729 | 1,361 | ||||||
| Other assets |
12,174 | 23,680 | ||||||
| Total assets |
$ | 1,566,890 | $ | 1,554,701 | ||||
| LIABILITIES AND STOCKHOLDERS’ EQUITY |
||||||||
| Liabilities: |
||||||||
| Deposits |
1,233,395 | 1,069,855 | ||||||
| Borrowings |
50,784 | 200,350 | ||||||
| Advance payments by borrowers taxes and insurance |
8,052 | 8,104 | ||||||
| Accrued interest payable and other liabilities |
11,056 | 9,601 | ||||||
| Total liabilities |
1,303,287 | 1,287,910 | ||||||
| Commitments and contingent liabilities |
||||||||
| Stockholders’ equity: |
||||||||
| Preferred Stock, $0.01 par value, 25,000,000 shares authorized, none issued or outstanding |
— | — | ||||||
| Common Stock, $0.01 par value, 100,000,000 shares authorized; shares issued at December 31, 2009, 21,416,377; and at December 31, 2008, 21,694,177 |
214 | 217 | ||||||
| Additional paid-in capital |
195,177 | 195,119 | ||||||
| Retained earnings |
81,531 | 88,279 | ||||||
| Unearned Employee Stock Ownership Plan shares |
(15,169 | ) | (16,148 | ) | ||||
| Accumulated other comprehensive income (loss) |
1,850 | (676 | ) | |||||
| Total stockholders’ equity |
263,603 | 266,791 | ||||||
| Total liabilities and stockholders’ equity |
$ | 1,566,890 | $ | 1,554,701 | ||||
See accompanying notes to consolidated financial statements.
58
BANKFINANCIAL CORPORATION
CONSOLIDATED STATEMENTS OF OPERATIONS
Years ended December 31, 2009, 2008, and 2007
(In thousands, except per share data)
| 2009 | 2008 | 2007 | ||||||||||
| Interest and dividend income |
||||||||||||
| Loans, including fees |
$ | 69,170 | $ | 73,983 | $ | 85,601 | ||||||
| Securities |
4,816 | 3,861 | 5,056 | |||||||||
| Other |
123 | 116 | 1,296 | |||||||||
| Total interest income |
74,109 | 77,960 | 91,953 | |||||||||
| Interest expense |
||||||||||||
| Deposits |
18,501 | 22,033 | 33,446 | |||||||||
| Borrowings |
2,056 | 3,634 | 4,858 | |||||||||
| Total interest expense |
20,557 | 25,667 | 38,304 | |||||||||
| Net interest income |
53,552 | 52,293 | 53,649 | |||||||||
| Provision for loan losses |
8,811 | 5,092 | 697 | |||||||||
| Net interest income after provision for loan losses |
44,741 | 47,201 | 52,952 | |||||||||
| Noninterest income |
||||||||||||
| Deposit service charges and fees |
3,363 | 3,571 | 3,606 | |||||||||
| Other fee income |
1,816 | 1,944 | 1,939 | |||||||||
| Insurance commissions and annuities income |
715 | 794 | 1,007 | |||||||||
| Gain on sale of loans, net |
699 | 118 | 126 | |||||||||
| Gain (loss) on sale of securities |
(988 | ) | 1,385 | 399 | ||||||||
| Gain on unredeemed VISA stock |
— | 1,240 | — | |||||||||
| Gain (loss) on disposition of premises and equipment |
(40 | ) | (302 | ) | 9 | |||||||
| Loan servicing fees |
653 | 771 | 811 | |||||||||
| Amortization and impairment of servicing assets |
(446 | ) | (524 | ) | (396 | ) | ||||||
| Earnings (loss) on bank owned life insurance |
(20 | ) | 586 | 585 | ||||||||
| Other |
1,487 | 835 | 1,579 | |||||||||
| Total noninterest income |
7,239 | 10,418 | 9,665 | |||||||||
| Noninterest expense |
||||||||||||
| Compensation and benefits |
29,046 | 30,535 | 32,276 | |||||||||
| Office occupancy and equipment |
6,845 | 6,874 | 5,949 | |||||||||
| Advertising and public relations |
1,321 | 1,361 | 1,412 | |||||||||
| Information technology |
3,637 | 3,662 | 3,241 | |||||||||
| Supplies, telephone, and postage |
1,819 | 2,070 | 2,109 | |||||||||
| Amortization of intangibles |
1,690 | 1,784 | 1,879 | |||||||||
| Operations of real estate owned |
1,273 | 434 | 17 | |||||||||
| VISA litigation |
— | — | 1,240 | |||||||||
| Loss on impairment of securities |
401 | 35,919 | — | |||||||||
| Loss on early extinguishment of borrowings |
— | 1,975 | — | |||||||||
| FDIC insurance premiums |
2,225 | 162 | 133 | |||||||||
| Other |
4,474 | 4,280 | 4,243 | |||||||||
| Total noninterest expense |
52,731 | 89,056 | 52,499 | |||||||||
| Income (loss) before income taxes |
(751 | ) | (31,437 | ) | 10,118 | |||||||
| Income tax expense (benefit) |
(13 | ) | (12,048 | ) | 2,963 | |||||||
| Net income (loss) |
$ | (738 | ) | $ | (19,389 | ) | $ | 7,155 | ||||
| Basic earnings (loss) per common share |
$ | (0.04 | ) | $ | (0.98 | ) | $ | 0.35 | ||||
| Diluted earnings (loss) per common share |
$ | (0.04 | ) | $ | (0.98 | ) | $ | 0.35 | ||||
| Weighted average common shares outstanding |
19,698,074 | 19,818,895 | 20,659,587 | |||||||||
| Diluted weighted average common shares outstanding |
19,698,074 | 19,818,895 | 20,659,587 | |||||||||
See accompanying notes to consolidated financial statements.
59
BANKFINANCIAL CORPORATION
CONSOLIDATED STATEMENTS OF CHANGES IN STOCKHOLDERS’ EQUITY AND
COMPREHENSIVE INCOME (LOSS)
Years ended December 31, 2009, 2008, and 2007
(In thousands)
| Common Stock |
Additional Paid-in Capital |
Retained Earnings |
Unearned Employee Stock Ownership Plan Shares |
Accumulated Other Comprehensive Income (Loss) |
Total | Comprehensive Loss |
||||||||||||||||||||||
| Balance at December 31, 2006 |
$ | 243 | $ | 227,741 | $ | 113,128 | $ | (18,105 | ) | $ | 3,008 | $ | 326,015 | |||||||||||||||
| Comprehensive loss: |
||||||||||||||||||||||||||||
| Net income |
— | — | 7,155 | — | — | 7,155 | $ | 7,155 | ||||||||||||||||||||
| Change in other comprehensive income (loss), net of tax effects |
— | — | — | — | (7,218 | ) | (7,218 | ) | (7,218 | ) | ||||||||||||||||||
| Total comprehensive loss |
$ | (63 | ) | |||||||||||||||||||||||||
| Purchase and retirement of common stock (2,077,923 shares) |
(21 | ) | (33,936 | ) | — | — | — | (33,957 | ) | |||||||||||||||||||
| Nonvested stock awards: |
||||||||||||||||||||||||||||
| Issuance of shares of restricted stock (17,450 shares) |
— | — | — | — | — | — | ||||||||||||||||||||||
| Stock-based compensation expense |
— | 4,075 | — | — | — | 4,075 | ||||||||||||||||||||||
| Cash dividends declared on common stock ($0.28 per share) |
— | — | (6,481 | ) | — | — | (6,481 | ) | ||||||||||||||||||||
| ESOP shares earned |
— | 569 | — | 979 | — | 1,548 | ||||||||||||||||||||||
| Balance at December 31, 2007 |
$ | 222 | $ | 198,449 | $ | 113,802 | $ | (17,126 | ) | $ | (4,210 | ) | $ | 291,137 | ||||||||||||||
| Comprehensive loss: |
||||||||||||||||||||||||||||
| Net loss |
— | — | (19,389 | ) | — | — | (19,389 | ) | $ | (19,389 | ) | |||||||||||||||||
| Change in other comprehensive loss, net of tax effects |
— | — | — | — | 3,534 | 3,534 | 3,534 | |||||||||||||||||||||
| Total comprehensive loss |
$ | (15,855 | ) | |||||||||||||||||||||||||
| Purchase and retirement of common stock (549,700 shares) |
(5 | ) | (7,732 | ) | — | — | — | (7,737 | ) | |||||||||||||||||||
| Nonvested stock awards-stock-based compensation expense |
— | 4,383 | — | — | — | 4,383 | ||||||||||||||||||||||
| Cash dividends declared on common stock ($0.28 per share) |
— | — | (6,134 | ) | — | — | (6,134 | ) | ||||||||||||||||||||
| ESOP shares earned |
— | 19 | — | 978 | — | 997 | ||||||||||||||||||||||
| Balance at December 31, 2008 |
$ | 217 | $ | 195,119 | $ | 88,279 | $ | (16,148 | ) | $ | (676 | ) | $ | 266,791 | ||||||||||||||
See accompanying notes to consolidated financial statements.
60
BANKFINANCIAL CORPORATION
CONSOLIDATED STATEMENTS OF CHANGES IN STOCKHOLDERS’ EQUITY AND
COMPREHENSIVE INCOME (LOSS)
Years ended December 31, 2009, 2008, and 2007
(In thousands)
| Common Stock |
Additional Paid-in Capital |
Retained Earnings |
Unearned Employee Stock Ownership Plan Shares |
Accumulated Other Comprehensive Income (Loss) |
Total | Comprehensive Loss |
||||||||||||||||||||||
| Balance at December 31, 2008 |
$ | 217 | $ | 195,119 | $ | 88,279 | $ | (16,148 | ) | $ | (676 | ) | $ | 266,791 | ||||||||||||||
| Comprehensive income |
||||||||||||||||||||||||||||
| Net loss |
— | — | (738 | ) | — | — | (738 | ) | $ | (738 | ) | |||||||||||||||||
| Change in other comprehensive income, net of tax effects |
— | — | — | — | 2,526 | 2,526 | 2,526 | |||||||||||||||||||||
| Total comprehensive income |
$ | 1,788 | ||||||||||||||||||||||||||
| Purchase and retirement of common stock (277,800 shares) |
(3 | ) | (2,488 | ) | — | — | — | (2,491 | ) | |||||||||||||||||||
| Nonvested stock awards-stock-based compensation expense |
— | 2,556 | — | — | — | 2,556 | ||||||||||||||||||||||
| Cash dividends declared on common stock ($0.28 per share) |
— | — | (6,010 | ) | — | — | (6,010 | ) | ||||||||||||||||||||
| ESOP shares earned |
— | (10 | ) | — | 979 | — | 969 | |||||||||||||||||||||
| Balance at December 31, 2009 |
$ | 214 | $ | 195,177 | $ | 81,531 | $ | (15,169 | ) | $ | 1,850 | $ | 263,603 | |||||||||||||||
See accompanying notes to consolidated financial statements.
61
BANKFINANCIAL CORPORATION
CONSOLIDATED STATEMENTS OF CASH FLOWS
Years ended December 31, 2009, 2008, and 2007
(In thousands)
| 2009 | 2008 | 2007 | ||||||||||
| Cash flows from operating activities |
||||||||||||
| Net income (loss) |
$ | (738 | ) | $ | (19,389 | ) | $ | 7,155 | ||||
| Adjustments to reconcile to net income to net cash from operating activities |
||||||||||||
| Provision for loan losses |
8,811 | 5,092 | 697 | |||||||||
| ESOP shares earned |
969 | 997 | 1,548 | |||||||||
| Stock-based compensation expense |
2,556 | 4,125 | 4,075 | |||||||||
| Depreciation and amortization |
4,331 | 3,945 | 3,863 | |||||||||
| Amortization of premiums and discounts on securities and loans |
(59 | ) | (41 | ) | (314 | ) | ||||||
| Amortization of core deposit and other intangible assets |
1,676 | 1,769 | 1,874 | |||||||||
| Amortization and impairment of servicing assets |
446 | 524 | 396 | |||||||||
| Net change in net deferred loan origination costs |
211 | 174 | 338 | |||||||||
| Net loss on sale of real estate owned |
91 | 253 | — | |||||||||
| Net gain on sale of loans |
(699 | ) | (118 | ) | (126 | ) | ||||||
| Net loss (gain) on sale of securities |
988 | (1,385 | ) | (399 | ) | |||||||
| Loss on impairment of securities |
401 | 35,919 | — | |||||||||
| Gain on unredeemed VISA stock |
— | (1,240 | ) | — | ||||||||
| Net loss (gain) disposition of premises and equipment |
40 | 302 | (9 | ) | ||||||||
| Loans originated for sale |
(40,795 | ) | (23,395 | ) | (26,637 | ) | ||||||
| Proceeds from sale of loans |
42,366 | 22,814 | 26,888 | |||||||||
| Net change in: |
||||||||||||
| Deferred income tax |
8,854 | (14,396 | ) | (438 | ) | |||||||
| Accrued interest receivable |
621 | 358 | 779 | |||||||||
| Loss (earnings) on bank owned life insurance |
20 | (586 | ) | (585 | ) | |||||||
| Other assets |
(17,280 | ) | (3,513 | ) | (1,989 | ) | ||||||
| Accrued interest payable and other liabilities |
1,455 | (792 | ) | 623 | ||||||||
| Net cash from operating activities |
14,265 | 11,417 | 17,739 | |||||||||
| Cash flows from investing activities |
||||||||||||
| Securities |
||||||||||||
| Proceeds from sales |
967 | 1,385 | 399 | |||||||||
| Proceeds from maturities |
1,872 | 16,113 | 46,717 | |||||||||
| Proceeds from principal repayments |
22,718 | 9,051 | 5,866 | |||||||||
| Purchases of securities |
— | (103,018 | ) | — | ||||||||
| Loans receivable |
||||||||||||
| Principal payments on loans receivable |
852,140 | 810,643 | 807,683 | |||||||||
| Purchases of loans |
(19,423 | ) | (12,680 | ) | (3,848 | ) | ||||||
| Originated for investment |
(796,324 | ) | (818,656 | ) | (752,752 | ) | ||||||
| Purchase of bank owned life insurance |
— | — | (19,000 | ) | ||||||||
| Proceeds from sale of real estate owned |
331 | 2,274 | — | |||||||||
| Purchase of premises and equipment, net |
(3,098 | ) | (3,015 | ) | (2,115 | ) | ||||||
| Net cash from investing activities |
59,183 | (97,903 | ) | 82,950 | ||||||||
(Continued)
62
BANKFINANCIAL CORPORATION
CONSOLIDATED STATEMENTS OF CASH FLOWS
Years ended December 31, 2009, 2008, and 2007
(In thousands)
| 2009 | 2008 | 2007 | ||||||||||
| Cash flows from financing activities |
||||||||||||
| Net change in deposits |
$ | 163,540 | $ | (3,795 | ) | $ | (55,952 | ) | ||||
| Net change in advance payments by borrowers for taxes and insurance |
(52 | ) | 616 | (973 | ) | |||||||
| Net change in borrowings |
(149,566 | ) | 103,917 | (41,715 | ) | |||||||
| Repurchase and retirement of common stock |
(2,491 | ) | (7,737 | ) | (33,957 | ) | ||||||
| Cash dividends paid on common stock |
(6,010 | ) | (6,134 | ) | (6,481 | ) | ||||||
| Net cash from financing activities |
5,421 | 86,867 | (139,078 | ) | ||||||||
| Net change in cash and cash equivalents |
78,869 | 381 | (38,389 | ) | ||||||||
| Beginning cash and cash equivalents |
29,329 | 28,948 | 67,337 | |||||||||
| Ending cash and cash equivalents |
$ | 108,198 | $ | 29,329 | $ | 28,948 | ||||||
| Supplemental disclosures of cash flow information: |
||||||||||||
| Interest paid |
$ | 20,767 | $ | 25,902 | $ | 38,508 | ||||||
| Income taxes paid |
1,500 | 3,575 | 3,492 | |||||||||
| Loans transferred to real estate owned |
5,990 | 2,967 | 820 | |||||||||
| Loans securitized to securities |
— | — | 23,482 | |||||||||
| Due to broker |
— | — | 158 | |||||||||
See accompanying notes to consolidated financial statements.
63
BANKFINANCIAL CORPORATION
NOTES TO CONSOLIDATED FINANCIAL STATEMENTS
(Table amounts in thousands, except share and per share data)
NOTE 1 – SUMMARY OF SIGNIFICANT ACCOUNTING POLICIES
Basis of Presentation: BankFinancial Corporation, a Maryland corporation headquartered in Burr Ridge, Illinois (the “Company”), is the owner of all of the issued and outstanding capital stock of BankFinancial, F.S.B. (the “Bank”). On March 15, 2008, Financial Assurance Services, Inc. (“Financial Assurance”), a wholly-owned subsidiary of the Bank, completed the sale of its title insurance agency business to a newly formed, third-party title insurance agency. The transaction had no material impact on the Company’s total assets, stockholders’ equity or net income.
Principles of Consolidation: The consolidated financial statements include the accounts of and transactions of BankFinancial Corporation, the Maryland corporation, the Bank, and the Bank’s wholly-owned subsidiaries, Financial Assurance Services, Inc. and BankFinancial Asset Recovery Corporation (collectively, “the Company”). All significant intercompany accounts and transactions have been eliminated.
Nature of Business: The Company’s revenues, operating income, and assets are primarily from the banking industry. All of the Company’s banking operations are considered by management to be aggregated in one reportable operating segment for financial reporting purposes. Loan origination customers are mainly located in the greater Chicago metropolitan area. To supplement loan originations, the Company purchases mortgage loans. The loan portfolio is concentrated in loans that are primarily secured by real estate.
Use of Estimates: To prepare financial statements in conformity with accounting principles generally accepted in the United States of America (“US GAAP”), management makes estimates and assumptions based on available information. These estimates and assumptions affect the amounts reported in the financial statements and the disclosures provided, and future results could differ. The allowance for loan losses, mortgage servicing rights, stock-based compensation, impairment of securities and fair value of financial instruments are particularly subject to change.
Interest-bearing Deposits in Other Financial Institutions: Interest-bearing deposits in other financial institutions maturing in less than 90 days are carried at cost.
Cash Flows: Cash and cash equivalents include cash, deposits with other financial institutions maturing in less than 90 days, and daily federal funds sold. Net cash flows are reported for customer loan and deposit transactions, interest bearing deposits in other financial institutions, borrowings, and advance payments by borrowers for taxes and insurance.
Securities: Debt securities are classified as available-for-sale when they might be sold before maturity. Equity securities with readily determinable fair values are classified as available-for-sale. Securities available-for-sale are carried at fair value, with unrealized holding gains and losses reported in other comprehensive income (loss), net of tax. Interest income includes amortization of purchase premium or discount. Premiums and discounts on securities are amortized on the level-yield method without anticipating prepayments, except for mortgage-backed securities where prepayments are anticipated. Gains and losses on sales are based on the amortized cost of the security sold. Declines in the fair value of securities below their cost that are other-than-temporary are reflected as realized losses. In determining if losses are other-than-temporary, management considers: (1) the length of time and extent that fair value has been less than cost or adjusted cost, as applicable, (2) the financial condition and near term prospects of the issuer, and (3) whether the Company has the intent to sell the debt security or it is more likely than not that the Company will be required to sell the debt security before the anticipated recovery.
Federal Home Loan Bank Stock: The Bank is a member of the FHLB system. Members are required to own a certain amount of stock based on the level of borrowings and other factors, and may invest in additional amounts. FHLBC stock is carried at cost and classified as a restricted security. Current accounting guidance for FHLBC stock provides that, for impairment testing purposes, the value of long term investments such as our FHLBC common stock is based on the “ultimate recoverability” of the par value of the security without regard to temporary declines in value. Both cash and stock dividends are reported as income.
64
BANKFINANCIAL CORPORATION
NOTES TO CONSOLIDATED FINANCIAL STATEMENTS
(Table amounts in thousands, except share and per share data)
NOTE 1 – SUMMARY OF SIGNIFICANT ACCOUNTING POLICIES (continued)
Loans Held for Sale: Mortgage loans originated and intended for sale in the secondary market are carried at the lower of aggregate cost or estimated fair market value, as determined by outstanding commitments from investors. Net unrealized losses, if any, are recorded as a valuation allowance and charged to earnings.
Mortgage loans held for sale are generally sold with servicing rights retained. The carrying value of mortgage loans sold is reduced by the fair value of the servicing right. Gains and losses on sales of mortgage loans are based on the difference between the selling price and the carrying value of the related loan sold.
Loans and Loan Income: Loans that management has the intent and ability to hold for the foreseeable future or until maturity or payoff are reported at the principal balance outstanding, net of the allowance for loan losses, premiums and discounts on loans purchased, and net deferred loan costs. Interest income on loans is recognized in income over the term of the loan based on the amount of principal outstanding.
Premiums and discounts associated with loans purchased are amortized over the contractual term of the loan using the level-yield method.
Interest income is reported on the interest method and includes amortization of net deferred loan fees and costs over the contractual loan term, adjusted for prepayments. Interest income is discontinued at the time the loan is 90 days delinquent unless the loan is well-secured and in process of collection. Past due status is based on the contractual terms of the loan. In all cases, loans are placed on nonaccrual or charged off at an earlier date if collection of principal or interest is considered doubtful.
All interest accrued but not received for loans placed on nonaccrual status is reversed against interest income. Interest received on such loans is accounted for on the cash-basis or cost-recovery method, until qualifying for return to accrual status. Loans are returned to accrual status when all the principal and interest amounts contractually due are brought current and future payments are reasonably assured.
Allowance for Loan Losses: The allowance for loan losses is a valuation allowance for probable incurred credit losses. Loan losses are charged against the allowance when management believes the uncollectibility of a loan balance is confirmed. Subsequent recoveries, if any, are credited to the allowance. Management estimates the allowance balance required using past loan loss experience; the nature and volume of the portfolio; information about specific borrower situations; and estimated collateral values, economic conditions, and other factors. The amount of the allowance is based on estimates and the ultimate losses may vary from such estimates as more information becomes available, or as later events occur or circumstances change. Allocations of the allowance may be made for specific loans, but the entire allowance is available for any loan that, in management’s judgment, should be charged off.
The allowance consists of specific and general components. The specific component relates to loans that are individually classified as impaired or loans otherwise classified as substandard or doubtful. The general component covers nonclassified loans and is based on historical loss experience adjusted for current factors.
A loan is impaired when full payment under the loan terms is not expected. Loans that experience insignificant payment delays and payment shortfalls are generally not classified as impaired. Management determines the significance of payment delays and shortfalls on a case-by-case basis, considering the length of the delay, reasons for the delay and prior experience with the borrower. Multi-family, nonresidential, construction and land, and commercial real estate loans are individually evaluated for impairment. If a loan is impaired, a portion of the allowance is allocated so that the loan is reported, net, at the present value of estimated future cash flows using the loan’s existing rate or at the fair value of collateral if repayment is expected solely from the collateral. Large groups of smaller balance homogeneous loans, such as consumer and residential real estate loans, are collectively evaluated for impairment, and accordingly, they are not separately identified for impairment disclosures. Trouble debt restructurings are measured at the present value of estimated future cash flows using the loan’s effective rate at inception or the fair value of the collateral.
65
BANKFINANCIAL CORPORATION
NOTES TO CONSOLIDATED FINANCIAL STATEMENTS
(Table amounts in thousands, except share and per share data)
NOTE 1 – SUMMARY OF SIGNIFICANT ACCOUNTING POLICIES (continued)
Mortgage Servicing Rights: Mortgage servicing rights are recognized separately when they are acquired through sales of loans. When mortgage loans are sold, servicing rights are initially recorded at fair value and gains on sales of loans are recorded in the statement of operations. Fair value is based on market prices for comparable mortgage servicing contracts, when available, or alternatively, is based on a valuation model that calculates the present value of estimated future net servicing income. The valuation model incorporates assumptions that market participants would use in estimating future net servicing income, such as the servicing cost per loan, the discount rate, the escrow float rate, an inflation rate, ancillary income, prepayment speeds and default rates and losses. The Company compares the valuation model inputs and results to published industry data in order to validate the model results and assumptions. All classes of servicing assets are subsequently measured using the amortization method which requires servicing rights to be amortized into non-interest income in proportion to, and over the period of, the estimated future net servicing income of the underlying loans.
Servicing assets are evaluated for impairment based upon the fair value of the rights as compared to carrying amount. Impairment is determined by stratifying rights into groupings based on predominant risk characteristics, such as interest rate, loan type and investor type. Impairment is recognized through a valuation allowance for an individual grouping, to the extent that fair value is less than the carrying amount. If the Company later determines that all or a portion of the impairment no longer exists for a particular grouping, a reduction of the allowance may be recorded as an increase to income. Changes in valuation allowances are reported with amortization and impairment of servicing assets on the statement of operations. The fair values of servicing rights are subject to significant fluctuations as a result of changes in estimated and actual prepayment speeds and default rates and losses.
Servicing fee income that is reported on the statement of operations as loan servicing fees is recorded for fees earned for servicing loans. The fees are based on a contractual percentage of the outstanding principal; or a fixed amount per loan and are recorded as income when earned. Late fees and ancillary fees related to loan servicing are not material.
Real Estate Owned: Real estate properties acquired in collection of a loan are initially recorded at fair value less cost to sell at acquisition, establishing a new cost basis. If fair value declines subsequent to foreclosure, a valuation allowance is recorded through expense. Expenses, gains and losses on disposition, and changes in the valuation allowance are reported in noninterest expense as operations of real estate owned.
Premises and Equipment: Land is carried at cost. Premises and equipment are stated at cost less accumulated depreciation. Depreciation is included in noninterest expense and is computed on the straight-line method over the estimated useful lives of the assets. Useful lives are estimated to be 25 to 40 years for buildings and improvements that extend the life of the original building, ten to 20 years for routine building improvements, five to 15 years for furniture and equipment, two to five years for computer hardware and software and no greater than four years on automobiles. The cost of maintenance and repairs is charged to expense as incurred and significant repairs are capitalized.
Goodwill and Other Intangible Assets: Goodwill resulted from business acquisitions prior to January 1, 2009 and represents the excess of the purchase price over the fair value of acquired tangible assets and liabilities and identifiable intangible assets.
Goodwill is assessed at least annually for impairment and any such impairment will be recognized in the period identified. There was no impairment to goodwill for the years ended December 31, 2009, 2008 and 2007.
Other intangible assets consist of core deposit intangible assets arising from whole bank acquisitions. They are initially measured at fair value and then are amortized on an accelerated method over their estimated useful lives.
66
BANKFINANCIAL CORPORATION
NOTES TO CONSOLIDATED FINANCIAL STATEMENTS
(Table amounts in thousands, except share and per share data)
NOTE 1 – SUMMARY OF SIGNIFICANT ACCOUNTING POLICIES (continued)
Bank Owned Life Insurance The Company has purchased life insurance policies on certain key executives. The Company owned life insurance is recorded at the amount that can be realized under the insurance contract at the balance sheet date, which is the cash surrender value adjusted for other charges or other amounts due that are probable at settlement.
Long-Term Assets: Premises and equipment, core deposit and other intangible assets, and other long-term assets are reviewed for impairment when events indicate that their carrying amount may not be recoverable from future undiscounted cash flows. If impaired, the assets are recorded at fair value.
Loan Commitments and Related Financial Instruments: Financial instruments include off-balance-sheet credit instruments, such as commitments to make loans and commercial letters of credit, issued to meet customer financing needs. The face amount for these items represents the exposure to loss, before considering customer collateral or ability to repay. Such financial instruments are recorded when they are funded.
Income Taxes: Income tax expense is the sum of the current year income tax due or refundable and the change in the deferred tax assets and liabilities. Deferred tax assets and liabilities are the expected future tax consequences of temporary differences between the carrying amounts and tax basis of assets and liabilities, computed using enacted tax rates. A valuation allowance, if needed, reduces deferred tax assets to the amount expected to be realized.
A tax position is recognized as a benefit only if it is “more likely than not” that the tax position would be sustained in a tax examination, presuming that a tax examination will occur. The amount recognized is the largest amount of tax benefit that is greater than 50% likely to be realized on examination. For tax positions not meeting the “more likely than not” test, no tax benefit is recorded. The adoption had no material effect on the Company’s financial statements. At December 31, 2009 and 2008 the Company had unrecognized tax benefits of $165,000 and $173,000, respectively. The Company and its subsidiary are subject to U.S. federal income tax as well as income tax of the State of Illinois. The Company is no longer subject to examination by these taxing authorities for years before 2006. Beginning in 2009, the Company and its subsidiary are subject to income tax of the State of New Jersey. The Company does not expect the total amount of unrecognized tax benefits to significantly increase in the next twelve months.
The Company recognizes interest and/or penalties related to income tax matters in income tax expense. At December 31, 2009 and 2008, the Company had recorded a cumulative accrual of $27,000 and $25,000, respectively, for potential interest and penalties.
Retirement Plans: Employee 401(k) and profit sharing plan expense is the amount of matching contributions and any annual discretionary contribution made at the discretion of the Company’s Board of Directors. Deferred compensation expense allocates the benefits over years of service.
Employee Stock Ownership Plan (“ESOP”): The cost of shares issued to the ESOP, but not yet allocated to participants, is shown as a reduction of stockholders’ equity. Compensation expense is based on the market price of shares as they are committed to be released to participant accounts. Dividends on allocated ESOP shares reduce retained earnings; dividends on unearned ESOP shares reduce debt and accrued interest.
Earnings (Loss) Per Common Share: Basic earnings (loss) per common share is net income (loss) divided by the weighted average number of common shares outstanding during the period. ESOP shares are considered outstanding for this calculation unless unearned. Diluted earnings (loss) per common share is net income (loss) divided by the weighted average number of common shares outstanding during the period plus the dilutive effect of restricted stock shares and the additional potential shares issuable under stock options.
Loss Contingencies: Loss contingencies, including claims and legal actions arising in the ordinary course of business, are recorded as liabilities when the likelihood of loss is probable and an amount or range of loss can be reasonably estimated. Management does not believe that there are such matters that will have a material effect on the financial statements as of December 31, 2009.
67
BANKFINANCIAL CORPORATION
NOTES TO CONSOLIDATED FINANCIAL STATEMENTS
(Table amounts in thousands, except share and per share data)
NOTE 1 – SUMMARY OF SIGNIFICANT ACCOUNTING POLICIES (continued)
Restrictions on Cash: Cash on hand or on deposit with the Federal Reserve Bank was required to meet regulatory reserve and clearing requirements. These required balances do not earn interest.
Fair Values of Financial Instruments: Fair values of financial instruments are estimated using relevant market value information and other assumptions, as more fully disclosed in a separate note. Fair value estimates involve uncertainties and matters of significant judgment regarding interest rates, credit risk, prepayments, and other factors, especially in the absence of broad markets for particular items. Changes in assumptions or in market conditions could significantly affect the estimates.
Comprehensive Income (Loss): Comprehensive income (loss) consists of net income (loss) and other comprehensive income (loss). Other comprehensive income (loss) includes unrealized gains and losses on securities, which are also recognized as separate components of stockholders’ equity.
Stock-based Compensation: Compensation cost is recognized for stock options and restricted stock awards issued to employees, based on the fair value of these awards at the date of grant. The Black-Scholes model is utilized to estimate the fair value of stock options, while the market price of the Company’s common stock at the date of grant is used for restricted stock awards. Compensation cost is recognized over the required service period, generally defined as the vesting period.
Transfers of Financial Assets: Transfers of financial assets are accounted for as sales when control over the assets has been relinquished. Control over transferred assets is deemed to be surrendered when the assets have been isolated from the Company, the transferee obtains the right (free of conditions that constrain it from taking advantage of that right) to pledge or exchange the transferred assets, and the Company does not maintain effective control over the transferred assets through an agreement to repurchase them before their maturity.
Reclassifications: Certain reclassifications have been made in the prior year’s financial statements to conform to the current year’s presentation.
Adoption of New Accounting Standards
In May 2009, the FASB issued guidance which requires the effects of events that occur subsequent to the balance-sheet date be evaluated through the date the financial statements are either issued or available to be issued. Companies should disclose the date through which subsequent events have been evaluated and whether that date is the date the financial statements were issued or the date the financial statements were available to be issued. Companies are required to reflect in their financial statements the effects of subsequent events that provide additional evidence about conditions at the balance-sheet date (recognized subsequent events). Companies are also prohibited from reflecting in their financial statements the effects of subsequent events that provide evidence about conditions that arose after the balance-sheet date (nonrecognized subsequent events), but requires information about those events to be disclosed if the financial statements would otherwise be misleading. This guidance was effective for interim and annual financial periods ending after June 15, 2009 with prospective application. The adoption of this guidance did not have a material impact on the Company’s financial condition, results of operations or cash flows as it only required disclosures.
In June 2009, the FASB replaced The Hierarchy of Generally Accepted Accounting Principles, with the FASB Accounting Standards Codification TM (The Codification) as the source of authoritative accounting principles recognized by the FASB to be applied by nongovernmental entities in the preparation of financial statements in conformity with GAAP. Rules and interpretive releases of the Securities and Exchange Commission under authority of federal securities laws are also sources of authoritative GAAP for SEC registrants. The Codification was effective for financial statements issued for periods ending after September 15, 2009.
68
BANKFINANCIAL CORPORATION
NOTES TO CONSOLIDATED FINANCIAL STATEMENTS
(Table amounts in thousands, except share and per share data)
NOTE 1 – SUMMARY OF SIGNIFICANT ACCOUNTING POLICIES (continued)
In April 2009, the FASB amended existing guidance for determining whether impairment is other-than-temporary for debt securities. The guidance requires an entity to assess whether it intends to sell, or it is more likely than not that it will be required to sell, a security in an unrealized loss position before recovery of its amortized cost basis. If either of these criteria is met, the entire difference between amortized cost and fair value is recognized as impairment through earnings. For securities that do not meet the aforementioned criteria, the amount of impairment is split into two components as follows: 1) other-than-temporary impairment (OTTI) related to other factors, which is recognized in other comprehensive income and 2) OTTI related to credit loss, which must be recognized in the statement of operations. The credit loss is defined as the difference between the present value of the cash flows expected to be collected and the amortized cost basis. Additionally, disclosures about other-than-temporary impairments for debt and equity securities were expanded. This guidance was effective for interim and annual reporting periods ending after June 15, 2009, with early adoption permitted for periods ending after March 15, 2009. The adoption of this FSP, effective January 1, 2009, did not have a material impact on the Company’s financial condition, results of operations or cash flows.
In April 2009, the FASB issued guidance that emphasizes that the objective of a fair value measurement does not change even when market activity for the asset or liability has decreased significantly. Fair value is the price that would be received for an asset sold or paid to transfer a liability in an orderly transaction (that is, not a forced liquidation or distressed sale) between market participants at the measurement date under current market conditions. When observable transactions or quoted prices are not considered orderly, then little, if any, weight should be assigned to the indication of the asset or liability’s fair value. Adjustments to those transactions or prices should be applied to determine the appropriate fair value. The guidance, which was applied prospectively, was effective for interim and annual reporting periods ending after June 15, 2009. The adoption of this FSP at June 30, 2009 did not have a material impact on the Company’s financial condition, results of operations or cash flows.
In August 2009, the FASB amended existing guidance for the fair value measurement of liabilities by clarifying that in circumstances in which a quoted price in an active market for the identical liability is not available, a reporting entity is required to measure fair value using a valuation technique that uses the quoted price of the identical liability when traded as an asset, quoted prices for similar liabilities or similar liabilities when traded as assets, or that is consistent with existing fair value guidance. The amendments in this guidance also clarify that both a quoted price in an active market for the identical liability at the measurement date and the quoted price for the identical liability when traded as an asset in an active market when no adjustments to the quoted price of the asset are required are Level 1 fair value measurements. The guidance was effective for the first reporting period beginning after issuance. The adoption of this update did not have a significant impact to the Company’s financial condition, results of operations or cash flows.
Newly Issued Accounting Standards:
In June 2009, the FASB amended previous guidance relating to transfers of financial assets and eliminates the concept of a qualifying special purpose entity. This guidance must be applied as of the beginning of each reporting entity’s first annual reporting period that begins after November 15, 2009, for interim periods within that first annual reporting period and for interim and annual reporting periods thereafter. This guidance must be applied to transfers occurring on or after the effective date. Additionally, on and after the effective date, the concept of a qualifying special-purpose entity is no longer relevant for accounting purposes. Therefore, formerly qualifying special-purpose entities should be evaluated for consolidation by reporting entities on and after the effective date in accordance with the applicable consolidation guidance. The disclosure provisions were also amended and apply to transfers that occurred both before and after the effective date of this guidance. The adoption of this update will not have a material impact on the Company’s financial condition, results of operations or cash flows.
In June 2009, the FASB amended guidance for consolidation of variable interest entity guidance by replacing the quantitative-based risks and rewards calculation for determining which enterprise, if any, has a controlling financial interest in a variable interest entity with an approach focused on identifying which enterprise has the power to direct the activities of a variable interest entity that most significantly impact the entity’s economic performance and (1) the obligation to absorb losses of the entity or (2) the right to receive benefits from the entity. Additional disclosures about an enterprise’s involvement in variable interest entities are also required. This guidance is effective as of the beginning of each reporting entity’s first annual reporting period that begins after November 15, 2009, for interim periods within that first annual reporting period, and for interim and annual reporting periods thereafter. Early adoption is prohibited. The adoption of this update will not have a material impact on the Company’s financial condition, results of operations or cash flows.
69
BANKFINANCIAL CORPORATION
NOTES TO CONSOLIDATED FINANCIAL STATEMENTS
(Table amounts in thousands, except share and per share data)
NOTE 2 – EARNINGS (LOSS) PER SHARE
Amounts reported in earnings (loss) per share reflect earnings (loss) available to common stockholders for the period divided by the weighted average number of shares of common stock outstanding during the period, exclusive of unearned ESOP shares and unvested restricted stock shares. Stock options and restricted stock are regarded as potential common stock and are considered in the diluted earnings per share calculations to the extent that they would have a dilutive effect if converted to common stock.
| Year Ended December 31, | ||||||||||||
| 2009 | 2008 | 2007 | ||||||||||
| Net income (loss) available to common stockholders |
$ | (738 | ) | $ | (19,389 | ) | $ | 7,155 | ||||
| Average common shares outstanding |
21,471,268 | 21,904,284 | 23,037,710 | |||||||||
| Less: |
||||||||||||
| Unearned ESOP shares |
(1,554,492 | ) | (1,662,519 | ) | (1,765,359 | ) | ||||||
| Unvested restricted stock shares |
(218,702 | ) | (422,870 | ) | (612,764 | ) | ||||||
| Weighted average common shares outstanding |
19,698,074 | 19,818,895 | 20,659,587 | |||||||||
| Basic earnings (loss) per common share |
$ | (0.04 | ) | $ | (0.98 | ) | $ | 0.35 | ||||
| Year Ended December 31, | |||||||||||
| 2009 | 2008 | 2007 | |||||||||
| Net income (loss) available to common stockholders |
$ | (738 | ) | $ | (19,389 | ) | $ | 7,155 | |||
| Weighted average common shares outstanding |
19,698,074 | 19,818,895 | 20,659,587 | ||||||||
| Add - Net effect of dilutive stock options and unvested restricted stock |
— | — | — | ||||||||
| Weighted average dilutive common shares outstanding |
19,698,074 | 19,818,895 | 20,659,587 | ||||||||
| Diluted earnings (loss) per common share |
$ | (0.04 | ) | $ | (0.98 | ) | $ | 0.35 | |||
| Number of antidilutive stock options excluded from the diluted earnings per share calculation |
2,322,603 | 2,327,603 | 1,597,400 | ||||||||
| Weighted average exercise price of anti-dilutive option shares |
$ | 16.51 | $ | 16.51 | $ | 17.40 | |||||
70
BANKFINANCIAL CORPORATION
NOTES TO CONSOLIDATED FINANCIAL STATEMENTS
(Table amounts in thousands, except share and per share data)
NOTE 3 – SECURITIES
The fair value of securities and the related gross unrealized gains and losses recognized in accumulated other comprehensive income (loss) at December 31 is as follows:
| Amortized Cost |
Gross Unrealized Gains |
Gross Unrealized Losses |
Fair Value | ||||||||||
| 2009 |
|||||||||||||
| Municipal securities |
$ | 1,225 | $ | 78 | $ | — | $ | 1,303 | |||||
| Mortgage-backed securities |
33,008 | 1,049 | — | 34,057 | |||||||||
| Collateralized mortgage obligations |
64,791 | 1,873 | (13 | ) | 66,651 | ||||||||
| SBA-guaranteed loan participation certificates |
114 | 1 | — | 115 | |||||||||
| $ | 99,138 | $ | 3,001 | $ | (13 | ) | $ | 102,126 | |||||
| 2008 |
|||||||||||||
| Certificate of deposit |
$ | 500 | $ | — | $ | — | $ | 500 | |||||
| Municipal securities |
1,735 | 76 | — | 1,811 | |||||||||
| Mortgage-backed securities |
41,865 | 281 | (170 | ) | 41,976 | ||||||||
| Collateralized mortgage obligations |
79,425 | 743 | (14 | ) | 80,154 | ||||||||
| SBA-guaranteed loan participation certificates |
131 | — | (6 | ) | 125 | ||||||||
| Equity securities |
2,356 | — | (2,003 | ) | 353 | ||||||||
| $ | 126,012 | $ | 1,100 | $ | (2,193 | ) | $ | 124,919 | |||||
Mortgage-backed securities and collateralized mortgage obligations reflected in the preceding table were issued by U.S. government-sponsored entities and agencies, Freddie Mac, Fannie Mae and Ginnie Mae, and are obligations which the government has affirmed its commitment to support. At December 31, 2008, the equity securities reflected in the preceding table consisted of Freddie Mac preferred stocks. All securities reflected in the preceding table were classified as available-for-sale at December 31, 2009 and 2008.
The fair values of securities at December 31, 2009 by contractual maturity are shown below. Securities not due at a single maturity date are shown separately. Expected maturities may differ from contractual maturities because borrowers may have the right to call or prepay obligations with or without call or prepayment penalties.
| 2009 | ||||||
| Amortized Cost |
Fair Value | |||||
| Due in one year or less |
$ | 550 | $ | 555 | ||
| Due after one year through five years |
675 | 748 | ||||
| 1,225 | 1,303 | |||||
| Mortgage-backed securities |
33,008 | 34,057 | ||||
| Collateralized mortgage obligations |
64,791 | 66,651 | ||||
| SBA-guaranteed loan participation certificates |
114 | 115 | ||||
| Total |
$ | 99,138 | $ | 102,126 | ||
Securities pledged at December 31, 2009 and 2008 had a carrying amount of $75.1 million and $87.6 million, respectively, and the security interests resulting from the pledges secures certain depository relationships, customer repurchase agreements and a line of credit with the Federal Reserve Bank of Chicago.
71
BANKFINANCIAL CORPORATION
NOTES TO CONSOLIDATED FINANCIAL STATEMENTS
(Table amounts in thousands, except share and per share data)
NOTE 3 – SECURITIES (continued)
Sale of securities were as follows:
| 2009 | 2008 | 2007 | |||||||
| Proceeds |
$ | 967 | $ | 1,385 | $ | 399 | |||
| Gross gains |
— | 1,385 | 399 | ||||||
| Gross losses |
988 | — | — | ||||||
Securities with unrealized losses at December 31, 2009 and 2008 not recognized in income are as follows:
| Less than 12 Months | 12 Months or More | Total | ||||||||||||||||
| Fair Value |
Unrealized Loss |
Fair Value |
Unrealized Loss |
Fair Value |
Unrealized Loss | |||||||||||||
| 2009 |
||||||||||||||||||
| Collateralized mortgage obligations |
$ | 1,358 | $ | 13 | $ | — | $ | — | $ | 1,358 | $ | 13 | ||||||
| 2008 |
||||||||||||||||||
| Mortgage-backed securities |
$ | 27,895 | $ | 158 | $ | 833 | $ | 12 | $ | 28,728 | $ | 170 | ||||||
| Collateralized mortgage obligations |
1,129 | 14 | — | — | 1,129 | 14 | ||||||||||||
| SBA-guaranteed loan participation certificates |
125 | 6 | — | — | 125 | 6 | ||||||||||||
| Equity securities |
353 | 2,003 | — | — | 353 | 2,003 | ||||||||||||
| Total temporarily impaired |
$ | 29,502 | $ | 2,181 | $ | 833 | $ | 12 | $ | 30,335 | $ | 2,193 | ||||||
The Company evaluates marketable investment securities with significant declines in fair value on a quarterly basis to determine whether they should be considered other-than-temporarily impaired under current accounting guidance, which generally provides that if a marketable security is in an unrealized loss position, whether due to general market conditions or industry or issuer-specific factors, the holder of the securities must assess whether the impairment is other-than-temporary.
The collateralized mortgage obligations that the Company holds in its investment portfolio remained in an unrealized loss position at December 31, 2009, but the unrealized losses were not considered significant under the Company’s impairment testing methodology. In addition, the Company does not intend to sell these securities, and it is likely that the Company will not be required to sell the securities before their anticipated recovery occurs.
At December 31, 2008, the Company held shares of Freddie Mac preferred stock in its investment portfolio. The securities experienced significant declines in fair value (as measured by quoted market prices for these securities) during the years ended December 31, 2009 and 2008 due to a variety of market conditions and issuer-specific factors, including Freddie Mac’s conservatorship, its issuance of new shares of preferred stock that are senior to all previously issued preferred shares, and its suspension of dividends on all previously issued preferred shares. The Company evaluated these shares of Freddie Mac preferred stock for impairment, and concluded that the unrealized losses that existed at that date with respect to this series of Freddie Mac preferred stock constituted an other-than-temporary impairment under the current accounting guidance. Based on this conclusion, the Company recorded a pre-tax impairment loss of $401,000 and $35.9 million for the years ended December 31, 2009 and 2008. These securities were sold in the fourth quarter of 2009 and the Company recorded a pre-tax loss of $988,000 on the sale.
72
BANKFINANCIAL CORPORATION
NOTES TO CONSOLIDATED FINANCIAL STATEMENTS
(Table amounts in thousands, except share and per share data)
NOTE 4 – LOANS RECEIVABLE
Loans receivable are as follows:
| 2009 | 2008 | |||||||
| One-to-four family residential real estate loans |
$ | 289,623 | $ | 312,390 | ||||
| Multi-family mortgage loans |
329,227 | 305,318 | ||||||
| Nonresidential real estate loans |
316,607 | 342,583 | ||||||
| Construction and land loans |
32,577 | 50,687 | ||||||
| Commercial loans |
88,067 | 92,679 | ||||||
| Commercial leases |
176,821 | 174,644 | ||||||
| Consumer loans |
2,539 | 2,655 | ||||||
| Total loans |
1,235,461 | 1,280,956 | ||||||
| Loans in process |
(73 | ) | (154 | ) | ||||
| Net deferred loan origination costs |
1,701 | 1,912 | ||||||
| Allowance for loan losses |
(18,622 | ) | (14,746 | ) | ||||
| Loans, net |
$ | 1,218,467 | $ | 1,267,968 | ||||
Activity in the allowance for loan losses is as follows:
| 2009 | 2008 | 2007 | ||||||||||
| Beginning of year |
$ | 14,746 | $ | 11,051 | $ | 10,622 | ||||||
| Provision for loan losses |
8,811 | 5,092 | 697 | |||||||||
| Loans charged off |
(5,065 | ) | (1,413 | ) | (305 | ) | ||||||
| Recoveries |
130 | 16 | 37 | |||||||||
| End of year |
$ | 18,622 | $ | 14,746 | $ | 11,051 | ||||||
Individually impaired loans were as follows:
| 2009 | 2008 | |||||
| Year-end loans with allocated allowance for loan losses |
$ | 22,583 | $ | 10,061 | ||
| Year-end loans with no allocated allowance for loan losses |
23,059 | 15,506 | ||||
| Total impaired loans |
$ | 45,642 | $ | 25,567 | ||
| Amount of the allowance for loan losses allocated to impaired loans |
$ | 5,060 | $ | 2,705 | ||
| 2009 | 2008 | 2007 | |||||||
| Average of impaired loans during the year |
$ | 40,520 | $ | 22,944 | $ | 22,090 | |||
| Interest income recognized during impairment |
1,106 | 1,152 | 2,271 | ||||||
| Cash basis interest income recognized |
1,106 | 1,152 | 2,271 | ||||||
73
BANKFINANCIAL CORPORATION
NOTES TO CONSOLIDATED FINANCIAL STATEMENTS
(Table amounts in thousands, except share and per share data)
NOTE 4 – LOANS RECEIVABLE (continued)
Nonaccrual loans and loans past due 90 days still on accrual are as follows:
| 2009 | 2008 | |||||
| Nonaccrual loans |
$ | 49,489 | $ | 13,658 | ||
| 90 days delinquent, still accruing |
148 | 2,673 | ||||
| Reserve for uncollected loan interest |
2,317 | 659 | ||||
Nonaccrual loans and impaired loans are defined differently. Some loans may be included in both categories, and some may only be included in one category. Nonaccrual loans include both smaller balance homogeneous loans that are collectively evaluated for impairment and individually classified impaired loans.
Generally, the Bank utilizes the “90 days delinquent, still accruing” category of loan classification when: (1) the loan is repaid in full shortly after the period end date; (2) the loan is well secured and there are no asserted or pending legal barriers to its collection; or (3) the borrower has remitted all scheduled payments and is otherwise in substantial compliance with the terms of the loan, but the processing of payments actually received or the renewal of a loan has not occurred for administrative reasons.
The Company has $9.6 million of troubled debt restructurings at December 31, 2009, with an allocated $525,000 of specific reserves to those customers. The Company has no outstanding commitments to customers whose loans are classified as troubled debt restructurings.
NOTE 5 – SECONDARY MORTGAGE MARKET ACTIVITIES
First mortgage loans serviced for others are not included in the accompanying consolidated statements of financial condition. The unpaid principal balances of these loans were $274.2 million, $303.9 million, and $337.3 million at December 31, 2009, 2008, and 2007, respectively. Custodial escrow balances maintained in connection with the foregoing loan servicing were $6.4 million, $6.3 million, and $6.1 million at December 31, 2009, 2008, and 2007, respectively.
Capitalized mortgage servicing rights are included in other assets in the accompanying consolidated statements of financial condition. Activity for capitalized mortgage servicing rights and the related valuation allowance was as follows.
| 2009 | 2008 | |||||||
| Servicing rights |
||||||||
| Beginning of year |
$ | 1,940 | $ | 2,161 | ||||
| Additions |
322 | 193 | ||||||
| Amortized to expense |
(482 | ) | (414 | ) | ||||
| End of year |
$ | 1,780 | $ | 1,940 | ||||
| Valuation allowance |
||||||||
| Beginning of year |
$ | 110 | $ | — | ||||
| Additions expensed |
153 | 279 | ||||||
| Reductions credited to expense |
(189 | ) | (169 | ) | ||||
| End of year |
$ | 74 | $ | 110 | ||||
| Carrying value of mortgage servicing rights |
$ | 1,706 | $ | 1,830 | ||||
| Fair value of mortgage servicing rights |
$ | 1,862 | $ | 2,019 | ||||
74
BANKFINANCIAL CORPORATION
NOTES TO CONSOLIDATED FINANCIAL STATEMENTS
(Table amounts in thousands, except share and per share data)
NOTE 5 – SECONDARY MORTGAGE MARKET ACTIVITIES (continued)
The estimated fair value of mortgage servicing rights is the present value of the expected future cash flows over the projected life of the loan. Assumptions used in the present value calculation are based on actual performance of the underlying servicing along with general market consensus. The expected cash flow is the net amount of all mortgage servicing income and expense items. The expected cash flows are discounted at an interest rate appropriate for the associated risk given the current market conditions. Significant assumptions are as follows:
| 2009 | 2008 | |||||||
| Prepayment speed |
16.65 | % | 18.62 | % | ||||
| Discount rate |
12.00 | % | 12.00 | % | ||||
| Average servicing cost per loan |
$ | 58.00 | $ | 57.00 | ||||
| Escrow float rate |
0.60 | % | 0.60 | % | ||||
Key economic assumptions used in measuring the fair value of the Company’s mortgage servicing rights as of December 31, 2009 and the effect on the fair value of our mortgage servicing rights from adverse changes in those assumptions, are as follows:
| Fair value of mortgage servicing rights |
$ | 1,862 | ||
| Weighted average annual prepayment speed |
16.65 | % | ||
| Decrease in fair value from 10% adverse change |
65 | |||
| Decrease in fair value from 20% adverse change |
124 | |||
| Weighted-average annual discount rate |
12.00 | % | ||
| Decrease in fair value from 10% adverse change |
66 | |||
| Decrease in fair value from 20% adverse change |
129 |
These sensitivities are hypothetical and should be used with caution. As the above table indicates, changes in fair value based on variations in individual assumptions generally cannot be used to predict changes in fair value based upon further variations of the same assumptions. Also, the effect of a variation in a particular assumption on the fair value of the retained interest is calculated in the above table independently, without changing any other assumption. In reality, changes in one factor may result in changes in another factor, which might magnify or counteract the sensitivities.
The weighted average amortization period is 47 months. The estimated amortization expense for each of the next five years is as follows:
| 2010 |
$ | 366 | |
| 2011 |
289 | ||
| 2012 |
230 | ||
| 2013 |
185 | ||
| 2014 |
148 |
75
BANKFINANCIAL CORPORATION
NOTES TO CONSOLIDATED FINANCIAL STATEMENTS
(Table amounts in thousands, except share and per share data)
NOTE 6 – PREMISES AND EQUIPMENT
Premises and equipment are as follows:
| 2009 | 2008 | |||||||
| Land and land improvements |
$ | 11,658 | $ | 11,619 | ||||
| Buildings and improvements |
30,825 | 30,184 | ||||||
| Furniture and equipment |
9,426 | 10,367 | ||||||
| Computer equipment |
7,657 | 6,863 | ||||||
| 59,566 | 59,033 | |||||||
| Accumulated depreciation |
(24,952 | ) | (24,468 | ) | ||||
| $ | 34,614 | $ | 34,565 | |||||
Depreciation of premises and equipment was $3.0 million, for the year ended December 31, 2009 and $2.6 million, for the years ended December 31, 2008 and 2007.
The Company leases certain branch facilities under noncancelable operating lease agreements expiring through 2032. Rent expense, net of sublease income, for facilities was $519,000, $452,000, and $378,000 in 2009, 2008, and 2007, respectively, excluding taxes, insurance, and maintenance. The projected minimum rental under existing leases, not including taxes, insurance, and maintenance, as of December 31, 2009 is as follows:
| 2010 |
$ | 533 | |
| 2011 |
468 | ||
| 2012 |
469 | ||
| 2013 |
459 | ||
| 2014 |
422 | ||
| Thereafter |
6,982 | ||
| Total |
$ | 9,333 | |
The Company has subleased some of these branch facilities and currently is entitled to receive income as follows:
| 2010 |
$ | 30 | |
| 2011 |
17 | ||
| 2012 |
4 | ||
| 2013 |
4 | ||
| 2014 |
4 | ||
| Total |
$ | 59 | |
76
BANKFINANCIAL CORPORATION
NOTES TO CONSOLIDATED FINANCIAL STATEMENTS
(Table amounts in thousands, except share and per share data)
NOTE 7 – CORE DEPOSIT INTANGIBLE
Core deposit intangible assets were as follows:
| 2009 | 2008 | |||||||||||
| Gross Carrying Amount |
Accumulated Amortization |
Gross Carrying Amount |
Accumulated Amortization | |||||||||
| Amortized intangible assets - core deposit intangibles |
$ | 18,612 | $ | 14,317 | $ | 18,612 | $ | 12,627 | ||||
Aggregate amortization expense was $1.7 million, $1.8 million and $1.9 million for 2009, 2008 and 2007, respectively.
Estimated amortization expense for each of the next five years is as follows:
| 2010 |
$ | 1,595 | |
| 2011 |
1,404 | ||
| 2012 |
252 | ||
| 2013 |
225 | ||
| 2014 |
198 |
NOTE 8 – DEPOSITS
Year-end deposits are as follows:
| 2009 | 2008 | |||||
| Non-interest-bearing demand deposits |
$ | 108,308 | $ | 109,056 | ||
| Savings deposits |
96,107 | 94,802 | ||||
| Money market accounts |
322,126 | 205,768 | ||||
| Interest-bearing NOW accounts |
303,219 | 285,737 | ||||
| Certificates of deposit |
403,635 | 374,492 | ||||
| $ | 1,233,395 | $ | 1,069,855 | |||
Certificates of deposit of $100,000 or more were $141.1 million and $125.4 million at year-end 2009 and 2008, respectively.
Scheduled maturities of certificates of deposit for the next five years are as follows:
| 2010 |
$ | 327,577 | |
| 2011 |
59,070 | ||
| 2012 |
6,808 | ||
| 2013 |
3,880 | ||
| 2014 |
6,300 |
77
BANKFINANCIAL CORPORATION
NOTES TO CONSOLIDATED FINANCIAL STATEMENTS
(Table amounts in thousands, except share and per share data)
NOTE 8 – DEPOSITS (continued)
Interest expense on deposit accounts is summarized as follows for the years indicated:
| 2009 | 2008 | 2007 | |||||||
| Savings deposits |
$ | 495 | $ | 715 | $ | 833 | |||
| Money market accounts |
4,503 | 5,397 | 11,072 | ||||||
| Interest-bearing NOW accounts |
2,178 | 4,844 | 6,838 | ||||||
| Certificates of deposit |
11,325 | 11,077 | 14,703 | ||||||
| $ | 18,501 | $ | 22,033 | $ | 33,446 | ||||
NOTE 9 – BORROWINGS
Borrowed funds are summarized as follows:
| December 31, 2009 | December 31, 2008 | |||||||||||||||||
| Contractual Interest Rate Range |
Weighted Average Contractual Rate |
Amount | Weighted Average Contractual Rate |
Amount | ||||||||||||||
| Fixed-rate advance from FHLBC due: |
||||||||||||||||||
| Within 1 year |
1.60 | % | 3.91 | % | 2.79 | % | $ | 27,550 | 1.35 | % | $ | 95,450 | ||||||
| 1 to 2 years |
2.14 | 3.76 | 2.81 | 13,000 | 2.96 | 24,050 | ||||||||||||
| 2 to 3 years |
— | — | — | — | 3.38 | 7,000 | ||||||||||||
| 4 to 5 years |
2.99 | 2.99 | 2.99 | 3,000 | — | — | ||||||||||||
| Total fixed-rate advances |
1.60 | 3.91 | 2.81 | 43,550 | 1.77 | 126,500 | ||||||||||||
| Adjustable-rate advance from FHLBC due: |
||||||||||||||||||
| Within 1 year |
— | — | — | — | 0.55 | 25,000 | ||||||||||||
| Open Line advance, due on demand |
— | — | — | — | 0.70 | 37,400 | ||||||||||||
| Total FHLBC funds |
1.60 | 3.91 | 2.81 | 43,550 | 1.40 | 188,900 | ||||||||||||
| Securities sold under agreements to repurchase |
0.25 | 0.25 | 0.25 | 7,234 | 0.25 | 11,450 | ||||||||||||
| Total borrowings |
0.25 | % | 3.91 | % | 2.44 | % | $ | 50,784 | 1.33 | % | $ | 200,350 | ||||||
In December 2008, the Bank elected to pursue certain balance sheet restructuring strategies as a result of the historically low interest rate environment. The restructuring consisted of retiring a $25.0 million of FHLBC term advance and replacing it with a new FHLBC advance with an adjustable interest rate and a maturity of approximately one month. The Company incurred a net pre-tax prepayment penalty and recognized an immediate loss of $2.0 million on the early extinguishment of borrowings, in accordance with Emerging Issues Task Force 96-19, Debtor's Accounting for a Modification or Exchange of Debt Instruments. Certain of the Company’s existing borrowings would be subject to prepayment penalties should they be repaid prior to maturity. There were no prepayment penalties recorded in 2009 and 2007.
The Company maintains a collateral pledge agreement covering secured advances whereby the Company has agreed to at all times keep on hand, free of all other pledges, liens, and encumbrances, specifically identified whole first mortgages on improved residential property not more than 90-days delinquent to secure advances from the FHLBC. All of the Bank’s FHLBC common stock is pledged as additional collateral for these advances. At December 31, 2009, $184.9 million and $117.6 million of first mortgage and multi-family mortgage loans, respectively, collateralized the advances. At December 31, 2009, we had the ability to borrow an additional $257.9 million under our credit facilities with the FHLBC. The Company also had available pre-approved overnight federal funds borrowing and repurchase agreement lines. At December 31, 2009 and 2008, there was no outstanding balance on these lines.
78
BANKFINANCIAL CORPORATION
NOTES TO CONSOLIDATED FINANCIAL STATEMENTS
(Table amounts in thousands, except share and per share data)
NOTE 10 – INCOME TAXES
The income tax expense (benefit) is as follows:
| 2009 | 2008 | 2007 | ||||||||||
| Current |
$ | (8,867 | ) | $ | 2,348 | $ | 3,401 | |||||
| Deferred |
8,854 | (14,396 | ) | (438 | ) | |||||||
| Total income tax expense (benefit) |
$ | (13 | ) | $ | (12,048 | ) | $ | 2,963 | ||||
A reconciliation of the provision for income taxes computed at the statutory federal corporate tax rate of 34% for 2009, 2008 and 2007 to the income tax expense in the consolidated statements of operations follows:
| 2009 | 2008 | 2007 | ||||||||||
| Provision computed at the statutory federal tax rate |
$ | (256 | ) | $ | (10,689 | ) | $ | 3,440 | ||||
| State taxes and other, net |
(47 | ) | (1,360 | ) | (26 | ) | ||||||
| Bank owned life insurance |
7 | (199 | ) | (199 | ) | |||||||
| ESOP/Share based compensation |
309 | 442 | 317 | |||||||||
| Dividends received deduction |
— | (242 | ) | (569 | ) | |||||||
| $ | (13 | ) | $ | (12,048 | ) | $ | 2,963 | |||||
| Effective income tax rate |
1.86 | % | 38.33 | % | 29.29 | % | ||||||
Retained earnings at December 31, 2009 and 2008 include $14.9 million for which no deferred federal income tax liability has been recorded. This amount represents an allocation of income to bad debt deductions for tax purposes alone.
79
BANKFINANCIAL CORPORATION
NOTES TO CONSOLIDATED FINANCIAL STATEMENTS
(Table amounts in thousands, except share and per share data)
NOTE 10 – INCOME TAXES (continued)
The net deferred tax asset is as follows:
| 2009 | 2008 | |||||||
| Gross Deferred tax assets: |
||||||||
| Allowance for loan losses |
$ | 7,049 | $ | 5,618 | ||||
| Alternative minimum tax, general business credit and net operating loss carryforwards |
6,869 | — | ||||||
| Capital loss carryforwards |
— | 340 | ||||||
| Impairment of securities |
— | 17,045 | ||||||
| Unrealized loss on securities |
— | 416 | ||||||
| Non-qualified stock options |
772 | 634 | ||||||
| Other |
840 | 588 | ||||||
| 15,530 | 24,641 | |||||||
| Gross Deferred tax liabilities: |
||||||||
| Net deferred loan origination costs |
(1,434 | ) | (1,461 | ) | ||||
| FHLBC stock dividends |
(1,785 | ) | (1,796 | ) | ||||
| Purchase accounting adjustments |
(1,393 | ) | (1,922 | ) | ||||
| Accumulated depreciation |
(994 | ) | (523 | ) | ||||
| Mortgage servicing rights |
(646 | ) | (697 | ) | ||||
| Goodwill |
(1,069 | ) | (789 | ) | ||||
| Other |
(510 | ) | (484 | ) | ||||
| Unrealized gain on securities |
(1,138 | ) | — | |||||
| (8,969 | ) | (7,672 | ) | |||||
| Net deferred tax asset |
$ | 6,561 | $ | 16,969 | ||||
At December 31, 2009, the Company had a federal net operating loss carryforward of $6.3 million which will expire in 2029. At December 31, 2009, the Company had a state net operating loss carryforward for the State of Illinois of $32.0 million which will expire in 2021. Based upon projections of future taxable income, management believes that it is more likely than not that the deferred tax assets reflected in the above table will be fully realized and thus a valuation allowance is not needed.
Unrecognized Tax Benefits
A reconciliation of the beginning and ending amount of unrecognized tax benefits is as follows:
| 2009 | 2008 | |||||||
| Beginning of year |
$ | 173 | $ | 108 | ||||
| Additions based on tax positions related to the current year |
8 | 63 | ||||||
| Additions for tax positions of prior years |
13 | 25 | ||||||
| Reductions due to the statute of limitations |
(29 | ) | (23 | ) | ||||
| End of year |
$ | 165 | $ | 173 | ||||
80
BANKFINANCIAL CORPORATION
NOTES TO CONSOLIDATED FINANCIAL STATEMENTS
(Table amounts in thousands, except share and per share data)
NOTE 10 – INCOME TAXES (continued)
The Company does not expect the total amount of unrecognized tax benefits to significantly increase or decrease in the next twelve months.
The total amount of interest and penalties recorded in the statement of operations for the year ended December 31, 2009, 2008 and 2007 was $2,000, $5,000, and $25,000, respectively. The amount accrued for interest and penalties at December 31, 2009 and 2008 was $27,000 and $25,000, respectively.
The Company and its subsidiary are subject to U.S. federal income tax as well as income tax of the State of Illinois. The Company is no longer subject to examination by these taxing authorities for years before 2006. Beginning in 2009, the Company and its subsidiary are subject to income taxes in the State of New Jersey.
NOTE 11 – REGULATORY MATTERS
The Bank is subject to regulatory capital requirements administered by the federal banking agencies. Failure to meet minimum capital requirements can initiate certain mandatory—and possibly additional discretionary—actions by regulators that, if undertaken, could have a direct material effect on the Company's financial statements. Under capital adequacy guidelines and the regulatory framework for prompt corrective action, the Bank must meet specific capital guidelines that involve quantitative measures of the Bank's assets, liabilities, and certain off-balance-sheet items as calculated under regulatory accounting practices. The Bank's capital amounts and classification are also subject to qualitative judgments by regulators about components, risk weightings, and other factors.
The prompt corrective action regulations provide five classifications, including well capitalized, adequately capitalized, undercapitalized, significantly undercapitalized, and critically undercapitalized, although these terms are not used to represent overall financial condition. If only adequately capitalized, regulatory approval is required to accept brokered deposits. If undercapitalized, capital distributions, asset growth and expansion are limited, and the submission of a capital restoration is required.
At year-end, actual capital levels and minimum required levels for the Bank were:
| Actual | Minimum Required for Capital Adequacy Purposes |
Minimum Required to Be Well Capitalized Under Prompt Corrective Action Provisions |
||||||||||||||||
| Amount | Ratio | Amount | Ratio | Amount | Ratio | |||||||||||||
| December 31, 2009 |
||||||||||||||||||
| Total capital (to risk- weighted assets) |
$ | 204,661 | 16.40 | % | $ | 99,857 | 8.00 | % | $ | 124,821 | 10.00 | % | ||||||
| Tier 1 (core) capital (to risk-weighted assets) |
191,099 | 15.31 | 49,929 | 4.00 | 74,893 | 6.00 | ||||||||||||
| Tier 1 (core) capital (to adjusted total assets) |
191,099 | 12.44 | 61,446 | 4.00 | 76,808 | 5.00 | ||||||||||||
| December 31, 2008 |
||||||||||||||||||
| Total capital (to risk- weighted assets) |
$ | 195,961 | 14.69 | % | $ | 106,728 | 8.00 | % | $ | 133,410 | 10.00 | % | ||||||
| Tier 1 (core) capital (to risk-weighted assets) |
183,920 | 13.79 | 53,364 | 4.00 | 80,046 | 6.00 | ||||||||||||
| Tier 1 (core) capital (to adjusted total assets) |
183,920 | 12.08 | 60,921 | 4.00 | 76,151 | 5.00 | ||||||||||||
81
BANKFINANCIAL CORPORATION
NOTES TO CONSOLIDATED FINANCIAL STATEMENTS
(Table amounts in thousands, except share and per share data)
NOTE 11 – REGULATORY MATTERS (continued)
A reconciliation of the Bank’s equity under GAAP to regulatory capital is as follows:
| 2009 | 2008 | |||||||
| GAAP equity |
$ | 220,135 | $ | 214,706 | ||||
| Disallowed goodwill and other intangible assets |
(24,878 | ) | (26,326 | ) | ||||
| Disallowed servicing assets and deferred tax asset |
(2,308 | ) | (5,136 | ) | ||||
| Accumulated loss (gain) on securities |
(1,850 | ) | 676 | |||||
| Tier 1 capital |
191,099 | 183,920 | ||||||
| General regulatory loan loss reserves |
13,562 | 12,041 | ||||||
| Total regulatory capital |
$ | 204,661 | $ | 195,961 | ||||
As of December 31, 2009 the most recent notification from the Office of Thrift Supervision categorized the Bank as well capitalized under the regulatory framework for prompt corrective action. There are no conditions or events since that notification that management believes have changed the institution’s category.
Federal regulations require the Bank to comply with a Qualified Thrift Lender (“QTL”) test, which generally requires that 65% of assets be maintained in housing-related finance and other specified assets. If the QTL test is not met, limits are placed on growth, branching, new investment, FHLBC advances, and dividends or the institution must convert to a commercial bank charter. Management considers the QTL test to have been met as of December 31, 2009.
The Bank is subject to restrictions on the amount of dividends it may declare without prior regulatory approval. At December 31, 2009, the Bank does not have pre-approved approval for future dividends.
NOTE 12 – EMPLOYEE BENEFIT PLANS
Employee Stock Ownership Plan Employees are eligible to participate in the ESOP after attainment of age 21 and completion of one year of service. In connection with the conversion and reorganization, the ESOP borrowed $19.6 million from the Company, and used the proceeds of the loan to purchase 1,957,300 shares of common stock issued in the subscription offering at $10.00 per share. The loan is secured by the shares and will be repaid by the ESOP with funds from the Bank’s discretionary contributions to the ESOP and earnings on ESOP assets. The Bank has committed to make discretionary contributions to the ESOP sufficient to service the loan over a period not to exceed 20 years. When loan payments are made, ESOP shares are allocated to participants based on relative compensation and expense is recorded. Participants receive their earned shares at the end of employment.
Contributions to the ESOP during 2009 and 2008 were $1.9 million each year, including dividends and interest received on unallocated shares of $453,000 and $486,000 in 2009 and 2008, respectively. Expense related to the ESOP, net of dividends and interest received on unallocated ESOP shares, was $516,000, $512,000 and $1.0 million for the years ended December 31, 2009, 2008 and 2007, respectively.
Shares held by the ESOP were as follows:
| 2009 | 2008 | |||||||
| Allocated to participants |
432,420 | 340,813 | ||||||
| Distributed to participants |
(12,614 | ) | (6,258 | ) | ||||
| Unearned |
1,516,907 | 1,614,772 | ||||||
| Total ESOP shares |
1,936,713 | 1,949,327 | ||||||
| Fair value of unearned shares |
$ | 15,017 | $ | 16,455 | ||||
82
BANKFINANCIAL CORPORATION
NOTES TO CONSOLIDATED FINANCIAL STATEMENTS
(Table amounts in thousands, except share and per share data)
NOTE 12 – EMPLOYEE BENEFIT PLANS (continued)
Profit Sharing Plan/401(k) Plan. The Company has a defined contribution plan (“profit sharing plan”) covering all of its eligible employees. Employees are eligible to participate in the profit sharing plan after attainment of age 21 and completion of one year of service. The Company provides a dollar-for-dollar match on contributions made prior to March 31, 2007 on contributions up to 5% of eligible compensation, and a match of $0.50 on each $1.00 of contribution up to 6% of eligible compensation beginning April 1, 2007. The Company may also contribute an additional amount annually at the discretion of the Board of Directors. Contributions totaling $376,000, $442,000, and $566,000 were made for the years ended 2009, 2008, and 2007, respectively.
NOTE 13 – EQUITY INCENTIVE PLANS
On June 27, 2006, the Company’s stockholders approved the BankFinancial Corporation 2006 Equity Incentive Plan, which authorized the Human Resources Committee of the Board of Directors of the Company to grant a variety of cash- and equity-based incentive awards, including stock options, stock appreciation rights, restricted stock, performance shares and other incentive awards, to employees and directors aggregating up to 3,425,275 shares of the Company’s common stock.
The Human Resources Committee may grant stock options to purchase shares of the Company’s common stock to certain employees and directors of the Company. The exercise price for the stock options is the fair market value of the common stock on the dates of the grants. The stock options generally vest annually over three to five year periods; vesting is subject to acceleration in certain circumstances. The stock options will expire if not exercised within five years from the date of grant.
The fair value of each option award is estimated on the date of grant using a closed form option valuation (Black-Scholes) model that uses the assumptions noted in the table below. The risk-free interest rate was determined using the yield available on the option grant date for a zero-coupon U.S. Treasury security with a term equivalent to the expected life of the option. The expected life for options granted represents the period the option is expected to be outstanding and was determined by applying the simplified method as allowed by SAB 107. The expected volatility for options issued in 2008 was determined using the Company’s historical data. Estimated forfeitures were assumed to be zero due to the lack of historical experience for the Company. There were no options granted in 2009.
The Company estimated the grant date fair value of options awarded in 2008 using the Black-Scholes Option-Pricing model with the following assumptions:
| 2008 Assumptions |
||||
| Risk-free interest rate |
2.00 | % | ||
| Expected option life (years) |
1.84 | |||
| Expected stock price volatility |
21.71 | % | ||
| Current quarterly cash dividend |
$ | 0.07 | ||
| Projected dividend growth |
5.00 | % | ||
| Weighted average fair value of options granted during year |
$ | 0.541 | ||
83
BANKFINANCIAL CORPORATION
NOTES TO CONSOLIDATED FINANCIAL STATEMENTS
(Table amounts in thousands, except share and per share data)
NOTE 13 – EQUITY INCENTIVE PLANS (continued)
The Company recognized $406,000, $594,000 and $498,000 of stock-based compensation expenses relating to the granting of stock options for the years ended December 31, 2009, 2008 and 2007, respectively. As of December 31, 2009, the Company had $379,000 of total unrecognized compensation cost related to unvested stock options. The cost is expected to be recognized over a weighted average period of 1.0 years as follows:
| 2010 |
$ | 364 | |
| 2011 |
15 |
| Stock Options |
Number of Shares |
Weighted Average Exercise Price |
Weighted Average Remaining Contractual Term (in years) |
Aggregate Intrinsic Value (1) | ||||||||
| Stock options outstanding at December 31, 2007 |
1,597,400 | $ | 17.40 | 3.9 | $ | — | ||||||
| Stock options granted |
756,403 | 14.82 | ||||||||||
| Stock options exercised |
— | — | ||||||||||
| Stock options expired |
(7,200 | ) | (16.47 | ) | ||||||||
| Stock options forfeited |
(19,000 | ) | (16.27 | ) | ||||||||
| Stock options outstanding at December 31, 2008 |
2,327,603 | $ | 16.51 | 2.8 | $ | — | ||||||
| Stock options granted |
— | — | ||||||||||
| Stock options exercised |
— | — | ||||||||||
| Stock options expired |
(2,000 | ) | (16.00 | ) | ||||||||
| Stock options forfeited |
(3,000 | ) | (16.00 | ) | ||||||||
| Stock options outstanding at December 31, 2009 |
2,322,603 | $ | 16.51 | 1.9 | $ | — | ||||||
| Stock options exercisable at December 31, 2009 |
1,995,783 | $ | 16.43 | 1.9 | $ | — | ||||||
| Fully vested and expected to vest |
2,322,603 | $ | 16.51 | 1.9 | $ | — | ||||||
| (1) | Stock option aggregate intrinsic value represents the number of shares subject to options multiplied by the difference (if positive) in the closing market price of the common stock underlying the options on the date shown and the weighted average exercise price. |
The Human Resources Committee of the Board of Directors may grant shares of restricted stock to certain employees and directors of the Company. The awards generally vest annually over varying periods from three to five years and vesting is subject to acceleration in certain circumstances. The cost of such awards will be accrued ratably as compensation expense over such respective periods based on expected vesting dates. The Company recognized $2.2 million, $3.5 million and $3.6 million of expenses relating to the grant of shares of restricted stock during the years ended December 31, 2009, 2008 and 2007, respectively. As of December 31, 2009 and 2008, the total unrecognized compensation cost related to unvested shares of restricted stock was $1.8 million and $3.9 million, respectively. The remaining cost is expected to be recognized in 2010.
84
BANKFINANCIAL CORPORATION
NOTES TO CONSOLIDATED FINANCIAL STATEMENTS
(Table amounts in thousands, except share and per share data)
NOTE 13 – EQUITY INCENTIVE PLANS (continued)
| Restricted Stock |
Number of Shares (1) |
Weighted Average Fair Value at Grant Date |
Weighted Average Term to Vest (in years) |
Aggregate Intrinsic Value (2) | ||||||||
| Shares outstanding at December 31, 2007 |
435,150 | $ | 17.57 | 1.8 | $ | 6,884 | ||||||
| Shares granted |
— | — | ||||||||||
| Shares vested |
(195,450 | ) | (17.58 | ) | ||||||||
| Shares forfeited |
(600 | ) | (17.69 | ) | ||||||||
| Shares outstanding at December 31, 2008 |
239,100 | $ | 17.56 | 1.5 | $ | 2,436 | ||||||
| Shares granted |
— | — | ||||||||||
| Shares vested |
(130,450 | ) | (17.57 | ) | ||||||||
| Shares forfeited |
— | — | ||||||||||
| Shares outstanding at December 31, 2009 |
108,650 | $ | 17.56 | 1.0 | $ | 1,076 | ||||||
| (1) | The end of period balances consist only of unvested shares. |
| (1) | Restricted stock aggregate intrinsic value represents the number of shares of restricted stock multiplied by the market price of the common stock underlying the outstanding shares on the date shown. |
NOTE 14 – LOAN COMMITMENTS AND OTHER OFF-BALANCE SHEET ACTIVITIES
The Company is party to various financial instruments with off-balance-sheet risk. The Company uses these financial instruments in the normal course of business to meet the financing needs of customers and to effectively manage exposure to interest rate risk. These financial instruments include commitments to extend credit, standby letters of credit, unused lines of credit, and commitments to sell loans. When viewed in terms of the maximum exposure, those instruments may involve, to varying degrees, elements of credit and interest rate risk in excess of the amount recognized in the consolidated statements of financial condition. Credit risk is the possibility that a counterparty to a financial instrument will be unable to perform its contractual obligations. Interest rate risk is the possibility that, due to changes in economic conditions, the Company’s net interest income will be adversely affected.
The following is a summary of the contractual or notional amount of each significant class of off-balance-sheet financial instruments outstanding. The Company’s exposure to credit loss in the event of nonperformance by the counterparty for commitments to extend credit, standby letters of credit, and unused lines of credit is represented by the contractual notional amount of these instruments.
The contractual or notional amounts are as follows:
| 2009 | 2008 | |||||
| Financial instruments wherein contractual amounts represent credit risk |
||||||
| Commitments to extend credit |
$ | 11,221 | $ | 39,961 | ||
| Standby letters of credit |
2,170 | 2,224 | ||||
| Unused lines of credit |
149,815 | 164,908 | ||||
| Commitments to sell mortgages |
1,313 | 8,471 | ||||
Commitments to extend credit are generally made for periods of 60 days or less. The fixed-rate loans commitment totaled $2.3 million with interest rates ranging from 4.50% to 6.63% and maturities ranging from one to 30 years.
85
BANKFINANCIAL CORPORATION
NOTES TO CONSOLIDATED FINANCIAL STATEMENTS
(Table amounts in thousands, except share and per share data)
NOTE 14 – LOAN COMMITMENTS AND OTHER OFF-BALANCE SHEET ACTIVITIES (continued)
Since many of the commitments are expected to expire without being drawn upon, the total commitment amounts do not necessarily represent future cash requirements. The Company evaluates each customer’s creditworthiness on a case-by-case basis. The amount of collateral obtained, if it is deemed necessary by the Company upon extension of credit, is based on management’s credit evaluation of the customers. The collateral held varies, but primarily consists of single-family residential real estate.
The Bank, as a member of Visa USA, received 51,404 unrestricted shares of Visa, Inc. Class B common stock in connection with Visa, Inc.’s initial public offering in 2007, and 32,398 additional shares of Class B common stock that were deposited into a litigation escrow that Visa, Inc. established under its retrospective responsibility plan. The retroactive responsibility plan obligates all former Visa USA members to indemnify Visa USA, in proportion to their equity interests in Visa USA, for certain litigation losses and expenses, including settlement expenses, for the lawsuits covered by the retrospective responsibility plan. The primary method for discharging the indemnification obligations under the retrospective responsibility plan is a reduction of the ratio at which the Visa, Inc. Class B shares held in the litigation escrow can be converted into publicly traded Class A common shares of Visa, Inc. Due to the restrictions that the retrospective responsibility plan imposes on the Company’s Visa, Inc. Class B shares, the Company has not recorded the Class B shares as an asset.
NOTE 15 – FAIR VALUE
Fair value is the exchange price that would be received for an asset or paid to transfer a liability (exit price) in the principal or most advantageous market for the asset or liability in an orderly transaction between market participants on the measurement date. There are three levels of inputs that may be used to measure fair values:
| • | Level 1 – Quoted prices (unadjusted) for identical assets or liabilities in active markets that the entity has the ability to access as of the measurement date. |
| • | Level 2 – Significant other observable inputs other than Level 1 prices such as quoted prices for similar assets or liabilities; quoted prices in markets that are not active; or other inputs that are observable or can be corroborated by observable market data. |
| • | Level 3 – Significant unobservable inputs that reflect a company’s own assumptions about the assumptions that market participants would use in pricing an asset or liability. |
The Company used the following methods and significant assumptions to estimate the fair value of each type of financial instrument:
The fair values of marketable equity securities are generally determined by quoted prices, in active markets, for each specific security (Level 1 measurement inputs). If Level 1 measurement inputs are not available for a marketable equity security, we determine its fair value based on the quoted price of a similar security traded in an active market (Level 2 measurement inputs). The fair values of debt securities are generally determined by matrix pricing, which is a mathematical technique widely used in the industry to value debt securities without relying exclusively on quoted prices for the specific securities, but rather by relying on the securities’ relationship to other benchmark quoted securities (Level 2 measurement inputs).
The fair values of loans held for sale are generally determined by quoted prices in active markets that are accessible at the measurement date for similar, unrestricted assets (Level 2 measurement inputs).
Impaired loans and real estate owned properties are evaluated and valued at the time the loan is identified as impaired or placed into real estate owned, at the lower of cost or market value. Market value is measured based on the value of the collateral securing these loans and is classified at a Level 2 in the fair value hierarchy. Collateral may be real estate and/or business assets, including equipment, inventory and/or accounts receivable, and its fair value is generally determined based on real estate appraisals or other independent evaluations by qualified professionals. Impaired loans are reviewed and evaluated on at least a quarterly basis for additional impairment and adjusted accordingly, based on the same factors identified above.
86
BANKFINANCIAL CORPORATION
NOTES TO CONSOLIDATED FINANCIAL STATEMENTS
(Table amounts in thousands, except share and per share data)
NOTE 15 – FAIR VALUE (continued)
The fair values of mortgage servicing rights are based on a valuation model that calculates the present value of estimated net servicing income. The valuation model incorporates assumptions that market participants would use in estimating future net servicing income. The Company is able to compare the valuation model inputs and results to widely available published industry data for reasonableness (Level 2 measurement inputs).
The following table sets forth the Company’s financial assets that were accounted for at fair value and are classified in their entirety based on the lowest level of input that is significant to the fair value measurement.
| Fair Value Measurements Using | |||||||||||||||
| Amortized Cost |
Fair Value | Quoted Prices in Active Markets for Identical Assets (Level 1) |
Significant Observable Inputs (Level 2) |
Significant Unobservable Inputs (Level 3) | |||||||||||
| December 31, 2009 |
|||||||||||||||
| Securities: |
|||||||||||||||
| Municipal securities |
$ | 1,225 | $ | 1,303 | $ | — | $ | 1,303 | $ | — | |||||
| Mortgage-backed securities |
33,008 | 34,057 | — | 34,057 | — | ||||||||||
| Collateralized mortgage obligations |
64,791 | 66,651 | — | 66,651 | — | ||||||||||
| SBA-guaranteed loan participation certificates |
114 | 115 | — | 115 | — | ||||||||||
| $ | 99,138 | $ | 102,126 | $ | — | $ | 102,126 | $ | — | ||||||
| December 31, 2008 |
|||||||||||||||
| Securities: |
|||||||||||||||
| Certificate of deposit |
$ | 500 | $ | 500 | $ | — | $ | 500 | $ | — | |||||
| Municipal securities |
1,735 | 1,811 | 1,811 | ||||||||||||
| Mortgage-backed securities |
41,865 | 41,976 | — | 41,976 | — | ||||||||||
| Collateralized mortgage obligations |
79,425 | 80,154 | — | 80,154 | — | ||||||||||
| SBA-guaranteed loan participation certificates |
131 | 125 | — | 125 | — | ||||||||||
| Equity securities |
2,356 | 353 | 353 | — | — | ||||||||||
| $ | 126,012 | $ | 124,919 | $ | 353 | $ | 124,566 | $ | — | ||||||
87
BANKFINANCIAL CORPORATION
NOTES TO CONSOLIDATED FINANCIAL STATEMENTS
(Table amounts in thousands, except share and per share data)
NOTE 15 – FAIR VALUE (continued)
The Company’s assets that were measured at fair value on a non-recurring basis are as follows:
| Fair Value Measurements Using | ||||||||||||
| Fair Value |
Quoted Prices in Active Markets for Identical Assets (Level 1) |
Significant Observable Inputs (Level 2) |
Significant Unobservable Inputs (Level 3) | |||||||||
| December 31, 2009 |
||||||||||||
| Impaired loans |
$ | 22,583 | $ | — | $ | 22,583 | $ | — | ||||
| Real estate owned |
1,118 | — | 1,118 | — | ||||||||
| Mortgage servicing rights |
377 | — | 377 | — | ||||||||
| December 31, 2008 |
||||||||||||
| Impaired loans |
$ | 10,061 | $ | — | $ | 10,061 | $ | — | ||||
| Real estate owned |
204 | — | 204 | — | ||||||||
| Mortgage servicing rights |
1,093 | — | 1,093 | — | ||||||||
Impaired loans, which are measured for impairment using the fair value of the collateral for collateral-dependent loans, had a carrying amount of $45.6 million, with a valuation allowance of $5.1 million at December 31, 2009, compared to a carrying amount of $25.6 million, with a valuation allowance of $2.7 million at December 31, 2008, resulting in a provision for loan losses of $2.4 million for the year ended December 31, 2009.
Real estate owned which are carried at lower of cost or fair value less cost to sell, had a carrying amount of $4.1 million at December 31, 2009, which included write downs of $687,000 for the year ended December 31, 2009 compared to $955,000 at December 31, 2008, which included write downs of $171,000 for the year ended December 31, 2008.
Mortgage servicing rights, which are carried at lower of cost or fair value, had a carrying amount of $1.7 million at December 31, 2009, comprised of $1.3 million on fixed rate loans and $451,000 on adjustable rate loans, including a valuation allowance of $74,000 on mortgage servicing rights of the fixed rate loans. A pre-tax recovery of $36,000 was included in net loss as a reduction to the reserve on our mortgage servicing rights portfolio for the year ended December 31, 2009 compared to a pre-tax charge of $110,000 was included in net loss as an additional reserve on our mortgage servicing rights portfolio for the years ended December 31, 2008.
88
BANKFINANCIAL CORPORATION
NOTES TO CONSOLIDATED FINANCIAL STATEMENTS
(Table amounts in thousands, except share and per share data)
NOTE 15 – FAIR VALUE (continued)
The carrying amount and estimated fair value of financial instruments is as follows:
| 2009 | 2008 | |||||||||||||||
| Carrying Amount |
Estimated Fair Value |
Carrying Amount |
Estimated Fair Value |
|||||||||||||
| Financial assets |
||||||||||||||||
| Cash and cash equivalents |
$ | 108,198 | $ | 108,198 | $ | 29,329 | $ | 29,329 | ||||||||
| Securities |
102,126 | 102,126 | 124,919 | 124,919 | ||||||||||||
| Loans held-for-sale |
— | — | 872 | 890 | ||||||||||||
| Loans receivable, net of allowance for loan losses |
1,218,467 | 1,221,098 | 1,267,968 | 1,289,867 | ||||||||||||
| FHLBC stock |
15,598 | N/A | 15,598 | N/A | ||||||||||||
| Accrued interest receivable |
6111 | 6,111 | 6,732 | 6,732 | ||||||||||||
| Mortgage servicing rights |
1,706 | 1,862 | 1,830 | 2,019 | ||||||||||||
| Financial liabilities |
||||||||||||||||
| Non-interest-bearing demand deposits |
$ | (108,308 | ) | $ | (108,308 | ) | $ | (109,056 | ) | $ | (109,056 | ) | ||||
| Savings deposits |
(96,107 | ) | (96,107 | ) | (94,802 | ) | (94,802 | ) | ||||||||
| NOW and money market accounts |
(625,345 | ) | (625,345 | ) | (491,505 | ) | (491,505 | ) | ||||||||
| Certificates of deposit |
(403,635 | ) | (407,693 | ) | (374,492 | ) | (379,257 | ) | ||||||||
| Borrowings |
(50,784 | ) | (51,573 | ) | (200,350 | ) | (201,814 | ) | ||||||||
| Accrued interest payable |
(535 | ) | (535 | ) | (745 | ) | (745 | ) | ||||||||
For purposes of the above, the following assumptions were used:
Cash and Cash Equivalents: The estimated fair values for cash and cash equivalents are based on their carrying value due to the short-term nature of these assets.
Loans: The estimated fair value for loans has been determined by calculating the present value of future cash flows based on the current rate the Company would charge for similar loans with similar maturities, applied for an estimated time period until the loan is assumed to be repriced or repaid. The estimated fair values of loans held-for-sale are based on quoted market prices.
FHLBC Stock: It is not practicable to determine the fair value of FHLBC stock due to the restrictions placed on its transferability.
Deposit Liabilities: The estimated fair value for certificates of deposit has been determined by calculating the present value of future cash flows based on estimates of rates the Company would pay on such deposits, applied for the time period until maturity. The estimated fair values of non-interest-bearing demand, NOW, money market, and savings deposits are assumed to approximate their carrying values as management establishes rates on these deposits at a level that approximates the local market area. Additionally, these deposits can be withdrawn on demand.
Borrowings: The estimated fair values of advances from the FHLBC and notes payable are based on current market rates for similar financing. The estimated fair value of securities sold under agreements to repurchase is assumed to equal its carrying value due to the short-term nature of the liability.
Accrued Interest: The estimated fair values of accrued interest receivable and payable are assumed to equal their carrying value.
Off-Balance-Sheet Instruments: Off-balance-sheet items consist principally of unfunded loan commitments, standby letters of credit, and unused lines of credit. The estimated fair values of unfunded loan commitments, standby letters of credit, and unused lines of credit are not material.
89
BANKFINANCIAL CORPORATION
NOTES TO CONSOLIDATED FINANCIAL STATEMENTS
(Table amounts in thousands, except share and per share data)
NOTE 15 – FAIR VALUES OF FINANCIAL INSTRUMENTS (continued)
While the above estimates are based on management’s judgment of the most appropriate factors, as of the balance sheet date, there is no assurance that the estimated fair values would have been realized if the assets were disposed of or the liabilities settled at that date, since market values may differ depending on the various circumstances. The estimated fair values would also not apply to subsequent dates.
In addition, other assets and liabilities that are not financial instruments, such as premises and equipment, are not included in the above disclosures.
NOTE 16 – OTHER COMPREHENSIVE INCOME (LOSS)
Other comprehensive income (loss) components and related taxes were as follows:
| 2009 | 2008 | 2007 | |||||||||
| Unrealized holding gains (losses) on securities, net of tax |
$ | 1,666 | $ | (17,274 | ) | $ | (6,985 | ) | |||
| Net loss (gain) on sale of securities recognized, net of tax |
612 | (835 | ) | (233 | ) | ||||||
| Loss on impairment of securities, net of tax |
248 | 21,643 | — | ||||||||
| $ | 2,526 | $ | 3,534 | $ | (7,218 | ) | |||||
NOTE 17 – COMPANY ONLY CONDENSED FINANCIAL INFORMATION
Condensed financial information of BankFinancial Corporation as of December 31, 2009 and 2008 and for the three years ended December 31, 2009 follows:
Condensed Statements of Financial Condition
| 2009 | 2008 | |||||
| ASSETS |
||||||
| Cash in subsidiary |
$ | 25,755 | $ | 32,976 | ||
| Loan receivable from ESOP |
17,172 | 17,778 | ||||
| Investment in subsidiary |
220,135 | 214,706 | ||||
| Income tax receivable |
11,729 | 1,361 | ||||
| Other assets |
141 | 18 | ||||
| Total assets |
$ | 274,932 | $ | 266,839 | ||
| LIABILITIES AND STOCKHOLDERS’ EQUITY |
||||||
| Accrued expenses and other liabilities |
11,329 | 48 | ||||
| Total stockholders’ equity |
263,603 | 266,791 | ||||
| Total liabilities and stockholders’ equity |
$ | 274,932 | $ | 266,839 | ||
90
BANKFINANCIAL CORPORATION
NOTES TO CONSOLIDATED FINANCIAL STATEMENTS
(Table amounts in thousands, except share and per share data)
NOTE 17 – COMPANY ONLY CONDENSED FINANCIAL INFORMATION (continued)
Condensed Statements of Operations
| 2009 | 2008 | 2007 | ||||||||||
| Interest income |
$ | 1,244 | $ | 1,287 | $ | 1,321 | ||||||
| Dividends from subsidiary |
— | 2,000 | 47,500 | |||||||||
| Other expense |
1,428 | 1,858 | 1,864 | |||||||||
| Income (loss) before income tax and undistributed subsidiary income |
(184 | ) | 1,429 | 46,957 | ||||||||
| Income tax benefit |
(69 | ) | (217 | ) | (209 | ) | ||||||
| Income (loss) before equity in undistributed subsidiary income |
(115 | ) | 1,646 | 47,166 | ||||||||
| Equity in undistributed subsidiary income (excess distributions) |
(623 | ) | (21,035 | ) | (40,011 | ) | ||||||
| Net income (loss) |
$ | (738 | ) | $ | (19,389 | ) | $ | 7,155 | ||||
Condensed Statements of Cash Flows
| 2009 | 2008 | 2007 | ||||||||||
| Cash flows from operating activities |
||||||||||||
| Net income (loss) |
$ | (738 | ) | $ | (19,389 | ) | $ | 7,155 | ||||
| Adjustments |
||||||||||||
| Equity in undistributed subsidiary income (excess distributions) |
623 | 21,035 | 40,011 | |||||||||
| Change in other assets |
(10,492 | ) | 549 | (21 | ) | |||||||
| Change in accrued expenses and other liabilities |
11,281 | (143 | ) | 191 | ||||||||
| Net cash from operating activities |
674 | 2,052 | 47,336 | |||||||||
| Cash flows from investing activities |
||||||||||||
| Principal payments received on ESOP loan |
606 | 563 | 529 | |||||||||
| Net cash from investing activities |
606 | 563 | 529 | |||||||||
| Cash flows from financing activities |
||||||||||||
| Repurchase and retirement of common stock |
(2,491 | ) | (7,737 | ) | (33,957 | ) | ||||||
| Cash dividends paid on common stock |
(6,010 | ) | (6,134 | ) | (6,481 | ) | ||||||
| Net cash from financing activities |
(8,501 | ) | (13,871 | ) | (40,438 | ) | ||||||
| Net change in cash and cash equivalents |
(7,221 | ) | (11,256 | ) | 7,427 | |||||||
| Beginning cash and cash equivalents |
32,976 | 44,232 | 36,805 | |||||||||
| Ending cash and cash equivalents |
$ | 25,755 | $ | 32,976 | $ | 44,232 | ||||||
91
BANKFINANCIAL CORPORATION
NOTES TO CONSOLIDATED FINANCIAL STATEMENTS
(Table amounts in thousands, except share and per share data)
NOTE 18 – SELECTED QUARTERLY FINANCIAL DATA (Unaudited)
| Year Ended December 31, 2009 | ||||||||||||||||
| First Quarter |
Second Quarter |
Third Quarter |
Fourth Quarter |
|||||||||||||
| Interest income |
$ | 18,906 | $ | 18,713 | $ | 18,510 | $ | 17,980 | ||||||||
| Interest expense |
5,736 | 5,500 | 4,838 | 4,483 | ||||||||||||
| Net interest income |
13,170 | 13,213 | 13,672 | 13,497 | ||||||||||||
| Provision for loan losses |
1,344 | 2,847 | 427 | 4,193 | ||||||||||||
| Net interest income |
11,826 | 10,366 | 13,245 | 9,304 | ||||||||||||
| Non interest income |
1,642 | 1,802 | 1,660 | 2,135 | ||||||||||||
| Non interest expense |
13,042 | 13,047 | 12,581 | 14,061 | ||||||||||||
| Income (loss) before income taxes |
426 | (879 | ) | 2,324 | (2,622 | ) | ||||||||||
| Income tax expense (benefit) |
254 | (214 | ) | 973 | (1,026 | ) | ||||||||||
| Net income (loss) |
$ | 172 | $ | (665 | ) | $ | 1,351 | $ | (1,596 | ) | ||||||
| Basic earnings (loss) per common share |
$ | 0.01 | $ | (0.03 | ) | $ | 0.07 | $ | (0.08 | ) | ||||||
| Diluted earnings (loss) per common share |
$ | 0.01 | $ | (0.03 | ) | $ | 0.07 | $ | (0.08 | ) | ||||||
| Year Ended December 31, 2008 | ||||||||||||||||
| First Quarter |
Second Quarter |
Third Quarter |
Fourth Quarter |
|||||||||||||
| Interest income |
$ | 20,742 | $ | 19,387 | $ | 18,749 | $ | 19,082 | ||||||||
| Interest expense |
7,469 | 6,405 | 5,983 | 5,810 | ||||||||||||
| Net interest income |
13,273 | 12,982 | 12,766 | 13,272 | ||||||||||||
| Provision (credit) for loan losses |
(51 | ) | 250 | 1,406 | 3,487 | |||||||||||
| Net interest income |
13,324 | 12,732 | 11,360 | 9,785 | ||||||||||||
| Non interest income |
4,717 | 1,684 | 2,107 | 1,910 | ||||||||||||
| Non interest expense |
13,239 | 23,416 | 37,484 | 14,917 | ||||||||||||
| Income (loss) before income taxes |
4,802 | (9,000 | ) | (24,017 | ) | (3,222 | ) | |||||||||
| Income tax expense (benefit) |
1,610 | (3,593 | ) | 1,065 | (11,130 | ) | ||||||||||
| Net income (loss) |
$ | 3,192 | $ | (5,407 | ) | $ | (25,082 | ) | $ | 7,908 | ||||||
| Basic earnings (loss) per common share |
$ | 0.16 | $ | (0.27 | ) | $ | (1.27 | ) | $ | 0.40 | ||||||
| Diluted earnings (loss) per common share |
$ | 0.16 | $ | (0.27 | ) | $ | (1.26 | ) | $ | 0.40 | ||||||
The Company recorded a net loss of $1.6 million for the fourth quarter of 2009. The Company’s operating results included a $4.2 million provision for loan losses as well as a $988,000 loss on sale of our Freddie Mac preferred stock.
On January 29, 2010, the Company announced that its Board of Directors declared a cash dividend of $0.07 per share of its common stock. The dividend will be payable on March 5, 2010 to stockholders of record on February 10, 2010.
92
| ITEM 9. | CHANGES IN AND DISAGREEMENTS WITH ACCOUNTANTS ON ACCOUNTING AND FINANCIAL DISCLOSURE |
Not Applicable.
| ITEM 9A. | CONTROLS AND PROCEDURES |
(a) Evaluation of disclosure controls and procedures.
Under the supervision and with the participation of our management, including our Principal Executive Officer and Principal Financial Officer, we evaluated the effectiveness of the design and operation of our disclosure controls and procedures (as defined in Rule 13a-15(e) and 15d-15(e) under the Exchange Act) as of the end of the fiscal year (the “Evaluation Date”). Based upon that evaluation, the Principal Executive Officer and Principal Financial Officer concluded that, as of the Evaluation Date, our disclosure controls and procedures were effective in timely alerting them to the material information relating to us (or our consolidated subsidiaries) required to be included in our periodic Securities and Exchange Commission filings.
(b) Management’s Annual Report on Internal Control Over Financial Reporting.
The annual report of management on the effectiveness of our internal control over financial reporting and the attestation report thereon issued by our independent registered public accounting firm are set forth under “Report of Management on Internal Control Over Financial Reporting” and “Report of Independent Registered Public Accounting Firm on Internal Control Over Financial Reporting” under “Item 8. Financial Statements and Supplementary Data.”
(c) Changes in internal controls.
There were no changes made in our internal controls during the period covered by this report or, to our knowledge, in other factors that have materially affected, or are reasonably likely to materially affect these controls.
See the Certifications pursuant to Section 302 of the Sarbanes-Oxley Act of 2002.
| ITEM 9B. | OTHER INFORMATION |
Not Applicable.
93
PART III
| ITEM 10. | DIRECTORS AND EXECUTIVE OFFICERS OF THE REGISTRANT |
Directors and Executive Officers
The information concerning our directors and executive officers required by this item will be filed with the Securities and Exchange Commission by amendment to this Form 10-K, not later than 120 days after the end of our fiscal year.
Section 16(a) Beneficial Ownership Reporting Compliance
The information concerning compliance with the reporting requirements of Section 16(a) of the Securities Exchange Act of 1934 by our directors, officers and 10 percent stockholders required by this item will be filed with the Securities and Exchange Commission by amendment to this Form 10-K, not later than 120 days after the end of our fiscal year.
Code of Ethics
We have adopted a Code of Ethics for Senior Financial Officers that applies to our principal executive officer, principal financial officer, principal accounting officer, and persons performing similar functions. A copy of our Code of Ethics was attached as Exhibit 14 to our Annual Report on Form 10-K filed with the Securities and Exchange Commission on March 27, 2006. We have also adopted a Code of Business Conduct, pursuant to Nasdaq requirements, that applies generally to our directors, officers, and employees.
| ITEM 11. | EXECUTIVE COMPENSATION |
The information concerning compensation required by this item will be filed with the Securities and Exchange Commission by amendment to this Form 10-K, not later than 120 days after the end of our fiscal year.
| ITEM 12. | SECURITY OWNERSHIP OF CERTAIN BENEFICIAL OWNERS AND MANAGEMENT AND RELATED STOCKHOLDER MATTERS |
The information concerning security ownership of certain beneficial owners and management required by this item will be filed with the Securities and Exchange Commission by amendment to this Form 10-K, not later than 120 days after the end of our fiscal year.
Securities Authorized for Issuance under Equity Compensation Plan
The following table sets forth information regarding the securities that were authorized for issuance under our 2006 Equity Incentive Plan as of December 31, 2009:
| Column (A) | Column (B) | Column (C) Number of for Future | |||||
| Plan Category |
Number of Securities to be Issued Upon Exercise of Outstanding Options, Warrants and Rights |
Weighted- Average Exercise Price of Outstanding Options, Warrants and Rights |
2006 Equity Incentive Plan (Excluding Securities Reflected in Column (A)) | ||||
| Equity compensation plans approved by stockholders |
2,573,904 | $ | 16.51 | 257,622 | |||
| Equity compensation plans not approved by stockholders |
— | — | — | ||||
| Total |
2,573,904 | 16.51 | 257,622 | ||||
Column (A) represents stock options and restricted stock outstanding under the Company’s 2006 Equity Incentive Plan. Future equity awards under the 2006 Equity Incentive Plan may take the form of stock options, stock appreciation rights, performance unit awards, restricted stock, restricted performance stock, restricted stock units, stock awards or cash. Column (B) represents the weighted-average exercise price of the outstanding stock options only; the outstanding restricted stock awards are not included in this calculation. Column (C) represents the maximum aggregate number of future equity awards that can be made under the 2006 Equity Incentive Plan as of December 31, 2009.
94
| ITEM 13. | CERTAIN RELATIONSHIPS AND RELATED TRANSACTIONS |
The information concerning certain relationships and related transactions required by this will be filed with the Securities and Exchange Commission by amendment to this Form 10-K, not later than 120 days after the end of our fiscal year.
| ITEM 14. | PRINCIPAL ACCOUNTANT FEES AND SERVICES |
The information concerning principal accountant fees and services will be filed with the Securities and Exchange Commission by amendment to this Form 10-K, not later than 120 days after the end of our fiscal year.
PART IV
| ITEM 15. | EXHIBITS AND FINANCIAL STATEMENT SCHEDULES |
(a)(1) Financial Statements
The following consolidated financial statement of the registrant and its subsidiaries are filed as part of this document under “Item 8. Financial Statements and Supplementary Data.”
| (A) | Report of Independent Registered Accounting Firm |
| (B) | Consolidated Statements of Financial Condition - at December 31, 2009 and 2008 |
| (C) | Consolidated Statements of Operations for the years ended December 31, 2009, 2008 and 2007 |
| (D) | Consolidated Statements of Changes in Stockholders’ Equity for the years ended December 31, 2009, 2008 and 2007 |
| (E) | Consolidated Statements of Cash Flows for the years ended December 31, 2009, 2008 and 2007 |
| (F) | Notes to Consolidated Financial Statements |
(a)(2) Financial Statement Schedules
None.
(a)(3) Exhibits
The documents set forth below are filed herewith or incorporated herein by reference to the location indicated.
| Exhibit |
Location | |||
| 3.1 |
Articles of Incorporation of BankFinancial Corporation | Exhibit 3.1 to the Registration Statement on Form S-1 of the Company, originally filed with the Securities and Exchange Commission on September 23, 2004 | ||
| 3.2 |
Bylaws of BankFinancial Corporation | Exhibit 3.2 to the Registration Statement on Form S-1 of the Company, originally filed with the Securities and Exchange Commission on September 23, 2004 | ||
| 3.3 |
Articles of Amendment to Charter of BankFinancial Corporation | Exhibit 3.3 to the Registration Statement on Form S-1 of the Company, originally filed with the Securities and Exchange Commission on September 23, 2004 | ||
95
| Exhibit |
Location | |||
| 3.4 | Restated Bylaws of BankFinancial Corporation | Exhibit 3.4 to the Annual Report on Form 10-K of the Company, originally filed with the Securities and Exchange Commission on March 15, 2007 | ||
| 4 |
Form of Common Stock Certificate of BankFinancial Corporation | Exhibit 4 to the Registration Statement on Form S-1 of the Company, originally filed with the Securities and Exchange Commission on September 23, 2004 | ||
| 10.1 |
Employee Stock Ownership Plan | Exhibit 10.1 to the Registration Statement on Form S-1 of the Company, originally filed with the Securities and Exchange Commission on September 23, 2004 | ||
| 10.2 |
Deferred Compensation Plan | Exhibit 10.2 to the Registration Statement on Form S-1 of the Company, originally filed with the Securities and Exchange Commission on September 23, 2004 | ||
| 10.3 |
BankFinancial FSB Employment Agreement with F. Morgan Gasior | Exhibit 10.1 to the Current Report on Form 8-K of the Company, originally filed with the Securities and Exchange Commission on May 5, 2008 | ||
| 10.4 |
BankFinancial FSB Employment Agreement with James J. Brennan | Exhibit 10.3 to the Current Report on Form 8-K of the Company, originally filed with the Securities and Exchange Commission on May 5, 2008. | ||
| 10.5 |
BankFinancial FSB Employment Agreement with Paul A. Cloutier | Exhibit 10.2 to the Current Report on Form 8-K of the Company, originally filed with the Securities and Exchange Commission on May 5, 2008 | ||
| 10.12 |
Form of Incentive Stock Option Award Terms | Exhibit 10.1 to the Report on Form 8-K of the Company, originally filed with the Securities and Exchange Commission on September 5, 2006 | ||
| 10.13 |
2006 BankFinancial Corporation Equity Incentive Plan | Appendix C to the Definitive Form 14A, originally filed with the Securities and Exchange Commission on May 25, 2006 (File No. 000-51331) | ||
| 10.14 |
Form of Performance Based Incentive Stock Option Award Terms | Exhibit 10.2 to the Report on Form 8-K of the Company, originally filed with the Securities and Exchange Commission on September 5, 2006 | ||
| 10.15 |
Form of Non-Qualified Stock Option Award Terms | Exhibit 10.3 to the Report on Form 8-K of the Company, originally filed with the Securities and Exchange Commission on September 5, 2006 | ||
| 10.16 |
Form of Performance Based Non-Qualified Stock Option Award Terms | Exhibit 10.4 to the Report on Form 8-K of the Company, originally filed with the Securities and Exchange Commission on September 5, 2006 | ||
| 10.17 |
Form of Restricted Stock Unit Award Agreement | Exhibit 10.5 to the Report on Form 8-K of the Company, originally filed with the Securities and Exchange Commission on September 5, 2006 | ||
| 10.18 |
Form of Performance Based Restricted Stock Award Agreement | Exhibit 10.6 to the Report on Form 8-K of the Company, originally filed with the Securities and Exchange Commission on September 5, 2006 | ||
| 10.19 |
Form of Restricted Stock Award Agreement | Exhibit 10.7 to the Report on Form 8-K of the Company, originally filed with the Securities and Exchange Commission on September 5, 2006 | ||
| 10.20 |
Form of Stock Appreciation Rights Agreement | Exhibit 10.8 to the Report on Form 8-K of the Company, originally filed with the Securities and Exchange Commission on September 5, 2006 | ||
96
| Exhibit |
Location | |||
| 10.25 | BankFinancial Corporation Employment Agreement with F. Morgan Gasior | Exhibit 10.1 to the Report on Form 8-K of the Company, originally filed with the Securities and Exchange Commission on October 20, 2008 | ||
| 10.26 | BankFinancial Corporation Employment Agreement with Paul A. Cloutier | Exhibit 10.2 to the Report on Form 8-K of the Company, originally filed with the Securities and Exchange Commission on October 20, 2008 | ||
| 10.27 | BankFinancial Corporation Employment Agreement with James J. Brennan | Exhibit 10.3 to the Report on Form 8-K of the Company, originally filed with the Securities and Exchange Commission on October 20, 2008 | ||
| 10.28 | BankFinancial Corporation Employment Agreement with Elizabeth A. Doolan | Exhibit 10.28 to the Annual Report on Form 10-K of the Company, originally filed with the Securities and Exchange Commission on February 23, 2009. | ||
| 10.29 | BankFinancial FSB Employment Agreement with Elizabeth A. Doolan | Exhibit 10.28 to the Annual Report on Form 10-K of the Company, originally filed with the Securities and Exchange Commission on February 23, 2009. | ||
| 14 | Code of Ethics for Senior Financial Officers | Exhibit 14 to the Annual Report on Form 10-K of the Company, originally filed with the Securities and Exchange Commission on March 27, 2006 | ||
| 21 | Subsidiaries of Registrant | Exhibit 21 to the Registration Statement on Form S-1 of the Company, originally filed with the Securities and Exchange Commission on September 23, 2004 | ||
| 23 | Consent of Crowe Horwath LLP | Filed herewith | ||
| 31.1 | Certification of Chief Executive Officer pursuant to Section 302 of the Sarbanes-Oxley Act of 2002 | Filed herewith | ||
| 31.2 | Certification of Chief Financial Officer pursuant to Section 302 of the Sarbanes-Oxley Act of 2002 | Filed herewith | ||
| 32 | Certification of Chief Executive Officer and Chief Financial Officer pursuant to Section 906 of the Sarbanes-Oxley Act of 2002* | Furnished herewith | ||
| * | A signed original of this written statement required by Section 906 has been provided to the Company and will be retained by the Company and furnished to the Securities and Exchange Commission or its staff upon request. |
97
SIGNATURES
Pursuant to the requirements of Section 13 or 15(d) of the Securities Exchange Act of 1934, the Registrant has duly caused this report to be signed on its behalf by the undersigned, thereunto duly authorized.
| BANKFINANCIAL CORPORATION | ||||
| Date: March 8, 2010 | By: | /s/ F. Morgan Gasior | ||
| F. Morgan Gasior | ||||
| Chairman of the Board, Chief Executive Officer and President | ||||
| (Duly Authorized Representative) | ||||
Pursuant to the requirements of the Securities Exchange of 1934, this report has been signed below by the following persons on behalf of the Registrant and in the capacities and on the dates indicated.
| Signatures |
Title |
Date | ||||||
| /s/ F. Morgan Gasior |
Chairman of the Board, Chief Executive Officer and President (Principal Executive Officer) | March 8, 2010 | ||||||
| F. Morgan Gasior | ||||||||
| /s/ Paul A. Cloutier |
Executive Vice President and Chief Financial Officer (Principal Financial Officer) | March 8, 2010 | ||||||
| Paul A. Cloutier | ||||||||
| /s/ Elizabeth A. Doolan |
Senior Vice President and Controller (Principal Accounting Officer) |
March 8, 2010 | ||||||
| Elizabeth A. Doolan | ||||||||
| /s/ Cassandra J. Francis |
Director | March 8, 2010 | ||||||
| Cassandra J. Francis | ||||||||
| /s/ John M. Hausmann |
Director | March 8, 2010 | ||||||
| John M. Hausmann | ||||||||
| /s/ Sherwin R. Koopmans |
Director | March 8, 2010 | ||||||
| Sherwin R. Koopmans | ||||||||
| /s/ Joseph A. Schudt |
Director | March 8, 2010 | ||||||
| Joseph A. Schudt | ||||||||
| /s/ Terry R. Wells |
Director | March 8, 2010 | ||||||
| Terry R. Wells | ||||||||
| /s/ Glen R. Wherfel |
Director | March 8, 2010 | ||||||
| Glen R. Wherfel | ||||||||
98