Attached files
Table of Contents
UNITED STATES
SECURITIES AND EXCHANGE COMMISSION
Washington, D.C. 20549
FORM 10-K
(Mark One)
| x | ANNUAL REPORT PURSUANT TO SECTION 13 OR 15(d) OF THE SECURITIES EXCHANGE ACT OF 1934 |
For the fiscal year ended December 31, 2009
OR
| ¨ | TRANSITION REPORT PURSUANT TO SECTION 13 OR 15(d) OF THE SECURITIES EXCHANGE ACT OF 1934 |
For the transition period from to
Commission File Number: 001-34621
GRAHAM PACKAGING COMPANY INC.
(Exact name of registrant as specified in its charter)
| Delaware | 52-2076126 | |
| (State or other jurisdiction of Incorporation or organization) |
(I.R.S. Employer Identification No.) |
2401 Pleasant Valley Road
York, Pennsylvania 17402
(717) 849-8500
(Address, including zip code, and telephone number, including
area code, of the registrant’s principal executive offices)
Securities registered pursuant to Section 12(b) of the Act:
| Title of each class |
Name of each exchange on which registered | |
| Common stock, $0.01 par value |
New York Stock Exchange |
Indicate by check mark if the registrant is a well-known seasoned issuer, as defined by Rule 405 of the Securities Act. Yes ¨ No x.
Indicate by check mark if the registrant is not required to file reports pursuant to Section 13 or Section 15(d) of the Act. Yes ¨ No x.
Indicate by check mark whether the registrant (1) has filed all reports required to be filed by Section 13 or 15(d) of the Securities Exchange Act of 1934 during the preceding 12 months (or for such shorter period that the registrant was required to file such reports), and (2) has been subject to such filing requirements for the past 90 days. Yes ¨ No x.
Indicate by check mark whether the registrant has submitted electronically and posted on its corporate website, if any, every Interactive Data File required to be submitted and posted pursuant to Rule 405 of Regulation S-T (§ 232.405 of this chapter) during the preceding 12 months (or for such shorter period that the registrant was required to submit and post such files). Yes ¨ No ¨.
Indicate by check mark if disclosure of delinquent filers pursuant to Item 405 of Regulation S-K is not contained herein, and will not be contained, to the best of the registrant’s knowledge, in definitive proxy or information statements incorporated by reference in Part III of this Form 10-K or any amendment to this Form 10-K. x
Indicate by check mark whether the registrant is a large accelerated filer, an accelerated filer, a non-accelerated filer, or a smaller reporting company. See the definitions of “large accelerated filer,” “accelerated filer” and “smaller reporting company” in Rule 12b-2 of the Exchange Act. (Check one):
| Large accelerated filer ¨ | Accelerated filer ¨ | |
| Non-accelerated filer x (Do not check if a smaller reporting company) | Smaller reporting company ¨ |
Indicate by check mark whether the registrant is a shell company (as defined in Rule 12b-2 of the Act). Yes ¨ No x.
There was no active trading market for the registrant’s common stock as of June 30, 2009. As of February 11, 2010 (the date that the registrant’s common stock, par value $0.01 per share, began trading on the New York Stock Exchange), the aggregate market value of the voting and non-voting common equity of the registrant held by non-affiliates was approximately $170.0 million, based on the closing price of the registrant’s common stock reported on the New York Stock Exchange on such date of $10.20 per share.
As of March 3, 2010 the registrant had outstanding 60,235,453 shares of common stock, par value $0.01 per share.
DOCUMENTS INCORPORATED BY REFERENCE
Portions of the definitive Proxy Statement of Graham Packaging Company Inc. to be filed pursuant to Regulation 14A of the general rules and regulations under the Securities Exchange Act of 1934, as amended, for the 2010 annual meeting of stockholders of Graham Packaging Company Inc. (“Proxy Statement”) are incorporated by reference into Part III of this Form 10-K.
Table of Contents
GRAHAM PACKAGING COMPANY INC.
| Page Number | ||||
| PART I |
||||
| Item 1. |
5 | |||
| Item 1A. |
17 | |||
| Item 1B. |
29 | |||
| Item 2. |
29 | |||
| Item 3. |
32 | |||
| Item 4. |
(Removed and Reserved) |
32 | ||
| PART II |
||||
| Item 5. |
33 | |||
| Item 6. |
34 | |||
| Item 7. |
Management’s Discussion and Analysis of Financial Condition and Results of Operations |
36 | ||
| Item 7A. |
58 | |||
| Item 8. |
60 | |||
| Item 9. |
Changes in and Disagreements with Accountants on Accounting and Financial Disclosure |
116 | ||
| Item 9A. |
116 | |||
| Item 9B. |
116 | |||
| PART III |
||||
| Item 10. |
Directors; Executive Officers of the Registrant and Corporate Governance |
118 | ||
| Item 11. |
118 | |||
| Item 12. |
Security Ownership of Certain Beneficial Owners and Management and Related Stockholder Matters |
119 | ||
| Item 13. |
Certain Relationships and Related Transactions, and Director Independence |
119 | ||
| Item 14. |
119 | |||
| PART IV |
||||
| Item 15. |
119 | |||
2
Table of Contents
CAUTIONARY STATEMENT REGARDING FORWARD-LOOKING STATEMENTS
All statements other than statements of historical facts included in this Annual Report on Form 10-K, including statements regarding the future financial position, economic performance and results of operations of the Company (as defined below), as well as the Company’s business strategy, budgets and projected costs and plans and objectives of management for future operations, and the information referred to under “Management’s Discussion and Analysis of Financial Condition and Results of Operations” (Part II, Item 7) and “Quantitative and Qualitative Disclosures About Market Risk” (Part II, Item 7A), are forward-looking statements. In addition, forward-looking statements generally can be identified by the use of forward-looking terminology, such as “may,” “will,” “expect,” “intend,” “estimate,” “anticipate,” “believe” or “continue” or similar terminology. These forward-looking statements are not historical facts, and are based on current expectations, estimates and projections about the Company’s industry, management’s beliefs and certain assumptions made by management, many of which, by their nature, are inherently uncertain and beyond the Company’s control. Accordingly, readers are cautioned that any such forward-looking statements are not guarantees of future performance and are subject to certain risks, uncertainties and assumptions that are difficult to predict. Although the Company believes that the expectations reflected in such forward-looking statements are reasonable as of the date made, expectations may prove to have been materially different from the results expressed or implied by such forward-looking statements. Unless otherwise required by law, the Company also disclaims any obligation to update its view of any such risks or uncertainties or to announce publicly the result of any revisions to the forward-looking statements made in this report. Important factors that could cause actual results to differ materially from the Company’s expectations include, without limitation:
| • | increased competition in the Company’s industry which could lead to a decline in prices of plastic packaging; |
| • | the Company’s ability to develop product innovations and improve its production technology and expertise; |
| • | infringement of the Company’s proprietary technology; |
| • | the Company’s dependence on significant customers and the risk of loss of any of those customers; |
| • | customers not purchasing amounts under requirements contracts that meet the Company’s expectations; |
| • | the Company’s exposure to fluctuations in resin prices and its dependence on resin supplies; |
| • | risks associated with the Company’s international operations; |
| • | the Company’s recovery of the carrying value of its long-lived assets; |
| • | the Company’s realization of the carrying value of its goodwill and other identifiable intangible assets; |
| • | the Company’s dependence on key management and the material adverse effect that could result from the loss of their services; |
| • | the Company’s ability to successfully integrate its business with those of other businesses that it may acquire; |
| • | risks associated with a significant portion of the Company’s employees being covered by collective bargaining agreements; |
| • | the Company’s dependence on additional blow molding equipment in order to be able to expand its operations; |
| • | risks associated with environmental regulation and liabilities; |
| • | risks associated with being deemed an “investment company” under the 1940 Act, as a result of the Company’s ownership of Holdings (as defined herein); |
| • | the Company’s recent net losses; |
3
Table of Contents
| • | payments to the Graham Family (as defined herein) and the Company’s pre-initial public offering stockholders for certain tax benefits the Company may claim; |
| • | the Company is dependent on distributions from Holdings to pay dividends, taxes and make payments under the income tax receivable agreements; |
| • | the possibility that Blackstone’s (as defined herein) interests will conflict with the Company’s interests; |
| • | the Company’s indebtedness, which could adversely affect its cash flow and its ability to operate and grow its business; |
| • | that despite its current levels of indebtedness, the Company may incur additional debt in the future, which could increase the risks associated with its leverage; |
| • | the terms of the Company’s debt instruments, which restrict the manner in which the Company conducts its business and may limit its ability to implement elements of its business strategy; |
| • | the inability to renew or replace the Company’s debt facilities on favorable terms or at all; and |
| • | the acquisition of voting power in the Company greater than the voting power owned by Blackstone may trigger an event of default under the Company’s Credit Agreement (as defined herein). |
See “Item 1A. Risk Factors.” All written and oral forward-looking statements attributable to the Company, or persons acting on its behalf, are expressly qualified in their entirety by these cautionary statements. You should evaluate all forward-looking statements made in this Annual Report on Form 10-K in the context of these risks and uncertainties. The Company cautions you that the important factors referenced above may not contain all of the factors that are important to you.
4
Table of Contents
Market data and certain industry forecasts used herein were obtained from internal surveys, market research, publicly available information and industry publications. While the Company believes that market research, publicly available information and industry publications it uses are reliable, the Company has not independently verified market and industry data from third-party sources. Moreover, while the Company believes its internal surveys are reliable, they have not been verified by any independent source.
PART I
| Item 1. | Business |
Unless the context otherwise requires, all references herein to the “Company,” “we,” “our” or “us” refer to Graham Packaging Company Inc. (formerly known as BMP/Graham Holdings Corporation) and its subsidiaries (including Graham Packaging Holdings Company). All references herein to “GPC” refer to Graham Packaging Company Inc., a public company with common stock listed on the New York Stock Exchange and is traded under the symbol “GRM.” All references to “Holdings” refer to Graham Packaging Holdings Company, a subsidiary of GPC, and all references to the “Operating Company” refer to Graham Packaging Company, L.P., a wholly-owned subsidiary of Holdings. References to “Blackstone” herein refer to Blackstone Capital Partners III Merchant Banking Fund L.P., Blackstone Offshore Capital Partners III L.P. and Blackstone Family Investment Partnership III L.P. References to the “Graham Family” herein refer to GPC Holdings L.P. or affiliates thereof or other entities controlled by Donald C. Graham and his family.
Plastic containers represent one of the faster growing segments in rigid packaging. The plastic container segment of the rigid packaging industry can be divided into two product types, commodity plastic containers, such as containers for soft drinks and water, and value-added, custom plastic containers, which include unique design features for specialized performance characteristics and product differentiation. Commodity plastic containers are manufactured using stock designs by both independent producers and in-house packaging operations of major beverage companies. Value-added, custom plastic containers are produced through specialized manufacturing processes using resin combinations and structures to create tailor-made solutions for customers seeking performance characteristics, including shelf stability and product differentiation, including unique shapes and high-function dispensers.
The Company focuses on the sale of value-added, custom plastic packaging products principally to large, multinational companies in the food and beverage, household, personal care/specialty and automotive lubricants product categories. The Company has manufacturing facilities in Argentina, Belgium, Brazil, Canada, Finland, France, Mexico, the Netherlands, Poland, Spain, Turkey, the United Kingdom, the United States and Venezuela.
General
The predecessor to Holdings, controlled by the predecessors of the Graham Family, was formed in the mid-1970’s as a regional domestic custom plastic container supplier. Holdings was formed under the name “Sonoco Graham Company” on April 3, 1989, as a Pennsylvania limited partnership. It changed its name to “Graham Packaging Company” on March 28, 1991, and to “Graham Packaging Holdings Company” on February 2, 1998. The primary business activity of Holdings is its direct and indirect ownership of 100% of the partnership interests in the Operating Company. The Operating Company was formed under the name “Graham Packaging Holdings I, L.P.” on September 21, 1994, as a Delaware limited partnership and changed its name to “Graham Packaging Company, L.P.” on February 2, 1998, in connection with the recapitalization transaction in which Blackstone, management and other investors became the indirect holders of 85.0% of the partnership interests of Holdings. On October 7, 2004, the Company acquired the blow molded plastic container business of Owens-Illinois, Inc. (“O-I Plastic”), which essentially doubled the size of the Company. The Company’s operations have included the operations of O-I Plastic since the acquisition date.
5
Table of Contents
GPC was incorporated in Delaware under the name “BMP/Graham Holdings Corporation” on November 5, 1997. GPC is a holding company whose only material assets are the direct ownership of 1) a limited partnership interest in Holdings of 87.6% after giving effect to the IPO (as defined herein), the subsequent purchase by GPC of 16,666,667 newly-issued unregistered limited partnership units and after entities controlled by the Graham Family exercised their rights to exchange 1,324,900 limited partnership units of Holdings for 1,324,900 shares of GPC through February 18, 2010, and 2) 100% of the limited liability company interests of BCP/Graham Holdings L.L.C. (“BCP”), which holds a 3.0% general partnership interest in Holdings, after giving effect to the IPO. GPC changed its name to “Graham Packaging Company Inc.” on December 10, 2009. GPC completed the initial public offering of its common stock on February 17, 2010, in which it issued 16,666,667 common shares and raised net proceeds of approximately $150.0 million. GPC’s common stock is listed on the New York Stock Exchange and is traded under the symbol “GRM.”
The principal executive offices of the Company are located at 2401 Pleasant Valley Road, York, Pennsylvania 17402, telephone (717) 849-8500. The Company maintains a website at www.grahampackaging.com. The Company makes available on its website, free of charge, annual reports on Form 10-K, quarterly reports on Form 10-Q and current reports on Form 8-K, for both GPC and Holdings, as soon as practical after the Company files these reports with the U.S. Securities and Exchange Commission (“SEC”). The information contained on the Company’s website or that can be accessed through its website is not incorporated by reference herein.
The Company is organized and managed on a geographical basis in three operating segments: North America, Europe and South America. Each operating segment includes four major categories: Food and Beverage, Household, Personal Care/Specialty and Automotive Lubricants.
The Company is a worldwide leader in the design, manufacture and sale of value-added, custom blow molded plastic containers for branded consumer products. The Company operates in product categories where customers and end users value the technology and innovation that the Company’s custom plastic containers offer as an alternative to traditional packaging materials such as glass, metal and paperboard. The Company selectively pursues opportunities where it can leverage its technology portfolio to continue to drive the trend of conversion to plastic containers from other packaging materials. The Company’s customers include leading multi-national and regional blue-chip consumer product companies that seek customized, sustainable plastic container solutions in diverse and stable end markets, such as the food and beverage and the household consumer products markets. The Company believes it is well-positioned to meet the evolving needs of its customers who often use the Company’s technology to differentiate their products with value-added design and performance characteristics such as smooth-wall panel-less bottles, unique pouring and dispensing features, multilayer bottles incorporating barrier technologies to extend shelf life, and ultra lightweight bottles with “hot-fill” capabilities that allow containers to be filled at high temperatures.
The Company believes it has number one market share positions in North America for hot-fill juices, sports drinks/isotonics, yogurt drinks, liquid fabric care, dish detergents, hair care, skin care and certain other products. For the year ended December 31, 2009, approximately 90% of its net sales from continuing operations were realized in these product categories. The Company does not participate in markets where technology is not a differentiating factor, such as the carbonated soft drink or bottled water markets.
The Company’s value-added products are supported by more than 1,000 issued or pending patents. The Company strives to provide the highest quality products and services to its customers, while remaining focused on operational excellence and continuous improvement. These priorities help to reduce its customers’ costs, while also maximizing its financial performance and cash flow. The Company supplies its customers through a network of 80 manufacturing facilities, approximately one-third of which are located on-site at its customers’ plants. The vast majority of its sales are made pursuant to long-term customer contracts that include the pass-through of the cost of plastic resin, as well as mechanisms for the pass-through of certain other manufacturing costs.
6
Table of Contents
Collectively, the Company’s product portfolio, technologies, end markets and operations all contribute to its industry-leading margins and strong cash flow.
Our Markets
The Company supplies plastic containers to a significant number of end markets and geographies. The Company’s products provide differentiated packaging for consumer products that help address basic needs such as nutrition, hygiene and home care. The end markets the Company supplies are generally characterized by stable, long-term demand trends that are relatively insulated from economic cycles.
Food and Beverage. In the food and beverage product category, the Company produces containers for shelf-stable, refrigerated and frozen juices, non-carbonated juice drinks, nutritional beverages, beer, yogurt drinks, teas, sports drinks/isotonics, vitamin enhanced waters, snacks, liquor, toppings, sauces, jellies and jams. Management believes, based on internal estimates, that the Company has one of the leading domestic positions in plastic containers for hot-fill juice and juice drinks, sports drinks/isotonics, drinkable yogurt and smoothies, nutritional supplements, wide-mouth food, dressings and condiments, and the leading global position in plastic containers for yogurt drinks. Based on the Company’s knowledge and experience in the industry, its focus on markets which are likely to convert to plastic, its proprietary technologies and its current market position, management believes the Company is strategically positioned to benefit from the food and beverage markets that have yet to convert, or that are in the early stages of conversion, to plastic and also to take advantage of evolving domestic and international conversion opportunities like beer, sauces, salsas and nutritional products.
The Company’s largest customers in the food and beverage product category include, in alphabetical order: Abbott Laboratories (“Abbott”), Arizona Beverages Company, LLC (“Arizona”), Clement Pappas & Co., Inc. (“Clement Pappas”), Clorox Products Manufacturing Company (“Clorox”), Coca-Cola North America (“Coca-Cola”), Conopco Inc. (“Unilever”), Group Danone (“Danone”), H.J. Heinz Company (“Heinz”), Knouse Foods Cooperative, Inc. (“Knouse”), Ocean Spray Cranberries, Inc. (“Ocean Spray”), PepsiCo, Inc. (“PepsiCo”), The Quaker Oats Company (“Gatorade”), Tropicana Products, Inc. (“Tropicana”) and Welch Foods, Inc. (“Welch’s”). For the years ended December 31, 2009, 2008 and 2007, the Company generated approximately 61.0%, 61.0% and 60.3%, respectively, of its net sales from food and beverage containers.
Household. In the household product category, the Company is a leading supplier of plastic containers for products such as liquid fabric care and dish care. The growth in prior years was fueled by conversions from powders to liquids for such products as detergents, household cleaners and automatic dishwashing detergent. The growth of this product category now follows gross domestic product (“GDP”) growth as liquids have gained a predominant share of these products. The fabric care industry now offers most of its brands in a concentrated formula which has reduced sales in this product category.
The Company’s largest customers in the household product category include, in alphabetical order: Church & Dwight Co., Inc. (“Church & Dwight”), Clorox, Dial Corporation (“Dial,” a division of Henkel), The Proctor & Gamble Company (“Proctor & Gamble”) and Unilever. For the years ended December 31, 2009, 2008 and 2007, the Company generated approximately 18.6%, 19.2% and 20.2%, respectively, of its net sales from household containers.
Personal Care/Specialty. In the personal care/specialty product category, the Company is a supplier of plastic containers for products such as hair care, skin care and oral care. The Company’s product design, technology development and decorating capabilities help its customers build brand awareness for their products through unique, and frequently changing, packaging design.
The Company’s largest customers in the personal care/specialty product category include, in alphabetical order: Johnson & Johnson Consumer Companies, Inc. and Proctor & Gamble. For the years ended December 31, 2009, 2008 and 2007, the Company generated approximately 7.6%, 7.3% and 8.3%, respectively, of its net sales from personal care/specialty containers.
7
Table of Contents
Automotive Lubricants. Management believes, based on internal estimates, that the Company is the leading supplier of plastic motor oil containers in the United States, Canada and Brazil, supplying most of the motor oil producers in these countries. Management believes the Company had a market share in 2009 of 73% of the single-quart motor oil and 80% of the multi-quart motor oil markets.
The Company’s largest customers in the automotive lubricants product category include, in alphabetical order: Ashland, Inc. (“Ashland,” producer of Valvoline motor oil), BP Lubricants USA, Inc. (“BP Lubricants,” an affiliated company of BP PLC, producer of Castrol motor oil), ExxonMobil Corporation (“ExxonMobil”), Petrobras Distribuidora S.A. (“Petrobras”) and Shell Oil Products US (“Shell,” producer of Shell, Pennzoil and Quaker State motor oils). For the years ended December 31, 2009, 2008 and 2007, the Company generated approximately 12.8%, 12.5% and 11.2%, respectively, of its net sales from automotive lubricants containers.
Additional information regarding operating segments and product categories is provided in Note 23 of the Notes to Consolidated Financial Statements in this Report.
Raw Materials
Polyethylene terephthalate, or PET, high-density polyethylene, or HDPE, and polypropylene, or PP, resins constitute the primary raw materials used to make the Company’s products. These materials are available from a number of domestic and international suppliers and the Company is not dependent upon any single supplier. The Company considers the supply and availability of raw materials to be adequate to meet its needs. Management believes that the Company maintains an adequate inventory to meet demand, but there is no assurance this will be true in the future. Resin prices can fluctuate significantly with fluctuations in crude oil and natural gas prices, as well as changes in refining capacity and the demand for other petroleum-based products. Changes in the cost of resin are passed through to customers by means of corresponding changes in product pricing in accordance with the Company’s agreements with these customers and industry practice. The Company operates a large HDPE bottles-to-bottles recycling plant in York, Pennsylvania, and uses the recycled materials from this plant and other recycled materials in a majority of the Company’s products.
8
Table of Contents
Customers
Substantially all of the Company’s sales are made to major branded consumer products companies. The products the Company manufactures for its customers require innovative packaging design and engineering to accommodate complex container shapes, specific material requirements and functionality. Customers also require quick and reliable delivery. As a result, many customers opt for long-term contracts. The Company’s long-term supply contracts with its on-site customers typically have ten-year terms. The Company’s long-term supply contracts for production off-site typically have terms that range from three to five years. Both of these categories of contracts either renew automatically for subsequent one year terms or are renegotiated by the Company before expiration of the initial term. A majority of the Company’s top twenty customers are under long-term contracts. The Company’s contracts typically contain provisions allowing for price adjustments based on changes in raw materials and in a majority of cases the cost of energy and labor, among other factors. In many cases, the Company is the sole supplier of its customers’ custom plastic container requirements nationally, regionally or for a specific brand. For the year ended December 31, 2009, the Company had sales to one customer, PepsiCo, which exceeded 10% of net sales. The Company’s sales to PepsiCo were 10.8% of net sales for the year ended December 31, 2009. All of these sales were made in North America. For the year ended December 31, 2009, the Company’s twenty largest customers, who accounted for over 68% of net sales, were, in alphabetical order:
| Customer (1) |
Category |
Company Customer Since (1) | ||
| Abbott |
Food and Beverage |
Mid 2000s | ||
| Arizona |
Food and Beverage |
Late 1990s | ||
| Ashland (2) |
Automotive Lubricants |
Early 1970s | ||
| BP Lubricants (3) |
Automotive Lubricants |
Late 1960s | ||
| Church & Dwight |
Household |
Late 1980s | ||
| Clement Pappas |
Food and Beverage |
Mid 1990s | ||
| Clorox |
Food and Beverage and Household |
Late 1960s | ||
| Coca-Cola |
Food and Beverage |
Late 1990s | ||
| Danone |
Food and Beverage |
Late 1970s | ||
| Dial |
Household and Personal Care/Specialty |
Early 1990s | ||
| ExxonMobil |
Automotive Lubricants |
Early 2000s | ||
| Heinz |
Food and Beverage |
Early 1990s | ||
| Knouse |
Food and Beverage |
Early 1990s | ||
| Ocean Spray |
Food and Beverage |
Early 1990s | ||
| PepsiCo (4) |
Food and Beverage |
Early 2000s | ||
| Frito-Lay |
Food and Beverage |
Early 2000s | ||
| Gatorade |
Food and Beverage |
Late 1990s | ||
| Tropicana |
Food and Beverage |
Mid 1980s | ||
| Proctor & Gamble |
Household and Personal Care/Specialty |
Late 1950s | ||
| Petrobras |
Automotive Lubricants |
Early 1990s | ||
| Shell (5) |
Automotive Lubricants |
Early 1970s | ||
| Pennzoil-Quaker State |
Automotive Lubricants |
Early 1970s | ||
| Unilever |
Household, Personal Care/Specialty and Food and Beverage |
Early 1970s | ||
| Welch’s |
Food and Beverage |
Early 1990s |
| (1) | These companies include their predecessors, if applicable, and the dates may reflect customer relationships initiated by predecessors to the Company or entities acquired by the Company. |
| (2) | Ashland is the producer of Valvoline motor oil. |
| (3) | BP Lubricants is the producer of Castrol motor oil. |
| (4) | PepsiCo includes Frito-Lay, Gatorade and Tropicana. |
| (5) | Shell includes Pennzoil-Quaker State. |
9
Table of Contents
International Operations
The Company has significant operations outside the United States. As of December 31, 2009, the Company had 27 manufacturing facilities located in countries outside of the United States. Each of the Company’s operating segments produces plastic containers for all four of the Company’s core product categories.
South America. The Company has one on-site plant in Argentina, five on-site plants in Brazil and one off-site plant in each of Brazil and Venezuela.
Mexico. In Mexico, the Company has three off-site plants and two on-site plants.
Europe. The Company has seven on-site plants in Belgium (2), France, the Netherlands, Poland, Spain and Turkey and six off-site plants in Finland, France, the Netherlands, Poland, Turkey and the United Kingdom.
Canada. The Company has one off-site plant located near Toronto, Canada to service Canadian and northern U.S. customers.
Additionally, on August 12, 2009, the Company purchased a 22% interest in PPI Blow Pack Private Limited, located in India.
Additional information regarding international operations is provided in Note 23 of the Notes to Consolidated Financial Statements in this Report.
See “Item 1A. Risk Factors” for risks related to the Company’s foreign operations.
Competition
The Company faces substantial regional and international competition across its product lines from a number of well-established businesses. In the Company’s North American segment, its primary competitors are Alpla Werke Alwin Lehner GmbH (“Alpla”), Amcor Limited (“Amcor”), Ball Corporation (“Ball”), Consolidated Container Company LLC, Constar International Inc, Liquid Container L.P., Plastipak, Inc. (“Plastipak”) and Silgan Holdings Inc. In the Company’s European segment, its primary competitors are Alpla and Logoplaste Mealhada Lda. (“Logoplaste”). In the Company’s South American segment, its primary competitors are Alpla, Amcor, Plastipak and Logoplaste. The Company faces competition from most of these companies across its product categories. Competition is based on several factors including price, product design, technology (such as barrier protection and lightweighting) and customer service. Several of these competitors are larger and have greater financial and other resources than the Company. In addition, several of these competitors sell other products used by the Company’s customers such as cans or flexible packaging which can be bundled with plastic containers in sales proposals. Management believes that the Company competes effectively because of its superior levels of service, speed to market and product design and development capabilities.
Marketing and Distribution
The Company’s sales are made primarily through its own direct sales force, as well as selected brokers. Sales activities are conducted from the Company’s corporate headquarters in York, Pennsylvania and from field sales offices located in North America, Europe and South America. The Company’s products are typically delivered by truck, on a daily basis, in order to meet customers’ just-in-time delivery requirements, except in the case of on-site operations. In many cases, the Company’s on-site operations are integrated with its customers’ manufacturing operations so that deliveries are made, as needed, by direct conveyance to the customers’ filling lines. The Company utilizes a number of outside warehouses to store its finished goods prior to delivery to the customer.
10
Table of Contents
Product Design and Development
The Company’s ability to develop new, innovative containers to meet the design and performance requirements of its customers has established the Company as a market leader. The Company has demonstrated significant success in designing plastic containers that require customized features such as complex shapes, reduced weight, handles, grips, view stripes and pouring features. These packages often must meet specialized performance and structural requirements such as hot-fill capability, recycled material usage, oxygen barriers, flavor protection and multi-layering. Hot-fill technology allows customers’ products to be heated to temperatures high enough as to sterilize the inside of the container. In addition to increasing global demand for its customers’ products, the Company believes that its innovative packaging stimulates consumer demand and drives further conversion to plastic packaging. Consequently, the Company’s strong design capabilities have been especially important to its food and beverage customers, who generally use packaging to differentiate and add value to their brands while spending less on promotion and advertising. The Company has been awarded significant contracts based on these unique product design capabilities that it believes set it apart from its competition. Some of the Company’s design and conversion successes over the past few years include:
| • | retortable PP container for Boost and Ensure adult nutritional beverages; |
| • | aseptic HDPE container for 8th Continent soy-based beverages; |
| • | hot-fill PET containers with Monosorb™ oxygen scavenger for juices; |
| • | hot-fill PET and PP wide-mouth jar for Ragu pasta sauce, Seneca applesauce, Welch’s jellies and jams and Del Monte fruit slices; |
| • | lightweight 64 oz. rectangular container for hot-fill juice; |
| • | panel-free lightweight 16.9 oz. container for juices and teas; and |
| • | panel-free 20 oz. container for vitamin enhanced water. |
The Company’s innovative designs have also been recognized, through various awards, by a number of customers and industry organizations, including its:
| • | International Delight Bottle (2009 Ameristar Award); |
| • | GIBCO® Cell Culture Bottle for Invitrogen Medical (2009 Ameristar Award); |
| • | multi-layer PP wide-mouth jar for Del Monte (2008 Ameristar Award); |
| • | PET “Apple” container for Martinelli’s (2007 WorldStar Award, 2006 DuPont Award and 2006 Ameristar Award); |
| • | PET rectangular juice bottle for Tree Top (2007 WorldStar Award and 2006 Ameristar Award); |
| • | PET “Fridge Fit” bottle for Heinz (2006 Ameristar Award and 2006 DuPont Award); |
| • | dual-chamber bottle for Proctor & Gamble Cosmetics (2005 Food & Drug Personal Care package of the year); |
| • | ATP panel-free single-serve bottle and 64 oz. rectangular hot-fill bottle (2004 Ameristar Award); and |
| • | Ensure recloseable bottle (2004 Ameristar Award and 2004 DuPont Award). |
The Company has an advanced multi-layer injection technology, trade named SurShot®. The Company believes that SurShot® is among the best multi-layer PET technologies available and billions of plastic containers are produced and sold each year using SurShot® technology. This multi-layer technology allows the Company’s customers to package oxygen and flavor-sensitive products, such as fruit juices, beer and teas, for extended shelf-life. In addition, the SurShot® technology can accommodate up to 40% post-consumer recycled resin. This is an important component of packaging sustainability. There has been increasing demand by customers for the Company’s innovative packages that meet new sustainability requirements for reduced weight. Recent
11
Table of Contents
introductions of Escape®, G-Lite™ and SlingShot™ technologies for PET bottles provide customers with improved features such as reduced container weight, smooth sides for a premium look or improved stacking ability for shipping and storage.
Management believes these new products, along with the Company’s design and development capabilities, have positioned the Company as the packaging design, development and technology leader in the industry. Over the past several years the Company has received and has filed for numerous patents and design patents. See “—Intellectual Property.”
In 2005, the Company enhanced its technical capability with the opening of the Global Innovation & Design Center in York, Pennsylvania. The Company also has two major Technology Centers in York, Pennsylvania and Warsaw, Poland capable of producing limited quantities of new products and refurbishing equipment. The Company’s Warsaw facility also manufactures and assembles a proprietary line of extrusion blow molding machines. This proprietary technology has enabled the Company to develop a leaner, more efficient manufacturing process.
The Company incurs costs to research, design and develop new packaging products and technologies. Such costs, net of any reimbursement from customers, were $9.9 million, $9.6 million and $11.6 million for the years ended December 31, 2009, 2008 and 2007, respectively.
Manufacturing
A critical component of the Company’s strategy is to locate manufacturing facilities on-site, reducing expensive shipping and handling charges and increasing production and distribution efficiencies. The Company is a leader in providing on-site manufacturing arrangements. As of December 31, 2009, approximately one-third of its 80 manufacturing facilities were on-site at customer facilities. The Company operates over 880 production lines. The Company sometimes dedicates particular production lines within a plant to better service customers. The plants generally operate 24 hours a day, five to seven days a week, although not every production line is run constantly. When customer demand requires, the plants run seven days a week. Historically, demand for the Company’s products has not been subject to large seasonal fluctuations.
In the blow molding process used for HDPE applications, resin pellets are blended with colorants or other necessary additives and fed into the extrusion machine, which uses heat and pressure to form the resin into a round hollow tube of molten plastic called a parison. In a wheel blow molding process, bottle molds mounted radially on a wheel capture the parison as it leaves the extruder. Once inside the mold, air pressure is used to blow the parison into the bottle shape of the mold. While certain of the Company’s competitors also use wheel technology in their production lines, the Company has developed a number of proprietary improvements which management believes permit the Company’s wheels to operate at higher speeds and with greater efficiency in the manufacture of containers with one or more special features, such as multiple layers and in-mold labeling.
In the stretch blow molding process used for hot-fill PET applications, resin pellets are fed into an injection molding machine that uses heat and pressure to mold a test tube shaped parison or “preform.” The preform is then fed into a blow molder where it is re-heated to allow it to be formed through a stretch blow molding process into a final container. During this re-heat and blow process, special steps are taken to induce the temperature resistance needed to withstand high temperatures on customer filling lines. Management believes that the injection molders and blow molders used by the Company are widely recognized as the leading technologies for high speed production of hot-fill PET containers.
Other blow molding processes include: various types of extrusion blow molding for medium- and large-sized HDPE and PP containers; stretch blow molding for medium-sized PET containers; injection blow molding for personal care containers in various materials; two-stage PET blow molding for high-volume, high-performance mono-layer, multi-layer and heat set PET containers; and proprietary blow molding for drain-back systems and other specialized applications.
12
Table of Contents
The Company also operates a variety of bottle decorating platforms. Labeling and decorating is accomplished through in-mold techniques or one of many post-molding methods. Post-molding methods include pressure sensitive labelers, rotary full-wrap labelers, silk-screen decoration, heat transfer and hot stamp. These post-molding methods of decoration or labeling can be in-line or off-line with the molding machine. Typically, these decoration methods are used for bottles in the personal care/specialty product category.
The Company has implemented various process improvements to minimize labor costs, automate assembly tasks, increase throughput and improve quality. Types of automation range from case and tray packers to laser guided vehicles. Other automation equipment includes box and bulk bottle palletizers, pick and place robots, automatic in-line leak detection and vision inspection systems. Assembly automation includes bottle trimming, spout spinwelding or insertion, cap insertion and tube cutting/welding. Management believes that there are additional automation opportunities which could further minimize labor costs and improve plant efficiency.
The Company maintains quality assurance and control programs with respect to the performance of the products it manufactures, the performance of its suppliers and the compliance of its operations to its quality management system and sound manufacturing practices. The Company’s production lines are equipped with specific quality control inspection equipment and its employees continuously monitor product attributes and performance through a comprehensive Statistical Process Control system. Quality control laboratories are maintained at each manufacturing facility to test its products and validate their compliance to customer requirements. The Company continuously monitors and enhances its quality assurance and control programs to keep pace with the most current technologies and to meet and exceed customer expectations.
The Company has highly modernized equipment in the majority of its plants, consisting primarily of rotational wheel systems and shuttle systems, both of which are used for HDPE and PP blow molding, and injection-stretch blow molding systems for value-added PET containers. The Company is also pursuing development initiatives in barrier technologies to strengthen its position in the food and beverage product category. In the past, the Company has achieved substantial cost savings in its manufacturing process through productivity and process enhancements, including increasing line speeds, utilizing recycled products, reducing scrap and optimizing plastic weight requirements for each product’s specifications.
Cash paid for property, plant and equipment, excluding acquisitions, for 2009, 2008 and 2007 was $146.0 million, $148.6 million and $153.4 million, respectively. Management believes that capital expenditures to maintain and upgrade property, plant and equipment are important to remain competitive. Management estimates that on average the annual maintenance capital expenditures are approximately $30 million to $40 million per year. For 2010, the Company expects to make capital expenditures, excluding acquisitions, ranging from $140 million to $160 million.
Most customer orders are manufactured with a lead time of three weeks or less. Therefore, the amount of backlog orders at December 31, 2009, was not material. The Company expects all backlog orders at December 31, 2009, to be shipped during the first quarter of 2010.
13
Table of Contents
Ownership
In February 2010, we completed a reorganization and our initial public offering (“IPO”). In connection with the IPO, GPC, on February 4, 2010, increased the number of authorized shares of common stock to 500,000,000 and of preferred stock to 100,000,000, and effected a 1,465.4874-for-one stock split of its shares of common stock. The chart below shows our ownership structure immediately following our IPO, including the purchase by GPC of 16,666,667 newly-issued unregistered limited partnership units:
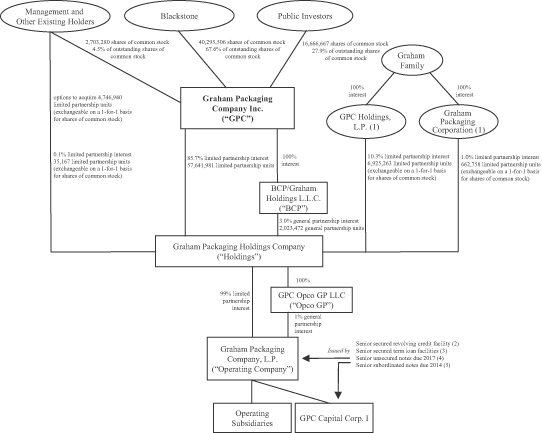
| (1) | As of February 18, 2010, entities controlled by the Graham Family, GPC Holdings L.P. and Graham Packaging Corporation, had exercised their rights to exchange, on a one-for-one basis, 1,324,900 limited partnership units of Holdings for 1,324,900 shares of GPC, respectively. As a result, entities controlled by the Graham Family own limited partnership units representing 9.6% of the limited partnership interests in Holdings and shares representing 2.2% of GPC’s common stock. |
| (2) | $248.0 million senior secured revolving credit facility, of which $135.2 million will mature on October 7, 2010, and $112.8 million will mature on October 1, 2013. As of December 31, 2009, $237.8 million was available for borrowing under this facility, after giving effect to $10.2 million of outstanding letters of credit. Upon consummation of GPC’s initial public offering, commitments under the Company’s Credit Agreement (as defined herein) automatically increased by an additional $12.0 million, which additional commitments will mature on October 1, 2013. |
14
Table of Contents
| (3) | Consists of $1,801.0 million principal amount, $610.0 million of which is scheduled to mature on October 7, 2011 and $1,191.0 million of which is scheduled to mature on April 5, 2014, net of $19.9 million unamortized discount that will be amortized and included in interest expense as the term loans mature. |
| (4) | $253.4 million of senior unsecured notes due 2017, which were issued at a $3.4 million discount that will be amortized and included in interest expense as the notes mature. |
| (5) | $375.0 million of senior subordinated unsecured notes due 2014. |
As a result of the IPO, GPC, is now a public company incorporated in Delaware with common stock listed on the New York Stock Exchange and is currently owned by public investors, Blackstone, the Graham Family and current and former management. GPC is a holding company whose only material assets are the direct ownership of 1) a limited partnership interest in Holdings of 87.6% after giving effect to the IPO, the subsequent purchase by GPC of 16,666,667 newly-issued unregistered limited partnership units and after entities controlled by the Graham Family exercised their rights to exchange 1,324,900 limited partnership units of Holdings for 1,324,900 shares of GPC through February 18, 2010, and 2) 100% of the limited liability company interests of BCP, a Delaware limited liability company, which holds a 3.0% general partnership interest in Holdings, after giving effect to the IPO.
As a result of the reorganization described above, Holdings, a Pennsylvania limited partnership, has one owner of its general partnership interests (BCP) and three owners of its limited partnership interests (GPC, the Graham Family and a former member of management). Holdings owns a 99% limited partnership interest in the Operating Company, and GPC Opco GP LLC (“Opco GP”), a wholly-owned subsidiary of Holdings, owns a 1% general partnership interest in the Operating Company.
GPC Capital Corp. I (“CapCo I”), a wholly-owned subsidiary of the Operating Company, and GPC Capital Corp. II (“CapCo II”), a wholly-owned subsidiary of Holdings, were incorporated in Delaware in January 1998. The sole purpose of CapCo I is to act as co-obligor of the Notes (as defined herein) and as co-borrower under the Credit Agreement (as defined herein). CapCo II currently has no obligations under any of the Company’s outstanding indebtedness. CapCo I and CapCo II have only nominal assets and do not conduct any operations. Accordingly, investors in the Notes must rely on the cash flow and assets of the Operating Company or the cash flow and assets of Holdings, as the case may be, for payment of the Notes.
Employees
As of December 31, 2009, the Company had approximately 7,200 employees, 5,800 of whom were located in North America, 900 of whom were located in Europe and 500 of whom were located in South America. Approximately 80% of the Company’s employees are hourly wage employees, 53% of whom are represented by various labor unions and are covered by various collective bargaining agreements that expire between now and June 2013. In North America, 81% of the Company’s employees are hourly wage employees, 43% of whom are represented by various labor unions. In Europe, 79% of the Company’s employees are hourly wage employees, 91% of whom are represented by various labor unions. In South America, 77% of the Company’s employees are hourly wage employees, 95% of whom are represented by various labor unions. Management believes that it enjoys good relations with the Company’s employees and there have been no significant work stoppages in the past three years.
Environmental Matters
The Company’s operations, both in the United States and abroad, are subject to national, state, foreign, provincial and/or local laws and regulations that impose limitations and prohibitions on the discharge and emission of, and establish standards for the use, disposal and management of, regulated materials and waste, and that impose liability for the costs of investigating and cleaning up, and damages resulting from, present and past spills, disposals or other releases of hazardous substances or materials. These domestic and international
15
Table of Contents
environmental laws can be complex and may change often. Compliance expenses can be significant and violations may result in substantial fines and penalties. In addition, environmental laws such as the Comprehensive Environmental Response, Compensation and Liability Act of 1980, as amended, also known as “Superfund” in the United States, impose strict, and in some cases joint and several, liability on specified responsible parties for the investigation and cleanup of contaminated soil, groundwater and buildings, and liability for damages to natural resources, at a wide range of properties. As a result, the Company may be liable for contamination at properties that it currently owns or operates, as well as at its former properties or off-site properties where it may have sent hazardous substances. The Company is not aware of any material noncompliance with the environmental laws currently applicable to it and is not the subject of any material environmental claim for liability with respect to contamination at any location. Based on existing information, management believes that it is not reasonably likely that losses related to known environmental liabilities, in aggregate, will be material to the Company’s financial position, results of operations, liquidity or cash flows. For its operations to comply with environmental laws, the Company has incurred and will continue to incur costs, which were not material in fiscal 2009 and are not expected to be material in the future.
As a result of the closing of the Company’s plant located in Edison, New Jersey in 2008, the Company is subject to New Jersey’s Industrial Site Recovery Act (“ISRA”). The Company acquired this facility from Owens-Illinois, Inc. in 2004. ISRA is an environmental law that specifies a process of reporting to the New Jersey Department of Environmental Protection (“NJDEP”) and, in some situations, investigating, cleaning up and/or taking other measures with respect to environmental conditions that may exist at an industrial establishment that has been shut down or is being transferred. The Company is in the process of evaluating and implementing its obligations under ISRA regarding this facility. The Company has recorded a preliminary reserve of $0.4 million for this obligation as of December 31, 2009. This amount may change based on results of additional investigation expected to be undertaken for NJDEP.
A number of governmental authorities, both in the United States and abroad, have considered, are expected to consider or have passed legislation aimed at reducing the amount of disposed plastic wastes. Those programs have included, for example, mandating certain rates of recycling and/or the use of recycled materials, imposing deposits or taxes on plastic packaging material and/or requiring retailers or manufacturers to take back packaging used for their products. That legislation, as well as voluntary initiatives similarly aimed at reducing the level of plastic wastes, could reduce the demand for certain plastic packaging, result in greater costs for plastic packaging manufacturers or otherwise impact the Company’s business. Some consumer products companies, including some of the Company’s customers, have responded to these governmental initiatives and to perceived environmental concerns of consumers by using containers made in whole or in part of recycled plastic. To date, the Company has not been materially adversely affected by these initiatives and developments. The Company operates a large HDPE bottles-to-bottles recycling plant in York, Pennsylvania.
Intellectual Property
The Company holds various patents and trademarks. While in the aggregate the patents are of material importance to its business, the Company believes that its business is not dependent upon any one single patent, group of patents or trademark. The Company also relies on unpatented proprietary know-how and continuing technological innovation and other trade secrets to develop and maintain its competitive position. Third parties could, however, obtain knowledge of this proprietary know-how through independent development or other unauthorized access. In addition to its own patents and proprietary know-how, the Company is a party to licensing arrangements and other agreements authorizing it to use other proprietary processes, know-how and related technology and/or to operate within the scope of certain patents owned by other entities. The duration of the Company’s licenses generally ranges from 5 to 17 years. In some cases the licenses granted to the Company are perpetual and in other cases the term of the license is related to the life of the patent associated with the license. The Company also has licensed some of its intellectual property rights to third parties.
16
Table of Contents
| Item 1A. | Risk Factors |
The following are certain risk factors that could materially and adversely affect our business, results of operations or financial condition.
Risks Related to Our Business
Our industry is very competitive and increased competition could reduce prices and our profit margins.
We operate in a competitive environment. In the past, we have encountered pricing pressures in our markets and could experience further declines in prices of plastic packaging as a result of competition. Although we have been able over time to partially offset pricing pressures by reducing our cost structure and making the manufacturing process more efficient by providing new and innovative technology, we may not be able to continue to do so in the future. Our business, results of operations and financial condition may be materially and adversely affected by further declines in prices of plastic packaging and such further declines could lead to a loss of business and a decline in our margins.
If we are unable to develop product innovations and improve our production technology and expertise, we could lose customers or market share.
Our success may depend on our ability to adapt to technological changes in the plastic packaging industry. If we are unable to timely develop and introduce new products, or enhance existing products, in response to changing market conditions or customer requirements or demands, our competitiveness could be materially and adversely affected.
We may be unable to protect our proprietary technology from infringement.
We rely on a combination of patents and trademarks, licensing agreements and unpatented proprietary know-how and trade secrets to establish and protect our intellectual property rights. We enter into confidentiality agreements with customers, vendors, employees, consultants and potential acquisition candidates as necessary to protect our know-how, trade secrets and other proprietary information. However, these measures and our patents and trademarks may not afford complete protection of our intellectual property, and it is possible that third parties may copy or otherwise obtain and use our proprietary information and technology without authorization or otherwise infringe on our intellectual property rights. We cannot assure that our competitors will not independently develop equivalent or superior know-how, trade secrets or production methods. Significant impairment of our intellectual property rights could harm our business or our ability to compete. For example, if we are unable to maintain the proprietary nature of our technologies, our profit margins could be reduced as competitors could more easily imitate our products, possibly resulting in lower prices or lost sales for certain products. In such a case, our business, results of operations and financial condition may be materially and adversely affected.
We are periodically involved in litigation in the course of our business to protect and enforce our intellectual property rights, and third parties from time to time initiate claims or litigation against us asserting infringement or violation of their intellectual property rights. We cannot assure that our products will not be found to infringe upon the intellectual property rights of others. Further, we cannot assure that we will prevail in any such litigation, or that the results or costs of any such litigation will not have a material adverse effect on our business. Any litigation concerning intellectual property could be protracted and costly and is inherently unpredictable and could have a material adverse effect on our business, results of operations or financial condition regardless of its outcome.
17
Table of Contents
We would lose a significant source of revenues and profits if we lost any of our largest customers.
The loss of one of our largest customers could result in: (i) our having excess capacity if we are unable to replace that customer; (ii) our having excess overhead and fixed costs and possible impairment of long-lived assets; and (iii) our selling, general and administrative expenses and capital expenditures representing increased portions of our revenues.
In 2009, our top 20 customers comprised 69% of our net sales. PepsiCo (collectively, with its affiliates, such as Frito-Lay, Gatorade and Tropicana) is our largest customer, with all product lines we provide to PepsiCo collectively accounting for approximately 10.8%, 13.3% and 14.0% of our net sales for the years ended December 31, 2009, 2008 and 2007, respectively.
If any of our large customers terminated its relationship with us, we would lose a significant source of revenues and profits.
Contracts with customers generally do not require them to purchase any minimum amounts of products from us, and customers may not purchase amounts that meet our expectations.
The majority of our sales are made pursuant to long-term customer purchase orders and contracts. Customers’ purchase orders and contracts typically vary in length with terms up to ten years. The contracts, including those with PepsiCo, generally are requirements contracts which do not obligate the customer to purchase any given amount of product from us. Prices under these arrangements are tied to market standards and therefore vary with market conditions. Changes in the cost of resin, the largest component of our cost of goods sold, are passed through to customers by means of corresponding changes in product pricing in accordance with our agreements with these customers and industry practice. Increases in resin prices relative to alternative packaging materials, or other price increases, may cause customers to decrease their purchases from us. Additionally, if customers undertake transformational initiatives to their product lines, such as concentrate conversions or product obsolescence actions, we may lose a source of revenues and profits. As a result, despite the existence of supply contracts with our customers, we face the risk that in the future customers will not continue to purchase amounts that meet our expectations.
Increases in resin prices, relative to alternative packaging materials, and reductions in resin supplies could significantly slow our growth and disrupt our operations.
We depend on large quantities of PET, HDPE and other resins in manufacturing our products. One of our primary strategies is to grow the business by capitalizing on the conversion from glass, metal and paper containers to plastic containers. Resin prices can fluctuate significantly with fluctuations in crude oil and natural gas prices, as well as changes in refining capacity and the demand for other petroleum-based products. A sustained increase in resin prices, relative to alternative packaging materials, to the extent that those costs are not passed on to the end-consumer, would make plastic containers less economical for our customers and could result in a slower pace of conversions to, or reductions in the use of, plastic containers. Changes in the cost of resin are passed through to customers by means of corresponding changes in product pricing, in accordance with our agreements with these customers and industry practice. However, if we are not able to do so in the future and there are sustained increases in resin prices, relative to alternative packaging materials, our operating margins could be affected adversely.
While there is currently an adequate supply of resin available from many sources, this may not be the case in the future. Several of our larger suppliers have either entered, or are emerging from, bankruptcy protection. If the number of suppliers is significantly reduced in the future, this could affect our ability to obtain resin timely, or obtain resin at favorable prices, and our operations and profitability may be impaired.
18
Table of Contents
Our international operations are subject to a variety of risks related to foreign currencies and local law in several countries.
We have significant operations outside the United States, and therefore hold assets, incur liabilities, earn revenues and pay expenses in a variety of currencies other than the U.S. dollar. The financial statements of our foreign subsidiaries are translated into U.S. dollars. Our operations outside the United States accounted for approximately 21.5%, 20.9% and 19.9% of our net sales for the years ended December 31, 2009, 2008 and 2007, respectively. As a result, we are subject to risks associated with operating in foreign countries, including fluctuations in currency exchange and interest rates, imposition of limitations on conversion of foreign currencies into U.S. dollars or remittance of dividends and other payments by foreign subsidiaries, imposition or increase of withholding and other taxes on remittances and other payments by foreign subsidiaries, labor relations problems, hyperinflation in some foreign countries and imposition or increase of investment and other restrictions by foreign governments or the imposition of environmental or employment laws. Furthermore, we typically price our products in our foreign operations in local currencies. As a result, an increase in the value of the U.S. dollar relative to the local currencies of profitable foreign subsidiaries can have a negative effect on our profitability. In our consolidated financial statements, we translate our local currency financial results into U.S. dollars based on average exchange rates prevailing during a reporting period or the exchange rate at the end of that period. During times of a strengthening U.S. dollar, at a constant level of business, our reported international sales, earnings, assets and liabilities will be reduced because the local currency will translate into fewer U.S. dollars. Exchange rate fluctuations increased comprehensive income by $19.6 million, increased comprehensive loss by $65.9 million and decreased comprehensive loss by $36.3 million for the years ended December 31, 2009, 2008 and 2007, respectively. In addition to currency translation risks, we incur a currency transaction risk whenever one of our operating subsidiaries enters into either a purchase or a sale transaction using a currency different from the operating subsidiary’s functional currency. In several countries where we operate, resin purchases must be made in U.S. dollars. Furthermore, changes in local economic conditions can affect operations. Our international operations also expose us to different local political and business risks and challenges. For example, in certain countries, such as Venezuela and Argentina, we are faced with periodic political issues which could result in currency risks or the risk that we are required to include local ownership or management in our businesses. The above mentioned risks in North America, Europe and South America may hurt our ability to generate revenue in those regions in the future.
We may not be able to recover the carrying value of our long-lived assets, which could require us to record additional asset impairment charges and materially and adversely affect our results of operations.
We had net property, plant and equipment of $1,017.8 million at December 31, 2009, or 47.9% of our total assets. We recorded asset impairment charges to property, plant and equipment of $41.8 million, $93.2 million and $135.5 million for the years ended December 31, 2009, 2008 and 2007, respectively. We operate in a competitive industry with rapid technological innovation. In order to remain competitive, we develop and invest in new equipment which enhances productivity, often making older equipment obsolete. In addition, changing market conditions can also impact our ability to recover the carrying value of our long-lived assets. The continuing presence of these factors, as well as other factors, could require us to record additional asset impairment charges in future periods which could materially and adversely affect our results of operations.
Goodwill and other identifiable intangible assets represent a significant portion of our total assets, and we may never realize the full value of our intangible assets.
As of December 31, 2009, goodwill and other identifiable intangible assets were approximately $480.1 million, or 22.6% of our total assets. Goodwill and other identifiable intangible assets are recorded at fair value on the date of acquisition. In accordance with the guidance under Financial Accounting Standards Board (“FASB”) Accounting Standards Codification (“ASC”) 350-20, “Intangibles—Goodwill and Other,” we review such assets at least annually for impairment. Impairment may result from, among other things, deterioration in performance, adverse market conditions, adverse changes in applicable laws or regulations, including changes that restrict the activities of or affect the products and services we sell, challenges to the validity of certain
19
Table of Contents
registered intellectual property, reduced sales of certain products incorporating registered intellectual property, and a variety of other factors. The amount of any quantified impairment must be expensed immediately as a charge to results of operations. Depending on future circumstances, it is possible that we may never realize the full value of our intangible assets. Any future determination of impairment of goodwill or other identifiable intangible assets could have a material adverse effect on our financial position and results of operations.
Our ability to operate effectively could be impaired if we lost key personnel.
Our success depends to a large extent on a number of key employees, and the loss of the services provided by them could have a material adverse effect on our ability to operate our business and implement our strategies effectively. The loss of members of our senior management team could have a material adverse effect on our operations. We do not maintain “key” person insurance on any of our executive officers.
If we make acquisitions in the future, we may experience assimilation problems and dissipation of management resources and we may need to incur additional indebtedness.
Our future growth may be a function, in part, of acquisitions of other consumer goods packaging businesses, including investments in geographic regions we are not familiar with. To the extent that we grow through acquisitions, we will face operational and financial risks, such as the risk of failing to assimilate the operations and personnel of the acquired businesses, disrupting our ongoing business, dissipating our limited management resources and impairing relationships with employees and customers of the acquired business as a result of changes in ownership and management. Additionally, we have incurred indebtedness to finance past acquisitions, and would likely incur additional indebtedness to finance future acquisitions, as permitted under the Credit Agreement (as defined herein) and the indentures governing our Notes (as defined herein), in which case we would also face certain financial risks associated with the incurrence of additional indebtedness to make an acquisition, such as a reduction in our liquidity, access to capital markets and financial stability.
Additionally, the types of acquisitions we will be able to make are limited by our Credit Agreement, which limits the amount that we may pay for an acquisition to $120 million plus additional amounts based on an unused available capital expenditure limit, certain proceeds from new equity issuances and other amounts.
Our operations and profitability could suffer if we experience labor relations problems.
As of December 31, 2009, approximately 3,100 of our approximately 7,200 employees were covered by collective bargaining agreements with various international and local labor unions. In addition, as of December 31, 2009, we operated 80 facilities, of which 40 were union facilities operated primarily by union employees. In the U.S. our union agreements typically have a term of three or four years and thus regularly expire and require negotiation in the course of our business. In 2010, collective bargaining agreements covering approximately 750 employees in the U.S. will expire. Upon the expiration of any of our collective bargaining agreements, we may be unable to negotiate new collective bargaining agreements on terms favorable to us, and our business operations at one or more of our facilities may be interrupted as a result of labor disputes or difficulties and delays in the process of renegotiating our collective bargaining agreements. A work stoppage at one or more of our facilities could have a material adverse effect on our business, results of operations and financial condition.
Our ability to expand our operations could be adversely affected if we lose access to additional blow molding equipment.
Access to blow molding equipment is important to our ability to expand our operations. We have access to a broad array of blow molding equipment and suppliers. However, if we fail to continue to access this new blow molding equipment or these suppliers, our ability to expand our operations may be materially and adversely affected until alternative sources of technology can be arranged.
20
Table of Contents
Our operations could expose us to substantial environmental costs and liabilities.
We are subject to a variety of national, state, foreign, provincial and/or local laws and regulations that impose limitations and prohibitions on the discharge and emission of, and establish standards for the use, disposal and management of, regulated materials and waste, and that impose liability for the costs of investigating and cleaning up, and damages resulting from, present and past spills, disposals or other releases of hazardous substances or materials. These domestic and international environmental laws can be complex and may change often, the compliance expenses can be significant and violations may result in substantial fines and penalties. In addition, environmental laws such as Superfund impose strict, and in some cases joint and several, liability on specified responsible parties for the investigation and cleanup of contaminated soil, groundwater and buildings, and liability for damages to natural resources, at a wide range of properties. As a result, we may be liable for contamination at properties that we currently own or operate, as well as at our former properties or off-site properties where we may have sent hazardous substances. As a manufacturer, we have an inherent risk of liability under environmental laws, both with respect to ongoing operations and with respect to contamination that may have occurred in the past on our properties or as a result of our operations. We could, in the future, incur a material liability resulting from the costs of complying with environmental laws or any claims concerning noncompliance, or liability from contamination.
We cannot predict what environmental legislation or regulations will be enacted in the future, how existing or future laws or regulations will be administered or interpreted, or what environmental conditions may be found to exist at our facilities or at third party sites for which we are liable. Enactment of stricter laws or regulations, stricter interpretations of existing laws and regulations or the requirement to undertake the investigation or remediation of currently unknown environmental contamination at our own or third-party sites may require us to make additional expenditures, some of which could be material.
In addition, a number of governmental authorities, both in the United States and abroad, have considered, or are expected to consider, legislation aimed at reducing the amount of plastic wastes disposed. Programs have included, for example, mandating certain rates of recycling and/or the use of recycled materials, imposing deposits or taxes on plastic packaging material and requiring retailers or manufacturers to take back packaging used for their products. Legislation, as well as voluntary initiatives similarly aimed at reducing the level of plastic wastes, could reduce the demand for certain plastic packaging, result in greater costs for plastic packaging manufacturers or otherwise impact our business. Some consumer products companies, including some of our customers, have responded to these governmental initiatives and to perceived environmental concerns of consumers by using containers made in whole or in part of recycled plastic. Future legislation and initiatives could adversely affect us in a manner that would be material.
If we were deemed an “investment company” under the Investment Company Act of 1940 (the “1940 Act”) as a result of our ownership of Holdings, applicable restrictions could make it impractical for us to continue our business as contemplated and could have a material adverse effect on our business.
If we were to cease participation in the management of Holdings, our interest in Holdings could be deemed an “investment security” for purposes of the 1940 Act. Generally, a person is deemed to be an “investment company” if it owns investment securities having a value exceeding 40% of the value of its total assets (exclusive of U.S. government securities and cash items), absent an applicable exemption. We will have no material assets other than our equity interest in Holdings. A determination that this interest was an investment security could result in our being an investment company under the 1940 Act and becoming subject to the registration and other requirements of the 1940 Act.
The 1940 Act and the rules thereunder contain detailed parameters for the organization and operations of investment companies. Among other things, the 1940 Act and the rules thereunder limit or prohibit transactions with affiliates, impose limitations on the issuance of debt and equity securities, prohibit the issuance of stock options, and impose certain governance requirements. We intend to conduct our operations so that we will not be deemed to be an investment company under the 1940 Act. However, if anything were to happen which would
21
Table of Contents
cause us to be deemed to be an investment company under the 1940 Act, requirements imposed by the 1940 Act, including limitations on our capital structure, ability to transact business with affiliates and ability to compensate key employees, could make it impractical for us to continue our business as currently conducted, impair the agreements and arrangements between and among us, Holdings, Blackstone or the Graham Family, or any combination thereof and materially adversely affect our business, financial condition and results of operations.
We had net losses in recent years and may not generate net income in the future.
For the years ended December 31, 2008 and 2007, we incurred net losses of $57.9 million and $207.4 million, respectively. Continuing net losses may limit our ability to execute our strategy and we may not generate net income from operations in the future. Factors contributing to losses in recent years included, but were not limited to:
| • | interest on our debt; |
| • | impairment of our long-lived tangible and intangible assets; |
| • | the write-off of deferred financing fees related to our debt refinancings; and |
| • | severance and other payments associated with exiting unprofitable plants. |
We will be required to pay our pre-IPO stockholders and the Graham Family for certain tax benefits we may claim arising in connection with our IPO and related transactions, which amounts are expected to be material.
In connection with our IPO, we entered into an exchange agreement with the Graham Family. Pursuant to the exchange agreement, limited partnership units held by the Graham Family may (subject to the terms of the exchange agreement) be exchanged for shares of our common stock outstanding on a one-for-one basis, subject to customary conversion rate adjustments for stock splits, stock dividends and reclassifications. Holdings intends to have in effect an election under Section 754 of the Internal Revenue Code of 1986, as amended (the “Code”) effective for each taxable year in which an exchange of limited partnership units for shares of common stock occurs, which may result in an adjustment to the tax basis of the assets of Holdings at the time of an exchange of limited partnership units. Any such exchanges are expected to result in an increase in the tax basis of the tangible and intangible assets of Holdings that otherwise would not have been available. Similar increases to the tax basis of the tangible and intangible assets of Holdings resulted from our 1998 acquisition of Holdings. These increases in tax basis will increase (for tax purposes) depreciation and amortization and therefore reduce the amount of tax that we would otherwise be required to pay in the future. These increases in tax basis may also decrease gain (or increase loss) on future dispositions of certain capital assets to the extent tax basis is allocated to those capital assets. Additionally, in connection with the IPO, we will be able to utilize net operating losses that arose prior to the IPO and are therefore attributable to our pre-IPO stockholder (i.e., Blackstone, management and other stockholders). These net operating loss carryforwards will also reduce the amount of tax that we would otherwise be required to pay in the future.
We have entered into an income tax receivable agreement with GPC Holdings, L.P. (“GPC LP”) that provide for the payment by us to the Graham Family of 85% of the amount of cash savings, if any, in U.S. federal, state and local income tax that we actually realize (or are deemed to realize in the case of an early termination payment or a change of control as discussed below) as a result of these increases in tax basis (specifically, those attributable to exchange of limited partnership units, as described above) and of certain other tax benefits related to our entering into the income tax receivable agreement, including tax benefits attributable to payments under the income tax receivable agreement. We have also entered into an income tax receivable agreement with certain of our pre-IPO stockholders that will provide for the payment to all of our pre-IPO stockholders (i.e., Blackstone, management and other investors) of 85% of the amount of cash savings, if any, in U.S. federal, state and local income tax that we actually realize (or are deemed to realize in the case of an early termination or a change of control as discussed below) as a result of (i) the utilization of our net operating losses attributable to periods prior to the IPO, and (ii) any increase to the tax basis of the assets of Holdings relating to our 1998 acquisition of 85% of Holdings (as discussed above) and certain other tax benefits related to our entering into the income tax receivable agreement, including tax benefits attributable to payments under the income tax receivable agreement.
22
Table of Contents
These payment obligations are our obligations and not obligations of Holdings or any of our other subsidiaries. The actual increase in tax basis, actual amount and utilization of net operating losses, as well as the amount and timing of any payments under the income tax receivable agreements, will vary depending upon a number of factors, including the timing of subsequent exchanges, the price of shares of our common stock outstanding at the time of an exchange, the extent to which such exchanges are taxable and the amount, character and timing of our taxable income in the future.
We expect that the payments that we make under these income tax receivable agreements will be material. Assuming no material changes in the relevant tax law, and that we earn sufficient taxable income to realize the full tax benefits subject to the income tax receivable agreements, we expect that future payments under the income tax receivable agreements will aggregate to between $190 million to $240 million with potential additional payments for tax basis step-ups relating to future exchanges by the Graham Family of their limited partnership units in Holdings for common stock depending on the timing and value of such exchanges. This range is based on our assumptions using presently available information including with respect to valuation, historic tax basis and the amount of tax attributes subject to the income tax receivable agreements that were in existence as of the IPO date. Such amounts may differ materially from the amounts presented above based on various items, including final valuation analysis and updated determinations of taxable income and historic tax basis amounts. The payments under the income tax receivable agreements are not conditioned upon these parties’ continued ownership of us or Holdings.
In addition, the income tax receivable agreements provide that upon certain mergers, asset sales, other forms of business combinations or other changes of control, the income tax receivable agreements will terminate and we will be required to make a payment equal to the present value of future payments under the income tax receivable agreements, which payment would be based on certain assumptions, including those relating to our future taxable income. In these situations, our obligations under the income tax receivable agreements could have a substantial negative impact on our liquidity and could have the effect of delaying, deferring or preventing certain mergers, asset sales, other form of business combinations or other changes of control.
Our counterparties under these agreements will not reimburse us for any payments previously made under the income tax receivable agreements if such benefits are subsequently disallowed (although future payments would be adjusted to the extent possible to reflect the result of such disallowance). As a result, in certain circumstances, payments could be made under the income tax receivable agreements in excess of our cash tax savings.
Our only material asset is our interest in Holdings, and we are accordingly dependent upon distributions from Holdings to pay dividends and taxes and other expenses, including payments under the income tax receivable agreements.
We are a holding company and have no material assets other than our ownership of limited partnership units in Holdings. We have no independent means of generating revenue. We intend to cause Holdings to make distributions to its partners in an amount sufficient to cover all applicable taxes payable and dividends, if any, declared by us, as well as any payments due under the income tax receivable agreements described above. However, the instruments and agreements governing our indebtedness contain covenants that restrict the ability or our subsidiaries to make distributions to us, which could affect our ability to make payments under the income tax receivable agreements and to pay dividends. To the extent that we need funds and Holdings is restricted from making such distributions under applicable law or regulation, or is otherwise unable to provide such funds pursuant to the terms of our indebtedness, it could materially adversely affect our liquidity and financial condition. To the extent that we are unable to make payments under the income tax receivable agreements for any reason, such payments will be deferred and will accrue interest at LIBOR plus five percent per annum until paid.
23
Table of Contents
Blackstone controls us and may have conflicts of interest with us in the future.
Blackstone owns shares of our common stock sufficient for the majority vote over all matters requiring a stockholder vote, including: the election of directors; mergers, consolidations or acquisitions; the sale of all or substantially all of our assets and other decisions affecting our capital structure; the amendment of our restated certificate of incorporation and amended and restated bylaws; and our winding up and dissolution. In addition, pursuant to the stockholders’ agreement with Blackstone, Blackstone has the right to nominate to our board of directors a number of designees equal to: (i) at least a majority of the total number of directors comprising our board at such time as long as Blackstone beneficially owns more than 35% of the shares of our common stock entitled to vote generally in the election of our directors; (ii) 42% of the total number of directors comprising our board at such time as long as Blackstone beneficially owns more than 25% but less than or equal to 35% of the shares of our common stock entitled to vote generally in the election of our directors; (iii) 28% of the total number of directors comprising our board of directors at such time as long as Blackstone beneficially owns more than 15% but less than or equal to 25% of the shares of our common stock entitled to vote generally in the election of our directors; and (iv) 14% of the total number of directors comprising our board of directors at such time as long as Blackstone beneficially owns 5% or more of the shares of our common stock entitled to vote generally in the election of our directors. As a result, even after Blackstone no longer owns a majority of our voting stock, Blackstone could continue to have significant influence over our decision to enter into any corporate transaction and may have the ability to prevent any transaction that requires the approval of stockholders, regardless of whether or not other stockholders believe that such transaction is in their own best interests. Such concentration of voting power could have the effect of delaying, deterring or preventing a change of control or other business combination that might otherwise be beneficial to our stockholders or noteholders. As long as Blackstone continues to own, directly or indirectly, a significant amount of the outstanding shares of our common stock, it will continue to be able to or effectively control our decisions.
Additionally, Blackstone is in the business of making investments in companies and may from time to time acquire and hold interests in businesses that compete directly or indirectly with us. Our restated certificate of incorporation provides that neither Blackstone, nor members of our board of directors who are not our employees (including any directors who also serve as officers) have any duty to refrain from engaging, directly or indirectly, in the same business activities or similar business activities or lines of business in which we operate. Blackstone may also pursue acquisition opportunities that may be complementary to our business and, as a result, those acquisition opportunities may not be available to us. These potential conflicts of interest could have a material adverse effect on our business, financial condition, results of operations or prospects if attractive corporate opportunities are allocated by Blackstone to themselves or their other affiliates instead of to us.
Risks Related to Our Indebtedness
Our indebtedness could adversely affect our cash flow and our ability to operate and grow our business.
At December 31, 2009, we had $2,436.9 million of total consolidated indebtedness. In addition, at December 31, 2009, after taking into account letters of credit of $10.2 million, we had $237.8 million of revolving loan capacity under our senior secured credit facility (the “Credit Agreement”). Under our Credit Agreement, we also have available to us an uncommitted incremental loan facility in an amount of up to an additional $300.0 million, and we may incur additional indebtedness as permitted by our Credit Agreement and other instruments governing our indebtedness.
A significant portion of our cash flow must be used to service our indebtedness and is therefore not available to be used in our business. Our ability to generate cash flow is subject to general economic, financial, competitive, legislative, regulatory and other factors that may be beyond our control. In addition, a substantial portion of our indebtedness bears interest at floating rates. At December 31, 2009, a one percentage point change in the interest rates for our variable-rate indebtedness would impact interest expense by an aggregate of approximately $6.2 million, excluding the impact of our interest rate collar and swap agreements. Our term loan C balance of $1,191.0 million at December 31, 2009, has a LIBOR floor of 2.5%. If LIBOR rates exceed that floor, a one percentage point change in the interest rates could impact interest expense by an additional amount of approximately $11.9 million.
24
Table of Contents
Our obligations in connection with our indebtedness could have important consequences. For example, they could:
| • | increase our vulnerability to general adverse economic and industry conditions; |
| • | require us to dedicate a significant portion of our cash flow from operations to payments on our indebtedness, thereby reducing the availability of our cash flow to fund working capital, acquisitions, capital expenditures and for other general corporate purposes; |
| • | limit our flexibility in planning for, or reacting to, changes in our business and the industry in which we operate; |
| • | restrict us from making strategic acquisitions or exploiting business opportunities; and |
| • | limit our ability to borrow additional funds. |
Despite our current level of indebtedness, we may incur additional debt in the future, which could increase the risks associated with our substantial outstanding indebtedness.
We continually pursue organic growth and selectively evaluate and pursue acquisition opportunities and may incur additional indebtedness, including indebtedness under our Credit Agreement, to finance any such growth and acquisitions and to fund any resulting increased operating needs. If new debt is added to our current debt levels, the risks we now face related to our indebtedness could increase.
The terms of our debt instruments restrict the manner in which we conduct our business and may limit our ability to implement elements of our business strategy.
The instruments and agreements governing our indebtedness contain numerous covenants including financial and operating covenants, some of which are quite restrictive. These covenants affect, and in many respects limit, among other things, our ability to:
| • | incur additional debt; |
| • | create liens; |
| • | consolidate, merge or sell assets; |
| • | make certain capital expenditures; |
| • | make certain advances, investments and loans; |
| • | enter into certain transactions with affiliates; |
| • | engage in any business other than the packaging business; |
| • | pay dividends; and |
| • | repurchase stock. |
These covenants could restrict us in the pursuit of our business strategy. As of December 31, 2009, we were in compliance with the covenants under the instruments and agreements governing our indebtedness.
We may obtain less favorable terms when we attempt to renew or replace our senior secured revolving credit facility and our senior secured term loan facility.
Approximately 34.0% of the term loans under our senior secured credit facility, or $610.0 million as of December 31, 2009, will mature on October 7, 2011, and the remaining $1,191.0 million will mature on April 5, 2014. Approximately 55.0% of total commitments of our senior secured revolving credit facility, or $135.2 million as of December 31, 2009, will mature on October 7, 2010, with the remaining $112.8 million
25
Table of Contents
maturing on October 1, 2013. In conjunction with the IPO, commitments under our senior secured revolving credit facility automatically increased by $12.0 million, which additional commitments will mature on October 1, 2013.
We may not be able to renew or replace these facilities on favorable terms as they expire, or we may not be able to renew or replace them at all. As a result, we may incur higher borrowing costs and could have more stringent debt covenants. If financial market conditions deteriorate, our business and financial results could be materially and adversely affected.
In the event that a party acquires beneficial ownership representing voting power in Holdings greater than the voting power represented by the interests beneficially owned by Blackstone, it will trigger an event of default under our Credit Agreement.
In the event that a party acquires beneficial ownership representing voting power in Holdings greater than the voting power represented by the interests beneficially owned by Blackstone through shares of our common stock, an event of default under our Credit Agreement will be triggered. Upon the occurrence of an event of default under our Credit Agreement, the lenders will not be required to lend any additional amounts to us or could elect to declare all borrowings outstanding, together with accrued and unpaid interest and fees, to be due and payable, which could result in an event of default under our other debt instruments. If we were unable to repay those amounts, the lenders under our Credit Agreement could proceed against the collateral granted to them to secure that indebtedness. We have pledged a significant portion of our assets as collateral under our Credit Agreement. If the lenders under our Credit Agreement accelerate the repayment of borrowings, we may not have sufficient assets to repay our Credit Agreement and our other indebtedness or be able to borrow sufficient funds to refinance such indebtedness. Even if we are able to obtain new financing, it may not be on commercially reasonable terms, or terms that are acceptable to us.
Risks Related to Our Common Stock
The market price of our common stock may be volatile, which could cause the value of our common stock to decline.
The market price of our common stock may be volatile due to a number of factors such as those listed in “—Risks Related to Our Business” and the following, some of which are beyond our control:
| • | quarterly variations in our results of operations; |
| • | results of operations that vary from those of our competitors; |
| • | changes in expectations as to our future financial performance, including financial estimates by securities analysts and investors; |
| • | announcements by us, our competitors or our vendors of significant contracts, acquisitions, joint marketing relationships, joint ventures or capital commitments; |
| • | announcements by third parties of significant claims or proceedings against us; |
| • | future sales of our common stock; and |
| • | changes in investor sentiment toward the stock of packaging companies in general and plastic packaging companies in particular. |
Furthermore, the stock market recently has experienced extreme volatility that in some cases has been unrelated or disproportionate to the operating performance of particular companies. These broad market and industry fluctuations may adversely affect the market price of our common stock, regardless of our actual operating performance.
26
Table of Contents
In the past, following periods of market volatility, stockholders have instituted securities class action litigation. If we were involved in securities litigation, it could have a substantial cost and divert resources and the attention of executive management from our business regardless of the outcome of such litigation.
If we or our pre-IPO investors sell our common stock or exchange Holdings partnership units for additional shares of our common stock, the market price of our common stock could decline.
The market price of our common stock could decline as a result of sales of a large number of shares of common stock in the market or the perception that such sales could occur. These sales, or the possibility that these sales may occur, also might make it more difficult for us to sell equity securities in the future at a time and at a price that we deem appropriate. Substantially all of the shares of our common stock are available for resale in the public market, subject to the restrictions on sale or transfer during the 180-day lockup period following the date of our IPO.
In addition, pursuant to an exchange agreement, the Graham Family has the right to exchange limited partnership units in Holdings for shares of our common stock outstanding on a one-for-one basis, subject to customary conversion rate adjustments for stock splits, stock dividends and reclassifications. The shares of common stock issuable upon exchange of the limited partnership units that are held by the Graham Family are eligible for resale from time to time, subject to certain contractual and Securities Act restrictions.
In addition, pursuant to a registration rights agreement, we have granted certain stockholders and unitholders the right to cause us, in certain instances, at our expense, to file registration statements under the Securities Act covering resales of shares of our common stock held by them or acquired by them by exchanging partnership units. The Graham Family and their affiliates may request that we file a shelf registration statement beginning on the 181st day after our IPO. These shares also may be sold pursuant to Rule 144 under the Securities Act of 1933, as amended (the “Securities Act”), depending on their holding period and subject to restrictions in the case of shares held by persons deemed to be our affiliates. As restrictions on resale end or if these stockholders exercise their registration rights, the market price of our common stock could decline if the holders of restricted shares sell them or are perceived by the market as intending to sell them.
Shares acquired in exchange for limited partnership units upon the exercise of vested options under Holdings’ equity incentive plan will first become eligible for resale 180 days after our IPO. Exchange of a substantial number of shares of our common stock for limited partnership units upon exercise of options could cause the market price of our common stock to decline.
Because we may not pay cash dividends on our common stock for the foreseeable future, you may not receive any return on investment unless you sell our common stock for a price greater than that which you paid for it.
We currently intend to retain future earnings, if any, for future operation, debt reduction and expansion, and do not anticipate paying any cash dividends for the foreseeable future. Any decision to declare and pay dividends in the future will be made at the discretion of our board of directors and will depend on, among other things, our results of operations, financial condition, level of indebtedness, cash requirements, contractual restrictions and other factors that our board of directors may deem relevant. In addition, our ability to pay dividends may be limited by covenants of any existing and future indebtedness we or our subsidiaries incur, including the senior secured credit agreement and the indentures. As a result, you may not receive any return on an investment in our common stock unless you sell our common stock for a price greater than that which you paid for it.
We have anti-takeover provisions in our organizational documents that may discourage a change of control.
Certain provisions of our restated certificate of incorporation and amended and restated bylaws may have an anti-takeover effect and may delay, defer or prevent a tender offer or takeover attempt that a stockholder might consider in its best interest, including those attempts that might result in a premium over the market price for the shares held by our stockholders.
27
Table of Contents
These provisions provide for, among other things:
| • | a classified board of directors with staggered three-year terms; |
| • | the ability of our board of directors to issue one or more series of preferred stock; |
| • | advance notice for nominations of directors by stockholders and for stockholders to include matters to be considered at our annual meetings; |
| • | certain limitations on convening special stockholder meetings; |
| • | the removal of directors only for cause and only upon the affirmative vote of holders of at least 75% of the shares of common stock entitled to vote generally in the election of directors; and |
| • | that certain provisions may be amended only by the affirmative vote of at least 75% of the shares of common stock entitled to vote generally in the election of directors. |
These anti-takeover provisions could make it more difficult for a third party to acquire our company, even if the third party’s offer may be considered beneficial by many of our stockholders. As a result, our stockholders may be limited in their ability to obtain a premium for their shares.
We are a “controlled company” within the meaning of the New York Stock Exchange rules and, as a result, will qualify for, and intend to rely on, exemptions from certain corporate governance requirements. You will not have the same protections afforded to stockholders of companies that are subject to such requirements.
Blackstone controls a majority of the voting power of our outstanding common stock. As a result, we are a “controlled company” within the meaning of the corporate governance standards of the New York Stock Exchange. Under these rules, a company of which more than 50% of the voting power is held by an individual, group or another company is a “controlled company” and may elect not to comply with certain corporate governance requirements, including:
| • | the requirement that a majority of the board of directors consist of independent directors; |
| • | the requirement that we have a nominating/corporate governance committee that is composed entirely of independent directors with a written charter addressing the committee’s purpose and responsibilities; |
| • | the requirement that we have a compensation committee that is composed entirely of independent directors with a written charter addressing the committee’s purpose and responsibilities; and |
| • | the requirement for an annual performance evaluation of the nominating/corporate governance and compensation committees. |
We utilize these exemptions and, therefore, do not have a majority of independent directors, our nominating and corporate governance committee and our compensation committee do not consist entirely of independent directors and such committees are not subject to annual performance evaluations. Accordingly, you do not have the same protections afforded to stockholders of companies that are subject to all of the corporate governance requirements of the New York Stock Exchange.
28
Table of Contents
| Item 1B. | Unresolved Staff Comments |
None.
| Item 2. | Properties |
At December 31, 2009, the Company owned or leased 85 plants located in Argentina, Belgium, Brazil, Canada, Finland, France, Mexico, the Netherlands, Poland, Spain, Turkey, the United Kingdom, the United States and Venezuela. Twenty-eight of the plants are located on-site at customer facilities. The Company believes that its plants, which are of varying ages and types of construction, are in good condition, are suitable for its operations and generally are expected to provide sufficient capacity to meet its requirements for the foreseeable future.
The following table sets forth the location of the Company’s manufacturing and administrative facilities, their approximate current square footage, whether on-site or off-site and whether leased or owned as of December 31, 2009. In addition to the facilities listed below, the Company leases other warehousing space.
| Location |
Size (Square Feet) |
On-Site or Off-Site |
Leased/ Owned | |||||
| U.S. Packaging Facilities (1) | ||||||||
| 1. |
Findlay, Ohio | 406,800 | Off-Site | Owned | ||||
| 2. |
York (Household), Pennsylvania | 395,554 | Off-Site | Owned | ||||
| 3. |
Maryland Heights, Missouri | 308,961 | Off-Site | Owned | ||||
| 4. |
Henderson, Nevada | 298,407 | Off-Site | Owned | ||||
| 5. |
Vandalia, Illinois | 277,500 | Off-Site | Owned | ||||
| 6. |
Evansville, Indiana | 266,720 | Off-Site | Leased | ||||
| 7. |
Woodridge, Illinois | 265,062 | Off-Site | Leased | ||||
| 8. |
Rockwall, Texas | 241,000 | Off-Site | Owned | ||||
| 9. |
Modesto, California | 238,000 | Off-Site | Owned | ||||
| 10. |
Hazleton (Household), Pennsylvania | 218,384 | On-Site | Leased | ||||
| 11. |
Holland, Michigan | 218,168 | Off-Site | Leased | ||||
| 12. |
Fremont, Ohio | 210,883 | Off-Site | Owned | ||||
| 13. |
Bedford, New Hampshire | 210,510 | Off-Site | Owned | ||||
| 14. |
York (Food & Beverage), Pennsylvania | 210,370 | Off-Site | Leased | ||||
| 15. |
Tolleson, Arizona | 209,468 | Off-Site | Owned | ||||
| 16. |
Cartersville, Georgia | 208,000 | Off-Site | Owned | ||||
| 17. |
Florence (Food & Beverage), Kentucky | 203,000 | Off-Site | Owned | ||||
| 18. |
Edison, New Jersey (2) | 194,000 | Off-Site | Owned | ||||
| 19. |
Hazleton (Food & Beverage), Pennsylvania | 185,080 | Off-Site | Owned | ||||
| 20. |
Newell, West Virginia | 183,388 | On-Site | Leased | ||||
| 21. |
Harrisonburg, Virginia | 180,000 | Off-Site | Owned | ||||
| 22. |
Selah, Washington | 170,553 | Off-Site | Owned | ||||
| 23. |
Atlanta, Georgia | 165,000 | On-Site | Leased | ||||
| 24. |
Jefferson, Louisiana | 162,047 | Off-Site | Leased | ||||
| 25. |
Kansas City, Missouri | 162,000 | Off-Site | Leased | ||||
| 26. |
Belvidere, New Jersey | 160,000 | Off-Site | Owned | ||||
| 27. |
Florence (Personal Care/Specialty), Kentucky | 153,600 | Off-Site | Owned | ||||
| 28. |
Cincinnati, Ohio | 153,301 | Off-Site | Leased | ||||
| 29. |
Montgomery, Alabama (2) | 150,143 | Off-Site | Leased | ||||
| 30. |
Emigsville, Pennsylvania | 148,300 | Off-Site | Leased | ||||
| 31. |
Levittown, Pennsylvania (2) | 148,000 | Off-Site | Leased | ||||
| 32. |
Iowa City, Iowa | 140,896 | Off-Site | Owned | ||||
| 33. |
Baltimore, Maryland | 128,500 | Off-Site | Owned |
29
Table of Contents
| Location |
Size (Square Feet) |
On-Site or Off-Site |
Leased/ Owned | |||||
| 34. |
Santa Ana, California | 127,680 | Off-Site | Owned | ||||
| 35. |
Chicago, Illinois | 125,500 | Off-Site | Owned | ||||
| 36. |
Muskogee, Oklahoma | 125,000 | Off-Site | Leased | ||||
| 37. |
Alta Vista, Virginia | 122,680 | Off-Site | Leased | ||||
| 38. |
Kansas City, Kansas | 111,000 | On-Site | Leased | ||||
| 39. |
Ogden, Utah | 105,000 | On-Site | Leased | ||||
| 40. |
Casa Grande, Arizona | 100,000 | Off-Site | Leased | ||||
| 41. |
Bradford, Pennsylvania | 90,350 | Off-Site | Leased | ||||
| 42. |
Atlanta, Georgia | 81,600 | Off-Site | Leased | ||||
| 43. |
Lakeland, Florida | 80,000 | Off-Site | Leased | ||||
| 44. |
Berkeley, Missouri | 75,000 | Off-Site | Owned | ||||
| 45. |
Cambridge, Ohio | 57,000 | On-Site | Leased | ||||
| 46. |
Port Allen, Louisiana | 56,721 | On-Site | Leased | ||||
| 47. |
Richmond, California | 55,256 | Off-Site | Leased | ||||
| 48. |
Houston, Texas | 52,500 | Off-Site | Owned | ||||
| 49. |
St. Louis, Missouri | 48,150 | On-Site | Leased | ||||
| 50. |
Darlington, South Carolina | 43,200 | Off-Site | Leased | ||||
| 51. |
Vicksburg, Mississippi (2) | 31,200 | On-Site | Leased | ||||
| 52. |
Bordentown, New Jersey | 30,000 | On-Site | Leased | ||||
| 53. |
Joplin, Missouri | 29,200 | On-Site | Leased | ||||
| 54. |
Minster, Ohio | 27,674 | On-Site | Leased | ||||
| 55. |
West Jordan, Utah | 25,760 | On-Site | Leased | ||||
| 56. |
Bradenton, Florida | 21,500 | On-Site | Leased | ||||
| Canadian Packaging Facilities | ||||||||
| 57. |
Mississauga, Ontario | 78,416 | Off-Site | Owned | ||||
| Mexican Packaging Facilities | ||||||||
| 58. |
Tlalnepantla | 214,349 | Off-Site | Owned | ||||
| 59. |
Pachuca | 152,286 | Off-Site | Owned | ||||
| 60. |
Mexicali | 59,700 | Off-Site | Leased | ||||
| 61. |
Irapuato | 54,000 | On-Site | Leased | ||||
| 62. |
Tlaxcala | 9,792 | On-Site | Leased | ||||
| European Packaging Facilities | ||||||||
| 63. |
Assevent, France | 186,000 | Off-Site | Owned | ||||
| 64. |
Rotselaar, Belgium | 162,212 | On-Site | Leased | ||||
| 65. |
Etten-Leur, Netherlands | 124,450 | Off-Site | Leased | ||||
| 66. |
Ryttyla, Finland | 121,079 | Off-Site | Owned | ||||
| 67. |
Chalgrove, the United Kingdom | 104,200 | Off-Site | Leased | ||||
| 68. |
Aldaia, Spain | 75,350 | On-Site | Leased | ||||
| 69. |
Istanbul, Turkey | 45,000 | Off-Site | Leased | ||||
| 70. |
Lummen, Belgium | 42,840 | On-Site | Leased | ||||
| 71. |
Sulejowek, Poland | 32,732 | Off-Site | Owned | ||||
| 72. |
Villecomtal, France | 31,300 | On-Site | Leased | ||||
| 73. |
Zoetermeer, Netherlands | 22,702 | On-Site | Leased | ||||
| 74. |
Bierun, Poland | 10,652 | On-Site | Leased | ||||
| 75. |
Eskisehir, Turkey | 9,461 | On-Site | Leased | ||||
| South American Packaging Facilities | ||||||||
| 76. |
Valencia, Venezuela | 93,757 | Off-Site | Leased | ||||
| 77. |
Sao Paulo, Brazil | 71,300 | Off-Site | Leased | ||||
30
Table of Contents
| Location |
Size (Square Feet) |
On-Site or Off-Site |
Leased/ Owned | ||||||
| 78. |
Buenos Aires, Argentina (San Martin) (2) | 40,501 | Off-Site | Owned | |||||
| 79. |
Longchamps, Argentina | 30,100 | ** | On-Site | Owned/Leased | ||||
| 80. |
Caxias, Brazil | 29,493 | ** | On-Site | Owned/Leased | ||||
| 81. |
Rio de Janeiro, Brazil | 22,220 | On-Site | Leased | |||||
| 82. |
Inhauma, Brazil | 14,208 | On-Site | * | |||||
| 83. |
Curitiba, Brazil | 12,293 | On-Site | * | |||||
| 84. |
Carambei, Brazil | 7,621 | On-Site | * | |||||
| Graham Recycling | |||||||||
| 85. |
York, Pennsylvania | 44,416 | Off-Site | Owned | |||||
| Administrative Facilities | |||||||||
| • |
York, Pennsylvania—Technology Center |
159,000 | N/A | Leased | |||||
| • |
York, Pennsylvania—Corporate Office |
116,400 | N/A | Leased | |||||
| • |
Warsaw, Poland—Technology Center |
32,636 | N/A | Leased | |||||
| • |
Rueil, Paris, France |
4,300 | N/A | Leased | |||||
| (1) | Substantially all of the Company’s domestic tangible and intangible assets are pledged as collateral pursuant to the terms of the Credit Agreement. |
| (2) | The Company has closed these facilities. |
| * | The Company operates these on-site facilities without leasing the space it occupies. |
| ** | The building is owned and the land is leased. |
31
Table of Contents
| Item 3. | Legal Proceedings |
On November 3, 2006, the Company filed a complaint with the Supreme Court of the State of New York, New York County, against Owens-Illinois, Inc. and OI Plastic Products FTS, Inc. (collectively, “OI”). The complaint alleges certain misrepresentations by OI in connection with the Company’s 2004 purchase of O-I Plastic and seeks damages in excess of $30 million. In December 2006, OI filed an Answer and Counterclaim, seeking to rescind a Settlement Agreement entered into between OI and the Company in April 2005, and disgorgement of more than $39 million paid by OI to the Company in compliance with that Settlement Agreement. The Company filed a Motion to Dismiss the Counterclaim in July 2007, which was granted by the Court in October 2007. On August 1, 2007, the Company filed an Amended Complaint to add additional claims seeking indemnification from OI for claims made against the Company by former OI employees pertaining to their pension benefits. These claims arise from an arbitration between the Company and Glass, Molders, Pottery, Plastic & Allied Workers, Local #171 (the “Union”) that resulted in an award on April 23, 2007, in favor of the Union. The Arbitrator ruled that the Company had failed to honor certain pension obligations for past years of service to former employees of OI, whose seven Union-represented plants were acquired by the Company in October 2004. In the Amended Complaint, the Company maintains that under Section 8.2 of the Stock Purchase Agreement between the Company and OI, OI is obligated to indemnify the Company for any losses associated with differences in two of the Company’s pension plans including any losses incurred in connection with the Arbitration award. The litigation is proceeding.
On April 10, 2009, OnTech Operations, Inc. (“OnTech”) initiated an arbitration proceeding against the Company, in which OnTech alleges that the Company breached a bottle purchase agreement dated April 28, 2008, and an equipment lease dated June 1, 2008. In its statement of claims, OnTech alleges, among other things, that the Company’s failure to produce bottles as required by the bottle purchase agreement resulted in the failure of OnTech’s business. As a result, OnTech is seeking to recover the value of its business, which it alleges is between $80 million and $150 million, which is in excess of 10% of the Company’s current assets. The arbitration is currently scheduled to be heard by a three arbitrator panel from August 2, 2010, to August 6, 2010.
The Company believes that OnTech’s claims are without legal, contractual or factual merit. The Company is vigorously defending against these claims and feels that the likelihood of it not prevailing is remote. Accordingly, the Company has not accrued a loss on this claim.
The Company is a party to various other litigation matters arising in the ordinary course of business. The ultimate legal and financial liability of the Company with respect to such litigation cannot be estimated with certainty, but management believes, based on its examination of these matters, experience to date and discussions with counsel, that ultimate liability from the Company’s various litigation matters will not be material to the business, financial condition, results of operations or cash flows of the Company.
| Item 4. | (Removed and Reserved) |
32
Table of Contents
PART II
| Item 5. | Market for Registrant’s Common Equity, Related Stockholder Matters and Issuer Purchases of Equity Securities |
GPC’S common stock is listed on the New York Stock Exchange and is traded under the symbol “GRM.” At the close of business on March 3, 2010, there were 18 common stockholders of record.
The high and low reported sale prices per share for GPC’s common stock between February 11, 2010, the date that GPC’s common stock began trading on the New York Stock Exchange, and March 3, 2010, were $10.65 and $10.20, respectively.
Dividend Policy
The Company has not paid in the past years and does not anticipate paying for the foreseeable future any cash dividends, and instead intends to retain earnings, if any, for future operation and expansion. Any decision to pay dividends in the future will be at the discretion of its board of directors and will depend on, among other things, the Company’s results of operations, financial condition, level of indebtedness, cash requirements, contractual restrictions and other factors that its board of directors may deem relevant. In addition, the Company’s ability to pay dividends may be limited by covenants of any existing and future outstanding indebtedness it or its subsidiaries incur, including the Company’s senior secured credit agreement and indentures.
33
Table of Contents
| Item 6. | Selected Financial Data |
The following tables set forth the selected historical consolidated financial data of the Company for and at the end of each of the years in the five-year period ended December 31, 2009. The information in the following tables gives effect to the 1,465.4874-for-one stock split of our common stock which occurred on February 4, 2010. The selected consolidated statement of operations data and the selected consolidated cash flow data for the years ended December, 31, 2009, 2008, 2007 and 2006, and the selected consolidated balance sheet data as of December 31, 2009, 2008 and 2007, have been derived from our audited consolidated financial statements. The selected consolidated statement of operations data and the selected consolidated cash flow data for the year ended December 31, 2005, and the selected consolidated balance sheet data as of December 31, 2005 and 2006, is unaudited.
The following tables should be read in conjunction with “Management’s Discussion and Analysis of Financial Condition and Results of Operations” (Item 7) and the Financial Statements included under Item 8.
On November 12, 2009, the Company paid 2.3 million euros (approximately $3.5 million) to sell all of the shares of its wholly-owned subsidiary Graham Emballages Plastiques S.A.S., located in Meaux, France, to an independent third party. The Company’s exit from this location was due to its failure to meet internal financial performance criteria. The Company determined that the results of operations for this location, which had previously been reported in the Europe segment, would be reported as discontinued operations, in accordance with the guidance under ASC 205-20, “Discontinued Operations.” The Company’s consolidated statements of operations have been restated to reflect these discontinued operations. Accordingly, the selected financial data below, unless otherwise indicated, is based on results from continuing operations.
| Year Ended December 31, | ||||||||||||||||||||
| 2009 | 2008 | 2007 | 2006 | 2005 | ||||||||||||||||
| (In millions) | ||||||||||||||||||||
| STATEMENT OF OPERATIONS DATA: |
||||||||||||||||||||
| Net sales (1) |
$ | 2,271.0 | $ | 2,559.0 | $ | 2,470.9 | $ | 2,500.4 | $ | 2,447.8 | ||||||||||
| Cost of goods sold (1) |
1,866.6 | 2,183.3 | 2,129.4 | 2,212.3 | 2,153.3 | |||||||||||||||
| Gross profit |
404.4 | 375.7 | 341.5 | 288.1 | 294.5 | |||||||||||||||
| Selling, general and administrative expenses |
122.4 | 127.6 | 136.2 | 131.3 | 127.2 | |||||||||||||||
| Asset impairment charges (2) |
41.8 | 96.1 | 157.7 | 25.9 | 7.0 | |||||||||||||||
| Net loss on disposal of fixed assets |
6.5 | 6.8 | 19.5 | 14.3 | 13.7 | |||||||||||||||
| Operating income |
233.7 | 145.2 | 28.1 | 116.6 | 146.6 | |||||||||||||||
| Interest expense |
176.9 | 180.0 | 205.9 | 205.3 | 184.7 | |||||||||||||||
| Interest income |
(1.1 | ) | (0.8 | ) | (0.9 | ) | (0.6 | ) | (0.6 | ) | ||||||||||
| Net loss on debt extinguishment (3) |
8.7 | — | 4.5 | 2.1 | — | |||||||||||||||
| Other (income) expense, net |
(1.6 | ) | 0.4 | 2.0 | 2.2 | 1.0 | ||||||||||||||
| Income tax provision |
27.0 | 13.0 | 20.3 | 27.5 | 14.4 | |||||||||||||||
| Income (loss) from continuing operations |
23.8 | (47.4 | ) | (203.7 | ) | (119.9 | ) | (52.9 | ) | |||||||||||
| Loss from discontinued operations |
(9.5 | ) | (10.5 | ) | (3.7 | ) | (1.1 | ) | (0.6 | ) | ||||||||||
| Net income (loss) |
14.3 | (57.9 | ) | (207.4 | ) | (121.0 | ) | (53.5 | ) | |||||||||||
| Net income attributable to noncontrolling interests (4) |
3.2 | — | — | — | — | |||||||||||||||
| Net income (loss) attributable to Graham Packaging Company Inc. stockholders |
$ | 11.1 | $ | (57.9 | ) | $ | (207.4 | ) | $ | (121.0 | ) | $ | (53.5 | ) | ||||||
| EARNINGS PER SHARE (4): |
||||||||||||||||||||
| Income (loss) from continuing operations per share: |
||||||||||||||||||||
| Basic |
$ | 0.45 | $ | (1.10 | ) | $ | (4.74 | ) | $ | (2.79 | ) | $ | (1.23 | ) | ||||||
| Diluted |
$ | 0.44 | $ | (1.10 | ) | $ | (4.74 | ) | $ | (2.79 | ) | $ | (1.23 | ) | ||||||
| Loss from discontinued operations per share: |
||||||||||||||||||||
| Basic |
$ | (0.19 | ) | $ | (0.25 | ) | $ | (0.09 | ) | $ | (0.03 | ) | $ | (0.02 | ) | |||||
| Diluted |
$ | (0.19 | ) | $ | (0.25 | ) | $ | (0.09 | ) | $ | (0.03 | ) | $ | (0.02 | ) | |||||
| Net income (loss) attributable to Graham Packaging Company Inc. stockholders per share: |
||||||||||||||||||||
| Basic |
$ | 0.26 | $ | (1.35 | ) | $ | (4.83 | ) | $ | (2.82 | ) | $ | (1.25 | ) | ||||||
| Diluted |
$ | 0.25 | $ | (1.35 | ) | $ | (4.83 | ) | $ | (2.82 | ) | $ | (1.25 | ) | ||||||
| Weighted average shares outstanding: |
||||||||||||||||||||
| Basic |
42,981,204 | 42,975,419 | 42,975,419 | 42,975,419 | 42,975,419 | |||||||||||||||
| Diluted |
42,985,179 | 42,975,419 | 42,975,419 | 42,975,419 | 42,975,419 | |||||||||||||||
34
Table of Contents
| Year Ended December 31, | ||||||||||||||||||||
| 2009 | 2008 | 2007 | 2006 | 2005 (unaudited) |
||||||||||||||||
| (In millions) | ||||||||||||||||||||
| BALANCE SHEET DATA (at period end) (5): |
||||||||||||||||||||
| Cash and cash equivalents |
$ | 147.8 | $ | 43.9 | $ | 18.3 | $ | 13.3 | $ | 26.7 | ||||||||||
| Working capital (6) |
120.1 | 190.3 | 186.2 | 158.4 | 249.2 | |||||||||||||||
| Total assets |
2,126.3 | 2,149.8 | 2,377.3 | 2,586.0 | 2,707.1 | |||||||||||||||
| Total debt (7) |
2,436.9 | 2,499.2 | 2,534.3 | 2,546.9 | 2,638.3 | |||||||||||||||
| Equity (deficit) |
(763.1 | ) | (818.4 | ) | (645.8 | ) | (454.9 | ) | (350.2 | ) | ||||||||||
| OTHER DATA: |
||||||||||||||||||||
| Cash flow provided by (used in) (5): |
||||||||||||||||||||
| Operating activities |
$ | 325.5 | $ | 211.2 | $ | 174.2 | $ | 263.0 | $ | 120.0 | ||||||||||
| Investing activities |
(150.5 | ) | (144.4 | ) | (149.1 | ) | (172.4 | ) | (261.4 | ) | ||||||||||
| Financing activities |
(73.9 | ) | (33.6 | ) | (23.2 | ) | (104.6 | ) | 147.9 | |||||||||||
| Depreciation and amortization (8) |
159.4 | 177.8 | 203.7 | 206.1 | 201.9 | |||||||||||||||
| (1) | Net sales and cost of goods sold increase or decrease based on fluctuations in resin prices. Consistent with industry practice and as permitted under agreements with the Company’s customers, resin price changes are passed through to customers by means of corresponding changes in product pricing. Net sales and cost of goods sold are also impacted by changes in exchange rates and other factors, as further described in “Item 7. Management’s Discussion and Analysis of Financial Condition and Results of Operations—Results of Operations.” |
| (2) | The Company evaluated the recoverability of its long-lived tangible and intangible assets in selected locations, due to indicators of impairment, and recorded impairment charges of $41.8 million, $94.7 million, $156.6 million, $14.2 million and $6.6 million for the years ended December 31, 2009, 2008, 2007, 2006 and 2005, respectively. Goodwill is reviewed for impairment on at least an annual basis. The resulting impairment charges recognized were $1.4 million, $1.1 million, $11.7 million and $0.4 million for the years ended December 31, 2008, 2007, 2006 and 2005, respectively. See “Item 7. Management’s Discussion and Analysis of Financial Condition and Results of Operations—Results of Operations” for a further discussion. |
| (3) | Reclassifications have been made from interest expense to reflect as a separate line the net loss on debt extinguishment for all periods presented. |
| (4) | Earnings per share is calculated based on amounts attributable to Graham Packaging Company Inc. stockholders and excludes amounts attributable to noncontrolling interests. Net income attributable to noncontrolling interests consists of $4.6 million of income related to continuing operations and $1.4 million of loss related to discontinued operations for the year ended December 31, 2009. |
| (5) | Includes both continuing and discontinued operations. |
| (6) | Working capital is defined as current assets, less cash and cash equivalents, minus current liabilities, less current maturities of long-term debt. |
| (7) | Total debt includes capital lease obligations and current portion of long-term debt. |
| (8) | Depreciation and amortization includes continuing and discontinued operations, and excludes asset impairment charges and amortization of debt issuance fees, which is included in interest expense. |
35
Table of Contents
| Item 7. | Management’s Discussion and Analysis of Financial Condition and Results of Operations |
Overview
We are a worldwide leader in the design, manufacture and sale of value-added, custom blow molded plastic containers for branded consumer products. We operate in product categories where customers and end users value the technology and innovation that our custom plastic containers offer as an alternative to traditional packaging materials such as glass, metal and paperboard. We selectively pursue opportunities where we can leverage our technology portfolio to continue to drive the trend of conversion to plastic containers from other packaging materials. Our customers include leading multi-national and regional blue-chip consumer product companies that seek customized, sustainable plastic container solutions for diverse and stable end markets, such as the food and beverage and the household consumer products markets. We believe we are well-positioned to meet the evolving needs of our customers who often use our technology to differentiate their products with value-added design and performance characteristics such as smooth-wall panel-less bottles, unique pouring and dispensing features, multilayer bottles incorporating barrier technologies to extend shelf life, and ultra lightweight bottles with “hot-fill” capabilities that allow containers to be filled at high temperatures.
As of December 31, 2009, we operated a network of 80 manufacturing facilities throughout North America, Europe and South America. We are organized and managed on a geographical basis in three operating segments: North America, Europe and South America. Each operating segment includes four major categories: Food and Beverage, Household, Personal Care/Specialty and Automotive Lubricants. Our primary strategies are to manage our business for stable growth and strong cash flow from operations, leverage our technology portfolio to meet the needs of our customers, target organic growth in attractive markets utilizing our proven business model, continue to focus on operational excellence, and supplement our organic growth with opportunistic strategic investments.
We believe that the critical success factors to our business are our ability to:
| • | maintain relationships with, and serve the complex packaging demands of, our customers, which include some of the world’s largest branded consumer products companies; |
| • | participate in growth opportunities associated with the conversion of packaging products from glass, metal and paper to plastic; |
| • | develop proprietary technologies that provide a meaningful competitive advantage in product design, product performance, process technology and sustainability features; |
| • | focus on operational excellence, cost reductions and overall efficiencies; |
| • | make investments in plant and technology necessary to satisfy the factors mentioned above; and |
| • | reduce our financial leverage. |
We intend to capitalize on our leadership positions in value-added custom plastic containers to increase our EBITDA and cash flow in order to reduce our financial leverage and increase stockholder return.
We believe that the area with the greatest opportunity for growth continues to be in producing containers for the food and beverage product category because of the industry’s continued conversion to plastic packaging, including the demand for containers for juices and juice drinks, nutritional beverages, beer, yogurt drinks, liquor, teas, sports drinks/isotonics, vitamin enhanced waters, snacks, sauces, jellies, and jams. Much of the growth in this area in recent years has been in the sale of smaller sized containers. We believe we are a leader in providing value-added hot-fill PET juice containers. We also believe we are a leading participant in the growing markets for yogurt drinks and nutritional beverages where we manufacture containers using polyolefin resins.
Growth in our household container product category was fueled in prior years by conversions from powders to liquids for such products as detergents, household cleaners and automatic dishwashing detergent. Our
36
Table of Contents
strongest position is in fabric care, where management believes we are a leader in plastic container design and manufacture. It should be noted the fabric care industry now offers most of its brands in a concentrated formula which has reduced sales in this product category.
Our personal care/specialty product category is driven by new product launch and re-launch cycles of our customers. Based on the volume of our sales to many major suppliers of personal care/specialty products, management believes we are among the leading suppliers in this product category, which includes products for the hair care, skin care, oral care and specialty markets. Management believes that our supply position results from our commitment to, and reputation in, new product development and flexible manufacturing processes and operations.
Our North American one-quart/liter motor oil container product category is in a mature industry. Unit volume in the one-quart/liter motor oil industry decreased approximately 10% per year from 2006 through 2009 as the product category migrated towards the quick-lube market and larger multi-quart/liter packages. Even though we believe we have the largest market share of multi-quart/liter containers, these sales only partially offset the loss in sales of one-quart/liter containers.
As of December 31, 2009, we operated 27 manufacturing facilities outside of the United States in Argentina, Belgium, Brazil, Canada, Finland, France, Mexico, the Netherlands, Poland, Spain, Turkey, the United Kingdom and Venezuela. Over the past few years, we have expanded our international operations with the addition of two new plants in Brazil.
For the year ended December 31, 2009, 68.8% of our net sales were generated by our top twenty customers. All of the top twenty customers were under long-term contracts with terms up to ten years and have been doing business with us for over 20 years on average. Prices under these arrangements are typically tied to plastic resin market standards and, therefore, vary with market conditions. In general, the contracts have annually set minimum purchase requirements but do not obligate the customer to purchase any given amount of product from us beyond one year. Our sales to PepsiCo, our largest customer, were 10.8%, 13.3% and 14.0% of total sales for the years ended December 31, 2009, 2008 and 2007, respectively. All of these sales were made in North America.
The largest component of our cost of goods sold is resin costs. Based on certain resin industry indices, the following table summarizes average market prices per pound of PET and HDPE resins in the United States during the periods indicated:
| Year | |||||||||
| 2009 | 2008 | 2007 | |||||||
| PET |
$ | 0.73 | $ | 0.87 | $ | 0.82 | |||
| HDPE |
0.67 | 0.86 | 0.73 | ||||||
Resin and colorants make up a significant part of our cost of goods sold. Colorants are pigments added to the resin to formulate different colors of blow molded plastic bottles. Changes in the cost of colorants are typically passed through to customers, similarly to resin. On a percentage basis, resin and colorant costs generally make up between 40% and 50% of cost of goods sold, depending on the price of resin and colorants and bottle features. As a percentage of net sales, resin and colorant costs make up between 35% and 40%, in general. The percentage depends not only on the price of the resin and colorants, but also the physical characteristics of the bottle, such as size, weight, design features, labels and decorations, color and the technology platform and equipment used to make the bottle.
Changes in the cost of resin are passed through to customers by means of corresponding changes in product pricing, in accordance with our agreements with these customers and industry practice. A sustained increase in resin prices relative to other packaging materials, to the extent that those costs are not passed on to the end-consumer, would make plastic containers less economical for our customers and could result in a slower pace of conversions to, or reductions in the use of, plastic containers.
37
Table of Contents
On November 12, 2009, we paid 2.3 million euros (approximately $3.5 million) to sell all of the shares of our wholly-owned subsidiary Graham Emballages Plastiques S.A.S., located in Meaux, France, to an independent third party. Our exit from this location was due to its failure to meet internal financial performance criteria. We determined that the results of operations for this location, which had previously been reported in the Europe segment, would be reported as discontinued operations, in accordance with the guidance under ASC 205-20, “Discontinued Operations.” Our consolidated statements of operations reflect these discontinued operations. Accordingly, our discussion on results of operations below, unless otherwise indicated, is based on results from continuing operations.
Results of Operations
The following tables set forth the major components of our net sales and such net sales expressed as a percentage of total net sales:
| Year Ended December 31, | ||||||||||||||||||
| 2009 | 2008 | 2007 | ||||||||||||||||
| (Dollars in millions) | ||||||||||||||||||
| North America |
$ | 1,942.5 | 85.5 | % | $ | 2,195.0 | 85.8 | % | $ | 2,140.1 | 86.6 | % | ||||||
| Europe |
235.7 | 10.4 | 274.2 | 10.7 | 255.3 | 10.3 | ||||||||||||
| South America |
92.8 | 4.1 | 89.8 | 3.5 | 75.5 | 3.1 | ||||||||||||
| Total Net Sales |
$ | 2,271.0 | 100.0 | % | $ | 2,559.0 | 100.0 | % | $ | 2,470.9 | 100.0 | % | ||||||
| Year Ended December 31, | ||||||||||||||||||
| 2009 | 2008 | 2007 | ||||||||||||||||
| (Dollars in millions) | ||||||||||||||||||
| Food and Beverage |
$ | 1,385.5 | 61.0 | % | $ | 1,561.3 | 61.0 | % | $ | 1,488.7 | 60.3 | % | ||||||
| Household |
423.0 | 18.6 | 491.6 | 19.2 | 499.1 | 20.2 | ||||||||||||
| Personal Care/Specialty |
171.3 | 7.6 | 186.8 | 7.3 | 205.2 | 8.3 | ||||||||||||
| Automotive Lubricants |
291.2 | 12.8 | 319.3 | 12.5 | 277.9 | 11.2 | ||||||||||||
| Total Net Sales |
$ | 2,271.0 | 100.0 | % | $ | 2,559.0 | 100.0 | % | $ | 2,470.9 | 100.0 | % | ||||||
38
Table of Contents
2009 Compared to 2008
The following table sets forth the summary of the condensed consolidated statements of income and related percentage changes for the periods indicated:
| Year ended December 31, | %Increase/ (Decrease) |
||||||||||
| 2009 | 2008 | ||||||||||
| (Dollars in millions) | |||||||||||
| Net sales |
$ | 2,271.0 | $ | 2,559.0 | (11.3 | )% | |||||
| Cost of goods sold |
1,866.6 | 2,183.3 | (14.5 | ) | |||||||
| Gross profit (1) |
404.4 | 375.7 | 7.6 | ||||||||
| % of net sales (2) |
17.8 | % | 14.7 | % | |||||||
| Selling, general and administrative expenses (1) |
122.4 | 127.6 | (4.1 | ) | |||||||
| % of net sales (2) |
5.4 | % | 5.0 | % | |||||||
| Asset impairment charges |
41.8 | 96.1 | (56.5 | ) | |||||||
| Net loss on disposal of property, plant and equipment |
6.5 | 6.8 | (4.4 | ) | |||||||
| Operating income |
233.7 | 145.2 | 61.0 | ||||||||
| % of net sales (2) |
10.3 | % | 5.7 | % | |||||||
| Interest expense |
176.9 | 180.0 | (1.7 | ) | |||||||
| Interest income |
(1.1 | ) | (0.8 | ) | 37.5 | ||||||
| Net loss on debt extinguishment |
8.7 | — | 100.0 | ||||||||
| Other (income) expense, net |
(1.6 | ) | 0.4 | >100.0 | |||||||
| Income tax provision |
27.0 | 13.0 | >100.0 | ||||||||
| Income (loss) from continuing operations |
23.8 | (47.4 | ) | >100.0 | |||||||
| Loss from discontinued operations |
(9.5 | ) | (10.5 | ) | (9.5 | ) | |||||
| Net income (loss) |
14.3 | (57.9 | ) | >100.0 | |||||||
| Net income (loss) attributable to noncontrolling interests |
3.2 | — | 100.0 | ||||||||
| Net income (loss) attributable to our stockholders |
$ | 11.1 | $ | (57.9 | ) | >100.0 | % | ||||
| (1) | Amounts for gross profit and selling, general and administrative expenses may not be comparable to those of other companies, as the costs that we include in these line items may differ from the costs that other companies include. For a discussion of the types of costs included in each line item, see Note 1, “Significant Accounting Policies,” of the Notes to Consolidated Financial Statements in this Report. |
| (2) | As resin prices can fluctuate significantly, we believe that our gross profit, as well as certain expense items, should not be analyzed solely on a percentage of net sales basis. Fluctuations in crude oil and natural gas prices can cause significant fluctuations in resin prices, as can refining capacity and the demand for other petroleum-based products. |
Net Sales. Net sales for the year ended December 31, 2009, decreased $288.0 million, or 11.3%, from the year ended December 31, 2008. The decrease in sales was primarily due to a decrease in resin costs, which are passed through to customers. The average market price per pound of PET in the U.S. decreased from $0.87 to $0.73 and the average market price per pound of HDPE in the U.S. decreased from $0.86 to $0.67.
The unfavorable impact of exchange rates decreased sales by $72.2 million. The remaining $215.8 million decrease was driven primarily by lower resin costs as described above and, to a lesser extent, net price reductions both from operational cost savings shared with our customers and in response to competitive pressure. Container units sold increased 0.7%.
On an operating segment basis, sales for the year ended December 31, 2009, in North America decreased $252.5 million, or 11.5%, from the year ended December 31, 2008. The unfavorable impact of exchange rates
39
Table of Contents
decreased sales by approximately $34.4 million, and lower unit volume decreased sales by approximately $27.4 million. The remaining $190.7 million decrease was largely driven by lower resin costs mentioned above, and, to a lesser extent, net price reductions. North American sales in the food and beverage, household, personal care/specialty and automotive lubricants product categories contributed $148.8 million, $62.6 million, $12.6 million and $28.5 million, respectively, to the decrease. Container units sold in North America decreased in the household, personal care/specialty and automotive lubricants product categories by 0.8%, 3.6% and 7.4%, and increased in the food and beverage product category by 0.6%, respectively.
Sales for the year ended December 31, 2009, in Europe decreased $38.5 million, or 14.0%, from the year ended December 31, 2008. The unfavorable impact of exchange rates decreased sales by $28.4 million and the remaining decrease was primarily due to lower resin costs.
Sales for the year ended December 31, 2009, in South America increased $3.0 million, or 3.3%, from the year ended December 31, 2008. The increase in sales was primarily due to an increase in unit volume of approximately $7.9 million and price increases, partially offset by the unfavorable impact of exchange rates of $9.4 million.
Gross Profit. Gross profit for the year ended December 31, 2009, increased $28.7 million, or 7.6%, from the year ended December 31, 2008. Gross profit for the year ended December 31, 2009, increased in North America by $30.4 million, increased in Europe by $0.3 million and decreased in South America by $2.0 million, when compared to the year ended December 31, 2008. Lower depreciation and amortization expense contributed $16.1 million to the increase, but was offset by the unfavorable impact of exchange rates of $19.7 million, as well as the reduction in volume of approximately $7.9 million. The remaining increase in gross profit of $40.2 million resulted from ongoing productivity initiatives and an overall better mix of products sold, slightly offset by net price reductions referred to above.
Selling, General and Administrative Expenses. Selling, general and administrative expenses for the year ended December 31, 2009, decreased $5.2 million, or 4.1%, from the year ended December 31, 2008. The decrease was primarily due to a decrease in professional fees related to an aborted 2008 transaction of $4.1 million, a decrease in consulting expenses of $3.3 million, the impact of exchange rates of $3.0 million and ongoing expense reduction efforts, partially offset by an increase in compensation-related expenses of $6.7 million.
Asset Impairment Charges. Asset impairment charges were $41.8 million for the year ended December 31, 2009, as compared to $96.1 million for the year ended December 31, 2008. We operate in a competitive industry with rapid technological innovation. In order to remain competitive, we develop and invest in new equipment which enhances productivity, often making older equipment obsolete. In addition, changing market conditions can also impact our ability to recover the carrying value of our long-lived assets. During 2009, we noted several factors indicating that there may be impairment in some of our asset groups. These included:
| • | the economic conditions in general; |
| • | a continuing reduction in the automotive quart/liter container business as our customers convert to multi-quart/liter containers; |
| • | the introduction by us, and our competitors, of newer production technology in the plastic container industry which is improving productivity, causing certain of our older machinery and equipment to become obsolete; and |
| • | the decline and/or loss of business in certain market segments. |
40
Table of Contents
We conducted impairment tests in accordance with ASC 360-10-35-15, “Subsequent Measurement—Impairment or Disposal of Long-Lived Assets,” and recorded impairment charges of $41.8 million for property, plant and equipment for the year ended December 31, 2009, compared to $93.2 million for the year ended December 31, 2008. The impairment of property, plant and equipment in 2008 was primarily due to the following:
| • | the deteriorating economic conditions in general; |
| • | the expected decrease in volume of a major food and beverage customer; |
| • | a continuing reduction in the automotive quart/liter container business as our customers convert to multi-quart/liter containers; |
| • | the introduction by us, and our competitors, of newer production technology in the food and beverage sector which is improving productivity, causing certain of our older machinery and equipment to become obsolete; and |
| • | the loss of business of a large automotive lubricants customer. |
Of the 2009 impairment charges related to property, plant and equipment, $31.5 million, $3.9 million and $6.4 million were recorded in North America, Europe and South America, respectively.
We also evaluated the recoverability of our intangible assets, and consequently recorded no impairment charges related to intangible assets other than goodwill for the year ended December 31, 2009, as compared to $1.5 million for the year ended December 31, 2008. During 2008, we recorded impairment charges to our patented technologies and customer relationships of $1.0 million and $0.5 million, respectively.
We conducted our annual test for goodwill impairment as of December 31, 2009, and recorded no impairment charges for the year ended December 31, 2009, as compared to $1.4 million for the year ended December 31, 2008. The 2008 impairment charges were in connection with our plants in Brazil and Argentina.
Interest Expense. Interest expense for the year ended December 31, 2009, decreased $3.1 million from the year ended December 31, 2008. The decrease was primarily related to a decrease in interest rates (average 90-day LIBOR decreased from 2.9% for the year ended December 31, 2008, to 0.8% for the year ended December 31, 2009), lower debt levels and a decrease in amortization of deferred financing fees of $2.4 million. These decreases were partially offset by the extension, in May 2009, of $1,200.0 million of our term loan at a minimum LIBOR and increased LIBOR margin and an increase to interest expense resulting from the discontinuance of hedge accounting for our interest rate collar and swap agreements of $3.8 million. See “—Liquidity and Capital Resources” for a more detailed description of our term loan extension.
Net Loss on Debt Extinguishment. In May 2009, certain of the lenders under our Credit Agreement agreed to extend the final maturity date of certain loans and revolver commitments, which resulted in a net gain on debt extinguishment of $0.8 million. In November 2009, we tendered our 8.50% senior unsecured notes due 2012, which resulted in a net loss on debt extinguishment of $9.5 million. See “—Liquidity and Capital Resources” for a more detailed description of these transactions.
Other (Income) Expense, Net. Other (income) expense, net predominantly included net foreign exchange gains and losses for the years ended December 31, 2009 and 2008. Other income, net for the year ended December 31, 2009, was $1.6 million, as compared to other expense, net of $0.4 million for the year ended December 31, 2008.
Income Tax Provision. Income tax provision for the year ended December 31, 2009, increased $14.0 million from the year ended December 31, 2008. Our tax expense exceeds the US statutory rate primarily due to no tax benefit being recorded on losses in jurisdictions with valuation allowances, the inability to offset foreign tax credits against domestic tax expense because of our net operating losses and the expense related to deferred tax liabilities (primarily book/tax basis differences in goodwill) that cannot be offset by net operating losses. The
41
Table of Contents
$14.0 million increase primarily resulted from a benefit recognized during the third quarter of 2008 associated with Mexican asset tax credit carryforwards, increased profitability of our Spanish and Mexican subsidiaries valuation allowance adjustments in our Mexican and Brazilian subsidiaries and increases to domestic deferred tax liabilities that cannot be offset by net operating losses and other deferred tax assets.
Net Income (Loss). Primarily as a result of factors discussed above, net income was $14.3 million for the year ended December 31, 2009, compared to net loss of $57.9 million for the year ended December 31, 2008.
Net Income Attributable to Noncontrolling Interests. We allocate earnings and losses of Holdings to the noncontrolling interests based on the noncontrolling interests’ relative unit ownership percentage. Net income attributable to the noncontrolling interests was $3.2 million for the year ended December 31, 2009. Accumulated net losses attributable to the noncontrolling interests exceeded their carrying values in 2008. Accordingly, net losses attributable to the noncontrolling interest of $8.6 million in 2008 have been attributed to our stockholders.
2008 Compared to 2007
The following table sets forth the summary of the condensed consolidated statements of income and related percentage changes for the periods indicated:
| Year ended December 31, | %Increase/ (Decrease) |
||||||||||
| 2008 | 2007 | ||||||||||
| (Dollars in millions) | |||||||||||
| Net sales |
$ | 2,559.0 | $ | 2,470.9 | 3.6 | % | |||||
| Cost of goods sold |
2,183.3 | 2,129.4 | 2.5 | ||||||||
| Gross profit (1) |
375.7 | 341.5 | 10.0 | ||||||||
| % of net sales (2) |
14.7 | % | 13.8 | % | |||||||
| Selling, general and administrative expenses (1) |
127.6 | 136.2 | (6.3 | ) | |||||||
| % of net sales (2) |
5.0 | % | 5.5 | % | |||||||
| Asset impairment charges |
96.1 | 157.7 | (39.1 | ) | |||||||
| Net loss on disposal of property, plant and equipment |
6.8 | 19.5 | (65.1 | ) | |||||||
| Operating income |
145.2 | 28.1 | >100.0 | ||||||||
| % of net sales (2) |
5.7 | % | 1.1 | % | |||||||
| Interest expense |
180.0 | 205.9 | (12.6 | ) | |||||||
| Interest income |
(0.8 | ) | (0.9 | ) | (11.1 | ) | |||||
| Net loss on debt extinguishment |
— | 4.5 | (100.0 | ) | |||||||
| Other expense, net |
0.4 | 2.0 | (80.0 | ) | |||||||
| Income tax provision |
13.0 | 20.3 | (36.0 | ) | |||||||
| Loss from continuing operations |
(47.4 | ) | (203.7 | ) | (76.7 | ) | |||||
| Loss from discontinued operations |
(10.5 | ) | (3.7 | ) | >100.0 | ||||||
| Net loss |
(57.9 | ) | (207.4 | ) | (72.1 | ) | |||||
| Net loss attributable to noncontrolling interests |
— | — | |||||||||
| Net loss attributable to our stockholders |
$ | (57.9 | ) | $ | (207.4 | ) | (72.1 | )% | |||
| (1) | Amounts for gross profit and selling, general and administrative expenses may not be comparable to those of other companies, as the costs that we include in these line items may differ from the costs that other companies include. For a discussion of the types of costs included in each line item, see Note 1, “Significant Accounting Policies,” of the Notes to Consolidated Financial Statements in this Report. |
| (2) | As resin prices can fluctuate significantly, we believe that our gross profit, as well as certain expense items, should not be analyzed solely on a percentage of net sales basis. Fluctuations in crude oil and natural gas prices can cause significant fluctuations in resin prices, as can refining capacity and the demand for other petroleum-based products. |
42
Table of Contents
Net Sales. Net sales for the year ended December 31, 2008, increased $88.1 million, or 3.6%, from the year ended December 31, 2007. The increase in sales was primarily due to an increase in resin costs, which are passed through to customers, offset by lower volumes sold.
The favorable impact of exchange rates increased sales by $23.5 million. Container units sold decreased by 4.3%, which decreased sales by approximately $130.6 million. The percentage of our sales from lightweighted products also increased. While we believe lightweighting offers us a competitive advantage, our unit cost is lower because of a lower resin content. The remaining sales increase of $195.2 million was largely due to resin cost increases, slightly offset by net price reductions both from operational cost savings shared with our customers and in response to competitive pressure.
On an operating segment basis, sales for the year ended December 31, 2008, in North America increased $54.9 million, or 2.6%, from the year ended December 31, 2007, primarily due to an increase in resin costs, offset by lower unit volume and net price reductions. North American sales in the food and beverage and automotive lubricants product categories contributed $53.5 million and $34.0 million, respectively, to the increase, while North American sales in the household and personal care/specialty product categories decreased $16.6 million and $16.0 million, respectively. Container units sold in North America decreased in the food and beverage, household, personal care/specialty and automotive lubricants product categories by 3.2%, 3.1%, 13.7% and 7.6%, respectively.
Sales for the year ended December 31, 2008, in Europe increased $18.9 million, or 7.4%, from the year ended December 31, 2007. The increase in sales was primarily due to the favorable impact of exchange rates of $19.7 million.
Sales for the year ended December 31, 2008, in South America increased $14.3 million, or 18.9%, from the year ended December 31, 2007. The increase in sales was primarily due to increased unit volume of approximately $3.6 million and the favorable impact of exchange rates of $4.8 million.
Gross Profit. Gross profit for the year ended December 31, 2008, increased $34.2 million, or 10.0%, from the year ended December 31, 2007. Gross profit for the year ended December 31, 2008, increased in North America and Europe by $28.1 million and $7.0 million, respectively, while South America decreased by $0.9 million, when compared to the year ended December 31, 2007. The overall increase in gross profit was driven by several factors, including ongoing productivity initiatives, a mix shift to higher margin containers, lower depreciation and amortization expense of $25.6 million and the favorable impact of exchange rates of $6.9 million, partially offset by price reductions referred to above.
Selling, General and Administrative Expenses. Selling, general and administrative expenses for the year ended December 31, 2008, decreased $8.6 million, or 6.3%, from the year ended December 31, 2007. The decrease was primarily due to decreases in consulting expenses of $9.4 million and employee severance of $2.4 million and ongoing expense reduction efforts, partially offset by a $4.1 million increase in professional fees related to an aborted 2008 transaction.
Asset Impairment Charges. Asset impairment charges were $96.1 million for the year ended December 31, 2008, as compared to $157.7 million for the year ended December 31, 2007. We operate in a competitive industry with rapid technological innovation. In order to remain competitive, we develop and invest in new equipment which enhances productivity, often making older equipment obsolete. In addition, changing market conditions can also impact our ability to recover the carrying value of our long-lived assets. During 2008, we noted several factors indicating that there may be impairment in some of our asset groups. These included:
| • | the deteriorating economic conditions in general; |
| • | the expected decrease in volume of a major food and beverage customer; |
43
Table of Contents
| • | a continuing reduction in the automotive quart/liter container business as our customers convert to multi-quart/liter containers; |
| • | the introduction by us, and our competitors, of newer production technology in the food and beverage sector which is improving productivity, causing certain of our older machinery and equipment to become obsolete; and |
| • | the loss of business of a large automotive lubricants customer. |
We conducted impairment tests in accordance with ASC 360-10-35-15, “Subsequent Measurement—Impairment or Disposal of Long-Lived Assets,” and recorded impairment charges of $93.2 million for property, plant and equipment for the year ended December 31, 2008, compared to $135.5 million for the year ended December 31, 2007. The impairment of property, plant and equipment in 2007 was primarily due to the following:
| • | a steady conversion to concentrate containers in the liquid laundry detergent market which has decreased sales; |
| • | an ongoing reduction in the automotive quart/liter container business as our customers convert to multi-quart/liter containers; |
| • | introduction by us, and our competitors, of newer production technology in the food and beverage sector which has improved productivity, causing certain of our older machinery and equipment to become obsolete; and |
| • | the loss of the European portion of a customer’s business. |
Of the 2008 impairment charges related to property, plant and equipment, $85.4 million, $3.5 million and $4.3 million were recorded in North America, Europe and South America, respectively.
We also evaluated the recoverability of our intangible assets, and consequently recorded impairment charges related to intangible assets other than goodwill in the United States of $1.5 million for the year ended December 31, 2008, as compared to $21.1 million for the year ended December 31, 2007. During 2008, we recorded impairment charges to our patented technologies and customer relationships of $1.0 million and $0.5 million, respectively, all in our North American operating segment. These intangible assets were recorded in conjunction with the acquisitions of O-I Plastic in 2004 and certain operations from Tetra-Pak Inc. in 2005. The patented technologies were impaired primarily as a result of not realizing the growth in revenues for this technology that was anticipated at the time of the acquisition of O-I Plastic. The customer relationships were impaired primarily as a result of reduced revenues for the plant acquired from Tetra-Pak Inc. During 2007, we recorded impairment charges to our licensing agreements, customer relationships and patented technologies of $19.1 million, $1.7 million and $0.3 million, respectively.
We conducted our annual test for goodwill impairment as of December 31, 2008, and recorded impairment charges of $1.4 million, as compared to $1.1 million for the year ended December 31, 2007. The 2008 impairment charges were in connection with our plants in Brazil and Argentina, while the 2007 impairment charges were in connection with our plant in Venezuela. The plants in Brazil and Argentina have not performed at the levels expected and our projected discounted cash flows for these reporting units resulted in fair values that were not sufficient to support the goodwill recorded at the time of the respective acquisitions of these plants. The Venezuela plant had suffered several years of losses and our projected discounted cash flows for this reporting unit had resulted in a fair value that was not sufficient to support the goodwill recorded at the time of the O-I Plastic acquisition.
Interest Expense. Interest expense for the year ended December 31, 2008, decreased $25.8 million from the year ended December 31, 2007. The decrease was primarily related to a decrease in interest rates (average 90-day LIBOR decreased from 5.3% for the year ended December 31, 2007, to 2.9% for the year ended December 31, 2008).
44
Table of Contents
Other Expense, Net. Other expense, net predominantly included net foreign exchange losses for the years ended December 31, 2008 and 2007. Other expense, net for the year ended December 31, 2008, decreased $1.6 million from the year ended December 31, 2007.
Income Tax Provision. Income tax provision for the year ended December 31, 2008, decreased $7.3 million from the year ended December 31, 2007. The decrease primarily resulted from a reduction in unrecognized tax benefits of foreign subsidiaries and an increase in a deferred tax benefit associated with Mexican asset tax credit carryforwards. These decreases were partially offset by increased profitability in our Canadian and Mexican subsidiaries.
Net Loss. Primarily as a result of factors discussed above, net loss was $57.9 million for the year ended December 31, 2008, compared to net loss of $207.4 million for the year ended December 31, 2007.
Net Loss Attributable to Noncontrolling Interests. We allocate earnings and losses of Graham Packaging Holdings Company to the noncontrolling interests based on the noncontrolling interests’ relative unit ownership percentage. Accumulated net losses attributable to the noncontrolling interests exceeded their carrying values in both 2008 and 2007. Accordingly, net losses attributable to the noncontrolling interests of $8.6 million and $30.9 million in 2008 and 2007, respectively, have been attributed to our stockholders.
Effect of Changes in Exchange Rates
We generally conduct business in our foreign operations in local currencies. Accordingly, our results of operations are affected by changes in foreign exchange rates. Income and expense accounts and cash flow items are translated at average monthly exchange rates during the period. As a result, a decline in the value of the U.S. dollar relative to the local currencies of profitable foreign subsidiaries can have a favorable effect on our profitability, and an increase in the value of the U.S. dollar relative to the local currencies of profitable foreign subsidiaries can have a negative effect on our profitability. Global economic conditions for the first half of 2009 resulted in a rise of the U.S. dollar relative to these other local currencies. These conditions stabilized in the second half of 2009 resulting in a decline in the U.S. dollar relative to these other local currencies.
We manage foreign currency exposures (primarily to the euro, Canadian dollar, Polish zloty, Brazilian real, pound sterling and certain non-U.S. subsidiaries’ purchases of raw materials and/or sales of products in U.S. dollars) at the operating unit level. Exposures that cannot be naturally offset within an operating unit are hedged with derivative financial instruments where possible and cost effective in our judgment. Foreign currency exchange contracts which hedge defined exposures generally mature within twelve months. We do not generally hedge our exposure to translation gains or losses on our non-U.S. net assets. There were foreign currency exchange contracts of $1.5 million and $10.2 million outstanding as of December 31, 2009 and 2008, respectively. Included in other (income) expense, net were foreign exchange gains of $1.9 million and foreign exchange losses of $0.2 million and $1.9 million for the years ended December 31, 2009, 2008 and 2007, respectively.
Assets and liabilities are translated at exchange rates in effect at the balance sheet date. Net exchange gains or losses resulting from the translation of foreign financial statements are recorded as a separate component of partners’ capital (deficit) under the caption “accumulated other comprehensive income.” Exchange rate fluctuations increased comprehensive income by $19.6 million, increased comprehensive loss by $65.9 million and decreased comprehensive loss by $36.3 million for the years ended December 31, 2009, 2008 and 2007, respectively.
Liquidity and Capital Resources
In 2009, 2008 and 2007, we generated $325.5 million, $211.2 million and $174.2 million of cash flow from operations, respectively. In addition, for 2009, 2008 and 2007, we had cash and cash equivalents of $147.8 million, $43.9 million and $18.3 million, respectively. These funds were primarily used to fund $145.0 million,
45
Table of Contents
$144.4 million and $149.1 million of net cash paid for property, plant and equipment for 2009, 2008 and 2007, respectively, $1.4 million of acquisitions for 2009, $27.2 million and $4.5 million of debt issuance fee payments for 2009 and 2007, respectively, $4.1 million of cash paid for the sale of a business for 2009 and $3.0 million of fees paid in connection with our initial public offering.
The cash generated from operating activities for 2009 came primarily from our net income and reduction in working capital. The decrease in working capital, excluding cash, came from a reduction in accounts receivable and inventory primarily due to lower resin prices at the end of 2009 as compared to the end of 2008.
Cash used in 2009 for debt repayment was for regular amortization on our term loans and an excess cash flow payment of $22.8 million as was required by our Credit Agreement based on our cash generated in 2008.
Our Credit Agreement consists of senior secured term loans (“Term Loans”) to the Operating Company of $1,781.1 million ($1,801.0 million aggregate outstanding principal amount less $19.9 million unamortized discount) as of December 31, 2009, and a $248.0 million senior secured revolving credit facility (the “Revolver”). Availability under the Revolver as of December 31, 2009, was $237.8 million (as reduced by $10.2 million of outstanding letters of credit). The obligations of the Operating Company and CapCo I under the Credit Agreement are guaranteed by Holdings and certain domestic subsidiaries of the Operating Company. The Term Loans are payable in quarterly installments and require payments of $83.3 million (including the excess cash flow payment of $65.5 million due for the year ended December 31, 2009, payable by March 31, 2010, as further described below) in 2010, $593.2 million in 2011, $11.6 million in 2012, $11.6 million in 2013 and $1,101.3 million in 2014 (disregarding any further mandatory or voluntary prepayments that may reduce such scheduled amortization payments).
On May 28, 2009, certain of the lenders under our Term Loans agreed to extend the final maturity of $1,200.0 million of the Term Loans, conditioned on the refinancing in full of our senior notes due 2012. As a result of such refinancing in November 2009 (as further discussed below), $610.0 million of the Term Loans will mature on October 7, 2011, and the remaining $1,191.0 million will mature on April 5, 2014.
On May 28, 2009, certain of our Revolver lenders agreed to extend their commitments, with respect to $112.8 million of the total commitment, conditioned on the refinancing in full of our senior notes due 2012. As a result of such refinancing in November 2009, $135.2 million of commitments under the Revolver will expire on October 7, 2010, and the remainder of the commitments will expire on October 1, 2013. In conjunction with the extension of these revolving commitments, we also voluntarily reduced the amount of total revolving commitments available to us under the Credit Agreement from $250.0 million to $248.0 million. In conjunction with our initial public offering on February 10, 2010, we received a $12.0 million increase to our revolving commitments.
On May 28, 2009, the Credit Agreement was also amended such that we may not permit our senior secured debt to covenant compliance EBITDA (as defined below) ratio to exceed (a) 5.50x on the last day of any fiscal quarter ending on or before December 31, 2011; (b) 5.25x on the last day of any fiscal quarter ending on or after January 1, 2012, and ending on or before December 31, 2012; and (c) 5.00x on the last day of any fiscal quarter thereafter.
As of December 31, 2009, we were in compliance with all covenants in the Credit Agreement.
On November 24, 2009, the Operating Company and CapCo I co-issued $253.4 million aggregate principal amount of 8.25% senior unsecured notes due 2017 (“Senior Notes”). The net proceeds from the offering, along with cash on hand, were used to fully discharge our obligations and interest payments under our 8.50% senior notes due 2012. Besides these notes, as of December 31, 2009, we also had outstanding $375.0 million in senior subordinated notes due 2014 (“Senior Subordinated Notes”) co-issued by the Operating Company and CapCo I (collectively with the Senior Notes, the “Notes”). The Notes are unconditionally guaranteed, jointly and severally, by Holdings and certain domestic subsidiaries of the Operating Company and mature on October 7,
46
Table of Contents
2014 (Senior Subordinated Notes), and on January 1, 2017 (Senior Notes). Interest on the Senior Notes is payable semi-annually at 8.25% per annum and interest on the Senior Subordinated Notes is payable semi-annually at 9.875% per annum. In connection with the issuance of the Senior Notes, we entered into a registration rights agreement, under which we agreed to register with the SEC notes having substantially identical terms as part of an offer to exchange freely tradable exchange notes for the Senior Notes. In addition, we agreed to use our reasonable best efforts to cause each exchange offer to be completed or, if required, to have one or more shelf registration statements declared effective, before November 24, 2010. If we fail to meet this target (a “registration default”), the annual interest rate on the notes will increase by 0.25%. The annual interest rate on the notes will increase by an additional 0.25% for each subsequent 90-day period during which the registration default continues, up to a maximum additional interest rate of 1.0% per year. If the registration default is corrected, the applicable interest rate on the Senior Notes will revert to the original level.
At December 31, 2009, our total indebtedness was $2,436.9 million, net of $23.2 million unamortized discount, and our indebtness net of cash was $2,289.1 million.
Unused lines of credit, including the Revolver, at December 31, 2009 and 2008, were $245.6 million and $246.1 million, respectively. Substantially all unused lines of credit have no major restrictions and are provided under notes between us and the respective lending institutions.
We expect to fund scheduled debt repayments in 2010 from cash flow from operations. While we do not expect to draw on our Revolver in 2010, we continually review the condition of banks and institutions providing commitments and believe they would be able to meet their commitments should we have the need to draw on this facility. We believe our ability to generate cash flow from operations will be adequate to meet anticipated cash requirements to fund working capital, capital spending and other cash needs for the next twelve months. It is our intention to refinance in 2010 the portion of the Revolver maturing in 2010 and the portion of the Term Loans maturing in 2011. We may not be able to obtain refinancing on favorable terms or at all. See “Item 1A—Risk Factors—Risks Related to Our Indebtedness—We may obtain less favorable terms when we attempt to renew or replace our senior secured revolving credit facility and our senior secured term loan facility.”
The Credit Agreement and the indentures governing the Notes contain a number of significant covenants. We believe that these covenants are material terms of these agreements and that information about the covenants is material to an investor’s understanding of our financial condition and liquidity. Covenant compliance EBITDA (as defined below) is used to determine our compliance with certain of these covenants. Any breach of covenants in the Credit Agreement (including those that are tied to financial ratios based on covenant compliance EBITDA) could result in a default under the Credit Agreement and the lenders could elect to declare all amounts borrowed to be immediately due and payable. Any such acceleration would also result in a default under the indentures. Additionally, these covenants restrict our and our subsidiaries’ ability to dispose of assets, repay other indebtedness, incur additional indebtedness, pay dividends, prepay subordinated indebtedness, incur liens, make capital expenditures, investments or acquisitions, engage in mergers or consolidations, engage in transactions with affiliates and otherwise restrict our activities. Under the Credit Agreement, we are required to satisfy specified financial ratios and tests. The Credit Agreement also requires that up to 50% of excess cash flow (as defined in the Credit Agreement) is applied on an annual basis to pay down the Term Loans. An excess cash flow payment of $65.5 million is due for the year ended December 31, 2009, payable by March 31, 2010. As of December 31, 2009, we were in compliance with the financial ratios and tests specified in the Credit Agreement and we currently anticipate being able to comply with such financial ratios and tests for the next fiscal year, however, we cannot give any assurance this will occur.
We define covenant compliance EBITDA as EBITDA (i.e. earnings before interest, taxes, depreciation and amortization), generated by Holdings, further adjusted to exclude non-recurring items, non-cash items and other adjustments required in calculating covenant compliance under the Credit Agreement and the indentures, as shown in the table below. Adjusted EBITDA is defined as covenant compliance EBITDA, less project startup costs and certain other administrative expenses. Further, adjusted EBITDA is one of several measures we use to determine management
47
Table of Contents
incentive compensation. Covenant compliance EBITDA and adjusted EBITDA are not intended to represent cash flow from operations as defined by generally accepted accounting principles and should not be used as an alternative to net income as an indicator of operating performance or to cash flow as a measure of liquidity. We believe that the inclusion of covenant compliance EBITDA and adjusted EBITDA amounts in this annual report on Form 10-K is appropriate to provide additional information to investors about the calculation of certain financial covenants in the Credit Agreement and the indentures, as well as information as to how management is compensated. Because not all companies use identical calculations, these presentations of covenant compliance EBITDA and adjusted EBITDA may not be comparable to other similarly titled measures of other companies. A reconciliation of income (loss) from continuing operations to covenant compliance EBITDA and adjusted EBITDA is as follows:
Reconciliation of income (loss) from continuing operations to EBITDA
| Four Quarters Ended December 31, | ||||||||
| 2009 | 2008 | |||||||
| (In millions) | ||||||||
| Income (loss) from continuing operations |
$ | 23.8 | $ | (47.4 | ) | |||
| Interest income |
(1.1 | ) | (0.8 | ) | ||||
| Interest expense |
176.9 | 180.0 | ||||||
| Income tax provision |
27.0 | 13.0 | ||||||
| Depreciation and amortization |
158.6 | 175.5 | ||||||
| EBITDA |
$ | 385.2 | $ | 320.3 | ||||
Reconciliation of EBITDA to covenant compliance EBITDA
| Four Quarters Ended December 31, | ||||||
| 2009 | 2008 | |||||
| (In millions) | ||||||
| EBITDA |
$ | 385.2 | $ | 320.3 | ||
| Asset impairment charges |
41.8 | 96.1 | ||||
| Other non-cash charges (a) |
7.3 | 9.3 | ||||
| Fees related to monitoring agreements (b) |
5.0 | 5.0 | ||||
| Net loss on debt extinguishment |
8.7 | — | ||||
| Reorganization and other costs (c) |
14.4 | 22.0 | ||||
| Other administrative expenses (d) |
0.1 | 0.1 | ||||
| Adjusted EBITDA (e) |
462.5 | 452.8 | ||||
| Project startup costs (f) |
12.1 | 10.0 | ||||
| Other administrative expenses (g) |
0.7 | — | ||||
| Covenant compliance EBITDA |
$ | 475.3 | $ | 462.8 | ||
| (a) | Represents the net loss on disposal of fixed assets and stock-based compensation expense. |
| (b) | Represents annual fees paid to Blackstone Management Partners III L.L.C. and a limited partner of Holdings pursuant to the Fifth Amended and Restated Limited Partnership Agreement and the Amended and Restated Monitoring Agreement. |
| (c) | Represents non-recurring costs related to plant closures, employee severance, professional fees associated with an aborted 2008 transaction, consulting expenses associated with restructuring of the business, hurricanes Gustav and Ike and other costs defined in the Credit Agreement. |
| (d) | Represents administrative expenses incurred by us and paid by Blackstone on our behalf. |
| (e) | We use adjusted EBITDA as one factor in the setting of incentive compensation. |
| (f) | Represents costs associated with startups of manufacturing lines to produce new products. |
| (g) | Represents administrative expenses specific to GPC which are excluded from the computation of covenant compliance EBITDA. |
48
Table of Contents
Under applicable debt agreements, our ability to engage in activities such as incurring additional indebtedness, making investments and paying dividends is also tied to ratios based on covenant compliance EBITDA. The Credit Agreement requires that we maintain a senior secured debt to covenant compliance EBITDA ratio at a maximum of 5.5x for the most recent four-quarter period. For the four quarters ended December 31, 2009, the Operating Company’s covenant compliance EBITDA was $475.3 million and the senior secured debt to covenant compliance EBITDA ratio was 3.5x . Given the level of senior secured debt as of December 31, 2009, the Operating Company’s covenant compliance EBITDA could have fallen by $169.1 million to $306.2 million for the four quarters ended December 31, 2009, and we still would have been in compliance with the covenants in the Credit Agreement. The ability of the Operating Company to incur additional debt and make certain restricted payments under its Notes is tied to a minimum covenant compliance EBITDA to fixed charges (primarily cash interest expense) ratio of 2.0x, except that the Operating Company may incur certain debt and make certain restricted payments without regard to the ratio, including up to $2.2 billion under the Credit Agreement and investments equal to 7.5% of the Operating Company’s total assets. The covenant compliance EBITDA to fixed charges ratio was 2.8x for the four quarters ended December 31, 2009.
Substantially all of the tangible and intangible assets of our domestic subsidiaries that are guarantors under the Credit Agreement are pledged as collateral pursuant to the terms of the Credit Agreement.
Under the senior secured credit agreement, the Operating Company is subject to restrictions on the payment of dividends or other distributions to Holdings; provided that, subject to certain limitations, the Operating Company may pay dividends or other distributions to Holdings:
| • | with respect to overhead, tax liabilities, legal, accounting and other professional fees and expenses; and |
| • | to fund purchases and redemptions of equity interests of Holdings or GPC held by then present or former officers or employees of Holdings, the Operating Company or their Subsidiaries (as defined therein) or by any employee stock ownership plan upon that person’s death, disability, retirement or termination of employment or other circumstances with annual dollar limitations. |
We and our subsidiaries, affiliates or significant stockholders (including Blackstone) may, from time to time, subject to limitations in our debt agreements and in our or their sole discretion, purchase, repay, redeem or retire any of our outstanding debt or equity securities (including any publicly issued debt or equity securities), in privately negotiated or open market transactions, by tender offer or otherwise.
Cash paid for property, plant and equipment, excluding acquisitions, for 2009, 2008 and 2007 was $146.0 million, $148.6 million and $153.4 million, respectively. Our largest capital spending for 2009 included the installation of two new lines to service the east coast business of a food and beverage customer, the construction of an on-site plant for a large household customer in Missouri and new mold equipment for a beverage customer serving both east and west coast business. All of these projects were substantially complete by year end 2009. We believe that capital expenditures to maintain and upgrade property, plant and equipment are important to remain competitive. We estimate that on average the maintenance capital expenditures are approximately $30 million to $40 million per year. Additional capital expenditures beyond this amount will be required to expand capacity or improve our cost structure.
For the year 2010, we expect to incur capital expenditures ranging from $140 million to $160 million. However, total capital expenditures will depend on the size and timing of growth related opportunities. Our principal source of cash to fund ongoing operations and capital requirements has been and is expected to continue to be cash flow from operations. We believe that cash flow from operations will be sufficient to fund our ongoing operations and foreseeable capital requirements. In connection with plant expansion and improvement programs, we had commitments for capital expenditures of $24.3 million at December 31, 2009.
We have entered into agreements with an unrelated third-party for the financing of specific accounts receivable of certain foreign subsidiaries. For a further description of these agreements see “—Off-Balance Sheet Arrangements.”
49
Table of Contents
Year 2010 Outlook
For 2010, we believe we will have opportunities for further product packaging conversions to plastic. These opportunities could be balanced or offset by continued economic uncertainty, which may affect sales of certain products. In response to fluctuating conditions, we plan to control expenses, increase productivity and maintain discipline on working capital and capital expenditures.
The global economic climate has also resulted in increased foreign exchange rate volatility. We derive a significant percentage of our revenues from our non-U.S subsidiaries operating in their local currencies and those results are affected by changes in the values of non-U.S. currencies to the U.S. dollar. If the dollar remains at its current level relative to the local currencies of the countries in which we operate, or further strengthens, our sales and net income will be affected and the impact could be material. In January 2010, Venezuela became a country that has a highly inflationary economy. As such, in 2010, we will begin re-measuring our Venezuelan entity as if its functional currency was our reporting currency. We believe that this will not have a significant impact on our financial statements. We employ a number of strategies to manage our currency risks, including the use of derivative financial instruments. However, there can be no assurance that our efforts to manage our currency risks will be successful.
Contractual Obligations and Commitments
The following table sets forth our significant contractual obligations and commitments as of December 31, 2009, after giving effect to the paydown of our debt with proceeds from the IPO:
| Payments Due by Period | |||||||||||||||
| Contractual Obligations |
Total | 2010 | 2011 and 2012 |
2013 and 2014 |
2015 and beyond | ||||||||||
| (In thousands) | |||||||||||||||
| Long-term debt obligations (a)(b) |
$ | 2,443,029 | $ | 209,055 | $ | 584,751 | $ | 1,020,845 | $ | 628,378 | |||||
| Capital lease obligations |
17,039 | 10,414 | 6,622 | 3 | — | ||||||||||
| Interest payments (b)(c) |
670,145 | 159,803 | 274,367 | 194,168 | 41,807 | ||||||||||
| Operating lease obligations |
150,637 | 31,029 | 45,322 | 33,501 | 40,785 | ||||||||||
| Capital expenditures |
24,312 | 24,312 | — | — | — | ||||||||||
| Fees to Blackstone and the Graham Family (d) |
5,449 | 1,449 | 2,000 | 2,000 | — | ||||||||||
| Total |
$ | 3,310,611 | $ | 436,062 | $ | 913,062 | $ | 1,250,517 | $ | 710,970 | |||||
| (a) | Amounts exclude the unamortized discounts related to the Credit Agreement and Senior Notes of $23.2 million as of December 31, 2009. |
| (b) | Amounts reflect the effect of the paydown of our Credit Agreement of $114.2 million on February 17, 2010, with the net proceeds received from the IPO. |
| (c) | Interest payments are calculated based upon our 2009 year-end actual interest rates. |
| (d) | Represents annual fees paid and payable to Blackstone Management Partners III L.L.C. and the Graham Family under monitoring agreements and the limited partnership agreement of Holdings. Such agreements have no contractual term and for purposes of this table are assumed to be outstanding for a period of five years. For further information of such agreements, see Note 14, “Transactions with Related Parties,” of the Notes to Consolidated Financial Statements included in this Report. The amounts in the table reflect the reduction of the fees resulting from the termination of the Amended and Restated Monitoring Agreement on February 10, 2010, in conjunction with our initial public offering. The amount for 2010, however, does not include the fee of $35.0 million to terminate this agreement, which has already been paid. |
In addition to the amounts included above, in 2010 we expect to make cash contributions to our pension plans of approximately $7.3 million. Cash contributions in subsequent years will depend on a number of factors including the performance of plan assets.
50
Table of Contents
In connection with the IPO we entered into income tax receivable agreements which will obligate us to make payments to our pre-IPO stockholders (including Blackstone) and the Graham Family of 85% of the amount of cash savings, if any, in U.S. federal, state and local income tax that we actually realize (or are deemed to realize in the case of an early termination by us or a change of control) as a result of (i) the utilization of our net operating losses attributable to periods prior to the IPO, (ii) any increase to the tax basis of the assets of Holdings relating to our 1998 acquisition of 85% of Holdings and future exchanges of limited partnership units by the Graham Family pursuant to the exchange agreement, and (iii) other tax benefits related to our entering into the income tax receivable agreements, including tax benefits attributable to payments under the income tax receivable agreements.
Uncertain tax contingencies are positions taken or expected to be taken on an income tax return that may result in additional payments to tax authorities. However, due to the uncertainty of the timing of future cash flows associated with our unrecognized tax benefits, we are unable to make reasonably reliable estimates of the period of cash settlement, if any, with the respective taxing authorities. Accordingly, unrecognized tax benefits of $56.3 million as of December 31, 2009, have been excluded from the contractual obligations table above. For further information related to unrecognized tax benefits, see Note 20, “Income Taxes,” of the Notes to Consolidated Financial Statements included in this Report.
Other contractual obligations include certain derivatives with a net liability of $16.8 million as of December 31, 2009. We would have been required to pay this amount to the counterparties to settle these derivatives at December 31, 2009. As required under ASC 815-30, “Derivative Instruments and Hedging Activities,” these derivatives will be revalued at each balance sheet date, potentially resulting in a different asset or liability position. Based on the uncertainty of timing and amounts of payments in the future, these derivative contracts are excluded from the contractual obligations table above.
Off-Balance Sheet Arrangements
As of December 31, 2009, we did not have any off-balance sheet arrangements as defined in Item 303(a)(4)(ii) of SEC Regulation S-K.
We have entered into agreements with an unrelated third-party for the financing of specific accounts receivable of certain foreign subsidiaries. The financing of accounts receivable under these agreements is accounted for as a sale of receivables in accordance with the guidance under ASC 860-20, “Sale of Financial Assets.” Under the terms of the financing agreements, we transfer ownership of eligible accounts receivable without recourse to the third-party purchaser in exchange for cash. Proceeds on the transfer reflect the face value of the accounts receivable less a discount. The discount is recorded against net sales on the consolidated statement of operations in the period of the sale. The eligible receivables financed pursuant to this factoring agreement are excluded from accounts receivable on the consolidated balance sheet and are reflected as cash provided by operating activities on the consolidated statement of cash flows, while non-eligible receivables remain on the balance sheet with a corresponding liability established when those receivables are financed. We do not continue to service, administer and collect the eligible receivables under this program. The third-party purchaser has no recourse to us for failure of debtors constituting eligible receivables to pay when due. We maintain insurance on behalf of the third-party purchaser to cover any losses due to the failure of debtors constituting eligible receivables to pay when due. At December 31, 2009 and 2008, we had sold $15.7 million and $29.9 million of eligible accounts receivable, respectively, which represent the face amounts of total outstanding receivables at those dates.
Critical Accounting Policies and Estimates
Long-Lived Assets
The plastic container business is capital intensive and highly competitive. Technology and market conditions can change rapidly, possibly impacting the fair value of our long-lived assets. Long-lived assets are
51
Table of Contents
reviewed for impairment whenever events or changes in circumstances indicate that the carrying amount of an asset may not be recoverable. We use either a single scenario estimate or a probability-weighted estimate of the future undiscounted net cash flows of the related asset or asset grouping over the remaining life in measuring whether the assets are recoverable. For assets deemed not recoverable, any impairment loss, if indicated, is measured on the amount by which the carrying amount of the asset exceeds the estimated fair value of the asset. When fair values are not available, we estimate fair value using either single scenario expected future cash flows discounted at a risk-adjusted rate or probability-weighted expected future cash flows discounted at a risk-free rate. Management believes that this policy is critical to the financial statements, particularly when evaluating long-lived assets for impairment. Varying results of this analysis are possible due to the significant estimates involved in our evaluations.
As part of our review for impairment of long-lived assets during the year ended December 31, 2009, we performed an evaluation of indicators of possible impairment. Long-lived assets, with a net book value of $125.0 million, were identified as having a carrying value that may not be recoverable. Our further evaluation of these assets (“Step 1 analysis”) indicated that assets with a net book value of $94.5 million were not impaired, as the estimated undiscounted cash flows exceeded the net book value. Assets with a net book value of $30.5 million required further evaluation (“Step 2 analysis”) for impairment as a result of the net book value exceeding the estimated undiscounted cash flows. The estimated fair value of such assets was compared to the net book value, resulting in impairment charges (including impairment charges related to idle assets with no future value identified during the year) of $41.8 million for the year ended December 31, 2009. For assets that were considered not to be impaired following the Step 1 analysis, the expected undiscounted future cash flows substantially exceeded the total net book value of such assets.
Impairment of Goodwill
Goodwill is not amortized, but instead is subject to impairment testing. We perform an evaluation to determine whether goodwill is impaired annually, or when events occur or circumstances change that would more likely than not reduce the fair value of a reporting unit below its carrying amount. Events or circumstances that might indicate an interim evaluation is warranted include unexpected adverse business conditions, economic factors, unanticipated technological changes or competitive activities, loss of key personnel and acts by governments and courts.
We test impairment at the reporting unit level, which, as defined in ASC 350-20, “Intangibles—Goodwill and Other,” is an operating segment or one level below an operating segment (referred to as a component). A component of an operating segment is a reporting unit if the component constitutes a business for which discrete financial information is available and segment management regularly reviews the operating results of that component. We generally define our reporting units at the country level.
The identification and measurement of goodwill impairment involves the estimation of the fair value of reporting units. We consider a number of factors, including the input of an independent appraisal firm, in conducting the impairment testing of our reporting units. We perform our impairment testing by comparing the estimated fair value of the reporting unit to the carrying value of the reported net assets, with such testing occurring as of the end of each year. Fair value is generally based on the income approach using a calculation of discounted cash flows, based on the most recent financial projections for the reporting units, and is reconciled to our determination of total enterprise fair value. The financial projections are management’s best estimates based on current and forecasted market conditions. The calculation of fair value for our reporting units incorporates many assumptions including future growth rates, profit margins and discount factors; such assumptions are consistent with our annual budgeting and forecasting process. Changes in economic and operating conditions impacting these assumptions could result in additional impairment charges in future periods. In concluding on the fair values, we also consider the reasonableness of the implied EBITDA multiples resulting from the discounted cash flow analyses in comparison to EBITDA multiples from publicly traded companies in our industry and relevant transactions. We do not, however, directly apply a market approach in determining the fair values. Our methodology for determining fair values remained consistent for reported periods.
52
Table of Contents
Our evaluation as of December 31, 2009, resulted in no impairment charges. A 1% increase in the discount rates used in our evaluation would have resulted in a reduction of enterprise fair value of reporting units tested of approximately $358 million and no additional impairment charge for the year ended December 31, 2009. The goodwill remaining on the books as of December 31, 2009, was $386.0 million, $34.8 million, $12.5 million and $3.8 million for the reporting units of the U.S., Mexico, Poland and the Netherlands, respectively. The estimated fair values determined for each of these reporting units substantially exceeded their respective carrying values as of December 31, 2009.
Derivatives
We account for derivatives under ASC 815, “Derivatives and Hedging.” This guidance establishes accounting and reporting for derivative instruments, including certain derivative instruments embedded in other contracts, and for hedging activities. All derivatives, whether designated in hedging relationships or not, are required to be recorded on the balance sheet at fair value. The fair value of the derivatives is determined from sources independent of us, including the financial institutions which are party to the derivative instruments. The fair value of derivatives also considers the credit default risk of the paying party. If the derivative is designated as a fair value hedge, the changes in the fair value of the derivative and the hedged item will be recognized in earnings. If the derivative is designated as a cash flow hedge, the effective portion of the change in the fair value of the derivative will be recorded in other comprehensive income (loss) and will be recognized in the income statement when the hedged item affects earnings.
In the past, we have entered into interest rate swap and collar agreements, foreign currency exchange contracts and natural gas swap agreements. These derivative contracts are accounted for as cash flow hedges.
ASC 815 defines requirements for designation and documentation of hedging relationships as well as ongoing effectiveness assessments in order to use hedge accounting. For a derivative that does not qualify as a hedge, changes in fair value will be recognized in earnings. Continued use of hedge accounting is dependent on management’s adherence to this accounting policy. Failure to properly document our interest rate swap and collar agreements, foreign currency exchange contracts and natural gas swap agreements as cash flow hedges would result in income statement recognition of all or part of any future unrealized gain or loss recorded in other comprehensive income (loss). The potential income statement impact resulting from a failure to adhere to this policy makes this policy critical to the financial statements.
Benefit Plans
We have several defined benefit plans, under which participants earn a retirement benefit based upon a formula set forth in the plan. Key assumptions used in the actuarial valuations include the discount rate and the anticipated rate of return on plan assets, as determined by management. These rates are based on market interest rates, and therefore, fluctuations in market interest rates could impact the amount of pension expense recorded for these plans. Our primary U.S. defined benefit plan for hourly and salaried employees was frozen to future salary and service accruals in the fourth quarter of 2006.
These assumptions change based on changes in rates derived from high-quality long-term bond indices, the terms of which approximate the term of the cash flows to pay the accumulated benefit obligations when due. A decrease of 50 basis points in the discount rate and the long-term rate of return on plan assets, assuming no other changes in estimates, would have increased the amount of the required annual expense by approximately $0.6 million for the year ended December 31, 2009, and increased the pension liability by $0.4 million as of December 31, 2009.
Income Taxes
We account for income taxes in accordance with ASC 740-10, “ Income Taxes,” which requires that deferred tax assets and liabilities be recognized using enacted tax rates for the effect of temporary differences
53
Table of Contents
between the financial reporting and tax bases of recorded assets and liabilities. ASC 740-10 also requires that deferred tax assets be reduced by a valuation allowance if it is more likely than not that some portion or all of the deferred tax asset will not be realized. We have recorded a valuation allowance to reduce our deferred tax assets to the amount that we believe is more likely than not to be realized. Our assumptions regarding future realization may change due to future operating performance and other factors.
Inherent in determining our effective tax rate are judgments regarding business plans and expectations about future operations. These judgments include the amount and geographic mix of future taxable income, limitations on usage of net operating loss carry-forwards, potential tax law changes, the impact of ongoing or potential tax audits, earnings repatriation plans and other future tax consequences.
In 2007, we implemented the guidance under ASC 740-10, “Basic Recognition Threshold,” which prescribes a recognition threshold and measurement attribute for the financial statement recognition and measurement of a tax position taken or expected to be taken in a tax return. ASC 740-10 also provides guidance on accounting for derecognition, interest, penalties, accounting in interim periods, disclosure and classification of matters related to uncertainty in income taxes and transitional requirements upon adoption of this guidance. Due to the significant amounts involved and judgment required, we deem this policy to be critical to our financial statements.
For disclosure of all of our significant accounting policies see Note 1 of the Notes to Consolidated Financial Statements included in this Report.
Recently Issued Accounting Pronouncements
In September 2006, the FASB issued guidance under ASC 820-10, “Fair Value Measurements and Disclosures” (formerly Statement of Financial Accounting Standards (“SFAS”) 157, “Fair Value Measurements”). This guidance establishes a single authoritative definition of fair value, sets out a framework to classify the source of information used in fair value measurements, identifies additional factors that must be disclosed about assets and liabilities measured at fair value based on their placement in the new framework and modifies the long-standing accounting presumption that the transaction price of an asset or liability equals its initial fair value. In February 2008, the FASB delayed the effective date for certain non-financial assets and liabilities until January 1, 2009. We adopted this guidance effective January 1, 2008, for financial assets and liabilities (see Note 12 of the Notes to Consolidated Financial Statements in this Report for further discussion). We adopted this guidance for certain non-financial assets and liabilities effective January 1, 2009, and the adoption had no impact on our financial statements as it relates to these assets and liabilities.
In December 2007, the FASB issued guidance under ASC 810-10, “Consolidations” (formerly SFAS 160, “Noncontrolling Interests in Consolidated Financial Statements—Amendment of ARB No. 51”). This guidance establishes accounting and reporting standards for ownership interests in subsidiaries held by parties other than the parent, changes in a parent’s ownership of noncontrolling interests, calculation and disclosure of the consolidated net income attributable to the parent and the noncontrolling interests, changes in a parent’s ownership interest while the parent retains its controlling financial interest and fair value measurement of any retained noncontrolling equity investment. We adopted this guidance effective January 1, 2009. The adoption resulted in our recognizing allocated income or loss to noncontrolling interests in 2009.
In March 2008, the FASB issued guidance under ASC 815-30, “Derivatives and Hedging” (formerly SFAS 161, “Disclosures about Derivative Instruments and Hedging Activities”). This guidance is intended to improve financial reporting about derivative instruments and hedging activities by requiring enhanced disclosures to enable investors to better understand their effects on an entity’s financial position, financial performance and cash flows. It requires disclosure of the fair values of derivative instruments and their gains and losses in a tabular format. It also requires more information about an entity’s liquidity by requiring disclosure of derivative features that are credit risk-related, and requires cross-referencing within footnotes to enable financial statement users to locate important information about derivative instruments. We adopted this guidance effective January 1, 2009.
54
Table of Contents
In December 2008, the FASB issued guidance under ASC 715, “Defined Benefit Plans” (formerly Staff Position FAS 132(R)-1, “Employers’ Disclosures about Postretirement Benefit Plan Assets”), which requires enhanced disclosures of the plan assets of an employer’s defined benefit pension or other postretirement benefit plans. The disclosures required under this guidance include information regarding the investment allocation decisions made for plan assets, the fair value of each major category of plan assets disclosed separately for pension plans and other postretirement benefit plans and the inputs and valuation techniques used to measure the fair value of plan assets that would be similar to the disclosures about fair value measurements required by ASC 820-10. We adopted this guidance effective December 31, 2009.
In April 2009, the FASB issued guidance under ASC 825-10-65-1, “Financial Instruments—Overall—Transition and Open Effective Date Information” (formerly Staff Position FAS 107-1 and Accounting Principles Board Opinion 28-1, “Interim Disclosures about Fair Value of Financial Instruments”). This guidance requires disclosures about fair value of financial instruments for interim reporting periods that were previously only required in annual financial statements. We adopted this guidance effective June 30, 2009.
In May 2009, the FASB issued guidance under ASC 855, “Subsequent Events” (formerly SFAS 165, “Subsequent Events”). This guidance establishes general standards of accounting for and disclosure of events that occur after the balance sheet date but before financial statements are issued or are available to be issued. We adopted this guidance effective June 30, 2009, and the adoption had no impact on our financial statements.
In June 2009, the FASB issued guidance under ASC 860, “Transfers and Servicing” (formerly SFAS 166, “Accounting for Transfers of Financial Assets, an amendment of SFAS 140”). This guidance improves the relevance, representational faithfulness and comparability of the information that a reporting entity provides in its financial reports about a transfer of financial assets, the effects a transfer will have on its financial performance and cash flows and any transferor’s continuing involvement in transferred financial assets. This guidance is effective for interim and annual reporting periods that begin after November 15, 2009. We adopted this guidance effective January 1, 2010, and the adoption had no impact on our financial statements.
In June 2009, the FASB issued guidance under ASC 105-10, “Generally Accepted Accounting Principles” (formerly SFAS 168, “FASB Accounting Standards Codification and the Hierarchy of Generally Accepted Accounting Principles”). This guidance establishes the ASC as the single source of authoritative nongovernmental generally accepted accounting principles (“GAAP”), superseding existing pronouncements published by the FASB, American Institute of Certified Public Accountants, Emerging Issues Task Force and other accounting bodies. This guidance establishes only one level of authoritative GAAP. All other accounting literature will be considered non-authoritative. The ASC reorganizes the GAAP pronouncements into accounting topics and displays them using a consistent structure. We adopted this guidance effective July 1, 2009.
Management has determined that all other recently issued accounting pronouncements will not have a material impact on our financial statements, or do not apply to our operations.
Subsequent Events
On February 10, 2010, we completed our IPO and on February 11, 2010, our stock began trading on the New York Stock Exchange under the symbol “GRM.” In connection with our IPO, on February 4, 2010, we increased the number of authorized shares of common stock to 500,000,000 and of preferred stock to 100,000,000, and effected a 1,465.4874-for-one stock split of our shares of common stock. Additionally, Holdings effected a 3,781.4427-for-one unit split and the limited partnership agreement of Holdings has been amended and restated as the Sixth Amended and Restated Limited Partnership Agreement (the “Partnership Agreement”). Pursuant to the Partnership Agreement, the partnership interests in Holdings have been denominated as limited partnership units and general partnership units with no change in relative economic ownership percentages prior to our IPO.
55
Table of Contents
On February 17, 2010, and in connection with our IPO, we purchased from Holdings 16,666,667 newly-issued, unregistered limited partnership units for an aggregate amount of $114.2 million. On February 17, 2010, a portion of these net proceeds, and cash on hand, was used to pay a portion of the Term Loan B and Term Loan C. An aggregate of $115.1 million of the Term Loans was repaid, of which $19.4 million was allocated to repay principal and accrued interest on Term Loan B and $95.7 million was allocated to repay principal and accrued interest on Term Loan C. Additionally, as part of our IPO, the Graham Family entered into an Exchange Agreement as described below, and exercised their rights to exchange approximately 1.3 million units in Holdings for shares of our common stock.
Following these events:
| • | we now owns 58,966,881 limited partnership units, representing an 87.6% limited partnership interest, and our wholly owned subsidiary, BCP, is the sole general partner and owns 2,023,472 general partnership units, representing a 3.0% ownership in Holdings; |
| • | general partnership interests of the Graham Family have been converted into limited partnership interests on an equivalent basis such that the Graham Family owns an aggregate of 6,263,121 limited partnership units, representing a 9.3% limited partnership interest in Holdings; and |
| • | current and former directors and employees own 35,167 limited partnership units and options to acquire an aggregate of 4,746,940 limited partnership units in Holdings. |
The Partnership Agreement also provides that for so long as the Graham Family retains at least one-third of their partnership interests held as of February 2, 1998 (or equivalent common stock of GPC for which such partnership interests have been or are eligible to be exchanged), they are entitled to an advisory fee of $1.0 million annually for ongoing management and advisory services.
Income Tax Receivable Agreement
Also on February 10, 2010, we entered into separate Income Tax Receivable Agreements (“ITRs”) with pre-IPO stockholders and with GPC Holdings, L.P. (“GPCL”). The agreements provide for the payment by us to all of our pre-IPO stockholders (e.g. Blackstone, management and other stockholders) and to the Graham Family of 85% of the amount of cash savings, if any, in U.S. federal, state and local income tax that is actually realized (or are deemed to realize in the case of an early termination or change in control as further defined by the ITRs) as a result of the utilization of net operating losses attributable to periods prior to the IPO, and any increase to the tax basis of the assets of the Company related to (1) the 1998 acquisition of Holdings and (2) future exchanges by the Graham Family of their units for our common stock pursuant to the Exchange Agreement, and of certain other tax benefits related to our entering into the ITRs, including tax benefits attributable to payments under the ITRs.
We expect that the payments that we make under these income tax receivable agreements will be material. Assuming no material changes in the relevant tax law, and that we earn sufficient taxable income to realize the full tax benefits subject to the income tax receivable agreements, we expect that future payments under the income tax receivable agreements will aggregate to between $190 million to $240 million with potential additional payments for tax basis step-ups relating to future exchanges by the Graham Family of their limited partnership units in Holdings for common stock depending on the timing and value of such exchanges. This range is based on our assumptions using presently available information including with respect to valuation, historic tax basis and the amount of tax attributes subject to the income tax receivable agreements that were in existence as of the IPO date. Such amounts may differ materially from the amounts presented above based on various items, including final valuation analysis and updated determinations of taxable income and historic tax basis amounts. The payments under the income tax receivable agreements are not conditioned upon these parties’ continued ownership of us or Holdings. We will recognize such obligations based on the amount of recorded net deferred income tax assets recognized by us, and subject to the income tax receivable agreements. Changes in the recorded net deferred income tax assets will result in changes in the income tax receivable agreement obligations, and such changes will be recorded as other income or expense.
56
Table of Contents
Because we are a holding company with no operations of our own, our ability to make payments is dependent on the ability of Holdings to make distributions. Our credit agreements and outstanding notes generally restrict the ability to make distributions. To the extent we are unable to make payments under the ITRs for any reason, such payments will be deferred and will accrue interest at a rate of LIBOR plus five percent per annum until paid, provided that a failure to make a payment due pursuant to the terms of the ITRs within six months of the date such payment is due will generally constitute a breach, and payments under the ITRs would then be accelerated.
Exchange Agreement
Under the Exchange Agreement, the Graham Family and certain permitted transferees may, subject to specific terms, exchange their limited partnership units in Holdings for shares of our common stock at any time and from time to time on a one-for-one basis, subject to customary conversion rate adjustments for splits, stock dividends and reclassifications.
Under this Exchange Agreement, through February 18, 2010, entities controlled by the Graham Family and certain of their permitted transferees exercised their rights to exchange 1,324,900 limited partnership units of Holdings for 1,324,900 shares of the Company’s common stock. As a result of this exchange, entities controlled by the Graham Family own limited partnership units representing 9.6% of the limited partnership interests in Holdings and shares representing 2.2% of our common stock.
We have also entered into Management Exchange Agreements which provide for similar rights to management to exchange limited partnership units of Holdings obtained on exercise of outstanding options for shares of our common stock.
Registration Rights Agreement
Under the Registration Rights Agreement certain parties have been granted rights with respect to shares of our common stock, either held by them or received upon the exchange of limited partnership units of Holdings. The Registration Rights Agreement provides (1) to the Graham Family and their affiliates (and their permitted transferees) of partnership interests in the Company two “demand” registrations at any time and customary “piggyback” registration rights and (2) to Blackstone, an unlimited number of “demand” registrations and customary “piggyback” registration rights. In addition, the Registration Rights Agreement provides that the Graham Family and their affiliates may request that we file a shelf registration statement beginning on the 181st day after the IPO. The Graham Family and their affiliates may also request that we pay certain expenses of the Graham Family, Blackstone and their affiliates and certain other investors relating to such registrations and indemnify them against certain liabilities, which may arise under the Securities Act of 1933, as amended.
In connection with the IPO, the following agreements were terminated:
Termination of the Amended and Restated Monitoring Agreement
Holdings was party to a Monitoring Agreement whereas Blackstone Management Partners III L.L.C.(“BMP”) and Graham Alternative Investment Partners I (“GAIP”) provided management and advisory services to Holdings. On February 10, 2010, in connection with the IPO and in exchange for a one-time payment of $26.3 million to BMP, and $8.8 million to GAIP, the parties of the Monitoring Agreement agreed to terminate such agreement. These amounts paid to terminate the Monitoring Agreement represent the estimated fair value of future payments under the agreement. As a result of the termination, Blackstone the Graham Family and their affiliates have no further obligation to provide monitoring services to Holdings, and Holdings has no further obligation to make annual payments of $4.0 million under the Monitoring Agreement.
57
Table of Contents
Termination of the Stockholders’ Agreement
Holdings was party to a Stockholders Agreement with Blackstone, GPC Capital Corp. II and BT Investment Partners, Inc. which restricted transfer of ownership interests. On February 10, 2010, in connection with the IPO, the Stockholders Agreement was terminated in consideration for the rights granted under the Registration Rights Agreement.
Termination of the Management Stockholders Agreement
Holdings was party to a Management Stockholders Agreement with Blackstone, GPC Capital Corp. II and certain current and former members of management (the “Management Stockholders”) which restricted transfer of ownership interests and provided certain tag and drag-along rights. On January 25, 2010, and in connection with the IPO, the Company entered into Letter Agreements with the Management Stockholders, pursuant to which each Management Stockholders rights under the Management Stockholders Agreement were terminated as of February 17, 2010, in consideration for the rights granted to such person under the Registration Rights Agreement.
| Item 7A. | Quantitative and Qualitative Disclosures About Market Risk |
In the normal course of business we are subject to risk from adverse fluctuations in interest and foreign exchange rates and commodity prices. We manage these risks through a program that includes the use of derivative financial instruments, primarily interest rate swap and collar agreements, foreign currency exchange contracts and natural gas swap agreements. Counterparties to these contracts are major financial institutions. These instruments are not used for trading or speculative purposes. The extent to which we use such instruments is dependent upon our access to them in the financial markets and our use of other methods, such as netting exposures for foreign exchange risk and establishing sales arrangements that permit the pass-through to customers of changes in commodity prices and foreign exchange rates, to effectively achieve our goal of risk reduction. Our objective in managing our exposure to market risk is to limit the impact on earnings and cash flow.
Interest Rate Risk
We had significant long- and short-term debt commitments outstanding as of December 31, 2009. These on-balance sheet financial instruments, to the extent they provide for variable rates of interest, expose us to interest rate risk. We manage our interest rate risk by entering into interest rate swap and collar agreements. Based on the outstanding amount of our variable-rate indebtedness at December 31, 2009, a one percentage point change in the interest rates for our variable-rate indebtedness would impact interest expense by an aggregate of approximately $6.2 million, excluding the impact of our interest rate collar and swap agreements at December 31, 2009. All of our derivative financial instrument transactions are entered into for non-trading purposes.
Our financial instruments at December 31, 2009, including derivative instruments, which expose us to interest rate risk and market risk are presented in the table below. For variable-rate debt obligations, the table presents principal cash flows and related actual weighted average interest rates as of December 31, 2009. For fixed-rate debt obligations, the table presents principal cash flows and related weighted average interest rates by maturity dates. Amounts in the table exclude the unamortized discounts related to the Credit Agreement and the Senior Notes of $23.2 million as of December 31, 2009. Amounts in the table also reflect the effect of the paydown of our Credit Agreement of $114.2 million on February 17, 2010, with the net proceeds received from our initial public offering. For interest rate swap and collar agreements, the table presents notional amounts and interest rates, by expected (contractual) maturity date, including the pay rates and the receive rates (actual interest rates at December 31, 2009). The interest rate swap and collar agreements are accounted for as cash flow hedges.
58
Table of Contents
Notes 12 and 13 of the Notes to Consolidated Financial Statements included in this Report should be read in conjunction with the table below.
| Expected Maturity Date of Long-Term Debt (Including Current Portion) and Interest Rate Swap Agreements at December 31, 2009 |
Fair Value at December 31, 2009 |
|||||||||||||||||||||||||||||||
| 2010 | 2011 | 2012 | 2013 | 2014 | Thereafter | Total | ||||||||||||||||||||||||||
| (Dollars in thousands) | ||||||||||||||||||||||||||||||||
| Interest rate sensitive liabilities: |
||||||||||||||||||||||||||||||||
| Variable-rate borrowings, including short-term amounts |
$ | 204,543 | $ | 573,992 | $ | 10,606 | $ | 10,606 | $ | 1,010,233 | $ | — | $ | 1,809,980 | $ | 1,809,763 | ||||||||||||||||
| Average interest rate |
6.10 | % | 2.60 | % | 6.75 | % | 6.75 | % | 6.75 | % | 5.36 | % | ||||||||||||||||||||
| Fixed-rate borrowings |
$ | 14,926 | $ | 6,158 | $ | 617 | $ | 9 | $ | — | $ | 628,378 | $ | 650,088 | $ | 652,850 | ||||||||||||||||
| Average interest rate |
9.66 | % | 7.64 | % | 6.12 | % | 4.01 | % | 9.22 | % | 9.21 | % | ||||||||||||||||||||
| Total interest rate sensitive liabilities |
$ | 219,469 | $ | 580,150 | $ | 11,223 | $ | 10,615 | $ | 1,010,233 | $ | 628,378 | $ | 2,460,068 | $ | 2,462,613 | ||||||||||||||||
| Derivatives matched against liabilities: |
||||||||||||||||||||||||||||||||
| Pay fixed swaps |
— | $ | 350,000 | — | — | — | — | $ | 350,000 | $ | (16,688 | ) | ||||||||||||||||||||
| Pay rate |
— | 4.08 | % | — | — | — | — | 4.08 | % | |||||||||||||||||||||||
| Receive rate |
— | 0.28 | % | — | — | — | — | 0.28 | % | |||||||||||||||||||||||
| Interest rate collars |
$ | 385,000 | — | — | — | — | — | $ | 385,000 | $ | (68 | ) | ||||||||||||||||||||
| Cap rate |
4.70 | % | — | — | — | — | — | 4.70 | % | |||||||||||||||||||||||
| Floor rate |
2.88 | % | — | — | — | — | — | 2.88 | % | |||||||||||||||||||||||
Foreign Currency Exchange Rate Risk
We manage foreign currency exposures (primarily to the euro, Canadian dollar, Polish zloty, Brazilian real, pound sterling and certain non-U.S. subsidiaries’ purchases of raw materials and/or sales of products in U.S. dollars) at the operating unit level. Exposures that cannot be naturally offset within an operating unit are hedged with derivative financial instruments where possible and cost effective in our judgment. Foreign currency exchange contracts which hedge defined exposures generally mature within twelve months. We do not generally hedge our exposure to translation gains or losses on our non-U.S. net assets. Foreign currency exchange contracts are accounted for as cash flow hedges. At December 31, 2009 and 2008, we had foreign currency exchange contracts outstanding for the purchase of pound sterling in an amount of $1.5 million and Canadian dollars and pound sterling in an aggregate amount of $10.2 million, respectively.
Commodity Pricing Risk
We purchase commodities for our products such as HDPE and PET resins. These commodities are generally purchased pursuant to contracts or at market prices established with the vendor. In general, we do not engage in hedging activities for these commodities due to our ability to pass on price changes to our customers.
We also purchase other commodities, such as natural gas and electricity, and are subject to risks on the pricing of these commodities. In general, we purchase these commodities pursuant to contracts or at market prices. We manage a portion of our exposure to natural gas price fluctuations through natural gas swap agreements. We entered into natural gas swap agreements to hedge approximately 54% and 22% of our domestic exposure to fluctuations in natural gas prices for the years ended December 31, 2009 and 2008, respectively. At December 31, 2009, we had no natural gas swap agreements outstanding.
59
Table of Contents
| Item 8. | Financial Statements and Supplementary Data |
60
Table of Contents
REPORT OF INDEPENDENT REGISTERED PUBLIC ACCOUNTING FIRM
To the Board of Directors and Stockholders of
Graham Packaging Company Inc.
York, Pennsylvania
We have audited the accompanying consolidated balance sheets of Graham Packaging Company Inc. (formerly, BMP/Graham Holdings Corporation) and subsidiaries (the “Company”) as of December 31, 2009 and 2008, and the related consolidated statements of operations, comprehensive income (loss), equity (deficit), and cash flows for each of the three years in the period ended December 31, 2009. Our audits also included financial statement schedules I and II listed in the index at Item 15(2). These financial statements and financial statement schedules are the responsibility of the Company’s management. Our responsibility is to express an opinion on these financial statements and financial statement schedules based on our audits.
We conducted our audits in accordance with the standards of the Public Company Accounting Oversight Board (United States). Those standards require that we plan and perform the audit to obtain reasonable assurance about whether the financial statements are free of material misstatement. The Company is not required to have, nor were we engaged to perform, an audit of its internal control over financial reporting. Our audits included consideration of internal control over financial reporting as a basis for designing audit procedures that are appropriate in the circumstances, but not for the purpose of expressing an opinion on the effectiveness of the Company’s internal control over financial reporting. Accordingly, we express no such opinion. An audit also includes examining, on a test basis, evidence supporting the amounts and disclosures in the financial statements. An audit also includes, assessing the accounting principles used and significant estimates made by management, as well as evaluating the overall financial statement presentation. We believe that our audits provide a reasonable basis for our opinion.
In our opinion, such consolidated financial statements present fairly, in all material respects, the financial position of Graham Packaging Company Inc. and subsidiaries as of December 31, 2009 and 2008, and the results of their operations and their cash flows for each of the three years in the period ended December 31, 2009 in conformity with accounting principles generally accepted in the United States of America. Also, in our opinion, such financial statement schedules, when considered in relation to the basic consolidated financial statements taken as a whole, present fairly in all material respects the information set forth therein.
As discussed in Note 1 to the consolidated financial statements, on January 1, 2009, the Company adopted new accounting and reporting standard related to noncontrolling interests.
/s/ DELOITTE & TOUCHE LLP
Philadelphia, Pennsylvania
March 5, 2010
61
Table of Contents
CONSOLIDATED BALANCE SHEETS
(In thousands)
| December 31, | ||||||||
| 2009 | 2008 | |||||||
| ASSETS |
||||||||
| Current assets: |
||||||||
| Cash and cash equivalents |
$ | 147,808 | $ | 43,879 | ||||
| Accounts receivable, net |
191,685 | 233,734 | ||||||
| Inventories |
194,702 | 224,361 | ||||||
| Deferred income taxes |
3,446 | 2,829 | ||||||
| Prepaid expenses and other current assets |
58,297 | 57,248 | ||||||
| Total current assets |
595,938 | 562,051 | ||||||
| Property, plant and equipment |
1,974,152 | 1,957,238 | ||||||
| Less accumulated depreciation and amortization |
956,374 | 894,966 | ||||||
| Property, plant and equipment, net |
1,017,778 | 1,062,272 | ||||||
| Intangible assets, net |
43,012 | 46,258 | ||||||
| Goodwill |
437,058 | 434,645 | ||||||
| Other non-current assets |
32,506 | 44,587 | ||||||
| Total assets |
$ | 2,126,292 | $ | 2,149,813 | ||||
| LIABILITIES AND EQUITY (DEFICIT) |
||||||||
| Current liabilities: |
||||||||
| Current portion of long-term debt |
$ | 100,657 | $ | 56,899 | ||||
| Accounts payable |
111,013 | 100,778 | ||||||
| Accrued expenses and other current liabilities |
186,806 | 192,443 | ||||||
| Deferred revenue |
30,245 | 34,646 | ||||||
| Total current liabilities |
428,721 | 384,766 | ||||||
| Long-term debt |
2,336,206 | 2,442,339 | ||||||
| Deferred income taxes |
24,625 | 20,261 | ||||||
| Other non-current liabilities |
99,854 | 120,829 | ||||||
| Commitments and contingent liabilities (see Notes 21 and 22) Equity (deficit): |
||||||||
| Graham Packaging Company Inc. stockholders’ equity (deficit): |
||||||||
| Preferred stock, $0.01 par value, 100,000,000 shares authorized, 0 shares issued and outstanding |
— | — | ||||||
| Common stock, $0.01 par value, 500,000,000 shares authorized, shares issued and outstanding 42,998,786 and 42,975,419 |
430 | 430 | ||||||
| Additional paid-in capital |
297,470 | 296,650 | ||||||
| Retained earnings (deficit) |
(1,032,887 | ) | (1,043,966 | ) | ||||
| Notes and interest receivable for ownership interests |
(6,353 | ) | (6,292 | ) | ||||
| Accumulated other comprehensive income (loss) |
(31,123 | ) | (65,204 | ) | ||||
| Graham Packaging Company Inc. stockholders’ equity (deficit) |
(772,463 | ) | (818,382 | ) | ||||
| Noncontrolling interests |
9,349 | — | ||||||
| Equity (deficit) |
(763,114 | ) | (818,382 | ) | ||||
| Total liabilities and equity (deficit) |
$ | 2,126,292 | $ | 2,149,813 | ||||
See accompanying notes to consolidated financial statements.
62
Table of Contents
CONSOLIDATED STATEMENTS OF OPERATIONS
(In thousands except share and per share data)
| Year Ended December 31, | ||||||||||||
| 2009 | 2008 | 2007 | ||||||||||
| Net sales |
$ | 2,271,034 | $ | 2,558,954 | $ | 2,470,885 | ||||||
| Cost of goods sold |
1,866,585 | 2,183,286 | 2,129,359 | |||||||||
| Gross profit |
404,449 | 375,668 | 341,526 | |||||||||
| Selling, general and administrative expenses |
122,490 | 127,568 | 136,254 | |||||||||
| Asset impairment charges |
41,826 | 96,064 | 157,692 | |||||||||
| Net loss on disposal of property, plant and equipment |
6,452 | 6,834 | 19,459 | |||||||||
| Operating income |
233,681 | 145,202 | 28,121 | |||||||||
| Interest expense |
176,861 | 180,042 | 205,832 | |||||||||
| Interest income |
(1,103 | ) | (804 | ) | (859 | ) | ||||||
| Net loss on debt extinguishment |
8,726 | — | 4,529 | |||||||||
| Other (income) expense, net |
(1,551 | ) | 404 | 2,004 | ||||||||
| Income (loss) before income taxes |
50,748 | (34,440 | ) | (183,385 | ) | |||||||
| Income tax provision |
27,014 | 12,977 | 20,316 | |||||||||
| Income (loss) from continuing operations |
23,734 | (47,417 | ) | (203,701 | ) | |||||||
| Loss from discontinued operations |
(9,481 | ) | (10,506 | ) | (3,655 | ) | ||||||
| Net income (loss) |
14,253 | (57,923 | ) | (207,356 | ) | |||||||
| Net income attributable to noncontrolling interests |
3,174 | — | — | |||||||||
| Net income (loss) attributable to Graham Packaging Company Inc. stockholders |
$ | 11,079 | $ | (57,923 | ) | $ | (207,356 | ) | ||||
| Earnings per share: |
||||||||||||
| Income (loss) from continuing operations per share: |
||||||||||||
| Basic |
$ | 0.45 | $ | (1.10 | ) | $ | (4.74 | ) | ||||
| Diluted |
$ | 0.44 | $ | (1.10 | ) | $ | (4.74 | ) | ||||
| Loss from discontinued operations per share: |
||||||||||||
| Basic |
$ | (0.19 | ) | $ | (0.25 | ) | $ | (0.09 | ) | |||
| Diluted |
$ | (0.19 | ) | $ | (0.25 | ) | $ | (0.09 | ) | |||
| Net income (loss) attributable to Graham Packaging Company Inc. stockholders per share: |
||||||||||||
| Basic |
$ | 0.26 | $ | (1.35 | ) | $ | (4.83 | ) | ||||
| Diluted |
$ | 0.25 | $ | (1.35 | ) | $ | (4.83 | ) | ||||
| Weighted average shares outstanding: |
||||||||||||
| Basic |
42,981,204 | 42,975,419 | 42,975,419 | |||||||||
| Diluted |
42,985,179 | 42,975,419 | 42,975,419 | |||||||||
See accompanying notes to consolidated financial statements.
63
Table of Contents
CONSOLIDATED STATEMENTS OF COMPREHENSIVE INCOME (LOSS)
(In thousands)
| Year Ended December 31, | |||||||||||
| 2009 | 2008 | 2007 | |||||||||
| Net income (loss) |
$ | 14,253 | $ | (57,923 | ) | $ | (207,356 | ) | |||
| Other comprehensive income (loss): |
|||||||||||
| Changes in fair value of derivatives designated and accounted for as cash flow hedges (net of tax of $0 for all years presented) |
490 | (22,361 | ) | (11,572 | ) | ||||||
| Amortization of amounts in accumulated other comprehensive income (loss) as of the date the Company discontinued hedge accounting for its interest rate collar and swap agreements (net of tax of $0 for all years presented) |
9,621 | — | — | ||||||||
| Amortization of prior service costs and unrealized actuarial losses included in net periodic benefit costs for pension and post-retirement plans (net of a tax benefit of $118 for 2009, a tax benefit of $342 for 2008 and a tax provision of $363 for 2007) |
10,432 | (29,028 | ) | (3,670 | ) | ||||||
| Foreign currency translation adjustments (net of a tax benefit of $22 for 2009, a tax benefit of $985 for 2008 and a tax provision of $1,212 for 2007) |
19,579 | (65,941 | ) | 36,334 | |||||||
| Total other comprehensive income (loss) |
40,122 | (117,330 | ) | 21,092 | |||||||
| Comprehensive income (loss) |
54,375 | (175,253 | ) | (186,264 | ) | ||||||
| Comprehensive income attributable to noncontrolling interests |
9,215 | — | — | ||||||||
| Comprehensive income (loss) attributable to Graham Packaging Company Inc. stockholders |
$ | 45,160 | $ | (175,253 | ) | $ | (186,264 | ) | |||
See accompanying notes to consolidated financial statements.
64
Table of Contents
CONSOLIDATED STATEMENTS OF EQUITY (DEFICIT)
(In thousands except share amounts)
|
Common Stock |
Additional Paid-In Capital |
Retained Earnings (Deficit) |
Notes and Interest Receivable for Ownership Interests |
Accumulated Other Comprehensive Income (Loss) |
Graham Packaging Company Inc. Stockholders’ Equity (Deficit) |
Non- Controlling Interests |
Equity (Deficit) |
|||||||||||||||||||||||||
| Shares | Amount | |||||||||||||||||||||||||||||||
| Consolidated balance at January 1, 2007 |
42,975,419 | 430 | 293,620 | (773,890 | ) | (6,057 | ) | 31,034 | (454,863 | ) | — | (454,863 | ) | |||||||||||||||||||
| Net loss for the year |
— | — | — | (207,356 | ) | — | — | (207,356 | ) | — | (207,356 | ) | ||||||||||||||||||||
| Other comprehensive income |
— | — | — | — | — | 21,092 | 21,092 | — | 21,092 | |||||||||||||||||||||||
| Stock compensation expense |
— | — | 608 | — | — | — | 608 | — | 608 | |||||||||||||||||||||||
| Interest on notes receivable for ownership interests |
— | — | — | — | (114 | ) | — | (114 | ) | — | (114 | ) | ||||||||||||||||||||
| Amounts recognized upon implementation of ASC 740-10-25 (as defined in |
— | — | — | (4,797 | ) | — | — | (4,797 | ) | — | (4,797 | ) | ||||||||||||||||||||
| Equity transaction of consolidated subsidiary |
— | — | (378 | ) | — | — | — | (378 | ) | — | (378 | ) | ||||||||||||||||||||
| Consolidated balance at December 31, 2007 |
42,975,419 | 430 | 293,850 | (986,043 | ) | (6,171 | ) | 52,126 | (645,808 | ) | — | (645,808 | ) | |||||||||||||||||||
| Net loss for the year |
— | — | — | (57,923 | ) | — | — | (57,923 | ) | — | (57,923 | ) | ||||||||||||||||||||
| Other comprehensive loss |
— | — | — | — | — | (117,330 | ) | (117,330 | ) | — | (117,330 | ) | ||||||||||||||||||||
| Stock compensation expense |
— | — | 2,560 | — | — | — | 2,560 | — | 2,560 | |||||||||||||||||||||||
| Interest on notes receivable for ownership interests |
— | — | — | — | (121 | ) | — | (121 | ) | — | (121 | ) | ||||||||||||||||||||
| Equity transaction of consolidated subsidiary |
— | — | 240 | — | — | — | 240 | — | 240 | |||||||||||||||||||||||
| Consolidated balance at December 31, 2008 |
42,975,419 | $ | 430 | $ | 296,650 | $ | (1,043,966 | ) | $ | (6,292 | ) | $ | (65,204 | ) | $ | (818,382 | ) | $ | — | $ | (818,382 | ) | ||||||||||
| Net income for the year |
— | — | — | 11,079 | — | — | 11,079 | 3,174 | 14,253 | |||||||||||||||||||||||
| Other comprehensive income |
— | — | — | — | — | 34,081 | 34,081 | 6,041 | 40,122 | |||||||||||||||||||||||
| Stock compensation expense |
— | — | 761 | — | — | — | 761 | 134 | 895 | |||||||||||||||||||||||
| Interest on notes receivable |
— | — | — | — | (273 | ) | — | (273 | ) | — | (273 | ) | ||||||||||||||||||||
| Repayment of notes receivable |
— | — | — | — | 387 | — | 387 | — | 387 | |||||||||||||||||||||||
| Purchase of ownership interests |
— | — | — | — | (175 | ) | — | (175 | ) | — | (175 | ) | ||||||||||||||||||||
| Net proceeds from net issuance of ownership interests |
23,367 | — | 59 | — | — | — | 59 | — | 59 | |||||||||||||||||||||||
| Consolidated balance at December 31, 2009 |
42,998,786 | $ | 430 | $ | 297,470 | $ | (1,032,887 | ) | $ | (6,353 | ) | $ | (31,123 | ) | $ | (772,463 | ) | $ | 9,349 | $ | (763,114 | ) | ||||||||||
See accompanying notes to consolidated financial statements.
65
Table of Contents
CONSOLIDATED STATEMENTS OF CASH FLOWS
(In thousands)
| Year Ended December 31, | ||||||||||||
| 2009 | 2008 | 2007 | ||||||||||
| Operating activities: |
||||||||||||
| Net income (loss) |
$ | 14,253 | $ | (57,923 | ) | $ | (207,356 | ) | ||||
| Adjustments to reconcile net income (loss) to net cash provided by operating activities: |
||||||||||||
| Depreciation and amortization |
159,417 | 177,784 | 203,671 | |||||||||
| Amortization of debt issuance fees |
7,961 | 10,343 | 10,387 | |||||||||
| Accretion of senior unsecured notes |
47 | — | — | |||||||||
| Net loss on debt extinguishment |
8,726 | — | 4,529 | |||||||||
| Net loss on disposal of property, plant and equipment |
9,991 | 6,834 | 19,461 | |||||||||
| Pension expense |
5,118 | 2,625 | 3,014 | |||||||||
| Asset impairment charges |
47,721 | 103,922 | 157,853 | |||||||||
| Unrealized loss on termination of cash flow hedge accounting |
3,798 | — | — | |||||||||
| Stock compensation expense |
895 | 2,560 | 608 | |||||||||
| Equity income from unconsolidated subsidiaries |
(4 | ) | — | — | ||||||||
| Foreign currency transaction loss (gain) |
254 | (1,621 | ) | 569 | ||||||||
| Interest receivable |
(273 | ) | (121 | ) | (114 | ) | ||||||
| Changes in operating assets and liabilities, net of acquisition of a business: |
||||||||||||
| Accounts receivable |
42,203 | 1,651 | 626 | |||||||||
| Inventories |
28,600 | 30,674 | (22,793 | ) | ||||||||
| Prepaid expenses and other current assets |
1,039 | (7,796 | ) | 23,324 | ||||||||
| Other non-current assets |
(1,349 | ) | (8,699 | ) | (5,179 | ) | ||||||
| Accounts payable and accrued expenses |
2,941 | (39,985 | ) | (13,458 | ) | |||||||
| Pension contributions |
(16,328 | ) | (7,991 | ) | (7,891 | ) | ||||||
| Other non-current liabilities |
10,459 | (1,056 | ) | 6,979 | ||||||||
| Net cash provided by operating activities |
325,469 | 211,201 | 174,230 | |||||||||
| Investing activities: |
||||||||||||
| Cash paid for property, plant and equipment |
(146,011 | ) | (148,576 | ) | (153,385 | ) | ||||||
| Proceeds from sale of property, plant and equipment |
984 | 4,156 | 4,278 | |||||||||
| Acquisition of/investment in a business, net of cash acquired |
(1,385 | ) | — | — | ||||||||
| Cash paid for sale of business |
(4,118 | ) | — | — | ||||||||
| Net cash used in investing activities |
(150,530 | ) | (144,420 | ) | (149,107 | ) | ||||||
| Financing activities: |
||||||||||||
| Proceeds from issuance of long-term debt |
311,889 | 328,182 | 667,461 | |||||||||
| Payment of long-term debt |
(355,847 | ) | (362,024 | ) | (683,040 | ) | ||||||
| Proceeds from issuance of equity in consolidated subsidiary |
— | 240 | — | |||||||||
| Purchase of equity in consolidated subsidiary |
— | — | (378 | ) | ||||||||
| Purchase of ownership interests |
(175 | ) | — | (2,762 | ) | |||||||
| Repayment of notes and interest |
387 | — | — | |||||||||
| Net proceeds from net issuance of ownership interests |
59 | — | — | |||||||||
| Debt issuance fees |
(27,193 | ) | — | (4,500 | ) | |||||||
| Fees paid for initial public offering |
(3,023 | ) | — | — | ||||||||
| Net cash used in financing activities |
(73,903 | ) | (33,602 | ) | (23,219 | ) | ||||||
| Effect of exchange rate changes on cash and cash equivalents |
2,893 | (7,614 | ) | 3,083 | ||||||||
| Increase in cash and cash equivalents |
103,929 | 25,565 | 4,987 | |||||||||
| Cash and cash equivalents at beginning of year |
43,879 | 18,314 | 13,327 | |||||||||
| Cash and cash equivalents at end of year |
$ | 147,808 | $ | 43,879 | $ | 18,314 | ||||||
| Supplemental disclosures |
||||||||||||
| Cash paid for interest, net of amounts capitalized |
$ | 177,664 | $ | 169,035 | $ | 198,447 | ||||||
| Cash paid for income taxes (net of refunds) |
$ | 19,210 | $ | 9,295 | $ | 18,312 | ||||||
| Non-cash investing activities: |
||||||||||||
| Capital leases |
$ | 1,551 | $ | 403 | $ | 2,324 | ||||||
| Accruals for purchases of property, plant and equipment |
$ | 10,469 | $ | 13,806 | $ | 19,595 | ||||||
| Accruals for debt issuance fees |
$ | 335 | $ | — | $ | — | ||||||
See accompanying notes to consolidated financial statements.
66
Table of Contents
NOTES TO CONSOLIDATED FINANCIAL STATEMENTS
DECEMBER 31, 2009
1. Significant Accounting Policies
Description of Business
Graham Packaging Company Inc. (“GPC”), formerly BMP/Graham Holdings Corporation, a Delaware corporation formed by Blackstone Capital Partners III Merchant Banking Fund L.P., is a holding company that conducts its operations through its majority-owned subsidiary Graham Packaging Holdings Company (“Holdings”), a Pennsylvania limited partnership; Holdings’ wholly-owned subsidiary Graham Packaging Company, L.P. (the “Operating Company”), a Delaware limited partnership; and all of the Operating Company’s subsidiaries. These entities and assets, as well as other wholly-owned subsidiaries of GPC and Holdings, are referred to collectively as Graham Packaging Company Inc. (the “Company”). The Company focuses on the manufacture and sale of value-added plastic packaging products principally to large, multinational companies in the food and beverage, household, personal care/specialty and automotive lubricants product categories. The Company has manufacturing facilities in Argentina, Belgium, Brazil, Canada, Finland, France, Mexico, the Netherlands, Poland, Spain, Turkey, the United Kingdom, the United States and Venezuela.
Principles of Consolidation
The consolidated financial statements include the operations of GPC; BCP/Graham Holdings L.L.C. (“BCP” and together with GPC, the “Equity Investors”), a Delaware limited liability company and a wholly-owned subsidiary of GPC; Holdings, formerly known as Graham Packaging Company; the Operating Company, formerly known as Graham Packaging Holdings I, L.P; and all subsidiaries thereof.
GPC owned an 80.9% limited partnership interest and BCP owned a 4% general partnership interest in Holdings as of December 31, 2009. The Graham Family (defined as Graham Packaging Corporation and other entities controlled by Donald C. Graham and his family) owned a 0.7% general partnership interest through Graham Packaging Corporation (“Graham GP Corp”) and a 14.3% limited partnership interest in Holdings as of December 31, 2009. On December 23, 2008, Roger M. Prevot, former President and Chief Operating Officer of the Operating Company, exercised an option to purchase 35,167 partnership units of Holdings and therefore owned a 0.1% limited partnership interest in Holdings as of December 31, 2009. Additionally, Holdings owns a 99% limited partnership interest in the Operating Company, and GPC Opco GP L.L.C., a wholly-owned subsidiary of Holdings, owns a 1% general partnership interest in the Operating Company.
In addition, the consolidated financial statements of the Company include GPC Capital Corp. I (“CapCo I”), a wholly-owned subsidiary of the Operating Company, and GPC Capital Corp. II (“CapCo II”), a wholly-owned subsidiary of Holdings. The purpose of CapCo I is solely to act as co-obligor with the Operating Company under the Senior Notes and Senior Subordinated Notes (as defined herein) and as co-borrower with the Operating Company under the Credit Agreement (as defined herein). CapCo II currently has no obligations under any of the Company’s outstanding indebtedness. CapCo I and CapCo II have only nominal assets and do not conduct any independent operations. All significant intercompany accounts and transactions have been eliminated in the consolidated financial statements.
GPC (93.7% owned by Blackstone Capital Partners III Merchant Banking Fund L.P., Blackstone Offshore Capital Partners III L.P. and Blackstone Family Investment Partnership III L.P. (collectively, the “Blackstone”), 6.0% owned by other investors and 0.3% owned by management as of December 31, 2009) has no operations. GPC’s only assets are its direct and indirect investments in Holdings and its ownership of BCP. Holdings has no assets, liabilities or operations other than its direct and indirect investments in the Operating Company and its ownership of CapCo II and GPC Opco GP L.L.C. Holdings has fully and unconditionally guaranteed the Senior Notes and Senior Subordinated Notes of the Operating Company and CapCo I.
67
Table of Contents
GRAHAM PACKAGING COMPANY INC.
NOTES TO CONSOLIDATED FINANCIAL STATEMENTS—(Continued)
DECEMBER 31, 2009
Noncontrolling Interests
On January 1, 2009, the Company adopted new guidance issued under Financial Accounting Standards Board (“FASB”) Accounting Standards Codification (“ASC”) 810-10, “Consolidations.” This guidance establishes new standards that govern the accounting for, and reporting of, noncontrolling interests in partially-owned consolidated subsidiaries and the loss of control of subsidiaries. Specifically, the guidance requires that: (1) a noncontrolling interest, previously referred to as minority interest, is to be reported as part of equity in the consolidated financial statements; (2) losses are to be allocated to a noncontrolling interest even when such allocation might result in a deficit balance, thereby reducing the losses attributed to the controlling interest; (3) changes in ownership interest are to be treated as equity transactions if control is maintained; (4) changes in ownership interest resulting in a gain or loss are to be recognized in earnings if control is gained or lost; and (5) in a business combination the noncontrolling interest’s share of net assets acquired is to be recorded at fair value, plus its share of goodwill. The provisions under this guidance are prospective upon adoption, except for the presentation and disclosure requirements. The presentation and disclosure requirements must be applied retrospectively for all periods presented. Accordingly, the Company’s Consolidated Balance Sheets as of December 31, 2009 and 2008, and the Consolidated Statements of Operations and Consolidated Statements of Comprehensive Income (Loss) for the years ended December 31, 2009, 2008 and 2007, reflect this guidance.
The Company attributes earnings and losses of Holdings to the noncontrolling interests of Holdings based on the noncontrolling interests’ relative unit ownership percentages. Net income attributable to the noncontrolling interests was $3.2 million for the year ended December 31, 2009. Net losses attributable to the noncontrolling interests of $8.6 million and $30.9 million for the years ended December 31, 2008 and 2007, respectively, have been allocated to the GPC stockholders. As of December 31, 2009, accumulated comprehensive income of $9.3 million attributable to the noncontrolling interests is included in a separate component of equity (deficit). As of December 31, 2009, accumulated losses, incurred prior to the adoption of this guidance, of $69.9 million attributable to the noncontrolling interests have been allocated to the GPC stockholders and are included in the retained deficit.
Revenue Recognition
The Company recognizes revenue on product sales in the period when the sales process is complete. This generally occurs when products are shipped to the customer in accordance with terms of an agreement of sale, under which title and risk of loss have been transferred, collectability is reasonably assured and pricing is fixed or determinable. For a small percentage of sales where title and risk of loss pass at point of delivery, the Company recognizes revenue upon delivery to the customer, assuming all other criteria for revenue recognition are met. Sales are recorded net of discounts, allowances and returns. Sales allowances are recorded as a reduction to sales in accordance with the guidance under ASC 605-50, “Customer Payments and Incentives.” The Company maintains a sales return allowance to reduce sales for estimated future product returns.
Cost of Goods Sold
Cost of goods sold includes the cost of inventory (materials and conversion costs) sold to customers, shipping and handling costs and warehousing costs. It also includes inbound freight charges, purchasing and receiving costs, quality assurance costs, safety and environmental-related costs, packaging costs, internal transfer costs and other costs of the Company’s distribution network.
68
Table of Contents
GRAHAM PACKAGING COMPANY INC.
NOTES TO CONSOLIDATED FINANCIAL STATEMENTS—(Continued)
DECEMBER 31, 2009
Selling, General and Administrative Expenses
Selling, general and administrative expenses include the costs for the Company’s sales force and its related expenses, the costs of support functions, including information technology, finance, human resources, legal, global vendor contract services and executive management, and their related expenses and the costs of the Company’s research and development activities.
Research and Development Costs
The Company expenses costs to research, design and develop new packaging products and technologies as incurred. Such costs, net of any reimbursement from customers, were $9.9 million, $9.6 million and $11.6 million for the years ended December 31, 2009, 2008 and 2007, respectively.
Equity Investments
Investments in which the Company owns 20% to 50% of the common stock of, or otherwise exercises significant influence over, an investee are accounted for under the equity method. Under the equity method of accounting, investments are stated at initial cost and are adjusted for subsequent additional investments, the proportionate share of earnings and losses and distributions. The Company reviews the value of equity method investments and records impairment charges in the consolidated statement of operations for any decline in value that is determined to be other-than-temporary.
On August 12, 2009, the Company purchased a 22% interest in PPI Blow Pack Private Limited, an Indian limited liability company, for $1.4 million which is being accounted for under the equity method of accounting and is reflected in other non-current assets.
Cash and Cash Equivalents
The Company considers cash and investments with an initial maturity of three months or less when purchased to be cash and cash equivalents. Outstanding checks of $7.3 million and $8.4 million as of December 31, 2009 and 2008, respectively, are included in accounts payable on the Consolidated Balance Sheets.
Accounts Receivable
The Company maintains allowances for estimated losses resulting from the inability of specific customers to meet their financial obligations to the Company. A specific reserve for doubtful receivables is recorded against the amount due from these customers. For all other customers, the Company recognizes reserves for doubtful receivables based on the length of time specific receivables are past due based on past experience.
Inventories
Inventories include material, labor and overhead and are stated at the lower of cost or market with cost determined by the first-in, first-out (“FIFO”) method. Provisions for potentially obsolete or slow-moving inventory are made based on management’s analysis of inventory levels, historical usage and market conditions. See Note 5.
69
Table of Contents
GRAHAM PACKAGING COMPANY INC.
NOTES TO CONSOLIDATED FINANCIAL STATEMENTS—(Continued)
DECEMBER 31, 2009
Property, Plant and Equipment
Property, plant and equipment are stated at cost. The Company capitalizes significant improvements, and charges repairs and maintenance costs that do not extend the lives of the assets to expense as incurred. The Company accounts for its molds in accordance with the guidance under ASC 340-10, “Pre-Production Costs Related to Long-Term Supply Arrangements.” All capitalizable molds, whether owned by the Company or its customers, are included in property, plant and equipment in the Consolidated Balance Sheets. Interest costs are capitalized during the period of construction of capital assets as a component of the cost of acquiring these assets. Depreciation and amortization are computed by the straight-line method over the estimated useful lives of the various assets ranging from 2 to 31.5 years. Depreciation and amortization are included in cost of goods sold and selling, general and administrative expenses on the Consolidated Statements of Operations. The Company removes the cost and accumulated depreciation of assets sold or otherwise disposed of from the accounts and recognizes any resulting gain or loss upon the disposition of the assets.
Conditional Asset Retirement Obligations
The Company accounts for obligations associated with the retirement of its tangible long-lived assets in accordance with ASC 410-20, “Asset Retirement Obligations.” The Company recognizes a liability for a conditional asset retirement obligation when incurred if the liability can be reasonably estimated. A conditional asset retirement obligation is a legal obligation to perform an asset retirement activity in which the timing and/or method of settlement are conditional on a future event that may or may not be within the control of the Company. The Company records corresponding amounts for the asset retirement obligations as increases in the carrying amounts of the related long-lived assets, which are then depreciated over the useful lives of such long-lived assets. The net present value of these obligations was $11.1 million and $10.3 million as of December 31, 2009 and 2008, respectively.
Goodwill and Intangible Assets
The Company accounts for purchased goodwill in accordance with ASC 350-10, “Goodwill and Other Intangible Assets.” Under this guidance, goodwill is not amortized, but rather is tested for impairment at least annually.
Intangible assets, other than goodwill, with definite lives are amortized over their estimated useful lives. Intangible assets consist of patented technology, customer relationships, licensing agreements and non-compete agreements. The Company amortizes these intangibles using the straight-line method over the estimated useful lives of the assets ranging from 6 to 19 years. The Company periodically evaluates the reasonableness of the estimated useful lives of these intangible assets. See Note 7.
In order to test goodwill for impairment under ASC 350-10, a determination of the fair value of the Company’s reporting units is required and is based upon, among other things, estimates of future operating performance. Changes in market conditions, among other factors, may have an impact on these estimates. The Company performs its required annual impairment tests on December 31 of each fiscal year. See Notes 8, 9 and 23.
Other Non-Current Assets
Other non-current assets primarily include debt issuance fees and deferred income tax assets. Debt issuance fees totaled $22.0 million and $33.9 million as of December 31, 2009 and 2008, respectively. Debt issuance fees
70
Table of Contents
GRAHAM PACKAGING COMPANY INC.
NOTES TO CONSOLIDATED FINANCIAL STATEMENTS—(Continued)
DECEMBER 31, 2009
are net of accumulated amortization of $24.6 million and $41.5 million as of December 31, 2009 and 2008, respectively. Amortization is computed by the effective interest method over the term of the related debt.
Impairment of Long-Lived Assets and Intangible Assets
Long-lived assets and amortizable intangible assets are reviewed for impairment whenever events or changes in circumstances indicate that the carrying amount of an asset may not be recoverable in accordance with ASC 360-10, “Impairment or Disposal of Long-Lived Assets.” The Company generally uses either a single scenario estimate or a probability-weighted estimate of the future undiscounted cash flows of the related asset or asset grouping over the remaining life in measuring whether the assets are recoverable. Any impairment loss, if indicated, is measured on the amount by which the carrying amount of the asset exceeds the estimated fair value of the asset. When fair values are not available, the Company generally estimates fair value using either single scenario expected future cash flows discounted at a risk-adjusted rate or probability-weighted expected future cash flows discounted at a risk-free rate. See Note 9.
Derivatives
The Company accounts for derivatives under ASC 815-10, “Derivative Instruments and Hedging Activities.” This guidance establishes accounting and reporting for derivative instruments, including certain derivative instruments embedded in other contracts, and for hedging activities. ASC 815-10 defines requirements for designation and documentation of hedging relationships as well as ongoing effectiveness assessments in order to use hedge accounting. All derivatives, whether designated in hedging relationships or not, are required to be recorded on the balance sheet at fair value. The fair value of the derivatives is determined from sources independent of the Company, including the financial institutions which are party to the derivative instruments. The fair value of derivatives also considers the credit default risk of the paying party. If the derivative is designated as a fair value hedge, the changes in the fair value of the derivative and the hedged item will be recognized in earnings. If the derivative is designated as a cash flow hedge, the effective portion of the change in the fair value of the derivative will be recorded in other comprehensive income (loss) and will be recognized in the income statement when the hedged item affects earnings.
In the past, the Company had entered into interest rate swap and collar agreements, foreign currency exchange contracts and natural gas swap agreements. These derivative contracts had been accounted for as cash flow hedges.
Benefit Plans
The Company has several defined benefit plans, under which participants earn a retirement benefit based upon a formula set forth in the plan. Accounting for defined benefit pension plans, and any curtailments thereof, requires various assumptions, including, but not limited to, discount rates, expected rates of return on plan assets and future compensation growth rates. The Company evaluates these assumptions at least once each year, or as facts and circumstances dictate, and makes changes as conditions warrant. Changes to these assumptions will increase or decrease the Company’s reported income, which will result in changes to the recorded benefit plan assets and liabilities.
Deferred Revenue
The Company often receives advance payments related to the design and development of customer molds utilized by the Company under long-term supply arrangements. The Company records these advance payments as deferred revenue and recognizes the related revenue on a straight-line basis over the related term of the long-term
71
Table of Contents
GRAHAM PACKAGING COMPANY INC.
NOTES TO CONSOLIDATED FINANCIAL STATEMENTS—(Continued)
DECEMBER 31, 2009
supply arrangement. Current and non-current deferred revenue were $30.2 million and $28.4 million, respectively, for the year ended December 31, 2009, and $34.6 million and $25.3 million, respectively, for the year ended December 31, 2008.
Foreign Currency Translation
The Company uses the local currency as the functional currency for all foreign operations, except as noted below. All assets and liabilities of such foreign operations are translated into U.S. dollars at year-end exchange rates. Income statement items are translated at average exchange rates prevailing during the year. The resulting translation adjustments are included in accumulated other comprehensive income as a component of equity (deficit). Exchange gains and losses arising from transactions denominated in foreign currencies other than the functional currency of the entity entering into the transactions are included in current operations. For operations in highly inflationary economies, the Company remeasures such entities’ financial statements as if the functional currency was the U.S. dollar.
Comprehensive Income (Loss)
The Company follows ASC 220-10, “Comprehensive Income,” which requires the classification of items of other comprehensive income (loss) by their nature, and the disclosure of the accumulated balance of other comprehensive income (loss) separately within the equity section of the consolidated balance sheet. Comprehensive income (loss) is comprised of net loss and other comprehensive income (loss), which includes certain changes in equity that are excluded from net loss. Changes in fair value of derivatives designated and accounted for as cash flow hedges, amortization of amounts in accumulated other comprehensive income (loss) as of the date the Company discontinued hedge accounting for its interest rate collar and swap agreements, amortization of prior service costs and unrealized actuarial losses included in net periodic benefit costs for pension and post-retirement plans and foreign currency translation adjustments are included in other comprehensive income (loss) and added to net loss to determine total comprehensive income (loss), which is displayed in the Consolidated Statements of Comprehensive Income (Loss).
Income Taxes
The Company accounts for income taxes in accordance with the guidance under ASC 740-10, “Income Taxes.” Deferred income tax assets and liabilities are recognized for the future tax consequences attributable to temporary differences between the financial statement carrying amounts of existing assets and liabilities and their respective tax bases and are measured using enacted tax rates expected to apply to taxable income in the years in which the temporary differences are expected to reverse. Valuation allowances are recorded to reduce deferred tax assets when it is more likely than not that a tax benefit will not be realized.
Option Plans
The Company, from time to time, grants options to purchase partnership units of Holdings. The Company adopted the guidance under ASC 718-20, “Awards Classified as Equity,” on January 1, 2006, using the prospective method. In accordance with the guidance under this topic, the Company applied this guidance prospectively to awards issued, modified, repurchased or cancelled after January 1, 2006. Under the guidance of this topic, actual tax benefits, if any, recognized in excess of tax benefits previously established upon grant are reported as a financing cash inflow. Prior to adoption, such excess tax benefits, if any, were reported as an operating cash inflow.
72
Table of Contents
GRAHAM PACKAGING COMPANY INC.
NOTES TO CONSOLIDATED FINANCIAL STATEMENTS—(Continued)
DECEMBER 31, 2009
The Company continued to account for equity-based compensation to employees for awards outstanding as of January 1, 2006, using the intrinsic value method allowed by the guidance in ASC 718-10-30, “Stock Compensation Initial Measurement.” The exercise prices of all unit options were equal to or greater than the fair value of the units on the dates of the grants and, accordingly, no compensation cost has been recognized for these options. ASC 718-20 established accounting and disclosure requirements using a fair value based method of accounting for equity-based employee compensation plans. Under ASC 718-20, compensation cost is measured at the grant date based on the value of the award and is recognized over the service (or vesting) period.
Postemployment Benefits
The Company maintains deferred compensation plans for the Operating Company’s former Chief Executive Officers, which provide them with postemployment benefits. Accrued postemployment benefits of $7.0 million and $4.9 million as of December 31, 2009 and 2008, respectively, were included in other non-current liabilities.
Use of Estimates
The preparation of financial statements in conformity with accounting principles generally accepted in the United States requires management to make estimates and assumptions that affect the amounts reported in the financial statements and accompanying notes. Actual results could differ from those estimates.
Subsequent Events
The Company has evaluated subsequent events that have occurred after the balance sheet date but before the financial statements were available to be issued, which the Company considers to be the date of filing with the Securities and Exchange Commission.
Recently Issued Accounting Pronouncements
In September 2006, the FASB issued guidance under ASC 820-10, “Fair Value Measurements and Disclosures” (formerly Statement of Financial Accounting Standards (“SFAS”) 157, “Fair Value Measurements”). This guidance establishes a single authoritative definition of fair value, sets out a framework to classify the source of information used in fair value measurements, identifies additional factors that must be disclosed about assets and liabilities measured at fair value based on their placement in the new framework and modifies the long-standing accounting presumption that the transaction price of an asset or liability equals its initial fair value. In February 2008, the FASB delayed the effective date for certain non-financial assets and liabilities until January 1, 2009. The Company adopted this guidance effective January 1, 2008, for financial assets and liabilities (see Note 12 for further discussion). The Company adopted this guidance for certain non-financial assets and liabilities effective January 1, 2009, and the adoption had no impact on its financial statements as it relates to these assets and liabilities.
In December 2007, the FASB issued guidance under ASC 810-10, “Consolidations” (formerly SFAS 160, “Noncontrolling Interests in Consolidated Financial Statements—Amendment of ARB No. 51”). This guidance establishes accounting and reporting standards for ownership interests in subsidiaries held by parties other than the parent, changes in a parent’s ownership of noncontrolling interests, calculation and disclosure of the consolidated net income attributable to the parent and the noncontrolling interests, changes in a parent’s
73
Table of Contents
GRAHAM PACKAGING COMPANY INC.
NOTES TO CONSOLIDATED FINANCIAL STATEMENTS—(Continued)
DECEMBER 31, 2009
ownership interest while the parent retains its controlling financial interest and fair value measurement of any retained noncontrolling equity investment. The adoption resulted in the Company recognizing allocated income and loss to noncontrolling interests in 2009.
In March 2008, the FASB issued guidance under ASC 815-30, “Derivatives and Hedging” (formerly SFAS 161, “Disclosures about Derivative Instruments and Hedging Activities”). The guidance is intended to improve financial reporting about derivative instruments and hedging activities by requiring enhanced disclosures to enable investors to better understand their effects on an entity’s financial position, financial performance and cash flows. It requires disclosure of the fair values of derivative instruments and their gains and losses in a tabular format. It also requires more information about an entity’s liquidity by requiring disclosure of derivative features that are credit risk-related, and requires cross-referencing within footnotes to enable financial statement users to locate important information about derivative instruments. The Company adopted this guidance effective January 1, 2009.
In December 2008, the FASB issued guidance under ASC 715, “Defined Benefit Plans” (formerly Staff Position FAS 132(R)-1, “Employers’ Disclosures about Postretirement Benefit Plan Assets”), which requires enhanced disclosures of the plan assets of an employer’s defined benefit pension or other postretirement benefit plans. The disclosures required under this guidance include information regarding the investment allocation decisions made for plan assets, the fair value of each major category of plan assets disclosed separately for pension plans and other postretirement benefit plans and the inputs and valuation techniques used to measure the fair value of plan assets that would be similar to the disclosures about fair value measurements required by ASC 820-10. The Company adopted this guidance effective December 31, 2009.
In April 2009, the FASB issued guidance under ASC 825-10-65-1, “Financial Instruments—Overall—Transition and Open Effective Date Information” (formerly Staff Position FAS 107-1 and Accounting Principles Board Opinion 28-1, “Interim Disclosures about Fair Value of Financial Instruments”). This guidance requires disclosures about fair value of financial instruments for interim reporting periods that were previously only required in annual financial statements. The Company adopted this guidance effective June 30, 2009.
In May 2009, the FASB issued guidance under ASC 855, “Subsequent Events” (formerly SFAS 165, “Subsequent Events”). This guidance establishes general standards of accounting for and disclosure of events that occur after the balance sheet date but before financial statements are issued or are available to be issued. The Company adopted this guidance effective June 30, 2009, and the adoption had no impact on its financial statements.
In June 2009, the FASB issued guidance under ASC 860, “Transfers and Servicing” (formerly SFAS 166, “Accounting for Transfers of Financial Assets, an amendment of SFAS 140”). This guidance improves the relevance, representational faithfulness and comparability of the information that a reporting entity provides in its financial reports about a transfer of financial assets, the effects a transfer will have on its financial performance and cash flows and any transferor’s continuing involvement in transferred financial assets. This guidance is effective for interim and annual reporting periods that begin after November 15, 2009. The Company adopted this guidance effective January 1, 2010, and the adoption had no impact on its financial statements.
In June 2009, the FASB issued guidance under ASC 105-10, “Generally Accepted Accounting Principles” (formerly SFAS 168, “FASB Accounting Standards Codification and the Hierarchy of Generally Accepted Accounting Principles”). This guidance establishes the ASC as the single source of authoritative nongovernmental generally accepted accounting principles (“GAAP”), superseding existing pronouncements published by the FASB, American Institute of Certified Public Accountants, Emerging Issues Task Force and
74
Table of Contents
GRAHAM PACKAGING COMPANY INC.
NOTES TO CONSOLIDATED FINANCIAL STATEMENTS—(Continued)
DECEMBER 31, 2009
other accounting bodies. This guidance establishes only one level of authoritative GAAP. All other accounting literature will be considered non-authoritative. The ASC reorganizes the GAAP pronouncements into accounting topics and displays them using a consistent structure. The Company adopted this guidance effective July 1, 2009.
Management has determined that all other recently issued accounting pronouncements will not have a material impact on the Company’s financial statements, or do not apply to the Company’s operations.
Reclassification
A reclasification has been made to the 2007 Consolidated Statement of Operations from interest expense to net loss on debt extinguishment to conform to the 2009 presentation.
2. Discontinued Operations
For purposes of determining discontinued operations, the Company has determined that, in general, the plant or operating location is a component of an entity within the context of ASC 360-10-35-15, “Subsequent Measurement—Impairment or Disposal of Long-Lived Assets.” A component of an entity comprises operations and cash flows that can be clearly distinguished, operationally and for financial reporting purposes, from the rest of the Company. The Company routinely evaluates its manufacturing base and closes non-performing locations. The Company evaluates the results of closed operations both quantitatively and qualitatively to determine the appropriateness of reporting the results as discontinued operations. Locations sold, where the Company retains the customer relationships, are excluded from discontinued operations, as the Company retains the direct cash flows resulting from the migration of revenue to other facilities.
On November 12, 2009, the Company paid 2.3 million euros (approximately $3.5 million) to sell all of the shares of its wholly-owned subsidiary Graham Emballages Plastiques S.A.S., located in Meaux, France, to an independent third party. The Company’s exit from this location was due to the failure of this subsidiary to meet internal financial performance criteria. The Company determined that the results of operations for this location, which had previously been reported in the Europe segment, would be reported as discontinued operations, in accordance with the guidance under ASC 205-20, “Discontinued Operations.” The accompanying consolidated statements of operations reflect these discontinued operations. The following table summarizes the operating results for this location for the periods presented:
| Year Ended December 31, | ||||||||||||
| 2009 | 2008 | 2007 | ||||||||||
| (In thousands) | ||||||||||||
| Net sales |
$ | 16,706 | $ | 24,703 | $ | 22,586 | ||||||
| Cost of goods sold |
16,744 | 26,873 | 25,547 | |||||||||
| Selling, general and administrative expenses |
(26 | ) | 245 | 295 | ||||||||
| Asset impairment charges |
5,895 | 7,858 | 161 | |||||||||
| Net loss on disposal of property, plant and equipment |
3,538 | — | 2 | |||||||||
| Interest expense |
36 | 236 | 185 | |||||||||
| Other (income) expense |
— | (3 | ) | 1 | ||||||||
| Income tax provision |
— | — | 50 | |||||||||
| Loss from discontinued operations |
$ | (9,481 | ) | $ | (10,506 | ) | $ | (3,655 | ) | |||
75
Table of Contents
GRAHAM PACKAGING COMPANY INC.
NOTES TO CONSOLIDATED FINANCIAL STATEMENTS—(Continued)
DECEMBER 31, 2009
3. Accounts Receivable, Net
Accounts receivable, net are presented net of an allowance for doubtful accounts of $2.4 million and $6.5 million at December 31, 2009 and 2008, respectively. Management performs ongoing credit evaluations of its customers and generally does not require collateral.
4. Concentration of Credit Risk
For the years ended December 31, 2009, 2008 and 2007, 68.8%, 71.1% and 71.7% of the Company’s net sales, respectively, were generated by its top twenty customers. The Company’s sales to PepsiCo, Inc., the Company’s largest customer, were 10.8%, 13.3% and 14.0% of total sales for the years ended December 31, 2009, 2008 and 2007, respectively. All of these sales were made in North America.
The Company had $113.7 million and $141.8 million of accounts receivable from its top twenty customers as of December 31, 2009 and 2008, respectively. The Company had $17.5 million and $16.9 million of accounts receivable from PepsiCo, Inc. as of December 31, 2009 and 2008, respectively.
5. Inventories
Inventories, stated at the lower of cost or market, consisted of the following:
| December 31, | ||||||
| 2009 | 2008 | |||||
| (In thousands) | ||||||
| Finished goods |
$ | 130,989 | $ | 144,394 | ||
| Raw materials |
63,713 | 79,967 | ||||
| Total |
$ | 194,702 | $ | 224,361 | ||
6. Property, Plant and Equipment
A summary of gross property, plant and equipment at December 31 is presented in the following table:
| Expected Useful Lives (in years) |
2009 | 2008 | ||||||
| (In thousands) | ||||||||
| Land |
$ | 39,063 | $ | 39,111 | ||||
| Buildings and improvements |
7-31.5 | 236,446 | 234,801 | |||||
| Machinery and equipment (1) |
2-15 | 1,303,241 | 1,297,793 | |||||
| Molds and tooling |
3-5 | 282,243 | 273,312 | |||||
| Furniture and fixtures |
7 | 5,359 | 5,467 | |||||
| Computers |
3-7 | 40,930 | 38,491 | |||||
| Construction in progress |
66,870 | 68,263 | ||||||
| $ | 1,974,152 | $ | 1,957,238 | |||||
| (1) | Includes longer-lived machinery and equipment of approximately $1,230.5 million having estimated useful lives, when purchased new, ranging from 8 to 15 years, and shorter-lived machinery and equipment of approximately $72.7 million having estimated useful lives, when purchased new, ranging from 2 to 8 years, as of December 31, 2009. |
76
Table of Contents
GRAHAM PACKAGING COMPANY INC.
NOTES TO CONSOLIDATED FINANCIAL STATEMENTS—(Continued)
DECEMBER 31, 2009
Depreciation expense, including depreciation expense on assets recorded under capital leases, for the years ended December 31, 2009, 2008 and 2007 was $151.2 million, $168.2 million and $191.9 million, respectively.
Capital leases included in buildings and improvements were $2.2 million and $2.3 million at December 31, 2009 and 2008, respectively. Capital leases included in machinery and equipment were $49.1 million and $52.3 million at December 31, 2009 and 2008, respectively. Accumulated depreciation on property, plant and equipment accounted for as capital leases is included with accumulated depreciation on owned assets on the Consolidated Balance Sheets.
The Company capitalizes interest on borrowings during the active construction period of major capital projects. Capitalized interest is added to the cost of the underlying assets and is amortized over the useful lives of assets. Interest capitalized for the years ended December 31, 2009, 2008 and 2007, was $3.4 million, $3.9 million and $5.7 million, respectively.
The Company closed its plant located in Edison, New Jersey in the first half of 2008. The land and buildings at this location, having a carrying value of $6.6 million, are deemed to be held for sale, and as such have been reclassified from property, plant and equipment to prepaid expenses and other current assets on the Consolidated Balance Sheets as of December 31, 2009 and 2008.
7. Intangible Assets, Net
The gross carrying amount and accumulated amortization of the Company’s intangible assets subject to amortization as of December 31, 2009, were as follows:
| Gross Carrying Amount |
Accumulated Amortization |
Net | Weighted Average Amortization Period | |||||||||
| (In thousands) | ||||||||||||
| Patented technology |
$ | 24,545 | $ | (8,399 | ) | $ | 16,146 | 10 years | ||||
| Customer relationships |
33,863 | (6,997 | ) | 26,866 | 16 years | |||||||
| Total |
$ | 58,408 | $ | (15,396 | ) | $ | 43,012 | |||||
The gross carrying amount and accumulated amortization of the Company’s intangible assets subject to amortization as of December 31, 2008, were as follows:
| Gross Carrying Amount |
Accumulated Amortization |
Net | Weighted Average Amortization Period | |||||||||
| (In thousands) | ||||||||||||
| Patented technology |
$ | 23,018 | $ | (5,869 | ) | $ | 17,149 | 10 years | ||||
| Customer relationships |
33,340 | (4,507 | ) | 28,833 | 16 years | |||||||
| Licensing agreement |
601 | (550 | ) | 51 | 1 year | |||||||
| Non-compete agreement |
1,500 | (1,275 | ) | 225 | 5 years | |||||||
| Total |
$ | 58,459 | $ | (12,201 | ) | $ | 46,258 | |||||
77
Table of Contents
GRAHAM PACKAGING COMPANY INC.
NOTES TO CONSOLIDATED FINANCIAL STATEMENTS—(Continued)
DECEMBER 31, 2009
Amortization expense for the years ended December 31, 2009, 2008 and 2007 was $5.0 million, $5.7 million and $7.6 million, respectively. The estimated aggregate amortization expense for each of the next five years ending December 31 is as follows (in thousands):
| 2010 |
$ | 4,700 | |
| 2011 |
4,600 | ||
| 2012 |
4,600 | ||
| 2013 |
4,500 | ||
| 2014 |
4,100 |
8. Goodwill
The changes in the carrying amount of goodwill were as follows:
| North America Segment |
Europe Segment |
South America Segment |
Total | |||||||||||||
| (In thousands) | ||||||||||||||||
| Balance at January 1, 2008 |
$ | 427,580 | $ | 18,607 | $ | 1,817 | $ | 448,004 | ||||||||
| Foreign currency translation adjustments |
(8,796 | ) | (2,781 | ) | (373 | ) | (11,950 | ) | ||||||||
| Impairment |
— | — | (1,409 | ) | (1,409 | ) | ||||||||||
| Balance at December 31, 2008 |
418,784 | 15,826 | 35 | 434,645 | ||||||||||||
| Foreign currency translation adjustments |
1,981 | 460 | (28 | ) | 2,413 | |||||||||||
| Balance at December 31, 2009 |
$ | 420,765 | $ | 16,286 | $ | 7 | $ | 437,058 | ||||||||
9. Asset Impairment Charges
The components of asset impairment charges in the Consolidated Statements of Operations for the years ended December 31 are reflected in the table below and are described in the paragraphs following the table:
| Year ended December 31, | |||||||||
| 2009 | 2008 | 2007 | |||||||
| (In thousands) | |||||||||
| Property, plant and equipment |
$ | 41,826 | $ | 93,161 | $ | 135,499 | |||
| Intangible assets |
— | 1,494 | 21,093 | ||||||
| Goodwill |
— | 1,409 | 1,100 | ||||||
| $ | 41,826 | $ | 96,064 | $ | 157,692 | ||||
Property, Plant and Equipment
During 2009, the Company evaluated the recoverability of its long-lived tangible assets in light of several trends in some of the markets it serves. Among other factors, the Company considered the following in its evaluation:
| • | the economic conditions in general; |
| • | a continuing reduction in the automotive quart/liter container business as the Company’s customers convert to multi-quart/liter containers; |
78
Table of Contents
GRAHAM PACKAGING COMPANY INC.
NOTES TO CONSOLIDATED FINANCIAL STATEMENTS—(Continued)
DECEMBER 31, 2009
| • | the introduction by the Company, and the Company’s competitors, of newer production technology in the plastic container industry which is improving productivity, causing certain of the Company’s older machinery and equipment to become obsolete; and |
| • | the decline and/or loss of business in certain market segments. |
The impaired assets consisted of machinery and equipment, including molds and tooling and support assets, for the production lines. The Company determined the fair value of the production lines using either single scenario or probability-weighted discounted cash flows.
During 2008, the Company evaluated the recoverability of its long-lived tangible assets in light of several trends in some of the markets it serves. Among other factors, the Company considered the following in its evaluation:
| • | the deteriorating economic conditions in general; |
| • | the expected decrease in volume of a major food and beverage customer; |
| • | a continuing reduction in the automotive quart/liter container business as the Company’s customers convert to multi-quart/liter containers; |
| • | the introduction by the Company, and the Company’s competitors, of newer production technology in the food and beverage sector which is improving productivity, causing certain of the Company’s older machinery and equipment to become obsolete; and |
| • | the loss of business of a large automotive lubricants customer. |
During 2007, the Company evaluated the recoverability of its long-lived tangible assets in light of several trends in some of the markets it serves. Among other factors, the Company considered the following in its evaluation:
| • | a steady conversion to concentrate containers in the liquid laundry detergent market which has decreased sales; |
| • | an ongoing reduction in the automotive quart/liter container business as the Company’s customers convert to multi-quart/liter containers; |
| • | introduction by the Company, and its competitors, of newer production technology in the food and beverage sector which has improved productivity, causing certain of the Company’s older machinery and equipment to become obsolete; and |
| • | the loss of the European portion of a customer’s business. |
The impairment of property, plant and equipment was recorded in the following operating segments:
| Year ended December 31, | |||||||||
| 2009 | 2008 | 2007 | |||||||
| (In thousands) | |||||||||
| North America |
$ | 31,512 | $ | 85,367 | $ | 116,807 | |||
| Europe |
3,918 | 3,534 | 18,149 | ||||||
| South America |
6,396 | 4,260 | 543 | ||||||
| $ | 41,826 | $ | 93,161 | $ | 135,499 | ||||
79
Table of Contents
GRAHAM PACKAGING COMPANY INC.
NOTES TO CONSOLIDATED FINANCIAL STATEMENTS—(Continued)
DECEMBER 31, 2009
Intangible Assets
During 2009, no impairment charges were recorded for its intangible assets.
During 2008, the Company recorded impairment charges to its patented technologies and customer relationships of $1.0 million and $0.5 million, respectively, all in its North American operating segment. These intangible assets were recorded in conjunction with the acquisitions of the blow molded plastic container business of Owens-Illinois Inc. (“O-I Plastic”) in 2004 and certain operations from Tetra-Pak Inc. in 2005. The patented technologies were impaired primarily as a result of not realizing the growth in revenues for this technology that was anticipated at the time of the acquisition of O-I Plastic. The customer relationships were impaired primarily as a result of reduced revenues for the plant acquired from Tetra-Pak Inc.
During 2007, the Company recorded impairment charges to its licensing agreements, customer relationships and patented technologies of $19.1 million, $1.7 million and $0.3 million, respectively, all in its North American operating segment. These intangible assets were recorded in conjunction with the acquisition of O-I Plastic in 2004. The licensing agreements were impaired due to lower projected royalty revenues associated with licensing agreements acquired in the acquisition of O-I Plastic as compared to royalty revenues projected at the time of the acquisition. The customer relationships were impaired primarily as a result of reduced revenues with a major customer resulting from that customer’s policy regarding allocation of its business among several vendors. The patented technologies were impaired primarily as a result of the conversion of a significant portion of the Company’s continuous extrusion manufacturing to Graham Wheel technology.
Goodwill
The Company performs its annual test of impairment of goodwill as of December 31. As a result of this test the Company recorded no impairment charges for the year ended December 31, 2009, as compared to $1.4 million and $1.1 million for the years ended December 31, 2008 and 2007, respectively, related to the following locations (with the operating segment under which it reports in parentheses):
| • | Brazil in 2008 (South America) |
| • | Argentina in 2008 (South America) |
| • | Venezuela in 2007 (South America) |
Regarding the 2008 and 2007 impairments, the plants in Brazil and Argentina had not performed at the levels expected and the Company’s projected discounted cash flows for these reporting units resulted in fair values that were not sufficient to support the goodwill recorded at the time of the respective acquisitions of these plants. The Venezuela plant had suffered several years of losses and the Company’s projected discounted cash flows for this reporting unit had resulted in a fair value that was not sufficient to support the goodwill recorded at the time of the O-I Plastic acquisition.
80
Table of Contents
GRAHAM PACKAGING COMPANY INC.
NOTES TO CONSOLIDATED FINANCIAL STATEMENTS—(Continued)
DECEMBER 31, 2009
10. Accrued Expenses and Other Current Liabilities
Accrued expenses and other current liabilities consisted of the following:
| December 31, | ||||||
| 2009 | 2008 | |||||
| (In thousands) | ||||||
| Accrued employee compensation and benefits |
$ | 64,536 | $ | 65,460 | ||
| Accrued interest |
20,395 | 32,969 | ||||
| Accrued sales allowance |
22,917 | 27,425 | ||||
| Other |
78,958 | 66,589 | ||||
| $ | 186,806 | $ | 192,443 | |||
In recent years, the Company has initiated a series of restructuring activities to reduce costs, achieve synergies and streamline operations.
For the year ended December 31, 2008, the Company recognized severance expense in the United States of $1.6 million (reflected in cost of goods sold) related to the closure of its plant in Edison, New Jersey and the related severing of 115 employees, 114 of whom were terminated by December 31, 2009. Substantially all of the cash payments for these termination benefits are expected to be made by September 30, 2010. The Company also recognized severance expense of $1.8 million (reflected in selling, general and administrative expenses) related to the separation of the Operating Company’s former Chief Operating Officer on April 30, 2008. Substantially all of the cash payments for these termination benefits are expected to be made by June 30, 2010.
For the year ended December 31, 2007, the Company recognized severance expense in the United States of $2.1 million (reflected predominantly in selling, general and administrative expenses) related to the severing of 59 employees. All of the cash payments for these termination benefits have been made as of March 31, 2009. The Company also recognized severance expense in France of $1.9 million (reflected in selling, general and administrative expenses) in 2007, and reduced the accrual in 2008 and 2009 by $0.3 million and $0.2 million, respectively, related to the severing of 12 employees. All of the cash payments for these termination benefits have been made as of March 31, 2009.
For the year ended December 31, 2006, the Company recognized severance expense in the United States of $1.6 million (reflected predominantly in selling, general and administrative expenses) related to the severing of 46 employees. All of the cash payments for these termination benefits have been made as of March 31, 2008. The Company also recognized severance expense of $5.3 million (reflected in selling, general and administrative expenses) related to the separation of the Operating Company’s former Chief Executive Officer and Chief Financial Officer on December 3, 2006. All of the cash payments for these termination benefits have been made as of December 31, 2009.
For the year ended December 31, 2005, the Company recognized severance expense in the United States of $2.3 million (reflected in selling, general and administrative expenses) related to the severing of 16 employees. All of the cash payments for these termination benefits have been made as of March 31, 2008. The Company also recognized severance expense in France of $3.8 million (reflected in cost of goods sold) related to the severing of 37 employees. All of the cash payments for these termination benefits have been made as of September 30, 2008.
81
Table of Contents
GRAHAM PACKAGING COMPANY INC.
NOTES TO CONSOLIDATED FINANCIAL STATEMENTS—(Continued)
DECEMBER 31, 2009
The following table summarizes these severance accruals, and related expenses and payments, by operating segment for the last three years. The balance at December 31, 2009, was included in accrued employee compensation and benefits:
| North America |
Europe | Total | ||||||||||
| (In thousands) | ||||||||||||
| Balance at January 1, 2007 |
$ | 6,762 | $ | 1,072 | $ | 7,834 | ||||||
| Charged to expense during the year |
2,067 | 1,951 | 4,018 | |||||||||
| Payments during the year |
(4,125 | ) | (711 | ) | (4,836 | ) | ||||||
| Foreign currency translation adjustments |
— | 84 | 84 | |||||||||
| Other adjustments |
(42 | ) | (270 | ) | (312 | ) | ||||||
| Balance at December 31, 2007 |
4,662 | 2,126 | 6,788 | |||||||||
| Charged to expense during the year |
3,545 | 86 | 3,631 | |||||||||
| Payments during the year |
(5,064 | ) | (1,498 | ) | (6,562 | ) | ||||||
| Foreign currency translation adjustments |
— | 36 | 36 | |||||||||
| Other adjustments |
(126 | ) | (589 | ) | (715 | ) | ||||||
| Balance at December 31, 2008 |
3,017 | 161 | 3,178 | |||||||||
| Payments during the year |
(2,598 | ) | — | (2,598 | ) | |||||||
| Foreign currency translation adjustments |
— | (12 | ) | (12 | ) | |||||||
| Other adjustments |
(19 | ) | (149 | ) | (168 | ) | ||||||
| Balance at December 31, 2009 |
$ | 400 | $ | — | $ | 400 | ||||||
11. Debt Arrangements
Long-term debt consisted of the following:
| December 31, | ||||||
| 2009 | 2008 | |||||
| (In thousands) | ||||||
| Term loans (net of $19.9 million and $0.0 million unamortized discount as of December 31, 2009 and 2008, respectively) |
$ | 1,781,108 | $ | 1,842,188 | ||
| Revolver |
— | — | ||||
| Foreign and other revolving credit facilities |
3,381 | 2,455 | ||||
| Senior notes (net of $3.3 million and $0.0 million unamortized discount as of December 31, 2009 and 2008, respectively) |
250,047 | 250,000 | ||||
| Senior subordinated notes |
375,000 | 375,000 | ||||
| Capital leases |
17,039 | 21,427 | ||||
| Other |
10,288 | 8,168 | ||||
| 2,436,863 | 2,499,238 | |||||
| Less amounts classified as current |
100,657 | 56,899 | ||||
| Total |
$ | 2,336,206 | $ | 2,442,339 | ||
The Company’s credit agreement consists of senior secured term loans (“Term Loans”) to the Operating Company of $1,781.1 million ($1,801.0 million aggregate outstanding principal amount less $19.9 million unamortized discount) as of December 31, 2009, and a $248.0 million senior secured revolving credit facility
82
Table of Contents
GRAHAM PACKAGING COMPANY INC.
NOTES TO CONSOLIDATED FINANCIAL STATEMENTS—(Continued)
DECEMBER 31, 2009
(the “Revolver” and, together with the Term Loans, the “Credit Agreement”). Availability under the Revolver as of December 31, 2009, was $237.8 million (as reduced by $10.2 million of outstanding letters of credit). The obligations of the Operating Company and CapCo I under the Credit Agreement are guaranteed by Holdings and certain domestic subsidiaries of the Operating Company. The Term Loans are payable in quarterly installments and require payments of $83.3 million (including the excess cash flow payment of $65.5 million due for the year ended December 31, 2009, payable by March 31, 2010, as further described below) in 2010, $593.2 million in 2011, $11.6 million in 2012, $11.6 million in 2013 and $1,101.3 million in 2014 (disregarding any further mandatory or voluntary prepayments that may reduce such scheduled amortization payments).
On May 28, 2009, certain of the lenders under the Term Loans agreed to extend the final maturity of $1,200.0 million of the Term Loans, conditioned on the refinancing in full of the senior notes due 2012. As a result of such refinancing in November 2009, $610.0 million of the Term Loans will mature on October 7, 2011 (“Term Loan B”), and the remaining $1,191.0 million will mature on April 5, 2014 (“Term Loan C”).
On May 28, 2009, certain of the Revolver lenders agreed to extend their commitments, with respect to $112.8 million of the total commitment (“Extending Revolver”), conditioned on the refinancing in full of the senior notes due 2012. As a result of such refinancing in November 2009, $135.2 million of commitments under the Revolver will expire on October 7, 2010 (“Non-Extending Revolver”), and the remainder of the commitments will expire on October 1, 2013. In conjunction with the extension of these revolving commitments, the Company also voluntarily reduced the amount of total revolving commitments available to it under the Credit Agreement from $250.0 million to $248.0 million. In conjunction with the Company’s initial public offering (“IPO”) on February 10, 2010, the Company received a $12.0 million increase to its revolving commitments.
Interest under the Term Loan B and the Non-Extending Revolver is payable at (a) the “Alternate Base Rate” (“ABR”) (the higher of the Prime Rate or the Federal Funds Rate plus 0.50%) plus a margin ranging from 1.00% to 1.75%; or (b) the “Eurodollar Rate” (the applicable interest rate offered to banks in the London interbank eurocurrency market) plus a margin ranging from 2.00% to 2.75%. Interest under the Term Loan C and the Extending Revolver is payable at (a) the “Adjusted Alternate Base Rate” (the higher of (x) the Prime Rate plus a margin of 3.25%; (y) the Federal Funds Rate plus a margin of 3.75%; or (z) the one-month Eurodollar Rate, subject to a floor of 2.50%, plus a margin of 4.25%); or (b) the Eurodollar Rate, subject to a floor of 2.50%, plus a margin of 4.25%. A commitment fee of 0.50% is due on the unused portion of the Non-Extending Revolver. A commitment fee of 0.75% is due on the unused portion of the Extending Revolver.
Substantially all domestic tangible and intangible assets of the Company are pledged as collateral pursuant to the terms of the Credit Agreement.
On November 24, 2009, the Operating Company and CapCo I co-issued $253.4 million aggregate principal amount of 8.25% senior unsecured notes (“Senior Notes”). The notes mature on January 1, 2017. The notes were issued at a price of 98.667% of par value, resulting in $250.0 million of gross proceeds. The $3.4 million of discount is being amortized and included in interest expense as the notes mature. The net proceeds from the offering, along with cash on hand, were used to fully discharge the Company’s obligations and interest payments under its 8.50% senior notes due 2012. In conjunction with the issuance of the Senior Notes, the Company recorded $5.3 million in deferred financing fees, which are included in other non-current assets on the Consolidated Balance Sheet and are being amortized on a straight-line basis over the term of the notes. In conjuction with the tendering of the 8.50% senior notes due 2012, the Company incurred tender premiums of $5.3 million, as well as the write-off of the remaining unamortized debt issuance fees of $4.2 million, which are reflected in net loss on debt extinguishment on the Consolidated Statement of Operations.
83
Table of Contents
GRAHAM PACKAGING COMPANY INC.
NOTES TO CONSOLIDATED FINANCIAL STATEMENTS—(Continued)
DECEMBER 31, 2009
Besides these notes, as of December 31, 2009, the Company also had outstanding $375.0 million in senior subordinated notes due 2014 (“Senior Subordinated Notes”) co-issued by the Operating Company and CapCo I (collectively with the Senior Notes, the “Notes”). The Notes are unconditionally guaranteed, jointly and severally, by Holdings and certain domestic subsidiaries of the Operating Company and mature on October 7, 2014 (Senior Subordinated Notes) and January 1, 2017 (Senior Notes). Interest on the Senior Subordinated Notes is payable semi-annually at 9.875% per annum and interest on the Senior Notes is payable semi-annually at 8.25% per annum.
During 2004 and 2005, the Operating Company entered into forward starting interest rate swap agreements that effectively fixed the interest rate on $925.0 million of the Term Loans at a weighted average rate of 4.02%. These swap agreements went into effect at various points in 2006 and expired in December 2007 ($650.0 million) and January 2008 ($275.0 million).
During 2007, the Operating Company entered into two forward starting interest rate collar agreements that effectively fixed the interest rate within a fixed cap and floor rate on $385.0 million of the Term Loans at a weighted average cap rate of 4.70% and a weighted average floor rate of 2.88%. These forward starting collar agreements went into effect January 2008 and expired in January 2010.
During 2008, the Operating Company entered into four forward starting interest rate swap agreements that effectively fix the interest rate on $350.0 million of the Term Loans at a weighted average rate of 4.08%. These swap agreements went into effect August 2009 and expire in 2011.
The Credit Agreement and indentures governing the Notes contain a number of significant covenants that, among other things, restrict the Company’s and the Company’s subsidiaries’ ability to dispose of assets, repay other indebtedness, incur additional indebtedness, pay dividends, prepay subordinated indebtedness, incur liens, make capital expenditures, investments or acquisitions, engage in mergers or consolidations, engage in transactions with affiliates and otherwise restrict the Company’s activities. In addition, under the Credit Agreement, the Company is required to satisfy specified financial ratios and tests. The Credit Agreement also requires that up to 50% of excess cash flow (as defined in the Credit Agreement) be applied on an annual basis to pay down the Term Loans. An excess cash flow payment of $65.5 million was due for the year ended December 31, 2009, payable by March 31, 2010. As of December 31, 2009, the Company was in compliance with all covenants.
Under the Credit Agreement, the Operating Company is subject to restrictions on the payment of dividends or other distributions to Holdings; provided that, subject to certain limitations, the Operating Company may pay dividends or other distributions to Holdings:
| • | in respect of overhead, tax liabilities, legal, accounting and other professional fees and expenses; and |
| • | to fund purchases and redemptions of equity interests of Holdings or the Company held by then present or former officers or employees of Holdings, the Operating Company or their Subsidiaries (as defined therein) or by any employee stock ownership plan upon that person’s death, disability, retirement or termination of employment or other circumstances with annual dollar limitations. |
The Company’s weighted average effective interest rate on the outstanding borrowings under the Term Loans and Revolver was 5.71% and 5.50% at December 31, 2009 and 2008, respectively, excluding the effect of interest rate collar and swap agreements.
84
Table of Contents
GRAHAM PACKAGING COMPANY INC.
NOTES TO CONSOLIDATED FINANCIAL STATEMENTS—(Continued)
DECEMBER 31, 2009
The Company had several foreign and other revolving credit facilities denominated in U.S. dollars, Brazilian real, Argentine pesos and Polish zloty with aggregate available borrowings at December 31, 2009, equivalent to $11.2 million. The Company’s average effective interest rate on borrowings of $3.4 million on these credit facilities at December 31, 2009, was 11.1%. The Company’s average effective interest rate on borrowings of $2.5 million on these credit facilities at December 31, 2008, was 20.3%.
Cash paid for interest during 2009, 2008 and 2007, net of amounts capitalized of $3.4 million, $3.9 million and $5.7 million, respectively, totaled $177.7 million, $169.0 million and $198.4 million, respectively.
The annual debt service requirements of the Company for the succeeding five years are as follows (in thousands):
| 2010 |
$ | 106,424 | |
| 2011 |
600,208 | ||
| 2012 |
12,179 | ||
| 2013 |
11,571 | ||
| 2014 |
1,101,307 | ||
| Thereafter |
628,378 |
As required by the guidance under ASC 470-50-40, “Modifications and Extinguishments,” the Company performed an analysis to determine whether the amendment of the Credit Agreement to extend the maturity date of the Term Loans and Revolver on May 28, 2009, would be recorded as an extinguishment of debt or a modification of debt. Based on the Company’s analysis, it was determined that the amendment qualified as a debt extinguishment under this guidance and, as a result, the Company recorded a gain on debt extinguishment of $0.8 million. The gain on debt extinguishment is comprised of the following items (in millions):
| Recorded value of debt subject to amendment, prior to amendment |
$ | 1,200.0 | ||
| Fair value of debt resulting from amendment (see Note 12 for further discussion) |
(1,177.3 | ) | ||
| Gain on extinguished debt, before costs |
22.7 | |||
| Write-off of deferred financing fees on extinguished debt |
(9.3 | ) | ||
| New issuance costs on extinguished debt |
(12.6 | ) | ||
| Total |
$ | 0.8 | ||
In conjunction with the amendment, the Company recorded $2.5 million in deferred financing fees, which are included in other non-current assets on the Consolidated Balance Sheet and are being amortized to interest expense over the terms of the respective debt using the effective interest method.
12. Fair Value of Financial Instruments
The following methods and assumptions were used to estimate the fair values of each class of financial instruments:
Cash and Cash Equivalents, Accounts Receivable and Accounts Payable
The fair values of these financial instruments approximate their carrying amounts.
85
Table of Contents
GRAHAM PACKAGING COMPANY INC.
NOTES TO CONSOLIDATED FINANCIAL STATEMENTS—(Continued)
DECEMBER 31, 2009
Long-Term Debt
The Company’s long-term debt consists of both variable-rate and fixed-rate debt. The fair values of the Company’s long-term debt were based on market price information. The Company’s variable-rate debt, including the Company’s Credit Agreement, totaled $1,790.1 million (net of $19.9 million unamortized discount) and $1,846.1 million at December 31, 2009 and 2008, respectively. The fair value of this long-term debt, including the current portion, was approximately $1,809.8 million and $1,325.7 million at December 31, 2009 and 2008, respectively. The Company’s fixed-rate debt, including $253.4 million of Senior Notes and $375.0 million of Senior Subordinated Notes, totaled $646.8 million (net of $3.3 million unamortized discount) and $653.1 million at December 31, 2009 and 2008, respectively. The fair value of this long-term debt, including the current portion, was approximately $652.8 million and $436.9 million at December 31, 2009 and 2008, respectively.
Derivatives
On January 1, 2008, the Company adopted the guidance under ASC 820-10, “Fair Value Measurements and Disclosures,” which established the following fair value hierarchy that prioritizes the inputs used to measure fair value:
| Level 1: | Inputs are quoted prices in active markets for identical assets or liabilities as of the reporting date. Active markets are those in which transactions for the asset or liability occur with sufficient frequency and volume to provide pricing information on an ongoing basis. |
| Level 2: | Inputs include the following: |
| a) | Quoted prices in active markets for similar assets or liabilities. |
| b) | Quoted prices in markets that are not active for identical or similar assets or liabilities. |
| c) | Inputs other than quoted prices that are observable for the asset or liability. |
| d) | Inputs that are derived primarily from or corroborated by observable market data by correlation or other means. |
| Level 3: | Inputs are unobservable inputs for the asset or liability. |
Recurring Fair Value Measurements
The following table presents the Company’s financial assets and liabilities that were accounted for at fair value on a recurring basis as of December 31, 2009, by level within the fair value hierarchy:
| Fair Value Measurements Using | |||||||||
| Level 1 | Level 2 | Level 3 | |||||||
| (In thousands) | |||||||||
| Liabilities: |
|||||||||
| Interest rate collar agreements |
$ | — | $ | 68 | $ | — | |||
| Interest rate swap agreements |
— | 16,688 | — | ||||||
| Foreign currency exchange contract |
— | 27 | — | ||||||
The fair values of the Company’s derivative financial instruments are observable at commonly quoted intervals for the full term of the derivatives and therefore considered level 2 inputs.
86
Table of Contents
GRAHAM PACKAGING COMPANY INC.
NOTES TO CONSOLIDATED FINANCIAL STATEMENTS—(Continued)
DECEMBER 31, 2009
Non-recurring Fair Value Measurements
The Company has real estate located in Edison, New Jersey that is held for sale. The aggregate carrying value of these assets at December 31, 2009, was $6.6 million, which is less than the fair value of these assets and therefore resulted in no impairment charge for these assets. The determination of fair value included certain unobservable inputs, which reflect the Company’s assumptions regarding how market participants would price these assets in the marketplace, and therefore are considered level 3 inputs. The fair value of this real estate was based on offers received from potential buyers.
The Company also recorded impairment charges in continuing operations of $41.8 million for the year ended December 31, 2009, for long-lived assets in Argentina, Belgium, Brazil, France, Mexico, Netherlands, Poland Turkey, Venezuela, the United Kingdom and the United States whose carrying values exceeded fair values. Fair values for these assets were based on projected future cash flows, discounted using either a risk-free rate or a risk-adjusted rate, which the Company considers level 3 inputs.
The Company signed a Letter of Intent in the second quarter of 2009 to sell its manufacturing facility located in Meaux, France to an independent third party. The sale occurred in November 2009. Based upon the Letter of Intent, the high probability that the sale would occur and the conclusions made by the Company, after consideration of level 3 inputs, that there were no projected future cash flows for this location, the Company recorded an impairment charge in discontinued operations of $5.9 million for the year ended December 31, 2009.
As previously discussed, on May 28, 2009, the Company amended its Credit Agreement to extend the final maturity date of certain loans and revolver commitments. In accordance with the guidance under ASC 470-50-40, “Modifications and Extinguishments,” this transaction was treated as a debt extinguishment and the new debt was initially recorded at its fair value of $1,177.3 million, which was based on the average trading price on the first trade date and is considered a level 2 input. The initial fair value discount of $22.7 million is being amortized to interest expense over the term of the Term Loan C using the effective interest method.
13. Derivative Financial Instruments
The Company’s business and activities expose it to a variety of market risks, including risks related to changes in interest rates, foreign currency exchange rates and commodity prices. These financial exposures are monitored and managed by the Company as an integral part of its market risk management program. This program recognizes the unpredictability of financial markets and seeks to reduce the potentially adverse effects that market volatility could have on operating results. As part of its market risk management strategy, the Company uses derivative instruments to protect cash flows from fluctuations caused by volatility in interest rates, foreign currency exchange rates and commodity prices.
Credit risk arising from the inability of a counterparty to meet the terms of the Company’s financial instrument contracts is generally limited to the amounts, if any, by which the counterparty’s obligations exceed the obligations of the Company. It is the Company’s policy to enter into financial instruments with a diverse group of creditworthy counterparties in order to spread the risk among multiple counterparties. With respect to the Company’s cash flow hedges, the Company routinely considers the possible impact of counterparty default when assessing whether a hedging relationship continues to be effective. The Company has considered the recent market events in determining the impact, if any, of counterparty default on its cash flow hedges. The cash flow hedges that the Company currently has are with major banking institutions and the Company has concluded that the likelihood of counterparty default is remote.
87
Table of Contents
GRAHAM PACKAGING COMPANY INC.
NOTES TO CONSOLIDATED FINANCIAL STATEMENTS—(Continued)
DECEMBER 31, 2009
Cash Flow Hedges
The Company’s interest rate risk management strategy is to use derivative instruments to minimize significant unanticipated earnings fluctuations that may arise from volatility in interest rates of the Company’s borrowings and to manage the interest rate sensitivity of its debt. Interest rate collar and swap agreements are used to hedge exposure to interest rates associated with the Company’s Credit Agreement. Under these agreements, the Company agrees to exchange with a third party at specified intervals the difference between fixed and variable interest amounts calculated by reference to an agreed-upon notional principal amount. In 2009 and 2008, the liabilities associated with interest rate collar and swap agreements were recorded on the balance sheet in other current liabilities and other non-current liabilities, at fair value. The hedges were highly effective as defined by ASC 815, “Derivatives and Hedging,” with the effective portion of the cash flow hedges recorded in other comprehensive income (loss) until the first quarter of 2009, as further discussed below. The effective portion of these cash flow hedges recorded in other comprehensive income (loss) was an unrealized loss of $22.6 million as of December 31, 2008.
Derivatives are an important component of the Company’s interest rate management program, leading to acceptable levels of variable interest rate risk. Had the Company not hedged its interest rates in 2009, 2008 and 2007, interest expense would have been lower by $13.1 million and $0.2 million and higher by $12.3 million, respectively, compared to an entirely unhedged variable-rate debt portfolio.
The Company uses foreign currency exchange contracts as hedges against payments of intercompany balances and anticipated purchases denominated in foreign currencies. The Company enters into these contracts to protect itself against the risk that the eventual net cash flows will be adversely affected by changes in exchange rates. At December 31, 2009 and 2008, the Company had foreign currency exchange contracts outstanding for the purchase of pound sterling in an amount of $1.5 million and Canadian dollars and pound sterling in an aggregate amount of $10.2 million, respectively.
The Company’s energy risk management strategy is to use derivative instruments to minimize significant unanticipated manufacturing cost fluctuations that may arise from volatility in natural gas prices.
For derivative instruments that are designated and qualify as cash flow hedges, the effective portion of the gain or loss on the derivative is reported as a component of other comprehensive income and reclassified into earnings in the same period or periods during which the hedged transaction affects earnings. Gains and losses on derivatives representing hedge ineffectiveness, if any, are recognized in current earnings.
The maximum term over which the Company is hedging exposures to the variability of cash flows (for all forecasted transactions, excluding interest payments on variable-rate debt) is 12 months.
Derivatives Not Designated as Hedging Instruments
During the first quarter of 2009, the Company elected to roll over its senior secured term loan in one-month increments to reduce its cash interest, as opposed to continuing to roll over its senior secured term loan in three-month increments to match the terms of its interest rate collar agreements. The Company has therefore discontinued hedge accounting for its interest rate collar and swap agreements. The amount recorded in accumulated other comprehensive income (loss) as of the date the Company discontinued hedge accounting for its interest rate collar and swap agreements is being recognized as interest expense over the period in which the previously hedged activity continues to occur. Changes in the fair value of the interest rate collar and swap
88
Table of Contents
GRAHAM PACKAGING COMPANY INC.
NOTES TO CONSOLIDATED FINANCIAL STATEMENTS—(Continued)
DECEMBER 31, 2009
agreements from that date are also being recognized as interest expense. Of the amount recorded within accumulated other comprehensive income (loss) as of December 31, 2009, 63% is expected to be recognized in interest expense in the next twelve months.
During the first quarter of 2009, the Company entered into foreign currency exchange contracts to hedge the effects of fluctuations in exchange rates on an anticipated euro-denominated purchase of equipment. The gains or losses on the derivatives were recognized in current earnings.
Financial instruments are not held by the Company for trading purposes.
The notional amounts of the Company’s derivative instruments outstanding as of December 31, 2009, were as follows:
| Notional Amount | |||
| (In thousands) | |||
| Derivatives designated as hedges: |
|||
| Foreign currency exchange contract |
$ | 1,544 | |
| Total derivatives designated as hedges |
$ | 1,544 | |
| Derivatives not designated as hedges: |
|||
| Interest rate collar agreements |
$ | 385,000 | |
| Interest rate swap agreements |
350,000 | ||
| Total derivatives not designated as hedges |
$ | 735,000 | |
The fair values of the Company’s derivative instruments outstanding as of December 31, 2009, were as follows:
| Balance Sheet Location |
Fair Value | ||||
| (In thousands) | |||||
| Liability derivatives: |
|||||
| Derivatives designated as hedges: |
|||||
| Foreign currency exchange contract |
Accrued expenses and other current liabilities | $ | 27 | ||
| Total derivatives designated as hedges |
27 | ||||
| Derivatives not designated as hedges: |
|||||
| Interest rate collar agreements |
Accrued expenses and other current liabilities | 68 | |||
| Interest rate swap agreements |
Accrued expenses and other current liabilities | 10,466 | |||
| Interest rate swap agreements |
Other non-current liabilities | 6,222 | |||
| Total derivatives not designated as hedges |
16,756 | ||||
| Total liability derivatives |
$ | 16,783 | |||
89
Table of Contents
GRAHAM PACKAGING COMPANY INC.
NOTES TO CONSOLIDATED FINANCIAL STATEMENTS—(Continued)
DECEMBER 31, 2009
The gains and losses on the Company’s derivative instruments during the year ended December 31, 2009, were as follows:
| Amount of Gain or (Loss) Recognized in AOCI (a) (Effective Portion) for the Year Ended December 31, 2009 |
Income Statement Classification |
Amount of Gain or (Loss) Reclassified from AOCI into Income (Effective Portion) for the Year Ended December 31, 2009 |
||||||||
| (In thousands) | (In thousands) | |||||||||
| Derivatives designated as hedges: |
||||||||||
| Cash flow hedges: |
||||||||||
| Foreign currency exchange contract |
$ | 122 | Other income, net | $ | 122 | |||||
| Natural gas swap agreements |
(180 | ) | Cost of goods sold | (430 | ) | |||||
| Total derivatives designated as hedges |
$ | (58 | ) | $ | (308 | ) | ||||
| Amount of Gain or (Loss) Recognized in Income for the Year Ended December 31, 2009 |
||||||||||
| (In thousands) | ||||||||||
| Derivatives not designated as hedges: |
||||||||||
| Interest rate collar agreements |
Interest expense | $ | (7,790 | ) | ||||||
| Interest rate swap agreements |
Interest expense | (9,131 | ) | |||||||
| Foreign currency exchange contracts |
Other income, net | 95 | ||||||||
| Total derivatives not designated as hedges |
$ | (16,826 | ) | |||||||
| (a) | Accumulated other comprehensive income (loss) (“AOCI”). |
14. Transactions with Related Parties
The Company had transactions with entities affiliated through common ownership. The Company was a party to an Equipment Sales, Services and License Agreement dated February 2, 1998 (“Equipment Sales Agreement”) with Graham Engineering Corporation (“Graham Engineering”), under which Graham Engineering provided the Company with certain sizes of the Graham Wheel, which is an extrusion blow molding machine, on an exclusive basis within the countries and regions in which the Company had material sales of plastic containers. The Graham Family owns Graham Engineering and has a 15% ownership interest in Holdings as of December 31, 2009. In addition, they have supplied management services to Holdings since 1998. The Equipment Sales Agreement terminated on December 31, 2007. An entity affiliated with Blackstone, which has an 80% ownership interest in Holdings, as of December 31, 2009, has supplied management services to Holdings since 1998. Under the Fifth Amended and Restated Limited Partnership Agreement and the Amended and Restated Monitoring Agreement, Holdings was obligated to make annual payments of $2.0 million and $3.0 million to affiliates of the Graham Family and Blackstone, respectively.
90
Table of Contents
GRAHAM PACKAGING COMPANY INC.
NOTES TO CONSOLIDATED FINANCIAL STATEMENTS—(Continued)
DECEMBER 31, 2009
Transactions with entities affiliated through common ownership included the following:
| Year Ended December 31, | |||||||||
| 2009 | 2008 | 2007 | |||||||
| (In thousands) | |||||||||
| Equipment and related services purchased from affiliates |
$ | 2,504 | $ | 1,272 | $ | 11,011 | |||
| Management services provided by affiliates (1) |
$ | 10,024 | $ | 5,213 | $ | 5,293 | |||
| Interest income on notes receivable from owners |
$ | 273 | $ | 121 | $ | 114 | |||
| (1) | Amount for the year ended December 31, 2009, includes a $5.0 million fee from Blackstone Management Partners III L.L.C. in connection with the Fourth Amendment to the Credit Agreement entered into on May 28, 2009. This amount was charged against the resulting gain on debt extinguishment (see Note 11). |
Account balances with affiliates included the following:
| As of December 31, | ||||||
| 2009 | 2008 | |||||
| (In thousands) | ||||||
| Accounts payable |
$ | 972 | $ | 1,386 | ||
| Other current or non-current liabilities |
$ | 703 | $ | 695 | ||
| Notes and interest receivable for ownership interests |
$ | 1,795 | $ | 2,060 | ||
| Receivable from owner |
$ | 4,559 | $ | 4,232 | ||
At December 31, 2009, the Company had loans outstanding to certain former management employees of the Company of $1.8 million for the purchase of shares of GPC. These loans were made in connection with the capital call payments made on September 29, 2000, and March 29, 2001, pursuant to the capital call agreement dated as of August 13, 1998. The proceeds from the loans were used to fund management’s share of the capital call payments. In October 2009, current management repaid $0.3 million of these loans. The loans mature on September 28, 2012, and March 30, 2013, respectively, and accrue interest at a rate of 6.22%. The loans are secured by a pledge of the stock purchased by the loans. The loans and related interest are reflected in equity (deficit) on the Consolidated Balance Sheets.
On behalf of Blackstone, the Company made payments to the Operating Company’s former Chief Executive Officer and Chief Financial Officer on January 5, 2007, for its repurchase of all of their outstanding shares of GPC, pursuant to separation agreements dated as of December 3, 2006. Additionally, on behalf of Blackstone, the Company made a payment to a former Senior Vice President of the Operating Company on April 10, 2009, for its repurchase of all of his outstanding shares of GPC. As a result of these payments, Blackstone became the owners of these shares and owe the Company $4.6 million. This receivable is reflected in equity (deficit) on the Consolidated Balance Sheets.
Affiliates of Blackstone have also provided funding to the Company to cover its operating expenses, resulting in a payable to the affiliates of Blackstone, which is reflected in other current or non-current liabilities.
Gary G. Michael, a member of the Company’s board of directors and a member of the former committee that advised Holdings and its partners, also serves on the Board of Directors of The Clorox Company, which is a large customer of the Company. Included in current assets at December 31, 2009 and 2008, were receivables from The Clorox Company of $2.3 million and $3.6 million, respectively. Included in net sales for the years ended December 31, 2009, 2008 and 2007, were net sales to The Clorox Company of $49.1 million, $45.2 million and $30.0 million, respectively.
91
Table of Contents
GRAHAM PACKAGING COMPANY INC.
NOTES TO CONSOLIDATED FINANCIAL STATEMENTS—(Continued)
DECEMBER 31, 2009
15. Pension Plans
Substantially all employees of the Company participate in noncontributory defined benefit or defined contribution pension plans.
The U.S. defined benefit plan covering salaried employees provides retirement benefits based on the final five years average compensation, while plans covering hourly employees provide benefits based on years of service. The Company’s hourly and salaried pension plan covering non-union employees was frozen to future salary and service accruals in the fourth quarter of 2006.
The Company accounts for its defined benefit plans under the guidance in ASC 715, “Defined Benefit Plans.” The Company uses a December 31 measurement date for all of its plans. The components of pension expense and other changes in plan assets and benefit obligations recognized in other comprehensive income (loss) were as follows:
| Pension Plan | ||||||||||||||||||||||||
| U.S. | Non-U.S. | |||||||||||||||||||||||
| 2009 | 2008 | 2007 | 2009 | 2008 | 2007 | |||||||||||||||||||
| (In thousands) | ||||||||||||||||||||||||
| Net periodic benefit cost and amounts recognized in other comprehensive income (loss): |
||||||||||||||||||||||||
| Service cost |
$ | 1,795 | $ | 1,821 | $ | 2,192 | $ | 442 | $ | 690 | $ | 798 | ||||||||||||
| Interest cost |
5,189 | 4,695 | 4,339 | 847 | 910 | 891 | ||||||||||||||||||
| Expected return on assets |
(4,958 | ) | (5,711 | ) | (5,114 | ) | (792 | ) | (963 | ) | (953 | ) | ||||||||||||
| Amortization of prior service cost |
668 | 665 | 673 | 50 | 54 | 53 | ||||||||||||||||||
| Amortization of net loss |
1,602 | 80 | 85 | 42 | 66 | 50 | ||||||||||||||||||
| Special benefits charge |
52 | 318 | — | — | — | — | ||||||||||||||||||
| Settlements/curtailments |
181 | — | — | — | — | — | ||||||||||||||||||
| Net periodic pension costs |
4,529 | 1,868 | 2,175 | 589 | 757 | 839 | ||||||||||||||||||
| Other changes in plan assets and benefit obligations recognized in other comprehensive income (loss): |
||||||||||||||||||||||||
| Prior service cost for period |
— | 356 | 5,050 | — | — | 303 | ||||||||||||||||||
| Net (gain) loss for period |
(9,953 | ) | 29,585 | 27 | 940 | (325 | ) | (504 | ) | |||||||||||||||
| Amortization of prior service cost |
(849 | ) | (665 | ) | (673 | ) | (50 | ) | (54 | ) | (53 | ) | ||||||||||||
| Amortization of net loss |
(1,602 | ) | (80 | ) | (85 | ) | (42 | ) | (66 | ) | (50 | ) | ||||||||||||
| Foreign currency exchange rate change |
— | — | — | 884 | (84 | ) | 369 | |||||||||||||||||
| Total |
(12,404 | ) | 29,196 | 4,319 | 1,732 | (529 | ) | 65 | ||||||||||||||||
| Total recognized in net periodic benefit cost and |
||||||||||||||||||||||||
| other comprehensive income (loss) |
$ | (7,875 | ) | $ | 31,064 | $ | 6,494 | $ | 2,321 | $ | 228 | $ | 904 | |||||||||||
The estimated prior service cost and net actuarial loss for the defined benefit pension plans that will be amortized from accumulated other comprehensive loss into net periodic benefit cost in 2010 are $0.6 million and $0.8 million, respectively, for the U.S. plans, and $0.1 million and $0.1 million, respectively, for the non-U.S. plans.
92
Table of Contents
GRAHAM PACKAGING COMPANY INC.
NOTES TO CONSOLIDATED FINANCIAL STATEMENTS—(Continued)
DECEMBER 31, 2009
All of the Company’s plans have a benefit obligation in excess of plan assets. Using the most recent actuarial valuations, the following table sets forth the change in the Company’s benefit obligation and pension plan assets at market value for the years ended December 31, 2009 and 2008. The Company uses the fair value of its pension assets in the calculation of pension expense for all of its pension plans.
| U.S. | Non-U.S. | |||||||||||||||
| 2009 | 2008 | 2009 | 2008 | |||||||||||||
| (In thousands) | ||||||||||||||||
| Change in benefit obligation: |
||||||||||||||||
| Benefit obligation at beginning of year |
$ | (87,583 | ) | $ | (76,049 | ) | $ | (12,425 | ) | $ | (18,256 | ) | ||||
| Service cost |
(1,795 | ) | (1,821 | ) | (442 | ) | (690 | ) | ||||||||
| Interest cost |
(5,189 | ) | (4,695 | ) | (847 | ) | (910 | ) | ||||||||
| Benefits paid |
2,422 | 2,440 | 393 | 541 | ||||||||||||
| Change in benefit payments due to experience |
— | — | (21 | ) | (18 | ) | ||||||||||
| Settlements/curtailments |
142 | — | — | — | ||||||||||||
| Participant contributions |
— | — | (78 | ) | (102 | ) | ||||||||||
| Effect of exchange rate changes |
— | — | (2,293 | ) | 4,094 | |||||||||||
| Increase in benefit obligation due to change in discount rate |
— | (6,949 | ) | — | — | |||||||||||
| Special termination benefits |
(52 | ) | (318 | ) | — | — | ||||||||||
| Actuarial gain (loss) |
939 | 165 | (779 | ) | 2,916 | |||||||||||
| Increase in benefit obligation due to plan change |
— | (356 | ) | — | — | |||||||||||
| Benefit obligation at end of year |
$ | (91,116 | ) | $ | (87,583 | ) | $ | (16,492 | ) | $ | (12,425 | ) | ||||
| Change in plan assets: |
||||||||||||||||
| Plan assets at market value at beginning of year |
$ | 52,009 | $ | 64,333 | $ | 10,146 | $ | 14,767 | ||||||||
| Actual return on plan assets |
13,831 | (17,090 | ) | 1,281 | (1,611 | ) | ||||||||||
| Foreign currency exchange rate changes |
— | — | 1,366 | (3,356 | ) | |||||||||||
| Employer contributions |
15,585 | 7,206 | 743 | 785 | ||||||||||||
| Participant contributions |
— | — | 78 | 102 | ||||||||||||
| Benefits paid |
(2,422 | ) | (2,440 | ) | (393 | ) | (541 | ) | ||||||||
| Plan assets at market value at end of year |
$ | 79,003 | $ | 52,009 | $ | 13,221 | $ | 10,146 | ||||||||
| Funded status at end of year |
$ | (12,113 | ) | $ | (35,574 | ) | $ | (3,271 | ) | $ | (2,279 | ) | ||||
| Amounts recognized in the consolidated balance sheets consist of: |
||||||||||||||||
| Current liabilities |
$ | — | $ | — | $ | (32 | ) | $ | (16 | ) | ||||||
| Non-current liabilities |
(12,113 | ) | (35,574 | ) | (3,239 | ) | (2,263 | ) | ||||||||
| Total |
$ | (12,113 | ) | $ | (35,574 | ) | $ | (3,271 | ) | $ | (2,279 | ) | ||||
| Amounts recognized in accumulated other comprehensive income (loss): |
||||||||||||||||
| Unrecognized prior service cost |
$ | 5,309 | $ | 6,158 | $ | 481 | $ | 459 | ||||||||
| Unrecognized net actuarial loss |
19,702 | 31,258 | 1,567 | 485 | ||||||||||||
| Total |
$ | 25,011 | $ | 37,416 | $ | 2,048 | $ | 944 | ||||||||
| Accrued benefit cost: |
||||||||||||||||
| Accrued benefit cost at beginning of year |
$ | 1,842 | $ | (3,496 | ) | $ | (1,334 | ) | $ | (2,015 | ) | |||||
| Net periodic benefit cost |
(4,529 | ) | (1,868 | ) | (589 | ) | (757 | ) | ||||||||
| Employer contributions |
15,585 | 7,206 | 743 | 785 | ||||||||||||
| Effect of exchange rate changes |
— | — | (43 | ) | 652 | |||||||||||
| Accrued benefit cost at end of year |
$ | 12,898 | $ | 1,842 | $ | (1,223 | ) | $ | (1,335 | ) | ||||||
93
Table of Contents
GRAHAM PACKAGING COMPANY INC.
NOTES TO CONSOLIDATED FINANCIAL STATEMENTS—(Continued)
DECEMBER 31, 2009
The accumulated benefit obligation for all defined benefit pension plans was $107.6 million and $100.0 million as of December 31, 2009 and 2008, respectively.
Pension plans with accumulated benefit obligations in excess of plan assets at December 31 is as follows:
| As of December 31, | ||||||
| 2009 | 2008 | |||||
| (In thousands) | ||||||
| Projected benefit obligation |
$ | 107,608 | $ | 100,008 | ||
| Accumulated benefit obligation |
107,608 | 100,008 | ||||
| Fair value of plan assets |
92,224 | 62,155 | ||||
The following table presents significant assumptions used to determine benefit obligations at December 31:
| 2009 | 2008 | |||||
| Discount rate: |
||||||
| - U.S. |
6.00 | % | 6.25 | % | ||
| - Canada |
5.75 | % | 6.25 | % | ||
| - UK |
6.00 | % | 6.40 | % | ||
| - Mexico |
8.60 | % | 8.16 | % | ||
| Rate of compensation increase: |
||||||
| - U.S. |
N/A | N/A | ||||
| - Canada |
4.00 | % | 4.00 | % | ||
| - UK |
3.10 | % | 3.80 | % | ||
| - Mexico |
5.04 | % | 5.04 | % |
The following table presents significant weighted average assumptions used to determine benefit cost for the years ended December 31:
| Actuarial Assumptions | ||||||||||||
| U.S. | Canada | UK | Mexico | |||||||||
| Discount rate: |
||||||||||||
| 2009 |
6.00 | % | 5.75 | % | 6.00 | % | 8.60 | % | ||||
| 2008 |
6.00 | % | 5.25 | % | 5.37 | % | 7.64 | % | ||||
| 2007 |
5.75 | % | 5.00 | % | 5.00 | % | 5.59 | % | ||||
| Long-term rate of return on plan assets: |
||||||||||||
| 2009 |
8.00 | % | 7.00 | % | 6.43 | % | N/A | |||||
| 2008 |
8.75 | % | 7.00 | % | 7.10 | % | N/A | |||||
| 2007 |
8.75 | % | 8.00 | % | 6.92 | % | N/A | |||||
| Weighted average rate of increase for future compensation levels: |
||||||||||||
| 2009 |
N/A | 4.00 | % | 3.10 | % | 5.04 | % | |||||
| 2008 |
N/A | 4.00 | % | 3.60 | % | 4.54 | % | |||||
| 2007 |
4.50 | % | 4.00 | % | 3.60 | % | 4.91 | % | ||||
Pension expense is calculated based upon a number of actuarial assumptions established on January 1 of the applicable year, detailed in the table above, including a weighted-average discount rate, an expected long-term rate of return on plan assets and rate of increase in future compensation levels. The discount rate used by the Company for valuing pension liabilities is based on a review of high quality corporate bond yields with
94
Table of Contents
GRAHAM PACKAGING COMPANY INC.
NOTES TO CONSOLIDATED FINANCIAL STATEMENTS—(Continued)
DECEMBER 31, 2009
maturities approximating the remaining life of the projected benefit obligations. The U.S. expected long-term rate of return assumption on plan assets (which consist mainly of U.S. equity and debt securities) was developed by evaluating input from the Company’s actuaries and investment consultants as well as long-term inflation assumptions. Projected returns by such consultants are based on broad equity and bond indices. The expected long-term rate of return on plan assets is based on an asset allocation assumption of 65% with equity managers and 35% with fixed income managers. At December 31, 2009, the Company’s asset allocation was 48% with equity managers, 47% with fixed income managers and 5% other. At December 31, 2008, the Company’s asset allocation was 52% with equity managers, 37% with fixed income managers and 11% other. The Company believes that its long-term asset allocation on average will approximate 65% with equity managers and 35% with fixed income managers. The Company regularly reviews its actual asset allocation and periodically rebalances its investments to targeted allocations when considered appropriate. Based on this methodology, the Company’s expected long-term rate of return assumption was 8.00% and 8.75% in 2009 and 2008, respectively.
Asset allocation for the Company’s UK plan is 35% with equity managers, 50% with fixed income managers and 15% in real estate.
The Company made cash contributions to its pension plans in 2009 of $16.3 million and paid benefit payments of $2.8 million. The 2009 cash contribution amount includes a voluntary payment of $12.7 million to the U.S. defined benefit plans to maintain specific funding target percentages. The Company estimates that based on current actuarial calculations it will make cash contributions to its pension plans in 2010 of $7.3 million. Cash contributions in subsequent years will depend on a number of factors including performance of plan assets.
As of December 31, 2009, the Company adopted new guidance under ASC 715, “Defined Benefit Plans,” that requires disclosures of the fair value of pension plan assets. The following table presents the fair value of pension plan assets classified under the appropriate level of the fair value hierarchy as of December 31, 2009. Refer to Note 12 for the definition of fair value and a description of the fair value hierarchy structure.
| Fair Value Measurements Using | ||||||||||||
| Level 1 | Level 2 | Level 3 | Total | |||||||||
| (In thousands) | ||||||||||||
| Asset Category: |
||||||||||||
| Cash and cash equivalents |
$ | 6,440 | $ | — | $ | — | $ | 6,440 | ||||
| Mutual funds |
||||||||||||
| U.S. equity |
26,826 | — | — | 26,826 | ||||||||
| International equity |
11,149 | — | — | 11,149 | ||||||||
| International fixed income |
12,147 | — | — | 12,147 | ||||||||
| Taxable fixed income funds |
25,831 | — | 25,831 | |||||||||
| International equity securities |
3,571 | — | — | 3,571 | ||||||||
| Commingled pools / collective trusts |
— | 6,260 | — | 6,260 | ||||||||
| Total |
$ | 85,964 | $ | 6,260 | $ | — | $ | 92,224 | ||||
The Company measures fair value of mutual funds, taxable fixed income funds and international equity securities based on quoted market prices, as substantially all of these instruments have active markets. The Canadian pension plan is invested in only one asset, which is a commingled pooled trust that maintains diversification among various asset classes, including Canadian common stocks, bonds and money market securities, U.S. equities, other international equities and fixed income investments. Such investments are valued at the net asset value of the shares held at December 31, 2009. Accordingly, these investments are included in level 2.
95
Table of Contents
GRAHAM PACKAGING COMPANY INC.
NOTES TO CONSOLIDATED FINANCIAL STATEMENTS—(Continued)
DECEMBER 31, 2009
The following benefit payments, which reflect expected future service, as appropriate, are expected to be paid:
| Benefit Payments | |||
| (In thousands) | |||
| 2010 |
$ | 2,900 | |
| 2011 |
3,243 | ||
| 2012 |
3,683 | ||
| 2013 |
4,039 | ||
| 2014 |
4,400 | ||
| Years 2015 – 2019 |
28,920 | ||
During 2009, the Company closed its plant located in Bristol, Pennsylvania and announced the closure of its plant in Vicksburg, Mississippi. The Company recorded a net curtailment charge of $0.1 million for the vesting of all non-vested pension plan participants. Subsequent to year-end, the Company made a voluntary contribution of $0.5 million on January 29, 2010, to fully fund the Bristol, Pennsylvania plan.
The Company also participated in a defined contribution plan under Internal Revenue Code Section 401(k), which covered all U.S. employees of the Company except those represented by a collective bargaining unit. The Company’s contributions were determined as a specified percentage of employee contributions, subject to certain maximum limitations. The Company’s costs for the defined contribution plan for 2009, 2008 and 2007 were $7.4 million, $8.3 million and $8.5 million, respectively.
The Company also had a statutory plan in the Netherlands that is not included in the amounts above. As of December 31, 2009, this plan had pension liabilities of $0.8 million.
16. Holdings Partnership Agreement
Holdings was formed under the name “Sonoco Graham Company” on April 3, 1989, as a limited partnership in accordance with the provisions of the Pennsylvania Uniform Limited Partnership Act, and on March 28, 1991, Holdings changed its name to “Graham Packaging Company.” Pursuant to an Agreement and Plan of Recapitalization, Redemption and Purchase, dated as of December 18, 1997 (the “Recapitalization Agreement”), (i) Holdings, (ii) the then owners of the Company (the “Graham Entities”) and (iii) GPC and BCP agreed to a recapitalization of Holdings (the “Recapitalization”). Closing under the Recapitalization Agreement occurred on February 2, 1998. Upon the closing of the Recapitalization, the name of Holdings was changed to “Graham Packaging Holdings Company.” Holdings will continue until its dissolution and winding up in accordance with the terms of the Holdings Partnership Agreement (as defined below).
As contemplated by the Recapitalization Agreement, the Graham Family (as successors and assigns of Graham Capital Corporation and Graham Family Growth Partnership), Graham GP Corp, GPC and BCP entered into a Fifth Amended and Restated Agreement of Limited Partnership (the “Holdings Partnership Agreement”). The general partners of the partnership, as of December 31, 2009, were BCP and Graham GP Corp, and the limited partners of the partnership were GPC Holdings, L.P., GPC and Roger M. Prevot.
Capital Accounts. A capital account is maintained for each partner on the books of Holdings. The Holdings Partnership Agreement provides that at no time during the term of the partnership or upon dissolution and liquidation thereof shall a limited partner with a negative balance in its capital account have any obligation to
96
Table of Contents
GRAHAM PACKAGING COMPANY INC.
NOTES TO CONSOLIDATED FINANCIAL STATEMENTS—(Continued)
DECEMBER 31, 2009
Holdings or the other partners to restore such negative balance. Items of partnership income or loss are allocated to the partners’ capital accounts in accordance with their percentage interests except as provided in Section 704(c) of the Internal Revenue Code with respect to contributed property where the allocations are made in accordance with the U.S. Treasury regulations thereunder.
Distributions. The Holdings Partnership Agreement requires certain tax distributions to be made if and when Holdings has taxable income. Other distributions shall be made in proportion to the partners’ respective percentage interests.
Transfers of Partnership Interests. The Holdings Partnership Agreement provides that, subject to certain exceptions including, without limitation, the transfer rights described below, general partners shall not withdraw from Holdings, resign as a general partner nor transfer their general partnership interests without the consent of all general partners, and limited partners shall not transfer their limited partnership interests.
If either Graham GP Corp. and/or GPC Holdings, L.P. (individually “Continuing Graham Partner” and collectively the “Continuing Graham Partners”) wishes to sell or otherwise transfer its partnership interests pursuant to a bona fide offer from a third party, Holdings and the Equity Investors must be given a prior opportunity to purchase such interests at the same purchase price set forth in such offer. If Holdings and the Equity Investors do not elect to make such purchase, then such Continuing Graham Partner may sell or transfer such partnership interests to such third party upon the terms set forth in such offer. If the Equity Investors wish to sell or otherwise transfer their partnership interests pursuant to a bona fide offer from a third party, the Continuing Graham Partners shall have a right to include in such sale or transfer a proportionate percentage of their partnership interests. If the Equity Investors (so long as they hold 51% or more of the partnership interests) wish to sell or otherwise transfer their partnership interests pursuant to a bona fide offer from a third party, the Equity Investors shall have the right to compel the Continuing Graham Partners to include in such sale or transfer a proportionate percentage of their partnership interests.
Dissolution. The Holdings Partnership Agreement provides that Holdings shall be dissolved upon the earliest of (i) the sale, exchange or other disposition of all or substantially all of Holdings’ assets, (ii) the withdrawal, resignation, filing of a certificate of dissolution or revocation of the charter or bankruptcy of a general partner, or the occurrence of any other event which causes a general partner to cease to be a general partner unless (a) the remaining general partner elects to continue the business or (b) if there is no remaining general partner, a majority-in-interest of the limited partners elect to continue the partnership, or (iii) such date as the partners shall unanimously elect.
97
Table of Contents
GRAHAM PACKAGING COMPANY INC.
NOTES TO CONSOLIDATED FINANCIAL STATEMENTS—(Continued)
DECEMBER 31, 2009
17. Comprehensive Income (Loss)
The components of accumulated other comprehensive income (loss), net of income taxes, consisted of:
| Cash Flow Hedges |
Pension Liability |
Cumulative Translation Adjustments |
Total Other Comprehensive Income(Loss) |
Total Other Comprehensive Income(Loss) Attributable to Noncontrolling Interests |
Total Other Comprehensive Income(Loss) Attributable to GPC Stockholders |
||||||||||||||||
| Balance at January 1, 2007 |
$ | 10,866 | $ | (5,289 | ) | $ | 25,457 | $ | 31,034 | — | 31,034 | ||||||||||
| Other comprehensive income |
(11,572 | ) | (3,670 | ) | 36,334 | 21,092 | — | 21,092 | |||||||||||||
| Balance at December 31, 2007 |
(706 | ) | (8,959 | ) | 61,791 | 52,126 | — | 52,126 | |||||||||||||
| Other comprehensive income |
(22,361 | ) | (29,028 | ) | (65,941 | ) | (117,330 | ) | — | (117,330 | ) | ||||||||||
| Balance at December 31, 2008 |
(23,067 | ) | (37,987 | ) | (4,150 | ) | (65,204 | ) | — | (65,204 | ) | ||||||||||
| Other comprehensive income |
10,111 | (1) | 10,432 | 19,579 | 40,122 | 6,041 | 34,081 | ||||||||||||||
| Balance at December 31, 2009 |
$ | (12,956 | ) | (27,555 | ) | 15,429 | (25,082 | ) | 6,041 | (31,123 | ) | ||||||||||
| (1) | Includes amortization of amounts in accumulated other comprehensive income (loss) as of the date the Company discontinued hedge accounting for its interest rate collar and swap agreements of $9.6 million (net of tax of $0). |
18. Option Plans
Options have been granted under the terms of the Graham Packaging Holdings Company Management Option Plan (the “1998 Option Plan”), the 2004 Graham Packaging Holdings Company Management Option Plan (the “2004 Option Plan”) and the 2008 Graham Packaging Holdings Company Management Option Plan (the “2008 Option Plan” and, collectively with the 1998 Option Plan and the 2004 Option Plan, the “Option Plans”).
The Option Plans provide for the grant to management employees of Holdings and its subsidiaries and non-employee Directors, advisors, consultants and other individuals providing services to Holdings of options (“Options”) to purchase limited partnership interests in Holdings (each interest being referred to as a “Unit”). The aggregate number of Units with respect to which Options may be granted under the 1998 Option Plan may not exceed 2,386,090 Units and the aggregate number of Units with respect to which Options may be granted at any time under the 2008 Option Plan, together with the 2004 Option Plan, may not exceed 4,834,196 Units, representing a total of up to 12.5% of the equity of Holdings as of December 31, 2009. A committee has been appointed to administer the Option Plans, including, without limitation, the determination of the individuals to whom grants will be made, the number of Units subject to each grant and the various terms of such grants.
Under the 1998 Option Plan and the 2004 Option Plan, the exercise price per Unit is or will be equal to or greater than the fair value of a Unit on the date of grant. Under the 2008 Option Plan, the exercise price per Unit is or will be less than, equal to, or greater than the fair value of a Unit on the date of grant, provided that there are limitations on exercise of any Option granted at less than fair value on the grant date. The Company determines the fair value of a Unit by considering market multiples of comparable public companies and recent transactions involving comparable public and private companies, and by performing discounted cash flow analyses on its projected cash flows. The Company utilizes the services of an appraisal firm to assist in these analyses. The number and type of Units covered by outstanding Options and exercise prices may be adjusted to reflect certain
98
Table of Contents
GRAHAM PACKAGING COMPANY INC.
NOTES TO CONSOLIDATED FINANCIAL STATEMENTS—(Continued)
DECEMBER 31, 2009
events such as recapitalizations, mergers or reorganizations of or by Holdings. The Option Plans are intended to advance the best interests of the Company by allowing such employees to acquire an ownership interest in the Company, thereby motivating them to contribute to the success of the Company and to remain in the employ of the Company.
In general, Options awarded under the 1998 Option Plan vest according to either a time-based component or time-based and performance-based components as follows: 50% of the Options vest and become exercisable in 20% increments annually over five years, so long as the holder of the Option is still an employee on the vesting date, and 50% of the Options vest and become exercisable in 20% increments annually over five years, so long as the Company achieves specified earnings targets for each year, although these Options do become exercisable in full without regard to the Company’s achievement of these targets on the ninth anniversary of the date of grant, so long as the holder of the Option is still an employee on that date.
In general, time-based options awarded under the 2004 Option Plan and the 2008 Option Plan vest and become exercisable in 25% increments annually over four years, so long as the holder of the Option is still an employee on the vesting date, and in limited circumstances, options have been granted under the 2004 Option Plan and the 2008 Option Plan with vesting subject to the additional requirement of the achievement of an earnings target. In some circumstances, options have been granted under the 2004 Option Plan and the 2008 Option Plan that vest contingent upon the employee’s continuous employment with the Company and the sale by Blackstone of its entire interest in the Company, with the vesting percentage based upon the multiple of invested capital Blackstone achieves in such a sale (“MOIC Options”). These MOIC Options have been amended to provide that the MOIC Options will vest in accordance with the multiple of the invested capital Blackstone achieves if the employee remains continuously employed with the Company through the date on which Blackstone sells 75% of its interest in the Company. Employees can also qualify for additional vesting if Blackstone achieves additional multiple of invested capital milestones upon subsequent sales of its interest in the Company provided that those employees remain employed through a date that precedes such subsequent sale by three months or less.
Generally, upon a holder’s termination, all unvested options are forfeited and vested options must be exercised within 90 days of the termination event, with variations based on the circumstances of termination.
Options awarded under the Option Plans have a term of ten years. In the past, the Company has amended the terms of specified options to extend their terms.
The weighted average fair value at date of grant for Options granted in 2009, 2008 and 2007 was $1.42, $2.81 and $1.67 per Option, respectively. The fair value of each Option was estimated on the date of the grant using a fair value option pricing model, with the following weighted-average assumptions:
| 2009 | 2008 | 2007 | |||||||
| Dividend yield |
0 | % | 0 | % | 0 | % | |||
| Expected volatility |
30 | % | 30 | % | 30 | % | |||
| Risk-free interest rate |
2.05 | % | 2.28 | % | 3.50 | % | |||
| Expected option life (in years) |
4.5 | 4.5 | 3.2 |
The Company estimates expected volatility based upon the volatility of the stocks of comparable public companies. The Company’s expected life of Options granted was based upon actual experience and expected employee turnover. The risk-free interest rate was based on the implied yield available on U.S. Treasury zero-coupon issues with a term equivalent to the expected life of the Options granted. The Company has not paid dividends in the past and does not plan to pay any dividends in the foreseeable future.
99
Table of Contents
GRAHAM PACKAGING COMPANY INC.
NOTES TO CONSOLIDATED FINANCIAL STATEMENTS—(Continued)
DECEMBER 31, 2009
A summary of the changes in the Options outstanding under the Option Plans during 2009 is as follows:
| Units Under Option |
Weighted Average Exercise Price |
Weighted Average Remaining Contractual Life |
Aggregate Intrinsic Value | ||||||||
| (In years) | (In millions) | ||||||||||
| Outstanding at beginning of year |
4,954,011 | $ | 8.46 | ||||||||
| Granted |
695,786 | 7.01 | |||||||||
| Exercised |
— | ||||||||||
| Forfeited (1) |
(836,682 | ) | 7.84 | ||||||||
| Outstanding at end of year |
4,813,115 | 8.35 | 7.2 | $ | 30.4 | ||||||
| Vested or expected to be vested at end of year |
4,036,176 | 8.55 | 7.0 | 24.7 | |||||||
| Exercisable at end of year |
2,983,180 | 8.61 | 6.7 | 18.1 | |||||||
| (1) | Pursuant to the employment agreement effective December 4, 2006, for Warren D. Knowlton, the Operating Company’s former Chief Executive Officer and former Executive Chairman, Mr. Knowlton received an option (the “Performance Option”) to purchase 559,275 limited partnership units in Holdings that vests upon (A) Blackstone’s sale of their entire interest in the Company and (B) the attainment of certain financial performance goals established by the Company. All of the limited partnership units in Holdings subject to Mr. Knowlton’s Performance Option were forfeited automatically when Mr. Knowlton ceased to be Chief Executive Officer and Executive Chairman of the Company. These 559,275 Options are reflected as “forfeited” in the table above. |
In 2009, the Company granted Options to purchase 695,786 limited partnership units in Holdings. As a result, the Company will incur incremental compensation expense of approximately $0.6 million over the four-year vesting period of the options. The incremental expense recorded during the year ended December 31, 2009, was $0.1 million.
As of December 31, 2009, there was $1.3 million of total unrecognized compensation cost related to outstanding Options that is expected to be recognized over a weighted average period of 2.4 years. For the year ended December 31, 2008, the Company received net proceeds of $0.2 million from the exercise of Options.
The intrinsic value of Options exercised for the year ended December 31, 2008, was $0.0 million.
19. Other (Income) Expense, Net
Other (income) expense, net consisted of the following:
| Year Ended December 31, | ||||||||||
| 2009 | 2008 | 2007 | ||||||||
| (In thousands) | ||||||||||
| Foreign exchange (gain) loss, net |
$ | (1,907 | ) | $ | 215 | $ | 1,917 | |||
| Other |
356 | 189 | 87 | |||||||
| $ | (1,551 | ) | $ | 404 | $ | 2,004 | ||||
100
Table of Contents
GRAHAM PACKAGING COMPANY INC.
NOTES TO CONSOLIDATED FINANCIAL STATEMENTS—(Continued)
DECEMBER 31, 2009
20. Income Taxes
The provision (benefit) for income taxes consisted of:
| Year Ended December 31, | ||||||||||||
| 2009 | 2008 | 2007 | ||||||||||
| (In thousands) | ||||||||||||
| Income (loss) from continuing operations before income taxes: |
||||||||||||
| U.S. |
$ | (5,256 | ) | $ | (78,705 | ) | $ | (198,874 | ) | |||
| Foreign |
56,004 | 44,265 | 15,489 | |||||||||
| Total |
$ | 50,748 | $ | (34,440 | ) | $ | (183,385 | ) | ||||
| Current provision: |
||||||||||||
| Federal |
$ | 393 | $ | 23 | $ | — | ||||||
| State and local |
849 | 527 | 234 | |||||||||
| Foreign |
16,690 | 11,495 | 17,026 | |||||||||
| Total current provision |
17,932 | 12,045 | 17,260 | |||||||||
| Deferred provision: |
||||||||||||
| Federal |
6,451 | (536 | ) | 2,260 | ||||||||
| State and local |
1,008 | 12 | (2,245 | ) | ||||||||
| Foreign |
1,623 | 1,456 | 3,041 | |||||||||
| Total deferred provision |
9,082 | 932 | 3,056 | |||||||||
| Total provision |
$ | 27,014 | $ | 12,977 | $ | 20,316 | ||||||
101
Table of Contents
GRAHAM PACKAGING COMPANY INC.
NOTES TO CONSOLIDATED FINANCIAL STATEMENTS—(Continued)
DECEMBER 31, 2009
The following table sets forth the deferred income tax assets and liabilities that result from temporary differences between the reported amounts and the tax bases of the assets and liabilities:
| December 31, | ||||||||
| 2009 | 2008 | |||||||
| (In thousands) | ||||||||
| Deferred income tax assets: |
||||||||
| Net operating loss carryforwards |
$ | 327,858 | $ | 329,687 | ||||
| Capital loss carryforwards |
7,784 | 7,657 | ||||||
| Fixed assets, due to differences in depreciation, impairment and assigned values |
4,476 | 5,530 | ||||||
| Accrued retirement indemnities |
3,177 | 2,966 | ||||||
| Inventories |
2,532 | 3,226 | ||||||
| Accruals and reserves |
18,677 | 15,230 | ||||||
| Deferred revenue |
7,261 | 6,957 | ||||||
| Tax credits |
10,755 | 11,222 | ||||||
| Other items |
5,616 | 5,964 | ||||||
| Gross deferred income tax assets |
388,136 | 388,439 | ||||||
| Valuation allowance |
(329,909 | ) | (361,582 | ) | ||||
| Net deferred income tax assets |
58,227 | 26,857 | ||||||
| Deferred income tax liabilities: |
||||||||
| Investment in partnership |
14,580 | 1,664 | ||||||
| Fixed assets, due to differences in depreciation, impairment and assigned values |
43,244 | 26,501 | ||||||
| Inventories |
492 | 531 | ||||||
| Amortizable intangibles, due to differences in amortization, impairment and assigned values |
13,824 | 9,320 | ||||||
| Unremitted earnings of foreign subsidiaries |
11,875 | 5,551 | ||||||
| Other items |
944 | 980 | ||||||
| Gross deferred income tax liabilities |
84,959 | 44,547 | ||||||
| Net deferred income tax liabilities |
$ | 26,732 | $ | 17,690 | ||||
Current deferred income tax liabilities of $6.3 million in 2009 and $3.8 million in 2008 are included in accrued expenses. Non-current deferred income tax assets of $0.8 million in 2009 and $3.5 million in 2008 are included in other non-current assets.
Pursuant to the requirements of ASC 740-10-30, “Establishment of a Valuation Allowance for Deferred Tax Assets,” we assess the realizability of deferred tax assets based on an evaluation of positive and negative evidence of future taxable income. The valuation allowance for deferred income tax assets of $329.9 million and $361.6 million at December 31, 2009 and 2008, respectively, relates principally to the uncertainty of realizing the benefits arising from tax loss and credit carryforwards. The Company believes that it will generate sufficient future taxable income to realize the income tax benefits related to the remaining deferred income tax asset. The valuation allowance decrease in 2009 primarily relates to current year income in the Company’s domestic subsidiaries and decreases in deferred tax assets associated with the sale of a French subsidiary.
102
Table of Contents
GRAHAM PACKAGING COMPANY INC.
NOTES TO CONSOLIDATED FINANCIAL STATEMENTS—(Continued)
DECEMBER 31, 2009
The difference between the actual income tax provision and an amount computed by applying the U.S. federal statutory rate for corporations to earnings before income taxes is attributable to the following:
| Year Ended December 31, | ||||||||||||
| 2009 | 2008 | 2007 | ||||||||||
| (In thousands) | ||||||||||||
| Taxes at U.S. federal statutory rate |
$ | 17,762 | $ | (12,054 | ) | $ | (64,185 | ) | ||||
| Partnership loss not subject to federal income taxes |
157 | 273 | 3,276 | |||||||||
| State income tax net of federal benefit |
1,207 | 350 | (1,307 | ) | ||||||||
| Permanent differences between tax and book accounting |
1,287 | 1,372 | 4,145 | |||||||||
| Prior year adjustments |
(941 | ) | 137 | 306 | ||||||||
| Tax contingencies |
(407 | ) | 5,011 | 9,654 | ||||||||
| Income taxed in multiple jurisdictions |
22,913 | 2,703 | 6,678 | |||||||||
| Change in valuation allowance |
(14,242 | ) | 19,081 | 61,193 | ||||||||
| Tax credits |
(1,813 | ) | (4,191 | ) | 2,403 | |||||||
| Other |
1,091 | 295 | (1,847 | ) | ||||||||
| $ | 27,014 | $ | 12,977 | $ | 20,316 | |||||||
As of December 31, 2009, the Company’s domestic subsidiaries have U.S. federal net operating loss carryforwards of approximately $692.1 million. These net operating loss carryforwards are available to offset future taxable income and expire in the years 2017 through 2029. The Company also has various state net operating loss carryforwards that expire through 2029. The determination of the state net operating loss carryforwards is dependent upon the subsidiaries’ taxable income or loss, apportionment percentages and other respective state laws that can change from year to year and impact the amount of such carryforward. The Company’s international operating subsidiaries have, in the aggregate, approximately $185.3 million of tax loss carryforwards available as of December 31, 2009. These losses are available to reduce the originating subsidiaries’ future taxable foreign income and have varying expiration dates. The loss carryforwards relating to the Company’s French subsidiaries ($155.5 million), UK subsidiaries ($4.4 million), and Brazilian subsidiaries ($11.4 million) have no expiration date. The remainder of the foreign loss carryforwards have expiration dates ranging from 2010 through 2019. The Company has $21.9 million of capital loss carryforwards which are available to offset future capital gains and expire in the years 2011-2013. Additionally, the Company’s Canadian subsidiary has $0.5 million of capital loss carryforwards that have no expiration date.
As of December 31, 2009, the Company’s domestic subsidiaries had federal and state income tax credit carryforwards of approximately $7.4 million consisting of $1.9 million of Alternative Minimum Tax credits which never expire, $4.3 million of federal research and development credits and other general business credits which expire in the years 2010 through 2024 and $1.2 million of state tax credits with varying expiration dates. The Company’s subsidiaries in Mexico and Argentina have tax credit carryforwards of $3.2 million and $0.6 million, respectively, which expire in the years 2010 through 2019.
As of December 31, 2009, the Company’s equity in the undistributed earnings of foreign subsidiaries which are deemed to be permanently reinvested, and for which income taxes had not been provided, was $14.5 million. It is not practical to determine the related deferred tax liability.
The Company adopted ASC 740-10-25, “Basic Recognition Threshold,” effective January 1, 2007. This guidance prescribes a recognition threshold of more-likely-than-not for recognition of tax benefits. The transition adjustments of $4.8 million were shown as a reduction to retained earnings.
103
Table of Contents
GRAHAM PACKAGING COMPANY INC.
NOTES TO CONSOLIDATED FINANCIAL STATEMENTS—(Continued)
DECEMBER 31, 2009
The following table summarizes the activity related to the gross unrecognized tax benefits (“UTB”) from January 1, 2007, through December 31, 2009:
| December 31, | ||||||||||||
| 2009 | 2008 | 2007 | ||||||||||
| (In thousands) | ||||||||||||
| Balance at beginning of year |
$ | 52,246 | $ | 41,817 | $ | 25,232 | ||||||
| Increases related to prior year tax positions |
30 | 1,304 | 5,044 | |||||||||
| Decreases related to prior year tax positions |
(7,542 | ) | (156 | ) | — | |||||||
| Increases related to current year tax positions |
6,788 | 11,328 | 11,645 | |||||||||
| Decreases related to settlements with taxing authorities |
— | (52 | ) | — | ||||||||
| Decreases related to lapsing of statute of limitations |
(1,059 | ) | (1,128 | ) | (104 | ) | ||||||
| Currency translation adjustments |
240 | (867 | ) | — | ||||||||
| Balance at end of year |
$ | 50,703 | $ | 52,246 | $ | 41,817 | ||||||
Offsetting long-term deferred income tax assets in the amount of $14.6 million, $18.8 million and $15.3 million at December 31, 2009, 2008 and 2007, respectively, are not reflected in the gross UTB balance above. Approximately $9.0 million of UTB at December 31, 2009, $10.9 million of UTB at December 31, 2008, and $12.4 million at December 31, 2007, if recognized, would impact the Company’s effective tax rate.
The Company operates and files income tax returns in the U.S. federal jurisdiction and in many state and foreign jurisdictions. Its tax returns are periodically audited by domestic and foreign tax authorities. The Company is currently under examination by various state and foreign authorities. The U.S. corporate subsidiaries have open tax years from 2004 forward for certain state purposes. The Company generally has open tax years subject to audit scrutiny of three to five years in Europe and six years in Mexico and South America. The Company does not expect a significant change in the UTB balance in the next twelve months.
Upon adoption of ASC 740-10-25, the Company has elected to begin treating interest and penalties related to taxes as a component of income tax expense. As of December 31, 2009, 2008 and 2007, the Company has recorded UTB of $5.6 million, $6.0 million and $7.5 million, respectively, related to interest and penalties, all of which, if recognized, would affect the Company’s effective tax rate. During the year ended December 31, 2009, the Company recorded a tax benefit related to a decrease in UTB for interest and penalties of $0.4 million. The Company’s prior policy was to treat interest related to tax issues as interest expense and to record penalties as other expense.
Cash income tax payments of $19.2 million, $9.3 million and $18.3 million were made for income tax liabilities in 2009, 2008 and 2007, respectively.
21. Commitments
In connection with plant expansion and improvement programs, the Company had commitments for capital expenditures of approximately $24.3 million at December 31, 2009.
The Company is a party to various capital and operating leases involving real property and equipment. Lease agreements may include escalating rent provisions and rent holidays, which are expensed on a straight-line basis over the term of the lease. Total rent expense for operating leases was $50.3 million, $52.0 million and $54.8 million for the years ended December 31, 2009, 2008 and 2007, respectively.
104
Table of Contents
GRAHAM PACKAGING COMPANY INC.
NOTES TO CONSOLIDATED FINANCIAL STATEMENTS—(Continued)
DECEMBER 31, 2009
Minimum future lease obligations on long-term noncancelable operating leases in effect at December 31, 2009, were as follows (in thousands):
| 2010 |
$ | 31,029 | |
| 2011 |
25,645 | ||
| 2012 |
19,677 | ||
| 2013 |
17,830 | ||
| 2014 |
15,671 | ||
| Thereafter |
40,785 |
Minimum future lease obligations on capital leases in effect at December 31, 2009, were as follows (in thousands):
| 2010 |
$ | 10,414 | |
| 2011 |
6,082 | ||
| 2012 |
540 | ||
| 2013 |
3 | ||
| 2014 |
— | ||
| Thereafter |
— |
The gross amount of assets under capital leases was $51.3 million and $54.6 million as of December 31, 2009 and 2008, respectively. The deferred rent liability relating to escalating rent provisions and rent holidays was $2.2 million and $2.5 million as of December 31, 2009 and 2008, respectively.
The Company has entered into agreements with an unrelated third-party for the financing of specific accounts receivable of certain foreign subsidiaries. The financing of accounts receivable under these agreements is accounted for as a sale of receivables in accordance with ASC 860-20, “Sale of Financial Assets.” Under the terms of the financing agreements, the Company transfers ownership of eligible accounts receivable without recourse to the third-party purchaser in exchange for cash. Proceeds on the transfer reflect the face value of the accounts receivable less a discount. The discount is recorded against net sales on the consolidated statement of operations in the period of the sale. The eligible receivables financed pursuant to this factoring agreement are excluded from accounts receivable on the consolidated balance sheet and are reflected as cash provided by operating activities on the consolidated statement of cash flows, while non-eligible receivables remain on the balance sheet with a corresponding liability established when those receivables are financed. The Company does not continue to service, administer and collect the eligible receivables under this program. The third-party purchaser has no recourse to the Company for failure of debtors constituting eligible receivables to pay when due. The Company maintains insurance on behalf of the third-party purchaser to cover any losses due to the failure of debtors constituting eligible receivables to pay when due. At December 31, 2009 and 2008, the Company had sold $15.7 million and $29.9 million of eligible accounts receivable, respectively, which represent the face amounts of total outstanding receivables at those dates.
Under the Fifth Amended and Restated Limited Partnership Agreement and the Amended and Restated Monitoring Agreement, the Company was obligated to make annual payments of $2.0 million and $3.0 million to affiliates of the Graham Family and Blackstone, respectively.
105
Table of Contents
GRAHAM PACKAGING COMPANY INC.
NOTES TO CONSOLIDATED FINANCIAL STATEMENTS—(Continued)
DECEMBER 31, 2009
22. Contingencies and Legal Proceedings
On November 3, 2006, the Company filed a complaint with the Supreme Court of the State of New York, New York County, against Owens-Illinois, Inc. and OI Plastic Products FTS, Inc. (collectively, “OI”). The complaint alleges certain misrepresentations by OI in connection with the Company’s 2004 purchase of O-I Plastic and seeks damages in excess of $30 million. In December 2006, OI filed an Answer and Counterclaim, seeking to rescind a Settlement Agreement entered into between OI and the Company in April 2005, and disgorgement of more than $39 million paid by OI to the Company in compliance with that Settlement Agreement. The Company filed a Motion to Dismiss the Counterclaim in July 2007, which was granted by the Court in October 2007. On August 1, 2007, the Company filed an Amended Complaint to add additional claims seeking indemnification from OI for claims made against the Company by former OI employees pertaining to their pension benefits. These claims arise from an arbitration between the Company and Glass, Molders, Pottery, Plastic & Allied Workers, Local #171 (the “Union”) that resulted in an award on April 23, 2007, in favor of the Union. The Arbitrator ruled that the Company had failed to honor certain pension obligations for past years of service to former employees of OI, whose seven Union-represented plants were acquired by the Company in October 2004. In the Amended Complaint, the Company maintains that under Section 8.2 of the Stock Purchase Agreement between the Company and OI, OI is obligated to indemnify the Company for any losses associated with differences in two of the Company’s pension plans including any losses incurred in connection with the Arbitration award. The litigation is proceeding.
On April 10, 2009, OnTech Operations, Inc. (“OnTech”) initiated an arbitration proceeding against the Company, in which OnTech alleges that the Company breached a bottle purchase agreement dated April 28, 2008, and an equipment lease dated June 1, 2008. In its statement of claims, OnTech alleges, among other things, that the Company’s failure to produce bottles as required by the bottle purchase agreement resulted in the failure of OnTech’s business. As a result, OnTech is seeking to recover the value of its business, which it alleges is between $80 million and $150 million, which is in excess of 10% of the Company’s current assets. The arbitration is currently scheduled to be heard by a three arbitrator panel from August 2, 2010, to August 6, 2010.
The Company believes that OnTech’s claims are without legal, contractual or factual merit. The Company is vigorously defending against these claims and feels that the likelihood of it not prevailing is remote. Accordingly, the Company has not accrued a loss on this claim.
The Company is a party to various other litigation matters arising in the ordinary course of business. The ultimate legal and financial liability of the Company with respect to such litigation cannot be estimated with certainty, but management believes, based on its examination of these matters, experience to date and discussions with counsel, that ultimate liability from the Company’s various litigation matters will not be material to the business, financial condition, results of operations or cash flows of the Company.
106
Table of Contents
GRAHAM PACKAGING COMPANY INC.
NOTES TO CONSOLIDATED FINANCIAL STATEMENTS—(Continued)
DECEMBER 31, 2009
23. Segment Information
The Company is organized and managed on a geographical basis in three operating segments: North America, Europe and South America. The accounting policies of the segments are consistent with those described in Note 1. The Company’s measure of segment profit or loss is operating income. Segment information for the three years ended December 31, 2009, representing the reportable segments currently utilized by the chief operating decision makers, was as follows:
| Year | North America |
Europe | South America |
Eliminations (a) | Total | ||||||||||||||
| (In thousands) | |||||||||||||||||||
| Net sales (b)(c) |
2009 | $ | 1,942,747 | $ | 235,766 | $ | 92,771 | $ | (250 | ) | $ | 2,271,034 | |||||||
| 2008 | 2,196,048 | 274,382 | 89,747 | (1,223 | ) | 2,558,954 | |||||||||||||
| 2007 | 2,140,470 | 256,841 | 75,471 | (1,897 | ) | 2,470,885 | |||||||||||||
| Operating income (loss) |
2009 | $ | 210,990 | $ | 31,777 | $ | (9,086 | ) | $ | — | $ | 233,681 | |||||||
| 2008 | 119,648 | 30,181 | (4,627 | ) | — | 145,202 | |||||||||||||
| 2007 | 19,182 | 8,175 | 764 | — | 28,121 | ||||||||||||||
| Depreciation and amortization |
2009 | $ | 136,929 | $ | 17,902 | $ | 3,788 | $ | — | $ | 158,619 | ||||||||
| 2008 | 149,765 | 20,492 | 5,268 | — | 175,525 | ||||||||||||||
| 2007 | 176,317 | 20,887 | 4,511 | — | 201,715 | ||||||||||||||
| Asset impairment charges |
2009 | $ | 31,512 | $ | 3,918 | $ | 6,396 | $ | — | $ | 41,826 | ||||||||
| 2008 | 86,861 | 3,534 | 5,669 | — | 96,064 | ||||||||||||||
| 2007 | 137,900 | 18,150 | 1,642 | — | 157,692 | ||||||||||||||
| Interest expense, net |
2009 | $ | 171,647 | $ | 1,183 | $ | 2,928 | $ | — | $ | 175,758 | ||||||||
| 2008 | 174,128 | 2,678 | 2,432 | — | 179,238 | ||||||||||||||
| 2007 | 199,903 | 3,193 | 1,877 | — | 204,973 | ||||||||||||||
| Income tax provision (benefit) |
2009 | $ | 16,433 | $ | 9,535 | $ | 1,046 | $ | — | $ | 27,014 | ||||||||
| 2008 | 3,569 | 9,560 | (152 | ) | — | 12,977 | |||||||||||||
| 2007 | 10,206 | 9,481 | 629 | — | 20,316 | ||||||||||||||
| Identifiable assets (b)(c)(d) |
2009 | $ | 830,897 | $ | 138,053 | $ | 48,828 | $ | — | $ | 1,017,778 | ||||||||
| 2008 | 872,465 | 151,142 | 38,665 | — | 1,062,272 | ||||||||||||||
| Goodwill |
2009 | $ | 420,765 | $ | 16,286 | $ | 7 | $ | — | $ | 437,058 | ||||||||
| 2008 | 418,784 | 15,826 | 35 | — | 434,645 | ||||||||||||||
| Cash paid for property, plant and equipment |
2009 | $ | 119,875 | $ | 13,529 | $ | 12,607 | $ | — | $ | 146,011 | ||||||||
| 2008 | 116,442 | 20,767 | 11,367 | — | 148,576 | ||||||||||||||
| 2007 | 123,617 | 20,584 | 9,184 | — | 153,385 | ||||||||||||||
| (a) | To eliminate intercompany transactions. |
| (b) | The Company’s net sales for Europe include countries having significant sales as follows: |
| Year Ended December 31, | |||||||||
| 2009 | 2008 | 2007 | |||||||
| (In millions) | |||||||||
| Poland |
$ | 49.3 | $ | 63.7 | $ | 59.5 | |||
| Belgium |
54.9 | 57.4 | 51.1 | ||||||
| Spain |
40.6 | 40.8 | 38.2 | ||||||
| France |
24.3 | 34.4 | 34.5 | ||||||
107
Table of Contents
GRAHAM PACKAGING COMPANY INC.
NOTES TO CONSOLIDATED FINANCIAL STATEMENTS—(Continued)
DECEMBER 31, 2009
The Company’s identifiable assets for Europe include countries having significant identifiable assets as follows:
| December 31, | ||||||
| 2009 | 2008 | |||||
| (In millions) | ||||||
| Poland |
$ | 36.6 | $ | 37.7 | ||
| Belgium |
31.9 | 33.6 | ||||
| Spain |
23.6 | 27.6 | ||||
| France |
15.3 | 19.9 | ||||
| (c) | The Company’s net sales for North America include sales in Mexico which totaled approximately $147.3 million, $150.4 million and $138.4 million for the years ended December 31, 2009, 2008 and 2007, respectively. Identifiable assets in Mexico totaled approximately $58.8 million and $51.6 million as of December 31, 2009 and 2008, respectively. Approximately all of the North America reportable segment’s remaining net sales and identifiable assets are in the United States. |
| (d) | Represents property, plant and equipment, net. |
Product Net Sales Information
The following is supplemental information on net sales by product category:
| Food and Beverage |
Household | Automotive Lubricants |
Personal Care/ Specialty |
Total | |||||||||||
| (In thousands) | |||||||||||||||
| 2009 |
$ | 1,385,544 | $ | 423,004 | $ | 291,208 | $ | 171,278 | $ | 2,271,034 | |||||
| 2008 |
1,561,273 | 491,641 | 319,253 | 186,787 | 2,558,954 | ||||||||||
| 2007 |
1,488,699 | 499,101 | 277,874 | 205,211 | 2,470,885 | ||||||||||
24. Environmental Matters
As a result of the Company closing its plant located in Edison, New Jersey, the Company is subject to New Jersey’s Industrial Site Recovery Act (“ISRA”). The Company acquired this facility from Owens-Illinois, Inc. in 2004. ISRA is an environmental law that specifies a process of reporting to the New Jersey Department of Environmental Protection (“NJDEP”) and, in some situations, investigating, cleaning up and/or taking other measures with respect to environmental conditions that may exist at an industrial establishment that has been shut down or is being transferred. The Company is in the process of evaluating and implementing its obligations under ISRA regarding this facility. The Company has recorded a preliminary reserve of $0.4 million for this obligation. This amount may change based on results of additional investigation expected to be undertaken for NJDEP.
108
Table of Contents
GRAHAM PACKAGING COMPANY INC.
NOTES TO CONSOLIDATED FINANCIAL STATEMENTS—(Continued)
DECEMBER 31, 2009
25. Earnings (Loss) Per Share
The following are reconciliations of income from continuing operations, loss from discontinued operations and net income attributable to GPC stockholders used to calculate basic and diluted earnings per share.
The following summarizes earnings per share for the year ended December 31, 2009:
| As Reported |
Attributable to Noncontrolling Interests (1) |
Attributable to GPC Stockholders for Computation of Basic Earnings Per Share |
Adjustment for Potentially Dilutive Options to Purchase Partnership Units (2) |
Adjusted for Computation of Diluted Earnings Per Share |
||||||||||||||||
| Numerator: |
||||||||||||||||||||
| Income from continuing operations |
$ | 23,734 | $ | (4,602 | ) | $ | 19,132 | $ | (273 | ) | $ | 18,859 | ||||||||
| Loss from discontinued operations |
(9,481 | ) | 1,428 | (8,053 | ) | 85 | (7,968 | ) | ||||||||||||
| Net income |
$ | 14,253 | $ | (3,174 | ) | $ | 11,079 | $ | (188 | ) | $ | 10,891 | ||||||||
| Denominator: |
||||||||||||||||||||
| Weighted average number of GPC shares outstanding (3) |
42,981,204 | 42,985,179 | ||||||||||||||||||
| Basic | Diluted | |||||||||||||||||||
| Earnings per share: |
||||||||||||||||||||
| Income from continuing operations |
$ | 0.45 | $ | 0.44 | ||||||||||||||||
| Loss from discontinued operations |
(0.19 | ) | (0.19 | ) | ||||||||||||||||
| Net income attributable to GPC stockholders |
$ | 0.26 | $ | 0.25 | ||||||||||||||||
The following summarizes earnings per share for the year ended December 31, 2008:
| As Reported |
Attributable to Noncontrolling Interests (1) |
Attributable to GPC Stockholders for Computation of Basic Earnings Per Share |
Adjustment for Potentially Dilutive Options to Purchase Partnership Units (2) |
Adjusted for Computation of Diluted Earnings Per Share |
||||||||||||||
| Numerator: |
||||||||||||||||||
| Loss from continuing operations |
$ | (47,417 | ) | $ | — | $ | (47,417 | ) | $ | — | $ | (47,417 | ) | |||||
| Loss from discontinued operations |
(10,506 | ) | — | (10,506 | ) | — | (10,506 | ) | ||||||||||
| Net loss |
$ | (57,923 | ) | $ | — | $ | (57,923 | ) | $ | — | $ | (57,923 | ) | |||||
| Denominator: |
||||||||||||||||||
| Weighted average number of GPC shares outstanding (4) |
42,975,419 | 42,975,419 | ||||||||||||||||
| Basic | Diluted | |||||||||||||||||
| Loss per share: |
||||||||||||||||||
| Loss from continuing operations |
$ | (1.10 | ) | $ | (1.10 | ) | ||||||||||||
| Loss from discontinued operations |
(0.25 | ) | (0.25 | ) | ||||||||||||||
| Net loss attributable to GPC stockholders |
$ | (1.35 | ) | $ | (1.35 | ) | ||||||||||||
109
Table of Contents
GRAHAM PACKAGING COMPANY INC.
NOTES TO CONSOLIDATED FINANCIAL STATEMENTS—(Continued)
DECEMBER 31, 2009
The following summarizes earnings per share for the year ended December 31, 2007:
| As Reported |
Attributable to Noncontrolling Interests (1) |
Attributable to GPC Stockholders for Computation of Basic Earnings Per Share |
Adjustment for Potentially Dilutive Options to Purchase Partnership Units (2) |
Adjusted for Computation of Diluted Earnings Per Share |
||||||||||||||
| Numerator: |
||||||||||||||||||
| Loss from continuing operations |
$ | (203,701 | ) | $ | — | $ | (203,701 | ) | $ | — | $ | (203,701 | ) | |||||
| Loss from discontinued operations |
(3,655 | ) | — | (3,655 | ) | — | (3,655 | ) | ||||||||||
| Net loss |
$ | (207,356 | ) | $ | — | $ | (207,356 | ) | $ | — | $ | (207,356 | ) | |||||
| Denominator: |
||||||||||||||||||
| Weighted average number of GPC shares outstanding (4) |
42,975,419 | 42,975,419 | ||||||||||||||||
| Basic | Diluted | |||||||||||||||||
| Loss per share: |
||||||||||||||||||
| Loss from continuing operations |
$ | (4.74 | ) | $ | (4.74 | ) | ||||||||||||
| Loss from discontinued operations |
(0.09 | ) | (0.09 | ) | ||||||||||||||
| Net loss attributable to GPC stockholders |
$ | (4.83 | ) | $ | (4.83 | ) | ||||||||||||
| (1) | The allocation of earnings is based on the noncontrolling interests’ relative ownership percentage. |
| (2) | Holdings adjustment is based on incremental earnings that would be attributable to those potentially dilutive options to purchase partnership units on an “as-if converted” basis. For the years ended December 31, 2009, 2008 and 2007, 721,828, 4,954,011 and 5,469,346 potential options to purchase partnership units, respectively, have been excluded as the options are either antidilutive or as a result of the related contingencies not being met as of the reporting dates. Regarding contingencies, there are two types of options that contain contingencies: (1) those which vest and become exercisable upon the attainment of certain financial performance goals associated with a sale of Blackstone’s entire interest in the Company, and (2) those which vest and become exercisable upon Holdings’ achievement of specified earnings targets. |
| (3) | Reflects 3,975 incremental shares calculated using the treasury stock method. |
| (4) | As of December 31, 2008 and 2007, respectively, there were no potentially dilutive common stock equivalents outstanding regarding GPC shares. Accordingly, the number of basic and diluted weighted average shares outstanding is the same. |
26. Capital Stock
The authorized capital stock of the Company consisted of 500,000,000 shares of $0.01 par value common stock and 100,000,000 shares of $0.01 par value preferred stock. There were 0 shares of preferred stock issued and outstanding for each of the years ended December 31, 2009, 2008 and 2007. There were 42,998,786, 42,975,419 and 42,975,419 shares of common stock issued and outstanding for the years ended December 31, 2009, 2008 and 2007, respectively.
110
Table of Contents
GRAHAM PACKAGING COMPANY INC.
NOTES TO CONSOLIDATED FINANCIAL STATEMENTS—(Continued)
DECEMBER 31, 2009
27. Interim Financial Results (Unaudited)
| 2009 | ||||||||||||||||
| First Quarter |
Second Quarter |
Third Quarter |
Fourth Quarter |
Total | ||||||||||||
| (In thousands except per share data) | ||||||||||||||||
| STATEMENT OF OPERATIONS DATA: |
||||||||||||||||
| Net sales |
$ | 561,851 | $ | 585,714 | $ | 588,803 | $ | 534,666 | $ | 2,271,034 | ||||||
| Gross profit |
$ | 93,576 | $ | 112,693 | $ | 111,799 | $ | 86,381 | $ | 404,449 | ||||||
| Income (loss) from continuing operations |
$ | 17,170 | $ | 34,570 | $ | 13,084 | $ | (41,090 | ) | $ | 23,734 | |||||
| Net income (loss) |
$ | 16,843 | $ | 33,091 | $ | 10,966 | $ | (46,647 | ) | $ | 14,253 | |||||
| Net income (loss) attributable to noncontrolling interests |
$ | 2,826 | $ | 5,262 | $ | 1,930 | $ | (6,844 | ) | $ | 3,174 | |||||
| Net income (loss) attributable to Graham Packaging Company Inc. stockholders |
$ | 14,017 | $ | 27,829 | $ | 9,036 | $ | (39,803 | ) | $ | 11,079 | |||||
| Earnings per share: |
||||||||||||||||
| Net income (loss) attributable to Graham Packaging Company Inc. stockholders per share (1): |
||||||||||||||||
| Basic |
$ | 0.33 | $ | 0.65 | $ | 0.21 | $ | (0.93 | ) | $ | 0.26 | |||||
| Diluted |
$ | 0.33 | $ | 0.65 | $ | 0.21 | $ | (0.93 | ) | $ | 0.25 | |||||
111
Table of Contents
GRAHAM PACKAGING COMPANY INC.
NOTES TO CONSOLIDATED FINANCIAL STATEMENTS—(Continued)
DECEMBER 31, 2009
| 2008 | |||||||||||||||||
| First Quarter |
Second Quarter |
Third Quarter |
Fourth Quarter |
Total | |||||||||||||
| (In thousands except per share data) | |||||||||||||||||
| STATEMENT OF OPERATIONS DATA: |
|||||||||||||||||
| Net sales |
$ | 663,334 | $ | 680,964 | $ | 659,127 | $ | 555,529 | $ | 2,558,954 | |||||||
| Gross profit |
$ | 93,747 | $ | 107,980 | $ | 100,179 | $ | 73,762 | $ | 375,668 | |||||||
| Income (loss) from continuing operations |
$ | 4,407 | $ | 28,745 | $ | 5,662 | $ | (86,231 | ) | $ | (47,417 | ) | |||||
| Net income (loss) |
$ | 3,537 | $ | 28,110 | $ | 5,460 | $ | (95,030 | ) | $ | (57,923 | ) | |||||
| Net income (loss) attributable to noncontrolling interests |
$ | — | $ | — | $ | — | $ | — | $ | — | |||||||
| Net income (loss) attributable to Graham Packaging Company Inc. stockholders |
$ | 3,537 | $ | 28,110 | $ | 5,460 | $ | (95,030 | ) | $ | (57,923 | ) | |||||
| Earnings per share: |
|||||||||||||||||
| Net income (loss) attributable to Graham Packaging Company Inc. stockholders per share (1): |
|||||||||||||||||
| Basic |
$ | 0.08 | $ | 0.65 | $ | 0.13 | $ | (2.21 | ) | $ | (1.35 | ) | |||||
| Diluted |
$ | 0.08 | $ | 0.64 | $ | 0.12 | $ | (2.21 | ) | $ | (1.35 | ) | |||||
| (1) | Net income (loss) attributable to Graham Packaging Company Inc. stockholders per share may not necessarily total to the yearly income (loss) per share due to the weighting of shares outstanding on a quarterly and year-to-date basis. |
112
Table of Contents
GRAHAM PACKAGING COMPANY INC.
NOTES TO CONSOLIDATED FINANCIAL STATEMENTS—(Continued)
DECEMBER 31, 2009
28. Subsequent Event
On February 10, 2010, GPC completed its IPO and on February 11, 2010, its stock began trading on the New York Stock Exchange under the symbol “GRM.” In connection with the IPO, GPC, on February 4, 2010, increased the number of authorized shares of common stock to 500,000,000 and of preferred stock to 100,000,000, and effected a 1,465.4874-for-one stock split of its shares of common stock. Additionally, Holdings effected a 3,781.4427-for-one unit split and the limited partnership agreement of Holdings has been amended and restated as the Sixth Amended and Restated Limited Partnership Agreement (the “Partnership Agreement”). Pursuant to the Partnership Agreement, the partnership interests in Holdings have been denominated as limited partnership units and general partnership units with no change in relative economic ownership percentages prior to the IPO.
On February 17, 2010, and in connection with the IPO, GPC purchased from Holdings 16,666,667 newly-issued, unregistered limited partnership units for an aggregate amount of $114.2 million. On February 17, 2010, a portion of these net proceeds, and cash on hand, was used to pay a portion of the Term Loan B and Term Loan C. An aggregate of $115.1 million of the Term Loans was repaid, of which $19.4 million was allocated to repay principal and accrued interest on Term Loan B and $95.7 million was allocated to repay principal and accrued interest on Term Loan C. Additionally, as part of the IPO, the Graham Family entered into an Exchange Agreement as described below, and exercised their rights to exchange approximately 1.3 million units in Holdings for shares of GPC common stock.
Following these events:
| • | GPC now owns 58,966,881 limited partnership units, representing an 87.6% limited partnership interest, and its wholly owned subsidiary, BCP, is the sole general partner and owns 2,023,472 general partnership units, representing a 3.0% ownership in Holdings; |
| • | general partnership interests of the Graham Family have been converted into limited partnership interests on an equivalent basis such that the Graham Family owns an aggregate of 6,263,121 limited partnership units, representing a 9.3% limited partnership interest in Holdings; and |
| • | current and former directors and employees own 35,167 limited partnership units and options to acquire an aggregate of 4,746,940 limited partnership units in Holdings. |
The Partnership Agreement also provides that for so long as the Graham Family retains at least one-third of their partnership interests held as of February 2, 1998 (or equivalent common stock of GPC for which such partnership interests have been or are eligible to be exchanged), they are entitled to an advisory fee of $1.0 million annually for ongoing management and advisory services.
Income Tax Receivable Agreement
Also on February 10, 2010, GPC entered into separate Income Tax Receivable Agreements (“ITRs”) with pre-IPO stockholders and with GPC Holdings, L.P. (“GPCL”). The agreements provide for the payment by GPC to all of its pre-IPO stockholders (e.g. Blackstone, management and other stockholders) and to the Graham Family of 85% of the amount of cash savings, if any, in U.S. federal, state and local income tax that is actually realized (or are deemed to realize in the case of an early termination or change in control as further defined by the ITRs) as a result of the utilization of net operating losses attributable to periods prior to the IPO, and any increase to the tax basis of the assets of the Company related to (1) the 1998 acquisition of Holdings and (2) future exchanges by the Graham Family of their units for common stock of GPC pursuant to the Exchange Agreement, and of certain other tax benefits related to GPC’s entering into the ITRs, including tax benefits attributable to payments under the ITRs.
113
Table of Contents
GRAHAM PACKAGING COMPANY INC.
NOTES TO CONSOLIDATED FINANCIAL STATEMENTS—(Continued)
DECEMBER 31, 2009
The Company expects that the payments that it makes under these income tax receivable agreements will be material. Assuming no material changes in the relevant tax law, and that the Company earn sufficient taxable income to realize the full tax benefits subject to the income tax receivable agreements, it expect that future payments under the income tax receivable agreements will aggregate to between $190 million to $240 million with potential additional payments for tax basis step-ups relating to future exchanges by the Graham Family of their limited partnership units in Holdings for GPC common stock depending on the timing and value of such exchanges. This range is based on the Company’s assumptions using presently available information including with respect to valuation, historic tax basis and the amount of tax attributes subject to the income tax receivable agreements that were in existence as of the IPO date. Such amounts may differ materially from the amounts presented above based on various items, including final valuation analysis and updated determinations of taxable income and historic tax basis amounts. The payments under the income tax receivable agreements are not conditioned upon these parties’ continued ownership of the Company or Holdings. The Company will recognize such obligations based on the amount of recorded net deferred income tax assets recognized, and subject to the income tax receivable agreements. Changes in the recorded net deferred income tax assets will result in changes in the income tax receivable agreement obligations, and such changes will be recorded as other income or expense.
Because GPC is a holding company with no operations of its own, its ability to make payments is dependent on the ability of Holdings to make distributions. The Company’s credit agreements and outstanding notes generally restrict the ability to make distributions. To the extent the Company is unable to make payments under the ITRs for any reason, such payments will be deferred and will accrue interest at a rate of LIBOR plus five percent per annum until paid, provided that a failure to make a payment due pursuant to the terms of the ITRs within six months of the date such payment is due will generally constitute a breach, and payments under the ITRs would then be accelerated.
Exchange Agreement
Under the Exchange Agreement, the Graham Family and certain permitted transferees may, subject to specific terms, exchange their limited partnership units in Holdings for shares of GPC’s common stock at any time and from time to time on a one-for-one basis, subject to customary conversion rate adjustments for splits, stock dividends and reclassifications.
Under this Exchange Agreement, through February 18, 2010, entities controlled by the Graham Family and certain of their permitted transferees exercised their rights to exchange 1,324,900 limited partnership units of Holdings for 1,324,900 shares of GPC’s common stock. As a result of this exchange, entities controlled by the Graham Family own limited partnership units representing 9.6% of the limited partnership interests in Holdings and shares representing 2.2% of GPC’s common stock.
The Company has also entered into Management Exchange Agreements which provide for similar rights to management to exchange limited partnership units of Holdings obtained on exercise of outstanding options for shares of GPC common stock.
Registration Rights Agreement
Under the Registration Rights Agreement certain parties have been granted rights with respect to shares of GPC common stock, either held by them or received upon the exchange of limited partnership units of Holdings. The Registration Rights Agreement provides (1) to the Graham Family and their affiliates (and their permitted
114
Table of Contents
GRAHAM PACKAGING COMPANY INC.
NOTES TO CONSOLIDATED FINANCIAL STATEMENTS—(Continued)
DECEMBER 31, 2009
transferees) of partnership interests in the Company two “demand” registrations at any time and customary “piggyback” registration rights and (2) to Blackstone, an unlimited number of “demand” registrations and customary “piggyback” registration rights. In addition, the Registration Rights Agreement provides that the Graham Family and their affiliates may request that the Company file a shelf registration statement beginning on the 181st day after the IPO. The Graham Family and their affiliates may also request that the Company will pay certain expenses of the Graham Family, Blackstone and their affiliates and certain other investors relating to such registrations and indemnify them against certain liabilities, which may arise under the Securities Act of 1933, as amended.
Termination of the Amended and Restated Monitoring Agreement
Holdings was party to a Monitoring Agreement whereas Blackstone Management Partners III L.L.C.(“BMP”) and Graham Alternative Investment Partners I (“GAIP”) provided management and advisory services to the Company. On February 10, 2010, in connection with the IPO and in exchange for a one-time payment of $26.3 million to BMP, and $8.8 million to GAIP, the parties of the Monitoring Agreement agreed to terminate such agreement. These amounts paid to terminate the Monitoring Agreement represent the estimated fair value of future payments under the agreement. As a result of the termination, Blackstone the Graham Family and their affiliates have no further obligation to provide monitoring services to Holdings, and Holdings has no further obligation to make annual payments of $4.0 million under the Monitoring Agreement.
115
Table of Contents
| Item 9. | Changes in and Disagreements with Accountants on Accounting and Financial Disclosure |
Not applicable.
| Item 9A. | Controls and Procedures |
| (a) | Evaluation of Disclosure Controls and Procedures |
As of the end of the period covered by this Annual Report on Form 10-K, management, with the participation of the Company’s Chief Executive Officer and Chief Financial Officer, performed an evaluation of the effectiveness of the design and operation of our disclosure controls and procedures as defined in Rules 13a-15(e) and 15d-15(e) of the Exchange Act. Our disclosure controls and procedures are designed to ensure that information required to be disclosed in the reports we file or submit under the Exchange Act is recorded, processed, summarized and reported within the time periods specified in the Securities and Exchange Commission’s rules and forms, and that such information is accumulated and communicated to our management, including the Chief Executive Officer and the Chief Financial Officer, to allow timely decisions regarding required disclosures. Any controls and procedures, no matter how well designed and operated, can provide only reasonable assurance of achieving the desired control objective. Based on this evaluation, our Chief Executive Officer and Chief Financial Officer concluded that, as of December 31, 2009, the design and operation of our disclosure controls and procedures were effective at the reasonable assurance level.
| (b) | Internal Control Over Financial Reporting |
This annual report does not include a report of management’s assessment regarding internal control over financial reporting or an attestation report of the Company’s registered public accounting firm due to a transition period established by rules of the Securities and Exchange Commission for newly public companies.
| (c) | Changes in Internal Control over Financial Reporting |
There was no change in our internal control over financial reporting (as that term is defined in Rules 13a-15(f) and 15d-15(f) under the Exchange Act) that occurred during the quarter ended December 31, 2009, that has materially affected, or is reasonably likely to materially affect, our internal control over financial reporting.
| Item 9B. | Other Information |
Approval of Compensation Arrangements
On March 2, 2010, the Board of Directors (the “Board”) of GPC approved and adopted (i) GPC’s new Class A Executive Severance Plan (the “Class A Executive Severance Plan”), and (ii) GPC’s Long Term Incentive Plan (the “LTIP”), each of which will be effective as of February 10, 2010. In addition, on that date, the Board approved annual bonus amounts under GPC’s Corporate Incentive Plan and on a discretionary basis to several of the Company’s named executive officers.
Class A Executive Severance Plan
The Class A Executive Severance Plan was established for the benefit of eligible executive employees of the Company who are selected for coverage by the Company’s Chief Executive Officer. The CEO has selected the following executive officers for coverage under the Class A Executive Severance Plan: David Bullock, Mark Burgess, David Cargile, Michael Korniczky, Peter Lennox, Martin Sauer and Ashok Sudan (the “Class A Covered Executives”).
In the event that a Class A Covered Executive is terminated for Good Reason or Without Cause, the Class A Covered Executive will be entitled to the greater of the severance benefits provided under his or her employment agreement with the Company or the following benefits provided by the Class A Executive Severance Plan: (i) accelerated vesting of equity compensation awards; (ii) an amount equal to one (1) times the sum of the Covered Executive’s base salary; (iii) accrued but unpaid vacation; and (iv) the continuation of non-taxable health and dental benefits for 12 months.
116
Table of Contents
In the event that a Class A Covered Executive is terminated due to a Change of Control, the Class A Covered Executive will be entitled to the greater of the severance benefits provided under his or her employment agreement with the Company or the following benefits provided by the Executive Severance Plan: (i) accelerated vesting of equity compensation awards; (ii) a lump-sum amount equal to two (2) times the sum of the Class A Covered Executive’s base salary plus bonus; (iii) a lump-sum amount equal to a prorata annual bonus plus accrued but unpaid vacation; and (iv) the continuation of non-taxable health and dental benefits for 12 months.
In consideration of receiving benefits under the Class A Executive Severance Plan, each Class A Covered Executive agrees to (a) certain limitations on disclosing Confidential Information, (b) post-termination restrictions on non-solicitation and non-competition for a period of two years following the Class A Covered Executive’s termination from the Company and (c) return of Company property upon termination of employment. In the event of a breach by the Class A Covered Executive, the Company is entitled to (a) cease making any payments or providing any benefit otherwise required under the Class A Executive Severance Plan, and/or (b) an injunction preventing the Class A Covered Executive from any continued breach.
Any Class A Covered Executive who receives benefits under the Class A Executive Severance Plan will not be entitled to receive benefits under any other Company severance plan or program.
Long Term Incentive Plan
The LTIP is designed to encourage results-oriented actions on the part of select vice-presidents, general managers, and directors of the Company that will drive the achievement of specific business objectives. Under the LTIP, the Company’s Compensation Committee or its delegate will make a grant of performance share units to selected eligible employees. Each of those units represents one share of GPC’s Common stock. The number of units issued to a participant will be increased or decreased at the end of a two (2) year performance period depending upon the Company’s level of achievement over the performance period of the performance goals established by the Committee at the beginning of the performance period. At the end of the performance period, each LTIP unit will be satisfied in cash or stock (payable from shares authorized under GPC’s 2010 Equity Compensation Plan) at the discretion of the Committee. Upon a Change in Control, all LTIP awards will become fully vested and payable at the maximum amount.
In consideration of receiving the LTIP award, each participant agrees to (a) certain limitations on disclosing confidential information, (b) post-termination restrictions on non-solicitation and non-competition for a period of two years following the participant’s termination from the Company and (c) return of Company property upon termination of employment. The Company will be entitled to repayment of the LTIP award from the participant upon any violation of the above referenced agreements made in consideration of the LTIP award, and the Company may also be entitled to repayment of the LTIP award from the participant if the participant is terminated for cause within 6 months of receiving the LTIP award. No LTIP awards have yet been made.
The foregoing descriptions of the Class A Executive Severance Plan and the LTIP are qualified by reference to the full text of the Class A Executive Severance Plan and the LTIP, which are filed as Exhibits 10.48, and 10.49, respectively, to this Annual Report and are incorporated by reference herein.
Approval of Annual and Discretionary Bonuses
On March 2, 2010, the Board approved non-equity incentive compensation bonuses and discretionary bonuses to certain of the Company’s executive officers, based on the financial results of the Company for the year ended December 31, 2009. The amounts of these bonuses had not yet been determined at the time of the filing of the Registration Statement on Form S-1 of GPC relating to the IPO and were therefore not included in the “Non-Equity Incentive Plan Compensation,” “Bonus” or “Total” columns contained in the Summary Compensation Table set forth therein. The amount awarded to each of the named executive officers listed in the Registration Statement on Form S-1 and the amount of compensation that would have been reflected in the
117
Table of Contents
“Total” column of the Summary Compensation Table had the amounts of these awards been determined prior to the effectiveness of the filing of the Registration Statement on Form S-1 are set forth below.
| Name and Principal Position |
Bonus | Non-Equity Incentive Plan Compensation |
Total* | ||||||
| Warren D. Knowlton, Former Chief Executive Officer and Former Executive Chairman of the Advisory Committee |
$ | 1,786,069 | $ | 9,490,214 | |||||
| Mark S. Burgess, Chief Executive Officer |
1,620,000 | 2,673,355 | |||||||
| David W. Bullock, Chief Financial Officer |
504,000 | 1,068,648 | |||||||
| Ashok Sudan, Executive Vice President and General Manager, Global Food and Beverage |
$ | 145,150 | 492,421 | 1,108,640 | |||||
| David R. Nachbar, Former Chief Human Resources Officer |
333,568 | ||||||||
| George M. Lane, Former Senior Vice President, Global Human Resources |
56,358 | 504,094 | |||||||
| * | Total compensation figures are based on figures presented in the Registration Statement on Form S-1 of GPC relating to the IPO, which include, among other things, Option Award calculations based upon compensation cost recognized for financial reporting purposes over the period in which the employee is required to provide service in exchange for the award. |
As a result of the determination of bonus and non-equity incentive compensation amounts described above, Peter Lennox, the Company’s Senior Vice President, General Manager of Household Chemical and Automotive, Personal Care/Specialty and South America, became one of the Company’s three most highly compensated executive officers, other than the Company’s chief executive officer and chief financial officer, serving at December 31, 2009. The Board determined to award Mr. Lennox a discretionary bonus equal to $34,710 and non-equity incentive plan compensation equal to $310,864, resulting in total compensation of $640,588. As a result of the determinations described above, each of Mr. Lane and David Nachbar, the Company’s former Chief Human Resources Officer, will no longer be considered one of the Company’s named executive officers based upon 2009 total compensation.
PART III
| Item 10. | Directors; Executive Officers of the Registrant and Corporate Governance |
The information regarding directors of Graham Packaging Company Inc. and executive officers set forth under the caption “Proposal No. 1—Election of Directors” and “The Board of Directors and Certain Governance Matters—Executive Officers of the Company” in the Graham Packaging Company Inc. Proxy Statement for the 2010 Annual Meeting of Stockholders (the “Proxy Statement”) is incorporated herein by reference.
The information regarding compliance with Section 16(a) of the Exchange Act set forth under the caption “Section 16(a) Beneficial Ownership Reporting Compliance” in the Proxy Statement is incorporated herein by reference.
The information regarding our Code of Business Conduct and Ethics, our audit committee and our audit committee financial expert under the captions “The Board of Directors and Certain Governance Matters—Code of Conduct,” “The Board of Directors and Certain Governance Matters—Board Committees and Meetings” and “The Board of Directors and Certain Governance Matters—Committee Membership—Audit Committee” in the Proxy Statement is incorporated herein by reference.
| Item 11. | Executive Compensation |
The information contained in the sections captioned “Executive Compensation” and “Director Compensation” of the Proxy Statement is incorporated herein by reference.
118
Table of Contents
| Item 12. | Security Ownership of Certain Beneficial Owners and Management and Related Stockholder Matters |
The information contained in the section captioned “Ownership of Securities” of the Proxy Statement is incorporated herein by reference.
EQUITY COMPENSATION PLAN INFORMATION
The following table sets forth equity compensation plan information regarding equity options to purchase limited partnership units in Holdings at December 31, 2009.
| (a) | (b) | (c) | |||||
| Plan category |
Number of securities to be issued upon exercise of outstanding options |
Weighted-average exercise price of outstanding options |
Number of securities remaining available for future issuance under equity compensation plans (excluding securities reflected in column (a)) | ||||
| Equity compensation plans approved by security holders |
4,813,115 | $ | 8.35 | 1,852,359 | |||
| Equity compensation plans not approved by security holders |
N/A | N/A | N/A | ||||
| Total |
4,813,115 | $ | 8.35 | 1,852,359 | |||
| Item 13. | Certain Relationships and Related Transactions, and Director Independence |
The information contained in the sections captioned “Transactions with Related Persons” and “The Board of Directors and Certain Governance Matters—Director Independence and Independence Determinations” in the Proxy Statement is incorporated herein by reference.
| Item 14. | Principal Accountant Fees and Services |
The information regarding our independent registered public accounting firm fees and services in the section captioned “Proposal No. 2—Ratification of Independent Registered Public Accounting Firm Audit and Non-Audit Fees” of the Proxy Statement is incorporated herein by reference.
PART IV
| Item 15. | Exhibits and Financial Statement Schedules |
Documents filed as part of the Report:
| (1) | Financial Statements: |
See Index to Financial Statements in Item 8 of this Report.
| (2) | Financial Statement Schedules: |
The following Financial Statement Schedules are included herein:
Schedule I—Graham Packaging Company Inc. Registrant’s Condensed Financial Statements
Schedule II—Valuation and Qualifying Accounts
All other schedules are not submitted because they are not applicable or not required or because the required information is included in the financial statements or the notes thereto.
119
Table of Contents
The financial statements included in this annual report are listed under “Item 8. Financial Statements and Supplementary Data.” All exhibits filed with this annual report are listed in (3) below.
| (3) | Exhibits: |
The following exhibits are filed herewith or incorporated herein by reference:
| Exhibit |
Description of Exhibit | |
| 3.1 | Restated Certificate of Incorporation of Graham Packaging Company Inc. (incorporated herein by reference to Exhibit 3.1 to Amendment No. 5 to the Registration Statement of Graham Packaging Company Inc. on Form S-1/A filed by Graham Packaging Company Inc. on February 5, 2010 (File No. 333-163956)). | |
| 3.2 | Amended and Restated By-Laws of Graham Packaging Company Inc. (incorporated herein by reference to Exhibit 3.2 to Amendment No. 5 to the Registration Statement of Graham Packaging Company Inc. on Form S-1/A filed by Graham Packaging Company Inc. on February 5, 2010 (File No. 333-163956)). | |
| 4.1 | Indenture dated as of October 7, 2004, among Graham Packaging Company, L.P. and GPC Capital Corp. I and Graham Packaging Holdings Company, as guarantor, and The Bank of New York as Trustee, relating to the Senior Notes Due 2012 of Graham Packaging Company, L.P. and GPC Capital Corp. I, unconditionally guaranteed by Graham Packaging Holdings Company (incorporated herein by reference to Exhibit 4.1 to the Current Report on Form 8-K filed by Graham Packaging Holdings Company on October 14, 2004 (File No. 333-53603-03)). | |
| 4.2 | Indenture dated as of October 7, 2004, among Graham Packaging Company, L.P. and GPC Capital Corp. I and Graham Packaging Holdings Company, as guarantor, and The Bank of New York, as Trustee, relating to the Senior Subordinated Notes Due 2014 of Graham Packaging Company, L.P. and GPC Capital Corp. I, unconditionally guaranteed by Graham Packaging Holdings Company (incorporated herein by reference to Exhibit 4.2 to the Current Report on Form 8-K filed by the Company on October 14, 2004 (File No. 333-53603-03)). | |
| 4.3 | Indenture, dated as of November 24, 2009, among Graham Packaging Company, L.P., GPC Capital Corp. I, the Guarantors named therein and the Bank of New York Mellon, as Trustee, relating to the Senior Notes Due 2017 of Graham Packaging Company, L.P. and GPC Capital Corp. I, unconditionally guaranteed by the Guarantors named therein (incorporated herein by reference to Exhibit 4.1 to the Current Report on Form 8-K filed by the Company on November 24, 2009 (File No. 333-53603-03)). | |
| 4.4 | Form of 8 1/2% Senior Note due 2012 (incorporated herein by reference to Exhibit 4.1 to the Current Report on Form 8-K filed by the Company on October 14, 2004 (File No. 333-53603-03)). | |
| 4.5 | Form of 9 7/8% Series Senior Subordinated Note due 2014 (incorporated herein by reference to Exhibit 4.2 to the Current Report on Form 8-K filed by the Company on October 14, 2004 (File No. 333-53603-03)). | |
| 4.6 | Form of 8 1/4% Senior Note due 2017 (incorporated herein by reference to Exhibit 4.2 to the Current Report on Form 8-K filed by the Company on November 24, 2009 (File No. 333-53603-03)). | |
| 4.7 | Form of Common Stock Certificate (incorporated herein by reference to Exhibit 4.7 to Amendment No. 2 to the Registration Statement of Graham Packaging Company Inc. on Form S-1/A filed by Graham Packaging Company Inc. on February 5, 2010 (File No. 333-163956)). | |
| 10.1 | First Lien Credit Agreement, dated as of October 7, 2004, among Graham Packaging Holdings Company, Graham Packaging Company, L.P., as the borrower, GPC Capital Corp. I, as the co- borrower, the lenders named therein, Deutsche Bank AG Cayman Islands Branch, as administrative agent and as collateral agent, Citigroup Global Markets Inc., as syndication agent, Goldman Sachs Credit Partners, L.P., General Electric Capital Corporation and Lehman Commercial Paper Inc., as co-documentation agents, and Lasalle Bank National Association and Manufacturers and Traders Trust Company, as senior managing agents (incorporated herein by reference to Exhibit 10.1 to the Current Report on Form 8-K filed by the Company on October 14, 2004 (File No. 333-53603-03)). | |
120
Table of Contents
| Exhibit |
Description of Exhibit | |
| 10.2 | First Amendment to Credit Agreement, dated as of December 9, 2005, among Graham Packaging Holdings Company, Graham Packaging Company, L.P., as the borrower, GPC Capital Corp. I, as the co-borrower, the lenders named therein, Citigroup Global Markets Inc., as syndication agent, Goldman Sachs Credit Partners, L.P., General Electric Capital Corporation and Lehman Commercial Paper Inc., as co-documentation agents, Deutsche Bank AG Cayman Islands Branch, as administrative agent and as collateral agent for the lenders, and LaSalle Bank National Association and Manufacturers and Traders Trust Company, as senior managing agents (incorporated herein by reference to Exhibit 10.21 to the Annual Report on Form 10-K filed by the Company on March 31, 2006 (File No. 333-53603-03)). | |
| 10.3 | Second Amendment to Credit Agreement, dated as of April 18, 2006, among Graham Packaging Holdings Company, Graham Packaging Company, L.P., as the borrower, GPC Capital Corp. I, as the co-borrower, the lenders named therein, Citigroup Global Markets Inc., as syndication agent, Goldman Sachs Credit Partners, L.P., General Electric Capital Corporation and Lehman Commercial Paper Inc., as co-documentation agents, Deutsche Bank AG Cayman Islands Branch, as administrative agent and as collateral agent for the lenders, and LaSalle Bank National Association and Manufacturers and Traders Trust Company, as senior managing agents (incorporated herein by reference to Exhibit 10.1 to the Current Report on Form 8-K filed by the Company on April 21, 2006 (File No. 333-53603-03)). | |
| 10.4 | Third Amendment to Credit Agreement, dated as of March 30, 2007, among Graham Packaging Holdings Company, Graham Packaging Company, L.P., as the borrower, GPC Capital Corp. I, as the co-borrower, the lenders named therein, Citigroup Global Markets Inc., as syndication agent, Goldman Sachs Credit Partners, L.P., General Electric Capital Corporation and Lehman Commercial Paper Inc., as co-documentation agents, Deutsche Bank AG Cayman Islands Branch, as administrative agent and as collateral agent for the lenders, and LaSalle Bank National Association and Manufacturers and Traders Trust Company, as senior managing agents (incorporated herein by reference to Exhibit 10.25 to the Annual Report on Form 10-K filed by the Company on April 2, 2007 (File No. 333-53603-03)). | |
| 10.5 | Fourth Amendment to Credit Agreement, dated as of May 28, 2009, among Graham Packaging Holdings Company, Graham Packaging Company, L.P., as the borrower, GPC Capital Corp. I, as the co-borrower, the lenders named therein and Deutsche Bank AG Cayman Islands Branch, as administrative agent for the lenders (incorporated herein by reference to Exhibit 10.1 to the Current Report on Form 8-K filed by the Company on May 29, 2009 (File No. 333-53603-03)). | |
| 10.6 | Fifth Amendment to Credit Agreement, dated as of December 16, 2009, among Graham Packaging Holdings Company, Graham Packaging Company, L.P., as the borrower, GPC Capital Corp. I, as the co-borrower, the lenders named therein and Deutsche Bank AG Cayman Islands Branch, as administrative agent for the lenders (incorporated herein by reference to Exhibit 10.18 to the Registration Statement of Graham Packaging Company Inc. on Form S-1, filed on December 23, 2009 (File No. 333-163956)). | |
| 10.7 | Amended and Restated Monitoring Agreement, dated as of September 30, 2004, among Graham Packaging Holdings Company, L.P., Graham Packaging Company, L.P., Blackstone Management Partners III L.L.C. and Graham Alternative Investment Partners I (incorporated herein by reference to Exhibit 10.7 to Amendment No. 1 to the Registration Statement on Form S-4/A filed by the Company on July 8, 2005 (File No. 333-125173-02)). | |
| 10.8 | Management Stockholders Agreement, dated as of February 2, 1998, among Blackstone Capital Partners III Merchant Banking Fund L.P., Blackstone Offshore Capital Partners III L.P., Blackstone Family Investment Partnership III, L.P., BMP/Graham Holdings Corporation (currently known as Graham Packaging Company Inc.), Graham Packaging Holdings Company, L.P., GPC Capital Corp. II and the management investors named therein (incorporated herein by reference to Exhibit 10.8 to the Registration Statement on Form S-4/A filed by the Company on July 13, 1998 (File No. 333-53603-03)). | |
121
Table of Contents
| Exhibit |
Description of Exhibit | |
| 10.9 | Stockholders’ Agreement, dated as of February 2, 1998, among Blackstone Capital Partners III Merchant Banking Fund L.P., Blackstone Offshore Capital Partners III L.P., Blackstone Family Investment Partnership III, L.P., BMP/Graham Holdings Corporation (currently known as Graham Packaging Company Inc.), Graham Packaging Holdings Company, GPC Capital Corp. II and BT Investment Partners, Inc. (incorporated herein by reference to Exhibit 10.10 to the Registration Statement on Form S-4/A filed by the Company on July 13, 1998 (File No. 333-53603-03)). | |
| 10.10 | Exchange Agreement by and among Graham Packaging Company Inc., Graham Packaging Holdings Company, Graham Packaging Corporation and GPC Holdings, L.P., dated as of February 10, 2010 (incorporated herein by reference to Exhibit 10.1 to the Current Report on Form 8-K filed by Graham Packaging Company Inc. on February 17, 2010 (File No. 001-34621)). | |
| 10.11 | Registration Rights Agreement by and among Graham Packaging Company Inc., Graham Packaging Holdings Company, Graham Packaging Corporation, GPC Holdings, L.P., Blackstone Capital Partners III Merchant Banking Fund L.P., Blackstone Offshore Capital Partners III L.P., Blackstone Family Investment Partnership III L.P. and certain holders of the Company’s common stock, dated as of February 10, 2010 (incorporated herein by reference to Exhibit 10.2 to the Current Report on Form 8-K filed by Graham Packaging Company Inc. on February 17, 2010 (File No. 001-34621)). | |
| 10.12 | Stockholders’ Agreement by and among Graham Packaging Company Inc., Blackstone Capital Partners III Merchant Banking Fund L.P., Blackstone Offshore Capital Partners III L.P. and Blackstone Family Investment Partnership III L.P., dated as of February 10, 2010 (incorporated herein by reference to Exhibit 10.5 to the Current Report on Form 8-K filed by Graham Packaging Company Inc. on February 17, 2010 (File No. 001-34621)). | |
| 10.13 | Termination Agreement by and among Graham Packaging Holdings Company, Graham Packaging Company L.P., Blackstone Management Partners III L.L.C. and Graham Alternative Investment Partners I, dated as of February 10, 2010 (incorporated herein by reference to Exhibit 10.3 to the Current Report on Form 8-K filed by the Company on February 18, 2010 (File No. 333-53603-03)). | |
| 10.14 | Termination Agreement by and among Blackstone Capital Partners III Merchant Banking Fund L.P., Blackstone Offshore Capital Partners III L.P., Blackstone Family Investment Partnership III L.P., Graham Packaging Company Inc., Graham Packaging Holdings Company, GPC Capital Corp. II and MidOcean Capital Investors, L.P., dated as of February 10, 2010 (incorporated herein by reference to Exhibit 10.7 to the Current Report on Form 8-K filed by Graham Packaging Company Inc. on February 17, 2010 (File No. 001-34621)). | |
| 10.15 | Form of Management Stockholders’ Agreement Termination Agreement (incorporated herein by reference to Exhibit 10.8 to the Current Report on Form 8-K filed by Graham Packaging Company Inc. on February 17, 2010 (File No. 001-34621)). | |
| 10.16 | Income Tax Receivable Agreement between Graham Packaging Company Inc. and Blackstone Capital Partners III Merchant Banking Fund L.P., dated as of February 10, 2010 (incorporated herein by reference to Exhibit 10.3 to the Current Report on Form 8-K filed by Graham Packaging Company Inc. on February 17, 2010 (File No. 001-34621)). | |
| 10.17 | Income Tax Receivable Agreement between Graham Packaging Company Inc. and GPC Holdings, L.P., dated as of February 10, 2010 (incorporated herein by reference to Exhibit 10.4 to the Current Report on Form 8-K filed by Graham Packaging Company Inc. on February 17, 2010 (File No. 001-34621)). | |
| 10.18 | Registration Rights Agreement among Graham Packaging Company, L.P. and GPC Capital Corp. I, as issuers, and Graham Packaging Holdings Company and the guarantors listed on the signature pages thereto, as guarantors, dated as of November 24, 2009 (incorporated herein by reference to Exhibit 10.2 to the Current Report on Form 8-K filed by Graham Packaging Company Inc. on February 17, 2010 (File No. 001-34621)). | |
122
Table of Contents
| Exhibit |
Description of Exhibit | |
| 10.19** | Amended and Restated Employment Agreement Between Graham Packaging Company Inc., Graham Packaging Holdings Company, Graham Packaging Company, L.P. and Mark S. Burgess, dated January 20, 2010 (incorporated herein by reference to Exhibit 10.6 to the Current Report on Form 8-K filed by Graham Packaging Company Inc. on February 17, 2010 (File No. 001-34621)). | |
| 10.20** | Option Agreement, dated as of June 17, 2009, between Graham Packaging Holdings Company and Mark S. Burgess (incorporated by reference to Exhibit 10.1 to the Current Report on Form 8-K filed by the Company on June 19, 2009 (File No. 333-53603-03)). | |
| 10.21** | Employment Agreement, dated as of May 4, 2009, between Graham Packaging Holdings Company, Graham Packaging Company, L.P. and David Bullock (incorporated herein by reference to Exhibit 10.1 to the Quarterly Report on Form 10-Q filed by Graham Packaging Holdings Company on May 4, 2009 (File No. 333-53603-03)). | |
| 10.22** | Option Agreement (for performance-based “MOIC” options), dated as of May 4, 2009, between Graham Packaging Holdings Company and David Bullock (incorporated herein by reference to Exhibit 10.2 to the Quarterly Report on Form 10-Q filed by Graham Packaging Holdings Company on May 4, 2009 (File No. 333-53603-03)). | |
| 10.23** | Option Agreement (for time-based options), dated as of May 4, 2009, between Graham Packaging Holdings Company and David Bullock (incorporated herein by reference to Exhibit 10.3 to the Quarterly Report on Form 10-Q filed by Graham Packaging Holdings Company on May 4, 2009 (File No. 333-53603-03)). | |
| 10.24** | Management Subscription Agreement, dated as of May 4, 2009, between BMP/Graham Holdings Corporation (currently known as Graham Packaging Company Inc.) and David Bullock (incorporated herein by reference to Exhibit 10.30 of the Registration Statement of Graham Packaging Company Inc. on Form S-1, filed on December 23, 2009 (File No. 333-163956)). | |
| 10.25** | Form of Employment Agreement, dated as of June 27, 2002, between Graham Packaging Holdings Company and Ashok Sudan (incorporated herein by reference to Exhibit 10.18 to the Annual Report on Form 10-K filed by the Company on March 31, 2005 (File No. 333-53603-03)). | |
| 10.26** | Form of Employment Agreement, dated as of January 1, 2005, between Graham Packaging Holdings Company and Peter T. Lennox (incorporated herein by reference to Exhibit 10.18 to the Annual Report on Form 10-K filed by the Company on March 31, 2006 (File No. 333-53603-03)). | |
| 10.27** | Form of Employment Agreement, dated as of March 28, 2007, between Graham Packaging Holdings Company and Warren D. Knowlton (incorporated herein by reference to Exhibit 10.14 to the Annual Report on Form 10-K filed by the Company on April 2, 2007 (File No. 333-53603-03)). | |
| 10.28** | Letter Agreement, dated December 18, 2008, between Graham Packaging Holdings Company, Graham Packaging Company, L.P. and Warren D. Knowlton (incorporated herein by reference to Exhibit 10.1 to the Current Report on Form 8-K filed by the Company on December 19, 2008 (File No. 333-53603-03)). | |
| 10.29** | Graham Packaging Holdings Company and Graham Packaging Company, L.P. Transaction Bonus and Release Agreement with Warren D. Knowlton, dated January 20, 2010 (incorporated herein by reference to the Current Report on Form 8-K filed by the Company on February 18, 2010 (File No. 333-53603-03)). | |
| 10.30** | Employment Agreement, dated as of March 23, 2008, between Graham Packaging Company, L.P. and David Nachbar (incorporated herein by reference to Exhibit 10.38 of Amendment No. 1 to the Registration Statement of Graham Packaging Company Inc. on Form S-1/A filed by Graham Packaging Company Inc. on January 15, 2010 (File No. 333-163956)). | |
123
Table of Contents
| Exhibit |
Description of Exhibit | |
| 10.31** | Severance Letter with David Nachbar, dated February 9, 2010 (incorporated herein by reference to Exhibit 10.1 to the Current Report on Form 8-K filed by the Company on February 16, 2010 (File No. 333-53603-03)). | |
| 10.32** | Termination Agreement, dated as of March 27, 2008, between Graham Packaging Company, L.P. and George Lane (incorporated herein by reference to Exhibit 10.39 of Amendment No. 1 to the Registration Statement of Graham Packaging Company Inc. on Form S-1/A filed by Graham Packaging Company Inc. on January 15, 2010 (File No. 333-163956)). | |
| 10.33** | Graham Packaging Holdings Company Management Option Plan (incorporated herein by reference to Exhibit 10.11 to the Registration Statement on Form S-4/A filed by the Company on July 31, 1998 (File No. 333-53603-03)). | |
| 10.34** | 2004 Graham Packaging Holdings Company Management Option Plan (incorporated herein by reference to Exhibit 10.13 to the Annual Report on Form 10-K filed by the Company on March 31, 2005 (File No. 333-53603-03)). | |
| 10.35** | Form of Amended and Restated Option Agreement (incorporated herein by reference to Exhibit 10.1 to the Current Report on Form 8-K filed by the Company on February 6, 2008 (File No. 333-53603-03)). | |
| 10.36** | 2008 Graham Packaging Holdings Company Management Option Plan (incorporated herein by reference to Exhibit 10.1 to the Quarterly Report on Form 10-Q filed by the Company on August 7, 2008 (File No. 333-53603-03)). | |
| 10.37** | Form of Option Unit Agreement pursuant to the Graham Packaging Holdings Company 2008 Management Option Plan (incorporated herein by reference to Exhibit 10.1 to the Current Report on Form 8-K filed by the Company on April 10, 2008 (File No. 333-53603-03)). | |
| 10.38** | Form of Amended and Restated Option Unit Agreement. (incorporated herein by reference to Exhibit 10.24 to the Annual Report on Form 10-K filed by the Company on March 10, 2009 (File No. 333-53603-03)). | |
| 10.39** | Form of Director Fee Agreement (incorporated herein by reference to Exhibit 10.40 of Amendment No. 1 to the Registration Statement of Graham Packaging Company Inc. on Form S-1/A filed by Graham Packaging Company Inc. on January 15, 2010 (File No. 333-163956)). | |
| 10.40** | Form of Graham Packaging Holdings Company Management Option Unit Exchange Agreement (incorporated herein by reference to Exhibit 10.41 of Amendment No. 1 to the Registration Statement of Graham Packaging Company Inc. on Form S-1/A filed by Graham Packaging Company Inc. on January 15, 2010 (File No. 333-163956)). | |
| 10.41** | Form of 2010 Equity Compensation Plan (incorporated herein by reference to Exhibit 10.42 of Amendment No. 1 to the Registration Statement of Graham Packaging Company Inc. on Form S-1/A filed by Graham Packaging Company Inc. on January 15, 2010 (File No. 333-163956)). | |
| 10.42** | Form of Nonqualified Stock Option Agreement (incorporated herein by reference to Exhibit 10.43 of Amendment No. 1 to the Registration Statement of Graham Packaging Company Inc. on Form S-1/A filed by Graham Packaging Company Inc. on January 15, 2010 (File No. 333-163956)). | |
| 10.43** | Form of IPO Transaction Bonus Agreement (incorporated herein by reference to Exhibit 10.44 of Amendment No. 1 to the Registration Statement of Graham Packaging Company Inc. on Form S-1/A filed by Graham Packaging Company Inc. on January 15, 2010 (File No. 333-163956)). | |
| 10.44** | Form of Retention Bonus Agreement (incorporated herein by reference to Exhibit 10.45 of Amendment No. 1 to the Registration Statement of Graham Packaging Company Inc. on Form S-1/A filed by Graham Packaging Company Inc. on January 15, 2010 (File No. 333-163956)). | |
124
Table of Contents
| Exhibit |
Description of Exhibit | |
| 10.45** | Form of Amended and Restated Option Agreement (incorporated herein by reference to Exhibit 10.46 of Amendment No. 2 to the Registration Statement of Graham Packaging Company Inc. on Form S-1/A filed by Graham Packaging Company Inc. on January 22, 2010 (File No. 333-163956)). | |
| 10.46** | Graham Packaging Company Inc. Annual Incentive Plan (incorporated herein by reference to Exhibit 10.48 of Amendment No. 2 to the Registration Statement of Graham Packaging Company Inc. on Form S-1/A filed by Graham Packaging Company Inc. on January 22, 2010 (File No. 333-163956)). | |
| 10.47*/** | Executive Severance Plan, effective as of February 10, 2010. | |
| 10.48*/** | Class A Executive Severance Plan, effective as of February 10, 2010. | |
| 10.49*/** | Long Term Incentive Plan, effective as of February 10, 2010. | |
| 10.50*/** | Form of Long Term Incentive Plan Award Agreement. | |
| 21.1* | Subsidiaries of Graham Packaging Company Inc. | |
| 31.1* | Certification required by Rule 15d-14(a). | |
| 31.2* | Certification required by Rule 15d-14(a). | |
| 32.1* | Certification pursuant to 18 U.S.C. Section 1350, as adopted pursuant to Section 906 of the Sarbanes-Oxley Act of 2002. | |
| 32.2* | Certification pursuant to 18 U.S.C. Section 1350, as adopted pursuant to Section 906 of the Sarbanes-Oxley Act of 2002. | |
| * | - Filed herewith. |
| ** | - Indicates a management contract or compensatory plan arrangement. |
125
Table of Contents
SIGNATURES
Pursuant to the requirements of Section 13 or 15(d) of the Securities Exchange Act of 1934, the registrant has duly caused this report to be signed by the undersigned, thereunto duly authorized.
Date: March 5, 2010
| GRAHAM PACKAGING COMPANY INC. (Registrant) | ||
| By: |
/S/ WILLIAM E. HENNESSEY | |
| Name: | William E. Hennessey | |
| Title: | Vice President, Corporate Controller and Treasury (chief accounting officer and duly authorized officer) | |
Pursuant to the requirements of the Securities Exchange Act of 1934, this report has been signed on the 5th day of March, 2010 by the following persons on behalf of the registrant and in the capacities indicated below:
| Signature |
Title | |
| /S/ MARK S. BURGESS Mark S. Burgess |
Chief Executive Officer and Director (principal executive officer) | |
| /S/ DAVID W. BULLOCK David W. Bullock |
Chief Financial Officer (principal financial officer) | |
| /S/ WILLIAM E. HENNESSEY William E. Hennessey |
Vice President, Corporate Controller and Treasury (principal accounting officer) | |
| /S/ CHINH E. CHU Chinh E. Chu |
Director | |
| /S/ JAMES A. QUELLA James A. Quella |
Director | |
| /S/ CHARLES E. KIERNAN Charles E. Kiernan |
Director | |
| /S/ GARY G. MICHAEL Gary G. Michael |
Director | |
| /S/ JOHN R. CHIMINSKI John R. Chiminski |
Director | |
| /S/ ANGELO G. ACCONCIA Angelo G. Acconcia |
Director | |
126
Table of Contents
EXHIBIT LIST
| Exhibit |
Description of Exhibit | |
| 3.1 | Restated Certificate of Incorporation of Graham Packaging Company Inc. (incorporated herein by reference to Exhibit 3.1 to Amendment No. 5 to the Registration Statement of Graham Packaging Company Inc. on Form S-1/A filed by Graham Packaging Company Inc. on February 5, 2010 (File No. 333-163956)). | |
| 3.2 | Amended and Restated By-Laws of Graham Packaging Company Inc. (incorporated herein by reference to Exhibit 3.2 to Amendment No. 5 to the Registration Statement of Graham Packaging Company Inc. on Form S-1/A filed by Graham Packaging Company Inc. on February 5, 2010 (File No. 333-163956)). | |
| 4.1 | Indenture dated as of October 7, 2004, among Graham Packaging Company, L.P. and GPC Capital Corp. I and Graham Packaging Holdings Company, as guarantor, and The Bank of New York as Trustee, relating to the Senior Notes Due 2012 of Graham Packaging Company, L.P. and GPC Capital Corp. I, unconditionally guaranteed by Graham Packaging Holdings Company (incorporated herein by reference to Exhibit 4.1 to the Current Report on Form 8-K filed by Graham Packaging Holdings Company on October 14, 2004 (File No. 333-53603-03)). | |
| 4.2 | Indenture dated as of October 7, 2004, among Graham Packaging Company, L.P. and GPC Capital Corp. I and Graham Packaging Holdings Company, as guarantor, and The Bank of New York, as Trustee, relating to the Senior Subordinated Notes Due 2014 of Graham Packaging Company, L.P. and GPC Capital Corp. I, unconditionally guaranteed by Graham Packaging Holdings Company (incorporated herein by reference to Exhibit 4.2 to the Current Report on Form 8-K filed by the Company on October 14, 2004 (File No. 333-53603-03)). | |
| 4.3 | Indenture, dated as of November 24, 2009, among Graham Packaging Company, L.P., GPC Capital Corp. I, the Guarantors named therein and the Bank of New York Mellon, as Trustee, relating to the Senior Notes Due 2017 of Graham Packaging Company, L.P. and GPC Capital Corp. I, unconditionally guaranteed by the Guarantors named therein (incorporated herein by reference to Exhibit 4.1 to the Current Report on Form 8-K filed by the Company on November 24, 2009 (File No. 333-53603-03)). | |
| 4.4 | Form of 8 1/2% Senior Note due 2012 (incorporated herein by reference to Exhibit 4.1 to the Current Report on Form 8-K filed by the Company on October 14, 2004 (File No. 333-53603-03)). | |
| 4.5 | Form of 9 7/8% Series Senior Subordinated Note due 2014 (incorporated herein by reference to Exhibit 4.2 to the Current Report on Form 8-K filed by the Company on October 14, 2004 (File No. 333-53603-03)). | |
| 4.6 | Form of 8 1/4% Senior Note due 2017 (incorporated herein by reference to Exhibit 4.2 to the Current Report on Form 8-K filed by the Company on November 24, 2009 (File No. 333-53603-03)). | |
| 4.7 | Form of Common Stock Certificate (incorporated herein by reference to Exhibit 4.7 to Amendment No. 2 to the Registration Statement of Graham Packaging Company Inc. on Form S-1/A filed by Graham Packaging Company Inc. on February 5, 2010 (File No. 333-163956)). | |
| 10.1 | First Lien Credit Agreement, dated as of October 7, 2004, among Graham Packaging Holdings Company, Graham Packaging Company, L.P., as the borrower, GPC Capital Corp. I, as the co- borrower, the lenders named therein, Deutsche Bank AG Cayman Islands Branch, as administrative agent and as collateral agent, Citigroup Global Markets Inc., as syndication agent, Goldman Sachs Credit Partners, L.P., General Electric Capital Corporation and Lehman Commercial Paper Inc., as co-documentation agents, and Lasalle Bank National Association and Manufacturers and Traders Trust Company, as senior managing agents (incorporated herein by reference to Exhibit 10.1 to the Current Report on Form 8-K filed by the Company on October 14, 2004 (File No. 333-53603-03)). | |
127
Table of Contents
| Exhibit |
Description of Exhibit | |
| 10.2 | First Amendment to Credit Agreement, dated as of December 9, 2005, among Graham Packaging Holdings Company, Graham Packaging Company, L.P., as the borrower, GPC Capital Corp. I, as the co-borrower, the lenders named therein, Citigroup Global Markets Inc., as syndication agent, Goldman Sachs Credit Partners, L.P., General Electric Capital Corporation and Lehman Commercial Paper Inc., as co-documentation agents, Deutsche Bank AG Cayman Islands Branch, as administrative agent and as collateral agent for the lenders, and LaSalle Bank National Association and Manufacturers and Traders Trust Company, as senior managing agents (incorporated herein by reference to Exhibit 10.21 to the Annual Report on Form 10-K filed by the Company on March 31, 2006 (File No. 333-53603-03)). | |
| 10.3 | Second Amendment to Credit Agreement, dated as of April 18, 2006, among Graham Packaging Holdings Company, Graham Packaging Company, L.P., as the borrower, GPC Capital Corp. I, as the co-borrower, the lenders named therein, Citigroup Global Markets Inc., as syndication agent, Goldman Sachs Credit Partners, L.P., General Electric Capital Corporation and Lehman Commercial Paper Inc., as co-documentation agents, Deutsche Bank AG Cayman Islands Branch, as administrative agent and as collateral agent for the lenders, and LaSalle Bank National Association and Manufacturers and Traders Trust Company, as senior managing agents (incorporated herein by reference to Exhibit 10.1 to the Current Report on Form 8-K filed by the Company on April 21, 2006 (File No. 333-53603-03)). | |
| 10.4 | Third Amendment to Credit Agreement, dated as of March 30, 2007, among Graham Packaging Holdings Company, Graham Packaging Company, L.P., as the borrower, GPC Capital Corp. I, as the co-borrower, the lenders named therein, Citigroup Global Markets Inc., as syndication agent, Goldman Sachs Credit Partners, L.P., General Electric Capital Corporation and Lehman Commercial Paper Inc., as co-documentation agents, Deutsche Bank AG Cayman Islands Branch, as administrative agent and as collateral agent for the lenders, and LaSalle Bank National Association and Manufacturers and Traders Trust Company, as senior managing agents (incorporated herein by reference to Exhibit 10.25 to the Annual Report on Form 10-K filed by the Company on April 2, 2007 (File No. 333-53603-03)). | |
| 10.5 | Fourth Amendment to Credit Agreement, dated as of May 28, 2009, among Graham Packaging Holdings Company, Graham Packaging Company, L.P., as the borrower, GPC Capital Corp. I, as the co-borrower, the lenders named therein and Deutsche Bank AG Cayman Islands Branch, as administrative agent for the lenders (incorporated herein by reference to Exhibit 10.1 to the Current Report on Form 8-K filed by the Company on May 29, 2009 (File No. 333-53603-03)). | |
| 10.6 | Fifth Amendment to Credit Agreement, dated as of December 16, 2009, among Graham Packaging Holdings Company, Graham Packaging Company, L.P., as the borrower, GPC Capital Corp. I, as the co-borrower, the lenders named therein and Deutsche Bank AG Cayman Islands Branch, as administrative agent for the lenders (incorporated herein by reference to Exhibit 10.18 to the Registration Statement of Graham Packaging Company Inc. on Form S-1, filed on December 23, 2009 (File No. 333-163956)). | |
| 10.7 | Amended and Restated Monitoring Agreement, dated as of September 30, 2004, among Graham Packaging Holdings Company, L.P., Graham Packaging Company, L.P., Blackstone Management Partners III L.L.C. and Graham Alternative Investment Partners I (incorporated herein by reference to Exhibit 10.7 to Amendment No. 1 to the Registration Statement on Form S-4/A filed by the Company on July 8, 2005 (File No. 333-125173-02)). | |
128
Table of Contents
| Exhibit |
Description of Exhibit | |
| 10.8 | Management Stockholders Agreement, dated as of February 2, 1998, among Blackstone Capital Partners III Merchant Banking Fund L.P., Blackstone Offshore Capital Partners III L.P., Blackstone Family Investment Partnership III, L.P., BMP/Graham Holdings Corporation (currently known as Graham Packaging Company Inc.), Graham Packaging Holdings Company, L.P., GPC Capital Corp. II and the management investors named therein (incorporated herein by reference to Exhibit 10.8 to the Registration Statement on Form S-4/A filed by the Company on July 13, 1998 (File No. 333-53603-03)). | |
| 10.9 | Stockholders’ Agreement, dated as of February 2, 1998, among Blackstone Capital Partners III Merchant Banking Fund L.P., Blackstone Offshore Capital Partners III L.P., Blackstone Family Investment Partnership III, L.P., BMP/Graham Holdings Corporation (currently known as Graham Packaging Company Inc.), Graham Packaging Holdings Company, GPC Capital Corp. II and BT Investment Partners, Inc. (incorporated herein by reference to Exhibit 10.10 to the Registration Statement on Form S-4/A filed by the Company on July 13, 1998 (File No. 333-53603-03)). | |
| 10.10 | Exchange Agreement by and among Graham Packaging Company Inc., Graham Packaging Holdings Company, Graham Packaging Corporation and GPC Holdings, L.P., dated as of February 10, 2010 (incorporated herein by reference to Exhibit 10.1 to the Current Report on Form 8-K filed by Graham Packaging Company Inc. on February 17, 2010 (File No. 001-34621)). | |
| 10.11 | Registration Rights Agreement by and among Graham Packaging Company Inc., Graham Packaging Holdings Company, Graham Packaging Corporation, GPC Holdings, L.P., Blackstone Capital Partners III Merchant Banking Fund L.P., Blackstone Offshore Capital Partners III L.P., Blackstone Family Investment Partnership III L.P. and certain holders of the Company’s common stock, dated as of February 10, 2010 (incorporated herein by reference to Exhibit 10.2 to the Current Report on Form 8-K filed by Graham Packaging Company Inc. on February 17, 2010 (File No. 001-34621)). | |
| 10.12 | Stockholders’ Agreement by and among Graham Packaging Company Inc., Blackstone Capital Partners III Merchant Banking Fund L.P., Blackstone Offshore Capital Partners III L.P. and Blackstone Family Investment Partnership III L.P., dated as of February 10, 2010 (incorporated herein by reference to Exhibit 10.5 to the Current Report on Form 8-K filed by Graham Packaging Company Inc. on February 17, 2010 (File No. 001-34621)). | |
| 10.13 | Termination Agreement by and among Graham Packaging Holdings Company, Graham Packaging Company L.P., Blackstone Management Partners III L.L.C. and Graham Alternative Investment Partners I, dated as of February 10, 2010 (incorporated herein by reference to Exhibit 10.3 to the Current Report on Form 8-K filed by the Company on February 18, 2010 (File No. 333-53603-03)). | |
| 10.14 | Termination Agreement by and among Blackstone Capital Partners III Merchant Banking Fund L.P., Blackstone Offshore Capital Partners III L.P., Blackstone Family Investment Partnership III L.P., Graham Packaging Company Inc., Graham Packaging Holdings Company, GPC Capital Corp. II and MidOcean Capital Investors, L.P., dated as of February 10, 2010 (incorporated herein by reference to Exhibit 10.7 to the Current Report on Form 8-K filed by Graham Packaging Company Inc. on February 17, 2010 (File No. 001-34621)). | |
| 10.15 | Form of Management Stockholders’ Agreement Termination Agreement (incorporated herein by reference to Exhibit 10.8 to the Current Report on Form 8-K filed by Graham Packaging Company Inc. on February 17, 2010 (File No. 001-34621)). | |
| 10.16 | Income Tax Receivable Agreement between Graham Packaging Company Inc. and Blackstone Capital Partners III Merchant Banking Fund L.P., dated as of February 10, 2010 (incorporated herein by reference to Exhibit 10.3 to the Current Report on Form 8-K filed by Graham Packaging Company Inc. on February 17, 2010 (File No. 001-34621)). | |
129
Table of Contents
| Exhibit |
Description of Exhibit | |
| 10.17 | Income Tax Receivable Agreement between Graham Packaging Company Inc. and GPC Holdings, L.P., dated as of February 10, 2010 (incorporated herein by reference to Exhibit 10.4 to the Current Report on Form 8-K filed by Graham Packaging Company Inc. on February 17, 2010 (File No. 001-34621)). | |
| 10.18 | Registration Rights Agreement among Graham Packaging Company, L.P. and GPC Capital Corp. I, as issuers, and Graham Packaging Holdings Company and the guarantors listed on the signature pages thereto, as guarantors, dated as of November 24, 2009 (incorporated herein by reference to Exhibit 10.2 to the Current Report on Form 8-K filed by Graham Packaging Company Inc. on February 17, 2010 (File No. 001-34621)). | |
| 10.19** | Amended and Restated Employment Agreement Between Graham Packaging Company Inc., Graham Packaging Holdings Company, Graham Packaging Company, L.P. and Mark S. Burgess, dated January 20, 2010 (incorporated herein by reference to Exhibit 10.6 to the Current Report on Form 8-K filed by Graham Packaging Company Inc. on February 17, 2010 (File No. 001-34621)). | |
| 10.20** | Option Agreement, dated as of June 17, 2009, between Graham Packaging Holdings Company and Mark S. Burgess (incorporated by reference to Exhibit 10.1 to the Current Report on Form 8-K filed by the Company on June 19, 2009 (File No. 333-53603-03)). | |
| 10.21** | Employment Agreement, dated as of May 4, 2009, between Graham Packaging Holdings Company, Graham Packaging Company, L.P. and David Bullock (incorporated herein by reference to Exhibit 10.1 to the Quarterly Report on Form 10-Q filed by Graham Packaging Holdings Company on May 4, 2009 (File No. 333-53603-03)). | |
| 10.22** | Option Agreement (for performance-based “MOIC” options), dated as of May 4, 2009, between Graham Packaging Holdings Company and David Bullock (incorporated herein by reference to Exhibit 10.2 to the Quarterly Report on Form 10-Q filed by Graham Packaging Holdings Company on May 4, 2009 (File No. 333-53603-03)). | |
| 10.23** | Option Agreement (for time-based options), dated as of May 4, 2009, between Graham Packaging Holdings Company and David Bullock (incorporated herein by reference to Exhibit 10.3 to the Quarterly Report on Form 10-Q filed by Graham Packaging Holdings Company on May 4, 2009 (File No. 333-53603-03)). | |
| 10.24** | Management Subscription Agreement, dated as of May 4, 2009, between BMP/Graham Holdings Corporation (currently known as Graham Packaging Company Inc.) and David Bullock (incorporated herein by reference to Exhibit 10.30 of the Registration Statement of Graham Packaging Company Inc. on Form S-1, filed on December 23, 2009 (File No. 333-163956)). | |
| 10.25** | Form of Employment Agreement, dated as of June 27, 2002, between Graham Packaging Holdings Company and Ashok Sudan (incorporated herein by reference to Exhibit 10.18 to the Annual Report on Form 10-K filed by the Company on March 31, 2005 (File No. 333-53603-03)). | |
| 10.26** | Form of Employment Agreement, dated as of January 1, 2005, between Graham Packaging Holdings Company and Peter T. Lennox (incorporated herein by reference to Exhibit 10.18 to the Annual Report on Form 10-K filed by the Company on March 31, 2006 (File No. 333-53603-03)). | |
| 10.27** | Form of Employment Agreement, dated as of March 28, 2007, between Graham Packaging Holdings Company and Warren D. Knowlton (incorporated herein by reference to Exhibit 10.14 to the Annual Report on Form 10-K filed by the Company on April 2, 2007 (File No. 333-53603-03)). | |
| 10.28** | Letter Agreement, dated December 18, 2008, between Graham Packaging Holdings Company, Graham Packaging Company, L.P. and Warren D. Knowlton (incorporated herein by reference to Exhibit 10.1 to the Current Report on Form 8-K filed by the Company on December 19, 2008 (File No. 333-53603-03)). | |
130
Table of Contents
| Exhibit |
Description of Exhibit | |
| 10.29** | Graham Packaging Holdings Company and Graham Packaging Company, L.P. Transaction Bonus and Release Agreement with Warren D. Knowlton, dated January 20, 2010 (incorporated herein by reference to the Current Report on Form 8-K filed by the Company on February 18, 2010 (File No. 333-53603-03)). | |
| 10.30** | Employment Agreement, dated as of March 23, 2008, between Graham Packaging Company, L.P. and David Nachbar (incorporated herein by reference to Exhibit 10.38 of Amendment No. 1 to the Registration Statement of Graham Packaging Company Inc. on Form S-1/A filed by Graham Packaging Company Inc. on January 15, 2010 (File No. 333-163956)). | |
| 10.31** | Severance Letter with David Nachbar, dated February 9, 2010 (incorporated herein by reference to Exhibit 10.1 to the Current Report on Form 8-K filed by the Company on February 16, 2010 (File No. 333-53603-03)). | |
| 10.32** | Termination Agreement, dated as of March 27, 2008, between Graham Packaging Company, L.P. and George Lane (incorporated herein by reference to Exhibit 10.39 of Amendment No. 1 to the Registration Statement of Graham Packaging Company Inc. on Form S-1/A filed by Graham Packaging Company Inc. on January 15, 2010 (File No. 333-163956)). | |
| 10.33** | Graham Packaging Holdings Company Management Option Plan (incorporated herein by reference to Exhibit 10.11 to the Registration Statement on Form S-4/A filed by the Company on July 31, 1998 (File No. 333-53603-03)). | |
| 10.34** | 2004 Graham Packaging Holdings Company Management Option Plan (incorporated herein by reference to Exhibit 10.13 to the Annual Report on Form 10-K filed by the Company on March 31, 2005 (File No. 333-53603-03)). | |
| 10.35** | Form of Amended and Restated Option Agreement (incorporated herein by reference to Exhibit 10.1 to the Current Report on Form 8-K filed by the Company on February 6, 2008 (File No. 333-53603-03)). | |
| 10.36** | 2008 Graham Packaging Holdings Company Management Option Plan (incorporated herein by reference to Exhibit 10.1 to the Quarterly Report on Form 10-Q filed by the Company on August 7, 2008 (File No. 333-53603-03)). | |
| 10.37** | Form of Option Unit Agreement pursuant to the Graham Packaging Holdings Company 2008 Management Option Plan (incorporated herein by reference to Exhibit 10.1 to the Current Report on Form 8-K filed by the Company on April 10, 2008 (File No. 333-53603-03)). | |
| 10.38** | Form of Amended and Restated Option Unit Agreement. (incorporated herein by reference to Exhibit 10.24 to the Annual Report on Form 10-K filed by the Company on March 10, 2009 (File No. 333-53603-03)). | |
| 10.39** | Form of Director Fee Agreement (incorporated herein by reference to Exhibit 10.40 of Amendment No. 1 to the Registration Statement of Graham Packaging Company Inc. on Form S-1/A filed by Graham Packaging Company Inc. on January 15, 2010 (File No. 333-163956)). | |
| 10.40** | Form of Graham Packaging Holdings Company Management Option Unit Exchange Agreement (incorporated herein by reference to Exhibit 10.41 of Amendment No. 1 to the Registration Statement of Graham Packaging Company Inc. on Form S-1/A filed by Graham Packaging Company Inc. on January 15, 2010 (File No. 333-163956)). | |
| 10.41** | Form of 2010 Equity Compensation Plan (incorporated herein by reference to Exhibit 10.42 of Amendment No. 1 to the Registration Statement of Graham Packaging Company Inc. on Form S-1/A filed by Graham Packaging Company Inc. on January 15, 2010 (File No. 333-163956)). | |
131
Table of Contents
| Exhibit |
Description of Exhibit | |
| 10.42** | Form of Nonqualified Stock Option Agreement (incorporated herein by reference to Exhibit 10.43 of Amendment No. 1 to the Registration Statement of Graham Packaging Company Inc. on Form S-1/A filed by Graham Packaging Company Inc. on January 15, 2010 (File No. 333-163956)). | |
| 10.43** | Form of IPO Transaction Bonus Agreement (incorporated herein by reference to Exhibit 10.44 of Amendment No. 1 to the Registration Statement of Graham Packaging Company Inc. on Form S-1/A filed by Graham Packaging Company Inc. on January 15, 2010 (File No. 333-163956)). | |
| 10.44** | Form of Retention Bonus Agreement (incorporated herein by reference to Exhibit 10.45 of Amendment No. 1 to the Registration Statement of Graham Packaging Company Inc. on Form S-1/A filed by Graham Packaging Company Inc. on January 15, 2010 (File No. 333-163956)). | |
| 10.45** | Form of Amended and Restated Option Agreement (incorporated herein by reference to Exhibit 10.46 of Amendment No. 2 to the Registration Statement of Graham Packaging Company Inc. on Form S-1/A filed by Graham Packaging Company Inc. on January 22, 2010 (File No. 333-163956)). | |
| 10.46** | Graham Packaging Company Inc. Annual Incentive Plan (incorporated herein by reference to Exhibit 10.48 of Amendment No. 2 to the Registration Statement of Graham Packaging Company Inc. on Form S-1/A filed by Graham Packaging Company Inc. on January 22, 2010 (File No. 333-163956)). | |
| 10.47*/** | Executive Severance Plan, effective as of February 10, 2010. | |
| 10.48*/** | Class A Executive Severance Plan, effective as of February 10, 2010. | |
| 10.49*/** | Long Term Incentive Plan, effective as of February 10, 2010. | |
| 10.50*/** | Form of Long Term Incentive Plan Award Agreement. | |
| 21.1* | Subsidiaries of Graham Packaging Company Inc. | |
| 31.1* | Certification required by Rule 15d-14(a). | |
| 31.2* | Certification required by Rule 15d-14(a). | |
| 32.1* | Certification pursuant to 18 U.S.C. Section 1350, as adopted pursuant to Section 906 of the Sarbanes-Oxley Act of 2002. | |
| 32.2* | Certification pursuant to 18 U.S.C. Section 1350, as adopted pursuant to Section 906 of the Sarbanes-Oxley Act of 2002. | |
| * | - Filed herewith. |
| ** | - Indicates a management contract or compensatory plan arrangement. |
132
Table of Contents
SCHEDULE I
GRAHAM PACKAGING COMPANY INC.
REGISTRANT’S CONDENSED FINANCIAL STATEMENTS
(In thousands)
| December 31, | ||||||||||||
| 2009 | 2008 | |||||||||||
| BALANCE SHEETS |
||||||||||||
| Assets: |
||||||||||||
| Current assets |
$ | — | $ | — | ||||||||
| Other non-current assets |
— | — | ||||||||||
| Total assets |
$ | — | $ | — | ||||||||
| Liabilities and equity (deficit): |
||||||||||||
| Current liabilities |
$ | 703 | $ | — | ||||||||
| Investment in subsidiary |
771,760 | 817,687 | ||||||||||
| Other non-current liabilites |
— | 695 | ||||||||||
| Total liabilities |
772,463 | 818,382 | ||||||||||
| Equity (deficit) |
||||||||||||
| Preferred stock, $0.01 par value, 100,000,000 shares authorized, 0 shares issued and outstanding |
— | — | ||||||||||
| Common stock, $0.01 par value, 500,000,000 shares authorized, shares issued and outstanding 42,998,786 and 42,975,419 |
430 | 430 | ||||||||||
| Additional paid-in capital |
297,470 | 296,650 | ||||||||||
| Retained earnings |
(1,032,887 | ) | (1,043,966 | ) | ||||||||
| Notes and interest receivable for ownership interests |
(6,353 | ) | (6,292 | ) | ||||||||
| Accumulated other comprehensive income (loss) |
(31,123 | ) | (65,204 | ) | ||||||||
| Equity (defict) |
(772,463 | ) | (818,382 | ) | ||||||||
| Total liabilities and equity (deficit) |
$ | — | $ | — | ||||||||
| Year Ended December 31, | ||||||||||||
| 2009 | 2008 | 2007 | ||||||||||
| STATEMENTS OF OPERATIONS |
||||||||||||
| Selling general and administration expenses |
$ | 862 | $ | 60 | $ | 62 | ||||||
| Equity in income (loss) from continuing operations of subsidiaries |
30,250 | (47,290 | ) | (203,021 | ) | |||||||
| Equity in loss from discontinued operations of subsidiaries |
(9,481 | ) | (10,506 | ) | (3,655 | ) | ||||||
| Income (loss) before income taxes |
19,907 | (57,856 | ) | (206,738 | ) | |||||||
| Income tax provision |
5,654 | 67 | 618 | |||||||||
| Net income (loss) |
14,253 | (57,923 | ) | (207,356 | ) | |||||||
| Total other comprehensive income (loss) |
40,122 | (117,330 | ) | 21,092 | ||||||||
| Comprehensive income (loss) |
54,375 | (175,253 | ) | (186,264 | ) | |||||||
| Compreshensive income attributable to noncontrolling interests |
9,215 | — | — | |||||||||
| Comprehensive income (loss) attributable to Graham Packaging Company, Inc. |
$ | 45,160 | $ | (175,253 | ) | $ | (186,264 | ) | ||||
| Year Ended December 31, | ||||||||||||
| 2009 | 2008 | 2007 | ||||||||||
| STATEMENTS OF CASH FLOWS |
||||||||||||
| Operating activities: |
||||||||||||
| Net income (loss) |
$ | 14,253 | $ | (57,923 | ) | $ | (207,356 | ) | ||||
| Adjustments to reconcile net income (loss) to net cash provided by operating activities: |
||||||||||||
| Change in other current assets |
794 | — | — | |||||||||
| Change in other current liabilities |
703 | 236 | — | |||||||||
| Change in other non-current liabilities |
4,960 | (109 | ) | 680 | ||||||||
| Equity in (earnings) loss of subsidiaries |
(20,769 | ) | 57,796 | 206,676 | ||||||||
| Net cash used in operating activities |
(59 | ) | — | — | ||||||||
| Financing activities: |
||||||||||||
| Net proceeds from net issuance of ownership interests |
59 | — | — | |||||||||
| Net cash provided by financing activities |
59 | — | — | |||||||||
| Increase in cash and cash equivalents |
— | — | — | |||||||||
| Cash and cash equivalents at beginning of period |
— | — | — | |||||||||
| Cash and cash equivalents at end of period |
$ | — | $ | — | $ | — | ||||||
| Supplemental cash flow information: |
||||||||||||
| Cash paid for income taxes |
$ | — | $ | 26 | $ | 13 | ||||||
See footnotes to consolidated financial statements of Graham Packaging Company Inc.
133
Table of Contents
SCHEDULE II
GRAHAM PACKAGING COMPANY INC.
VALUATION AND QUALIFYING ACCOUNTS
(In thousands)
| Balance at Beginning of Year |
Additions | Deductions | Balance at End of Year | ||||||||||
| Year ended December 31, 2009 |
|||||||||||||
| Allowance for doubtful accounts |
$ | 6,452 | $ | (226 | ) | $ | 3,793 | $ | 2,433 | ||||
| Allowance for inventory losses |
6,482 | 3,345 | 3,957 | 5,870 | |||||||||
| Year ended December 31, 2008 |
|||||||||||||
| Allowance for doubtful accounts |
$ | 5,734 | $ | 1,298 | $ | 580 | $ | 6,452 | |||||
| Allowance for inventory losses |
6,966 | 3,593 | 4,077 | 6,482 | |||||||||
| Year ended December 31, 2007 |
|||||||||||||
| Allowance for doubtful accounts |
$ | 6,299 | $ | — | $ | 565 | $ | 5,734 | |||||
| Allowance for inventory losses |
5,505 | 2,776 | 1,315 | 6,966 | |||||||||
134