Attached files
| file | filename |
|---|---|
| 8-K - FORM 8-K - Wendy's Co | form8-k_030410.htm |
EXHIBIT 99.1
Fourth
Quarter and Full-Year 2009
Earnings Call
Earnings Call
March
4, 2010
Opening
Comments
John
Barker
SVP and Chief Communications Officer
SVP and Chief Communications Officer

2
§ Business
Highlights - Roland Smith
− Fourth
quarter
− Full-year
2009
§ Financial
Results - Steve Hare
− Fourth
quarter consolidated financial overview
− Full-year
2009 results
− G&A
synergies
− Cash flow and
debt capitalization
− Dividend and
stock repurchase program
§ 2010 Overview
- Steve Hare & Roland Smith
§ Q&A
Agenda

3
Wendy’s/Arby’s
Group Reported Today:
§ Fourth
Quarter and Full-Year 2009 Results
− Q4
2009
− Full-year
2009 is not comparable to 2008 due to the merger
§ Balance Sheet
Highlights
§ Adjusted
EBITDA Compared to Pro-forma Adjusted EBITDA
§ Selected
Financial Highlights for Each Brand
§ Form
10-K
Fourth
Quarter 2009

4
Forward-Looking
Statements and
Regulation G
Regulation G
This
presentation, and certain information that management may discuss in connection
with this
presentation, may contain statements that are not historical facts, including, importantly,
information concerning possible or assumed future results of our operations. Those statements
constitute “forward-looking statements” within the meaning of the Private Securities Litigation
Reform Act of 1995 (the “Reform Act”). For all our forward-looking statements, we claim the
protection of the safe harbor for forward-looking statements contained in the Reform Act.
Many
important factors could affect our future results and could cause those results
to differ
materially from those expressed in or implied by our forward-looking statements. Such factors,
all of which are difficult or impossible to predict accurately, and many of which are beyond our
control, include but are not limited to those identified under the caption “Forward-Looking
Statements” in our most recent earnings press release and in the “Special Note Regarding
Forward-Looking Statements and Projections” and “Risk Factors” sections of our most recent
Form 10-K and subsequent Form 10-Qs.
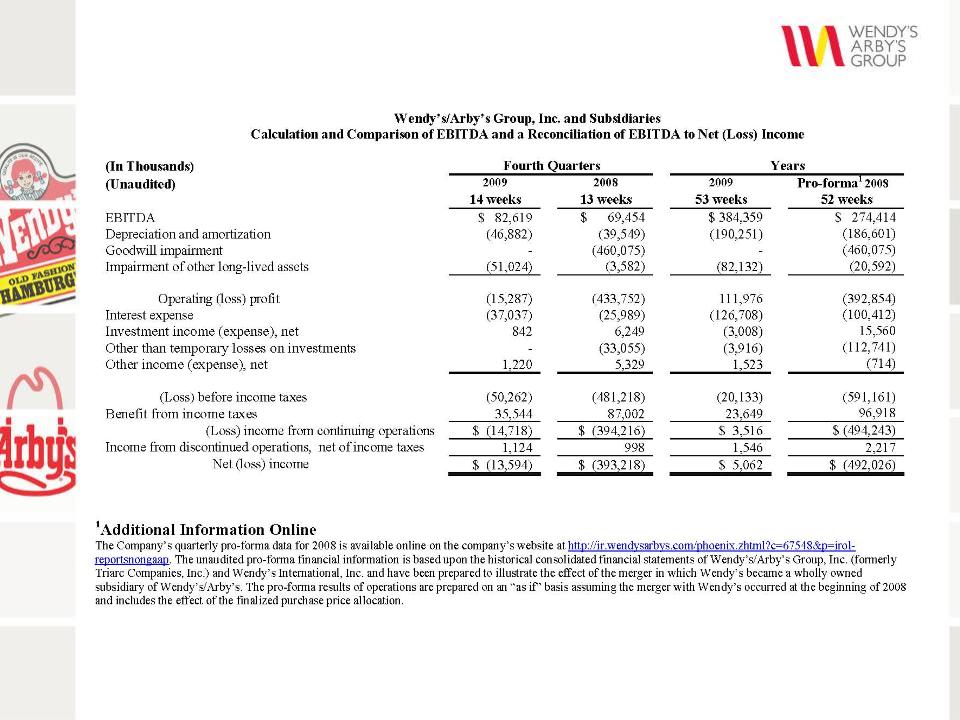
In addition,
this presentation and certain information management may discuss in
connection
with this presentation reference non-GAAP financial measures, such as earnings before
interest, taxes, depreciation and amortization, or EBITDA. Reconciliations of non-GAAP
financial measures to the most directly comparable GAAP financial measure are in the
Appendix to this presentation, and are included in the earnings release and posted on the
Investor Relations section of our website.
Fourth
Quarter and
Full-Year 2009 Highlights
Full-Year 2009 Highlights
Roland
Smith
President & Chief Executive Officer
President & Chief Executive Officer

6
§ Delivered
Strong Earnings Growth
– Adjusted
EBITDA* increased 16%
§ Produced
Margin Improvement at Wendy’s
– 330 basis
point improvement in company-operated stores
– Ahead of
schedule on improving Wendy’s restaurant margins by 500
basis points by end of 2011
basis points by end of 2011
§ Achieved Cost
Savings Ahead of Schedule
§ Repositioned
Wendy’s Brand
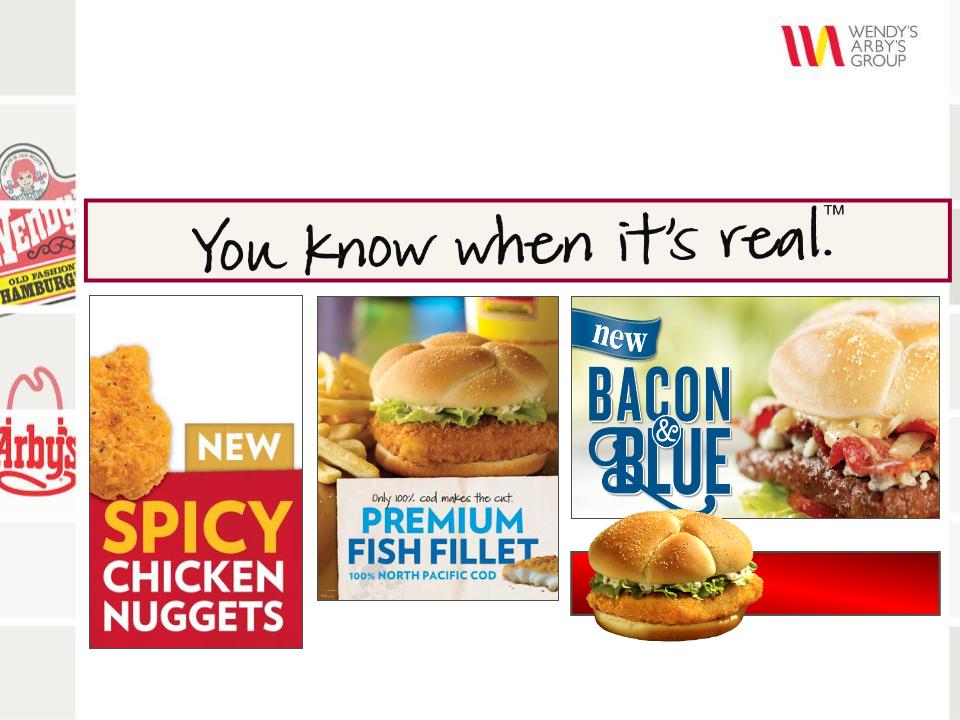
§ Drove Product
Innovation at Both Brands
§ Implemented
Improved Value Strategies at Both Brands
§ Formed
Wendy’s Purchasing Co-op
§ Delivered
Strong Cash Flow and Financial Flexibility
*See
Appendix.
2009
Key Accomplishments

7
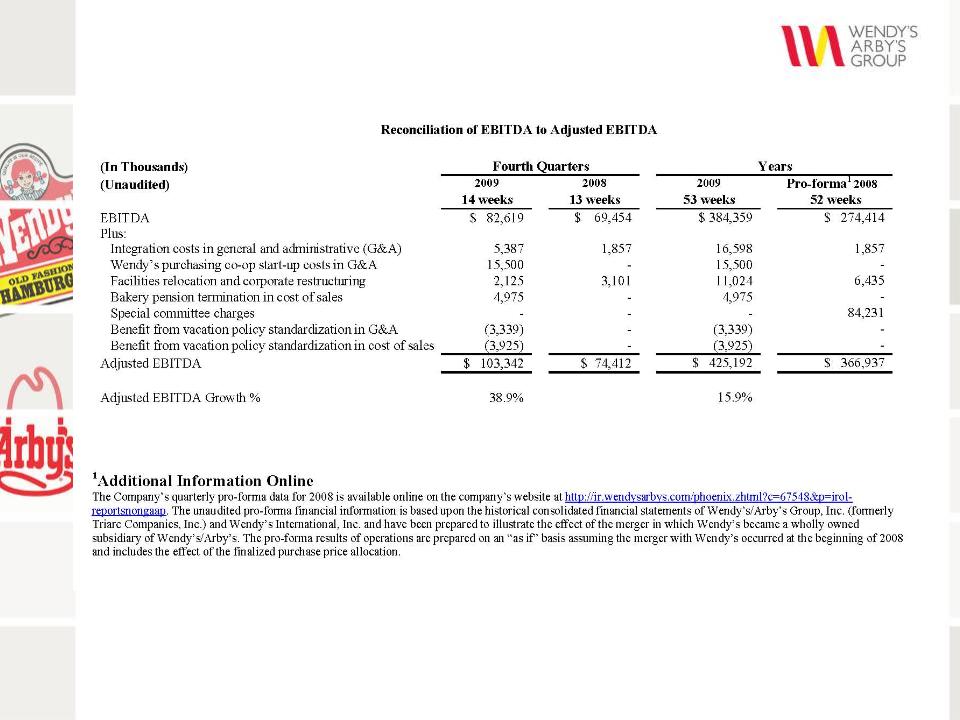
§ Adjusted
EBITDA* Grew 39% to $103.3 Million,
Including Effect of Additional Week in the Quarter
Including Effect of Additional Week in the Quarter
§ Strong Margin
Improvement at Wendy’s
− 420 basis
points improvement in company-operated stores
§ Sales and
Margins Declined at Arby’s
− Expanded
Everyday Value platform in Company units
*See
Appendix.
2009
Q4 Business Overview
8
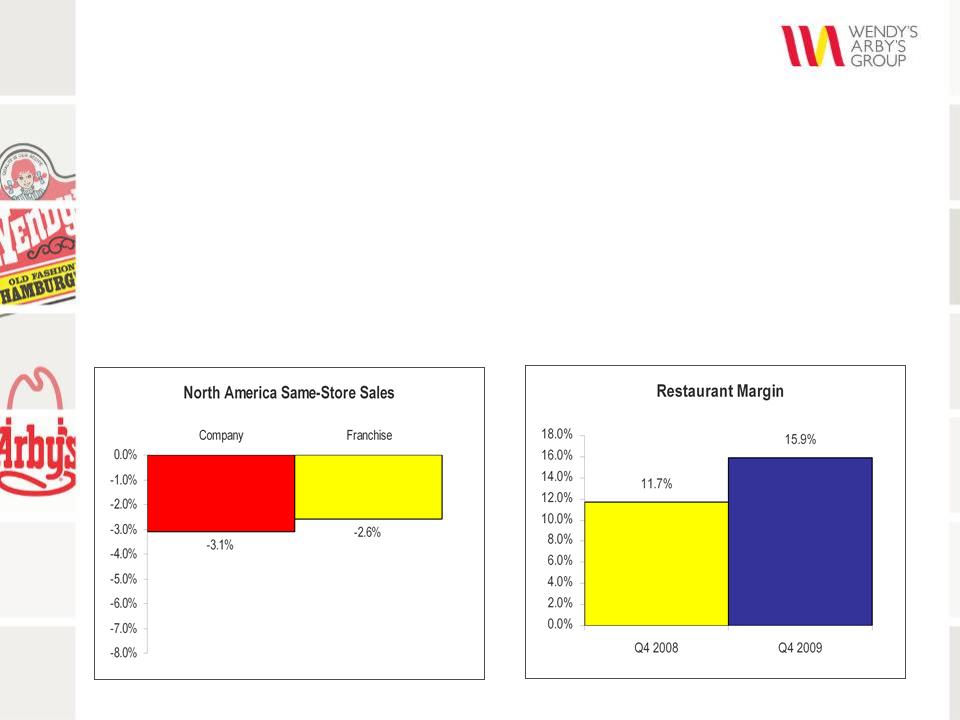
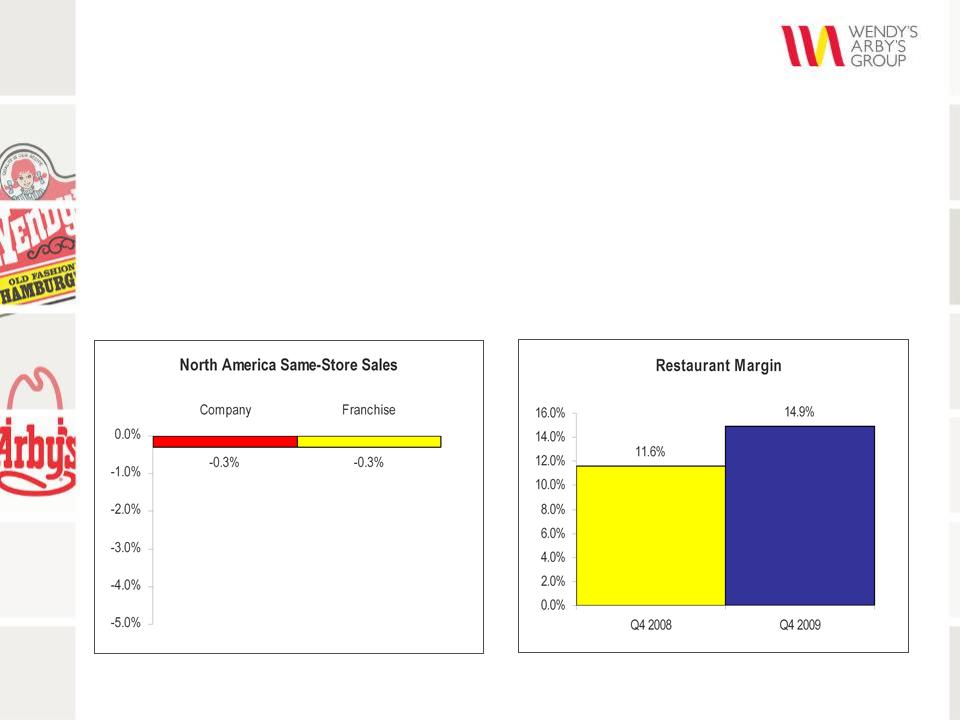
Wendy’s
2009 Q4 Results
§ North America
Systemwide Same-Store Sales Declined 3%
− SSS among
strongest in the industry
− Impacted by
challenging economic trends and strong Q4 2008
SSS of +3.7%
SSS of +3.7%
§ 420 bps
Margin Increase Driven by Operations, Pricing and
Favorable Commodities
Favorable Commodities
* Excludes
the effect (-1.0%) of fewer restaurants serving breakfast.
*
9
Wendy’s
Full-Year 2009 Results
§ North America
Systemwide Same-Store Sales Declined 0.7%
− Among the
best in the industry during a challenging year
§ Strong Margin
Increase of 330 bps Driven by Operations
Improvements and Pricing with No Impact from Commodities
Improvements and Pricing with No Impact from Commodities
* Excludes
the effect (-1.4%) of fewer restaurants serving breakfast.
*
110
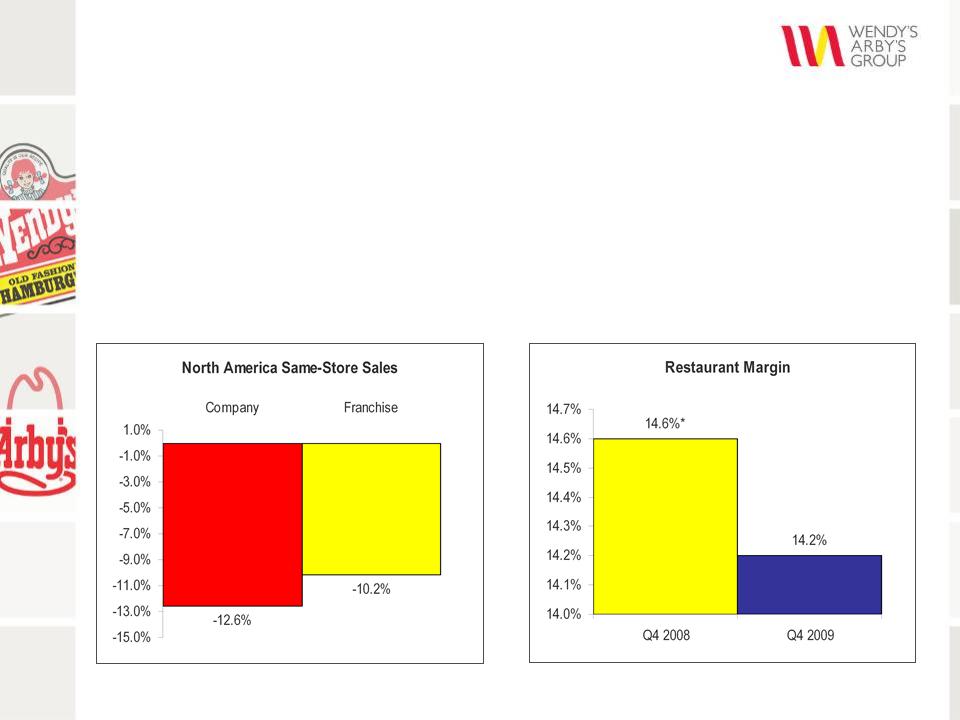
Arby’s
2009 Q4 Results
§ North America
Systemwide Same-Store Sales Declined 11%
− Impacted by
significant competitor discounting and challenging
economic trends
economic trends
§ Margin
Decreased Due to Sales Deleveraging
* Restaurant
Margin includes benefit of vacation policy
standardization (150 bps)
standardization (150 bps)
11
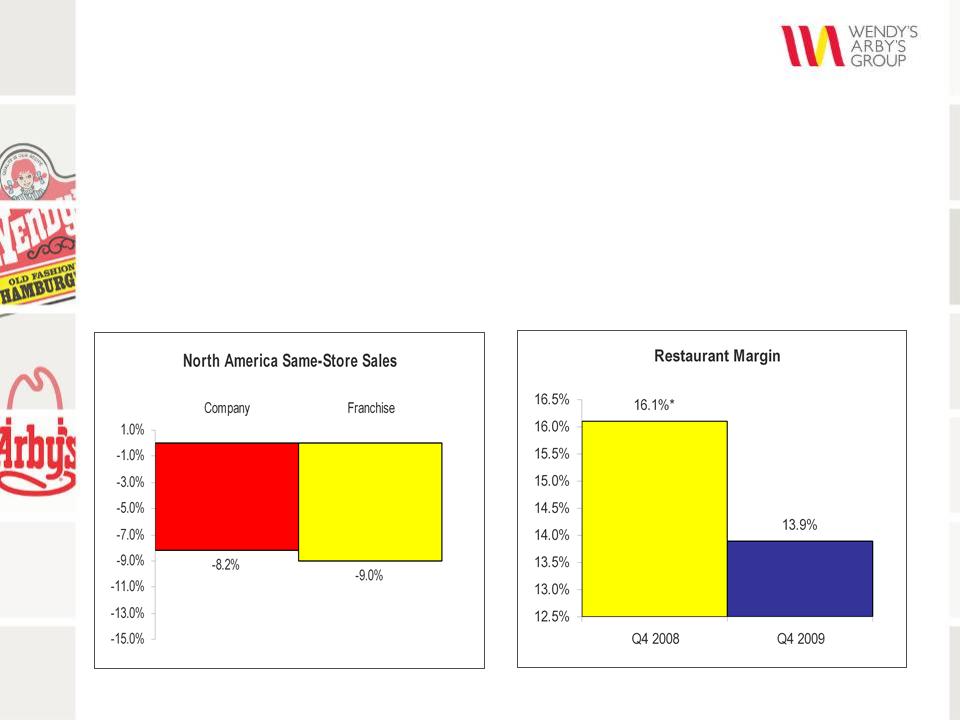
Arby’s
Full-Year 2009 Results
* Restaurant
Margin includes benefit of vacation policy
standardization (40 bps)
standardization (40 bps)
§ North America
Systemwide Same-Store Sales Declined 9%
− Impacted by
competitor discounting and lack of a value menu
offering
offering
§ Margins
Decreased Driven by Deleveraging
Financial
Overview
Steve Hare
Chief Financial Officer
13
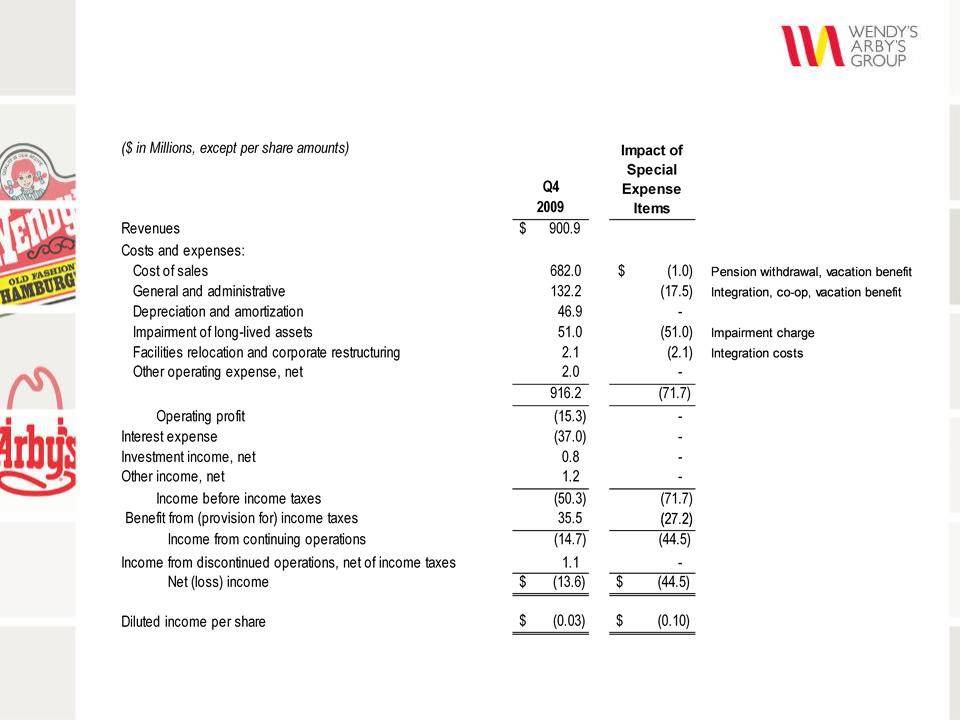
2009
Q4 Consolidated
Operating Results
Operating Results
14
*See
Appendix.
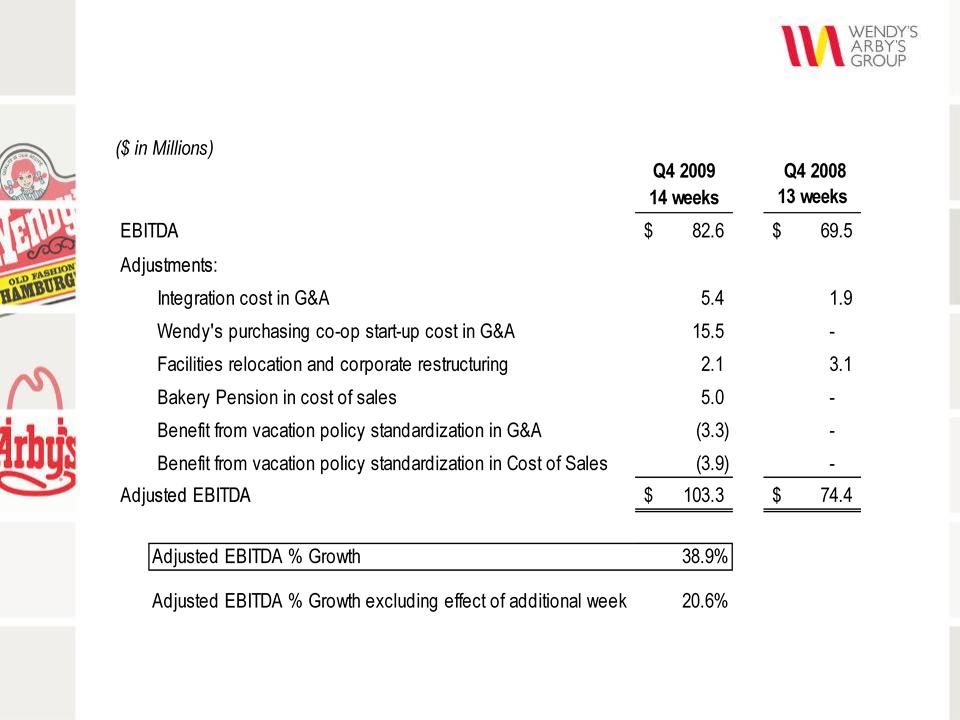
2009
Q4 EBITDA and
Adjusted EBITDA*
Adjusted EBITDA*
15
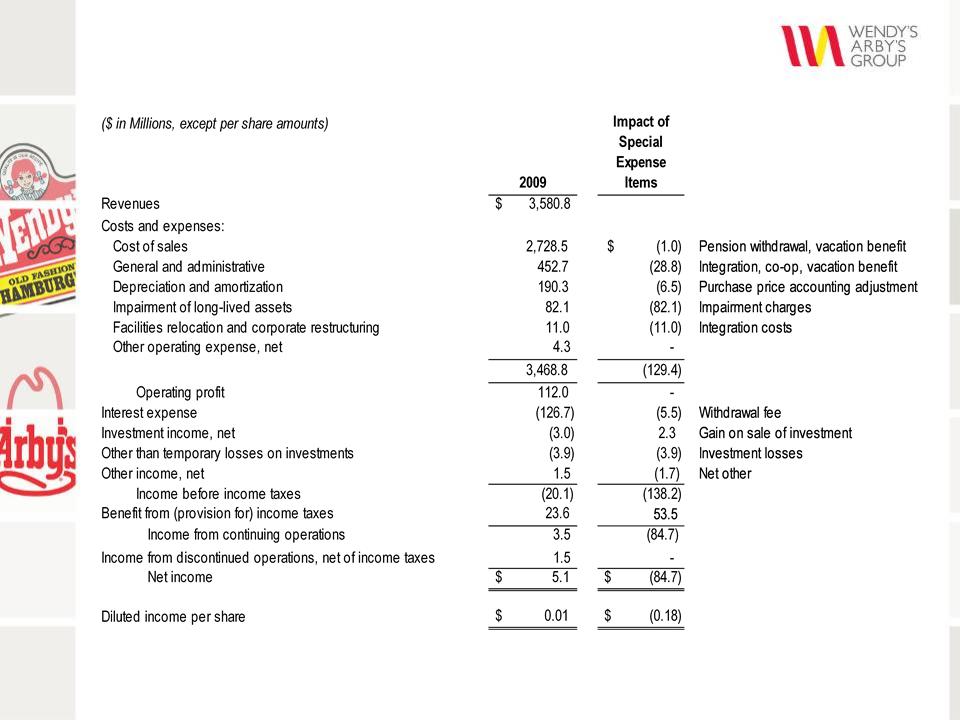
2009
Consolidated Operating Results
16
*See
Appendix.
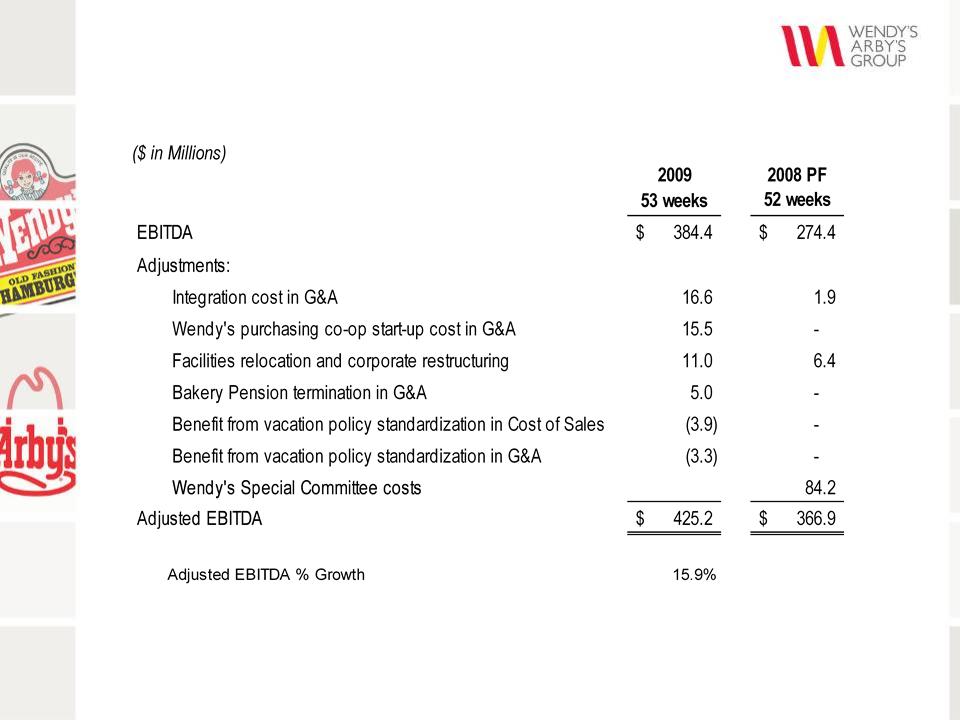
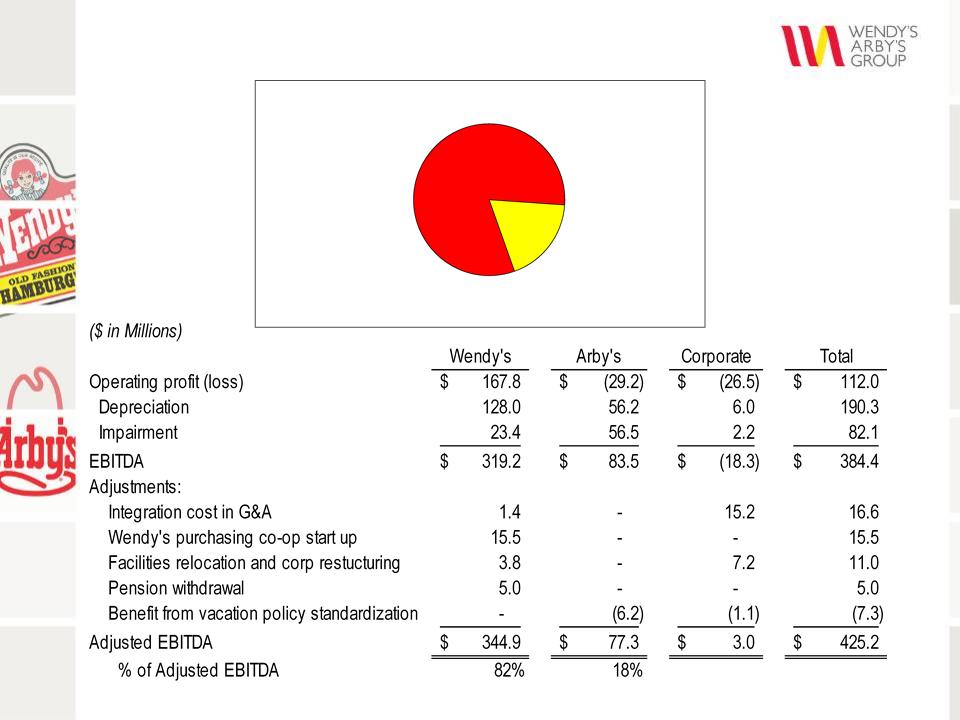
2009
EBITDA and Adjusted EBITDA*
17
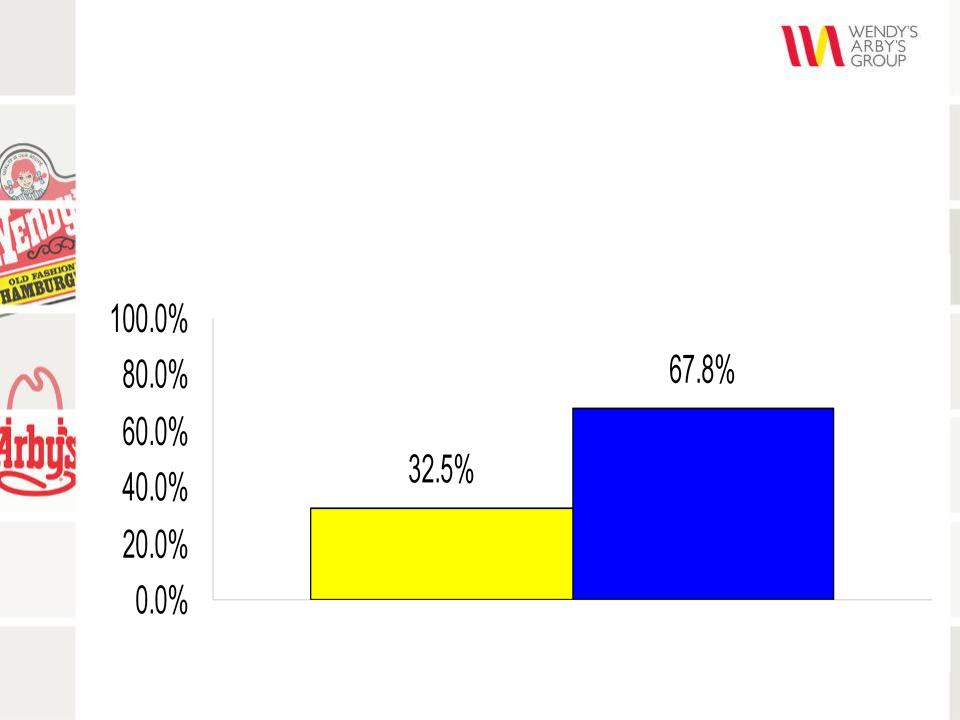
Wendy’s
Contributes Majority of Adjusted EBITDA
Wendy’s
82%
Arby’s
18%
%
of Consolidated Adjusted EBITDA
*See
Appendix.
2009
Adjusted EBITDA* by Brand
18
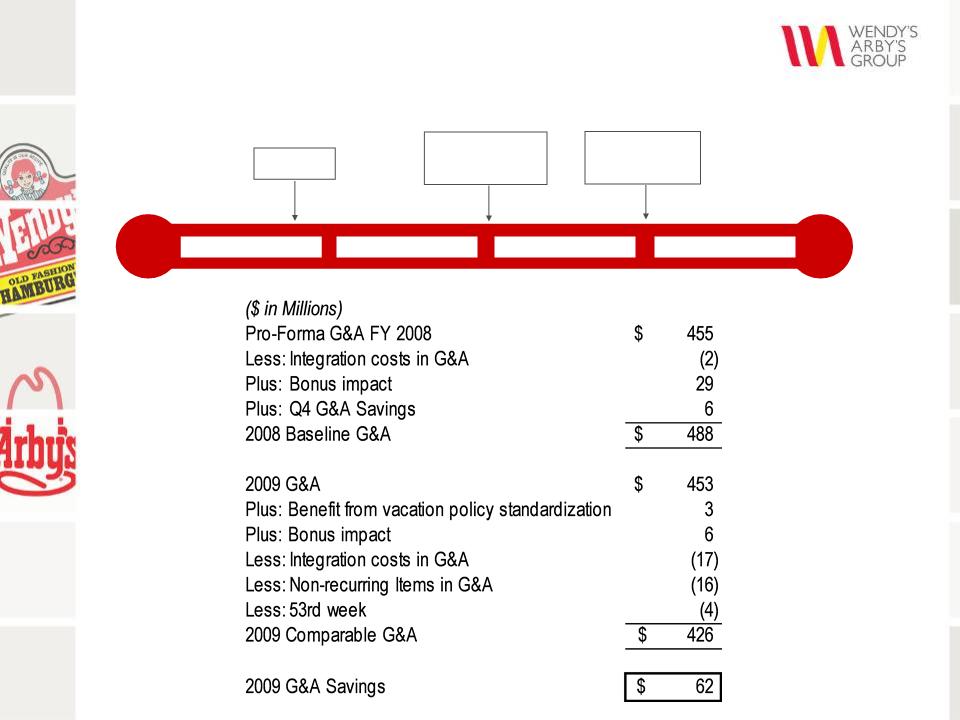
2008
2009
2010
2011
2009
Actual
$62
million
Plan
$60
million
Merger
Achieved
Targeted G&A
Synergies Ahead of Schedule
Synergies Ahead of Schedule
19
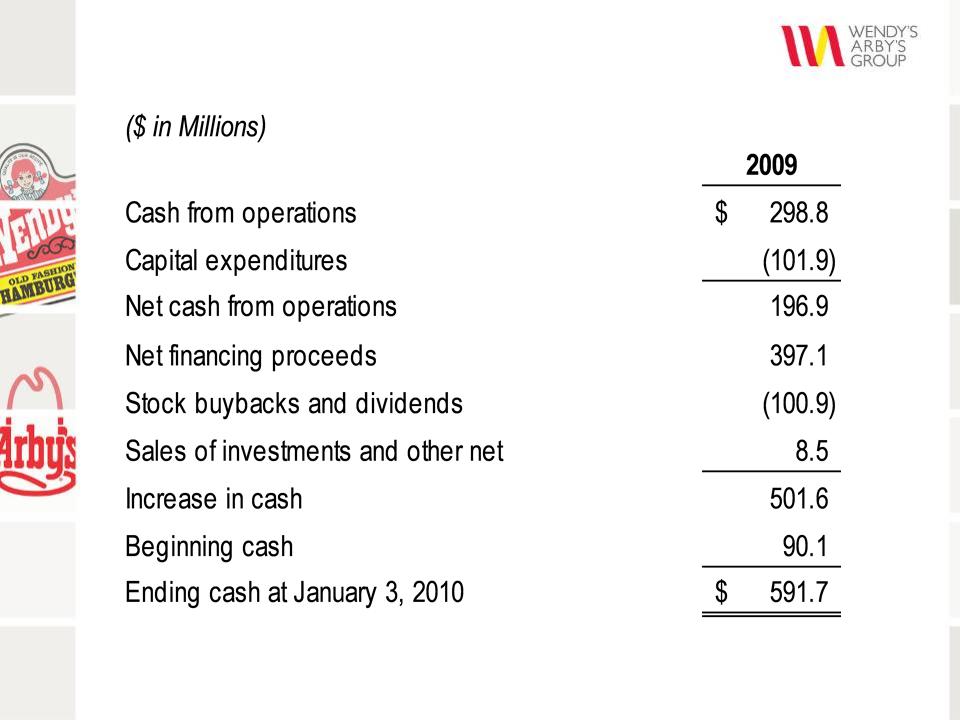
Strong
Cash Flow - 2009
20
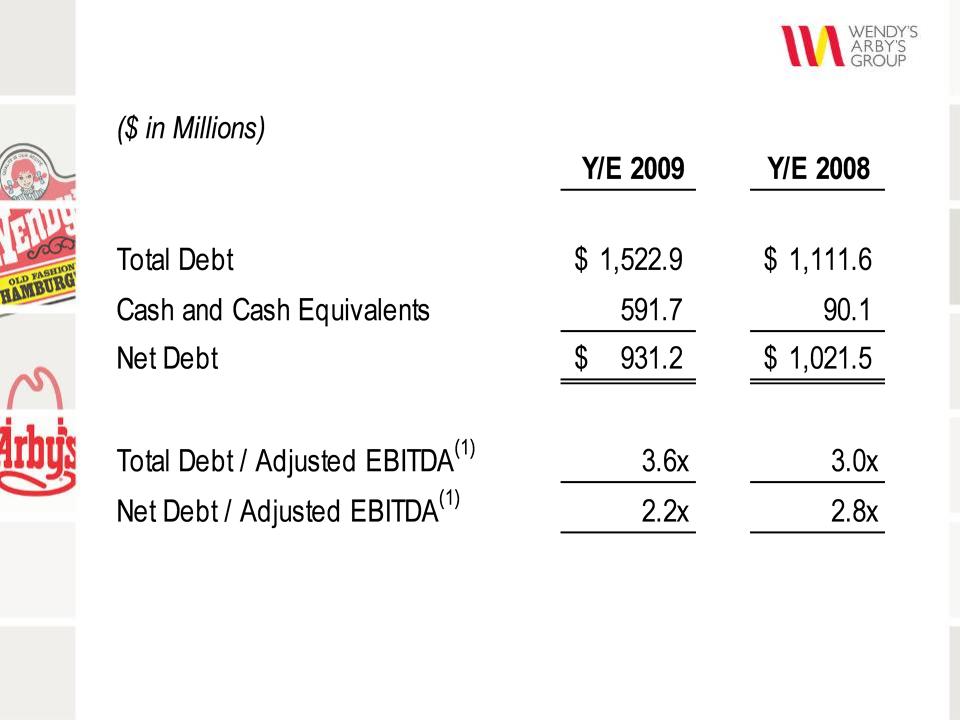
(1)Adjusted EBITDA for 2008
is pro-forma. See appendix.
Debt
Capitalization

21
§ Board
Increased Stock Repurchase Authorization to
$200 Million
$200 Million
– Company
purchased $120.2 million of common stock as
of February 26, 2010
of February 26, 2010
– 26.1 million
shares for approximately $4.61 per share
– Company may
repurchase additional shares as market
conditions warrant through January 2, 2011
conditions warrant through January 2, 2011
§ Quarterly
Cash Dividend
– $0.015 per
share
– Payable on
March 15, 2010 to stockholders of record as
of March 1, 2010
of March 1, 2010
Recent
Board Actions

2010
Overview
23
Source: Bureau
of Labor Statistics.
Unemployment
rate
remains
high at 9.7%
No
job growth in
the
U.S.
24
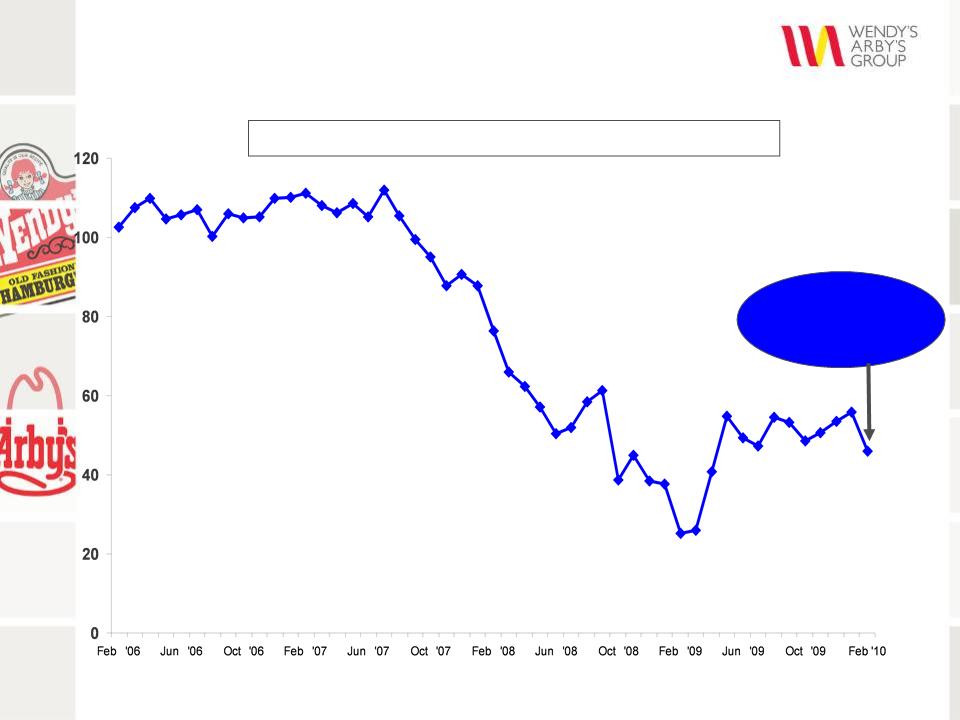
Consumer
Confidence Continues to
Run Below Healthy Economic Levels
Run Below Healthy Economic Levels
Source:
The Conference Board
Consumer
confidence
fell
10 points to a
10-month
low
Consumer
Confidence Index

25
Consumers
Continue to Pay Down Debt
Causing Less Consumer Spending
Causing Less Consumer Spending
Source: Federal
Reserve
Consumer
Revolving Credit Outstanding:
%
Change vs. Year Ago

26
§ Anticipate
Weak Economic Conditions to Continue
– High
unemployment
– Weak consumer
confidence
§ Positive SSS
at Wendy’s
§ Negative SSS
at Arby’s, but Improving Year-over-Year
§ Total Capital
Expenditure of $165 Million
– Open 12 new
Wendy’s
– Remodel 100
Wendy’s and 100 Arby’s
§ Low-to-Mid
Single Digit Growth in Adjusted EBITDA
– Excludes
effect of 53rd week ($14 million in 2009)
– Excludes
investment spending on Wendy’s breakfast
($9 million in 2010)
($9 million in 2010)
Financial
Outlook 2010

2010
Brand Overview
Roland
Smith
President & Chief Executive Officer
President & Chief Executive Officer

Wendy’s
Brand

29
§ Drive
Positive Same-Store Sales
– Balance
premium and value
– Continue
product innovation
– Reinforce
“Real” brand positioning
– Strategic
pricing project
§ Continue
Margin Improvement
§ Optimize New
Purchasing Co-op
§ Re-Launch
Breakfast Program and Expand to New Market
§ Execute
Remodeling Program
Wendy’s
Initiatives in 2010
30
Wendy’s
1st Quarter Calendar
January
February
March
99¢
Premium
Cod

31
Wendy’s
Strategic Pricing
§ Implementing
a Strategic Pricing Initiative to Drive
Same-Store Sales and Margins
Same-Store Sales and Margins
§ History:
– Wendy’s
priced on a national basis
– Over the past
two years, moved to regional pricing
§ New strategy
will price on a store-by-store basis
– Expect
benefit in 2011 and beyond
32
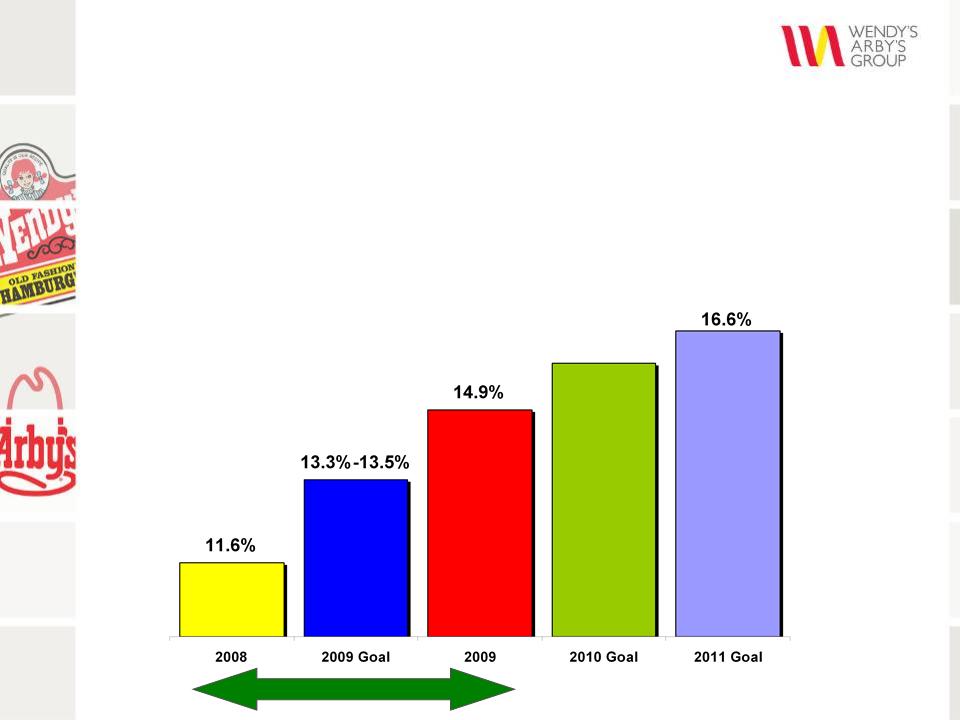
§ 2009: Goal was
160 to 180 bps Improvement
Achieved
330 bps Improvement
§ 2010: Goal is
to Continue Margin Expansion of 90 to 110 bps
(excluding incremental breakfast investment)
(excluding incremental breakfast investment)
§ 2011: Goal is
a Total Increase of 500 bps to 16.6%
330
bps 2009
15.8%-16.0%
Wendy’s
Margin Improvement
33
§ Steady
Improvement in Operations
– Number of “A”
and “B” stores increased by 35 points
Continue
to Improve Wendy’s
Restaurant
Operations
Q1
2008
Q4
2009
34
Optimize
Wendy’s New
Purchasing Co-op
Purchasing Co-op
§ Formed
National Supply Chain Co-op in January 2010
§ Co-op is
Managing Food and Related Product Purchases as
Well as Distribution Services
Well as Distribution Services
§ Offers Cost
Savings Opportunities While Maintaining the
Quality of the Wendy’s Brand
Quality of the Wendy’s Brand
35
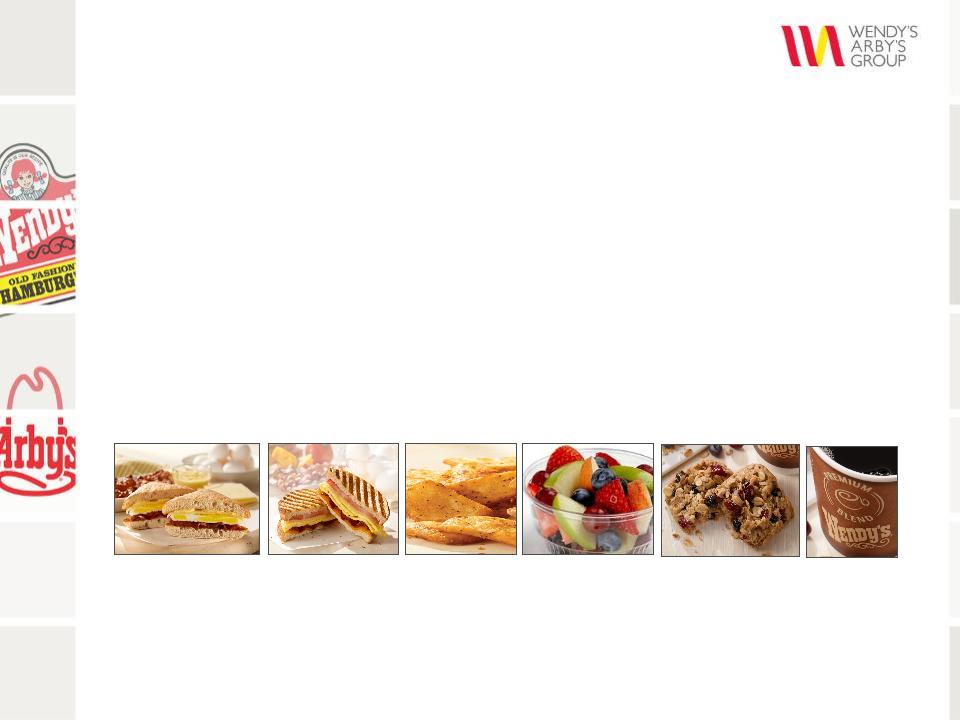
§ 2010
Plan:
– Introduce new
menu and program in 3 existing markets
– Expand into
additional company and franchise markets
• $9 million
incremental investment spend
Introduce
Wendy’s New Breakfast
Program and Expand
Program and Expand
36
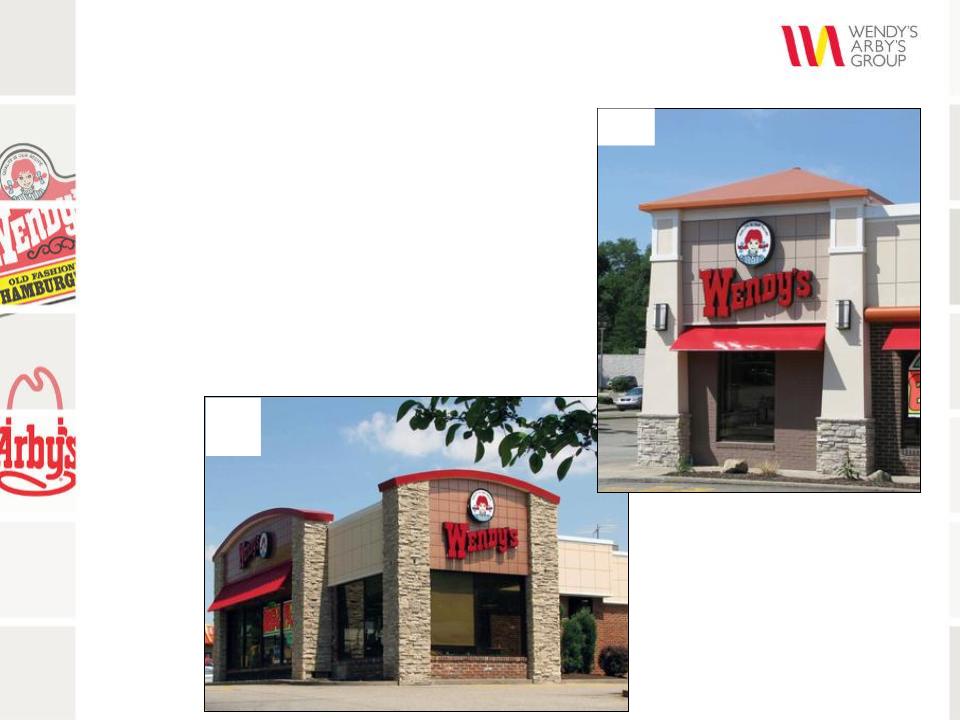
§ 2009: 90
Remodels Complete
§ 2010: 100
Remodels Planned
Curv
e
e
Tower
Wendy’s
Remodeling Plan

Arby’s
Brand

38
§ Recruit
Experienced Brand President
§ Execute
Turnaround Plan:
– Expand value
strategy
– Increase
media efficiency
– Validate
brand positioning
– Improve
advertising effectiveness
– Revitalize
product innovation
– Launch a
three-year remodeling program
Arby’s
2010 Initiatives

39
Arby’s
Unique Selling Proposition
§ Quality Food
Positioning
§ Unique,
Slow-Roasted and Freshly Sliced Roast Beef
Sandwiches
Sandwiches
§ A Menu that’s
an Alternative to Traditional Fast Food
Arby’s
Has One of the Highest
Check Averages in QSR
Check Averages in QSR
40
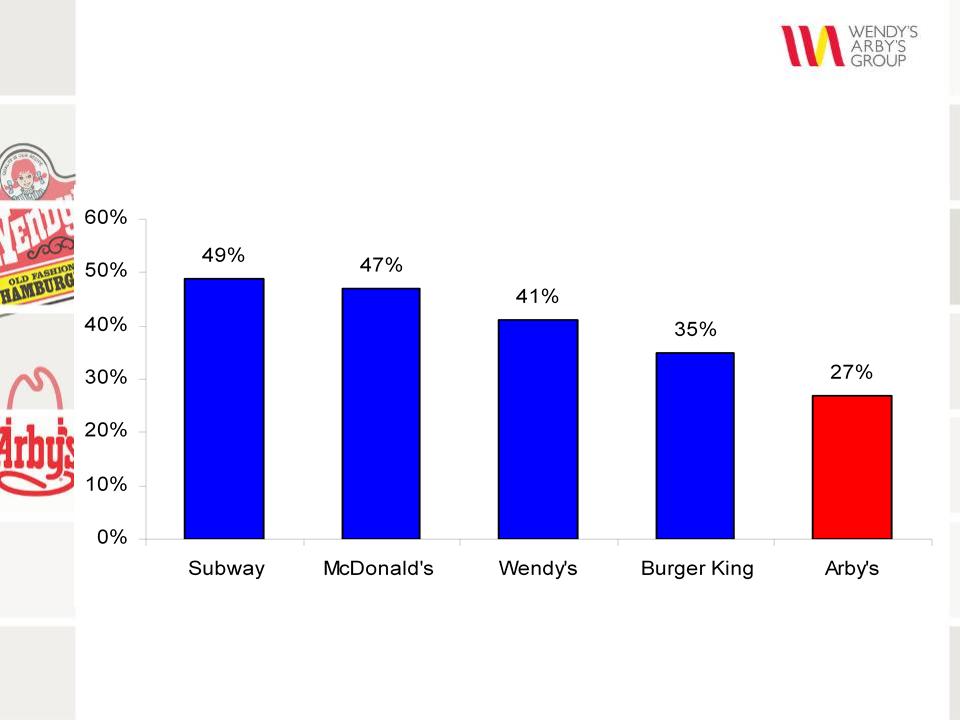
Arby’s
Rated Lowest in
“Worth
What You Pay for It”
Value
is Arby’s Biggest Issue
Source: Millward
Brown, Brand Tracking Study; represents % of consumers who agree “Worth What You
Pay for It”
41
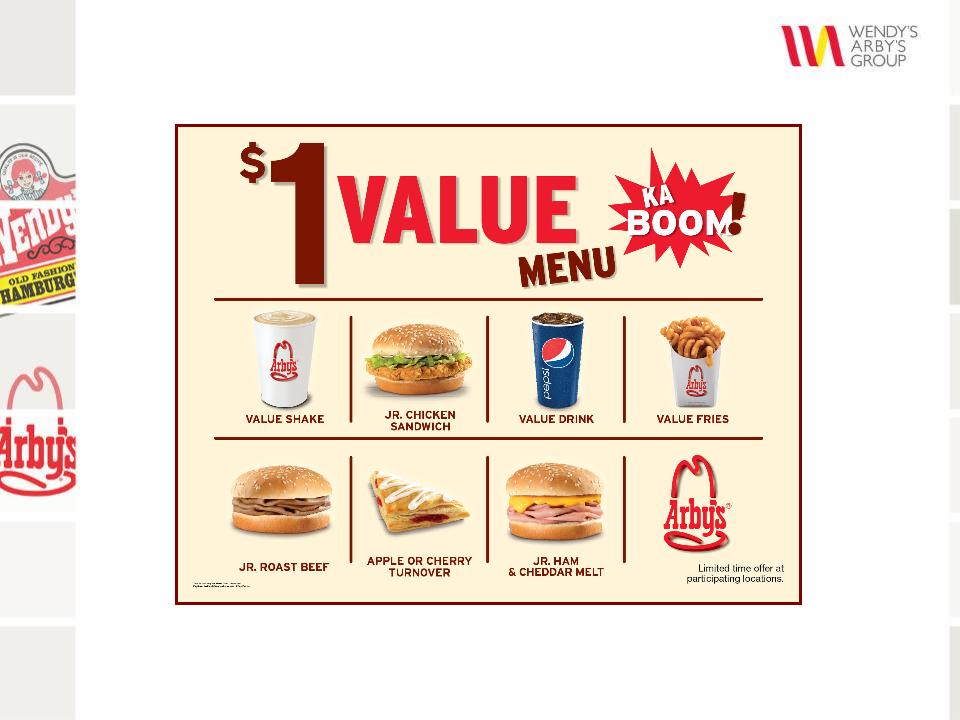
STARTING
AT
§ National
Advertising for $1 Value begins in April
Arby’s
- Value Strategy

42
Arby’s
Media Efficiency and
Advertising Effectiveness
Advertising Effectiveness
§ Increase
National Media Weight
§ Franchisees
Approved National Media Rate Increase from
1.2% to 2.5% Effective April 1
1.2% to 2.5% Effective April 1
§ New
Advertising Campaign begins in March
§ National
Advertising on New Value Menu Starts in April
43
§ 56% of Arby’s
System is “Pinnacle”
§ Remodel
Program
– 3-Year Plan
to Invest ($75-100M)
– Goal is 75%
as Pinnacle Image
§ 100 Remodels
in 2010
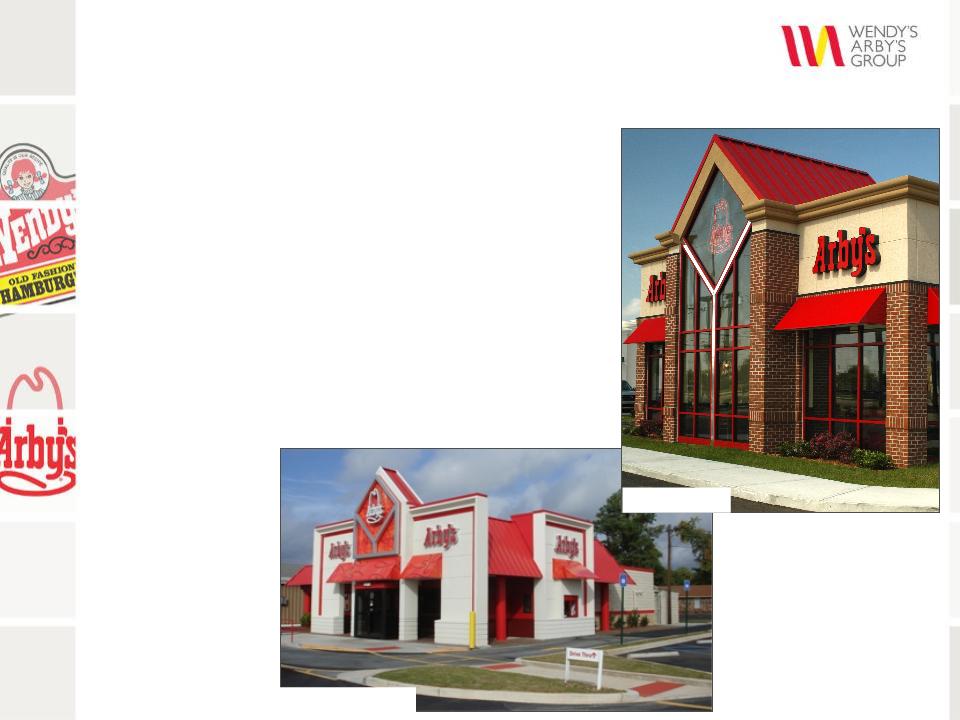
Launching
Arby’s Three-Year
Remodel Program
Remodel Program
Pinnacle
Remodel
New
Pinnacle

International
45
§ 2009:
– Contractual
commitments for more than
300 new restaurants
300 new restaurants
§ 2010:
– Targeting
development agreements for
approximately 400 restaurants
approximately 400 restaurants
• Expand
existing markets
• Enter 4 new
countries
• Identify a
new partner for Japan
– New
openings
• 35-45 new
franchise units
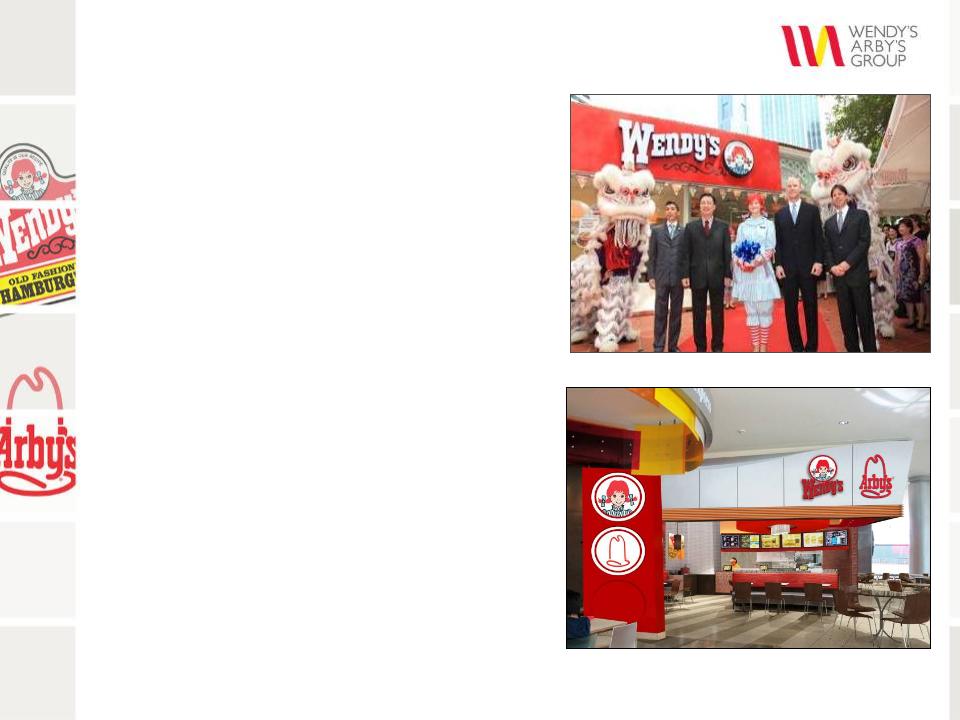
• First
dual-branded unit opening in Dubai
in Q2
in Q2
§ Long-Term:
– Potential for
8,000 restaurants outside of
North America
North America
Singapore
1st Store Grand Opening
Artist
rendering of first dual-branded unit in the Middle East
International
Growth

46
§ Invest in
Future Growth
– Breakfast
expansion
– Remodeling
– International
§ Drive
Positive Same-Store Sales and Continue Margin
Improvement at Wendy’s
Improvement at Wendy’s
§ Turnaround
Arby’s and Improve Same-Store Sales
§ Continue to
Identify G&A Efficiencies
§ Leverage
Purchasing Power of Both Brands
§ Deliver
Low-to-Mid Single Digits Growth in 2010
Adjusted EBITDA
Adjusted EBITDA
§ Expect to
Return to Mid-Teens Adjusted EBITDA
Growth in 2011
Growth in 2011
2010
Summary

www.wendysarbys.com
Q&A

Appendix
49
50