Attached files
| file | filename |
|---|---|
| EX-10.1 - EXHIBIT 10.1 - TREX CO INC | dex101.htm |
| EX-32 - EXHIBIT 32 - TREX CO INC | dex32.htm |
| EX-23 - EXHIBIT 23 - TREX CO INC | dex23.htm |
| EX-31.1 - EXHIBIT 31.1 - TREX CO INC | dex311.htm |
| EX-31.2 - EXHIBIT 31.2 - TREX CO INC | dex312.htm |
| EX-21 - EXHIBIT 21 - TREX CO INC | dex21.htm |
UNITED STATES
SECURITIES AND EXCHANGE COMMISSION
Washington, D.C. 20549
Form 10-K
(Mark One)
| þ | ANNUAL REPORT PURSUANT TO SECTION 13 OR 15(d) OF THE SECURITIES EXCHANGE ACT OF 1934 |
For the fiscal year ended December 31, 2009
| ¨ | TRANSITION REPORT PURSUANT TO SECTION 13 OR 15(d) OF THE SECURITIES EXCHANGE ACT OF 1934 |
For the transition period from to
Commission file number: 001-14649
Trex Company, Inc.
(Exact name of registrant as specified in its charter)
| Delaware | 54-1910453 | |
| (State or other jurisdiction of incorporation or organization) |
(I.R.S. Employer Identification No.) | |
| 160 Exeter Drive, Winchester, Virginia | 22603-8605 | |
| (Address of principal executive offices) | (Zip Code) | |
(540) 542-6300
Registrant’s telephone number, including area code:
Securities registered pursuant to Section 12(b) of the Act:
| Title of each class: |
Name of each exchange on which registered: | |
| Common Stock, par value $0.01 per share | New York Stock Exchange |
Securities registered pursuant to Section 12(g) of the Act:
None
Indicate by check mark if the registrant is a well-known seasoned issuer, as defined in Rule 405 of the Securities Act. Yes ¨ No þ
Indicate by check mark if the registrant is not required to file reports pursuant to Section 13 or Section 15(d) of the Exchange Act. Yes ¨ No þ
Indicate by check mark whether the registrant (1) has filed all reports required to be filed by Section 13 or 15(d) of the Securities Exchange Act of 1934 during the preceding 12 months (or for such shorter period that the registrant was required to file such reports), and (2) has been subject to such filing requirements for the past 90 days. Yes þ No ¨
Indicate by check mark whether the registrant has submitted electronically and posted on its corporate web site, if any, every Interactive Data File required to be submitted and posed pursuant to Rule 405 of Regulation S-T during the preceding 12 months. Yes ¨ No þ
Indicate by check mark if disclosure of delinquent filers pursuant to Item 405 of Regulation S-K is not contained herein, and will not be contained, to the best of registrant’s knowledge, in definitive proxy or information statements incorporated by reference in Part III of this Form 10-K or any amendment to this Form 10-K. þ
Indicate by check mark whether the registrant is a large accelerated filer, an accelerated filer, a non-accelerated filer, or a smaller reporting Company. See the definitions of “large accelerated filer,” “accelerated filer” and “smaller reporting Company” in Rule 12b-2 of the Exchange Act.
| Large accelerated filer ¨ | Accelerated filer þ | |
| Non-accelerated filer ¨ (Do not check if a smaller reporting Company) | Smaller reporting Company ¨ |
Indicate by check mark whether the registrant is a shell Company (as defined in Rule 12b-2 of the Exchange Act). Yes ¨ No þ
The aggregate market value of the registrant’s common equity held by non-affiliates of the registrant at June 30, 2009, which was the last business day of the registrant’s most recently completed second fiscal quarter, was approximately $191.0 million based on the closing price of the common stock as reported on the New York Stock Exchange on such date and assuming, for purposes of this computation only, that the registrant’s directors, executive officers and beneficial owners of 10% or more of the registrant’s common stock are affiliates.
The number of shares of the registrant’s common stock outstanding on March 9, 2010 was 15,452,256.
DOCUMENTS INCORPORATED BY REFERENCE
Portions of the following documents are incorporated by reference in this Form 10-K as indicated herein:
| Document |
Part of 10-K into which incorporated | |
| Proxy Statement relating to Registrant’s 2010 Annual Meeting of Stockholders |
Part III |
TABLE OF CONTENTS
| Page | ||||
| PART I | ||||
| Item 1. |
1 | |||
| Item 1A. |
10 | |||
| Item 1B. |
13 | |||
| Item 2. |
13 | |||
| Item 3. |
13 | |||
| PART II | ||||
| Item 5. |
15 | |||
| Item 6. |
17 | |||
| Item 7. |
Management’s Discussion and Analysis of Financial Condition and Results of Operations |
19 | ||
| Item 7A. |
28 | |||
| Item 8. |
28 | |||
| Item 9. |
Changes in and Disagreements With Accountants on Accounting and Financial Disclosure |
28 | ||
| Item 9A. |
28 | |||
| Item 9B. |
31 | |||
| PART III | ||||
| Item 10. |
32 | |||
| Item 11. |
32 | |||
| Item 12. |
Security Ownership of Certain Beneficial Owners and Management and Related Stockholder Matters |
32 | ||
| Item 13. |
Certain Relationships and Related Transactions, and Director Independence |
32 | ||
| Item 14. |
32 | |||
| PART IV | ||||
| Item 15. |
33 | |||
| F-1 | ||||
i
NOTE ON FORWARD-LOOKING STATEMENTS
This report, including the information it incorporates by reference, contains forward-looking statements within the meaning of Section 27A of the Securities Act of 1933 and Section 21E of the Securities Exchange Act of 1934. We intend our forward-looking statements to be covered by the safe harbor provisions for forward-looking statements in these sections. All statements regarding our expected financial position and operating results, our business strategy, our financing plans, forecasted demographic and economic trends relating to our industry and similar matters are forward-looking statements. These statements can sometimes be identified by our use of forward-looking words such as “believe,” “may,” “will,” “anticipate,” “estimate,” “expect” or “intend.” We cannot promise you that our expectations in such forward-looking statements will turn out to be correct. Our actual results could be materially different from our expectations because of various factors, including the factors discussed under “Risk Factors” in this report.
ii
Some of the information contained in this report concerning the markets and industry in which we operate is derived from publicly available information and from industry sources. Although we believe that this publicly available information and the information provided by these industry sources are reliable, we have not independently verified the accuracy of any of this information.
| Item 1. | Business |
General
Trex Company, Inc., (the “Company”), founded as a Delaware corporation in 1999, is the largest U.S. manufacturer of wood-alternative decking, railing, fencing and trim products, which are marketed under the brand name Trex®. Our principal executive offices are located at 160 Exeter Drive, Winchester, Virginia 22603, and our telephone number at that address is (540) 542-6300.
Products
We offer a comprehensive set of aesthetically durable, low maintenance product offerings in the decking, railing, fencing and trim categories. We believe that the range and variety of our product offerings allow consumers to design much of their outdoor living space using Trex brand products.
The majority of our products are made in a proprietary process that combines waste wood fibers and reclaimed polyethylene. Our decking, railing, fencing and trim products are provided in a wide selection of popular sizes and lengths and are available with several finishes and/or numerous colors.
We market our decking products under seven brand names:
| • | Trex Accents®, which offers a smooth surface on one side and subtle wood grain on the other; |
| • | Trex Accents Fire Defense®, which is a deck board that meets stringent new fire resistant requirements for certain areas of the Western United States; |
| • | Trex Brasilia®, which replicates the look of tropical hardwoods with a smooth surface and subtle, random color variations; |
| • | Trex Contours®, which has a deep, wood grain surface; |
| • | Trex Escapes®, which is an ultra-low maintenance cellular PVC deck board; |
| • | Trex Origins®, which features a smooth surface; and |
| • | Trex TranscendTM , which features a protective shell for enhanced protection against fading, staining and scratching. |
We also have Trex Hideaway®, which is a hidden fastening system for specially grooved boards.
Our two railing products are Trex Designer Series Railing® and Trex TranscendTM Railing. Our Designer Series Railing system consists of a decorative top and bottom rail, refined balusters, our Trex RailPost™, and post caps and skirts. In addition to its styling benefits for consumers, this railing is fast and easy to construct for contractors that use our TrexExpress™ assembly tool and system. The Designer railing is available in our smooth Trex Origins finish and color palette, as well as in the Trex Brasilia finish and colors. Trex Transcend Railing is available in a white finish that makes it appropriate for use with Trex decking products as well as other decking materials, which we believe will enhance the sales prospects of our railing business, and in the colors of Trex Transcend decking. This railing product is manufactured with Fibrex® material, which is a patented technology that we license from Andersen Corporation.
1
We offer two fencing products. Each product consists of structural posts, bottom rail, pickets, top rail and decorative post caps. The Trex Seclusions® fencing product uses interlocking pickets for privacy, and the Trex Surroundings® fencing uses traditional pickets. These systems have been well received by fencing installers and provide the homeowner a superior combination of low maintenance, durability and premium aesthetics which are designed to complement the outdoor living experience provided by Trex decking and railing products.
Our TrexTrim™ product is a low maintenance cellular PVC residential exterior trim product that offers exceptional workability, durability, visual appeal and a low level of required maintenance.
Trex products offer a number of significant aesthetic advantages over wood while eliminating many of wood’s major functional disadvantages, which include warping, splitting and other damage from moisture. Our products require no staining, are resistant to moisture damage, provide a splinter-free surface and need no chemical treatment against rot or insect infestation. These features eliminate most of the on-going maintenance requirements for a wood deck and make Trex products less costly than wood over the life of the deck. Like wood, Trex products are slip-resistant (even when wet), can be painted or stained and are less vulnerable to damage from ultraviolet rays. Special characteristics (including resistance to splitting, the ability to bend, and ease and consistency of machining and finishing) facilitate deck, railing, fencing and trim installation, reduce contractor call-backs and afford customers a wide range of design options. Trex products do not have the tensile strength of wood and, as a result, are not used as primary structural members in posts, beams or columns used in a deck’s substructure.
We have received product building code listings from the major U.S. and Canadian building code listing agencies for both our decking and railing systems. Our listings facilitate the acquisition of building permits by deck builders and promote consumer and industry acceptance of our products as an alternative to wood in decking. In addition, Trex Seclusions privacy fencing has passed the Miami/Dade County wind load testing, a widely regarded standard for assessing a fencing product’s performance under extreme environmental conditions.
Growth Strategies
Our long-term goal is to perpetuate our position as the leading producer of branded superior wood-alternative outdoor living products by increasing our market share and expanding into new product categories and geographic markets. To attain this goal, we intend to employ the following long-term strategies:
| • | Innovation: Bring to the market new products that address unmet consumer and trade professional needs. Provide a compelling value proposition through ease of installation, low maintenance, long-term durability and superior aesthetics. |
| • | Brand: Continue to build preference and commitment for the Trex brand with both the consumer and trade professional. Deliver on the brand’s promise of superior quality, functionality, aesthetics and overall performance in the outdoor living space. |
| • | Channels: Achieve comprehensive market segment and geographic coverage for Trex products by increasing the number of stocking dealers and retailers, thereby making our products available wherever our customers choose to purchase their decking, railing, and fencing and trim products. |
| • | Quality: Continuously advance the quality of all operational and business processes, with the goal of achieving superior product quality and service levels, thereby giving our Company a sustainable competitive advantage. |
| • | Cost: Through capital investments and process engineering, continuously seek to lower the cost to manufacture Trex products. Investments in plastic recycling capabilities will allow us to expand our ability to use a wider breadth of waste streams and, as a result, lower our raw material costs. We plan to concentrate on improving the productivity of our production process, from raw materials preparation through extrusion into finishing and packaging. |
2
Customers and Distribution
We distribute and/or sell our products through wholesale distribution and sell our products primarily to retail lumber dealers, retail building material specialty builders, Home Depot and Lowe’s.
Wholesale Distributors. In 2009, we generated the majority of our net sales through our wholesale distribution network by selling Trex products to wholesale companies. Our distributors, in turn, marketed our products to retail lumber outlets across North America. Although our dealers sell to both homeowners and contractors, they primarily direct their sales at professional contractors, remodelers and homebuilders.
We believe that attracting wholesale distributors, who are committed to our products and marketing approach and can effectively sell higher value products to contractor-oriented lumber yards and other retail outlets, is important to our future growth. Our distributors are able to provide value-added service in marketing our products because they sell premium wood decking products and other innovative building materials that typically require product training and personal selling efforts.
We typically appoint a distributor on a non-exclusive basis to distribute Trex products within a specified area. The distributor generally purchases our products at prices in effect at the time we ship the product to the distributor.
Based on our 2009 gross sales, sales to two of our distributors, Boise Cascade Corporation and Capital Lumber, exceeded 10% of our gross sales.
Retail Lumber Dealers. Our products are sold in independent lumber yards that emphasize sales to contractors. Although there is demand for our products from both the “do-it-yourself” homeowner and contractor, our sales efforts historically have emphasized the contractor-installed market. Contractor-installed decks generally are larger installations with professional craftsmanship. Our retail dealers generally provide sales personnel trained in Trex products, contractor training, inventory commitment and point-of-sale display support.
Retail Building Material Specialty Dealers. Composite decking is increasingly being sold through dealers that specialize in specific product lines instead of general lumber sales. These dealers include roofing and siding supply companies. We are focusing more attention on these distribution channels as we seek to make our products available at any retail location where contractor, builder or homeowner customers choose to purchase their decking.
Home Depot and Lowe’s. We sell our products through Home Depot and Lowe’s stores. Although Home Depot and Lowe’s serve the contractor market, the largest part of their sales are to “do-it-yourself” homeowner customers that shop for their materials at Home Depot and Lowe’s stores rather than at retail lumber dealers. We believe that brand exposure through Home Depot and Lowe’s distribution promotes consumer acceptance and generates sales to contractors that purchase from independent dealers.
Manufacturing Process
We have manufacturing facilities in Winchester, Virginia and Fernley, Nevada, which had floor space of approximately 265,000 square feet and 250,000 square feet, respectively, at December 31, 2009. In September 2007, we suspended operations at our Olive Branch facility and consolidated all of our manufacturing operations into our Winchester and Fernley sites. Our manufacturing capacity utilization rate was 32%, excluding the Olive Branch facility, during the year ended December 31, 2009.
Trex products are primarily manufactured from waste wood fiber and reclaimed polyethylene, which we sometimes refer to as “PE material” in this report. Our primary manufacturing process involves mixing wood particles with plastic, heating and finally extruding, or forcing, the highly viscous and abrasive material through a profile die. We have many proprietary and skill-based advantages in this process.
3
Production of a non-wood decking alternative such as ours requires significant capital investment, special process expertise and time to develop. We have continuously invested the capital necessary to expand our manufacturing capacity and improve our manufacturing processes. We have obtained, and continue to seek, patents with respect to our manufacturing process. We have also broadened the range of raw materials that we can use to produce a consistent and high-quality finished product. We maintain research and development operations in the Trex Technical Center adjacent to our Winchester, Virginia manufacturing facilities. In connection with our building code listings, we maintain a quality control testing program that is monitored by an independent inspection agency.
In 2005, we initiated Company-wide training and implementation of Six Sigma practices and in 2006 began implementation of Standard Lean Manufacturing methodology within our plant operations. These initiatives were significantly reenergized and expanded in 2008 and 2009. We are incorporating the use of these tools throughout our Company in the planning and execution of those projects that are the most important to our success.
Suppliers
The production of most of our products requires the supply of waste wood fiber and PE material.
The Company fulfills requirements for raw materials under both purchase orders and supply contracts. In the year ended December 31, 2009, the Company purchased substantially all of its waste wood fiber requirements under purchase orders, which do not involve long-term supply commitments. Substantially all of the Company’s PE material purchases are under short-term supply contracts that average two years, for which pricing is negotiated as needed. The PE material supply contracts have not had a material adverse effect on the Company’s business.
Waste Wood Fiber. Woodworking plants or mills are our preferred suppliers of waste wood fiber because the waste wood fiber produced by these operations contains little contamination and is low in moisture. These facilities generate waste wood fiber as a byproduct of their manufacturing operations.
If the waste wood fiber meets our specifications, our waste wood fiber supply contracts generally require us to purchase at least a specified minimum and at most a specified maximum amount of waste wood fiber each year. Depending on our needs, the amount of waste wood fiber that we actually purchase within the specified range under any supply contract may vary significantly from year to year.
PE Material. The PE material we consumed in 2009 was primarily composed of recovered plastic bags and plastic film. Approximately two billion pounds of polyethylene resin are used in the manufacture of plastic bags and stretch film in the United States each year. We will continue to seek to meet our future needs for plastic from the expansion of our existing supply sources and the development of new sources, including post-industrial waste and plastic coatings. We believe our use of multiple sources provides us with a cost advantage and facilitates an environmentally responsible approach to our procurement of PE material.
Our ability to source and use a wide variety of PE material is important to our cost strategy. We maintain this ability through the continued expansion of our plastic reprocessing operations in combination with the advancement of our proprietary material preparation and extrusion processes.
We own a 35% equity interest in a joint venture, called Denplax S.A., which operates a plant in El Ejido, Spain. Our joint venture partners are a local Spanish Company responsible for public environmental programs in southern Spain and an Italian equipment manufacturer. The plant is designed to recycle waste polyethylene generated primarily from agricultural and post-consumer sources. The plant delivered approximately 12% of the total PE material we purchased during 2009.
4
Third-Party Manufacturing. The Company outsources the production of certain products to third-party manufacturers under supply contracts that commit the Company to purchase minimum levels for each year extending through 2011. The Company is subject to monetary penalties if it fails to purchase a minimum volume as specified in the contracts.
Competition
In decking, we compete with wood and other manufacturers of wood alternative decking products. Many of the conventional lumber suppliers with which we compete have established ties to the building and construction industry and have well-accepted products. In railing, we compete with wood and other manufacturers of composite, non-wood and plastic products, as well as with railings using metal, glass, vinyl and other materials. In privacy fencing, we compete with wood, vinyl and other manufacturers of composites. In trim, we compete against wood, engineered wood, fiber cement, and other manufacturers of cellular PVC and similar plastic products.
Our primary competition consists of wood products, which constituted a substantial majority of 2009 decking and railing sales, as measured by linear feet of lumber. A majority of the lumber used in wooden decks is pressure-treated lumber. Southern yellow pine and fir have a porosity that readily allows the chemicals used in the pressure treating process to be absorbed. The same porosity makes southern yellow pine susceptible to taking on moisture, which causes the lumber to warp, crack, splinter and expel fasteners. In addition to pine and fir, other segments of wood material for decking include redwood, cedar and tropical hardwoods, such as ipe, teak and mahogany. These products are often significantly more expensive than pressure-treated lumber, but do not eliminate many of the disadvantages of other wood products.
Industry studies indicate that we have the leading market share of the wood/plastic composite segment of the decking and railing market. Our principal competitors in the wood/plastic composite decking and railing market include Advanced Environmental Recycling Technologies, Inc., Fiber Composites, LLC, Tamko Building Products, Inc., Timbertech Limited, and Universal Forest Products, Inc.
We also compete with decking products made from 100% plastic lumber that utilizes polyethylene, fiberglass and PVC as raw materials. Although there are several companies in the United States that manufacture 100% plastic lumber, this segment accounted for only a very small percentage of 2009 decking sales. We believe a number of factors have limited the success of 100% plastic lumber manufacturers, including poor product aesthetics and physical properties not considered suitable for decking, such as higher thermal expansion and contraction and poor slip resistance. We believe that Trex Escapes, an ultra-low maintenance cellular PVC deck board, is superior, both in terms of product aesthetics and physical properties, to 100% plastic lumber products available in the market.
Our ability to compete depends, in part, on a number of factors outside our control, including the ability of our competitors to develop new non-wood decking and railing alternatives that are competitive with our products. We believe that the principal competitive factors in the decking and railing market include product quality, price, aesthetics, maintenance cost, distribution and brand strength. We believe we compete favorably with respect to these factors. We believe that our products offer aesthetic and cost advantages over the life of a deck when compared to other types of decking and railing materials. Although a contractor-installed deck built with Trex products in 2009 using a pressure-treated wood substructure generally costs more than a deck made entirely from pressure-treated wood, Trex products eliminate most of the on-going maintenance required for a pressure-treated deck and are, therefore, less costly over the life of the deck. We believe that our manufacturing process and utilization of relatively low-cost raw material sources provide us with a competitive cost advantage relative to other wood/plastic composite and 100% plastic decking products. The scale of our operations also confers cost efficiencies in manufacturing, sales and marketing.
5
Government Regulation
We are subject to federal, state and local environmental regulation. The emissions of particulates and other substances from our manufacturing facilities must meet federal and state air quality standards implemented through air permits issued to us by the Department of Environmental Quality of the Commonwealth of Virginia, the Division of Environmental Protection of Nevada’s Department of Conservation and Natural Resources and the Mississippi Department of Environmental Quality. Our facilities are regulated by federal and state laws governing the disposal of solid waste and by state and local permits and requirements with respect to wastewater and storm water discharge. Compliance with environmental laws and regulations has not had a material adverse effect on our business, operating results or financial condition.
Our operations also are subject to work place safety regulation by the U.S. Occupational Safety and Health Administration, the Commonwealth of Virginia, the State of Nevada and the State of Mississippi. Our compliance efforts include safety awareness and training programs for our production and maintenance employees.
Intellectual Property
Our success depends, in part, upon our intellectual property rights relating to our products, production processes and other operations. We rely upon a combination of trade secret, nondisclosure and other contractual arrangements, and patent, copyright and trademark laws, to protect our proprietary rights. We have made substantial investments in manufacturing process improvements that have enabled us to increase manufacturing line production rates, facilitated our development of new products, and produced improvements in our existing products’ dimensional consistency, surface texture and color uniformity.
Intellectual property rights may be challenged by third parties and may not exclude competitors from using the same or similar technologies, brands or works. We seek to secure effective rights for our intellectual property, but cannot provide assurance that third parties will not successfully challenge, or avoid infringing, our intellectual property rights.
We have obtained two patents for complementary methods of preparing the raw materials for the manufacturing phase of production, one patent on an apparatus for implementing one of the methods, and one patent on a tool for use with the installation of the decking board. We intend to maintain our existing patents in effect until they expire, beginning in 2015, as well as to seek additional patents as we consider appropriate.
We consider our trademarks to be of material importance to our business plans. The U.S. Patent and Trademark Office has granted us federal registrations for many of our trademarks. Federal registration of trademarks is effective for as long as we continue to use the trademarks and renew their registrations. We do not generally register any of our copyrights with the U.S. Copyright Office, but rely on the protection afforded to such copyrights by the U.S. Copyright Act. This law provides protection to authors of original works, whether published or unpublished, and whether registered or unregistered. We enter into confidentiality agreements with our employees and limit access to and distribution of our proprietary information. If it is necessary to disclose proprietary information to third parties for business reasons, we require that such third parties sign a confidentiality agreement prior to any disclosure.
See “Legal Proceedings” in Item 3 of this report for information about a lawsuit involving intellectual property to which we were a party.
Employees
At December 31, 2009, we had approximately 520 full-time employees, approximately 375 of whom were employed in our manufacturing operations. Our employees are not covered by collective bargaining agreements. We believe that our relationships with our employees are good.
6
Web Sites and Additional Information
The SEC maintains an Internet web site at www.sec.gov that contains reports, proxy statements, and other information regarding our Company. In addition, we maintain an Internet corporate web site at www.trex.com. We make available through our web site our annual reports on Form 10-K, quarterly reports on Form 10-Q, current reports on Form 8-K, and all amendments to those reports, as soon as reasonably practicable after we electronically file or furnish such material with or to the SEC. We do not charge any fees to view, print or access these reports on our web site. The contents of our web site are not a part of this report.
Executive Officers and Directors
The table below sets forth information concerning our executive officers and directors as of February 15, 2010.
| Name |
Age | Positions with Company | ||
| Ronald W. Kaplan |
58 | President and Chief Executive Officer; Director | ||
| James E. Cline |
58 | Vice President and Chief Financial Officer | ||
| J.Mitchell Cox |
51 | Vice President, Sales | ||
| William R. Gupp |
50 | Chief Administrative Officer, General Counsel and Secretary | ||
| F. Timothy Reese |
57 | Vice President, Operations | ||
| Andrew U. Ferrari |
63 | Chairman | ||
| William F. Andrews |
78 | Director | ||
| Paul A. Brunner |
74 | Director | ||
| Jay M. Gratz |
57 | Director | ||
| Frank H. Merlotti, Jr. |
59 | Director | ||
| Richard E. Posey |
63 | Director | ||
| Patricia B. Robinson |
57 | Director |
Ronald W. Kaplan has served as a director and President and Chief Executive Officer of the Company since January 2008. From February 2006 through December 2007, Mr. Kaplan served as Chief Executive Officer of Continental Global Group, Inc., a manufacturer of bulk material handling systems. From July 2005 to February 2006, Mr. Kaplan was an independent consultant. From 1979 to July 2005, Mr. Kaplan was employed by Harsco Corporation, an international industrial services and products company, at which he served in a number of capacities, including as Senior Vice President-Operations, and, from 1994 through June 2005, as President of Harsco’s Gas Technologies Group, which manufactures containment and control equipment for the global gas industry. Mr. Kaplan received a B.A. degree in economics from Alfred University and an M.B.A. degree from the Wharton School of Business, University of Pennsylvania.
James E. Cline has served as Vice President and Chief Financial Officer of the Company since March 2008. Mr. Cline served from July 2005 through December 2007 as the President of Harsco GasServ, a subsidiary of Harsco Corporation and a manufacturer of containment and control equipment for the global gas industry. From January 2008 through February 2008, in connection with the purchase of Harsco GasServ by Taylor-Wharton International LLC, which is owned by Windpoint Partners Company, Mr. Cline served as a consultant to the buyers by providing transition management and financial services. From April 1994 through June 2005, Mr. Cline served as the Vice President and Controller of Harsco GasServ. Mr. Cline served in various capacities with Huffy Corporation from June 1976 to February 1994, including as the Director of Finance of its True Temper Hardware subsidiary, a manufacturer of lawn care and construction products with nine manufacturing locations in the United States, Canada and Ireland. Mr. Cline received a B.S.B.A. degree in accounting from Bowling Green State University.
J. Mitchell Cox has served as Vice President, Sales of the Company since September 2005. From 1981 to August 2005, Mr. Cox was employed by Kraft Foods Inc., an international manufacturer of packaged food and
7
beverage products, at which he served in a number of capacities, including Region Vice President from 1996 to August 2005; Director of Category Management from 1994 to 1996; and Division Sales Manager Metro New York/New Jersey from 1992 to 1994. Mr. Cox received a B.A. degree in English from the University of North Carolina at Chapel Hill.
William R. Gupp has served as Chief Administrative Officer, General Counsel and Secretary of the Company since October 2009. From May 2001 to October 2009, Mr. Gupp served as Vice President and General Counsel of the Company. From March 1993 to May 2001, Mr. Gupp was employed by Harsco Corporation, an international industrial services and products Company, most recently as Senior Counsel and Director-Corporate Development. From August 1985 to March 1993, Mr. Gupp was employed by the law firm of Harter, Secrest & Emery. Mr. Gupp received a B.S. degree in accounting from Syracuse University and a J.D. from the University of Pennsylvania Law School.
F. Timothy Reese has served as Vice President, Operations of the Company since February 2008. From March 2007 through January 2008, Mr. Reese served as Operations Director for the Americas Region of DuPont Teijin Films, a DuPont Teijin Films U.S. Limited Partnership and producer of polyester films. From 1979 to March 2007, Mr. Reese served in various positions with DuPont, including Global Director, Business and Integrated Operations, DuPont High Performance Films, from November 1995 through November 1998; Director/Plant Manager, Global Operations, Cyrel® Packaging Graphics Products, from December 1998 through May 2000; Director, Global Operations and Six Sigma Champion, Cyrel® Packaging Graphics Products, from June 2000 through February 2001; and Director/Plant Manager in multiple assignments from March 2001 through February 2007, including in Corporate Operations, Human Resources and DuPont Chemical Solutions Enterprise. Mr. Reese served in the U.S. Navy and received a B.S. in ocean engineering with an emphasis on mechanical engineering from the U.S. Naval Academy.
Andrew U. Ferrari has served as a director of the Company since September 1998 and as Chairman since January 2008. Mr. Ferrari served as Chief Executive Officer of the Company from August 2007 through December 2007, and as President and Chief Operating Officer of the Company from August 2005 through July 2007. From March 2003 through August 2005, Mr. Ferrari was a marketing and business development consultant. Mr. Ferrari served as Executive Vice President of Marketing and Business Development of the Company from October 2001 through March 2003, and of TREX Company, LLC, which was the Company’s wholly-owned subsidiary until December 31, 2002, from October 2001 through December 2002. He served as Executive Vice President of Sales and Marketing of the Company from September 1998 to October 2001 and of TREX Company, LLC from August 1996 to October 2001. From 1989 to 1996, Mr. Ferrari held various positions with Mobil Chemical, including Director of Sales and Marketing of the Composite Products Division, New Business Manager, and Marketing Director of the Consumer Products Division. Mr. Ferrari received a B.A. degree in economics from Whitman College and an M.B.A. degree from Columbia University.
William F. Andrews has served as a director of the Company since April 1999. Mr. Andrews has served as Chairman of Katy Industries, Inc., a manufacturer of maintenance and electrical products, since October 2001, and as Chairman of the Singer Sewing Company, a manufacturer of sewing machines, since 2004. Mr. Andrews served as Chairman of Corrections Corporation of America from 2000 to 2008 and is now the Chairman of the Executive Committee of the Board. Mr. Andrews has been a Principal of Kohlberg & Company, a venture capital firm, since 1994, and served as Chairman of Allied Aerospace Company from 2000 to 2006. Prior to 2002, he served in various positions, including Chairman of Scovill Fasteners Inc.; Chairman of Northwestern Steel and Wire Company; Chairman of Schrader-Bridgeport International, Inc.; Chairman, President and Chief Executive Officer of Scovill Manufacturing Co., where he worked for over 28 years; Chairman and Chief Executive Officer of Amdura Corporation; Chairman of Utica Corporation; and Chairman, President and Chief Executive Officer of Singer Sewing Company. Mr. Andrews also serves as a director of Black Box Corporation and O’Charley’s Restaurants. Mr. Andrews received a B.S. degree in business administration from the University of Maryland and an M.B.A degree in marketing from Seton Hall University.
8
Paul A. Brunner has served as a director of the Company since February 2003. Mr. Brunner is President and Chief Executive Officer of Spring Capital Inc., a merchant bank, which he founded in 1985. From 1982 to 1985, Mr. Brunner served as President and Chief Executive Officer of U.S. Operations of Asea-Brown Boveri, a multi-national Swiss manufacturer of high technology products. In 1967, he joined Crouse Hinds Company, a manufacturer of electronics and electronic equipment, and through 1982 held various positions with that company, including President and Chief Operating Officer, Executive Vice President of Operations, Vice President of Finance and Treasurer, and Director of Mergers and Acquisitions. Mr. Brunner served as a director of Johnson Controls, Inc. from 1983 through 2007, and as Chairman of its Audit Committee from 1989 to 2005. From 1959 to 1967, he worked for Coopers & Lybrand, an international accounting firm, as an audit supervisor. Mr. Brunner is a Certified Public Accountant. He received a B.S. degree in accounting from the University of Buenos Aires and an M.B.A. degree in management from Syracuse University.
Jay M. Gratz has served as a director of the Company since February 2007. Mr. Gratz has been a partner in Tatum LLC, a national executive services and consulting firm that focuses on the needs of the Office of the CFO since February 2010. From October 2007 through February 2010, Mr. Gratz was an independent consultant. From 1999 through October 2007, Mr. Gratz served as Executive Vice President and Chief Financial Officer of Ryerson Inc., a metals processor and distributor, and as President of Ryerson Coil Processing Division from November 2001 through October 2007. Mr. Gratz served as Vice President and Chief Financial Officer of Inland Steel Industries from 1994 through 1998 and served in various other positions, including Vice President of Finance, at that company since 1975. Mr. Gratz is a Certified Public Accountant. He received a B.A. degree in economics from the State University of New York in Buffalo and an M.B.A. degree from Northwestern University Kellogg Graduate School of Management.
Frank H. Merlotti, Jr. has served as a director of the Company since February 2006. Since October 2006, Mr. Merlotti has served as President of Steelcase Design Group, the North American business unit of Steelcase, Inc., a manufacturer of office furniture and furniture systems, and served as President of Steelcase North America from September 2002 through September 2006. Mr. Merlotti served as President and Chief Executive Officer of G&T Industries, a manufacturer and distributor of fabricated foam and soft-surface materials for the marine, office furniture and commercial building industries, from August 1999 to September 2002. From 1991 through 1999, Mr. Merlotti served as President and Chief Executive Officer of Metropolitan Furniture Company, a Steelcase Design Partnership Company. From 1985 through 1999, Mr. Merlotti served as General Manager of the Business Furniture Division of G&T Industries.
Richard E. Posey has served as a director of the company since May 2009. He served as President and Chief Executive Officer of Moen Incorporated, a leading manufacturer in the global faucet market, for six years before retiring in 2007. Prior to joining Moen, Mr. Posey was President and Chief Executive Officer of Hamilton Beach / Proctor Silex, Inc. for five years. Mr. Posey began his career at S.C. Johnson & Son, where for 22 years he served in a series of increasingly responsible management positions, both overseas and in the U.S., culminating with Executive Vice President, Consumer Products, North America. Mr. Posey currently serves on the Board of Directors of The Colman Group, a supply equipment company, is a member of the Visiting Committee, The Ross School of Business, The University of Michigan, and is a Founding Trustee, Virginia Commonwealth University School of Engineering Foundation. He received a B.A. degree in English from The University of Southern California and an M.B.A. degree from The University of Michigan.
Patricia B. Robinson has served as a director of the Company since November 2000. Ms. Robinson has been an independent consultant since 1999. From 1977 to 1998, Ms. Robinson served in a variety of positions with Mead Corporation, a forest products company, including President of Mead School and Office Products, Vice President of Corporate Strategy and Planning, President of Gilbert Paper, Plant Manager of a specialty machinery facility and Product Manager for new packaging product introductions. Ms. Robinson received a B.A. degree in economics from Duke University and an M.B.A. degree from the Darden School at the University of Virginia.
9
| Item 1A. | Risk Factors |
Our business is subject to a number of risks, including the following:
We may not be able to grow unless we increase market acceptance of our products and develop new products and applications.
Our primary competition consists of wood products, which constitute a substantial majority of decking and railing sales. Our ability to grow will depend largely on our success in converting the current demand for wood in decking, railing, fencing, and trim applications into a demand for Trex products. To increase our market share, we must overcome:
| • | the consumer lack of awareness of the value of non-wood decking, railing, fencing and trim alternatives in general and Trex brand products in particular; |
| • | the resistance of many consumers and contractors to change from well-established wood products; |
| • | the greater initial expense of Trex decking, railing, fencing and trim compared to wood; |
| • | the established relationships existing between suppliers of wood decking, railing, fencing and trim products and contractors and homebuilders; and |
| • | the competition from other wood alternative manufacturers. |
In addition to the above, substantially all of our revenues are derived from sales of our proprietary wood/plastic composite material. Although we have developed, and continue to develop, new products made from other materials, if we should experience significant problems, real or perceived, with product quality or acceptance of the Trex wood/polyethylene composite material, our lack of product diversification could have a significant adverse impact on our net sales levels.
Our prospects for sales growth and profitability may be adversely affected if we fail to maintain product quality and product performance at an acceptable cost.
We will be able to expand our net sales and to sustain and enhance profitable operations only if we succeed in maintaining the quality and performance of our products. If we should not be able to produce high-quality products at standard manufacturing rates and yields, unit costs may be higher. A lack of product performance would negatively affect our profitability by impeding acceptance of our products in the marketplace and by leading to higher product replacement and consumer relations expenses. In recent periods, we have experienced significant increases in product replacement and consumer relations expenses related to a small portion of our production at our Fernley, Nevada manufacturing facility and have increased our warranty reserve accordingly. Because the establishment of reserves is an inherently uncertain process involving estimates of the number of future claims and the cost to settle claims, our ultimate losses may exceed our warranty reserve. Future increases to the warranty reserve would have an adverse effect on our profitability in the periods in which we make such increases. Increases we made to the warranty reserve in 2007 had a material adverse effect on 2007 profitability and payments for related claims had a material adverse effect on our cash flow in 2007, 2008 and 2009.
Our sales and reputation may be affected by product liability claims or litigation in relation to our products.
Our products are used outdoors and are sometimes subject to heavy use and harsh exposure to the environment. Although our Limited Warranty excludes any conditions attributable to “any act of God (such as flooding, hurricane, earthquake, lighting, etc., ), environmental condition (such as air pollution, mold, mildew, etc.), staining from foreign substances (such as dirt, grease, oil, etc.), or normal weathering (defined as exposure to sunlight, weather and atmosphere which will cause any colored surface to gradually fade, chalk, or accumulate dirt or stains”), to the extent that our products are affected in any way, this may lead to an increased risk of product liability claims or litigation. Such claims could cause adverse publicity which in turn could result in a
10
loss of consumer confidence in our products and also reduce our sales. Product liability claims could increase our expenses and have a material adverse effect on demand for our products and, consequently, reduce our sales, net income and liquidity.
Our business is subject to risks in obtaining the raw materials we use at acceptable prices.
The production of our product requires substantial amounts of wood fiber and PE material. Our business strategy is to create a substantial cost advantage over our competitors by using recycled plastic and reclaimed wood. Our business could suffer from the termination of significant sources of raw materials, the payment of higher prices for raw materials or the failure to obtain sufficient additional raw materials to meet planned increases in production. Our ability to obtain adequate supplies of PE material depends on our success in developing new sources that meet our quality requirements, entering into long-term arrangements with suppliers and managing the collection of supplies from geographically dispersed distribution centers and off-shore sources.
The demand for our products is influenced by general economic conditions and could be adversely affected by economic downturns.
The demand for our products is correlated to changes in the health of the economy in general, and the level of activity in home improvements and, to a much lesser extent, new home construction. These activity levels, in turn, are affected by such factors as home equity values, consumer spending habits, employment, interest rates and inflation. Market conditions in the housing industry have slowed significantly in recent periods, particularly in new home construction. Home equity values in many markets have decreased significantly, adversely affecting the availability of home equity withdrawals, which have resulted in decreased home improvement spending. In 2008, the U.S. economy entered into a recession. We cannot predict how long the recession will last and whether the downward trend in home remodeling and new home construction will continue or worsen. Any continued economic downturn could reduce consumer income or equity capital available for spending on discretionary items such as decking, railing, fencing or trim, which could adversely affect the demand for our products.
Our performance may suffer if we do not compete effectively in the highly competitive decking, railing, fencing and trim markets.
We must compete with an increasing number of companies in the wood/plastic composites segment of the decking, railing, fencing and trim markets and with wood producers that currently have more production capacity than is required to meet the demand for such products. Our failure to compete successfully in such markets could have a material adverse effect on our ability to replace wood or increase the market share of wood/plastic composites compared to wood. Many of the conventional lumber suppliers with which we compete have established ties to the building and construction industry and have well-accepted products. Many of our competitors in the decking, railing, fencing and trim markets that sell wood products have significantly greater financial, technical and marketing resources than we do. Our ability to compete depends, in part, upon a number of factors outside our control, including the ability of competitors to develop new non-wood alternatives that are more competitive with Trex products.
We have significant capital invested in property, plant and equipment that may become obsolete or impaired and result in a charge to our earnings.
At December 31, 2009, we had $137.0 million of net property, plant and equipment. The improvement we seek to make to our manufacturing processes sometimes involves the implementation of new technology and replacement of equipment at our manufacturing facilities, which may result in charges to our earnings if the existing equipment is not fully depreciated. Of our net property, plant and equipment at December 31, 2009, approximately $14.2 million is located at our Olive Branch, Mississippi manufacturing facility. In September 2007, we suspended operations at our Olive Branch facility and consolidated all of our manufacturing operations into our Winchester and Fernley sites. In September 2009, we recorded a pre-tax impairment charge
11
of $23.3 million related to the long-lived assets held at the facility. Changes in the expected cash flows related to our facilities in the future may result in additional impairment charges and reduced earnings.
Our level of indebtedness could adversely affect our financial health and ability to compete.
As of December 31, 2009, we had $101.0 million of total indebtedness. Our level of indebtedness could have important consequences. For example, it may:
| • | increase our vulnerability to general adverse economic and industry conditions, including interest rate fluctuations; |
| • | require us to dedicate a substantial portion of our cash flow from operations to payments on our indebtedness, thereby reducing the availability of our cash flow to fund working capital, capital expenditures and other general corporate purposes; |
| • | limit our ability to borrow additional funds to alleviate liquidity constraints, as a result of financial and other restrictive covenants in our indebtedness; |
| • | limit our flexibility in planning for, or reacting to, changes in our business and the industry in which we operate; |
| • | place us at a competitive disadvantage relative to companies that have less indebtedness; and |
| • | limit our ability to refinance our principal secured indebtedness. |
In addition, our senior secured credit facility imposes operating and financial restrictions that may limit our discretion on some business matters, which could make it more difficult for us to expand, finance our operations and engage in other business activities that may be in our interest. These restrictions may limit our ability to:
| • | incur additional indebtedness and additional liens on our assets; |
| • | engage in mergers or acquisitions or dispose of assets; |
| • | enter into sale-leaseback transactions; |
| • | pay dividends or make other distributions; |
| • | voluntarily prepay other indebtedness; |
| • | enter into transactions with affiliated persons; |
| • | make investments; and |
| • | change the nature of our business. |
We may incur indebtedness in addition to our current indebtedness. Any additional indebtedness we may incur in the future could subject us to similar or even more restrictive conditions.
Our ability to refinance our indebtedness will depend on our ability in the future to generate cash flows from operations and to raise additional funds, including through the offering of equity or debt securities. We may not be able to generate sufficient cash flows from operations or to raise additional funds in amounts necessary for us to repay our indebtedness when such indebtedness becomes due and to meet our other cash needs.
Our ability to make scheduled principal and interest payments on our real estate loans, convertible notes, borrow and repay amounts under our revolving credit facility and continue to comply with our loan covenants will depend primarily on our ability to generate sufficient cash flow from operations. Our failure to comply with our loan covenants might cause our lenders to accelerate our repayment obligations under our credit facility, which may be declared payable immediately based on a default and which could result in a cross-default under our $97.5 million principal amount of outstanding convertible notes. Our ability to borrow under our revolving
12
credit facility is tied to a borrowing base that consists of specified receivables and inventory. To remain in compliance with our credit facility, and real estate loans, we must maintain specified financial ratios based on our levels of debt, capital, net worth, fixed charges, and earnings (excluding extraordinary gains and extraordinary non-cash losses) before interest, taxes, depreciation and amortization, all of which are subject to the risks of our business.
| Item 1B. | Unresolved Staff Comments |
None.
| Item 2. | Properties |
We lease our corporate headquarters in Winchester, Virginia, which consists of 32,517 square feet of office space, under a lease that expires in March 2020. In anticipation of relocating our corporate headquarters to Dulles, Virginia, we entered into a lease agreement in 2005, which expires in 2019. The Dulles lease agreement provides for our initial occupancy of 55,047 square feet of office space, which will increase during the lease term to 80,071 square feet in mid-2012. We reconsidered our decision to relocate our corporate headquarters in 2005 and decided not to move. As of January 10, 2008, we had executed subleases for the entire space we currently lease. The terms of the existing subleases extend through years 2012 to 2015. For a description of our financial reporting in connection with the Dulles lease agreement, see Note 14 to our consolidated financial statements appearing elsewhere in this report.
We own approximately 74 contiguous acres of land in Winchester, Virginia and the buildings on this land. The site includes our original manufacturing facility, which contains approximately 115,000 square feet of space, our research and development technical facility, which contains approximately 30,000 square feet of space, a mixed-use building, which contains approximately 173,000 square feet of space, and an additional manufacturing facility, which contains approximately 150,000 square feet of space. We own the land and the manufacturing facility on the Fernley, Nevada site, which contains approximately 250,000 square feet of manufacturing space. Our Fernley site is located on approximately 37 acres, which includes outside open storage. We own approximately 102 acres of land in Olive Branch, Mississippi and the buildings on this land. The site contains four buildings with approximately 200,000 square feet for manufacturing and raw material handling operations. In September 2007, we suspended operations at our Olive Branch facility and consolidated all of our manufacturing operations into our Winchester and Fernley sites.
We lease a total of approximately 1.1 million square feet of storage warehouse space under leases with expiration dates ranging from 2010 to 2015. For information about these leases, see Note 11 to our consolidated financial statements appearing elsewhere in this report.
The equipment and machinery we use in our operations consist principally of plastic and wood conveying and processing equipment. We own all of our manufacturing equipment. We lease substantially all of our forklift equipment at our facilities under operating leases.
We regularly evaluate our various facilities and equipment and make capital investments where necessary. In 2009, we spent a total of $6.9 million on capital expenditures, primarily to make process and productivity improvements. We estimate that our capital expenditures in 2010 will be approximately $10 million. We expect to use these expenditures principally to make process and productivity improvements and upgrade systems.
| Item 3. | Legal Proceedings |
On October 16, 2006, Ron Nystrom commenced a lawsuit against the Company in the United States District Court for the Eastern District of Virginia, Norfolk Division, which also named Home Depot, Inc. and Snavely Forest Products, Inc. as defendants. Mr. Nystrom alleged that the Company’s Accents® product and other new
13
products introduced after the commencement of a prior patent infringement action infringed his patent. Mr. Nystrom also alleged that the Company’s Contours® product infringed a second patent owned by him and that the Company was engaged in contributory infringement by recommending third party hidden fastening systems that infringe such patent. In January 2008, Mr. Nystrom added an additional allegation that the Company’s Trex HideawayTM hidden fastening system also infringed such patent. On May 16, 2008, the District Court granted summary judgment to the Company with respect to Mr. Nystrom’s claims on the first patent. On April 29, 2008, the District Court issued an order severing all claims associated with the second patent and consolidating them into a separate case.
On September 25, 2008, the Company commenced a lawsuit against Mr. Nystrom in Virginia Circuit Court for various causes of action, including defamation. On September 26, 2008, Mr. Nystrom filed a Notice of Appeal to the United States Court of Appeals for the Federal Circuit appealing the District Court’s grant of summary judgment to the Company with respect to Mr. Nystrom’s claims on the first patent. On October 16, 2008, the Company and Mr. Nystrom signed a Dismissal and Tolling Agreement which provided that the Federal District Court action relating to the second patent and the Company’s action in Virginia Circuit Court would both be dismissed without prejudice pending the decision of the Federal Court of Appeals on the District Court’s decision relating to the first patent. On September 8, 2009, the Federal Court of Appeals affirmed the District Court’s grant of summary judgment, in favor of the Company. Pursuant to the Dismissal and Tolling Agreement, this ended all pending litigation between the parties.
On January 19, 2009, a purported class action case was commenced against the Company in the Superior Court of California, Santa Cruz County, by Eric Ross and Bradley S. Hureth generally alleging certain product defects in the Company’s products, and that the Company has failed to provide adequate remedies for defective products. On February 13, 2009, the Company removed this case to the United States District Court, Northern District of California. On January 21, 2009, a purported class action case was commenced against the Company in the United States District Court, Western District of Washington by Mark Okano making similar allegations. The Okano case was subsequently transferred by the Washington Court to the California Court as a related case to the Ross/Hureth case. On July 30, 2009, the U.S. District Court for the Northern District of California preliminary approved a settlement of the claims of the Ross/Hureth lawsuit involving surface flaking of the Company’s product. A hearing for final approval of the settlement occurred on October 30, 2009. As of the date of this report, the District Court has not issued its final ruling. The Company believes that both lawsuits are without merit.
14
| Item 5. | Market for Registrant’s Common Equity, Related Stockholder Matters and Issuer Purchases of Equity Securities |
Market for Common Stock
Our common stock has been listed on the New York Stock Exchange, or NYSE since April 8, 1999. Between April 8, 1999 and November 22, 2009, it was listed under the symbol “TWP”. Effective November 23, 2009, the symbol changed to “TREX”. The table below shows the reported high and low sale prices of our common stock for each quarter during 2008 and 2009 as reported by the New York Stock Exchange:
| 2009 |
High | Low | ||||
| First Quarter |
$ | 19.50 | $ | 5.11 | ||
| Second Quarter |
14.85 | 7.24 | ||||
| Third Quarter |
21.22 | 11.51 | ||||
| Fourth Quarter |
20.98 | 15.46 | ||||
| 2008 |
High | Low | ||||
| First Quarter |
$ | 9.00 | $ | 6.42 | ||
| Second Quarter |
14.17 | 7.76 | ||||
| Third Quarter |
21.73 | 8.83 | ||||
| Fourth Quarter |
18.46 | 9.54 | ||||
Dividend Policy
We have never paid cash dividends on our common stock. We intend to retain future earnings, if any, to finance the development and expansion of our business and, therefore, do not anticipate paying any cash dividends on the common stock in the foreseeable future. Under the terms of our credit agreement there are restrictions on our ability to pay dividends.
15
Stockholder Return Performance Graph
The following graph and table show the cumulative total stockholder return on Trex Company’s common stock for the last five fiscal years compared to the Russell 2000 Index and the Standard and Poor’s 600 Building Products Index. The graph assumes $100 was invested on December 31, 2004 in (1) Trex Company common stock, (2) the Russell 2000 Index and (3) the S&P 600 Building Products Index, and assumes reinvestment of dividends and market capitalization weighting as of December 31, 2005, 2006, 2007, 2008 and 2009.
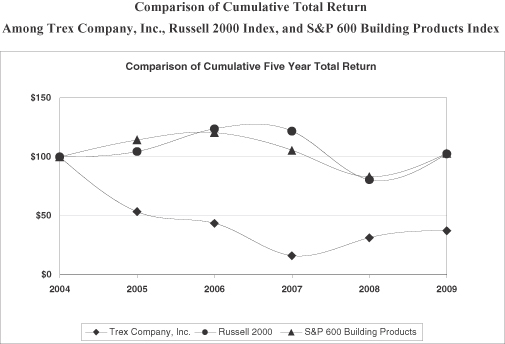
| December 31, 2004 |
December 31, 2005 |
December 31, 2006 |
December 31, 2007 |
December 31, 2008 |
December 31, 2009 | |||||||||||||
| Trex Company |
$ | 100.00 | $ | 53.49 | $ | 43.65 | $ | 16.23 | $ | 31.39 | $ | 37.38 | ||||||
| Russell 2000 |
$ | 100.00 | $ | 104.55 | $ | 123.76 | $ | 121.82 | $ | 80.66 | $ | 102.58 | ||||||
| S&P 600 BPI |
$ | 100.00 | $ | 114.40 | $ | 120.59 | $ | 105.62 | $ | 83.15 | $ | 102.99 | ||||||
Other Stockholder Matters
As of March 5, 2010, there were approximately 241 holders of record of our common stock.
In 2009, we submitted to the NYSE in a timely manner the annual certification that our Chief Executive Officer was not aware of any violation by us of the NYSE corporate governance listing standards.
16
| Item 6. | Selected Financial Data |
The following table presents selected financial data as of December 31, 2005, 2006, 2007, 2008 and 2009 and for each of the years in the five-year period ended December 31, 2009.
The selected financial data should be read in conjunction with “Management’s Discussion and Analysis of Financial Condition and Results of Operations” and our consolidated financial statements and related notes thereto appearing elsewhere in this report.
| Year Ended December 31, | ||||||||||||||||||||
| 2005 | 2006 | 2007 (1) | 2008 | 2009 (2) | ||||||||||||||||
| (In thousands, except share and per share data) | ||||||||||||||||||||
| Statement of Operations Data: |
||||||||||||||||||||
| Net sales |
$ | 294,133 | $ | 336,956 | $ | 328,952 | $ | 329,194 | $ | 272,286 | ||||||||||
| Cost of sales |
213,897 | 257,671 | 289,529 | 240,170 | 191,339 | |||||||||||||||
| Gross profit |
80,236 | 79,285 | 39,423 | 89,024 | 80,947 | |||||||||||||||
| Selling, general and administrative expenses |
77,378 | 73,223 | 119,439 | 66,958 | 65,257 | |||||||||||||||
| Impairment of long-lived assets |
— | — | — | — | 23,251 | |||||||||||||||
| Income (loss) from operations |
2,858 | 6,062 | (80,016 | ) | 22,066 | (7,561 | ) | |||||||||||||
| Interest expense, net |
2,626 | 3,011 | 11,503 | 15,282 | 14,699 | |||||||||||||||
| Income (loss) before income taxes |
232 | 3,051 | (91,519 | ) | 6,784 | (22,260 | ) | |||||||||||||
| Provision (benefit) for income taxes |
(2,019 | ) | 708 | (26,105 | ) | (750 | ) | (5,811 | ) | |||||||||||
| Net income (loss) |
$ | 2,251 | $ | 2,343 | $ | (65,414 | ) | $ | 7,534 | $ | (16,449 | ) | ||||||||
| Basic earnings (loss) per share |
$ | 0.15 | $ | 0.16 | $ | (4.39 | ) | $ | 0.50 | $ | (1.09 | ) | ||||||||
| Basic weighted average shares outstanding |
14,769,799 | 14,829,832 | 14,884,174 | 14,956,927 | 15,061,603 | |||||||||||||||
| Diluted earnings (loss) per share |
$ | 0.15 | $ | 0.16 | $ | (4.39 | ) | $ | 0.50 | $ | (1.09 | ) | ||||||||
| Diluted weighted average shares outstanding |
14,879,661 | 14,892,966 | 14,884,174 | 15,113,083 | 15,061,603 | |||||||||||||||
| Cash Flow Data: |
||||||||||||||||||||
| Cash provided by (used in) operating activities |
$ | 11,234 | $ | (4,038 | ) | $ | (1,163 | ) | $ | 33,042 | $ | 35,063 | ||||||||
| Cash used in investing activities |
(29,374 | ) | (27,743 | ) | (24,035 | ) | (8,594 | ) | (6,638 | ) | ||||||||||
| Cash provided by (used in) financing activities |
(4,432 | ) | 31,058 | 24,592 | (1,325 | ) | (32,100 | ) | ||||||||||||
| Other Data (unaudited): |
||||||||||||||||||||
| EBITDA (3) |
$ | 18,997 | $ | 26,324 | $ | (57,525 | ) | $ | 46,942 | $ | 38,592 | |||||||||
| Balance Sheet Data: |
||||||||||||||||||||
| Cash and cash equivalents and restricted cash |
$ | 1,395 | $ | 672 | $ | 66 | $ | 23,189 | $ | 19,514 | ||||||||||
| Working capital |
40,061 | 29,559 | 48,385 | 65,085 | 60,645 | |||||||||||||||
| Total assets |
285,714 | 352,317 | 320,529 | 307,084 | 256,459 | |||||||||||||||
| Total debt (including derivatives) |
73,606 | 104,637 | 98,002 | 103,563 | 77,571 | |||||||||||||||
| Total stockholder’s equity |
$ | 164,708 | $ | 169,415 | $ | 128,385 | $ | 137,828 | $ | 125,579 | ||||||||||
| (1) | Year ended December 31, 2007 materially affected by increases to the warranty reserve, product returns and tax valuation allowance as disclosed in the Company’s previous filings. |
17
| (2) | Year ended December 31, 2009 materially affected by impairment of long-lived assets at the idle Olive Branch facility. |
| (3) | EBITDA represents net income before interest, income taxes, depreciation and amortization. EBITDA is not a measurement of financial performance under accounting principles generally accepted in the United States, or GAAP. The Company has included data with respect to EBITDA because management evaluates and projects the performance of the Company’s business using several measures, including EBITDA. Management considers EBITDA to be an important supplemental indicator of the Company’s operating performance, particularly as compared to the operating performance of the Company’s competitors, because this measure eliminates many differences among companies in capitalization and tax structures, capital investment cycles and ages of related assets, as well as some recurring non-cash and non-operating charges to net income or loss. For these reasons, management believes that EBITDA provides important supplemental information to investors regarding the operating performance of the Company and facilitates comparisons by investors between the operating performance of the Company and the operating performance of its competitors. Management believes that consideration of EBITDA should be supplemental, because EBITDA has limitations as an analytical financial measure. These limitations include the following: |
| • | EBITDA does not reflect the Company’s cash expenditures, or future requirements for capital expenditures, or contractual commitments; |
| • | EBITDA does not reflect the interest expense, or the cash requirements necessary to service interest or principal payments, on the Company’s indebtedness; |
| • | although depreciation and amortization are non-cash charges, the assets being depreciated and amortized will often have to be replaced in the future, and EBITDA does not reflect any cash requirements for such replacements; |
| • | EBITDA does not reflect the effect of earnings or charges resulting from matters the Company considers not to be indicative of its ongoing operations; and |
| • | not all of the companies in the Company’s industry may calculate EBITDA in the same manner in which the Company calculates EBITDA, which limits its usefulness as a comparative measure. |
The Company compensates for these limitations by relying primarily on its GAAP results to evaluate its operating performance and by considering independently the economic effects of the foregoing items that are not reflected in EBITDA. As a result of these limitations, EBITDA should not be considered as an alternative to net income (loss), as calculated in accordance with GAAP, as a measure of operating performance, nor should it be considered as an alternative to cash flows as a measure of liquidity. The following table sets forth, for the years indicated, a reconciliation of EBITDA to net income (loss):
| Year Ended December 31, | |||||||||||||||||||
| 2005 | 2006 | 2007 | 2008 | 2009 | |||||||||||||||
| (In thousands) | |||||||||||||||||||
| Net income (loss) |
$ | 2,251 | $ | 2,343 | $ | (65,414 | ) | $ | 7,534 | $ | (16,449 | ) | |||||||
| Plus interest expense, net |
2,626 | 3,011 | 11,503 | 15,282 | 14,699 | ||||||||||||||
| Plus income tax provision (benefit) |
(2,019 | ) | 708 | (26,105 | ) | (750 | ) | (5,811 | ) | ||||||||||
| Plus depreciation and amortization |
16,139 | 20,262 | 22,491 | 24,876 | 22,902 | ||||||||||||||
| Plus impairment of long-lived assets |
— | — | — | — | 23,251 | ||||||||||||||
| EBITDA |
$ | 18,997 | $ | 26,324 | $ | (57,525 | ) | $ | 46,942 | $ | 38,592 | ||||||||
18
| Item 7. | Management’s Discussion and Analysis of Financial Condition and Results of Operations |
This management’s discussion and analysis contains forward-looking statements within the meaning of Section 27A of the Securities Act of 1933 and Section 21E of the Securities Exchange Act of 1934. All statements regarding our expected financial position and operating results, our business strategy, our financing plans, forecasted demographic and economic trends relating to our industry and similar matters are forward-looking statements. These statements can sometimes be identified by our use of forward-looking words such as “may,” “will,” “anticipate,” “estimate,” “expect,” “intend” or similar expressions. We cannot promise you that our expectations in such forward-looking statements will turn out to be correct. Our actual results could be materially different from our expectations because of various factors, including the factors discussed under “Item 1A. Risk Factors.” These statements are also subject to risks and uncertainties that could cause the Company’s actual operating results to differ materially. Such risks and uncertainties include the extent of market acceptance of the Company’s products; the sensitivity of the Company’s business to general economic conditions; the Company’s ability to obtain raw materials at acceptable prices; the Company’s ability to maintain product quality and product performance at an acceptable cost; the level of expenses associated with product replacement and consumer relations expenses related to product quality; and the highly competitive markets in which the Company operates.
Overview
General. Trex Company, Inc., (the “Company”), is the largest U.S. manufacturer of wood-alternative decking, railing, fencing and trim products, which are marketed under the brand name Trex®. We offer a comprehensive set of aesthetically durable, low maintenance product offerings and believe that the range and variety of our product offerings allow consumers to design personal outdoor living space using Trex brand products.
We have seven decking products: Trex Contours®, Trex Origins®, Trex Accents®, Trex Accents Fire Defense®, Trex Brasilia® , Trex Escapes® and Trex TranscendTM;; two railing products: Trex Designer Series Railing® and Trex TranscendTM Railing two fencing products, Trex Seclusions® and Trex Surroundings® and a cellular PVC outdoor trim product, TrexTrim™. In addition, we offer Trex Hideaway®, which is a hidden fastening system for specially grooved boards.
Highlights related to the full year 2009 include:
| • | In 2009, we experienced decreased sales volume primarily as a result of the poor U.S. macroeconomic conditions. Customers and dealers continued to reduce their inventory levels and conserve working capital. |
| • | We continued our progress on process and productivity improvements. Those improvements and the effect of our 2009 price increase more than offset the impact of operating at significantly lower capacity utilization and the effect of the startup of the new Transcend production lines. |
| • | During the year, we continued to significantly reduce inventory. Since December of 2007 we have reduced inventory by 51% or $47 million, of which $24 million was in 2009. This reduction resulted in a favorable LIFO adjustment approximately equal to the benefit realized in 2008. In the third quarter of 2009, we also recorded a $7.2 million write-down to certain inventory manufactured prior to 2008. This write-down was entirely offset by a corresponding favorable LIFO adjustment. |
| • | We generated positive operating cash flow, despite reduced earnings. At the end of 2009 our cash balance was $20 million and we had no outstanding balance on our revolving lines of credit. In addition, we refinanced our outstanding debt and reduced the total amount of our outstanding debt. During the year we utilized cash on hand to pay in full $25 million Mississippi Business Finance Corporation Bonds and $5 million in term debt related to our Winchester Properties. |
| • | 2009 cash flows were negatively impacted by claims payments of $10.6 million from the warranty reserve for material previously produced at the Nevada facility that exhibited surface defects. |
19
Net Sales. Net sales consist of sales and freight, net of returns and discounts. The level of net sales is principally affected by sales volume and the prices paid for Trex products. Our branding and product differentiation strategy enables us to command premium prices over wood and to maintain price stability for Trex. To ensure adequate availability of product to meet anticipated seasonal consumer demand, we have historically provided our distributors and dealers incentives to build inventory levels before the start of the prime deck-building season. These incentives include prompt payment discounts or extended payment terms. In addition, from time to time we may offer price discounts on specified products and other incentives based on increases in distributor purchases as part of specific promotional programs. There are no product return rights granted to our distributors except those granted pursuant to the warranty provisions of our agreements with distributors.
Gross Profit. Gross profit represents the difference between net sales and cost of sales. Cost of sales consists of raw materials costs, direct labor costs, manufacturing costs and freight. Raw materials costs generally include the costs to purchase and transport waste wood fiber, reclaimed polyethylene, or “PE material,” and pigmentation for coloring Trex products. Direct labor costs include wages and benefits of personnel engaged in the manufacturing process. Manufacturing costs consist of costs of depreciation, utilities, maintenance supplies and repairs, indirect labor, including wages and benefits, and warehouse and equipment rental activities.
Selling, General and Administrative Expenses. The largest components of selling, general and administrative expenses are branding and other sales and marketing costs, which we use to build brand awareness of Trex in the decking, railing, fencing and trim markets. Sales and marketing costs consist primarily of salaries, commissions and benefits paid to sales and marketing personnel, consumer relations, advertising expenses and other promotional costs. General and administrative expenses include salaries and benefits of personnel engaged in research and development, procurement, accounting and other business functions, office occupancy costs attributable to these functions, and professional fees. As a percentage of net sales, selling, general and administrative expenses have varied from quarter to quarter due, in part, to the seasonality of our business.
Critical Accounting Policies, Estimates and Risks and Uncertainties
Our significant accounting policies are described in Note 2 to our consolidated financial statements appearing elsewhere in this report. Critical accounting policies include the areas where we have made what we consider to be particularly difficult, subjective or complex judgments in making estimates, and where these estimates can significantly affect our financial results under different assumptions and conditions. We prepare our financial statements in conformity with accounting principles generally accepted in the United States. As a result, we are required to make estimates, judgments and assumptions that we believe are reasonable based upon the information available. These estimates, judgments and assumptions affect the reported amounts of assets and liabilities at the date of the financial statements and the reported amounts of revenue and expenses during the periods presented. Actual results could be different from these estimates.
Inventories. We account for inventories at the lower of cost (last-in, first-out, or “LIFO”) or market value. We believe that our current inventory of finished goods will be saleable in the ordinary course of business and, accordingly, have not established significant reserves for estimated slow moving products or obsolescence. At December 31, 2009, the excess of the replacement cost of inventory over the LIFO value of inventory was approximately $15.3 million. We cannot estimate at this time the effect of future reductions, if any, in inventory levels on future operating results.
Long-Lived Assets. In accordance with FASB ASC Topic 360, “Property, Plant and Equipment,” we review long-lived assets, including property, plant and equipment, whenever events or changes in circumstances indicate that the carrying amount of the assets may not be fully recoverable. To determine the recoverability of long-lived assets, we evaluate the probability that future estimated undiscounted net cash flows will be less than the carrying amount of the long-lived assets. If the estimated cash flows are less than the carrying amount of the long-lived assets, the assets are written down to their fair value. Our estimates of anticipated cash flows and the remaining estimated useful lives of long-lived assets could be reduced in the future. As a result, the carrying amount of long-lived assets could be reduced in the future.
20
Property, plant and equipment are depreciated on a straight-line basis over the estimated useful lives of the assets. The depreciable lives of these assets range from three to 40 years. Estimates of the useful lives are based, in part, upon historical performance of similar assets. We periodically review the remaining estimated useful lives of property, plant and equipment to determine if any revisions to the estimates are necessary. Changes to the estimate of the useful lives of property, plant and equipment could have a material effect on our financial position or results of operations.
In September 2009, we recorded a pre-tax impairment charge of $23.3 million related to the long-lived assets held at our Olive Branch facility to reduce the carrying value of those groups to their estimated fair value. The fair value measurement used to determine the impairment was based on prices for similar assets and considered the condition of the related fixed assets. Changes in the expected cash flows related to the facility in the future may result in additional impairment charges and reduced earnings.
Product Warranty. We warrant that our products will be free from material defects in workmanship and material and will not check, split, splinter, rot or suffer structural damage from termites or fungal decay. With respect to our new Transcend product, we further warrant that the product will not fade in color more than a certain amount and will be resistant to permanent staining from food substances or mold (provided the stain is cleaned within seven days of appearance). Each of these warranties generally extends for a period of 25 years for residential use and 10 years for commercial use. If there is a breach of such warranties, we have an obligation either to replace the defective product or refund the purchase price. We establish warranty reserves to provide for estimated future expenses as a result of product defects that result in claims. Reserve estimates are based on management’s judgment, considering such factors as historical experience and other available information. Management reviews and adjusts these estimates, if necessary, on a quarterly basis based on the differences between actual experience and historical estimates.
In 2007, we recorded a significant increase to the warranty reserve due to a high number of claims resulting from a small percentage of material produced at the Nevada facility that exhibited surface defects. We continue to settle these claims against the warranty reserve and regularly monitor the adequacy of the remaining reserve. It is possible that the ultimate settlement of the claims may differ from the amount recorded and may result in future charges or credits against income. We estimate that a 10% change in the expected number of remaining claims or average cost of claims may result in approximately a $1.0 million change in the warranty reserve. For additional information about product warranties, see Notes 2 and 14 to the consolidated financial statements appearing elsewhere in this report.
Contract Termination Costs. In anticipation of relocating our corporate headquarters, we entered into a lease agreement in 2005. We reconsidered and decided not to move our headquarters. The lease, which began on January 1, 2006 and extends through June 30, 2019, currently obligates us to lease 55,047 square feet and increases to 80,071 square feet in 2012. As of January 10, 2008, we have executed subleases for the entire 55,047 square feet we currently lease. The terms of the existing subleases extend through years 2012 to 2015. We estimate that the present value of the estimated future sublease rental receipts, net of transaction costs, will be less than our remaining minimum lease payment obligations under our lease for the office space. Accordingly, we account for the costs associated with the lease as contract termination costs in accordance with FASB ASC Topic 420, “Exit or Disposal Cost Obligations.”
To estimate future sublease receipts for the periods beyond the term of the existing subleases and for the additional space we are obligated to lease, we have assumed that the existing subleases will be renewed or new subleases will be executed at rates consistent with rental rates in the current subleases. However, management cannot be certain that the timing of future subleases or the rental rates contained in future subleases will not differ from current estimates. Factors such as the delivery of a significant amount of new office space or poor economic conditions could have a negative effect on vacancy rates and rental rates in the area. The inability to sublet the office space in the future or unfavorable changes to key management assumptions used in the estimate of the future sublease receipts may result in material charges to selling, general and administrative expenses in future periods.
21
Contingencies and Other Liabilities. We are subject, from time to time, to various lawsuits and other claims related to patent infringement, product quality, product liability and other matters. We are required to assess the likelihood of any adverse judgments or outcomes to these matters as well as potential ranges of probable losses. We make a determination of the amount of reserves required, if any, for these contingencies after an analysis of each lawsuit and claim. The required reserves may change in the future as a result of new developments in any such matter or changes in approach, such as a change in settlement strategy in dealing with a particular matter. In the opinion of management, adequate provision has been made for any probable losses as of December 31, 2009.
Revenue Recognition. We recognize revenue when title is transferred to customers, which is generally upon shipment of the product to the customer. We do not grant contractual product return rights to customers other than pursuant to our product warranty. We do not expect future product returns to be material and, consequently, do not maintain an allowance for product returns.
Pursuant to FASB ASC Topic 605, we record all shipping and handling fees in sales and records all of the related costs in cost of sales. We offer several sales incentive programs to dealers and distributors, including rebates, pricing discounts, extended terms and cooperative advertising, many of which result in cash consideration made to dealers and distributors. We account for consideration made pursuant to these programs in accordance with accounting guidance that governs consideration given by a vendor to a customer. With the exception of cooperative advertising, we classify sales incentives as a reduction in revenue in “Net sales.” Sales incentives are recorded in the period in which they are earned by customers. Our cooperative advertising program meets the requirements for exclusion from net sales and the costs are recorded as expenses in “Selling, general and administrative expenses” in the accompanying consolidated statements of operations. Cooperative advertising costs are accrued as incurred.
Valuation of Deferred Tax Assets. We provide for valuation allowances against our deferred tax assets in accordance with the requirements of FASB ASC Topic 740, “Income Taxes.” At December 31, 2009, we had a valuation allowance of $9.3 million primarily attributable to the uncertainty related to the realizability of our excess deferred tax assets. We have considered all available evidence, both positive and negative, in determining the need for a valuation allowance. Based upon this analysis, including a consideration of our cumulative loss history in the three-year period ended December 31, 2009, management determined that it is not more likely than not that its excess deferred tax assets will be realized.
Stock-Based Compensation. Under the provisions of FASB ASC Topic 718, “Stock Compensation,” we calculate the grant date fair value of share-based awards using the Black-Scholes valuation model for grants subsequent to the adoption of ASC 718. Determining the fair value of share-based awards is judgmental in nature and involves the use of significant estimates and assumptions, including the term of the share-based awards, risk-free interest rates over the vesting period, expected dividend rates, the price volatility of our shares and forfeiture rates of the awards. Prior to adopting ASC 718, we recognized forfeitures only as they occurred. We base our fair value estimates on assumptions we believe to be reasonable but that are inherently uncertain. Actual future results may differ from those estimates.
22
Results of Operations
The following table shows, for the last three years, selected statement of operations data as a percentage of net sales:
| Year Ended December 31, | |||||||||
| 2007 | 2008 | 2009 | |||||||
| Net sales |
100.0 | % | 100.0 | % | 100.0 | % | |||
| Cost of sales |
88.0 | 73.0 | 70.3 | ||||||
| Gross profit |
12.0 | 27.0 | 29.7 | ||||||
| Selling, general and administrative expenses |
36.3 | 20.3 | 24.0 | ||||||
| Impairment of long-lived assets |
— | — | 8.5 | ||||||
| Income (loss) from operations |
(24.3 | ) | 6.7 | (2.8 | ) | ||||
| Interest expense, net |
3.5 | 4.6 | 5.4 | ||||||
| Income (loss) before taxes and extraordinary item |
(27.8 | ) | 2.1 | (8.2 | ) | ||||
| Provision (benefit) for income taxes |
(7.9 | ) | (0.2 | ) | (2.1 | ) | |||
| Net income (loss) |
(19.9 | %) | 2.3 | % | (6.0 | %) | |||
2009 Compared to 2008
Net Sales. Net sales in 2009 decreased 17.3% to $272.3 million from $329.2 million in 2008. The decrease in net sales was primarily attributable to a 28% decrease in sales volume, which was partially offset by a 13% increase in the average price per product unit sold. The decrease in sales volume was principally related to lower consumer demand attributable to poor macroeconomic conditions, which includes suppressed repair and remodeling expenditures and lower housing starts, as compared to 2008. The increase in average price per product unit resulted from a price increase, effective January 2009, of approximately 8% and increased sales of higher unit priced products.
Gross Profit. Gross profit decreased 9.1% to $80.9 million in 2009 from $89.0 million in 2008. The decrease was primarily attributable to reduced sales volume. Gross profit as a percentage of net sales, gross margin, increased to 29.7% in 2009 from 27.0% in 2008. Sales related items including the effect of the 2009 price increase and sales mix of higher revenue per product unit resulted in an increase in gross margin in 2009 of approximately 7% from 2008. Gross margin was positively affected by an increase in production rates and yields and cost reductions due to our continued focus on process and productivity improvements, which contributed to a 4% increase in gross margin. The positive effect of the foregoing factors on gross margin in 2009 was partially offset by the negative impact on gross margin of 7% from operating at reduced levels of capacity utilization and 1% related to sales of excess poly at reduced prices. The excess poly sales were principally driven by operating at reduced levels of capacity utilization. The reduced sales price of poly was primarily driven by weak global demand early in the year. In addition, we recorded a $7.2 million charge related to certain finished goods inventories that are no longer saleable which management decided to reclaim for future use in its manufacturing process. This reclamation of inventory gave rise to $7.4 million of the $11.4 million favorable LIFO adjustment and mitigated the impact on earnings. Both 2008 and 2009 were positively impacted by a favorable net inventory adjustment of approximately $4 million.
Selling, General and Administrative Expenses. Selling, general and administrative expenses decreased 2.5% to $65.3 million in 2009 from $67.0 million in 2008. The reduction in selling, general and administrative expenses in 2009 was primarily related to lower personnel, branding and legal expenses partially offset by an increase in research and development expenses. Personnel-related expenses declined $1.0 million in 2009. The reduced personnel-related expenses in 2009 were principally driven by reduced incentive compensation. Branding expenses decreased $1.6 million in 2009. Legal expense decreased $0.8 million in 2009 primarily as a result of the costs incurred in 2008 related to a patent infringement legal proceeding. Research and development
23
expenses increased $2.0 million in 2009 to support the development and launch of Trex Transcend. As a percentage of net sales, total selling, general and administrative expenses increased to 24.0% in 2009 from 20.3% in 2008.
Interest Expense. Net interest expense decreased 3.8% to $14.7 million in 2009 from $15.3 million in 2008. Compared to 2008, interest expense in 2009 was lower by $1.1 million as a result of a favorable year-over-year variance related to interest accrued on uncertain tax positions and by approximately $1.1 million primarily due to reduced average debt levels. These favorable variances were partially offset by a $1.1 million increase in the non-cash amortization of the debt discount related to our convertible debt and $0.6 million of charges resulting from the change in our capital structure in 2009, which included the replacement of the revolving credit facility.
Provision for Income Taxes: We recorded a benefit for income taxes of $5.8 million in 2009 compared to a benefit for income taxes of $0.8 million in 2008. The related effective tax rates were 26.1% in 2009 and -11.1% in 2008. The higher benefit and related effective tax rate for 2009 resulted, primarily, from the net effects of a refund claim related to newly enacted legislation providing for a special 5-year net operating loss (NOL) carryback election.
2008 Compared to 2007
Net Sales. Net sales in 2008 increased 0.1% to $329.2 million from $329.0 million in 2007. Net sales in 2007 were adversely affected by charges of $37.8 million. We recorded $25.5 million of charges against net sales for product replacement expenses, driven by the increase in the warranty liability recorded in 2007 and $12.3 million of charges against net sales for distributor credits primarily related to the voluntarily return of product. Payments for the product replacement were recognized against the existing warranty liability during 2008 and, therefore, did not affect net sales. Before giving effect to these charges, net sales in 2008 were $329.2 million compared to $366.8 million in 2007 which represents a 10.2% decrease. In 2008, sales volume decreased by 14.6% and was partially offset by a 5.7% increase in the average price per unit. We believe that the decrease in sales volume is a result of lower consumer demand attributable to poor macroeconomic conditions, which includes continued softness in the building materials industry, the erosion of home values and the tightening of the credit market. The increase in average price per unit is primarily a result of a January 2008 price increase of 7.0% and a favorable mix of products sold.
Gross Profit. Gross profit increased 125.8% to $89.0 million in 2008 from $39.4 million in 2007. Gross profit in 2007 was adversely affected by $37.8 million of charges discussed above in “Net Sales” and $11.0 million recognized in cost of sales primarily related to inventory valuation adjustments for certain inventories reclaimed for use in the manufacturing process. Gross profit in 2008 was adversely impacted by aggregate charges of $4.4 million comprised of $2.9 million of inventory valuation adjustments primarily related to certain inventories being reclaimed for use in the manufacturing process, $0.9 million of freight charges to move inventories from the idled Olive Branch facility to our two other production facilities and $0.6 million of charges recognized upon a writedown of certain assets. Before giving effect to these charges gross profit in 2008 and 2007 was $93.4 million and $88.2 million, respectively, an improvement of $5.2 million or 5.9%. The $5.2 million increase was primarily attributable to lower unit manufacturing costs partially offset by the 14.6% decrease in sales volume. The lower manufacturing costs resulted primarily from production efficiencies and cost containment initiatives. Before giving effect to the aforementioned charges, gross profit as a percentage of net sales, or gross margin, increased to 28.4% in 2008 from 24.1% in 2007. Gross margin was positively affected by improved production rates and yields and process control and cost reduction initiatives, which accounted for a 6.5% increase in gross margin and the affects of the 2008 price increase and product mix, which accounted for a 4.1% increase in gross margin in 2008 as compared to 2007. The positive effect of the foregoing factors on gross margin in 2008 was offset, in part, by the negative effect on gross margin of 5.6% from reduced capacity utilization.
Selling, General and Administrative Expenses. Selling, general and administrative expenses decreased 43.9% to $67.0 million in 2008 from $119.4 million in 2007. As a percentage of net sales, total selling, general
24
and administrative expenses decreased to 20.3% in 2008 from 36.3% in 2007. Selling, general and administrative expenses in 2007 reflected $40.4 million of expenses related to replacement of product that exhibited surface defects, primarily driven by the increase in the warranty liability and $6.1 million of charges for losses on disposal of fixed assets, partially offset by a $3.25 million recovery pursuant to a settlement with ExxonMobil for the recovery of legal fees. Payment for claims related to the aforementioned surface defects were recognized against the existing warranty liability during 2008 and, therefore, did not affect selling, general and administrative expenses. In 2008 selling, general and administrative expenses were adversely affected by incremental incentive compensation of $7.2 million, $1.0 million of severance expense primarily related to our reduction in force, $0.8 million related to a patent infringement legal proceeding and $0.5 million for losses on disposal of fixed assets. Before giving effect to these charges, selling, general and administrative expenses in 2008 and 2007 were $57.5 million and $76.2 million, respectively, a decrease of $18.7 million or 24.5%. The $18.7 million lower selling, general and administrative expenses in 2008 were comprised principally of a decrease in salaries and personnel related expenses of $7.2 million, a $5.6 million reduction in branding expense, a $2.8 million reduction in allowance for doubtful accounts and a $1.2 million decrease in professional fees.
Interest Expense. Net interest expense increased 32.9% to $15.3 million in 2008 from $11.5 million in 2007. The increase in net interest expense was primarily attributable to an increase of $3.2 million of non-cash interest related to the adoption of FSP APB 14-1, combined with a $0.8 million reduction of interest capitalized in 2008 as compared to 2007 due to less capital spending in 2008 and a $0.5 million increase in unrealized losses related the change in the fair value of interest rate swaps in 2008 as compared to 2007. These factors were partially offset by a $0.6 million prepayment penalty recorded in 2007 related to the payment of the Senior Secured Notes.
Provision for Income Taxes. We recorded a benefit for income taxes of $0.8 million in 2008 compared to a benefit for income taxes of $26.1 million in 2007, which resulted in an effective tax rate of -11.1% in 2008 and 28.5% in 2007. The effective tax rates in both 2007 and 2008 were lower than the expected statutory tax rate primarily due to changes in the valuation allowance related to deferred tax assets. The valuation allowance increased by $7.4 million in 2007 which offset, in part, the expected statutory tax benefit and lowered the resulting effective tax rate. The valuation allowance decreased by $4.0 million in 2008 due to the realization of certain deferred tax assets as a result of net income generated. The $4.0 million decrease in the valuation allowance substantially offset the expected statutory tax expense and lowered the effective tax rate. The 2008 effective tax rate was also affected by a $0.5 million benefit recognized due to the reversal of liabilities related to uncertain tax positions upon the expiration of their statute of limitations and the recognition of certain refundable federal tax credits of $0.2 million.
Liquidity and Capital Resources
We finance operations and growth primarily with cash flow from operations, borrowings under the credit facility and other loans, operating leases and normal trade credit terms from operating activities.
Sources and Uses of Cash. Net cash provided by operating activities totaled $35.1 million in 2009 compared to net cash provided by operating activities of $33.0 million in 2008. We generated operating cash flow before the change in operating assets and liabilities of $42.1 million in 2009 compared to $42.5 million before the change in operating assets and liabilities in 2008. Net changes in operating assets and liabilities decreased $7.0 million in 2009 compared to a decrease of $9.4 million in 2008. The increase in cash flow related to changes in operating assets and liabilities resulted primarily from decreases in accrued expenses, primarily as a result of warranty payments, and increases in inventory reductions, which were partially offset by increases in accounts receivable. In 2009, inventories decreased $23.9 million compared to a decrease of $23.2 million in 2008. In 2009, accounts payable and accrued expenses decreased $11.3 million compared to a decrease of $22.8 million in 2008. Net cash provided by operations increased $2.0 million in 2009 from 2008 as a result of a continued focus on working capital management, particularly in the reduction of inventories.
25
Net cash used in investing activities totaled $6.6 million in 2009 compared to cash used in investing activities of $8.6 million in 2008. This reduction was a direct result of reduced capital expenditures in 2009 compared to 2008. Capital expenditures in 2009 were applied primarily to normal capital expenditures, consisting of manufacturing equipment and an ERP system upgrade. In 2008, net cash used in investing activities totaled $8.6 million compared to $24.0 million in 2007.
Net cash used in financing activities was $32.1 million in 2009 compared to cash used in financing activities of $1.3 million in 2008. In 2009, we reduced net debt by $31.1 million, including the redemption of $25.0 million of Mississippi Business Finance Corporation Bonds and certain real estate notes, and had no borrowings under the revolving credit facility. In 2008, we reduced net debt by $1.2 million and repaid borrowings under the revolving credit facility. Net cash used in financing activities was $1.3 million in 2008, compared to net cash provided by financing activities of $24.6 million in 2007.
Indebtedness. At December 31, 2009, our total indebtedness, including the fair value of the interest rate swap and excluding the unamortized debt discount, was $101.0 million and the annualized overall weighted average interest rate of such indebtedness, including the effect of the interest rate swap, was approximately 6.09%.
Compliance With Debt Covenants. Our ability to make scheduled principal and interest payments on the real estate loan, convertible notes, borrow and repay amounts under the revolving credit facility, and continue to comply with loan covenants will depend primarily on our ability to generate substantial cash flow from operations. To remain in compliance with financial covenants in the credit facility, we must maintain specified financial ratios based on levels of debt, capital, net worth, fixed charges, and earnings (excluding extraordinary gains and extraordinary non-cash losses) before interest, taxes, depreciation and amortization, all of which are subject to the risks of the business, some of which are discussed in this report under “Risk Factors.”
The Company was in compliance with all covenants contained in its loan agreements at December 31, 2009.
Effective November 4, 2009, financial covenants related to the Credit Agreement with BB&T Capital Markets, as lead arranger, Branch Banking and Trust Company, as administrative agent and letter of credit issuer, and TD Bank, N.A. are as follows:
| (a) | Minimum Consolidated Tangible Net Worth. Trex will maintain Consolidated Tangible Net Worth (as defined in the credit agreement) of not less than the sum of (i) $87,000,000, plus (ii) 50% of Consolidated Net Income (as defined in the credit agreement) after December 31, 2008 (taken as one accounting period), but excluding from such calculation of Consolidated Net Income any quarter in which Consolidated Net Income is negative, measured as of the end of each fiscal quarter commencing with the fiscal quarter ending September 30, 2009. |
| (b) | Fixed Charge Coverage Ratio. Trex will not permit the Fixed Charge Coverage Ratio (as defined in the credit agreement) to be less than 1.1 to 1.0, measured as of the end of each fiscal quarter, commencing with the fiscal quarter ending September 30, 2009, for the four-quarter period then ended; provided, however, that if Excess Availability (as defined in the credit agreement) exceeds $35,000,000, measurement of the Fixed Charge Coverage Ratio shall be made as of the end of each fiscal year. |
| (c) | Consolidated Debt to Consolidated EBITDA Ratio. Trex will not permit the Consolidated Debt to Consolidated EBITDA Ratio (as defined in the credit agreement) to exceed: (i) 6.0 to 1.0 as of December 31, 2009 and December 31, 2010, (ii) 5.5 to 1.0 as of December 31, 2011, and (iii) 4.5 to 1.0 as of December 31, 2012, and as of the end of each fiscal year thereafter. |
26
Contractual Obligations. The following tables show, as of December 31, 2009, our contractual obligations and commercial commitments, which consist primarily of long-term debt, interest payments on long-term debt, purchase commitments and operating leases (in thousands):
Contractual Obligations
Payments Due by Period
| Total | Less than 1 year |
1-3 years | 4-5 years | After 5 years | |||||||||||
| Long-term debt |
$ | 100,586 | $ | 545 | $ | 98,728 | $ | 1,313 | $ | — | |||||
| Interest payments on long-term debt (1) |
14,799 | 5,912 | 8,861 | 26 | — | ||||||||||
| Purchase commitments (2) |
46,235 | 28,575 | 17,660 | — | — | ||||||||||
| Operating leases |
41,036 | 8,191 | 11,575 | 8,650 | 12,620 | ||||||||||
| Total contractual cash obligations |
$ | 202,656 | $ | 43,223 | $ | 136,824 | $ | 9,989 | $ | 12,620 | |||||
| (1) | A portion of the interest expense disclosed is subject to variable interest rates. The amounts disclosed above assume that variable interest rates are equal to rates at December 31, 2009. |
| (2) | Purchase commitments represent supply contracts with third-party manufacturers. |
We use interest rate swaps to manage exposure to fluctuations in the interest rates on variable-rate debt. At December 31, 2009, the fair value of the debt-related derivative was $0.4 million and was classified as a long-term liability.
We do not have off-balance sheet financing arrangements other than operating leases.
Capital and Other Cash Requirements. We made capital expenditures of $24.0 million in 2007, $7.8 million in 2008 and $6.9 million in 2009, primarily to make process and productivity improvements. We currently estimate that capital expenditures in 2010 will be approximately $10 million. Capital expenditures in 2010 are expected to be used primarily to make process and productivity improvements and upgrade systems.
We believe that cash on hand, cash flow from operations and borrowings expected to be available under the existing revolving credit facility will provide sufficient funds to enable us to fund planned capital expenditures, make scheduled principal and interest payments, fund the warranty reserve, meet other cash requirements and maintain compliance with terms of our debt agreements for at least the next 12 months. We currently expect to fund future capital expenditures from operations and borrowings under the revolving credit facility. The actual amount and timing of future capital requirements may differ materially from our estimate depending on the demand for Trex and new market developments and opportunities. Our ability to meet our cash needs during the next 12 months and thereafter could be adversely affected by various circumstances, including increases in raw materials and product replacement costs, quality control problems, higher than expected product warranty claims, service disruptions and lower than expected collections of accounts receivable. In addition, any failure to negotiate amendments to our existing debt agreements to resolve any future noncompliance with financial covenants could adversely affect our liquidity by reducing access to revolving credit borrowings needed primarily to fund seasonal borrowing needs. We may determine that it is necessary or desirable to obtain financing through bank borrowings or the issuance of debt or equity securities to address such contingencies or changes to our business plan. Debt financing would increase our level of indebtedness, while equity financing would dilute the ownership of our stockholders. There can be no assurance as to whether, or as to the terms on which, we would be able to obtain such financing, which would be restricted by covenants contained in our existing debt agreements.
27
| Item 7A. | Quantitative and Qualitative Disclosures About Market Risk |
Our major market risk exposure is to changing interest rates. We use interest rate swaps to manage exposure to fluctuations in the interest rates on variable-rate debt. We had outstanding debt of $100.6 million at December 31, 2009, $97.5 million of which is fixed-rate debt. The remaining $3.1 million was effectively converted to a fixed rate through the use of a fixed-for-floating interest rate swap.
Changes in interest rates affect the fair value of our fixed-rate debt. The fair value of our long-term fixed-rate debt at December 31, 2009, consisting of convertible notes, was approximately $108.2 million. This fair value was based on an analysis of actual market transactions. Prices for transactions vary with market conditions and can be affected by trade size and other factors. Thus, this fair value may not be indicative of the value at which the debt may ultimately settle. Based on balances outstanding at December 31, 2009, a 1% change in interest rates would change the fair value of our long-term fixed-rate debt by approximately $2.2 million.
The foregoing sensitivity analysis provides only a limited view as of a specific date regarding the sensitivity of some of our financial instruments to market risk. The actual impact of changes in market interest rates on the financial instruments may differ significantly from the impact shown in this sensitivity analysis.
We have a purchase agreement for PE material under which we have market risk related to foreign currency fluctuations between the U.S. dollar and the euro. At current purchase levels, such exposure is not material. In addition, we had a Euro-denominated note receivable of 1.1 million Euros at December 31, 2009. The exposures to foreign currency fluctuations under the PE purchase agreement and Euro-denominated note receivable are offsetting.
| Item 8. | Financial Statements and Supplementary Data |
The financial statements listed in Item 15 and appearing on pages F-2 through F-29 are incorporated by reference in this Item 8 and are filed as part of this report.
| Item 9. | Changes in and Disagreements With Accountants on Accounting and Financial Disclosure |
None.
| Item 9A. | Controls and Procedures |
Evaluation of Disclosure Controls and Procedures
Our management, with the participation of our Chief Executive Officer, who is our principal executive officer, and our Chief Financial Officer, who is our principal financial officer, has evaluated the effectiveness of our disclosure controls and procedures (as defined in Rules 13a-15(e) and 15d-15(e) under the Securities Exchange Act of 1934) as of December 31, 2009. Based upon this evaluation, our Chief Executive Officer and our Chief Financial Officer concluded that our disclosure controls and procedures were effective as of December 31, 2009.
28
Management’s Report on Internal Control Over Financial Reporting
We, as members of management of Trex Company, Inc. (the “Company”), are responsible for establishing and maintaining adequate internal control over financial reporting. The Company’s internal control over financial reporting is a process designed to provide reasonable assurance regarding the reliability of financial reporting and the preparation of financial statements for external purposes in accordance with generally accepted accounting principles. Internal control over financial reporting includes those policies and procedures that (1) pertain to the maintenance of records that, in reasonable detail, accurately and fairly reflect the transactions and dispositions of the assets of the Company; (2) provide reasonable assurance that transactions are recorded as necessary to permit preparation of financial statements in accordance with generally accepted accounting principles, and that receipts and expenditures of the Company are being made only in accordance with authorizations of management and directors of the Company; and (3) provide reasonable assurance regarding prevention or timely detection of unauthorized acquisition, use, or disposition of the Company’s assets that could have a material effect on the financial statements.
Because of its inherent limitations, internal control over financial reporting may not prevent or detect misstatements. Also, projections of any evaluation of effectiveness to future periods are subject to the risk that controls may become inadequate because of changes in conditions, or that the degree of compliance with the policies and procedures may deteriorate.
We assessed the Company’s internal control over financial reporting as of December 31, 2009, based on criteria for effective internal control over financial reporting established in “Internal Control-Integrated Framework” issued by the Committee of Sponsoring Organizations of the Treadway Commission (the “COSO Framework”). Based on this assessment, we concluded that, as of December 31, 2009, our internal control over financial reporting was effective, based on the COSO Framework.
The effectiveness of our internal control over financial reporting as of December 31, 2009, has been audited by Ernst & Young LLP, an independent registered public accounting firm, as stated in their report, which follows hereafter.
| TREX COMPANY, INC. | ||||||||
| March 12, 2010 | By: | /s/ RONALD W. KAPLAN | ||||||
| Ronald W. Kaplan | ||||||||
| President and Chief Executive Officer | ||||||||
| (Principal Executive Officer) | ||||||||
| March 12, 2010 | By: | /s/ JAMES E. CLINE | ||||||
| James E. Cline | ||||||||
| Vice President and Chief Financial Officer | ||||||||
| (Principal Financial Officer) | ||||||||
Remediation Efforts Related to Material Weakness in Internal Control Over Financial Reporting
In our 2008 annual report on Form 10-K, as amended on Form 10K/A, we identified a material weakness in our internal control over financial reporting as of December 31, 2007 and each subsequent financial reporting period through March 31, 2009.
Management concluded that the Company failed to institute procedures to accurately compute the valuation allowance related to the Company’s deferred tax assets. As a result, in determining the valuation allowance, the Company considered as a source of future taxable income existing taxable temporary differences related to indefinite-lived intangible assets. Because the timing of reversal of these deferred tax liabilities is unknown, they are not a reliable source of recovery of deferred tax assets. The result of this error is that the valuation allowance for deferred tax assets was understated at December 31, 2007 and each subsequent financial reporting date through March 31, 2009.
29
As corrective actions, in calculating the valuation allowance at December 31, 2009, we enhanced procedures related to the consideration of the four possible sources of taxable income prescribed in FASB ASC Topic 740, “Income Taxes,” including performing a detailed examination of the estimated reversal of deferred tax assets and liabilities. In addition, we improved the segregation of duties related to the preparation of the provision for income taxes, which facilitated improved review and monitoring by management.
We believe that the foregoing corrective actions have resolved the material weakness.
Changes in Internal Control Over Financial Reporting
Other than the matters described in this Item 9A under “Remediation of Material Weakness in Internal Control Over Financial Reporting,” during the fourth quarter ended December 31, 2009, there have been no changes in our internal control over financial reporting that have materially affected, or that are reasonably likely to materially affect, our internal control over financial reporting.
Ernst & Young LLP, an independent registered public accounting firm, which audited the Company’s consolidated financial statements included in this report, has issued a report on management’s assessment of the effectiveness and on the Company’s internal control over financial reporting, which is included in this report.
30
Report of Independent Registered Public Accounting Firm
On Internal Control Over Financial Reporting
The Board of Directors and Shareholders of Trex Company, Inc.
We have audited Trex Company, Inc.’s internal control over financial reporting as of December 31, 2009, based on criteria established in Internal Control—Integrated Framework issued by the Committee of Sponsoring Organizations of the Treadway Commission (the COSO criteria). Trex Company, Inc.’s management is responsible for maintaining effective internal control over financial reporting, and for its assessment of the effectiveness of internal control over financial reporting included in the accompanying Management Report on Internal Control over Financial Reporting. Our responsibility is to express an opinion on the Company’s internal control over financial reporting based on our audit.
We conducted our audit in accordance with the standards of the Public Company Accounting Oversight Board (United States). Those standards require that we plan and perform the audit to obtain reasonable assurance about whether effective internal control over financial reporting was maintained in all material respects. Our audit included obtaining an understanding of internal control over financial reporting, assessing the risk that a material weakness exists, testing and evaluating the design and operating effectiveness of internal control based on the assessed risk, and performing such other procedures as we considered necessary in the circumstances. We believe that our audit provides a reasonable basis for our opinion.
A company’s internal control over financial reporting is a process designed to provide reasonable assurance regarding the reliability of financial reporting and the preparation of financial statements for external purposes in accordance with generally accepted accounting principles. A company’s internal control over financial reporting includes those policies and procedures that (1) pertain to the maintenance of records that, in reasonable detail, accurately and fairly reflect the transactions and dispositions of the assets of the company; (2) provide reasonable assurance that transactions are recorded as necessary to permit preparation of financial statements in accordance with generally accepted accounting principles, and that receipts and expenditures of the company are being made only in accordance with authorizations of management and directors of the company; and (3) provide reasonable assurance regarding prevention or timely detection of unauthorized acquisition, use or disposition of the company’s assets that could have a material effect on the financial statements.
Because of its inherent limitations, internal control over financial reporting may not prevent or detect misstatements. Also, projections of any evaluation of effectiveness to future periods are subject to the risk that controls may become inadequate because of changes in conditions, or that the degree of compliance with the policies or procedures may deteriorate.
In our opinion, Trex Company, Inc. maintained, in all material respects, effective internal control over financial reporting as of December 31, 2009, based on the COSO criteria.
We also have audited, in accordance with the standards of the Public Company Accounting Oversight Board (United States), the consolidated balance sheets of Trex Company, Inc., as of December 31, 2009 and 2008, and the related consolidated statements of operations, stockholders’ equity and cash flows for each of the three years in the period ended December 31, 2009, and our report dated March 12, 2010 expressed an unqualified opinion thereon.
/s/ Ernst & Young LLP
Richmond, Virginia
March 12, 2010
| Item 9B. | Other Information |
None.
31
| Item 10. | Directors, Executive Officers and Corporate Governance |
See “Executive Officers and Directors” in Part I, Item 1 of this report for the information about our executive officers, which is incorporated by response in this Item 10. Other information responsive to this Item 10 is incorporated herein by reference to our definitive proxy statement for our 2010 annual meeting of stockholders, which we will file with the SEC on or before 120 days after our 2009 fiscal year-end.
We have adopted a code of conduct and ethics, which is applicable to all of our directors, officers and employees, including our chief executive officer and chief financial officer. The code is available on our corporate web site and in print to any stockholder who requests a copy. We also make available on our web site, at www.trex.com, and in print to any stockholder who requests them, copies of our corporate governance principles and the charters of each standing committee of our board of directors. Requests for copies of these documents should be directed to Corporate Secretary, Trex Company, Inc., 160 Exeter Drive, Winchester, Virginia 22603-8605. To the extent required by SEC rules, we intend to disclose any amendments to our code of conduct and ethics, and any waiver of a provision of the code with respect to our principal executive officer, principal financial officer, principal accounting officer or controller, or persons performing similar functions, on our web site referred to above within four business days following any such amendment or waiver, or within any other period that may be required under SEC rules from time to time.
| Item 11. | Executive Compensation |
Information responsive to this Item 11 is incorporated herein by reference to our definitive proxy statement for our 2010 annual meeting of stockholders, which we will file with the SEC on or before 120 days after our 2009 fiscal year-end.
| Item 12. | Security Ownership of Certain Beneficial Owners and Management and Related Stockholder Matters |
Information responsive to this Item 12 is incorporated herein by reference to our definitive proxy statement for our 2010 annual meeting of stockholders, which we will file with the SEC on or before 120 days after our 2009 fiscal year-end.
| Item 13. | Certain Relationships and Related Transactions, and Director Independence |
Information responsive to this Item 13 is incorporated herein by reference to our definitive proxy statement for our 2010 annual meeting of stockholders, which we will file with the SEC on or before 120 days after our 2009 fiscal year-end.
| Item 14. | Principal Accounting Fees and Services |
Information responsive to this Item 14 is incorporated herein by reference to our definitive proxy statement for our 2010 annual meeting of stockholders, which we will file with the SEC on or before 120 days after our 2009 fiscal year-end.
32
| Item 15. | Exhibits and Financial Statement Schedules |
(a)(1) The following consolidated financial statements of the Company appear on pages F-2 through F-26 of this report and are incorporated by reference in Part II, Item 8:
| Report of Independent Registered Public Accounting Firm |
F-2 | |
| Consolidated Financial Statements |
||
| Consolidated Balance Sheets as of December 31, 2008 and 2009 |
F-3 | |
| Consolidated Statements of Operations for the three years ended December 31, 2009 |
F-4 | |
| Consolidated Statements of Stockholders’ Equity and Comprehensive Income for the three years ended December 31, 2009 |
F-5 | |
| Consolidated Statements of Cash Flows for the three years ended December 31, 2009 |
F-6 | |
| Notes to Consolidated Financial Statements |
F-7 | |
| Schedule II—Valuation and Qualifying Accounts and Reserves |
F-25 | |
(a)(2) Schedules for which provision is made in the applicable accounting regulations of the Securities and Exchange Commission are not required under the related instructions, or are inapplicable or not material and therefore have been omitted.
(a)(3) The following exhibits are either filed with this Form 10-K or are incorporated herein by reference. The Company’s Securities Exchange Act file number is 001-14649.
| Exhibit |
Exhibit Description | |
| 3.1 | Restated Certificate of Incorporation of Trex Company, Inc. (the “Company”). Filed as Exhibit 3.1 to the Company’s Registration Statement on Form S-1 (No. 333-63287) and incorporated herein by reference. | |
| 3.2 | Amended and Restated By-Laws of the Company. Filed as Exhibit 3.2 to the Company’s Current Report on Form 8-K filed May 7, 2008 and incorporated herein by reference. | |
| 4.1 | Specimen certificate representing the Company’s common stock. Filed as Exhibit 4.1 to the Company’s Registration Statement on Form S-1 (No. 333-63287) and incorporated herein by reference. | |
| 4.2 | Indenture, dated as of June 18, 2007, between Trex Company, Inc. and The Bank of New York, as trustee. Filed as Exhibit 4.1 to the Company’s Current Report on Form 8-K filed on June 19, 2007 and incorporated herein by reference. | |
| 4.3 | Supplemental Indenture, dated as of June 18, 2007, between Trex Company, Inc. and The Bank of New York, as trustee, including the form of 6.00% Convertible Senior Subordinated Note due 2012. Filed as Exhibit 4.2 to the Company’s Current Report on Form 8-K filed on June 19, 2007 and incorporated herein by reference. | |
| 10.1 | Description of Management Compensatory Plans and Arrangements. Filed herewith. | |
| 10.2 | Trex Company, Inc. 2005 Stock Incentive Plan. Filed as Exhibit 10.1 to the Company’s Current Report on Form 8-K filed on May 7, 2008 and incorporated herein by reference. | |
| 10.3 | Trex Company, Inc. Amended and Restated 1999 Incentive Plan for Outside Directors. Filed as Exhibit 10.4 to the Company’s Annual Report on Form 10-K for the fiscal year ended December 31, 2007 and incorporated herein by reference. | |
33
| Exhibit |
Exhibit Description | |
| 10.4 | Form of Trex Company, Inc. 2005 Stock Incentive Plan Non-Incentive Stock Option Agreement. Filed as Exhibit 10.1 to the Company’s Quarterly Report on Form 10-Q for the quarterly period ended June 30, 2005 and incorporated herein by reference. | |
| 10.5 | Form of Trex Company, Inc. 2005 Stock Incentive Plan Stock Appreciation Rights Agreement. Filed as Exhibit 10.2 to the Company’s Quarterly Report on Form 10-Q for the quarterly period ended June 30, 2005 and incorporated herein by reference. | |
| 10.6 | Form of Trex Company, Inc. 2005 Stock Incentive Plan Performance Award Agreement. Filed as Exhibit 10.3 to the Company’s Quarterly Report on Form 10-Q for the quarterly period ended June 30, 2005 and incorporated herein by reference. | |
| 10.7 | Form of Trex Company, Inc. 2005 Stock Incentive Plan Restricted Stock Agreement, as amended. Filed as Exhibit 10.8 to the Company’s Annual Report on Form 10-K for the fiscal year ended December 31, 2006 and incorporated herein by reference. | |
| 10.8 | Form of Trex Company, Inc. Amended and Restated 1999 Incentive Plan for Outside Directors Non-Incentive Stock Option Agreement for Directors. Filed as Exhibit 10.2 to the Company’s Quarterly Report on Form 10-Q for the quarterly period ended September 30, 2006 and incorporated herein by reference. | |
| 10.9 | Form of Trex Company, Inc. Amended and Restated 1999 Incentive Plan for Outside Directors Stock Appreciation Rights Agreement. Filed as Exhibit 10.3 to the Company’s Quarterly Report on Form 10-Q for the quarterly period ended September 30, 2006 and incorporated herein by reference. | |
| 10.10 | Form of Change in Control Severance Agreement for Officers of Trex Company, Inc. other than the Chief Executive Officer. Filed as Exhibit 10.4 to the Company’s Quarterly Report on Form 10-Q for the quarterly period ended June 30, 2007 and incorporated herein by reference. | |
| 10.11 | Amended and Restated Stock Appreciation Rights Agreement, between Trex Company, Inc. and Anthony J. Cavanna dated August 14, 2007. Filed as Exhibit 10.2 to the Company’s Quarterly Report on Form 10-Q for the quarterly period ended September 30, 2007 and incorporated herein by reference. | |
| 10.12 | Amended and Restated Stock Appreciation Rights Agreement, between Trex Company, Inc. and Anthony J. Cavanna dated August 14, 2007. Filed as Exhibit 10.3 to the Company’s Quarterly Report on Form 10-Q for the quarterly period ended September 30, 2007 and incorporated herein by reference. | |
| 10.13 | Amended and Restated Restricted Stock Agreement, between Trex Company, Inc. and Anthony J. Cavanna dated August 14, 2007. Filed as Exhibit 10.4 to the Company’s Quarterly Report on Form 10-Q for the quarterly period ended September 30, 2007 and incorporated herein by reference. | |
| 10.14 | Employment Agreement, dated as of January 1, 2008, between Trex Company, Inc. and Ronald W. Kaplan. Filed as Exhibit 10.1 to the Company’s Current Report on Form 8-K filed on January 2, 2008 and incorporated herein by reference. | |
| 10.15 | Change in Control Severance Agreement, dated as of January 1, 2008, between Trex Company, Inc. and Ronald W. Kaplan. Filed as Exhibit 10.2 to the Company’s Current Report on Form 8-K filed on January 2, 2008 and incorporated herein by reference. | |
| 10.16 | Form of Indemnity Agreement for Directors. Filed as Exhibit 10.19 to the Company’s Annual Report on Form 10-K for the fiscal year ended December 31, 2008 and incorporated herein by reference. | |
| 10.17 | Form of Indemnity Agreement for Officers. Filed as Exhibit 10.20 to the Company’s Annual Report on Form 10-K for the fiscal year ended December 31, 2008 and incorporated herein by reference. | |
34
| Exhibit |
Exhibit Description | |
| 10.18 | Form of Indemnity Agreement for Director/Officers. Filed as Exhibit 10.21 to the Company’s Annual Report on Form 10-K for the fiscal year ended December 31, 2008 and incorporated herein by reference. | |
| 10.19 | Form of Distributor Agreement of TREX Company, Inc. Filed as Exhibit 10.5 to the Company’s Annual Report on Form 10-K for the fiscal year ended December 31, 2001 and incorporated herein by reference. | |
| 10.20 | Form of Distributor Agreement of TREX Company, Inc. Filed as Exhibit 10.23 to the Company’s Annual Report on Form 10-K for the fiscal year ended December 31, 2008 and incorporated herein by reference. | |
| 10.21 | Form of Trex Company, Inc. Fencing Agreement for Installers/Retailers. Filed as Exhibit 10.4 to the Company’s Quarterly Report on Form 10-Q for the quarterly period ended September 30, 2006 and incorporated herein by reference. | |
| 10.22 | Deed of Lease, dated June 15, 2000, between TREX Company, LLC and Space, LLC. Filed as Exhibit 10.16 to the Company’s Annual Report on Form 10-K for the fiscal year ended December 31, 2000 and incorporated herein by reference. | |
| 10.23 | Deed of Lease, dated as of July 27, 2005, between the Company and 1 Dulles Town Center, L.L.C. Filed as Exhibit 10.34 to the Company’s Annual Report on Form 10-K for the fiscal year ended December 31, 2005 and incorporated herein by reference.* | |
| 10.24 | Credit Agreement dated as of November 4, 2009 between the Company and Branch Banking and Trust Company as Administrative Agent and Letter of Credit Issuer, BB&T Capital Markets as Lead Arranger and the Lenders listed on the signature pages thereof. Filed as Exhibit 4.1 to the Company’s Current Report on Form 8-K filed on November 6, 2009 and incorporated herein by reference. | |
| 10.25 | Amended and Restated Security Agreement between the Company and Branch Banking and Trust Company as Collateral Agent for the Lenders, dated as of November 4, 2009. Filed as Exhibit 4.7 to the Company’s Current Report on Form 8-K filed on November 6, 2009 and incorporated herein by reference. | |
| 10.26 | Amended and Restated Credit Line Deed of Trust, dated November 4, 2009, by and among the Company, as grantor, BB&T-VA Collateral Service Corporation, as trustee, and Branch Banking and Trust Company, as Collateral Agent for the Lenders, as Beneficiary relating to real property partially located in the County of Frederick, Virginia and partially located in the City of Winchester, Virginia. Filed as Exhibit 4.8 to the Company’s Current Report on Form 8-K filed on November 6, 2009 and incorporated herein by reference. | |
| 10.27 | Deed of Trust, dated November 4, 2009, by and among the Company, as grantor, Eric L. Sappenfield, as trustee, and Branch Banking and Trust Company, as Collateral Agent for the Lenders, as Beneficiary relating to real property located in the County of De Soto, Mississippi. Filed as Exhibit 4.9 to the Company’s Current Report on Form 8-K filed on November 6, 2009 and incorporated herein by reference. | |
| 10.28 | Revolver Note dated November 4, 2009 payable by the Company to Branch Banking and Trust Company in the amount of the lesser of $38,823,529.41 or the outstanding revolver advances made by Branch Banking and Trust Company. Filed as Exhibit 4.2 to the Company’s Current Report on Form 8-K filed on November 6, 2009 and incorporated herein by reference. | |
| 10.29 | Revolver Note dated November 4, 2009 payable by the Company Inc. to TD Bank, N.A. in the amount of the lesser of $21,176,470.59 or the outstanding revolver advances made by TD Bank, N.A. Filed as Exhibit 4.3 to the Company’s Current Report on Form 8-K filed on November 6, 2009 and incorporated herein by reference. | |
35
| Exhibit |
Exhibit Description | |
| 10.30 | Reducing Revolver Note dated November 4, 2009 payable by the Company Inc. to Branch Banking and Trust Company in the amount of the lesser of $16,176,470.59 or the outstanding reducing revolver advances made by Branch Banking and Trust Company. Filed as Exhibit 4.4 to the Company’s Current Report on Form 8-K filed on November 6, 2009 and incorporated herein by reference. | |
| 10.31 | Reducing Revolver Note dated November 4, 2009 payable by the Company Inc. to TD Bank, N.A. in the amount of the lesser of $8,823,529.41 or the outstanding reducing revolver advances made by TD Bank, N.A. Filed as Exhibit 4.5 to the Company’s Current Report on Form 8-K filed on November 6, 2009 and incorporated herein by reference. | |
| 10.32 | Swing Advance Note dated November 4, 2009 payable by the Company Inc. to Branch Banking and Trust Company in the amount of the lesser of $5,000,000 or the outstanding swing advances made by Branch Banking and Trust Company. Filed as Exhibit 4.6 to the Company’s Current Report on Form 8-K filed on November 6, 2009 and incorporated herein by reference. | |
| 21 | Subsidiaries of the Company. Filed herewith. | |
| 23 | Consent of Ernst & Young LLP, Independent Registered Public Accounting Firm. Filed herewith. | |
| 31.1 | Certification of Chief Executive Officer of the Company pursuant to Rule 13a-14(a) under the Securities Exchange Act of 1934. Filed herewith. | |
| 31.2 | Certification of Chief Financial Officer of the Company pursuant to Rule 13a-14(a) under the Securities Exchange Act of 1934. Filed herewith. | |
| 32 | Certifications pursuant to Rule 13a-14(b) under the Securities Exchange Act of 1934 and 18 U.S.C. § 1350. Filed herewith. | |
| * | Portions of this exhibit have been omitted and filed separately with the Securities and Exchange Commission pursuant to a request for confidential treatment. |
36
TREX COMPANY, INC.
Index to Consolidated Financial Statements
| Page | ||
| F-2 | ||
| Consolidated Financial Statements |
||
| Consolidated Balance Sheets as of December 31, 2008 and 2009 |
F-3 | |
| Consolidated Statements of Operations for the three years ended December 31, 2009 |
F-4 | |
| F-5 | ||
| Consolidated Statements of Cash Flows for the three years ended December 31, 2009 |
F-6 | |
| F-7 |
The following Consolidated Financial Statement Schedule of the Registrant is filed as part of this Report as required to be included in Item 15(a)(2):
| Page | ||
| F-30 |
F-1
REPORT OF INDEPENDENT REGISTERED PUBLIC ACCOUNTING FIRM
The Board of Directors and Stockholders of Trex Company, Inc.
We have audited the accompanying consolidated balance sheets of Trex Company, Inc. as of December 31, 2009 and 2008, and the related consolidated statements of operations, stockholders’ equity, and cash flows for each of the three years in the period ended December 31, 2009. Our audits also included the financial statement schedule listed in Item 15. These financial statements and schedule are the responsibility of the Company’s management. Our responsibility is to express an opinion on these financial statements and schedule based on our audits.
We conducted our audits in accordance with the standards of the Public Company Accounting Oversight Board (United States). Those standards require that we plan and perform the audit to obtain reasonable assurance about whether the financial statements are free of material misstatement. An audit includes examining, on a test basis, evidence supporting the amounts and disclosures in the financial statements. An audit also includes assessing the accounting principles used and significant estimates made by management, as well as evaluating the overall financial statement presentation. We believe that our audits provide a reasonable basis for our opinion.
In our opinion, the financial statements referred to above present fairly, in all material respects, the consolidated financial position of Trex Company, Inc. at December 31, 2009 and 2008, and the consolidated results of its operations and its cash flows for each of the three years in the period ended December 31, 2009, in conformity with U.S. generally accepted accounting principles. Also, in our opinion, the related financial statement schedule, when considered in relation to the basic financial statements taken as a whole, presents fairly in all material respects the information set forth therein.
As discussed in Note 6 to the consolidated financial statements, in 2009 the Company changed its method for accounting for convertible debt instruments with the adoption of the guidance originally issued in the accounting provisions of Financial Accounting Standards Board (FASB) Staff Position APB 14-1, Accounting for Convertible Debt Instruments That May Be Settled in Cash upon Conversion (codified in FASB ASC 740, Debt). In addition, as discussed in Note 13 to the consolidated financial statements, in 2007 the Company changed its method of accounting for uncertain income tax positions to comply with the guidance originally issued in FASB Interpretation No. 48, Accounting for Uncertainty in Income Taxes (codified in FASB ASC 740, Income Taxes).
We also have audited, in accordance with the standards of the Public Company Accounting Oversight Board (United States), Trex Company, Inc.’s internal control over financial reporting as of December 31, 2009, based on criteria established in Internal Control—Integrated Framework issued by the Committee of Sponsoring Organizations of the Treadway Commission and our report dated March 12, 2010 expressed an unqualified opinion thereon.
/s/ Ernst & Young LLP
Richmond, Virginia
March 12, 2010
F-2
TREX COMPANY, INC.
| December 31, | ||||||||
| 2008 | 2009 | |||||||
| (In thousands) | ||||||||
| Assets |
||||||||
| Current Assets: |
||||||||
| Cash and cash equivalents |
$ | 23,189 | $ | 19,514 | ||||
| Accounts receivable (net of allowance for doubtful accounts of $1.5 million at December 31, 2008 and 2009) |
13,555 | 31,429 | ||||||
| Inventories |
69,397 | 45,485 | ||||||
| Prepaid expenses and other assets |
5,518 | 2,368 | ||||||
| Income taxes receivable |
2,554 | 7,775 | ||||||
| Deferred income taxes |
2,141 | — | ||||||
| Total current assets |
116,354 | 106,571 | ||||||
| Property, plant and equipment, net |
176,336 | 137,027 | ||||||
| Goodwill |
6,837 | 6,837 | ||||||
| Other assets |
7,557 | 6,024 | ||||||
| Total assets |
$ | 307,084 | $ | 256,459 | ||||
| Liabilities and Stockholders’ Equity |
||||||||
| Current Liabilities: |
||||||||
| Accounts payable |
$ | 15,427 | $ | 16,514 | ||||
| Accrued expenses |
22,239 | 19,126 | ||||||
| Accrued warranty |
12,310 | 9,256 | ||||||
| Deferred income taxes |
— | 485 | ||||||
| Current portion of long-term debt |
1,293 | 545 | ||||||
| Total current liabilities |
51,269 | 45,926 | ||||||
| Deferred income taxes |
3,531 | 1,925 | ||||||
| Accrued taxes |
2,640 | 3,735 | ||||||
| Non-current accrued warranty |
9,546 | 2,268 | ||||||
| Debt-related derivatives |
2,069 | 392 | ||||||
| Long-term debt |
100,201 | 76,634 | ||||||
| Total liabilities |
169,256 | 130,880 | ||||||
| Commitments and contingencies |
||||||||
| Stockholders’ Equity: |
||||||||
| Preferred stock, $0.01 par value, 3,000,000 shares authorized; none issued and outstanding |
— | — | ||||||
| Common stock, $0.01 par value, 40,000,000 shares authorized; 15,320,612 and 15,397,093 shares issued and outstanding at December 31, 2008 and 2009, respectively |
153 | 154 | ||||||
| Additional paid-in capital |
92,825 | 96,197 | ||||||
| Accumulated other comprehensive loss |
(1,092 | ) | (265 | ) | ||||
| Retained earnings |
45,942 | 29,493 | ||||||
| Total stockholders’ equity |
137,828 | 125,579 | ||||||
| Total liabilities and stockholders’ equity |
$ | 307,084 | $ | 256,459 | ||||
See accompanying notes to financial statements.
F-3
TREX COMPANY, INC.
CONSOLIDATED STATEMENTS OF OPERATIONS
| Year Ended December 31, | ||||||||||||
| 2007 | 2008 | 2009 | ||||||||||
| (In thousands, except share and per share data) | ||||||||||||
| Net sales |
$ | 328,952 | $ | 329,194 | $ | 272,286 | ||||||
| Cost of sales |
289,529 | 240,170 | 191,339 | |||||||||
| Gross profit |
39,423 | 89,024 | 80,947 | |||||||||
| Selling, general, and administrative expenses |
119,439 | 66,958 | 65,257 | |||||||||
| Impairment of long-lived assets |
— | — | 23,251 | |||||||||
| Income (loss) from operations |
(80,016 | ) | 22,066 | (7,561 | ) | |||||||
| Interest expense, net |
11,503 | 15,282 | 14,699 | |||||||||
| Income (loss) before provision for income taxes |
(91,519 | ) | 6,784 | (22,260 | ) | |||||||
| Provision (benefit) for income taxes |
(26,105 | ) | (750 | ) | (5,811 | ) | ||||||
| Net income (loss) |
$ | (65,414 | ) | $ | 7,534 | $ | (16,449 | ) | ||||
| Basic earnings (loss) per common share |
$ | (4.39 | ) | $ | 0.50 | $ | (1.09 | ) | ||||
| Basic weighted average common shares outstanding |
14,884,174 | 14,956,927 | 15,061,603 | |||||||||
| Diluted earnings (loss) per common share |
$ | (4.39 | ) | $ | 0.50 | $ | (1.09 | ) | ||||
| Diluted weighted average common shares outstanding |
14,884,174 | 15,113,083 | 15,061,603 | |||||||||
See accompanying notes to financial statements.
F-4
TREX COMPANY, INC.
CONSOLIDATED STATEMENTS OF CHANGES IN STOCKHOLDERS’
EQUITY AND COMPREHENSIVE INCOME
| Common Stock | Additional Paid-In Capital |
Accumulated Other Comprehensive Loss |
Retained Earnings |
Total | ||||||||||||||||||
| Shares | Amount | |||||||||||||||||||||
| (Dollars in thousands) | ||||||||||||||||||||||
| Balance, December 31, 2006 |
14,913,889 | $ | 149 | $ | 62,986 | $ | (278 | ) | $ | 106,558 | $ | 169,415 | ||||||||||
| Comprehensive income (loss): |
||||||||||||||||||||||
| Net income (loss) |
— | — | — | — | (65,414 | ) | (65,414 | ) | ||||||||||||||
| Net unrealized losses on derivatives, net of tax |
— | — | — | (605 | ) | — | (605 | ) | ||||||||||||||
| Net derivative losses reclassified to earnings, net of tax |
— | — | — | 326 | — | 326 | ||||||||||||||||
| Total comprehensive income (loss) |
— | — | — | — | — | (65,693 | ) | |||||||||||||||
| Employee stock purchase and option plans |
23,132 | 2 | 299 | — | — | 301 | ||||||||||||||||
| Tax benefit of stock options and restricted stock |
— | — | (19 | ) | — | — | (19 | ) | ||||||||||||||
| Repurchases of common stock |
(15,618 | ) | — | (377 | ) | — | — | (377 | ) | |||||||||||||
| Stock-based compensation |
162,117 | — | 3,634 | — | — | 3,634 | ||||||||||||||||
| Adoption of accounting standards: |
||||||||||||||||||||||
| Convertible debt instrument |
— | — | 23,860 | — | — | 23,860 | ||||||||||||||||
| Uncertain tax positions |
— | — | — | — | (2,736 | ) | (2,736 | ) | ||||||||||||||
| Balance, December 31, 2007 |
15,083,520 | 151 | 90,383 | (557 | ) | 38,408 | 128,385 | |||||||||||||||
| Comprehensive income: |
||||||||||||||||||||||
| Net income |
— | — | — | — | 7,534 | 7,534 | ||||||||||||||||
| Net unrealized losses on interest rate swaps, net of tax |
— | — | — | (718 | ) | — | (718 | ) | ||||||||||||||
| Net derivative losses reclassified to earnings, net of tax |
— | — | — | 183 | — | 183 | ||||||||||||||||
| Total comprehensive income |
— | — | — | — | — | 6,999 | ||||||||||||||||
| Employee stock purchase and option plans |
27,298 | — | 229 | — | — | 229 | ||||||||||||||||
| Repurchases of common stock |
(9,816 | ) | 2 | (77 | ) | — | — | (75 | ) | |||||||||||||
| Stock-based compensation |
219,610 | — | 2,290 | — | — | 2,290 | ||||||||||||||||
| Balance, December 31, 2008 |
15,320,612 | 153 | 92,825 | (1,092 | ) | 45,942 | 137,828 | |||||||||||||||
| Comprehensive income (loss): |
||||||||||||||||||||||
| Net income (loss) |
— | — | — | — | (16,449 | ) | (16,449 | ) | ||||||||||||||
| Net unrealized losses on interest rate swaps, net of tax |
— | — | — | (55 | ) | — | (55 | ) | ||||||||||||||
| Net derivative losses reclassified to earnings, net of tax |
— | — | — | 882 | — | 882 | ||||||||||||||||
| Total comprehensive income (loss) |
— | — | — | — | — | (15,622 | ) | |||||||||||||||
| Employee stock purchase and option plans |
42,352 | 1 | 416 | — | — | 417 | ||||||||||||||||
| Repurchases of common stock |
(38,938 | ) | — | (572 | ) | — | — | (572 | ) | |||||||||||||
| Stock-based compensation |
73,067 | — | 3,528 | — | — | 3,528 | ||||||||||||||||
| Balance, December 31, 2009 |
15,397,093 | $ | 154 | $ | 96,197 | $ | (265 | ) | $ | 29,493 | $ | 125,579 | ||||||||||
See accompanying notes to financial statements.
F-5
TREX COMPANY, INC.
CONSOLIDATED STATEMENTS OF CASH FLOWS
| Year Ended December 31, | ||||||||||||
| 2007 | 2008 | 2009 | ||||||||||
| (in thousands) | ||||||||||||
| Operating Activities |
||||||||||||
| Net income (loss) |
$ | (65,414 | ) | $ | 7,534 | $ | (16,449 | ) | ||||
| Adjustments to reconcile net income to net cash provided by (used in) operating activities: |
||||||||||||
| Depreciation and amortization |
22,491 | 25,876 | 24,485 | |||||||||
| Debt discount amortization |
2,508 | 5,730 | 6,833 | |||||||||
| Impairment of long-lived assets |
— | — | 23,251 | |||||||||
| Deferred income taxes |
(24,400 | ) | (155 | ) | 997 | |||||||
| Derivatives |
160 | 667 | (827 | ) | ||||||||
| Stock-based compensation |
3,634 | 2,290 | 3,528 | |||||||||
| Equity method losses (income) |
(363 | ) | 40 | 252 | ||||||||
| Loss on disposal of property, plant and equipment |
6,126 | 500 | 29 | |||||||||
| Changes in operating assets and liabilities: |
||||||||||||
| Accounts receivable |
11,552 | (6,967 | ) | (17,413 | ) | |||||||
| Inventories |
18,865 | 23,172 | 23,912 | |||||||||
| Prepaid expenses and other assets |
317 | (2,665 | ) | 2,950 | ||||||||
| Accounts payable |
(20,472 | ) | (4,349 | ) | 1,087 | |||||||
| Accrued expenses |
39,729 | (18,453 | ) | (12,367 | ) | |||||||
| Income taxes receivable |
4,104 | (178 | ) | (5,205 | ) | |||||||
| Net cash provided by (used in) operating activities |
(1,163 | ) | 33,042 | 35,063 | ||||||||
| Investing Activities |
||||||||||||
| Expenditures for property, plant and equipment |
(24,035 | ) | (7,814 | ) | (6,919 | ) | ||||||
| Proceeds from sales of property, plant and equipment |
— | 45 | 45 | |||||||||
| Notes receivable, net |
— | (825 | ) | 236 | ||||||||
| Net cash used in investing activities |
(24,035 | ) | (8,594 | ) | (6,638 | ) | ||||||
| Financing Activities |
||||||||||||
| Financing costs |
(3,603 | ) | (286 | ) | (798 | ) | ||||||
| Proceeds from sales of convertible notes |
97,500 | — | — | |||||||||
| Principal payments under mortgages and notes |
(25,077 | ) | (1,194 | ) | (31,147 | ) | ||||||
| Borrowings under line of credit |
86,120 | 44,178 | — | |||||||||
| Principal payments under line of credit |
(130,252 | ) | (44,178 | ) | — | |||||||
| Repurchases of common stock |
(377 | ) | (74 | ) | (572 | ) | ||||||
| Proceeds from employee stock purchase and option plans |
300 | 229 | 417 | |||||||||
| Excess tax effect from stock-based compensation |
(19 | ) | — | — | ||||||||
| Net cash provided by (used in) financing activities |
24,592 | (1,325 | ) | (32,100 | ) | |||||||
| Net increase (decrease) in cash and cash equivalents |
(606 | ) | 23,123 | (3,675 | ) | |||||||
| Cash and cash equivalents at beginning of year |
672 | 66 | 23,189 | |||||||||
| Cash and cash equivalents at end of year |
$ | 66 | $ | 23,189 | $ | 19,514 | ||||||
| Supplemental disclosures of cash flow information: |
||||||||||||
| Cash paid for interest, net of capitalized interest |
$ | 5,059 | $ | 7,820 | $ | 7,002 | ||||||
| Cash paid (received) for income taxes, net |
$ | (5,056 | ) | $ | 93 | $ | (2,301 | ) | ||||
See accompanying notes to financial statements.
F-6
TREX COMPANY, INC.
NOTES TO CONSOLIDATED FINANCIAL STATEMENTS
| 1. | BUSINESS AND ORGANIZATION |
Trex Company, Inc. (together with its subsidiaries, the “Company”), a Delaware corporation, was incorporated on September 4, 1998. The Company manufactures and distributes wood/plastic composite products primarily for residential and commercial decking and railing applications. The majority of our products are manufactured in a proprietary process that combines waste wood fibers and reclaimed polyethylene (“PE material”). The Company operates in one business segment.
| 2. | SUMMARY OF SIGNIFICANT ACCOUNTING POLICIES |
Basis of Accounting
The accompanying consolidated financial statements have been prepared in accordance with accounting principles generally accepted in the United States and include the accounts of the Company and its wholly-owned subsidiaries, Winchester Capital, Inc., and Trex Wood-Polymer Espana, S.L. (“TWPE”). Intercompany accounts and transactions have been eliminated in consolidation.
TWPE was formed to hold the Company’s 35% equity interest in Denplax, S.A. (“Denplax”), a joint venture with a Spanish Company responsible for public environmental programs in southern Spain and with an Italian equipment manufacturer. The joint venture was formed to recycle polyethylene at a facility in El Ejido, Spain. The Company’s investment in Denplax is accounted for using the equity method.
Use of Estimates
The preparation of financial statements in conformity with accounting principles generally accepted in the United States requires management to make estimates and assumptions that affect the amounts reported in the consolidated financial statements and the accompanying notes. Actual results could differ from those estimates.
Cash and Cash Equivalents
Cash equivalents consist of highly liquid investments purchased with original maturities of three months or less.
Concentrations and Credit Risk
The Company’s financial instruments that are exposed to concentrations of credit risk consist primarily of cash and cash equivalents, trade accounts receivable and interest rate swap contracts. The Company from time to time may have bank deposits in excess of insurance limits of the Federal Deposit Insurance Corporation. As of December 31, 2009, substantially all deposits are maintained in one financial institution. The Company has not experienced any losses in such accounts and believes it is not exposed to any significant credit risk related to its cash and cash equivalents.
The Company routinely assesses the financial strength of its customers and believes that its trade receivables credit risk exposure is limited. Trade receivables are carried at the original invoice amount less an estimate made for doubtful accounts. A valuation allowance is provided for known and anticipated credit losses and disputed amounts, as determined by management in the course of regularly evaluating individual customer receivables. This evaluation takes into consideration a customer’s financial condition and credit history, as well as current economic conditions.
F-7
The Company recorded a decrease to the allowance for doubtful accounts of $32 thousand in the year ended December 31, 2009. In the years ended December 31, 2007, 2008 and 2009, sales from certain customers accounted for 10% or more of the Company’s total gross sales. For the year ended December 31, 2007, the Company’s three largest customers represented 25%, 13% and 11%, respectively, of the Company’s gross sales. For the year ended December 31, 2008, the Company’s two largest customers represented 26%, and 11%, respectively, of the Company’s gross sales. For the year ended December 31, 2009, the Company’s two largest customers represented 28% and 11%, respectively, of the Company’s gross sales. As of December 31, 2009, four customers represented 41%, 14%, 14% and 10%, respectively, of the Company’s accounts receivable balance.
Approximately 32%, 23% and 30% of the Company’s raw materials purchases for the years ended December 31, 2007, 2008 and 2009, respectively, were purchased from its four largest suppliers.
The Company is also exposed to credit loss in the event of nonperformance by the counter-party to its interest rate swap agreement, but the Company does not anticipate nonperformance by the counter-party. The amount of such exposure is limited to the unrealized gains, if any, under such agreements. At December 31, 2009, the Company had no unrealized gains on its interest rate swap.
Inventories
Inventories are stated at the lower of cost (last-in, first-out, or “LIFO” method) or market value. The Company periodically reviews its inventory for slow moving or obsolete items and writes down the related products to estimated realizable value.
Property, Plant and Equipment
Property, plant and equipment are stated at historical cost. The costs of additions and improvements are capitalized, while maintenance and repairs are expensed as incurred. Depreciation is provided using the straight-line method over the following estimated useful lives:
| Buildings |
40 years | |
| Machinery and equipment |
5-11 years | |
| Furniture and equipment |
10 years | |
| Forklifts and tractors |
5 years | |
| Computer equipment and software |
3-5 years |
Leasehold improvements are amortized over the shorter of the lease term or the estimated useful life of the asset.
Long-Lived Assets
In accordance with FASB ASC Topic 360, “Property, Plant and Equipment,” the Company reviews its long-lived assets, including property, plant and equipment, whenever events or changes in circumstances indicate that the carrying amount of the assets may not be fully recoverable. To determine the recoverability of its long-lived assets, the Company evaluates the probability that future estimated undiscounted net cash flows will be less than the carrying amount of the long-lived assets. If the estimated cash flows are less than the carrying amount of the long-lived assets, the assets are written down to their fair value. The Company’s estimates of anticipated cash flows and the remaining estimated useful lives of long-lived assets could be reduced in the future. As a result, the carrying amount of long-lived assets could be reduced in the future.
In September 2009, the Company recorded a pre-tax impairment charge of $23.3 million related to the long-lived assets held at the Company’s Olive Branch facility to reduce the carrying value of those groups to their estimated fair value. The fair value measurement used to determine the impairment was based on prices for
F-8
similar assets and considered the condition of the related fixed assets. Changes in the expected cash flows related to the facility in the future may result in additional impairment charges and reduced earnings.
Contract Termination Costs
In anticipation of relocating the Company’s corporate headquarters, the Company entered into a lease agreement in 2005. The Company reconsidered and decided not to move its headquarters. The lease, which began on January 1, 2006 and extends through June 30, 2019, currently obligates the Company to lease 55,047 square feet and increases to 80,071 square feet in 2012. As of January 10, 2008, the Company had executed subleases for the entire 55,047 square feet it currently leases. The terms of the existing subleases extend through years 2012 to 2015. The Company estimates that the present value of the estimated future sublease rental receipts, net of transaction costs, will be less than the Company’s remaining minimum lease payment obligations under its lease for the office space. Accordingly, the Company accounts for the costs associated with the lease as contract termination costs in accordance with FASB ASC Topic 420, “Exit or Disposal Cost Obligations.”
To estimate future sublease receipts for the periods beyond the term of the existing subleases and for the additional space the Company is obligated to lease, the Company has assumed that the existing subleases will be renewed or new subleases will be executed at rates consistent with rental rates in the current subleases. However, management cannot be certain that the timing of future subleases or the rental rates contained in future subleases will not differ from current estimates. Factors such as the delivery of a significant amount of new office space or poor economic conditions could have a negative effect on vacancy rates and rental rates in the area. The inability to sublet the office space in the future or unfavorable changes to key management assumptions used in the estimate of the future sublease receipts may result in material charges to selling, general and administrative expenses in future periods.
Goodwill
Goodwill represents the excess of cost over net assets acquired resulting from the Company’s purchase of the Mobil Composite Products Division in 1996. Each year, in accordance with FASB ASC Topic 350, “Intangibles- Goodwill and Others,” the Company conducts an impairment test. For the years ended December 31, 2007, 2008 and 2009, the Company completed its annual impairment test of goodwill and noted no impairment. The Company performs the annual impairment testing of its goodwill as of October 31 of each year.
Product Warranty
The Company warrants that its products will be free from material defects in workmanship and material and will not check, split, splinter, rot or suffer structural damage from termites or fungal decay. With respect to the Company’s new Transcend product, the Company further warrants that the product will not fade in color more than a certain amount and will be resistant to permanent staining from food substances or mold (provided the stain is cleaned within seven days of appearance). Each of these warranties generally extends for a period of 25 years for residential use and 10 years for commercial use. If there is a breach of such warranties, the Company has an obligation either to replace the defective product or refund the purchase price. The Company establishes warranty reserves to provide for estimated future expenses as a result of product defects that result in claims. Reserve estimates are based on management’s judgment, considering such factors as historical experience and other available information. Management reviews and adjusts these estimates, if necessary, on a quarterly basis based on the differences between actual experience and historical estimates.
In 2007, the Company recorded a significant increase to its warranty reserve due to a high number of claims resulting from a small percentage of material produced at its Nevada facility that exhibited surface defects. The Company continues to settle these claims against the warranty reserve and regularly monitors the adequacy of the remaining reserve. It is possible that the ultimate settlement of the claims may differ from the amount recorded and may result in future charges against income. The Company estimates that a 10% change in the expected
F-9
number of remaining claims or average cost of claims may result in approximately a $1.0 million change in the warranty reserve. For additional information about product warranties, see Note 14.
Revenue Recognition
The Company recognizes revenue when title is transferred to customers, which is generally upon shipment of the product to the customer. The Company does not grant contractual product return rights to customers other than pursuant to its product warranty. The Company does not expect future product returns to be material and, consequently, does not maintain an allowance for product returns.
Pursuant to FASB ASC Topic 605, the Company records all shipping and handling fees in sales and records all of the related costs in cost of sales. The Company offers several sales incentive programs to dealers and distributors, including rebates, pricing discounts, extended terms and cooperative advertising, many of which result in cash consideration made to dealers and distributors. The Company accounts for consideration made pursuant to these programs in accordance with accounting guidance that governs consideration given by a vendor to a customer. With the exception of cooperative advertising, the Company classifies sales incentives as a reduction in revenue in “Net sales.” Sales incentives are recorded in the period in which they are earned by customers. The Company’s cooperative advertising program meets the requirements for exclusion from net sales and the costs are recorded as expenses in “Selling, general and administrative expenses” in the accompanying consolidated statements of operations. Cooperative advertising costs are accrued as incurred.
Stock-Based Compensation
The Company accounts for share-based compensation in accordance with FASB ASC Topic 718, “Compensation—Stock Compensation.” Under the fair value recognition provisions of ASC 718, share-based compensation cost is measured at the grant date of the share-based awards based on their fair values, and is recognized on a straight line basis as expense in the accompanying consolidated statements of operations over the vesting periods of the awards, net of an estimated forfeiture rate.
Under the provisions of ASC 718, the grant date fair value of share-based awards is calculated using the Black-Scholes valuation model. Determining the fair value of share-based awards is judgmental in nature and involves the use of significant estimates and assumptions, including the term of the share-based awards, risk-free interest rates over the vesting period, expected dividend rates, the price volatility of shares and forfeiture rates of the awards. The Company bases the fair value estimates on assumptions it believes to be reasonable but that are inherently uncertain. Actual future results may differ from those estimates.
Income Taxes
The Company accounts for income taxes and the related accounts in accordance with FASB ASC Topic 740, “Income Taxes”. Deferred tax liabilities and assets are determined based on the difference between the financial statement and tax basis of assets and liabilities using enacted rates expected to be in effect during the year in which the differences reverse. Deferred tax assets are reduced by a valuation allowance when, in the opinion of management, it is more likely than not that some portion, or all, of the deferred tax asset will not be realized. Management periodically assesses the likelihood that the Company will be able to recover its deferred tax assets and reflects any changes in estimates in the valuation allowance.
Research and Development Costs
Research and development costs are expensed as incurred. For the years ended December 31, 2007, 2008 and 2009, research and development costs were $3.9 million, $3.5 million and $5.3 million, respectively, and have been included in “Selling, general and administrative expenses” in the accompanying consolidated statements of operations.
F-10
Advertising Costs
The Company expenses its branding and advertising communication costs as incurred. Significant production costs are deferred and recognized as expense in the period that the related advertisement is first used. At December 31, 2008 and December 31, 2009, $0.1 million and $0.6 million, respectively, were included in prepaid expenses for production costs.
For the years ended December 31, 2007, 2008 and 2009, branding expenses, including advertising expenses as described above, were $22.5 million, $16.9 million and $16.2 million, respectively.
Fair Value of Financial Instruments
The Company considers the recorded value of its financial assets and liabilities, consisting primarily of cash and cash equivalents, accounts receivable, accounts payable, accrued expenses and other current liabilities, real estate loans, and promissory note to approximate the fair value of the respective assets and liabilities at December 31, 2008 and 2009. At December 31, 2009, the fair value of the Company’s $97.5 million 6.00% Convertible Senior Subordinated Notes due July 1, 2012 was estimated at $108.2 million based on quoted market prices.
Derivative Instruments
The Company uses interest rate swaps to manage its exposure to fluctuations in the interest rates on its variable-rate debt. The Company accounts for interest rate swaps as derivative instruments in accordance with FASB ASC Topic 815, “Derivative and Hedging” (formerly SFAS No. 133, Accounting for Derivative Instruments and Hedging Activities, as amended). ASC 815 requires derivative instruments to be measured at fair value in the consolidated balance sheets. Changes in the fair value of the derivative instruments not designated as cash flow hedges or the ineffective portion of derivative instruments designated as cash flow hedges are recorded as a gain or loss in income in the current period. Changes in the fair value of a derivative instrument that qualifies and has been designated as a cash flow hedge of a forecasted transaction are initially recorded, net of tax, in “Accumulated other comprehensive loss” in the accompanying consolidated balance sheets and are subsequently reclassified to “Interest expense, net” when the forecasted transaction occurs. If a forecasted transaction is no longer probable, the deferred gain or loss in “Accumulated other comprehensive loss” in the accompanying consolidated balance sheets is immediately reclassified to income. Gains or losses related to any ineffective portion of cash flow hedges are recognized in income immediately.
Comprehensive Income (Loss)
Comprehensive income (loss) consists of net income (loss) and net unrealized gains and losses on interest rate swap contracts. For the years ended December 31, 2007, 2008 and 2009, comprehensive income (loss) was ($65.7) million, $7.0 million and ($15.6) million, respectively.
Investment in Denplax
During 2000, the Company formed a joint venture, Denplax, with a Spanish environmental company and an Italian equipment manufacturer to operate a plant in Spain designed to recycle waste polyethylene. Denplax qualifies as a variable interest entity per relevant accounting guidance. Denplax was financed with initial equity contributions from the Company and the other partners and debt financing. The Company is not contingently liable for any of Denplax’s obligations. The Company does not control Denplax and records its proportional 35% share of Denplax’s operating results using the equity method. The Company’s purchases account for substantially all of the Denplax plant’s production. The carrying amount of the Company’s investment in Denplax at December 31, 2009 was approximately $1.2 million. In addition, the Company had outstanding loans due from Denplax totaling approximately $1.9 million and $1.6 million at December 31, 2008 and 2009, respectively.
F-11
New Accounting Standards
In June 2009, the Financial Accounting Standards Board (“FASB”) issued Accounting Standards Update No. 2009-01, “Generally Accepted Accounting Principles” (ASC Topic 105) which establishes the FASB Accounting Standards Codification™ (“the Codification” or “ASC”) as the single source of authoritative U.S. generally accepted accounting principles (“GAAP”) recognized by the FASB to be applied to nongovernmental entities. All existing accounting standards are superseded. All other accounting guidance not included in the Codification will be considered non-authoritative. The Codification also includes all relevant Securities and Exchange Commission (“SEC”) guidance organized using the same topical structure in separate sections within the Codification.
Following the Codification, the Board will not issue new standards in the form of Statements, FASB Staff Positions or Emerging Issues Task Force Abstracts. Instead, it will issue Accounting Standards Updates (“ASU”) which will serve to update the Codification, provide background information about the guidance and provide the basis for conclusions on the changes to the Codification.
The Codification is not intended to change GAAP, but it will change the way GAAP is organized and presented. The Codification is effective for our third-quarter 2009 financial statements and the principal impact on our financial statements is limited to disclosures as all future references to authoritative accounting literature will be referenced in accordance with the Codification. In order to ease the transition to the Codification, we are providing the Codification cross-reference alongside the references to the standards issued and adopted prior to the adoption of the Codification.
In April 2009, the FASB issued guidance, now codified within ASC 825, “Financial Instruments” (formerly FSP No. FAS 107-1 and APB 28-1, Interim Disclosures about Fair Value of Financial Instruments). ASC 825 requires disclosures about fair value of financial instruments for interim reporting periods of publicly traded companies as well as in annual financial statements. This standard also requires those disclosures in summarized financial information at interim reporting periods and annual periods ending after June 15, 2009. The Company adopted the disclosure requirements of this pronouncement for the quarter ended June 30, 2009.
Accounting Pronouncements Issued But Not Yet Effective
In June 2009, the FASB issued a pronouncement, now codified within ASC 810-10, (formerly SFAS No. 167, Amendments to FASB Interpretation No. 46(R), Consolidation of Variable Interest Entities). This updated guidance requires an analysis to determine whether a variable interest gives the entity a controlling financial interest in a variable interest entity. The determination of whether a reporting entity is required to consolidate another entity is based on, among other things, the other entity’s purpose and design and the reporting entity’s ability to direct the activities of the other entity that most significantly impact the other entity’s economic performance. ASC 810-10 will require a reporting entity to provide additional disclosures about its involvement with variable interest entities and any significant changes in risk exposure due to that involvement. A reporting entity will be required to disclose how its involvement with a variable interest entity affects the reporting entity’s financial statements. ASC 810-10 will be effective for our fiscal year beginning on January 1, 2010. The Company is currently evaluating the impact, if any, of adoption of ASC 810-10 on its financial statements.
| 3. | INVENTORIES |
Inventories (at LIFO value) consist of the following as of December 31 (in thousands):
| 2008 | 2009 | |||||
| Finished goods |
$ | 48,751 | $ | 25,846 | ||
| Raw materials |
20,646 | 19,639 | ||||
| Total inventories |
$ | 69,397 | $ | 45,485 | ||
F-12
Inventory is stated at the lower of cost or net realizable value. The Company periodically reviews its inventory for slow moving or obsolete items and writes down the related products to estimated net realizable value.
During the years ended December 31, 2007, 2008 and 2009, due to the liquidation of certain inventories, a portion of the Company’s cost of sales is based on prior year costs rather than current year costs. As a result, the Company recognized benefits of $0.6 million, $4.2 million and $11.4 million, respectively.
The Company reviews its inventory for slow moving or obsolete items and writes down the related products to net realizable value. During the three months ended September 30, 2009, management decided to reclaim for future use in its manufacturing process certain finished goods inventories that are no longer saleable or do not meet quality specifications. As a result, the Company recorded a charge of $7.2 million in the three months ended September 30, 2009. This reclamation of inventory gave rise to $7.4 million of the aforementioned $11.4 million LIFO benefit recognized in the twelve months ended December 31, 2009.
At December 31, 2008 and 2009, the excess of the replacement cost of inventory over the LIFO value of inventory was approximately $30.3 million and $15.3 million, respectively.
| 4. | PROPERTY, PLANT AND EQUIPMENT |
Property, plant and equipment consist of the following as of December 31 (in thousands):
| 2008 | 2009 | |||||||
| Building and improvements |
$ | 56,214 | $ | 56,524 | ||||
| Machinery and equipment |
223,393 | 227,116 | ||||||
| Furniture and fixtures |
2,528 | 2,480 | ||||||
| Forklifts and tractors |
4,514 | 4,398 | ||||||
| Computer equipment |
11,408 | 11,525 | ||||||
| Construction in process |
2,608 | 2,908 | ||||||
| Land |
8,857 | 8,858 | ||||||
| 309,522 | 313,809 | |||||||
| Accumulated depreciation |
(133,186 | ) | (176,782 | ) | ||||
| Total property, plant and equipment, net |
$ | 176,336 | $ | 137,027 | ||||
The Company had construction in process as of December 31, 2009 of approximately $2.9 million. The Company expects that the construction in process will be completed and put into service in the year ending December 31, 2010.
Depreciation expense for the years ended December 31, 2007, 2008 and 2009 totaled $22.5 million, $24.9 million and $22.9 million, respectively.
In September 2009, the Company recorded a pre-tax impairment charge of $23.3 million related to the long-lived assets held at the Company’s Olive Branch facility to reduce the carrying value of those groups to their estimated fair value. The fair value measurement used to determine the impairment was based on prices for similar assets and considered the condition of the related fixed assets and is a Level III fair value measurement as defined by FASB ASC Topic 820. Changes in the expected cash flows related to the facility in the future may result in additional impairment charges and reduced earnings.
F-13
| 5. | ACCRUED EXPENSES |
Accrued expenses consist of the following (in thousands):
| 2008 | 2009 | |||||
| Accrued compensation and benefits |
$ | 9,996 | $ | 5,917 | ||
| Accrued interest |
4,734 | 3,850 | ||||
| Accrued rent obligations |
2,268 | 2,351 | ||||
| Accrued sales and marketing costs |
2,023 | 2,536 | ||||
| Accrued taxes and penalties |
1,144 | 278 | ||||
| Other |
2,074 | 4,194 | ||||
| Total accrued expenses |
$ | 22,239 | $ | 19,126 | ||
| 6. | DEBT |
Indebtedness. At December 31, 2009, the Company’s indebtedness, including the fair value of its interest rate swaps, totaled $101.0 million and the annualized overall weighted average interest rate of such indebtedness, including the effect of the Company’s interest rate swap, was approximately 6.09%.
Convertible Notes Offering. On June 18, 2007, the Company issued $85.0 million principal amount of its 6.00% Convertible Senior Subordinated Notes due July 1, 2012 (the “Notes”) through an underwritten public offering. The Company used a portion of net proceeds of $82.1 million from the sale of the Notes to repay in full $24.0 million principal amount of its 8.32% senior secured notes due July 19, 2009 and $45.7 million principal amount of borrowings outstanding under its revolving credit facility. The Company paid a prepayment penalty of $0.6 million in connection with the retirement of the senior secured notes. On July 12, 2007, the underwriters of the Notes offering exercised their over-allotment option to purchase an additional $12.5 million principal amount of Notes. The Company received net proceeds of $12.1 million from the sale of the additional Notes, which it issued on July 17, 2007.
Holders may convert the Notes into the Company’s common stock at their option before the close of business on any business day prior to April 1, 2012 only under the following circumstances:
| • | during any fiscal quarter of the Company commencing after September 30, 2007, if the last reported sale price of the Company’s common stock for at least 20 trading days during a period of 30 consecutive trading days ending on the last trading day of the preceding fiscal quarter is greater than or equal to 130% of the applicable conversion price on each applicable trading day; |
| • | during the five business-day period after any ten consecutive trading-day period in which the trading price per Note for each day of that measurement period is less than 98% of the product of the last reported sale price of the common stock and the applicable Note conversion rate on each such day; or |
| • | upon the occurrence of specified corporate events. |
On and after April 1, 2012, until the close of business on the third business day immediately preceding the maturity date, holders may convert their Notes at any time, regardless of the foregoing circumstances.
Upon conversion of any Notes, the Company will pay cash up to the principal amount of the Notes converted and deliver shares of its common stock to the extent the daily conversion value exceeds the proportionate principal amount of such Notes based on a 40 trading-day observation period. The conversion rate will be 45.9116 shares of common stock per $1,000 principal amount of Notes, which is equivalent to a conversion price of approximately $21.78 per share of common stock. The conversion rate will be subject to adjustment in some events. In addition, following specified corporate transactions that occur before the maturity date, the conversion rate will be increased for a holder who elects to convert the holder’s Notes in connection with such a corporate transaction in certain circumstances. Shares issued as a result of the conversion of any Notes would have a dilutive effect on earnings per share.
F-14
The Company may not redeem the Notes. If the Company undergoes a fundamental change, as defined in the Notes, holders may require the Company to purchase the Notes in whole or in part for cash at a price equal to 100% of the principal amount of the Notes to be purchased, plus any accrued and unpaid interest.
The Notes are the Company’s direct, senior subordinated, unsecured obligations and rank equally in right of payment with all of the Company’s existing and future senior subordinated indebtedness, senior in right of payment to all of the Company’s existing and future subordinated indebtedness and junior in right of payment to all of the Company’s existing and future senior indebtedness.
In May 2008, the FASB issued guidance, now codified within ASC 470 (formerly FSP APB 14-1, Accounting for Convertible Debt Instruments That May Be Settled in Cash upon Conversion (Including Partial Cash Settlement). ASC 470 requires the proceeds from the issuance of convertible debt instruments that may be settled in cash upon conversion to be allocated between a liability component and an equity component. The resulting debt discount will be amortized over the period the convertible debt is expected to be outstanding as non-cash interest expense. The Company adopted ASC 470 effective January 1, 2009, which was applied retrospectively to prior periods as reflected in the Company’s Annual Report on Form 10-K, as amended by Amendment No. 1 on Form 10-K/A. The Company has outstanding convertible debt instruments issued in June 2007 that are affected by ASC 470. Upon the original issuance of convertible debt in 2007, the Company recorded the net debt obligation as long-term debt in accordance with applicable accounting standards at that time. To adopt ASC 470, the Company estimated the fair value, as of the date of issuance, of the convertible debt instruments as if the instruments were issued without the conversion options. The difference between the fair value and the principal amounts of the instruments was $38.5 million. This amount was retrospectively applied to the Company’s financial statements from the issuance date of the debt instruments in 2007, and was retrospectively recorded as a debt discount and as a component of equity. The discount is being amortized over the expected five-year life of the Notes resulting in a non-cash increase to interest expense in historical and future periods.
The retrospective adoption of ASC 470 resulted in a $6.8 million and a $5.7 million increase to interest expense for the years ended December 31, 2009 and 2008, respectively.
The following tables provide additional information regarding the Company’s convertible debt instruments that are subject to ASC 470 (in thousands, except conversion price):
| December 31, 2007 |
December 31, 2008 |
December 31, 2009 |
||||||||||
| Principal amount of the liability component |
$ | 97,500 | $ | 97,500 | $ | 97,500 | ||||||
| Unamortized discount of liability component |
(35,970 | ) | (30,240 | ) | (23,407 | ) | ||||||
| Net carrying amount of liability component |
61,530 | 67,260 | 74,093 | |||||||||
| Carrying amount of the equity component |
23,860 | 23,860 | 23,860 | |||||||||
| Remaining amortization period of discount |
54 months | 42 months | 30 months | |||||||||
| Conversion price |
$ | 21.78 | $ | 21.78 | $ | 21.78 | ||||||
| Effective interest rate on liability component |
18.41 | % | 18.41 | % | 18.41 | % | ||||||
| Interest expense at coupon rate (6.0%) |
$ | 2,925 | $ | 5,850 | $ | 5,850 | ||||||
| Non-cash interest in accordance with ASC 470 |
$ | 2,508 | $ | 5,730 | $ | 6,833 | ||||||
Revolving Credit Facility. In November 2009, the Company entered into a credit agreement providing an $85 million revolving line of credit. The company has the option to borrow at Base Rate Advances or Euro-Dollar Advances. Base Rate Advances under the Revolver Loans accrue interest at the Base Rate plus the Applicable Margin of 0.25% to 1.00% and Euro-Dollar Advances for the Revolver Loans accrue interest at the Adjusted London InterBank Offered Rate (“LIBOR”) plus the Applicable Margin of 2.75% to 3.50% annually. The credit facility matures on December 31, 2011, but may be extended to December 31, 2012 if certain terms and conditions are met.
F-15
The $85 million credit facility consists of a $60 million revolver loan and a $25 million reducing revolver loan. The reducing revolver loan is subject to an annual step down in the amount of $1,670,000 each. Amounts drawn under the revolver loan are subject to a borrowing base consisting of accounts receivable, finished goods inventories and certain raw material inventories. At December 31, 2009, the borrowing base under the two revolver loans totaled approximately $47 million.
Compliance With Debt Covenants. Effective November 4, 2009, financial covenants related to the Credit Agreement with BB&T Capital Markets, as lead arranger, Branch Banking and Trust Company, as administrative agent and letter of credit issuer, and TD Bank, N.A. are as follows:
| (a) | Minimum Consolidated Tangible Net Worth. Trex will maintain Consolidated Tangible Net Worth (as defined in the credit agreement) of not less than the sum of (i) $87,000,000, plus (ii) 50% of Consolidated Net Income (as defined in the credit agreement) after December 31, 2008 (taken as one accounting period), but excluding from such calculation of Consolidated Net Income any quarter in which Consolidated Net Income is negative, measured as of the end of each fiscal quarter commencing with the fiscal quarter ending September 30, 2009. |
| (b) | Fixed Charge Coverage Ratio. Trex will not permit the Fixed Charge Coverage Ratio (as defined in the credit agreement) to be less than 1.1 to 1.0, measured as of the end of each fiscal quarter, commencing with the fiscal quarter ending September 30, 2009, for the four-quarter period then ended; provided, however, that if Excess Availability (as defined in the credit agreement) exceeds $35,000,000, measurement of the Fixed Charge Coverage Ratio shall be made as of the end of each fiscal year. |
| (c) | Consolidated Debt to Consolidated EBITDA Ratio. Trex will not permit the Consolidated Debt to Consolidated EBITDA Ratio (as defined in the credit agreement) to exceed: (i) 6.0 to 1.0 as of December 31, 2009 and December 31, 2010, (ii) 5.5 to 1.0 as of December 31, 2011, and (iii) 4.5 to 1.0 as of December 31, 2012, and as of the end of each fiscal year thereafter. |
The Company was in compliance with all covenants contained in its loan agreements at December 31, 2009.
Long-Term Debt. The Company’s Notes have been reduced by debt discounts of $30.2 million and $23.4 million as of December 31, 2008 and 2009, respectively, in accordance with the terms of FASB ASC Topic 470.
Long-term debt consists of the following as of December 31 (in thousands):
| 2008 | 2009 | |||||||
| Real estate loans |
$ | 9,234 | $ | 3,086 | ||||
| Convertible notes |
97,500 | 97,500 | ||||||
| Promissory note |
25,000 | — | ||||||
| Total long-term debt |
131,734 | 100,586 | ||||||
| Less unamortized debt discount |
(30,240 | ) | (23,407 | ) | ||||
| 101,494 | 77,179 | |||||||
| Less current portion |
(1,293 | ) | (545 | ) | ||||
| Long-term debt, excluding current portion |
$ | 100,201 | $ | 76,634 | ||||
F-16
Future debt maturities are as follows (in thousands):
| Years ending December 31, |
|||
| 2010 |
$ | 545 | |
| 2011 |
590 | ||
| 2012 |
98,138 | ||
| 2013 |
693 | ||
| 2014 |
620 | ||
| Thereafter |
— | ||
| Total long-term debt |
$ | 100,586 | |
During the years ended December 31, 2007, 2008 and 2009, the Company capitalized approximately $1.0 million, $0.2 million and $5 thousand of interest, respectively.
Interest Rate Swaps
The Company uses interest rate swaps to manage its exposure to fluctuations in the interest rates on its variable-rate debt. The Company had outstanding debt of $100.6 million at December 31, 2009, $97.5 million of which is fixed-rate debt. The remaining $3.1 million of the Company’s total debt outstanding at December 31, 2009 is variable-rate debt.
At December 31, 2009 and 2008 the fair value of the Company’s interest rate swaps was $0.4 million and $2.1 million, respectively and was classified as a long term liability in the accompanying consolidated balance sheets. The Company accounts for interest rate swaps as derivative instruments in accordance with FASB ASC Topic 815, “Derivatives and Hedging” (formerly SFAS No. 133, Accounting for Derivative Instruments and Hedging Activities, as amended). ASC 815 requires derivative instruments to be measured at fair value in the consolidated balance sheets. The interest rate swap was designated as a cash flow hedge of a forecasted transaction in accordance with ASC 815 and the changes in fair value of this instrument was recorded, net of tax, in “Accumulated other comprehensive loss” in the accompanying consolidated balance sheets. At December 31, 2009, $0.3 million of unrealized losses, net of tax, were recorded in “Accumulated other comprehensive loss” in the accompanying consolidated balance sheets. The Company expects approximately $0.2 million to be reclassified into “Interest expense, net” over the next twelve months.
| 7. | FAIR VALUE MEASUREMENT |
The Company adopted certain provisions of FASB ASC Topic 820 on January 1, 2008, which defines fair value, establishes a framework for measuring fair value in accordance with generally accepted accounting principles and expands disclosures about fair value measurements. The Company’s adoption was limited to financial assets and liabilities, which primarily relate to derivative contracts.
ASC 820 requires the categorization of financial assets and liabilities based upon the level of judgments associated with the inputs used to measure their fair value. Hierarchical levels, defined by ASC 820 and directly related to the amount of subjectivity associated with the inputs used to determine the fair value of financial assets and liabilities, are as follows:
| • | Level 1—Inputs are unadjusted, quoted prices in active markets for identical assets or liabilities at the measurement date |
| • | Level 2—Inputs (other than quoted prices included in Level 1) are either directly or indirectly observable for the assets or liability through correlation with market data at the measurement date and for the duration of the instrument’s anticipated life |
F-17
| • | Level 3—Inputs reflect management’s best estimate of what market participants would use in pricing the asset or liability at the measurement date. Consideration is given to the risk inherent in the valuation technique and the risk inherent in the inputs to the model. |
The determination of the fair value level within which the entire fair value measurement falls is based on the lowest level input that is significant to the fair value measurement in its entirety. The Company’s assessment of the significance of a particular input to the fair value measurement in its entirety requires judgment, and considers factors specific to the assets or liabilities.
The following table presents the financial assets and liabilities we measure at fair value on a recurring basis, based on the fair value hierarchy as of December 31, 2009 (in thousands):
| Total Fair Value Measurement December 31, 2009 |
Quoted Prices in Active Markets for Identical Asset (Level 1) |
Significant Other Observable Inputs (Level 2) |
Significant Unobservable Inputs (Level 3) | |||||||||
| Debt-related derivative liability |
$ | 392 | $ | — | $ | 392 | $ | — | ||||
The Company uses interest-rate swap contracts to manage its exposure to fluctuations in the interest rates under its variable-rate debt.
| 8. | FINANCIAL INSTRUMENTS |
The Company considers the recorded value of its financial assets and liabilities, consisting primarily of cash and cash equivalents, accounts receivable, accounts payable, accrued expenses and other current liabilities, real estate loans, and promissory note to approximate the fair value of the respective assets and liabilities at December 31, 2008 and December 31, 2009. At December 31, 2009, the fair value of the Company’s 6.00% Convertible Senior Subordinated Notes due 2012 was estimated at $108.2 million based on quoted market prices.
The Company uses interest rate swaps to manage its exposure to fluctuations in the interest rates on its variable-rate debt. At December 31, 2009, the Company had one fixed-for-floating interest rate swap that matures on October 1 2014 that effectively converts the Company’s variable-rate real estate note to fixed-rate obligation. The Company accounts for interest rate swaps as derivative instrument in accordance with FASB ASC Topic 815, “Derivatives and Hedging” (formerly SFAS No. 133, Accounting for Derivative Instruments and Hedging Activities, as amended). ASC 815 requires derivative instruments to be measured at fair value in the condensed consolidated balance sheets. At December 31, 2009 the fair value of the Company’s interest rate swap was $0.4 million and was classified as a long-term liability in the accompanying condensed consolidated balance sheets. The interest rate swap instrument qualifies for, and was designated as, cash flow hedge of a forecasted transaction in accordance with ASC 815 and the change in fair value of this instrument was recorded, net of tax, in “Accumulated other comprehensive loss” in the accompanying consolidated balance sheets. At December 31, 2009, $0.3 million of unrealized losses, net of tax, were recorded in “Accumulated other comprehensive loss” in the accompanying consolidated balance sheets. The Company expects approximately $0.2 million to be reclassified into “Interest expense, net” over the next twelve months.
The following table illustrates the changes in “Accumulated other comprehensive loss” related to the cash flow hedges during the twelve months ended December 31, 2009 (in thousands):
| Fair Value of Cash Flow Hedges |
Tax Effect | Fair Value of Cash Flow Hedges, Net of Tax |
||||||||||
| Balance, December 31, 2008 |
$ | 1,241 | $ | (150 | ) | $ | 1,091 | |||||
| Gain (loss) reclassified to “Interest expense, net” |
(904 | ) | 23 | (881 | ) | |||||||
| Unrealized (gains) losses during period |
55 | — | 55 | |||||||||
| Balance, December 31, 2009 |
$ | 392 | $ | (127 | ) | $ | 265 | |||||
F-18
| 9. | EARNINGS PER SHARE |
The following table sets forth the computation of basic and diluted earnings per share (in thousands, except share and per share data):
| Year Ended December 31, | |||||||||||
| 2007 | 2008 | 2009 | |||||||||
| Numerator: |
|||||||||||
| Net income (loss) |
$ | (65,414 | ) | $ | 7,534 | $ | (16,449 | ) | |||
| Denominator: |
|||||||||||
| Basic weighted average shares outstanding |
14,884,174 | 14,956,927 | 15,061,603 | ||||||||
| Effect of dilutive securities: |
|||||||||||
| Stock options |
— | 38,623 | — | ||||||||
| Restricted stock |
— | 117,533 | — | ||||||||
| Diluted weighted average shares outstanding |
14,884,174 | 15,113,083 | 15,061,603 | ||||||||
| Basic earnings (loss) per share |
$ | (4.39 | ) | $ | 0.50 | $ | (1.09 | ) | |||
| Diluted earnings (loss) per share |
$ | (4.39 | ) | $ | 0.50 | $ | (1.09 | ) | |||
Upon evaluation of its convertible notes, the Company determined there was no dilutive effect as of December 31, 2007, 2008 and 2009. In the years ended December 31, 2007 and December 31, 2009, the dilutive effect of stock options, stock appreciation rights and restricted stock is not recognized due to the net operating loss for these periods. In the year ended December 31, 2008, the Company excluded approximately 58,000 restricted shares because of their anti-dilutive effect.
| 10. | STOCK-BASED COMPENSATION |
Effective January 1, 2006, the Company adopted the fair value recognition provisions of FASB ASC Topic 718, Share-Based Payment, (ASC Topic 718). Under that transition method, compensation cost includes (a) compensation cost for all share-based payments granted prior to, but not yet vested as of, January 1, 2006, based on the grant date fair value estimated in accordance with the original provisions of ASC 718; and (b) compensation cost for all share-based payments granted subsequent to January 1, 2006, based on the grant date fair value estimated in accordance with the provisions of ASC 718.
The Company has one stock-based compensation plan, the 2005 Stock Incentive Plan (the “2005 Plan”), which was amended by its shareholders on May 7, 2008. The 2005 Plan is administered by the Compensation Committee of the Company’s Board of Directors. Stock-based compensation is granted to officers, directors and certain key employees in accordance with the provisions of the 2005 Plan. The 2005 Plan provides for grants of stock options, stock appreciation rights (“SARs”), restricted stock and performance share awards. The total aggregate number of shares of the Company’s common stock that may be issued under the 2005 Plan is 3,150,000 shares. For the years ended December 31, 2007, 2008 and 2009, stock compensation expense related to awards under the 2005 Plan was $3.6 million, $2.3 million and $3.5 million, respectively. This expense was included in “Selling, general and administrative expenses” in the accompanying consolidated statements of operations.
Stock Options and Stock Appreciation Rights
The 2005 Plan authorizes the grant of stock options and SARs. Stock options are granted with an exercise price and SARs are granted with a grant price equal to the closing market price of the Company’s common stock on the date of grant. These awards have ten-year contractual terms and vest based on the terms of the individual awards. The options and SARs are generally forfeitable upon termination of a holder’s service as an employee or
F-19
director, unless the individual’s service is terminated due to retirement, death or permanent disability. The Company recognizes compensation cost on a straight-line basis over the vesting period for the award. Prior to 2006, the Company granted stock options and all stock options outstanding at December 31, 2009 are fully vested. In 2006, the Company began the use of SARs instead of stock options.
As of December 31, 2009, there was $2.3 million of unrecognized compensation cost related to SARs expected to be recognized over a weighted-average period of approximately 1.6 years. The fair value of each stock option award and SAR is estimated on the date of grant using a Black-Scholes option-pricing model. For SARs issued in the years ended December 31, 2007, 2008 and 2009, respectively, the assumptions shown in the following table were used:
| Year Ended December 31, | |||||||||
| 2007 | 2008 | 2009 | |||||||
| Dividend yield |
0 | % | 0 | % | 0 | % | |||
| Average risk-free interest rate |
4.7 | % | 2.9 | % | 1.6 | % | |||
| Expected term (years) |
5 | 5 | 5 | ||||||
| Volatility |
41.4 | % | 45.0 | % | 57.9 | % | |||
Expected Volatility. Volatility is a measure of the amount by which a financial variable such as a share price has fluctuated (historical volatility) or is expected to fluctuate (expected volatility) during a period. The Company has used the historical volatility over the average expected term of the options granted as the expected volatility.
Risk-Free Interest Rate. This is the U.S. Treasury rate having a term that most closely resembles the expected term of the option.
Expected Term. The expected term is the period of time that the SARs granted is expected to remain unexercised. SARs granted during the year ended December 31, 2008 had a maximum term of ten years. The Company used historical exercise behavior with further consideration given to the class of employees to whom the equity awards were granted to estimate the expected term of the SAR.
The forfeiture rate is the estimated percentage of equity awards granted that are expected to be forfeited or canceled before becoming fully vested. The Company estimates forfeitures based on historical experience with further consideration given to the class of employees to whom the equity awards were granted.
The weighted-average grant date fair value of SARs granted during the year ended December 31, 2009 was $6.82.
F-20
Stock option activity under the 2005 Plan and a predecessor stock incentive plan is as follows:
| Options | Weighted- Average Exercise Price Per Share |
Weighted- Average Remaining Contractual Life |
Aggregate Intrinsic Value as of December 31, 2009 | ||||||||
| Outstanding at December 31, 2006 |
587,406 | $ | 35.19 | ||||||||
| Granted |
— | $ | — | ||||||||
| Exercised |
(1,733 | ) | $ | 22.59 | |||||||
| Canceled |
(60,221 | ) | $ | 36.64 | |||||||
| Outstanding at December 31, 2007 |
525,452 | $ | 35.10 | ||||||||
| Granted |
— | $ | — | ||||||||
| Exercised |
— | $ | — | ||||||||
| Canceled |
(298,862 | ) | $ | 37.11 | |||||||
| Outstanding at December 31, 2008 |
226,590 | $ | 32.45 | ||||||||
| Granted |
— | $ | — | ||||||||
| Exercised |
— | $ | — | ||||||||
| Canceled |
(18,924 | ) | $ | 30.19 | |||||||
| Outstanding at December 31, 2009 |
207,666 | $ | 32.66 | 3.3 | $ | 10,562 | |||||
| Vested at December 31, 2009 |
207,666 | $ | 32.66 | 3.3 | $ | 10,562 | |||||
| Exercisable at December 31, 2009 |
207,666 | $ | 32.66 | 3.3 | $ | 10,562 | |||||
At December 31, 2009, the price range of options outstanding was as follows:
| Options Outstanding |
Weighted- Average Exercise Price |
Weighted- Average Remaining Contractual Life (Years) |
Options Exercisable |
Weighted- Average Exercise Price | ||||||||
| $ 0.00 – 19.99 |
15,582 | $ | 18.92 | 2.0 | 15,582 | $ | 18.92 | |||||
| 20.00 – 29.99 |
81,362 | $ | 24.85 | 2.5 | 81,362 | $ | 24.85 | |||||
| 30.00 – 39.99 |
67,427 | $ | 36.77 | 3.6 | 67,427 | $ | 36.77 | |||||
| 40.00 and over |
43,295 | $ | 45.88 | 5.0 | 43,295 | $ | 45.88 | |||||
| Total |
207,666 | $ | 32.66 | 3.3 | 207,666 | $ | 32.66 | |||||
SAR activity under the 2005 Plan is as follows:
| SARs | Weighted-Average Grant Price Per Share | |||||
| Outstanding at December 31, 2006 |
300,360 | $ | 24.21 | |||
| Granted |
209,665 | $ | 24.42 | |||
| Canceled |
(37,499 | ) | $ | 24.79 | ||
| Vested at December 31, 2007 |
403,513 | $ | 24.21 | |||
| Exercisable at December 31, 2007 |
134,571 | $ | 23.01 | |||
| Outstanding at December 31, 2007 |
472,526 | $ | 24.26 | |||
| Granted |
732,648 | $ | 9.01 | |||
| Canceled |
(254,038 | ) | $ | 22.23 | ||
| Vested at December 31, 2008 |
848,014 | $ | 12.31 | |||
| Exercisable at December 31, 2008 |
219,387 | $ | 19.90 | |||
| Outstanding at December 31, 2008 |
951,136 | $ | 13.07 | |||
| Granted |
251,695 | $ | 13.52 | |||
| Exercised |
(22,334 | ) | $ | 16.63 | ||
| Canceled |
(47,145 | ) | $ | 12.88 | ||
| Outstanding at December 31, 2009 |
1,133,352 | $ | 13.25 | |||
| Vested at December 31, 2009 |
817,782 | $ | 13.69 | |||
| Exercisable at December 31, 2009 |
542,283 | $ | 15.58 | |||
F-21
Performance Share Awards
In the years ended December 31, 2005 and December 31, 2006, the Company granted performance share awards (“PSAs”) to certain of the Company’s officers and other employees under the 2005 Plan. The PSAs consist of a right to receive shares of the Company’s common stock if the Company met specified performance criteria over a three-year performance period.
Prior to January 1, 2006, PSAs were accounted for under APB 25 by charging a portion of compensation expense during each accounting period based on the probable number of shares to be issued. Beginning January 1, 2006, all PSAs are accounted for in accordance with the provisions of ASC 718. The fair value of the PSAs is determined based on the closing price of the Company’s shares on the date of grant. At December 31, 2008, there were 37,806 performance share awards outstanding with a weighted-average grant fair value of $24.79 per share. As a result of Company performance, all PSAs were cancelled in 2009 and no compensation expense was recognized related to PSAs during the years ended December 31, 2007, 2008, and 2009.
Performance share awards activity under the 2005 Plan is as follows:
| Performance Share Awards |
Weighted-Average Grant Price Per Share | |||||
| Nonvested at December 31, 2006 |
124,704 | $ | 30.36 | |||
| Granted |
7,213 | $ | 25.37 | |||
| Forfeited |
(25,276 | ) | $ | 32.25 | ||
| Nonvested at December 31, 2007 |
106,641 | $ | 29.56 | |||
| Granted |
— | $ | — | |||
| Forfeited |
(68,835 | ) | $ | 32.19 | ||
| Nonvested at December 31, 2008 |
37,806 | $ | 24.79 | |||
| Granted |
— | $ | — | |||
| Forfeited |
(37,806 | ) | $ | 24.79 | ||
| Nonvested at December 31, 2009 |
— | $ | — | |||
Restricted Stock
The fair value of the restricted stock is determined based on the closing price of the Company’s shares on the grant date. Shares of restricted stock vest based on the terms of the awards. Unvested restricted stock is generally forfeitable upon termination of a holder’s service as an employee, unless the individual’s service is terminated due to retirement, death or permanent disability. In the years ended December 31, 2007, 2008 and 2009, 188,331, 325,202 and 106,874 restricted shares were granted at $23.44, $8.59 and $13.44 per share, respectively. In the years ended December 31, 2007, 2008 and 2009, $1.4 million, $1.2 million and $1.6 million of compensation expense, respectively, was recognized related to restricted stock awards. At December 31, 2009, there was $2.1 million of total compensation expense related to unvested restricted stock remaining to be recognized over a weighted-average period of approximately 1.4 years. Compensation expense related to restricted stock is included in “Selling, general and administrative expenses” in the accompanying consolidated statements of operations.
F-22
Restricted stock activity under the 2005 Plan is as follows:
| Restricted Stock |
Weighted-Average Grant Price Per Share | |||||
| Nonvested at December 31, 2006 |
66,311 | $ | 26.77 | |||
| Granted |
188,331 | $ | 23.44 | |||
| Vested |
(49,767 | ) | $ | 24.07 | ||
| Forfeited |
(27,738 | ) | $ | 23.90 | ||
| Nonvested at December 31, 2007 |
177,137 | $ | 24.03 | |||
| Granted |
325,202 | $ | 8.59 | |||
| Vested |
(50,439 | ) | $ | 7.59 | ||
| Forfeited |
(105,592 | ) | $ | 16.87 | ||
| Nonvested at December 31, 2008 |
346,308 | $ | 11.69 | |||
| Granted |
106,874 | $ | 13.44 | |||
| Vested |
(126,781 | ) | $ | 14.50 | ||
| Forfeited |
(34,621 | ) | $ | 12.21 | ||
| Nonvested at December 31, 2009 |
291,780 | $ | 11.79 | |||
Employee Stock Purchase Plan
The Company has an employee stock purchase plan (“ESPP”) that permits eligible employees to purchase shares of common stock of the Company at a purchase price which is the lesser of 85% of the market price on the first day of the calendar quarter or 85% of the market price on the last day of the calendar quarter. Eligible employees may elect to participate in the plan by authorizing payroll deductions from 1% to 15% of gross compensation for each payroll period. On the last day of each quarter, each participant’s contribution account is used to purchase the maximum number of whole shares of common stock determined by dividing the contribution account’s balance by the purchase price. The aggregate number of shares of common stock that may be purchased under the plan is 300,000. Through December 31, 2009, employees had purchased approximately 159,000 shares under the plan. In the years ended December 31, 2007, 2008 and 2009, compensation expense of $49.2 thousand, $67.9 thousand and $117.9 thousand, respectively, was recognized related to the discount on ESPP purchases. Compensation expense related to ESPP purchases is included in “Selling, general and administrative expenses” in the accompanying consolidated statements of operations.
| 11. | LEASES |
The Company leases office space (also see Note 14), storage warehouses and certain office and plant equipment under various operating leases. Minimum annual payments under these non-cancelable leases as of December 31, 2009 were as follows (in thousands):
| Year Ending December 31, |
|||
| 2010 |
$ | 8,191 | |
| 2011 |
6,134 | ||
| 2012 |
5,441 | ||
| 2013 |
4,226 | ||
| 2014 |
4,424 | ||
| Thereafter |
12,620 | ||
| Total minimum lease payments |
$ | 41,036 | |
For the years ended December 31, 2007, 2008 and 2009, the Company recognized rental expenses of approximately $12.2 million, $10.1 million and $8.4 million, respectively.
F-23
| 12. | EMPLOYEE BENEFIT PLANS |
Through December 31, 2007, the Company had a 401(k) Profit Sharing Plan and a Money Purchase Pension Plan for the benefit of all employees who meet certain eligibility requirements. These plans covered substantially all of the Company’s full-time employees. The plan documents provide for the Company to make defined contributions as well as matching and other discretionary contributions, as determined by the Board of Directors. At December 31, 2007, the Company merged the two plans together and subsequently administers post-retirement benefits to employees through the prevailing 401(k) Profit Sharing Plan. The Company’s contributions to the plans totaled $1.8 million, $1.3 million and $1.2 million for the years ended December 31, 2007, 2008 and 2009.
| 13. | INCOME TAXES |
Income tax provision (benefit) for the years ended December 31, 2007, 2008 and 2009 consists of the following (in thousands):
| Year Ended December 31, | ||||||||||||
| 2007 | 2008 | 2009 | ||||||||||
| Current income tax provision (benefit): |
||||||||||||
| Federal |
$ | (1,617 | ) | $ | (238 | ) | $ | (5,172 | ) | |||
| State |
(88 | ) | (357 | ) | (1,636 | ) | ||||||
| (1,705 | ) | (595 | ) | (6,808 | ) | |||||||
| Deferred income tax provision (benefit): |
||||||||||||
| Federal |
(23,912 | ) | (131 | ) | 913 | |||||||
| State |
(488 | ) | (24 | ) | 84 | |||||||
| (24,400 | ) | (155 | ) | 997 | ||||||||
| Total income tax provision (benefit) |
$ | (26,105 | ) | $ | (750 | ) | $ | (5,811 | ) | |||
The income tax provision (benefit) differs from the amount of income tax determined by applying the U.S. federal statutory rate to income before taxes as a result of the following (in thousands):
| Year Ended December 31, | ||||||||||||
| 2007 | 2008 | 2009 | ||||||||||
| U.S. federal statutory taxes |
$ | (31,117 | ) | $ | 2,307 | $ | (7,582 | ) | ||||
| State and local taxes, net of U.S. federal benefit |
(3,377 | ) | 1,480 | (916 | ) | |||||||
| Permanent items |
125 | 89 | (30 | ) | ||||||||
| Federal credits |
(189 | ) | (402 | ) | (61 | ) | ||||||
| Other |
1,101 | (106 | ) | (1.255 | ) | |||||||
| Increase (decrease) in valuation allowance |
7,352 | (4,118 | ) | 4,033 | ||||||||
| Total income tax provision (benefit) |
$ | (26,105 | ) | $ | (750 | ) | $ | (5,811 | ) | |||
F-24
Deferred tax assets and liabilities as of December 31, 2008 and 2009 consist of the following (in thousands):
| As of December 31, | ||||||||
| 2008 | 2009 | |||||||
| Deferred tax assets: |
||||||||
| Net operating losses |
$ | 21,527 | $ | 20,146 | ||||
| Warranty reserve |
8,389 | 4,418 | ||||||
| Stock-based compensation |
2,203 | 2,635 | ||||||
| Accruals not currently deductible and other |
5,382 | 5,535 | ||||||
| Inventories |
1,853 | 1,837 | ||||||
| State tax credit carryforwards |
3,424 | 3,424 | ||||||
| Gross deferred tax assets, before valuation allowance |
42,778 | 37,995 | ||||||
| Valuation allowance |
(5,596 | ) | (9,321 | ) | ||||
| Gross deferred tax assets, after valuation allowance |
37,182 | 28,674 | ||||||
| Deferred tax liabilities: |
||||||||
| Inventories |
(2,783 | ) | (4,107 | ) | ||||
| Debt discount |
(11,466 | ) | (8,974 | ) | ||||
| Depreciation and other |
(24,323 | ) | (18,003 | ) | ||||
| Gross deferred tax liabilities |
(38,572 | ) | (31,084 | ) | ||||
| Net deferred tax asset (liability) |
$ | (1,390 | ) | $ | (2,410 | ) | ||
The valuation allowance as of December 31, 2009 of $9.3 million is primarily attributable to the uncertainty related to the realizability of the Company’s excess deferred tax assets. The increase in the valuation allowance during 2009 resulted primarily from losses incurred during 2009, partially offset by the effects of a $7.6 million refund claim related to newly enacted legislation providing for a special five-year net operating carryback election. The Company has considered all available evidence, both positive and negative, in determining the need for a valuation allowance. Based upon this analysis, including a consideration of the Company’s cumulative loss history in the three-year period ended December 31, 2009, management determined that it is not more likely than not that its excess deferred tax assets will be realized. The Company’s future realization of its excess deferred tax assets ultimately depends on the existence of sufficient taxable income in the carry-forward periods under the tax laws. The Company will analyze its position in subsequent reporting periods, considering all available positive and negative evidence, in determining the expected realization of its excess deferred tax assets.
The Company has federal net operating losses of $52.7 million at December 31, 2009 which expire starting 2027.
The Company adopted FASB Interpretation No. 48, Accounting for Uncertainty in Income Taxes (codified in FASB ASC 740, Income Taxes) on January 1, 2007. As a result of the adoption, the Company recorded a charge of $2.7 million to the January 1, 2007 “Retained earnings” balance in the accompanying consolidated balance sheets. The Company had $3.6 million, $3.1 million and $3.8 million of unrecognized tax benefits as of December 31, 2007, 2008 and 2009, respectively. A reconciliation of the beginning and ending amount of unrecognized tax benefits is as follows (in thousands):
| Year Ended December 31, | ||||||||||||
| 2007 | 2008 | 2009 | ||||||||||
| Unrecognized tax benefits balance at January 1 |
$ | 2,929 | $ | 3,620 | $ | 3,070 | ||||||
| Gross increases related to prior year tax positions |
1,479 | — | 2,528 | |||||||||
| Gross decreases related to prior year tax positions |
(545 | ) | — | (167 | ) | |||||||
| Gross increases related to current year tax positions |
— | 34 | — | |||||||||
| Settlements |
— | (63 | ) | (1,368 | ) | |||||||
| Lapse of statute of limitations |
(243 | ) | (521 | ) | (311 | ) | ||||||
| Unrecognized tax benefits balance at December 31 |
$ | 3,620 | $ | 3,070 | $ | 3,752 | ||||||
F-25
The total liabilities associated with unrecognized tax benefits that, if recognized, would affect the effective tax rates were $2.5 million and $1.0 million at December 31, 2008 and December 31, 2009, respectively.
The Company recognizes interest and penalties related to tax matters as a component of “Selling, general and administrative expenses” in the accompanying consolidated statements of operations. As of December 31, 2008 and December 31, 2009, the Company had accrued interest related to uncertain tax positions of $1.7 million and $0.9 million, respectively, and accrued penalties related to uncertain tax positions of $0.7 million and $0.2 million, respectively, in the accompanying consolidated balance sheets.
The Company operates in multiple tax jurisdictions and, in the normal course of business, its tax returns are subject to examination by various taxing authorities. Such examinations may result in future assessments by these taxing authorities and the Company has accrued a liability when it believes that it is not more likely than not that it will realize the benefits of tax positions that it has taken or for the amount of any tax benefit that exceeds the cumulative probability threshold in accordance with ASC 740. The Company believes that adequate provisions have been made for all tax returns subject to examination. As of December 31, 2009, tax years 2003 through 2009 remain subject to examination by federal and certain state tax jurisdictions. The Internal Revenue Service is currently examining our federal income tax returns for the tax years 2003 through 2008.
The Company has taken tax positions in certain taxing jurisdictions for which it is reasonably possible that the total amounts of unrecognized tax benefits may decrease within the year ending December 31, 2010. The Company does not expect any significant change to the total amount of unrecognized tax benefits within the next 12 months.
| 14. | COMMITMENTS AND CONTINGENCIES |
Legal Matters
On October 16, 2006, Ron Nystrom commenced a lawsuit against the Company in the United States District Court for the Eastern District of Virginia, Norfolk Division, which also named Home Depot, Inc. and Snavely Forest Products, Inc. as defendants. Mr. Nystrom alleges that the Company’s Accents® product and other new products introduced after the commencement of a prior patent infringement action infringe his patent. Mr. Nystrom also alleges that the Company’s Contours® product infringes a second patent owned by him and that the Company is engaged in contributory infringement by recommending third party hidden fastening systems that infringe such patent. In January 2008, Mr. Nystrom added an additional allegation that the Company’s Trex Hideaway™ hidden fastening system also infringes such patent. On May 16, 2008, the District Court granted summary judgment to the Company with respect to Mr. Nystrom’s claims on the first patent. On April 29, 2008, the District Court issued an order severing all claims associated with the second patent and consolidating them into a separate case. The Company believes that all of Mr. Nystrom’s claims are without merit, and, in addition, are barred by a prior judgment and patent claim construction.
On September 25, 2008, the Company commenced a lawsuit against Mr. Nystrom in Virginia Circuit Court for various causes of action, including defamation. On September 26, 2008, Mr. Nystrom filed a Notice of Appeal to the United States Court of Appeals for the Federal Circuit appealing the District Court’s grant of summary judgment to the Company with respect to Mr. Nystrom’s claims on the first patent. On October 16, 2008, the Company and Mr. Nystrom signed a Dismissal and Tolling Agreement which provided that the Federal District Court action relating to the second patent and the Company’s action in Virginia Circuit Court would both be dismissed without prejudice pending the decision of the Federal Court of Appeals on the District Court’s decision relating to the first patent. On September 8, 2009, the Federal Court of Appeals affirmed the District Court’s grant of summary judgment, in favor of the Company. Pursuant to the Dismissal and Tolling Agreement, this ended all pending litigation between the parties.
On January 19, 2009, a purported class action case was commenced against the Company in the Superior Court of California, Santa Cruz County, by Eric Ross and Bradley S. Hureth generally alleging certain product
F-26
defects in the Company’s products, and that the Company has failed to provide adequate remedies for defective products. On February 13, 2009, the Company removed this case to the United States District Court, Northern District of California. On January 21, 2009, a purported class action case was commenced against the Company in the United States District Court, Western District of Washington by Mark Okano making similar allegations. The Okano case was subsequently transferred by the Washington Court to the California Court as a related case to the Ross/Hureth case. On July 30, 2009, the U.S. District Court for the Northern District of California preliminary approved a settlement of the claims of the Ross/Hureth lawsuit involving surface flaking of the Company’s product. A hearing for final approval of the settlement occurred on October 30, 2009. As of the date of this report, the District Court has not issued its final ruling. The Company believes that both lawsuits are without merit.
Purchase Commitments
The Company fulfills requirements for raw materials under both purchase orders and supply contracts. In the year ended December 31, 2009, the Company purchased substantially all of its waste wood fiber requirements under purchase orders, which do not involve long-term supply commitments. Substantially all of the Company’s PE material purchases are under short-term supply contracts that average two years, for which pricing is negotiated as needed. The PE material supply contracts have not had a material adverse effect on the Company’s business.
The waste wood and PE material supply contracts generally provide that the Company is obligated to purchase all of the waste wood or PE material a supplier provides, if the waste wood or PE material meets certain specifications. The amount of waste wood and PE material the Company is required to purchase under these contracts varies with the production of its suppliers and, accordingly, is not fixed or determinable.
The Company outsources the production of certain products to third-party manufacturers under supply contracts that commit the Company to purchase minimum levels for each year extending through 2011. The Company has purchase commitments under the third-party manufacturing contracts of $28.6 million and $17.7 million for the years ended December 31, 2010 and 2011, respectively, and is subject to monetary penalties if it fails to purchase the minimum volumes specified in the contracts.
Contract Termination Costs
In anticipation of relocating the Company’s corporate headquarters, the Company entered into a lease agreement in 2005. The Company reconsidered and decided not to move its headquarters. The lease, which began on January 1, 2006 and extends through June 30, 2019, currently obligates the Company to lease 55,047 square feet and increases to 80,071 square feet in 2012. As of January 10, 2008, the Company had executed subleases for the entire 55,047 square feet it currently leases. The terms of the existing subleases extend through years 2012 to 2015. The Company estimates that the present value of the estimated future sublease rental receipts, net of transaction costs, will be less than the Company’s remaining minimum lease payment obligations under its lease for the office space. Accordingly, the Company accounts for the costs associated with the lease as contract termination costs in accordance with FASB ASC 420, “Exit or Disposal Cost Obligations.”
To estimate future sublease receipts for the periods beyond the term of the existing subleases and for the additional space the Company is obligated to lease, the Company has assumed that the existing subleases will be renewed or new subleases will be executed at rates consistent with rental rates in the current subleases. However, management cannot be certain that the timing of future subleases or the rental rates contained in future subleases will not differ from current estimates. Factors such as the delivery of a significant amount of new office space or poor economic conditions could have a negative effect on vacancy rates and rental rates in the area. The inability to sublet the office space in the future or unfavorable changes to key management assumptions used in the estimate of the future sublease receipts may result in material charges to selling, general and administrative expenses in future periods.
F-27
As of December 31, 2009, the minimum payments remaining under the Company’s lease over the years ending December 31, 2010, 2011, 2012, 2013 and 2014 are $1.6 million, $1.6 million, $2.0 million, $2.5 million and $2.5 million, respectively, and $12.2 million thereafter. The minimum receipts remaining under the Company’s existing subleases over the years ending December 31, 2010, 2011, 2012, 2013 and 2014 are $1.6 million, $1.6 million, $1.6 million, $1.3 million and $1.0 million, respectively, and $0.4 million thereafter. The following table provides information about the Company’s liability under the lease (in thousands):
| 2008 | 2009 | |||||||
| Balance as of January 1, |
$ | 925 | $ | 524 | ||||
| Less: cash payments |
(847 | ) | (79 | ) | ||||
| Accretion of discount |
55 | 40 | ||||||
| Add: charge for minimum lease payments in excess of estimated sublease receipts, net |
391 | — | ||||||
| Balance as of December 31, |
$ | 524 | $ | 485 | ||||
Product Warranty
The Company warrants that its products will be free from material defects in workmanship and material and will not check, split, splinter, rot or suffer structural damage from termites or fungal decay. With respect to the Company’s new Transcend product, it further warrants that the product will not fade in color more than a certain amount and will be resistant to permanent staining from food substances or mold (provided the stain is cleaned within seven days of appearance). Each of these warranties generally extends for a period of 25 years for residential use and 10 years for commercial use. If there is a breach of such warranties, the Company has an obligation either to replace the defective product or refund the purchase price. The Company establishes warranty reserves to provide for estimated future expenses as a result of product defects that result in claims. Reserve estimates are based on management’s judgment, considering such factors as historical experience and other available information. Management reviews and adjusts these estimates, if necessary, on a quarterly basis based on the differences between actual experience and historical estimates.
In 2007, the Company recorded a significant increase to its warranty reserve due to a high number of claims resulting from a small percentage of material produced at its Nevada facility that exhibited surface defects. The Company continues to settle these claims against the warranty reserve and regularly monitors the adequacy of the remaining reserve. It is possible that the ultimate settlement of the claims may differ from the amount recorded and may result in future charges against income. The Company estimates that a 10% change in the expected number of remaining claims may result in approximately a $1.0 million change in the warranty reserve.
The following is a reconciliation of the Company’s warranty reserve (in thousands):
| 2008 | 2009 | |||||||
| Beginning balance, January 1 |
$ | 39,985 | $ | 21,856 | ||||
| Provision for estimated warranties |
— | 250 | ||||||
| Settlements made during the period |
(18,129 | ) | (10,582 | ) | ||||
| Ending balance, December 31 |
$ | 21,856 | $ | 11,524 | ||||
F-28
| 15. | INTERIM FINANCIAL DATA (Unaudited) |
| Three Months Ended | |||||||||||||||||||||||||||
| March 31, 2008 |
June 30 2008 |
September 30 2008 |
December 31 2008 |
March 31, 2009 |
June 30 2009 |
September 30 2009 |
December 31 2009 | ||||||||||||||||||||
| (In thousands, except per share data) | |||||||||||||||||||||||||||
| Net sales |
119,529 | 94,998 | 85,379 | 29,288 | 67,650 | 91,455 | 61,949 | 51,232 | |||||||||||||||||||
| Gross profit |
32,276 | 27,618 | 22,973 | 6,157 | 16,754 | 28,562 | 18,482 | 17,150 | |||||||||||||||||||
| Net income (loss) |
7,401 | 6,484 | 5,165 | (11,516 | ) | (3,116 | ) | 7,378 | (22,462 | ) | 1,751 | ||||||||||||||||
| Basic net income (loss) per share |
$ | 0.50 | $ | 0.43 | $ | 0.35 | $ | (0.77 | ) | $ | (0.21 | ) | $ | 0.49 | $ | (1.49 | ) | $ | 0.12 | ||||||||
| Diluted net income (loss) per share |
$ | 0.49 | $ | 0.43 | $ | 0.34 | $ | (0.77 | ) | $ | (0.21 | ) | $ | 0.49 | $ | (1.49 | ) | $ | 0.11 | ||||||||
The Company’s net sales, gross profit and income from operations have historically varied from quarter to quarter. Such variations are principally attributable to seasonal trends in the demand for Trex. The Company has historically experienced lower net sales during the fourth quarter because holidays and adverse weather conditions in certain regions reduce the level of home improvement and new construction activity.
| (a) | Three months ended September 30, 2009 materially affected by a non-cash impairment charge of $23.3 million related to the Olive Branch facility. |
| (b) | Three months ended December 31, 2009 materially affected by a benefit resulting from newly enacted legislation providing for a special 5-year net operating loss (NOL) carryback election. |
F-29
TREX COMPANY, INC.
SCHEDULE II—VALUATION AND QUALIFYING ACCOUNTS AND RESERVES
(In Thousands)
| Descriptions |
Balance at Beginning of Period |
Additions (Reductions) Charged to Cost and Expenses |
Other | Deductions | Balance at End of Period | |||||||||||||
| Year ended December 31, 2009: |
||||||||||||||||||
| Allowance for doubtful accounts (a) |
$ | 1,489 | $ | 732 | $ | — | $ | (764 | ) | $ | 1,457 | |||||||
| Warranty reserve |
$ | 21,856 | $ | 250 | $ | — | $ | (10,582 | ) | $ | 11,524 | |||||||
| Income tax valuation allowance |
$ | 5,596 | $ | 4,033 | $ | (308 | ) | $ | — | $ | 9,321 | |||||||
| Year ended December 31, 2008: |
||||||||||||||||||
| Allowance for doubtful accounts (a) |
$ | 3,074 | $ | (701 | ) | $ | — | $ | (884 | ) | $ | 1,489 | ||||||
| Warranty reserve |
$ | 39,985 | $ | — | $ | — | $ | (18,129 | ) | $ | 21,856 | |||||||
| Income tax valuation allowance |
$ | 9,581 | $ | — | $ | 133 | $ | (4,118 | ) | $ | 5,596 | |||||||
| Year ended December 31, 2007: |
||||||||||||||||||
| Allowance for doubtful accounts (a) |
$ | 1,059 | $ | 2,130 | $ | — | $ | (115 | ) | $ | 3,074 | |||||||
| Warranty reserve |
$ | 2,467 | $ | 65,496 | $ | — | $ | (27,978 | ) | $ | 39,985 | |||||||
| Income tax valuation allowance |
$ | 2,229 | $ | 7,352 | $ | — | $ | — | $ | 9,581 | ||||||||
| (a) | Reserve related to accounts receivable |
F-30
SIGNATURES
Pursuant to the requirements of Section 13 or 15(d) of the Securities Exchange Act of 1934, the registrant has duly caused this report to be signed on its behalf by the undersigned, thereunto duly authorized.
| Trex Company, Inc. | ||||||||
| Date: March 12, 2010 | By: | /s/ RONALD W. KAPLAN | ||||||
| Ronald W. Kaplan President and Chief Executive Officer (Duly Authorized Officer) | ||||||||
Pursuant to the requirements of the Securities Exchange Act of 1934, this report has been signed as of March 12, 2010 by the following persons on behalf of the registrant and in the capacities indicated.
| Signature |
Title | |
| /s/ RONALD W. KAPLAN Ronald W. Kaplan |
President and Chief Executive Officer (Principal Executive Officer); Director | |
| /s/ JAMES E. CLINE James E. Cline |
Vice President and Chief Financial Officer (Principal Financial Officer and Principal Accounting Officer) | |
| /s/ ANDREW U. FERRARI Andrew U. Ferrari |
Chairman | |
| /s/ WILLIAM F. ANDREWS William F. Andrews |
Director | |
| /s/ PAUL A. BRUNNER Paul A. Brunner |
Director | |
| /s/ JAY M. GRATZ Jay M. Gratz |
Director | |
| /s/ FRANK H. MERLOTTI, JR. Frank H. Merlotti, Jr. |
Director | |
| /s/ RICHARD E. POSEY Richard E. Posey |
Director | |
| /s/ PATRICIA B. ROBINSON Patricia B. Robinson |
Director | |
EXHIBIT INDEX
| Exhibit |
Exhibit Description | |
| 3.1 | Restated Certificate of Incorporation of Trex Company, Inc. (the “Company”). Filed as Exhibit 3.1 to the Company’s Registration Statement on Form S-1 (No. 333-63287) and incorporated herein by reference. | |
| 3.2 | Amended and Restated By-Laws of the Company. Filed as Exhibit 3.2 to the Company’s Current Report on Form 8-K filed May 7, 2008 and incorporated herein by reference. | |
| 4.1 | Specimen certificate representing the Company’s common stock. Filed as Exhibit 4.1 to the Company’s Registration Statement on Form S-1 (No. 333-63287) and incorporated herein by reference. | |
| 4.2 | Indenture, dated as of June 18, 2007, between Trex Company, Inc. and The Bank of New York, as trustee. Filed as Exhibit 4.1 to the Company’s Current Report on Form 8-K filed on June 19, 2007 and incorporated herein by reference. | |
| 4.3 | Supplemental Indenture, dated as of June 18, 2007, between Trex Company, Inc. and The Bank of New York, as trustee, including the form of 6.00% Convertible Senior Subordinated Note due 2012. Filed as Exhibit 4.2 to the Company’s Current Report on Form 8-K filed on June 19, 2007 and incorporated herein by reference. | |
| 10.1 | Description of Management Compensatory Plans and Arrangements. Filed herewith. | |
| 10.2 | Trex Company, Inc. 2005 Stock Incentive Plan. Filed as Exhibit 10.1 to the Company’s Current Report on Form 8-K filed on May 7, 2008 and incorporated herein by reference. | |
| 10.3 | Trex Company, Inc. Amended and Restated 1999 Incentive Plan for Outside Directors. Filed as Exhibit 10.4 to the Company’s Annual Report on Form 10-K for the fiscal year ended December 31, 2007 and incorporated herein by reference. | |
| 10.4 | Form of Trex Company, Inc. 2005 Stock Incentive Plan Non-Incentive Stock Option Agreement. Filed as Exhibit 10.1 to the Company’s Quarterly Report on Form 10-Q for the quarterly period ended June 30, 2005 and incorporated herein by reference. | |
| 10.5 | Form of Trex Company, Inc. 2005 Stock Incentive Plan Stock Appreciation Rights Agreement. Filed as Exhibit 10.2 to the Company’s Quarterly Report on Form 10-Q for the quarterly period ended June 30, 2005 and incorporated herein by reference. | |
| 10.6 | Form of Trex Company, Inc. 2005 Stock Incentive Plan Performance Award Agreement. Filed as Exhibit 10.3 to the Company’s Quarterly Report on Form 10-Q for the quarterly period ended June 30, 2005 and incorporated herein by reference. | |
| 10.7 | Form of Trex Company, Inc. 2005 Stock Incentive Plan Restricted Stock Agreement, as amended. Filed as Exhibit 10.8 to the Company’s Annual Report on Form 10-K for the fiscal year ended December 31, 2006 and incorporated herein by reference. | |
| 10.8 | Form of Trex Company, Inc. Amended and Restated 1999 Incentive Plan for Outside Directors Non-Incentive Stock Option Agreement for Directors. Filed as Exhibit 10.2 to the Company’s Quarterly Report on Form 10-Q for the quarterly period ended September 30, 2006 and incorporated herein by reference. | |
| 10.9 | Form of Trex Company, Inc. Amended and Restated 1999 Incentive Plan for Outside Directors Stock Appreciation Rights Agreement. Filed as Exhibit 10.3 to the Company’s Quarterly Report on Form 10-Q for the quarterly period ended September 30, 2006 and incorporated herein by reference. | |
| 10.10 | Form of Change in Control Severance Agreement for Officers of Trex Company, Inc. other than the Chief Executive Officer. Filed as Exhibit 10.4 to the Company’s Quarterly Report on Form 10-Q for the quarterly period ended June 30, 2007 and incorporated herein by reference. | |
| Exhibit |
Exhibit Description | |
| 10.11 | Amended and Restated Stock Appreciation Rights Agreement, between Trex Company, Inc. and Anthony J. Cavanna dated August 14, 2007. Filed as Exhibit 10.2 to the Company’s Quarterly Report on Form 10-Q for the quarterly period ended September 30, 2007 and incorporated herein by reference. | |
| 10.12 | Amended and Restated Stock Appreciation Rights Agreement, between Trex Company, Inc. and Anthony J. Cavanna dated August 14, 2007. Filed as Exhibit 10.3 to the Company’s Quarterly Report on Form 10-Q for the quarterly period ended September 30, 2007 and incorporated herein by reference. | |
| 10.13 | Amended and Restated Restricted Stock Agreement, between Trex Company, Inc. and Anthony J. Cavanna dated August 14, 2007. Filed as Exhibit 10.4 to the Company’s Quarterly Report on Form 10-Q for the quarterly period ended September 30, 2007 and incorporated herein by reference. | |
| 10.14 | Employment Agreement, dated as of January 1, 2008, between Trex Company, Inc. and Ronald W. Kaplan. Filed as Exhibit 10.1 to the Company’s Current Report on Form 8-K filed on January 2, 2008 and incorporated herein by reference. | |
| 10.15 | Change in Control Severance Agreement, dated as of January 1, 2008, between Trex Company, Inc. and Ronald W. Kaplan. Filed as Exhibit 10.2 to the Company’s Current Report on Form 8-K filed on January 2, 2008 and incorporated herein by reference. | |
| 10.16 | Form of Indemnity Agreement for Directors. Filed as Exhibit 10.19 to the Company’s Annual Report on Form 10-K for the fiscal year ended December 31, 2008 and incorporated herein by reference. | |
| 10.17 | Form of Indemnity Agreement for Officers. Filed as Exhibit 10.20 to the Company’s Annual Report on Form 10-K for the fiscal year ended December 31, 2008 and incorporated herein by reference. | |
| 10.18 | Form of Indemnity Agreement for Director/Officers. Filed as Exhibit 10.21 to the Company’s Annual Report on Form 10-K for the fiscal year ended December 31, 2008 and incorporated herein by reference. | |
| 10.19 | Form of Distributor Agreement of TREX Company, Inc. Filed as Exhibit 10.5 to the Company’s Annual Report on Form 10-K for the fiscal year ended December 31, 2001 and incorporated herein by reference. | |
| 10.20 | Form of Distributor Agreement of TREX Company, Inc. Filed as Exhibit 10.23 to the Company’s Annual Report on Form 10-K for the fiscal year ended December 31, 2008 and incorporated herein by reference. | |
| 10.21 | Form of Trex Company, Inc. Fencing Agreement for Installers/Retailers. Filed as Exhibit 10.4 to the Company’s Quarterly Report on Form 10-Q for the quarterly period ended September 30, 2006 and incorporated herein by reference. | |
| 10.22 | Deed of Lease, dated June 15, 2000, between TREX Company, LLC and Space, LLC. Filed as Exhibit 10.16 to the Company’s Annual Report on Form 10-K for the fiscal year ended December 31, 2000 and incorporated herein by reference. | |
| 10.23 | Deed of Lease, dated as of July 27, 2005, between the Company and 1 Dulles Town Center, L.L.C. Filed as Exhibit 10.34 to the Company’s Annual Report on Form 10-K for the fiscal year ended December 31, 2005 and incorporated herein by reference.* | |
| 10.24 | Credit Agreement dated as of November 4, 2009 between the Company and Branch Banking and Trust Company as Administrative Agent and Letter of Credit Issuer, BB&T Capital Markets as Lead Arranger and the Lenders listed on the signature pages thereof. Filed as Exhibit 4.1 to the Company’s Current Report on Form 8-K filed on November 6, 2009 and incorporated herein by reference. | |
| Exhibit |
Exhibit Description | |
| 10.25 | Amended and Restated Security Agreement between the Company and Branch Banking and Trust Company as Collateral Agent for the Lenders, dated as of November 4, 2009. Filed as Exhibit 4.7 to the Company’s Current Report on Form 8-K filed on November 6, 2009 and incorporated herein by reference. | |
| 10.26 | Amended and Restated Credit Line Deed of Trust, dated November 4, 2009, by and among the Company, as grantor, BB&T-VA Collateral Service Corporation, as trustee, and Branch Banking and Trust Company, as Collateral Agent for the Lenders, as Beneficiary relating to real property partially located in the County of Frederick, Virginia and partially located in the City of Winchester, Virginia. Filed as Exhibit 4.8 to the Company’s Current Report on Form 8-K filed on November 6, 2009 and incorporated herein by reference. | |
| 10.27 | Deed of Trust, dated November 4, 2009, by and among the Company, as grantor, Eric L. Sappenfield, as trustee, and Branch Banking and Trust Company, as Collateral Agent for the Lenders, as Beneficiary relating to real property located in the County of De Soto, Mississippi. Filed as Exhibit 4.9 to the Company’s Current Report on Form 8-K filed on November 6, 2009 and incorporated herein by reference. | |
| 10.28 | Revolver Note dated November 4, 2009 payable by the Company to Branch Banking and Trust Company in the amount of the lesser of $38,823,529.41 or the outstanding revolver advances made by Branch Banking and Trust Company. Filed as Exhibit 4.2 to the Company’s Current Report on Form 8-K filed on November 6, 2009 and incorporated herein by reference. | |
| 10.29 | Revolver Note dated November 4, 2009 payable by the Company Inc. to TD Bank, N.A. in the amount of the lesser of $21,176,470.59 or the outstanding revolver advances made by TD Bank, N.A. Filed as Exhibit 4.3 to the Company’s Current Report on Form 8-K filed on November 6, 2009 and incorporated herein by reference. | |
| 10.30 | Reducing Revolver Note dated November 4, 2009 payable by the Company Inc. to Branch Banking and Trust Company in the amount of the lesser of $16,176,470.59 or the outstanding reducing revolver advances made by Branch Banking and Trust Company. Filed as Exhibit 4.4 to the Company’s Current Report on Form 8-K filed on November 6, 2009 and incorporated herein by reference. | |
| 10.31 | Reducing Revolver Note dated November 4, 2009 payable by the Company Inc. to TD Bank, N.A. in the amount of the lesser of $8,823,529.41 or the outstanding reducing revolver advances made by TD Bank, N.A. Filed as Exhibit 4.5 to the Company’s Current Report on Form 8-K filed on November 6, 2009 and incorporated herein by reference. | |
| 10.32 | Swing Advance Note dated November 4, 2009 payable by the Company Inc. to Branch Banking and Trust Company in the amount of the lesser of $5,000,000 or the outstanding swing advances made by Branch Banking and Trust Company. Filed as Exhibit 4.6 to the Company’s Current Report on Form 8-K filed on November 6, 2009 and incorporated herein by reference. | |
| 21 | Subsidiaries of the Company. Filed herewith. | |
| 23 | Consent of Ernst & Young LLP, Independent Registered Public Accounting Firm. Filed herewith. | |
| 31.1 | Certification of Chief Executive Officer of the Company pursuant to Rule 13a-14(a) under the Securities Exchange Act of 1934. Filed herewith. | |
| 31.2 | Certification of Chief Financial Officer of the Company pursuant to Rule 13a-14(a) under the Securities Exchange Act of 1934. Filed herewith. | |
| 32 | Certifications pursuant to Rule 13a-14(b) under the Securities Exchange Act of 1934 and 18 U.S.C. § 1350. Filed herewith. | |
| * | Portions of this exhibit have been omitted and filed separately with the Securities and Exchange Commission pursuant to a request for confidential treatment. |