Attached files
| file | filename |
|---|---|
| EX-32 - ROCKY BRANDS, INC. | v175806_ex32.htm |
| EX-23 - ROCKY BRANDS, INC. | v175806_ex23.htm |
| EX-24 - ROCKY BRANDS, INC. | v175806_ex24.htm |
| EX-99.3 - ROCKY BRANDS, INC. | v175806_ex99-3.htm |
| EX-31.1 - ROCKY BRANDS, INC. | v175806_ex31-1.htm |
| EX-99.1 - ROCKY BRANDS, INC. | v175806_ex99-1.htm |
| EX-31.2 - ROCKY BRANDS, INC. | v175806_ex31-2.htm |
| EX-10.27 - ROCKY BRANDS, INC. | v175806_ex10-27.htm |
United
States
Securities
and Exchange Commission
Washington,
D.C. 20549
FORM
10-K
(Mark
One)
|
x
|
ANNUAL
REPORT PURSUANT TO SECTION 13 OR 15(d) OF THE SECURITIES EXCHANGE ACT OF
1934
|
For
the fiscal year ended December 31, 2009
OR
|
o
|
TRANSITION REPORT PURSUANT TO
SECTION 13 OR 15(d) OF THE SECURITIES EXCHANGE ACT OF
1934
|
Commission File Number:
0-21026
ROCKY BRANDS, INC.
(Exact name of Registrant as specified
in its charter)
|
Ohio
|
No.
31-1364046
|
|
(State or other jurisdiction
of
|
(I.R.S. Employer Identification
No.)
|
|
incorporation or
organization)
|
39 East Canal Street
Nelsonville, Ohio
45764
(Address of principal executive offices,
including zip code)
(740) 753-1951
(Registrant's telephone number,
including area code)
Securities registered pursuant to
Section 12(b) of the Act:
|
Title of each class
|
Name of each exchange on which
registered
|
|
Common
Shares, without par value
|
The
NASDAQ Stock Market, Inc.
|
Securities registered pursuant to
Section 12(g) of the Act: None
Indicate by check mark if the registrant
is a well-known seasoned issuer (as defined in Rule 405 of the Securities Act).
Yes ¨ No x
Indicate by check mark if the registrant
is not required to file reports pursuant to Section 13 or Section 15(d) of the
Act. Yes ¨ No x
Indicate by checkmark
whether the registrant (1) has filed all reports required to be filed by Section
13 or 15(d) of the Securities Exchange Act of 1934 during the preceding 12
months, and (2) has been subject to the filing requirements for at least the
past 90 days. YES x NO ¨
Indicate by check mark
if disclosure of delinquent filers pursuant to Item 405 of Regulation S-K is not
contained herein, and will not be contained, to the best of Registrant's
knowledge, in definitive proxy or information statements incorporated by
reference in Part III of this Form 10-K or any amendment to this Form
10-K. ¨
Indicate by check mark whether the
registrant is a large accelerated filer, an accelerated filer, or a
non-accelerated filer (as defined in Exchange Act Rule 12b-2). (Check
one):
Large accelerated
filer ¨
Accelerated filer £
Non-accelerated filer £
Smaller reporting company x
(Do not check if a
smaller reporting company)
Indicate by check mark whether the
registrant is a shell company (as defined in Rule 12b-2 of the Exchange Act).
Yes ¨ No x
The aggregate market value of the
Registrant's Common Stock held by non-affiliates of the Registrant was
approximately $19,306,712
on June 30, 2009.
There were 5,602,537 shares of the
Registrant's Common Stock outstanding on February 26, 2010.
DOCUMENTS INCORPORATED BY
REFERENCE
Portions of the Registrant's Proxy
Statement for the 2010 Annual Meeting of Shareholders are incorporated by
reference in Part III.
TABLE OF CONTENTS
|
Page
|
||||
|
PART I
|
||||
|
Item 1.
|
Business.
|
3
|
||
|
Item 1A.
|
Risk
Factors.
|
11
|
||
|
Item 1B.
|
Unresolved Staff
Comments.
|
15
|
||
|
Item 2.
|
Properties.
|
15
|
||
|
Item 3.
|
Legal
Proceedings.
|
16
|
||
|
Item 4.
|
Submission of Matters to a Vote of
Security Holders.
|
16
|
||
|
PART II
|
||||
|
Item 5.
|
Market for Registrant’s Common
Equity, Related Stockholder Matters and Issuer Purchases of Equity
Securities.
|
16
|
||
|
Item 6.
|
Selected Consolidated Financial
Data.
|
18
|
||
|
Item 7.
|
Management's Discussion and
Analysis of Financial Condition and Results of
Operation.
|
18
|
||
|
Item 7A.
|
Quantitative and Qualitative
Disclosures About Market Risk.
|
29
|
||
|
Item 8.
|
Financial Statements and
Supplementary Data.
|
29
|
||
|
Item 9.
|
Changes in and Disagreements With
Accountants on Accounting and Financial Disclosure.
|
29
|
||
|
Item 9A.
|
Controls and
Procedures.
|
29
|
||
|
Item 9B.
|
Other
Information.
|
32
|
||
|
PART III
|
||||
|
Item 10.
|
Directors, Executive Officers and
Corporate Governance.
|
32
|
||
|
Item 11.
|
Executive
Compensation.
|
32
|
||
|
Item 12.
|
Security Ownership of Certain
Beneficial Owners and Management and Related Shareholder
Matters.
|
32
|
||
|
Item 13.
|
Certain Relationships and Related
Transactions, and Director Independence.
|
32
|
||
|
Item 14.
|
Principal Accounting Fees and
Services.
|
32
|
||
|
PART IV
|
||||
|
Item 15.
|
Exhibits and Financial
Statement Schedules.
|
33
|
||
|
SIGNATURES
|
37
|
|||
2
This Annual Report on Form 10-K contains
forward-looking statements within the meaning of Section 21E of the Securities
Exchange Act of 1934, as amended, and Section 27A of the Securities Act of 1933,
as amended. The words “anticipate,” “believe,” “expect,” “estimate,” and
“project” and similar words and expressions identify forward-looking statements
which speak only as of the date hereof. Investors are cautioned that such
statements involve risks and uncertainties that could cause actual results to
differ materially from historical or anticipated results due to many factors,
including, but not limited to, the factors discussed in “Item 1A, Risk Factors.”
The Company undertakes no obligation to publicly update or revise any
forward-looking statements.
PART I
|
ITEM
1.
|
BUSINESS.
|
All references to “we,” “us,” “our,”
“Rocky Brands,” or the “Company” in this Annual Report on Form 10-K mean Rocky
Brands, Inc. and Subsidiaries.
We are a
leading designer, manufacturer and marketer of premium quality footwear marketed
under a portfolio of well recognized brand names including Rocky, Georgia Boot,
Durango, Lehigh, Mossy Oak, Michelin and Dickies. Our brands have a long
history of representing high quality, comfortable, functional and durable
footwear and our products are organized around four target markets: outdoor,
work, duty and western. Our footwear products incorporate varying features
and are positioned across a range of suggested retail price points from $29.95
for our value priced products to $249.95 for our premium products. In
addition, as part of our strategy of outfitting consumers from head-to-toe, we
market complementary branded apparel and accessories that we believe leverage
the strength and positioning of each of our brands.
Our products are distributed through
three distinct business segments: wholesale, retail and military. In our
wholesale business, we distribute our products through a wide range of
distribution channels representing over 10,000 retail store locations in the
U.S. and Canada. Our wholesale channels vary by product line and include
sporting goods stores, outdoor retailers, independent shoe retailers, hardware
stores, catalogs, mass merchants, uniform stores, farm store chains, specialty
safety stores and other specialty retailers. Our retail business includes
direct sales of our products to consumers through our Lehigh Outfitters mobile
and retail stores (including a fleet of trucks, supported by small warehouses
that include retail stores, which we refer to as mini-stores), our Rocky outlet
store and our websites. We also sell footwear under the Rocky label to the
U.S. military.
Competitive
Strengths
Our
competitive strengths include:
|
|
•
|
Strong portfolio of
brands. We believe the Rocky, Georgia Boot, Durango, Lehigh,
Mossy Oak, Michelin and Dickies brands are well recognized and established
names that have a reputation for performance, quality and comfort in the
markets they serve: outdoor, work, duty and western. We plan to
continue strengthening these brands through product innovation in existing
footwear markets, by extending certain of these brands into our other
target markets and by introducing complementary apparel and accessories
under our owned brands.
|
|
|
•
|
Commitment to product
innovation. We believe a critical component of our success in
the marketplace has been a result of our continued commitment to product
innovation. Our consumers demand high quality, durable products that
incorporate the highest level of comfort and the most advanced technical
features and designs. We have a dedicated group of product design
and development professionals, including well recognized experts in the
footwear and apparel industries, who continually interact with consumers
to better understand their needs and are committed to ensuring our
products reflect the most advanced designs, features and materials
available in the marketplace.
|
|
|
•
|
Long-term retailer
relationships. We believe that our long history of designing,
manufacturing and marketing premium quality, branded footwear has enabled
us to develop strong relationships with our retailers in each of our
distribution channels. We reinforce these relationships by
continuing to offer innovative footwear products, by continuing to meet
the individual needs of each of our retailers and by working with our
retailers to improve the visual merchandising of our products in their
stores. We believe that strengthening our relationships with
retailers will allow us to increase our presence through additional store
locations and expanded shelf space, improve our market position in a
consolidating retail environment and enable us to better understand and
meet the evolving needs of both our retailers and
consumers.
|
3
|
|
•
|
Diverse product sourcing and
manufacturing capabilities. We believe our strategy, of
utilizing both company operated and third party facilities for the
sourcing of our products, offers several advantages. Operating our
own facilities significantly improves our knowledge of the entire
production process, which allows us to more efficiently source product
from third parties that is of the highest quality and at the lowest cost
available. We intend to continue to source a higher proportion of
our products from third party manufacturers, which we believe will enable
us to obtain high quality products at lower costs per
unit.
|
Growth
Strategy
We intend
to increase our sales through the following strategies:
|
|
•
|
Expand into new target markets
under existing brands. We believe there is significant
opportunity to extend certain of our brands into our other target
markets. We intend to continue to introduce products across varying
feature sets and price points in order to meet the needs of our
retailers.
|
|
|
•
|
Cross-sell our brands to our
retailers. We believe that many retailers of our existing and
acquired brands target consumers with similar characteristics and, as a
result, we believe there is significant opportunity to offer each of our
retailers a broader assortment of footwear and apparel that target
multiple markets and span a range of feature sets and price
points.
|
|
|
•
|
Expand Business
Internationally. We intend to extend certain of our brands
into international markets. We believe this is a significant
opportunity because of the long history and authentic heritage of these
brands. We intend on growing our business internationally through a
network of distributors.
|
|
|
•
|
Increase apparel
offerings. We believe the long history and authentic heritage
of our owned brands provide significant opportunity to extend each of
these brands into complementary apparel. We intend to continue to
increase our Rocky apparel offerings and believe that similar
opportunities exist for our Georgia Boot and Durango brands in their
respective markets.
|
|
|
•
|
Acquire or develop new
brands. We intend to continue to acquire or develop new
brands that are complementary to our portfolio and could leverage our
operational infrastructure and distribution
network.
|
Product
Lines
Our
product lines consist of high quality products that target the following
markets:
|
|
•
|
Outdoor. Our
outdoor product lines consist of footwear, apparel and accessory items
marketed to outdoor enthusiasts who spend time actively engaged in
activities such as hunting, fishing, camping or hiking. Our
consumers demand high quality, durable products that incorporate the
highest level of comfort and the most advanced technical features, and we
are committed to ensuring our products reflect the most advanced designs,
features and materials available in the marketplace. Our outdoor
product lines consist of all-season sport/hunting footwear, apparel and
accessories that are typically waterproof and insulated and are designed
to keep outdoorsmen comfortable on rugged terrain or in extreme weather
conditions.
|
|
|
•
|
Work. Our work
product lines consist of footwear and apparel marketed to industrial and
construction workers, as well as workers in the hospitality industry, such
as restaurants or hotels. All of our work products are specially
designed to be comfortable, incorporate safety features for specific work
environments or tasks and meet applicable federal and other standards for
safety. This category includes products such as safety toe footwear
for steel workers and non-slip footwear for kitchen
workers.
|
|
|
•
|
Duty. Our duty
product line consists of footwear products marketed to law enforcement,
security personnel and postal employees who are required to spend a
majority of time at work on their feet. All of our duty footwear styles
are designed to be comfortable, flexible, lightweight, slip resistant and
durable. Duty footwear is generally designed to fit as part of a
uniform and typically incorporates stylistic features, such as black
leather uppers in addition to the comfort features that are incorporated
in all of our footwear products.
|
|
|
•
|
Western. Our
western product line currently consists of authentic footwear products
marketed to farmers and ranchers who generally live in rural communities
in North America. We also selectively market our western footwear to
consumers enamored with the western
lifestyle.
|
Our
products are marketed under four well-recognized, proprietary brands, Rocky,
Georgia Boot, Durango and Lehigh, in addition to the licensed brands of Dickies,
Michelin and Mossy Oak.
4
Rocky
Rocky,
established in 1979, is our premium priced line of branded footwear, apparel and
accessories. We currently design Rocky products for each of our four
target markets and offer our products at a range of suggested retail price
points: $99.95 to $249.95 for our footwear products, $29.95 to $49.95 for tops
and bottoms in our apparel lines and $49.95 to $199.95 for our basic and
technical outerwear.
The Rocky
brand originally targeted outdoor enthusiasts, particularly hunters, and has
since become the market leader in the hunting boot category. In 2002, we
also extended into hunting apparel, including jackets, pants, gloves and caps.
Our Rocky products for hunters and other outdoor enthusiasts are designed for
specific weather conditions and the diverse terrains of North America.
These products incorporate a range of technical features and designs such as
Gore-Tex waterproof breathable fabric, 3M Thinsulate insulation, nylon Cordura
fabric and camouflaged uppers featuring either Mossy Oak or Realtree
patterns. Rugged outsoles made by industry leaders like Vibram are
sometimes used in conjunction with our proprietary design features like the
“Rocky Ride Comfort System” to make the products durable and easy to
wear.
We also
produce Rocky duty footwear targeting law enforcement professionals, security
workers and postal service employees, and we believe we have established a
leading market share position in this category.
In 2002,
we introduced Rocky work footwear designed for varying weather conditions or
difficult terrain, particularly for people who make their living outdoors such
as those in lumber or forestry occupations. These products typically
include many of the proprietary features and technologies that we incorporate in
our hunting and outdoor products. Similar to our strategy for the outdoor
market, we introduced rugged work apparel in 2004, such as ranch jackets and
carpenter jeans.
We have
also introduced western influenced work boots for farmers and ranchers.
Most of these products are waterproof, insulated and utilize our proprietary
comfort systems. We also recently introduced some men’s and women’s casual
western footwear for consumers enamored with western influenced
fashion.
Georgia
Boot
Georgia
Boot was launched in 1937 and is our moderately priced, high quality line of
work footwear. Georgia Boot footwear is sold at suggested retail price
points ranging from $79.95 to $109.95. This line of products primarily
targets construction workers and those who work in industrial plants where
special safety features are required for hazardous work environments. Many
of our boots incorporate steel toes or metatarsal guards to protect wearers’
feet from heavy objects and non-slip outsoles to prevent slip related injuries
in the work place. All of our boots are designed to help prevent injury
and subsequent work loss and are designed according to standards determined by
the Occupational Safety & Health Administration or other standards required
by employers.
In
addition, we market a line of Georgia Boot footwear to brand loyal consumers for
hunting and other outdoor activities. These products are primarily all
leather boots distributed in the western and southwestern states where hunters
do not require camouflaged boots or other technical features incorporated in our
Rocky footwear.
We
believe the Georgia Boot brand can be extended into moderately priced duty
footwear as well as outdoor and work apparel.
Durango
Durango
is our moderately priced, high quality line of western footwear. Launched
in 1965, the brand has developed broad appeal and earned a reputation for
authenticity and quality in the western footwear market. Our current line
of products is offered at suggested retail price points ranging from $79.95 to
$149.95, and we market products designed for both work and casual wear.
Our Durango line of products primarily targets farm and ranch workers who live
in the heartland where western influenced footwear and apparel is worn for work
and casual wear and, to a lesser extent, this line appeals to urban consumers
enamored with western influenced fashion. Many of our western boots
marketed to farm and ranch workers are designed to be durable, including special
“barn yard acid resistant” leathers to maintain integrity of the uppers, and
incorporate our proprietary “Comfort Core” system to increase ease of wear and
reduce foot fatigue. Other products in the Durango line that target casual
and fashion oriented consumers have colorful leather uppers and shafts with
ornate stitch patterns and are offered for men, women and
children.
5
Lehigh
The
Lehigh brand was launched in 1922 and is our moderately priced, high quality
line of safety shoes sold at suggested retail price points ranging from $29.95
to $149.95. Our current line of products is designed to meet occupational
safety footwear needs. Most of this footwear incorporates steel toes to
protect workers and often incorporates other safety features such as metatarsal
guards or non-slip outsoles. Additionally, certain models incorporate
durability features to combat abrasive surfaces or caustic substances often
found in some work places.
With the
recent shift in manufacturing jobs to service jobs in the U.S., Lehigh began
marketing products for the hospitality industry. These products have
non-slip outsoles designed to reduce slips, trips and falls in kitchen
environments where floors are often tiled and greasy. Price points for
this kind of footwear range from $29.95 to $49.95.
Dickies
Dickies
is a high quality, value priced line of work footwear. The Dickies brand,
owned by the Williamson-Dickie Manufacturing Co. since 1922, has a long history
of providing value priced apparel in the work and casual markets and is a
leading brand name in that category.
We currently offer work products
targeted at the construction trades and agricultural and hospitality
workers. Our Dickies footwear incorporates specific design features to
appeal to these workers and is offered at suggested retail price points ranging
from $49.95 to $89.95. Our licensing agreement for the Dickies
brand expires on December 31, 2010 and is renewable at the option of the
Williamson-Dickie Manufacturing Company. We expect that our license to
manufacture and distribute products bearing the Dickies brand will terminate
upon the expiration of this agreement. Sales of our Dickies branded
merchandise approximated $11.2 million in 2009.
Zumfoot
We were
disappointed with the results that the Zumfoot brand provided and terminated our
licensing agreement with Zumfoot in February 2009. We are currently
liquidating the inventory at a reduced selling price.
Michelin
Michelin
is a premier price point line of work footwear targeting specific industrial
professions, primarily indoor professions. The license to design, develop
and manufacture footwear under the Michelin name was secured in 2006.
Suggested retail prices for the Michelin brand are from $99.95 to
$159.95.
Mossy
Oak
Mossy Oak
is high quality, value priced line of casual and hunting footwear. The
license to design, develop and manufacture footwear under the Mossy Oak name was
secured in 2008. Suggested retail prices for the Mossy Oak Brand are from
$39.95 to $79.95 for casual footwear and $49.95 to 89.95 for hunting
footwear.
Sales
and Distribution
Our
products are distributed through three distinct business segments: wholesale,
retail and military. You can find more information regarding our three
business segments in Note 14 to our consolidated financial
statements.
Wholesale
In the
U.S., we distribute Rocky, Georgia Boot, Durango, Michelin, Mossy Oak and
Dickies products through a wide range of wholesale distribution channels. As of
December 31, 2009, our products were offered for sale at over 10,000 retail
locations in the U.S. and Canada.
We sell
our products to wholesale accounts in the U.S. primarily through a dedicated
in-house sales team who carry our branded products exclusively, as well as
independent sales representatives who carry our branded products and other
non-competing products. Our sales force for Rocky is organized around
major accounts, including Bass Pro Shops, Cabela’s, Dick’s Sporting Goods and
Gander Mountain, and around our target markets: outdoor, work, duty and
western. For our Georgia Boot, Durango and Dickies brands, our sales
employees are organized around each brand and target a broad range of
distribution channels. All of our sales people actively call on their
retail customer base to educate them on the quality, comfort, technical features
and breadth of our product lines and to ensure that our products are displayed
effectively at retail locations.
6
Our
wholesale distribution channels vary by market:
|
|
•
|
Our
outdoor products are sold primarily through sporting goods stores, outdoor
specialty stores, catalogs and mass
merchants.
|
|
|
•
|
Our
work-related products are sold primarily through retail uniform stores,
catalogs, farm store chains, specialty safety stores, independent shoe
stores and hardware stores. In addition to these retailers, we also
market Dickies work-related footwear to select large, national
retailers.
|
|
|
•
|
Our
duty products are sold primarily through uniform stores and catalog
specialists.
|
|
|
•
|
Our
western products are sold through western stores, work specialty stores,
specialty farm and ranch stores and more recently, fashion oriented
footwear retailers.
|
Retail
We market
products directly to consumers through three retail strategies: mobile and
retail stores, our outlet store and our websites.
Mobile
and Retail Stores
Lehigh
markets branded work footwear, principally through mobile stores, to industrial
and hospitality related corporate customers across the U.S. We work
closely with our customers to select footwear products best suited for the
specific safety needs of their work site and that meet the standards determined
by the Occupational Safety & Health Administration or other standards
required by our customers. Our customers include large, national companies
such as 3M, Abbott Laboratories, Alcoa, Carnival Cruise Lines, Federal Express,
IBM and Texas Instruments.
Our
Lehigh mobile trucks, supported by our small warehouses, are stocked with work
footwear, as established by the specific needs of our customers, and typically
include our owned brands augmented by branded work footwear from third parties
including Dunham and Timberland Pro. Prior to a scheduled site visit,
Lehigh sales managers consult with our corporate customers to ensure that our
trucks are appropriately stocked for their specific needs. Our trucks then
perform a site visit where customer employees select work related footwear and
apparel. Our corporate customers generally purchase footwear or provide payroll
deduction plans for footwear purchases by their employees. We believe that
our ability to service work sites across the U.S. allows us to effectively
compete for large, national customers who have employees located throughout the
U.S.
We also
operate mini-stores located in our small warehouses, which are primarily
situated in industrial parks. Over time, we intend to improve some of
these locations to sites that experience higher foot traffic in order to better
utilize our retail square footage and leverage our fixed costs. We also
intend to expand the breadth and depth of products sold in these mini-stores to
include casual and outdoor footwear and apparel to offer a broader range of
products to our consumers. We opened two stores in 2007 and one store in
2008 utilizing this concept. These stores are located in Columbia, South
Carolina; Green Bay, Wisconsin; and Houston, Texas.
During
the fourth quarter of 2009, we initiated a comprehensive series of actions to
reduce the operating cost structure and increase the operating efficiency of our
retail division. These actions involved the closing of underperforming
mini-stores and trucks in our retail division.
Lehigh is
looking to expand its internet sales volume by offering some of our customers
that are currently supported by our mobile truck fleet, incentives to fulfill
their employee safety shoe requirements via the internet.
Outlet
Store
We
operate the Rocky outlet store in Nelsonville, Ohio. Our outlet store
primarily sells first quality or discontinued products in addition to a limited
amount of factory damaged goods. Related products from other manufacturers
are also sold in the store. Our outlet store allows us to showcase the
breadth of our product lines as well as to cost-effectively sell slow moving
inventory. Our outlet store also provides an opportunity to interact with
consumers to better understand their needs.
7
Websites
We sell
our product lines on our websites at www.rockyboots.com, www.georgiaboot.com, www.lehighoutfitters.com,
www.lehighsafetyshoes.com,
www.slipgrips.com and
www.dickiesfootwear.com.
We believe that our internet presence allows us to showcase the breadth and
depth of our product lines in each of our target markets and enables us to
educate our consumers about the unique technical features of our
products.
Military
While we
are focused on continuing to build our wholesale and retail business, we also
actively bid on footwear contracts with the U.S. military, which requires
products to be made in the U.S. Our manufacturing facilities in Puerto
Rico, a U.S. territory, allow us to competitively bid for such contracts.
In July 2007, we were awarded a $6.4 million order to produce footwear for the
U.S. military, which includes an option for four yearly renewals at similar
amounts. In January 2008, we were awarded a $5.0 million order to produce
footwear for the U.S. Military, which includes an option for four yearly
renewals at similar amounts. In July 2009, we were awarded a $29.0 million
blanket purchase order from the GSA to produce footwear for the U.S. Military
through 2014.
All of
our footwear for the U.S. military is currently branded Rocky. We believe
that many U.S. service men and women are active outdoor enthusiasts and may be
employed in many of the work and duty markets that we target with our
brands. As a result, we believe our sales to the U.S. military serve as an
opportunity to reach our target demographic with high quality branded
products.
Marketing
and Advertising
We
believe that our brands have a reputation for high quality, comfort,
functionality and durability built through their long history in the markets
they serve. To further increase the strength and awareness of our brands,
we have developed comprehensive marketing and advertising programs to gain
national exposure and expand brand awareness for each of our brands in their
target markets.
We have
focused the majority of our advertising efforts on consumers in support of our
retail partners. A key component of this strategy includes in-store point
of purchase materials that add a dramatic focus to our brands and the products
our retail partners carry. We also advertise through targeted national and
local cable programs and print publications aimed at audiences that share the
demographic profile of our typical customers. For example, we are a main
sponsor of the hit outdoor TV shows, “Archer’s Choice” and “the Choice”
featuring hosts Ralph and Vicki Cianciarulo; Mossy Oak’s “Hunting the
Country” on The Outdoor Channel; as well as “Obsession Revealed” and “Turkey
Thugs” on the Pursuit Network. In addition we advertise in such print
publications as Outdoor Life and North American Hunter and on targeted cable
broadcasts for NASCAR and NHRA on The Outdoor Channel and Versus television
networks. We also promote our products through event sponsorships.
We are a sponsor of the Kevin Harvick NASCAR racing team and the Kallita
MotoSports NHRA racing team. These events are broadcasted on the ESPN and
FOX television networks. These sponsorship properties provide significant
national exposure for all of our brands, as well as direct connection to our
target customers. Our print advertisements and radio and television
commercials emphasize the technical features of our products as well as their
high quality, comfort, functionality and durability.
We also
support independent dealers by listing their locations in our national print
advertisements. In addition to our national advertising campaign, we have
developed attractive merchandising displays and store-in-store concept fixturing
that are available to our retailers who purchase the breadth of our product
lines. We also attend numerous tradeshows, including the World Shoe
Association show, the Denver International Western Retailer Market and the
Shooting, Hunting, Outdoor Exposition. Tradeshows allow us to showcase our
entire product line to retail buyers and have historically been an important
source of new accounts.
Product
Design and Development
We
believe that product innovation is a key competitive advantage for us in each of
our markets. Our goal in product design and development is to continue to
create and introduce new and innovative footwear and apparel products that
combine our standards of quality, functionality and comfort and that meet the
changing needs of our retailers and consumers. Our product design and
development process is highly collaborative and is typically initiated both
internally by our development staff and externally by our retailers and
suppliers, whose employees are generally active users of our products and
understand the needs of our consumers. Our product design and development
personnel, marketing personnel and sales representatives work closely together
to identify opportunities for new styles, camouflage patterns, design
improvements and newer, more advanced materials. We have a dedicated group
of product design and development professionals, some of whom are well
recognized experts in the footwear and apparel industries, who continually
interact with consumers to better understand their needs and are committed to
ensuring our products reflect the most advanced designs, features and materials
available in the marketplace.
8
Manufacturing
and Sourcing
We
manufacture footwear in facilities that we operate in the Dominican Republic and
Puerto Rico, and source footwear, apparel and accessories from third party
facilities, primarily in China. We do not have long-term contracts with
any of our third party manufacturers. The products purchased from one of
our third party manufacturers in China, with whom we have had a relationship for
over 20 years, and which has historically accounted for a significant portion of
our manufacturing, represented approximately 21% of our net sales in 2009.
We believe that operating our own facilities significantly improves our
knowledge of the entire raw material sourcing and manufacturing process enabling
us to more efficiently source finished goods from third parties that are of the
highest quality and at the lowest cost available. In addition, our Puerto
Rican facilities allow us to produce footwear for the U.S. military and other
commercial businesses that require production by a U.S. manufacturer.
Sourcing products from offshore third party facilities generally enables us to
lower our costs per unit while maintaining high product quality and it limits
the capital investment required to establish and maintain company operated
manufacturing facilities. We expect that a greater portion of our products
will be sourced from third party facilities in the future. Because quality
is an important part of our value proposition to our retailers and consumers, we
source products from manufacturers who have demonstrated the intent and ability
to maintain the high quality that has become associated with our
brands.
Quality
control is stressed at every stage of the manufacturing process and is monitored
by trained quality assurance personnel at each of our manufacturing facilities,
including our third party factories. In addition, we utilize a team of
procurement, quality control and logistics employees in our China office to
visit factories to conduct quality control reviews of raw materials, work in
process inventory and finished goods. We also utilize quality control
personnel at our finished goods distribution facilities to conduct quality
control testing on incoming sourced finished goods and raw materials and inspect
random samples from our finished goods inventory from each of our manufacturing
facilities to ensure that all items meet our high quality
standards.
Our
products are primarily distributed in the United States and Canada. During
2009, we expanded our distribution channels in South America, Europe and
Asia. We ship our products from our finished goods distribution facilities
located near Logan and Columbus, Ohio; San Bernardino, California; and Waterloo,
Ontario, Canada. Certain of our retailers receive shipments directly from
our manufacturing sources, including all of our U.S. military sales, which are
shipped directly from our manufacturing facilities in Puerto Rico.
Suppliers
We
purchase raw materials from sources worldwide. We do not have any
long-term supply contracts for the purchase of our raw materials, except for
limited blanket orders on leather to protect wholesale selling prices for an
extended period of time. The principal raw materials used in the
production of our products, in terms of dollar value, are leather, Gore-Tex
waterproof breathable fabric, Cordura nylon fabric and soling materials.
We believe these materials will continue to be available from our current
suppliers. However, in the event these materials are not available from
our current suppliers, we believe these products, or similar products, would be
available from alternative sources.
Seasonality
and Weather
Historically,
we have experienced significant seasonal fluctuations in our business because we
derive a significant portion of our revenues from sales of our outdoor
products. Many of our outdoor products are used by consumers in cold or
wet weather. As a result, a majority of orders for these products are
placed by our retailers in January through April for delivery in July through
October. In order to meet demand, we must manufacture and source outdoor
footwear year round to be in a position to ship advance orders for these
products during the last two quarters of each year. Accordingly, average
inventory levels have been highest during the second and third quarters of each
year and sales have been highest in the last two quarters of each year. In
addition, mild or dry weather conditions historically have had a material
adverse effect on sales of our outdoor products, particularly if they occurred
in broad geographical areas during late fall or early winter. Since 2005,
we have experienced and we expect that we will continue to experience less
seasonality and that our business will be subject to reduced weather risk
because we now derive a higher proportion of our sales from work-related
footwear products. Generally, work, duty and western footwear is sold year
round and is not subject to the same level of seasonality or variation in
weather as our outdoor product lines. However, because of seasonal
fluctuations and variations in weather conditions from year to year, there is no
assurance that the results for any particular interim period will be indicative
of results for the full year or for future interim periods.
9
Backlog
At
December 31, 2009, our backlog was $23.2 million compared to $13.6 million at
December 31, 2008. Our backlog at December 31, 2009 includes $11.6 million
of orders under contracts with the U.S. Military versus $1.1 at December 31,
2008. Because a substantial portion of our orders are placed by our
retailers in January through April for delivery in July through October, our
backlog is lowest during the October through December period and peaks during
the April through June period. Factors other than seasonality could have a
significant impact on our backlog and, therefore, our backlog at any one point
in time may not be indicative of future results. Generally, orders may be
canceled by retailers prior to shipment without penalty.
Patents, Trademarks and Trade
Names
We own numerous design and utility
patents for footwear, footwear components (such as insoles and outsoles) and
outdoor apparel in the U.S. and in foreign countries including Canada, Mexico,
China and Taiwan. We own U.S. and certain foreign registrations for the
trademarks used in our business, including our marks Rocky, Georgia Boot,
Durango and Lehigh. In addition, we license trademarks, including Dickies,
Gore-Tex, Mossy Oak and Michelin, in order to market our products. We have
an exclusive license through December 31, 2010 to use the Dickies brand for
footwear in our target markets. We expect that our license to manufacture
and distribute products bearing the Dickies brand will terminate upon the
expiration of this agreement.
While we have an active program to
protect our intellectual property by filing for patents and trademarks, we do
not believe that our overall business is materially dependent on any individual
patent or trademark. We are not aware of any infringement of our
intellectual property rights or that we are infringing any intellectual property
rights owned by third parties. Moreover, we are not aware of any material
conflicts concerning our trademarks or our use of trademarks owned by
others.
Competition
We
operate in a very competitive environment. Product function, design,
comfort, quality, technological and material improvements, brand awareness,
timeliness of product delivery and pricing are all important elements of
competition in the markets for our products. We believe that the strength
of our brands, the quality of our products and our long-term relationships with
a broad range of retailers allows us to compete effectively in the footwear and
apparel markets that we serve. However, we compete with footwear and
apparel companies that have greater financial, marketing, distribution and
manufacturing resources than we do. In addition, many of these competitors
have strong brand name recognition in the markets they serve.
The
footwear and apparel industry is also subject to rapid changes in consumer
preferences. Some of our product lines are susceptible to changes in both
technical innovation and fashion trends. Therefore, the success of these
products and styles are more dependent on our ability to anticipate and respond
to changing product, material and design innovations as well as fashion trends
and consumer demands in a timely manner. Our inability or failure to do so
could adversely affect consumer acceptance of these product lines and styles and
could have a material adverse effect on our business, financial condition and
results of operations.
Employees
At
December 31, 2009, we had approximately 2,000 employees. Approximately
1,350 of our employees work in our manufacturing facilities in the Dominican
Republic and Puerto Rico. None of our employees are represented by a
union. We believe our relations with our employees are good.
Available
Information
We make
available free of charge on our corporate website, www.rockyboots.com, our
annual report on Form 10-K, quarterly reports on Form 10-Q, current reports on
Form 8-K and, if applicable, amendments to those reports filed or furnished
pursuant to Section 13(a) or 15(d) of the Securities Exchange Act of 1934, as
amended, as soon as reasonably practicable after such reports are electronically
filed with or furnished to the Securities and Exchange
Commission.
10
|
ITEM 1A.
|
RISK
FACTORS.
|
Business Risks
Expanding
our brands into new footwear and apparel markets may be difficult and expensive,
and if we are unable to successfully continue such expansion, our brands may be
adversely affected, and we may not achieve our planned sales
growth.
Our
growth strategy is founded substantially on the expansion of our brands into new
footwear and apparel markets. New products that we introduce may not be
successful with consumers or one or more of our brands may fall out of favor
with consumers. If we are unable to anticipate, identify or react
appropriately to changes in consumer preferences, we may not grow as fast as we
plan to grow or our sales may decline, and our brand image and operating
performance may suffer.
Furthermore,
achieving market acceptance for new products will likely require us to exert
substantial product development and marketing efforts, which could result in a
material increase in our selling, general and administrative, or SG&A,
expenses, and there can be no assurance that we will have the resources
necessary to undertake such efforts. Material increases in our SG&A
expenses could adversely impact our results of operations and cash
flows.
We may
also encounter difficulties in producing new products that we did not anticipate
during the development stage. Our development schedules for new products
are difficult to predict and are subject to change as a result of shifting
priorities in response to consumer preferences and competing products. If
we are not able to efficiently manufacture newly-developed products in
quantities sufficient to support retail distribution, we may not be able to
recoup our investment in the development of new products. Failure to gain
market acceptance for new products that we introduce could impede our growth,
reduce our profits, adversely affect the image of our brands, erode our
competitive position and result in long term harm to our business.
A
majority of our products are produced outside the U.S. where we are subject to
the risks of international commerce.
A
majority of our products are produced in the Dominican Republic and China.
Therefore, our business is subject to the following risks of doing business
offshore:
|
|
•
|
the
imposition of additional United States legislation and regulations
relating to imports, including quotas, duties, taxes or other charges or
restrictions;
|
|
|
•
|
foreign
governmental regulation and
taxation;
|
|
|
•
|
fluctuations
in foreign exchange rates;
|
|
|
•
|
changes
in economic conditions;
|
|
|
•
|
transportation
conditions and costs in the Pacific and
Caribbean;
|
|
|
•
|
changes
in the political stability of these countries;
and
|
|
|
•
|
changes
in relationships between the United States and these
countries.
|
If any of
these factors were to render the conduct of business in these countries
undesirable or impracticable, we would have to manufacture or source our
products elsewhere. There can be no assurance that additional sources or
products would be available to us or, if available, that these sources could be
relied on to provide product at terms favorable to us. The occurrence of
any of these developments would have a material adverse effect on our business,
financial condition, results of operations and cash flows.
Our
success depends on our ability to anticipate consumer trends.
Demand
for our products may be adversely affected by changing consumer trends.
Our future success will depend upon our ability to anticipate and respond to
changing consumer preferences and technical design or material developments in a
timely manner. The failure to adequately anticipate or respond to these
changes could have a material adverse effect on our business, financial
condition, results of operations and cash flows.
11
Loss
of services of our key personnel could adversely affect our
business.
The
development of our business has been, and will continue to be, highly dependent
upon Mike Brooks, Chairman and Chief Executive Officer, David Sharp, President
and Chief Operating Officer, and James E. McDonald, Executive Vice President,
Chief Financial Officer and Treasurer. Messrs. Brooks, Sharp, and McDonald
each have an at-will employment agreement with us. Each employment
agreement provides that in the event of termination of employment, without
cause, the terminated executive will receive a severance benefit. In the event
of termination for any reason, the terminated executive may not compete with us
for a period of one year. None of our other executive officers and key
employees has an employment agreement with our company. The loss of the
services of any of these officers could have a material adverse effect on our
business, financial condition, results of operations and cash
flows.
We
depend on a limited number of suppliers for key production materials, and any
disruption in the supply of such materials could interrupt product manufacturing
and increase product costs.
We
purchase raw materials from a number of domestic and foreign sources. We
do not have any long-term supply contracts for the purchase of our raw
materials, except for limited blanket orders on leather. The principal raw
materials used in the production of our footwear, in terms of dollar value, are
leather, Gore-Tex waterproof breathable fabric, Cordura nylon fabric and soling
materials. Availability or change in the prices of our raw materials could
have a material adverse effect on our business, financial condition, results of
operations and cash flows.
We
currently have a licensing agreement for the use of Gore-Tex waterproof
breathable fabric, and any termination of this licensing agreement could impact
our sales of waterproof products.
We are
currently one of the largest customers of Gore-Tex waterproof breathable fabric
for use in footwear. Our licensing agreement with W.L. Gore &
Associates, Inc. may be terminated by either party upon advance written notice
to the other party by October 1 for termination effective December 31 of that
same year. Although other waterproofing techniques and materials are
available, we place a high value on our Gore-Tex waterproof breathable fabric
license because Gore-Tex has high brand name recognition with our
customers. The loss of our license to use Gore-Tex waterproof breathable
fabric could have a material adverse effect on our competitive position, which
could have a material adverse effect on our business, financial condition,
results of operations and cash flows.
We
currently have a licensing agreement for the use of the Dickies trademark, and
any termination of this licensing agreement could impact our sales and growth
strategy.
We have an exclusive license through
December 31, 2010 to use the Dickies brand on all footwear products, except
nursing shoes. The Dickies brand is well recognized by consumers, and we
plan to introduce value priced Dickies footwear targeting additional markets,
including outdoor, duty and western. Our license with Dickies may be
terminated by Dickies prior to December 31, 2010 if we do not achieve certain
minimum net shipments in a particular year. We expect that our license to
manufacture and distribute products bearing the Dickies brand will terminate
upon the expiration of this agreement. The loss of our license to use the
Dickies brand could have a material adverse effect on our competitive position
and growth strategy, which could have a material adverse effect on our business,
financial condition, results of operations and cash flows. Sales of our
Dickies branded merchandise approximated $11.2 million in
2009.
Our
outdoor products are seasonal.
We have
historically experienced significant seasonal fluctuations in our business
because we derive a significant portion of our revenues from sales of our
outdoor products. Many of our outdoor products are used by consumers in
cold or wet weather. As a result, a majority of orders for these products
are placed by our retailers in January through April for delivery in July
through October. In order to meet demand, we must manufacture and source
outdoor footwear year round to be in a position to ship advance orders for these
products during the last two quarters of each year. Accordingly, average
inventory levels have been highest during the second and third quarters of each
year and sales have been highest in the last two quarters of each year.
There is no assurance that we will have either sufficient inventory to satisfy
demand in any particular quarter or have sufficient demand to sell substantially
all, of our, inventory without significant markdowns.
12
Our
outdoor products are sensitive to weather conditions.
Historically,
our outdoor products have been used primarily in cold or wet weather. Mild
or dry weather has in the past and may in the future have a material adverse
effect on sales of our products, particularly if mild or dry weather conditions
occur in broad geographical areas during late fall or early winter. Also,
due to variations in weather conditions from year to year, results for any
single quarter or year may not be indicative of results for any future
period.
Our
business could suffer if our third party manufacturers violate labor laws or
fail to conform to generally accepted ethical standards.
We
require our third party manufacturers to meet our standards for working
conditions and other matters before we are willing to place business with
them. As a result, we may not always obtain the lowest cost
production. Moreover, we do not control our third party manufacturers or
their respective labor practices. If one of our third party manufacturers
violates generally accepted labor standards by, for example, using forced or
indentured labor or child labor, failing to pay compensation in accordance with
local law, failing to operate its factories in compliance with local safety
regulations or diverging from other labor practices generally accepted as
ethical, we likely would cease dealing with that manufacturer, and we could
suffer an interruption in our product supply. In addition, such a
manufacturer’s actions could result in negative publicity and may damage our
reputation and the value of our brand and discourage retail customers and
consumers from buying our products.
The
growth of our business will be dependent upon the availability of adequate
capital.
The
growth of our business will depend on the availability of adequate capital,
which in turn will depend in large part on cash flow generated by our business
and the availability of equity and debt financing. We cannot assure you
that our operations will generate positive cash flow or that we will be able to
obtain equity or debt financing on acceptable terms or at all. Our
revolving credit facility contains provisions that restrict our ability to incur
additional indebtedness or make substantial asset sales that might otherwise be
used to finance our expansion. Security interests in substantially all of
our assets, which may further limit our access to certain capital markets or
lending sources, secure our obligations under our revolving credit
facility. Moreover, the actual availability of funds under our revolving
credit facility is limited to specified percentages of our eligible inventory
and accounts receivable. Accordingly, opportunities for increasing our
cash on hand through sales of inventory would be partially offset by reduced
availability under our revolving credit facility. As a result, we cannot
assure you that we will be able to finance our current expansion
plans.
We
must comply with the restrictive covenants contained in our revolving credit
facility.
Our
credit facility and term loan agreements require us to comply with certain
financial restrictive covenants that impose restrictions on our operations,
including our ability to incur additional indebtedness, make investments of
other restricted payments, sell or otherwise dispose of assets and engage in
other activities. Any failure by us to comply with the restrictive
covenants could result in an event of default under those borrowing
arrangements, in which case the lenders could elect to declare all amounts
outstanding there under to be due and payable, which could have a material
adverse effect on our financial condition. As of December 31, 2009, we
were in compliance with all financial restrictive covenants.
We
face intense competition, including competition from companies with
significantly greater resources than ours, and if we are unable to compete
effectively with these companies, our market share may decline and our business
could be harmed.
The
footwear and apparel industries are intensely competitive, and we expect
competition to increase in the future. A number of our competitors have
significantly greater financial, technological, engineering, manufacturing,
marketing and distribution resources than we do, as well as greater brand
awareness in the footwear market. Our ability to succeed depends on our
ability to remain competitive with respect to the quality, design, price and
timely delivery of products. Competition could materially adversely affect
our business, financial condition, results of operations and cash
flows.
We
currently manufacture a portion of our products and we may not be able to do so
in the future at costs that are competitive with those of competitors who source
their goods.
We
currently plan to retain our internal manufacturing capability in order to
continue benefiting from expertise we have gained with respect to footwear
manufacturing methods conducted at our manufacturing facilities. We
continue to evaluate our manufacturing facilities and third party manufacturing
alternatives in order to determine the appropriate size and scope of our
manufacturing facilities. There can be no assurance that the costs of
products that continue to be manufactured by us can remain competitive with
products sourced from third parties.
13
We
rely on distribution centers in Logan and Columbus, Ohio, San Bernardino,
California and Waterloo, Ontario, Canada, and if there is a natural disaster or
other serious disruption at any of these facilities, we may be unable to deliver
merchandise effectively to our retailers.
We rely
on distribution centers located in Logan and Columbus, Ohio, San Bernardino,
California and Waterloo, Ontario, Canada. Any natural disaster or other serious
disruption at any of these facilities due to fire, tornado, flood, terrorist
attack or any other cause could damage a portion of our inventory or impair our
ability to use our distribution center as a docking location for
merchandise. Either of these occurrences could impair our ability to
adequately supply our retailers and harm our operating results.
We
are subject to certain environmental and other regulations.
Some of
our operations use substances regulated under various federal, state, local and
international environmental and pollution laws, including those relating to the
storage, use, discharge, disposal and labeling of, and human exposure to,
hazardous and toxic materials. Compliance with current or future
environmental laws and regulations could restrict our ability to expand our
facilities or require us to acquire additional expensive equipment, modify our
manufacturing processes or incur other significant expenses. In addition,
we could incur costs, fines and civil or criminal sanctions, third party
property damage or personal injury claims or could be required to incur
substantial investigation or remediation costs, if we were to violate or become
liable under any environmental laws. Liability under environmental laws can be
joint and several and without regard to comparative fault. There can be no
assurance that violations of environmental laws or regulations have not occurred
in the past and will not occur in the future as a result of our inability to
obtain permits, human error, equipment failure or other causes, and any such
violations could harm our business, financial condition, results of operations
and cash flows.
If
our efforts to establish and protect our trademarks, patents and other
intellectual property are unsuccessful, the value of our brands could
suffer.
We regard
certain of our footwear designs as proprietary and rely on patents to protect
those designs. We believe that the ownership of patents is a significant
factor in our business. Existing intellectual property laws afford only limited
protection of our proprietary rights, and it may be possible for unauthorized
third parties to copy certain of our footwear designs or to reverse engineer or
otherwise obtain and use information that we regard as proprietary. If our
patents are found to be invalid, however, to the extent they have served, or
would in the future serve, as a barrier to entry to our competitors, such
invalidity could have a material adverse effect on our business, financial
condition, results of operations and cash flows.
We own
U.S. registrations for a number of our trademarks, trade names and designs,
including such marks as Rocky, Georgia Boot, Durango and Lehigh.
Additional trademarks, trade names and designs are the subject of pending
federal applications for registration. We also use and have common law
rights in certain trademarks. Over time, we have increased distribution of
our goods in several foreign countries. Accordingly, we have applied for
trademark registrations in a number of these countries. We intend to
enforce our trademarks and trade names against unauthorized use by third
parties.
Our
success depends on our ability to forecast sales.
Our
investments in infrastructure and product inventory are based on sales forecasts
and are necessarily made in advance of actual sales. The markets in which
we do business are highly competitive, and our business is affected by a variety
of factors, including brand awareness, changing consumer preferences, product
innovations, susceptibility to fashion trends, retail market conditions, weather
conditions and economic and other factors. One of our principal challenges
is to improve our ability to predict these factors, in order to enable us to
better match production with demand. In addition, our growth over the
years has created the need to increase the investment in infrastructure and
product inventory and to enhance our systems. To the extent sales
forecasts are not achieved, costs associated with the infrastructure and
carrying costs of product inventory would represent a higher percentage of
revenue, which would adversely affect our business, financial condition, results
of operations and cash flows.
14
Risks
Related to Our Industry
Because
the footwear market is sensitive to decreased consumer spending and slow
economic cycles, if general economic conditions deteriorate, many of our
customers may significantly reduce their purchases from us or may not be able to
pay for our products in a timely manner.
The
footwear industry has been subject to cyclical variation and decline in
performance when consumer spending decreases or softness appears in the retail
market. Many factors affect the level of consumer spending in the footwear
industry, including:
•
general business conditions;
•
interest rates;
•
the availability of consumer credit;
•
weather;
•
increases in prices of nondiscretionary goods;
•
taxation; and
•
consumer confidence in future economic
conditions.
Consumer
purchases of discretionary items, including our products, may decline during
recessionary periods and also may decline at other times when disposable income
is lower. A downturn in regional economies where we sell products also
reduces sales.
The
continued shift in the marketplace from traditional independent retailers to
large discount mass merchandisers may result in decreased margins.
A
continued shift in the marketplace from traditional independent retailers to
large discount mass merchandisers has increased the pressure on many footwear
manufacturers to sell products to these mass merchandisers at less favorable
margins. Because of competition from large discount mass merchandisers, a
number of our small retailing customers have gone out of business, and in the
future more of these customers may go out of business, which could have a
material adverse effect on our business, financial condition, results of
operations and cash flows.
|
ITEM
1B.
|
UNRESOLVED
STAFF COMMENTS.
|
None.
|
ITEM 2.
|
PROPERTIES.
|
We own,
subject to a mortgage, our 25,000 square foot executive offices that are located
in Nelsonville, Ohio which are utilized by all segments. We also own,
subject to a mortgage, our 192,000 square foot finished goods distribution
facility near Logan, Ohio which is utilized by our wholesale and retail
segments. We own outright our 41,000 square foot outlet store and a 5,500
square foot executive office building located in Nelsonville, Ohio, a portion of
which is utilized by our retail segment. We lease two manufacturing
facilities in Puerto Rico consisting of 44,978 square feet and 39,581 square
feet which are utilized by the wholesale and military segments. These leases
expire in 2019. In the Dominican Republic, we lease an 81,872 square foot
manufacturing facility under a lease expiring in 2014 and lease two additional
stand-alone buildings of 39,815 square feet and 24,053 square feet under leases
which expire in 2014 and 2013, respectively and are utilized by our wholesale
segment. In Waterloo, Ontario, we lease a 30,300 square foot distribution
facility under a lease expiring in 2012 which is utilized by our wholesale
segment.
15
|
ITEM
3.
|
LEGAL
PROCEEDINGS.
|
We are,
from time to time, a party to litigation which arises in the normal course of
our business. Although the ultimate resolution of pending proceedings
cannot be determined, in the opinion of management, the resolution of these
proceedings in the aggregate will not have a material adverse effect on our
financial position, results of operations, or liquidity.
|
ITEM 4.
|
SUBMISSION OF MATTERS TO A VOTE OF
SECURITY HOLDERS.
|
Not applicable.
PART
II
|
ITEM
5.
|
MARKET
FOR REGISTRANT'S COMMON EQUITY, RELATED STOCKHOLDER MATTERS AND ISSUER
PURCHASES OF EQUITY SECURITIES.
|
Market
Information
Our
common stock trades on the NASDAQ National Market under the symbol “RCKY.”
The following table sets forth the range of high and low sales prices for our
common stock for the periods indicated, as reported by the NASDAQ National
Market:
|
Quarter Ended
|
High
|
Low
|
||||||
|
March
31, 2008
|
$ | 7.11 | $ | 4.80 | ||||
|
June
30, 2008
|
$ | 6.00 | $ | 4.61 | ||||
|
September
30, 2008
|
$ | 6.15 | $ | 2.82 | ||||
|
December
31, 2008
|
$ | 4.39 | $ | 2.25 | ||||
|
March
31, 2009
|
$ | 4.96 | $ | 2.71 | ||||
|
June
30, 2009
|
$ | 4.32 | $ | 3.23 | ||||
|
September
30, 2009
|
$ | 6.40 | $ | 3.66 | ||||
|
December
31, 2009
|
$ | 9.65 | $ | 5.55 | ||||
On
February 26, 2010, the last reported sales price of our common stock on the
NASDAQ National Market was $8.48 per share. As of February 26, 2010, there
were 96 shareholders of record of our common stock.
We
presently intend to retain our earnings to finance the growth and development of
our business and do not anticipate paying any cash dividends in the foreseeable
future. Future dividend policy will depend upon our earnings and financial
condition, our need for funds and other factors. Presently, our credit
facility restricts the payment of dividends on our common stock. At
December 31, 2009, we had no retained earnings available for
distribution.
16
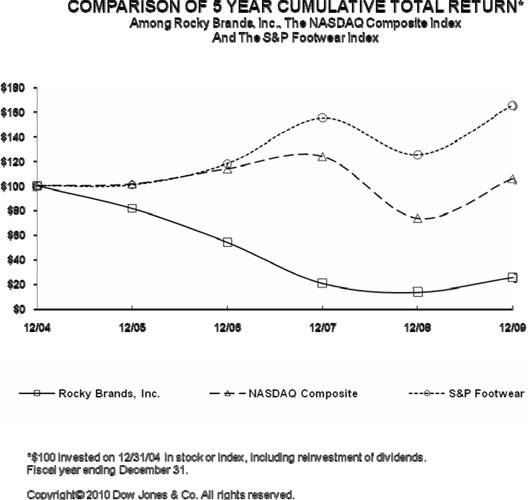
Performance
Graph
The
following performance graph compares our performance of the Company with the
NASDAQ Stock Market (U.S.) Index and the Standard & Poor’s Footwear Index,
which is a published industry index. The comparison of the cumulative
total return to shareholders for each of the periods assumes that $100 was
invested on December 31, 2004, in our common stock, and in the NASDAQ Stock
Market (U.S.) Index and the Standard & Poor’s Footwear Index and that all
dividends were reinvested.
17
|
ITEM 6.
|
SELECTED CONSOLIDATED FINANCIAL
DATA.
|
ROCKY
BRANDS, INC. AND SUBSIDIARIES
SELECTED
CONSOLIDATED FINANCIAL DATA
(in
thousands, except for per share data)
|
Five
Year Financial Summary
|
||||||||||||||||||||
|
12/31/09
|
12/31/08
|
12/31/07
|
12/31/06
|
12/31/05
|
||||||||||||||||
|
Income
Statement Data
|
||||||||||||||||||||
|
Net
sales
|
$ | 229,486 | $ | 259,538 | $ | 275,267 | $ | 263,491 | $ | 296,023 | ||||||||||
|
Gross
margin (% of sales)
|
36.8 | % | 39.4 | % | 39.2 | % | 41.5 | % | 37.6 | % | ||||||||||
|
Net
income (loss)
|
$ | 1,175 | $ | 1,167 | $ | (23,105 | ) | $ | 4,819 | $ | 13,014 | |||||||||
|
Per
Share
|
||||||||||||||||||||
|
Net
(loss) income
|
||||||||||||||||||||
|
Basic
|
$ | 0.21 | $ | 0.21 | $ | (4.22 | ) | $ | 0.89 | $ | 2.48 | |||||||||
|
Diluted
|
$ | 0.21 | $ | 0.21 | $ | (4.22 | ) | $ | 0.86 | $ | 2.33 | |||||||||
|
Weighted
average number of common shares outstanding
|
||||||||||||||||||||
|
Basic
|
5,551 | 5,509 | 5,476 | 5,392 | 5,258 | |||||||||||||||
|
Diluted
|
5,551 | 5,513 | 5,476 | 5,578 | 5,585 | |||||||||||||||
|
Balance
Sheet Data
|
||||||||||||||||||||
|
Inventories
|
$ | 55,420 | $ | 70,302 | $ | 75,404 | $ | 77,949 | $ | 75,387 | ||||||||||
|
Total
assets
|
$ | 163,390 | $ | 196,862 | $ | 216,724 | $ | 246,356 | $ | 236,134 | ||||||||||
|
Working
capital
|
$ | 94,324 | $ | 124,586 | $ | 135,318 | $ | 135,569 | $ | 119,278 | ||||||||||
|
Long-term
debt, less current maturities
|
$ | 55,080 | $ | 87,259 | $ | 103,220 | $ | 103,203 | $ | 98,972 | ||||||||||
|
Stockholders'
equity
|
$ | 82,478 | $ | 80,950 | $ | 81,725 | $ | 104,128 | $ | 99,093 | ||||||||||
The 2009
financial data reflects restructuring charges of $0.5 million, net of tax
benefits. The 2008, 2007 and 2006 financial data reflects non-cash
intangible impairment charges of $3.0 million, $23.5 million and $0.5 million,
net of tax benefits, respectively.
|
ITEM
7.
|
MANAGEMENT'S
DISCUSSION AND ANALYSIS OF FINANCIAL CONDITION AND RESULTS OF OPERATIONS.
|
This
Management’s Discussion and Analysis of Financial Condition and Result of
Operations (“MD&A”) describes the matters that we consider to be important
to understanding the results of our operations for each of the three years in
the period ended December 31, 2009, and our capital resources and liquidity as
of December 31, 2009 and 2008. Use of the terms “Rocky,” the “Company,”
“we,” “us” and “our” in this discussion refer to Rocky Brands, Inc. and its
subsidiaries. Our fiscal year begins on January 1 and ends on December
31. We analyze the results of our operations for the last three years,
including the trends in the overall business followed by a discussion of our
cash flows and liquidity, our credit facility, and contractual
commitments. We then provide a review of the critical accounting judgments
and estimates that we have made that we believe are most important to an
understanding of our MD&A and our consolidated financial statements.
We conclude our MD&A with information on recent accounting pronouncements
which we adopted during the year, as well as those not yet adopted that are
expected to have an impact on our financial accounting practices.
The
following discussion should be read in conjunction with the “Selected
Consolidated Financial Data” and our consolidated financial statements and the
notes thereto, all included elsewhere herein. The forward-looking
statements in this section and other parts of this document involve risks and
uncertainties including statements regarding our plans, objectives, goals,
strategies, and financial performance. Our actual results could differ
materially from the results anticipated in these forward-looking statements as a
result of factors set forth under the caption “Safe Harbor Statement under the
Private Securities Litigation Reform Act of 1995” below. The Private
Securities Litigation Reform Act of 1995 provides a “safe harbor” for
forward-looking statements made by or on behalf of the Company.
18
Our products are distributed through
three distinct business segments: wholesale, retail and military. In our
wholesale business, we distribute our products through a wide range of
distribution channels representing over ten-thousand retail store locations in
the U.S. and Canada. Our wholesale channels vary by product line and include
sporting goods stores, outdoor retailers, independent shoe retailers, hardware
stores, catalogs, mass merchants, uniform stores, farm store chains, specialty
safety stores and other specialty retailers. Our retail business includes
direct sales of our products to consumers through our Lehigh mobile and retail
stores (including a fleet of trucks, supported by small warehouses that include
retail stores, which we refer to as mini-stores), our Rocky outlet store and our
websites. We also sell footwear under the Rocky label to the U.S.
military.
2009
OVERVIEW
Highlights of our 2009 financial
performance include the following:
|
|
·
|
Net
sales decreased $30.0 million to $229.5 million from $259.5 million in
2008.
|
|
|
·
|
Gross
margin decreased $17.6 million to $84.6 million from $102.2 million the
prior year. Gross margin as a percentage of sales decreased 260
basis points to 36.8% from 39.4% in
2008.
|
|
|
·
|
SG&A
expenses decreased $12.4 million to $75.1 million, or 32.7% of net sales
in 2009 compared to $87.5 million, or 33.7% of net sales for
2008.
|
|
|
·
|
In
2009 we recognized $0.7 million of restructuring charges and in 2008 we
recognized a non-cash intangible impairment charge of $4.9 million,
relating to the carrying value of
trademarks.
|
|
|
·
|
Net
income for 2009 was $1.2 million, or $0.21 per diluted share, including a
$0.5 million restructuring charge, net of tax benefits, compared to net
income for 2008 of $1.2 million, or $0.21 per diluted share, including a
$3.0 million non-cash intangible impairment charge, net of tax
benefits.
|
|
|
·
|
Total
debt minus cash and cash equivalents was $53.8 million or 39.0% of total
capitalization at December 31, 2009 compared to $83.4 million or 49.5% of
total capitalization at year-end 2008. Total debt decreased $32.1
million to $55.6 million or 40.3% of total capitalization at December 31,
2009 compared to $87.7 million or 52.0% of total capitalization at
December 31, 2008.
|
Net sales. Net sales
and related cost of goods sold are recognized at the time products are shipped
to the customer and title transfers. Net sales are recorded net of
estimated sales discounts and returns based upon specific customer agreements
and historical trends.
Cost of goods sold. Our
cost of goods sold represents our costs to manufacture products in our own
facilities, including raw materials costs and all overhead expenses related to
production, as well as the cost to purchase finished products from our third
party manufacturers. Cost of goods sold also includes the cost to transport
these products to our distribution centers.
SG&A expenses. Our
SG&A expenses consist primarily of selling, marketing, wages and related
payroll and employee benefit costs, travel and insurance expenses, depreciation,
amortization, professional fees, facility expenses, bank charges, and warehouse
and outbound freight expenses.
19
PERCENTAGE
OF NET SALES
The
following table sets forth consolidated statements of operations data as
percentages of total net sales:
|
Years
Ended December 31,
|
||||||||||||
|
2009
|
2008
|
2007
|
||||||||||
|
Net
sales
|
100.0 | % | 100.0 | % | 100.0 | % | ||||||
|
Cost
of goods sold
|
63.2 | % | 60.6 | % | 60.8 | % | ||||||
|
Gross
margin
|
36.8 | % | 39.4 | % | 39.2 | % | ||||||
|
SG&A
expense
|
32.7 | % | 33.7 | % | 35.0 | % | ||||||
|
Restructuring
charges
|
0.3 | % | 0.0 | % | 0.0 | % | ||||||
|
Non-cash
intangible impairment charges
|
0.0 | % | 1.9 | % | 9.0 | % | ||||||
|
Income
(loss) from operations
|
3.8 | % | 3.8 | % | -4.8 | % | ||||||
Results
of Operations
Year
Ended December 31, 2009 Compared to Year Ended December 31, 2008
Net sales. Net sales
decreased 11.6% to $229.5 million for 2009 compared to $259.5 million the prior
year. Wholesale sales decreased $13.1 million to $174.3 million for 2009
compared to $187.3 million for 2008. The $13.1 million decrease in
wholesale sales is the result of decreased sales in the majority of our footwear
categories and apparel. Retail sales were $50.0 million in 2009 compared
to $65.8 million for 2008. The $15.8 million decrease in retail sales
results from plant closings and layoffs in the manufacturing sector as the
current economic conditions have impacted a significant portion of our retail
customer base. In addition, retail sales were negatively impacted by our
ongoing transition to more internet driven transactions and the decision to
remove a portion of our Lehigh mobile stores from operations to help lower
costs. Military segment sales, which occur from time to time, were $5.2
million for 2009 compared to $6.4 million in 2008. Shipments in 2009 were
under the $6.4 million contract issued in July 2007 and the $29.0 million
contract, issued in July 2009. Average list prices for our footwear,
apparel and accessories were similar in 2009 compared to 2008.
Gross margin. Gross
margin decreased to $84.6 million or 36.8% of net sales for 2009 compared to
$102.2 million or 39.4% of net sales for the prior year. Wholesale gross
margin for 2009 was $60.6 million, or 34.8% of net sales, compared to $68.5
million, or 36.6% of net sales in 2008. The 180 basis point decrease is
the result of additional sales of closeouts at reduced gross margins, an
increase in manufacturing costs, and a decrease in sales price per unit for
competitive reasons. Retail gross margin for 2009 was $23.4 million, or
46.9% of net sales, compared to $33.2 million, or 50.4% of net sales, in
2008. The 350 basis point decrease reflects reduced sales via our mobile
stores, which carry the highest gross margin and lowest operating margin in our
retail business. Military gross margin in 2009 was $0.6 million, or 10.7%
of net sales, compared to $0.6 million, or 9.1% of net sales in
2008.
SG&A expenses.
SG&A expenses were $75.1 million, or 32.7% of net sales in 2009 compared to
$87.5 million, or 33.7% of net sales for 2008. The net change primarily
results from decreases in compensation and benefits expenses of $5.2 million,
shipping expenses of $1.8 million, advertising expenses of $1.5 million, Lehigh
mobile store expenses of $1.1 million, travel expenses of $0.7 million,
telephone expense of $0.4 million and show expenses of $0.4
million.
Restructuring charges.
As a result of our decision during the Fourth quarter of 2009 to initiate
a comprehensive series of actions to reduce the operating cost structure and,
increase the operating efficiency of both our wholesale and retail divisions we
recognized $0.7 million of restructuring charges. These actions involved
the relocation of our wholesale division’s customer care function from Franklin,
TN to Nelsonville, OH, and the closing of underperforming mini-stores in our
retail division. These charges were composed of severance and employee
benefits related costs; transition costs; and facility exit costs, which
includes facility shut down and lease contract termination costs.
Non-cash intangible impairment
charges. Our 2009 evaluation of indefinite lived intangible assets
indicated that none of these assets were impaired. As a result of our
annual evaluation of intangible assets, in 2008 we recognized impairment losses
on the carrying values of the Lehigh and Gates trademarks of $4.0 million and
$0.9 million, respectively. We recognized tax benefits relating to the
Lehigh and Gates trademark impairments of $1.6 million and $0.3 million,
respectively. We estimated fair value based on projections of the future
cash flows for each of the trademarks. We then compared the carrying value
for each trademark to its estimated fair value. Since the fair value of
the trademark was less than its carrying value, we recognized the reductions in
fair value as non-cash intangible impairment charges in our 2008 operating
expenses.
20
Interest expense.
Interest expense was $7.5 million in 2009, compared to $9.3 million for the
prior year. The decrease of $1.8 million resulted from a reduction in
average borrowings combined with lower interest rates compared to the same
period last year.
Income taxes. Income
tax expense was $0.7 million in 2009, compared to an income tax benefit of $0.6
million for the same period a year ago. In 2008, we recognized a $1.9
million benefit relating to the non-cash intangible impairment charge of $4.9
million; a $0.6 million reduction in income tax expense related to the
filing of the 2007 Federal income tax return; and, a $0.1 million reduction in
income tax expense related to an adjustment of state deferred tax
liabilities.
Year
Ended December 31, 2008 Compared to Year Ended December 31, 2007
Net sales. Net sales
decreased 5.7% to $259.5 million for 2008 compared to $275.3 million the prior
year. Wholesale sales decreased $15.3 million to $187.3 million for 2008
compared to $202.6 million for 2007. The $15.3 million decrease in
wholesale sales is primarily attributable to a supply chain disruption for our
western footwear category combined with sales decreases in our outdoor footwear
categories resulting from current economic conditions. Retail sales were
$65.8 million in 2008 compared to $70.7 million for 2007. The $4.9 million
decrease in retail sales results from customer decisions to close plants, reduce
headcount and defer safety shoe purchases as a result of current economic
conditions. Military segment sales, which occur from time to time, were
$6.4 million for 2008 compared to $2.0 million in 2007. Shipments in 2008
were under the $6.4 million contract issued in July 2007 and the $5.0 million
contract issued in January 2008. Average list prices for our footwear,
apparel and accessories were similar in 2008 compared to 2007.
Gross margin. Gross
margin decreased to $102.2 million or 39.4% of net sales for 2008 compared to
$108.0 million or 39.2% of net sales for the prior year. Wholesale gross
margin for 2008 was $68.5 million, or 36.6% of net sales, compared to $70.4
million, or 34.8% of net sales in 2007. The 180 basis point increase
reflects an increase in sales price per unit, as well as a decrease in
manufacturing costs resulting from increased operating efficiencies at our
manufacturing facilities. Retail gross margin for 2008 was $33.2 million,
or 50.4% of net sales, compared to $36.1 million, or 51.1% of net sales, in
2007. The 70 basis point decrease is primarily the result of increased
costs to purchase products. Military gross margin in 2008 was $0.6
million, or 9.1% of net sales, compared to $1.4 million, or 72.9% of net sales
in 2007. The decrease in basis points reflects the $1.2 million settlement
in 2007 of a previously cancelled military contract.
SG&A expenses.
SG&A expenses were $87.5 million, or 33.7% of net sales in 2008 compared to
$96.4 million, or 35.0% of net sales for 2007. The net change primarily
reflects decreases in salaries and commissions of $5.7 million, professional
fees of $1.6 million and freight and handling of $1.5.
Non-cash intangible impairment
charges. As a result of our annual evaluation of intangible assets,
in 2008 we recognized impairment losses on the carrying values of the Lehigh and
Gates trademarks of $4.0 million and $0.9 million, respectively. We
recognized tax benefits relating to the Lehigh and Gates trademark impairments
of $1.6 million and $0.3 million, respectively. We estimated fair value
based on projections of the future cash flows for each of the trademarks.
We then compared the carrying value for each trademark to its estimated fair
value. Since the fair value of the trademark was less than its carrying
value, we recognized the reductions in fair value as non-cash intangible
impairment charges in our 2008 operating expenses. In 2007, we recognized
an impairment loss on the carrying value of goodwill in the amount of $24.9
million. Because the trading value of our shares indicated a level of
equity market capitalization below our book value at the time of the annual
impairment test, there was indication that our goodwill could be impaired.
In performing the first step of the impairment test, we valued the wholesale
segment, for which all the goodwill applied, based on the guideline company
method. The companies we selected are publicly traded wholesale
competitors who manufacture shoes and apparel. While the selected
companies may differ from the wholesale division in terms of the specific products they provide, they have
similar financial risks and operating performance and reflect current economic
conditions for the footwear and apparel industry in general. As a result
of this analysis, it was determined that an indication of impairment did exist
and the results of the second step of the impairment test resulted in an
impairment of $24.9 million or $23.5 million, net of tax benefit to our
goodwill.
Interest expense.
Interest expense was $9.3 million in 2008, compared to $11.6 million for the
prior year. A reduction in our average borrowings combined with reductions
in Prime and LIBOR interest rates during 2008 resulted in a decrease of $2.3
million in interest expense for 2008. Interest expense for 2007 includes
$0.8 million of deferred financing costs.
21
Income taxes. Income
tax benefit was $0.6 million in 2008, compared to $1.4 million for the same
period a year ago. We recognized a $1.9 million and $1.3 million benefit
relating to the non-cash intangible impairment charge of $4.9 million and $24.9
million in 2008 and 2007, respectively. In 2008, we recognized a $0.6
million reduction in income tax expense related to the filing of the 2007
Federal income tax return and a $0.1 million reduction in income tax expense
related to an adjustment of state deferred tax liabilities. In 2007, we
recognized a $0.3 million benefit relating to a prior year state income tax
refund.
LIQUIDITY
AND CAPITAL RESOURCES
Overview
Our
principal sources of liquidity have been our income from operations and
borrowings under our credit facility and other indebtedness.
Over the
last several years our principal uses of cash have been for working capital and
capital expenditures to support our growth. Our working capital consists
primarily of trade receivables and inventory, offset by accounts payable and
accrued expenses. Our working capital fluctuates throughout the year as a
result of our seasonal business cycle and business expansion and is generally
lowest in the months of January through March of each year and highest during
the months of May through October of each year. We typically utilize our
revolving credit facility to fund our seasonal working capital
requirements. As a result, balances on our revolving credit facility will
fluctuate significantly throughout the year. Our working capital decreased
to $94.3 million at December 31, 2009, compared to $124.6 million at the end of
the prior year.
Our
capital expenditures relate primarily to projects relating to our corporate
offices, property, merchandising fixtures, molds and equipment associated with
our manufacturing operations and for information technology. Capital
expenditures were $4.9 million for 2009 and $4.8 million in 2008. Capital
expenditures for 2010 are anticipated to be approximately $5.0
million.
In May
2007, we entered into a Note Purchase Agreement, totaling $40 million, with
Laminar Direct Capital L.P., Whitebox Hedged High Yield Partners, L.P. and GPC
LIX L.L.C., and issued notes to them for $20 million, $17.5 million and $2.5
million, respectively, at an interest rate of 11.5% payable semi-annually over
the five year term of the notes. Principal repayment is due at maturity in
May 2012. The proceeds from these notes were used to pay down the GMAC
Commercial Finance (“GMAC”) term loans which totaled approximately $17.5 million
and the $15 million American Capital Strategies, LTD (“ACAS”) term loan.
The balance of the proceeds, net of debt acquisition costs of approximately $1.5
million, was used to reduce the outstanding balance on the revolving credit
facility. The Note Purchase Agreement is secured by a security interest in
our assets and is subordinate to the security interest under the GMAC line of
credit.
The total amount available on our
revolving credit facility is subject to a borrowing base calculation based on
various percentages of accounts receivable and inventory. As of
December 31, 2009, we had $13.1 million in borrowings under this
facility and total capacity of $50.0 million. Our credit facilities contain
certain restrictive covenants which require us to maintain fixed charge coverage
ratios; and places limits on the amount of our annual capital
expenditures. At December 31, 2009, we had no retained earnings
available for dividends. As of December 31, 2009, we were in
compliance with these restrictive covenants.
We believe that our existing credit
facilities coupled with cash generated from operations will provide sufficient
liquidity to fund our operations for at least the next twelve months. Our
continued liquidity, however, is contingent upon future operating performance,
cash flows and our ability to meet financial covenants under our credit
facilities. Based on our expected borrowings for 2010, a
hypothetical 100 basis point increase in short term interest rates would result,
over the subsequent twelve-month period, in a reduction of approximately $0.8
million in income before income taxes and cash flows. The estimated
reductions are based upon the current level of variable debt and assume no
changes in the composition of that debt.
22
Cash
Flows
|
Cash
Flow Summary
|
2009
|
2008
|
2007
|
|||||||||
|
($
in millions)
|
||||||||||||
|
Cash
provided by (used in):
|
||||||||||||
|
Operating
activities
|
$ | 35.9 | $ | 18.3 | $ | 16.5 | ||||||
|
Investing
activities
|
(4.9 | ) | (4.8 | ) | (5.7 | ) | ||||||
|
Financing
activities
|
(33.5 | ) | (15.7 | ) | (8.0 | ) | ||||||
|
Net
change in cash and cash equivalents
|
$ | (2.5 | ) | $ | (2.2 | ) | $ | 2.8 | ||||
Operating
Activities. Net cash provided by operating activities totaled
$35.9 million for Fiscal 2009, compared to $18.3 million for Fiscal 2008, and
$16.5 million for Fiscal 2007. The principal sources of net cash in
2009 included decreases of $14.2 million in accounts receivable, $14.9 million
in inventory offset by decreases of $3.1 million in accounts
payable. The principal sources of net cash in 2008 included decreases
of $5.1 million in accounts receivable, $5.1 million in inventory and $0.6
million in income taxes receivable offset by decreases of $2.1 million in
accounts payable and $1.0 million in accrued and other
liabilities. The principal sources of net cash in 2007 included
decreases of $2.5 million in inventory and $2.9 million in income taxes
receivable combined with increases of $2.1 million in accounts payable and $1.7
million in accrued and other liabilities.
Investing Activities. Net
cash used in investing activities was $4.9 million in Fiscal 2009 compared to
$4.8 million in Fiscal 2008 and $5.7 million in Fiscal 2007. The
principal use of cash in 2009, 2008 and 2007 was for the purchase of molds and
equipment associated with our manufacturing operations and for information
technology software and system upgrades.
Financing
Activities. Cash used by financing activities during 2009 was
$33.5 million compared to $15.7 million in 2008 and $8.0 million in
2007. Proceeds and repayments of the revolving credit facility
reflect daily cash disbursement and deposit activity. The Company’s
financing activities during 2009 included repayments on long term debt of $0.5
million and debt financing costs of $1.5 million. The Company’s
financing activities during 2008 included cash proceeds from the issuance of
debt of $0.4 million and repayments on long term debt of $0.4
million. The Company’s financing activities during 2007 included cash
proceeds from the issuance of debt of $40 million and proceeds from the exercise
of stock options and related tax benefits of $0.4 million and repayments on long
term debt of $32.8 million.
Borrowings
and External Sources of Funds
Our
borrowings and external sources of funds were as follows at December 31, 2009
and 2008:
|
December
31
|
||||||||
|
($
in millions)
|
2009
|
2008
|
||||||
|
Revolving
credit facility
|
$ | 13.1 | $ | 44.8 | ||||
|
Term
loans
|
40.0 | 40.0 | ||||||
|
Real
estate obligations
|
2.3 | 2.7 | ||||||
|
Other
|
0.2 | 0.3 | ||||||
|
Total
debt
|
55.6 | 87.8 | ||||||
|
Less
current maturities
|
0.5 | 0.5 | ||||||
|
Net
long-term debt
|
$ | 55.1 | $ | 87.3 | ||||
Our real
estate obligations were $2.3 million at December 31, 2009. The
mortgage financing, completed in 2000, includes two of our facilities, with
monthly payments of less than $0.1 million through 2014.
We lease
certain machinery, trucks, shoe centers, and manufacturing facilities under
operating leases that generally provide for renewal options. Future
minimum lease payments under non-cancelable operating leases are $1.5 million,
$1.1 million, $0.7 million and $0.4 million for years 2010 through 2013,
respectively, and $0.1 million for 2014, or approximately $3.8 million in
total.
23
We
continually evaluate our external credit arrangements in light of our growth
strategy and new opportunities. In March 2009, we amended the terms
of our revolving credit facility with GMAC Commercial Finance (“GMAC”) which was
set to expire on January 5, 2010. The size of the facility was
reduced to $85 million from $100 million and the maturity date was extended to
April 30, 2012. The interest rates for the term of this amendment are
LIBOR plus 3.75% or prime plus 2.25%, at our option. The financing
costs associated with this amendment totaled approximately $1.5
million.
Contractual
Obligations and Commercial Commitments
The
following table summarizes our contractual obligations at December 31, 2009
resulting from financial contracts and commitments. We have not
included information on our recurring purchases of materials for use in our
manufacturing operations. These amounts are generally consistent from
year to year, closely reflect our levels of production, and are not long-term in
nature (less than three months).
Contractual
Obligations at December 31, 2009:
|
Payments due by Year
|
||||||||||||||||||||
|
$ millions
|
||||||||||||||||||||
|
Total
|
Less Than 1
Year
|
1-3 Years
|
3-5 Years
|
Over 5
Years
|
||||||||||||||||
|
Long-term
debt
|
$ | 55.6 | $ | 0.5 | $ | 54.0 | $ | 1.0 | $ | 0.1 | ||||||||||
|
Minimum
operating lease commitments
|
3.8 | 1.5 | 1.8 | 0.5 | - | |||||||||||||||
|
Minimum
royalty commitments
|
3.8 | 2.0 | 1.8 | - | - | |||||||||||||||
|
Expected
cash requirements for interest (1)
|
22.8 | 5.1 | 14.6 | 3.1 | - | |||||||||||||||
|
Total
contractual obligations
|
$ | 86.0 | $ | 9.1 | $ | 72.2 | $ | 4.6 | $ | 0.1 | ||||||||||
(1)
Assumes the following interest rates which are consistent with rates as of
December 31, 2009: (1) 5.0% on the $85 million revolving credit facility; (2)
11.5% on the $40 million five-year term loan; and (3) 8.275% on the
$2.3 million mortgage loans.
From time
to time, we enter into purchase commitments with our suppliers under customary
purchase order terms. Any significant losses implicit in these
contracts would be recognized in accordance with generally accepted accounting
principles. At December 31, 2009, no such losses
existed.
Our
ongoing business activities continue to be subject to compliance with various
laws, rules and regulations as may be issued and enforced by various federal,
state and local agencies. With respect to environmental matters,
costs are incurred pertaining to regulatory compliance. Such costs
have not been, and are not anticipated to become, material.
We are
contingently liable with respect to lawsuits, taxes and various other matters
that routinely arise in the normal course of business. We do not have
off-balance sheet arrangements, financings, or other relationships with
unconsolidated entities or other persons, also known as “Variable Interest
Entities.” Additionally, we do not have any related party
transactions that materially affect the results of operations, cash flow or
financial condition.
Inflation
Our
financial performance is influenced by factors such as higher raw material costs
as well as higher salaries and employee benefits. Management attempts
to minimize or offset the effects of inflation through increased selling prices,
productivity improvements, and cost reductions. We were able to
mitigate the effects of inflation during 2009 due to these
factors. It is anticipated that inflationary pressures during 2010
will be offset through decreases in the cost of sourcing our
inventory. We expect these reductions to be generated by price
reductions with our suppliers resulting from the competitive pressures which
they are currently experiencing as a result of the current global economic
conditions. Our suppliers are experiencing increased competition from
other suppliers as a result of the underutilization of their available
manufacturing capacity.
24
CRITICAL
ACCOUNTING POLICIES AND ESTIMATES
“Management’s
Discussion and Analysis of Financial Condition and Results of Operations”
discusses our consolidated financial statements, which have been prepared in
accordance with accounting principles generally accepted in the United
States. The preparation of these consolidated financial statements
requires management to make estimates and assumptions that affect the reported
amounts of assets and liabilities, the disclosure of contingent assets and
liabilities at the date of the consolidated financial statements and the
reported amounts of revenues and expenses during the reporting
period. A summary of our significant accounting policies is included
in the Notes to Consolidated Financial Statements included in this Annual Report
on Form 10-K.
Our
management regularly reviews our accounting policies to make certain they are
current and also provide readers of the consolidated financial statements with
useful and reliable information about our operating results and financial
condition. These include, but are not limited to, matters related to
accounts receivable, inventories, intangibles, pension benefits and income
taxes. Implementation of these accounting policies includes estimates
and judgments by management based on historical experience and other factors
believed to be reasonable. This may include judgments about the
carrying value of assets and liabilities based on considerations that are not
readily apparent from other sources. Actual results may differ from
these estimates under different assumptions or conditions.
Our
management believes the following critical accounting policies are most
important to the portrayal of our financial condition and results of operations
and require more significant judgments and estimates in the preparation of our
consolidated financial statements.
Revenue
recognition
Revenue
principally consists of sales to customers, and, to a lesser extent, license
fees. Revenue is recognized when goods are shipped and title passes
to the customer, while license fees are recognized when
earned. Customer sales are recorded net of allowances for estimated
returns, trade promotions and other discounts, which are recognized as a
deduction from sales at the time of sale.
Accounts
receivable allowances
Management
maintains allowances for uncollectible accounts for estimated losses resulting
from the inability of our customers to make required payments. If the
financial condition of our customers were to deteriorate, resulting in an
impairment of their ability to make payments, additional allowances may be
required. The allowance for uncollectible accounts is calculated
based on the relative age and size of trade receivable balances.
Sales
returns and allowances
We record
a reduction to gross sales based on estimated customer returns and
allowances. These reductions are influenced by historical experience,
based on customer returns and allowances. The actual amount of sales
returns and allowances realized may differ from our estimates. If we
determine that sales returns or allowances should be either increased or
decreased, then the adjustment would be made to net sales in the period in which
such a determination is made. Sales returns and allowances for sales
returns were approximately 4.6% and 5.7% of sales for 2009 and 2008,
respectively.
Inventories
Management
identifies slow moving or obsolete inventories and estimates appropriate loss
provisions related to these inventories. Historically, these loss
provisions have not been significant as the vast majority of our inventories are
considered saleable and we have been able to liquidate slow moving or obsolete
inventories at amounts above cost through our factory outlet stores or through
various discounts to customers. Should management encounter
difficulties liquidating slow moving or obsolete inventories, additional
provisions may be necessary. Management regularly reviews the
adequacy of our inventory reserves and makes adjustments to them as
required.
Intangible
assets
Intangible
assets, including goodwill, trademarks and patents are reviewed for impairment
annually, and more frequently, if necessary. We perform such testing
of goodwill and indefinite-lived intangible assets in the fourth quarter of each
year or as events occur or circumstances change that would more likely than not
reduce the fair value of the asset below its carrying amount.
25
In
assessing whether indefinite-lived intangible assets are impaired, we must make
certain estimates and assumptions regarding future cash flows, long-term growth
rates of our business, operating margins, weighted average cost of capital and
other factors such as; discount rates, royalty rates, cost of capital, and
market multiples to determine the fair value of our assets. These
estimates and assumptions require management’s judgment, and changes to these
estimates and assumptions could materially affect the determination of fair
value and/or impairment for each of our other indefinite-lived intangible
assets. Future events could cause us to conclude that indications of
intangible asset impairment exist. Impairment may result from, among
other things, deterioration in the performance of our business, adverse market
conditions, adverse changes in applicable laws and regulations, competition, or
the sale or disposition of a reporting segment. Any resulting
impairment loss could have a material adverse impact on our financial condition
and results of operations.
Pension
benefits
Accounting
for pensions involves estimating the cost of benefits to be provided well into
the future and attributing that cost over the time period each employee
works. To accomplish this, extensive use is made of assumptions about
inflation, investment returns, mortality, turnover and discount
rates. These assumptions are reviewed annually. See Note
10, “Retirement Plans,” to the consolidated financial statements for information
on our plan and the assumptions used.
Pension
expenses are determined by actuaries using assumptions concerning the discount
rate, expected return on plan assets and rate of compensation
increase. An actuarial analysis of benefit obligations and plan
assets is determined as of December each year. The funded status of
our plan and reconciliation of accrued pension cost is determined annually as of
December 31. Actual results would be different using other
assumptions. On December 31, 2005 we froze the noncontributory
defined benefit pension plan for all non-U.S. territorial employees. Future
adverse changes in market conditions or poor operating results of underlying
plan assets could result in losses or a higher accrual.
Income
taxes
Management
has recorded a valuation allowance to reduce its deferred tax assets for a
portion of state and local income tax net operating losses that it believes may
not be realized. We have considered future taxable income and ongoing
prudent and feasible tax planning strategies in assessing the need for a
valuation allowance, however, in the event we were to determine that we would
not be able to realize all or part of our net deferred tax assets in the future,
an adjustment to the deferred tax assets would be charged to income in the
period such determination was made. At December 31, 2009,
approximately $13.1 million of undistributed earnings remains that would become
taxable upon repatriation to the United States.
RECENT
FINANCIAL ACCOUNTING PRONOUNCEMENTS
Recently
Adopted Accounting Pronouncements
FASB
Accounting Standards Codification and the Hierarchy of GAAP
In June
2009, the Financial Accounting Standards Board (“FASB”) issued the FASB
Accounting Standards Codification (the “Codification”). The
Codification is the single source for all authoritative GAAP recognized by the
FASB to be applied in the preparation of financial statements of nongovernmental
entities issued for periods ending after September 15, 2009. The
Codification supersedes all existing non-SEC accounting and reporting
standards. The Codification did not change GAAP and did not have a
material impact on our consolidated financial statements.
Fair
Value Measurements
In
January 2009, we adopted the Financial Accounting Standards Board’s (“FASB”)
Statement “Fair Value
Measurements” related to nonfinancial assets and nonfinancial
liabilities. This statement defines fair value, establishes a
framework for measuring fair value in GAAP, and expands disclosures about fair
value measurements. This statement applies whenever another standard
requires (or permits) assets or liabilities to be measured at fair
value. The standard does not expand the use of fair value to any new
circumstances. The adoption of this pronouncement did not have a
material impact on our consolidated financial statements.
26
Disclosures
about Derivative Instruments and Hedging Activities
In
January 2009, we adopted the FASB’s Statement “Disclosures about Derivative
Instruments and Hedging Activities.” This statement requires enhanced
disclosures about derivative and hedging activities and thereby improves the
transparency of financial reporting. This statement also encourages,
but does not require, comparative disclosures for earlier periods at initial
adoption. The adoption of this pronouncement did not have an impact
on our consolidated financial statements.
Non-controlling
Interests in Consolidated Financial Statements
In
January 2009, we adopted the FASB’s statement “Non-controlling Interests in
Consolidated Financial Statements.” This statement improves
the relevance, comparability, and transparency of the financial information that
a company provides in its consolidated financial statements. This
statement requires a company to clearly identify and present ownership interests
in subsidiaries held by parties other than the company in the consolidated
financial statements within the equity section but separate from the company’s
equity. It also requires that the amount of consolidated net income
attributable to the parent and to the non-controlling interest be clearly
identified and presented on the face of the consolidated statement of income;
that changes in ownership interest be accounted for similarly, as equity
transactions; and when a subsidiary is deconsolidated, that any retained
non-controlling equity investment in the former subsidiary and the gain or loss
on the deconsolidation of the subsidiary be measured at fair
value. The adoption this pronouncement did not have an impact on our
consolidated financial statements.
Recognition
and Presentation of Other-Than-Temporary Impairments
In June
2009, we adopted the FASB’s statement “Recognition and Presentation of
Other-Than-Temporary Impairments.” This statement provides
additional guidance to provide greater clarity about the credit and noncredit
component of an other-than-temporary impairment event and to improve
presentation and disclosure of other-than-temporary impairments in the financial
statements. The adoption of this pronouncement did not have a
material impact on our consolidated financial statements.
Interim
Disclosures about Fair Value of Financial Instruments
In June
2009, we adopted the FASB’s statement “Interim Disclosures about Fair
Value of Financial Instruments.” This statement requires
disclosures about fair value of financial instruments in interim as well as in
annual financial statements. The adoption of this pronouncement did
not have a material impact on our consolidated financial
statements.
Employers’
Disclosures about Postretirement Benefit Plan Assets
In
December 2009, we adopted the FASB’s statement “Employers’ Disclosures about
Postretirement Benefit Plan Assets.” This statement expands
the disclosure requirements to include more detailed disclosures about
employers’ plan assets, including employers’ investment strategies, major
categories of plan assets, concentrations of risk within plan assets, and
valuation techniques used to measure the fair value of plan
assets. The adoption did not have a material impact on our
consolidated financial statements.
Recently
Issued Accounting Pronouncements
Consolidation
— Variable Interest Entities
In June
2009, the FASB issued new accounting rules related to the accounting and
disclosure requirements for the consolidation of variable interest
entities. The new accounting rules are effective for the Company’s
first fiscal year that begins after November 15, 2009. We are
currently assessing the potential impact of the adoption of these rules on our
consolidated financial statement disclosures.
Accounting
for Transfers of Financial Assets
In June
2009, the FASB issued new accounting rules for transfers of financial
assets. These new rules require greater transparency and additional
disclosures for transfers of financial assets; the entity’s continuing
involvement with them; and changes the requirements for derecognizing financial
assets. The new accounting rules are effective for financial asset
transfers occurring after the beginning of the Company’s first fiscal year that
begins after November 15, 2009. We are currently assessing the
potential impact of the adoption of these rules on our consolidated financial
statement disclosures.
27
Revenue
Arrangements with Multiple Deliverables
In
September 2009, the Emerging Issues Task Force (“EITF”) issued “Revenue Arrangements with Multiple
Deliverables.” This issue addresses how to determine whether
an arrangement involving multiple deliverables contains more than one unit of
accounting, and how to allocate the consideration to each unit of
accounting. This issue eliminates the use of the residual value
method for determining allocation of arrangement consideration; and allows the
use of an entity's best estimate to determine the selling price if vendor
specific objective evidence and third-party evidence cannot be
determined. This issue also requires additional disclosure to provide
both qualitative and quantitative information regarding the significant
judgments made in applying this issue. In addition, for each
reporting period in the initial year of adoption, this issue requires disclosure
of the amount of revenue recognized subject to the measurement requirements of
this issue and the amount of revenue that would have been recognized if the
related transactions were subject to the measurement requirements of Issue
00-21. This issue is effective for revenue arrangements entered into
or materially modified in fiscal years beginning after June 15,
2010. Early adoption is permitted. We are currently
assessing the potential impact of the adoption of these rules on our
consolidated financial statement disclosures.
Fair
Value Measurements
In
January 2010, the FASB issued “Fair Value Measurements and
Disclosures - Improving Disclosures about Fair Value
Measurements.” This statement requires some new disclosures
and clarifies some existing disclosure requirements about fair value measurement
as set forth in FASB Statement “Fair Value Measurement”. The
amendments are effective for interim and annual reporting periods beginning
after December 15, 2009, except for the disclosures about purchases, sales,
issuances, and settlements in the roll forward of activity in Level 3 fair value
measurements. Those disclosures are effective for fiscal years
beginning after December 15, 2010, and for interim periods within those fiscal
years. The adoption of this pronouncement should not have an impact
on our consolidated financial statement disclosures.
SAFE
HARBOR STATEMENT UNDER THE PRIVATE SECURITIES REFORM ACT OF 1995
This
Management’s Discussion and Analysis of Financial Conditions and Results of
Operations contains forward-looking statements within the meaning of Section 21E
of the Securities Exchange Act of 1934, as amended, and Section 27A of the
Securities Act of 1933, as amended, which are intended to be covered by the safe
harbors created thereby. Those statements include, but may not be
limited to, all statements regarding our and management’s intent, belief,
expectations, such as statements concerning our future profitability and our
operating and growth strategy. Words such as “believe,” “anticipate,”
“expect,” “will,” “may,” “should,” “intend,” “plan,” “estimate,” “predict,”
“potential,” “continue,” “likely” and similar expressions are intended to
identify forward-looking statements. Investors are cautioned that all
forward-looking statements involve risk and uncertainties including, without
limitations, dependence on sales forecasts, changes in consumer demand,
seasonality, impact of weather, competition, reliance on suppliers, changing
retail trends, economic changes, as well as other factors set forth under the
caption “Item 1A, Risk Factors” in this Annual Report on Form 10-K and other
factors detailed from time to time in our filings with the Securities and
Exchange Commission. Although we believe that the assumptions
underlying the forward-looking statements contained herein are reasonable, any
of the assumptions could be inaccurate. Therefore, there can be no
assurance that the forward-looking statements included herein will prove to be
accurate. In light of the significant uncertainties inherent in the
forward-looking statements included herein, the inclusion of such information
should not be regarded as a representation by us or any other person that our
objectives and plans will be achieved. We assume no obligation to
update any forward-looking statements.
28
|
ITEM
7A.
|
QUANTITATIVE
AND QUALITATIVE DISCLOSURES ABOUT MARKET
RISK.
|
Our
primary market risk results from fluctuations in interest rates. We
are also exposed to changes in the price of commodities used in our
manufacturing operations. However, commodity price risk related to
the Company's current commodities is not material as price changes in
commodities can generally be passed along to the customer. We do not
hold any market risk sensitive instruments for trading purposes.
The
following item is market rate sensitive for interest rates for the Company: (1)
long-term debt consisting of a credit facility (as described below) with a
balance at December 31, 2009 of $13.1 million.
In May
2007, we entered into a Note Purchase Agreement, totaling $40 million, with
Laminar Direct Capital L.P., Whitebox Hedged High Yield Partners, L.P. and GPC
LIX L.L.C., and issued notes to them for $20 million, $17.5 million and $2.5
million, respectively, at an interest rate of 11.5% payable semi-annually over
the five year term of the notes. Principal repayment is due at
maturity in May 2012. The proceeds from these notes were used to pay
down the GMAC Commercial Finance (“GMAC”) term loans which totaled approximately
$17.5 million and the $15 million American Capital Strategies, LTD (“ACAS”) term
loan. The balance of the proceeds, net of debt acquisition costs of
approximately $1.5 million, was used to reduce the outstanding balance on the
revolving credit facility. The Note Purchase Agreement is secured by
a security interest in our assets and is subordinate to the security interest
under the GMAC line of credit.
In March
2009, we amended the terms of our revolving credit facility with GMAC Commercial
Finance (“GMAC”) which was set to expire on January 5, 2010. The size
of the facility was reduced to $85 million from $100 million and the maturity
date was extended to April 30, 2012. The interest rates for the term
of this amendment are LIBOR plus 3.75% or prime plus 2.25%, at our
option. The financing costs associated with this amendment totaled
approximately $1.5 million.
Based on
our expected borrowings for 2010, a hypothetical 100 basis point increase in
short term interest rates would result, over the subsequent twelve-month period,
in a reduction of approximately $0.8 million in income before income taxes and
cash flows. The estimated reductions are based upon the current level
of variable debt and assume no changes in the composition of that
debt.
We do not
have any interest rate management agreements as of December 31,
2009.
|
ITEM
8.
|
FINANCIAL
STATEMENTS AND SUPPLEMENTARY DATA.
|
Our
consolidated balance sheets as of December 31, 2009 and 2008 and the related
consolidated statements of income, shareholders’ equity, and cash flows for the
years ended December 31, 2009, 2008, and 2007, together with the report of the
independent registered public accounting firm thereon appear on pages F-1
through F-30 hereof and are incorporated herein by reference.
|
ITEM
9.
|
CHANGES
IN AND DISAGREEMENTS WITH ACCOUNTANTS ON ACCOUNTING AND FINANCIAL
DISCLOSURE.
|
None.
|
ITEM
9A.
|
CONTROLS
AND PROCEDURES.
|
Evaluation
of Disclosure Controls and Procedures
As of the
end of the period covered by this report, our management carried out an
evaluation, with the participation of our principal executive officer and
principal financial officer, of the effectiveness of our disclosure controls and
procedures (as defined in Rules 13a-15(e) and 15d-15(e) promulgated under the
Securities Exchange Act of 1934, as amended). Based upon that
evaluation, our principal executive officer and principal financial officer
concluded that our disclosure controls and procedures were effective as of the
end of the period covered by this report. It should be noted that the
design of any system of controls is based in part upon certain assumptions about
the likelihood of future events, and there can be no assurance that any design
will succeed in achieving its stated goals under all potential future
conditions, regardless of how remote.
29
Changes
in Internal Control over Financial Reporting
As part
of our evaluation of the effectiveness of internal controls over financial
reporting described below, we made certain improvements to our internal
controls. However, there were no changes in our internal controls
over financial reporting that occurred during our most recent fiscal quarter
that have materially affected, or are reasonably likely to materially affect,
our internal control over financial reporting.
Management’s
Report on Internal Control over Financial Reporting
Our management is responsible for
establishing and maintaining adequate internal control over financial reporting,
as such term is defined in Rule 13a-15(f) under the Exchange
Act. Because of its inherent limitations, internal control over
financial reporting may not prevent or detect misstatements. Also,
projections of any evaluation of effectiveness to future periods are subject to
risk that controls may become inadequate because of changes in conditions, or
that the degree of compliance with the policies or procedures may
deteriorate. Under the supervision and with the participation of our
principal executive officer and principal financial officer, our management
conducted an evaluation of the effectiveness of our internal control over
financial reporting based on the framework in Internal Control –
Integrated Framework
issued by the Committee of Sponsoring Organizations of the Treadway
Commission. Based upon that evaluation under the framework in
Internal Control –
Integrated Framework, our
management concluded that our internal control over financial reporting was
effective as of December 31, 2009. Schneider Downs & Co., Inc.,
our independent registered public accounting firm has issued an attestation
report on the effectiveness of our internal controls over financial reporting
which is included on the following page.
30
REPORT OF
INDEPENDENT REGISTERED PUBLIC ACCOUNTING FIRM
To the
Board of Directors and Shareholders of Rocky Brands, Inc.:
We have
audited Rocky Brands, Inc.’s (the “Company”) internal control over financial
reporting as of December 31, 2009, based on criteria established in Internal
Control—Integrated Framework issued by the Committee of Sponsoring Organizations
of the Treadway Commission (COSO). The Company’s management is responsible for
maintaining effective internal control over financial reporting and for its
assessment of the effectiveness of internal control over financial reporting
included in the accompanying Management’s Report on Internal Control Over
Financial Reporting. Our responsibility is to express an opinion on the
Company’s internal control over financial reporting based on our
audit.
We
conducted our audit in accordance with the standards of the Public Company
Accounting Oversight Board (United States). Those standards require that we plan
and perform the audit to obtain reasonable assurance about whether effective
internal control over financial reporting was maintained in all material
respects. Our audit of internal control over financial reporting included
obtaining an understanding of internal control over financial reporting,
assessing the risk that a material weakness exists, and testing and evaluating
the design and operating effectiveness of internal control based on the assessed
risk. Our audit also included performing such other procedures as we considered
necessary in the circumstances. We believe that our audit provides a reasonable
basis for our opinion.
A
company’s internal control over financial reporting is a process designed to
provide reasonable assurance regarding the reliability of financial reporting
and the preparation of financial statements for external purposes in accordance
with generally accepted accounting principles. A company’s internal control over
financial reporting includes those policies and procedures that (1) pertain to
the maintenance of records that, in reasonable detail, accurately and fairly
reflect the transactions and dispositions of the assets of the company; (2)
provide reasonable assurance that transactions are recorded as necessary to
permit preparation of financial statements in accordance with generally accepted
accounting principles, and that receipts and expenditures of the company are
being made only in accordance with authorizations of management and directors of
the company; and (3) provide reasonable assurance regarding prevention or timely
detection of unauthorized acquisition, use, or disposition of the company’s
assets that could have a material effect on the financial
statements.
Because
of its inherent limitations, internal control over financial reporting may not
prevent or detect misstatements. Also, projections of any evaluation of
effectiveness to future periods are subject to the risk that controls may become
inadequate because of changes in conditions, or that the degree of compliance
with the policies or procedures may deteriorate.
In
our opinion, Rocky Brands, Inc. maintained, in all material respects, effective
internal control over financial reporting as of December 31, 2009, based on
criteria established in Internal Control—Integrated Framework issued by the
Committee of Sponsoring Organizations of the Treadway Commission
(COSO).
We have
also audited, in accordance with the standards of the Public Company Accounting
Oversight Board (United States), the consolidated balance sheets and the related
consolidated statements of operations, shareholders’ equity, and cash flows of
Rocky Brands, Inc., and our report dated March 2, 2010 expressed an unqualified
opinion.
/s/
Schneider Downs & Co., Inc.
Columbus,
Ohio
March 2,
2010
31
|
ITEM
9B.
|
OTHER
INFORMATION
|
None.
PART
III
|
ITEM 10.
|
DIRECTORS, EXECUTIVE OFFICERS
AND CORPORATE GOVERNANCE.
|
The
information required by this item is included under the captions “ELECTION OF
DIRECTORS” and “INFORMATION CONCERNING THE BOARD OF DIRECTORS AND CORPORATE
GOVERNANCE,” INFORMATION CONCERNING EXECUTIVE OFFICERS,” and “SECTION 16(a)
BENEFICIAL OWNERSHIP REPORTING COMPLIANCE” in the Company's Proxy Statement for
the 2010 Annual Meeting of Shareholders (the “Proxy Statement”) to be held on
May 19, 2010, to be filed with the Securities and Exchange Commission pursuant
to Regulation 14A promulgated under the Securities Exchange Act of 1934, is
incorporated herein by reference.
We have
adopted a Code of Business Conduct and Ethics that applies to our directors,
officers and all employees. The Code of Business Conduct and Ethics
is posted on our website at www.rockyboots.com. The Code of Business
Conduct and Ethics may be obtained free of charge by writing to Rocky Brands,
Inc., Attn: Chief Financial Officer, 39 East Canal Street, Nelsonville,
Ohio 45764.
|
ITEM 11.
|
EXECUTIVE
COMPENSATION.
|
The
information required by this item is included under the captions “EXECUTIVE
COMPENSATION” and “COMPENSATION COMMITTEE INTERLOCKS AND INSIDER PARTICIPATION”
in the Company's Proxy Statement, and is incorporated herein by
reference.
|
ITEM 12.
|
SECURITY OWNERSHIP OF CERTAIN
BENEFICIAL OWNERS AND MANAGEMENT AND RELATED SHAREHOLDER
MATTERS.
|
The
information required by this item is included under the caption “PRINCIPAL
HOLDERS OF VOTING SECURITIES - OWNERSHIP OF COMMON STOCK BY
MANAGEMENT,” “- OWNERSHIP OF COMMON STOCK BY PRINCIPAL SHAREHOLDERS,”
and “EQUITY COMPENSATION PLAN INFORMATION,” in the Company's Proxy Statement,
and is incorporated herein by reference.
|
ITEM
13.
|
CERTAIN
RELATIONSHIPS AND RELATED TRANSACTIONS AND DIRECTOR
INDEPENDENCE.
|
The
information required by this item is included under the caption “COMPENSATION
COMMITTEE INTERLOCKS AND INSIDER PARTICIPATION COMPENSATION COMMITTEE” and
INTERLOCKS AND INSIDER PARTICIPATION/RELATED PARTY TRANSACTIONS” in the
Company's Proxy Statement, and is incorporated herein by reference.
|
ITEM
14.
|
PRINCIPAL
ACCOUNTING FEES AND SERVICES.
|
The
information required by this item is included under the caption “REPORT OF THE
AUDIT COMMITTEE OF THE BOARD OF DIRECTORS” in the Company’s Proxy Statement, and
is incorporated herein by reference.
32
PART
IV
|
ITEM
15.
|
EXHIBITS
AND FINANCIAL STATEMENT SCHEDULES
|
(a) THE
FOLLOWING DOCUMENTS ARE FILED AS PART OF THIS REPORT:
|
|
(1)
|
The
following Financial Statements are included in this Annual Report on Form
10-K on the pages indicated below:
|
|
Reports
of Independent Registered Public Accounting Firm
|
F-1
|
|
|
Consolidated
Balance Sheets as of December 31, 2009 and 2008
|
F-2
- F-3
|
|
|
Consolidated
Statements of Operations for the years ended
|
||
|
December
31, 2009, 2008, and 2007
|
F-4
|
|
|
Consolidated
Statements of Shareholders' Equity for the
|
||
|
years
ended December 31, 2009, 2008, and 2007
|
F-5
|
|
|
Consolidated
Statements of Cash Flows for the years ended
|
||
|
December
31, 2009, 2008, and 2007
|
F-6
|
|
|
Notes
to Consolidated Financial Statements for the years ended
|
||
|
December
31, 2009, 2008, and 2007
|
F-7
-
F-30
|
|
|
(2)
|
The
following financial statement schedule for the years ended December 31,
2009, 2008, and 2007 is included in this Annual Report on Form 10-K and
should be read in conjunction with the Consolidated Financial Statements
contained in the Annual Report.
|
Schedule
II — Consolidated Valuation and Qualifying Accounts.
Reports
of Independent Registered Public Accounting Firms on Financial Statement
Schedule.
Schedules
not listed above are omitted because of the absence of the conditions under
which they are required or because the required information is included in the
Consolidated Financial Statements or the notes thereto.
|
|
(3)
|
Exhibits:
|
|
Exhibit
|
||
|
Number
|
Description
|
|
|
3.1
|
Second
Amended and Restated Articles of Incorporation of the Company
(incorporated by reference to Exhibit 3.1 to the Company’s Annual Report
of Form 10-K for the fiscal year ended December 31,
2006).
|
|
|
3.2
|
Amendment
to Company’s Second Amended and Restated Articles of Incorporation of the
Company (incorporated by reference to Exhibit 3.2 to the Company’s Annual
Report of Form 10-K for the fiscal year ended December 31,
2006).
|
|
|
3.3
|
Amended
and Restated Code of Regulations of the Company (incorporated by reference
to Exhibit 3.2 to the Registration Statement on Form S-1, registration
number 33-56118 (the “Registration Statement”)).
|
|
|
4.1
|
Form
of Stock Certificate for the Company (incorporated by reference to Exhibit
4.1 to the Registration Statement).
|
|
|
4.2
|
Articles
Fourth, Fifth, Sixth, Seventh, Eighth, Eleventh, Twelfth, and Thirteenth
of the Company's Amended and Restated Articles of Incorporation (see
Exhibit 3.1).
|
|
|
4.3
|
Articles
I and II of the Company's Code of Regulations (see Exhibit
3.3).
|
33
|
10.1
|
Deferred
Compensation Agreement, dated May 1, 1984, between Rocky Shoes & Boots
Co. and Mike Brooks (incorporated by reference to Exhibit 10.3 to the
Registration Statement).
|
|
|
10.2
|
Information
concerning Deferred Compensation Agreements substantially similar to
Exhibit 10.1 (incorporated by reference to Exhibit 10.4 to the
Registration Statement).
|
|
|
10.3
|
Indemnification
Agreement, dated December 12, 1992, between the Company and Mike Brooks
(incorporated by reference to Exhibit 10.10 to the Registration
Statement).
|
|
|
10.4
|
Information
concerning Indemnification Agreements substantially similar to Exhibit
10. (incorporated by reference to Exhibit 10.8 to the Company’s
Annual Report on Form 10-K for the fiscal year ended December 31,
2005).
|
|
|
10.5
|
Amended
and Restated Lease Agreement, dated March 1, 2002, between Rocky Shoes
& Boots Co. and William Brooks Real Estate Company regarding
Nelsonville factory (incorporated by reference to Exhibit 10.11 to the
Company's Annual Report on Form 10-K for the fiscal year ended December
31, 2002).
|
|
|
10.6
|
Company's
Amended and Restated 1995 Stock Option Plan (incorporated by reference to
Exhibit 4(a) to the Registration Statement on Form S-8, registration
number 333-67357).
|
|
|
10.7
|
Form
of Stock Option Agreement under the 1995 Stock Option Plan (incorporated
by reference to Exhibit 10.28 to the 1995 Form 10-K).
|
|
|
10.8
|
Lease
Contract dated December 16, 1999, between Lifestyle Footwear, Inc. and The
Puerto Rico Industrial Development Company (incorporated by reference to
Exhibit 10.14 to the Company's Annual Report on Form 10-K for the fiscal
year ended December 31, 2004).
|
|
|
10.9
|
Promissory
Note, dated December 30, 1999, in favor of General Electric Capital
Business Asset Funding Corporation in the amount of $1,050,000
(incorporated by reference to Exhibit 10.1 to the Quarterly Report on Form
10-Q for the quarter ended June 30, 2000 (the “June 30, 2000 Form
10-Q”)).
|
|
|
10.10
|
Promissory
Note, dated December 30, 1999, in favor of General Electric Capital
Business Asset Funding Corporation in the amount of $1,500,000
(incorporated by reference to Exhibit 10.2 to the June 30, 2000 Form
10-Q).
|
|
|
10.11
|
Promissory
Note, dated December 30, 1999, in favor of General Electric Capital
Business Asset Funding Corporation in the amount of $3,750,000
(incorporated by reference to Exhibit 10.3 to the June 30, 2000 Form
10-Q).
|
|
|
10.12
|
Company’s
Second Amended and Restated 1995 Stock Option Plan (incorporated by
reference to the Company’s Definitive Proxy Statement for the 2002 Annual
Meeting of Shareholders held on May 15, 2002, filed on April 15,
2002).
|
|
|
10.13
|
Company’s
2004 Stock Incentive Plan (incorporated by reference to the Company’s
Definitive Proxy Statement for the 2004 Annual Meeting of Shareholders,
held on May 11, 2004, filed on April 6, 2004).
|
|
|
10.14
|
Renewal
of Lease Contract, dated June 24, 2004, between Five Star Enterprises Ltd.
and the Dominican Republic Corporation for Industrial Development
(incorporated by reference to Exhibit 10.20 to the Company's Annual Report
on Form 10-K for the fiscal year ended December 31,
2004).
|
|
|
10.15
|
Second
Amendment to Lease Agreement, dated as of July 26, 2004, between Rocky
Shoes & Boots, Inc. and the William Brooks Real Estate Company
(incorporated by reference to Exhibit 10.1 to the Company’s Quarterly
Report on Form 10-Q for the quarter ended September 30,
2004).
|
34
|
10.16
|
Form
of Option Award Agreement under the Company’s 2004 Stock Incentive Plan
(incorporated by reference to Exhibit 10.1 to the Current Report on Form
8-K dated January 3, 2005, filed with the Securities and Exchange
Commission on January 7, 2005).
|
|
|
10.17
|
Form
of Restricted Stock Award Agreement relating to the Retainer Shares issued
under the Company’s 2004 Stock Incentive Plan (incorporated by reference
to Exhibit 10.2 to the Current Report on Form 8-K dated January 3, 2005,
filed with the Securities and Exchange Commission on January 7,
2005).
|
|
|
10.18
|
Description
of Material Terms of Rocky Brands, Inc.’s Bonus Plan for Fiscal Year
Ending December 31, 2009 (incorporated by reference to Exhibit 10.1 to the
Company’s Current Report on Form 8-K dated December 12, 2008, filed with
the Securities and Exchange Commission on December 18,
2008).
|
|
|
10.19
|
Note
Purchase Agreement, dated as of May 25, 2007, by and among Rocky Brands,
Inc., Lifestyle Footwear, Inc., Rocky Brands Wholesale LLC, and Rocky
Brands Retail LLC, as the Loan Parties, the purchasers party thereto (each
a “Purchaser” and collectively, the “Purchasers”), and Laminar Direct
Capital L.P., as collateral agent for the Purchasers (incorporated by
reference to Exhibit 10.1 to the Company’s Current Report of Form 8-K
dated May 25, 2007, filed with the Securities and Exchange Commission on
May 30, 2007).
|
|
|
10.20
|
Amended
and Restated Loan and Security Agreement, dated as of May 25, 2007, by and
among Rocky Brands, Inc., Lifestyle Footwear, Inc., Rocky Brands Wholesale
LLC, and Rocky Brands Retail LLC, as Borrowers, the financial institutions
party thereto (each a “Lender” and collectively, the “Lenders”), and GMAC
Commercial Finance LLC, as administrative agent and sole lead arranger for
the Lenders (incorporated by reference to Exhibit 10.2 to the Company’s
Current Report of Form 8-K dated May 25, 2007, filed with the Securities
and Exchange Commission on May 30, 2007).
|
|
|
10.21
|
Amendment
to the Rocky Brands, Inc. Agreement with J. Michael Brooks (dated April
16, 1985), dated December 22, 2008 (incorporated by reference to Exhibit
10.35 to the Company’s Annual Report on Form 10-Kfor the fiscal year ended
December 31, 2008).
|
|
|
10.22
|
First
Amendment to the Rocky Brands, Inc. 2004 Stock Incentive Plan, dated
December 30, 2008 (incorporated by reference to Exhibit 10.36 to the
Company’s Annual Report on Form 10-K for the fiscal year ended December
31, 2008).
|
|
|
10.23
|
Amendment
No. 2 to the Amended and Restated Loan and Security Agreement, dated as of
March 31, 2009, by and among Rocky Brands, Inc., Lifestyle Footwear, Inc.,
Rocky Brands Wholesale LLC, and Rocky Brands Retail LLC, as Borrowers, the
financial institutions party thereto (each a “Lender” and collectively,
the “Lenders”), and GMAC Commercial Finance LLC, as administrative agent
and sole lead arranger for the Lender (incorporated by reference to
Exhibit 10.1 to the Company’s Current Report on Form 8-K dated March 31,
2009, filed with the Securities and Exchange Commission on April 3,
2009).
|
|
|
10.24
|
Employment
Agreement, dated June 12, 2008, between the Company and Mike Brooks
(incorporated by reference to Exhibit 10.2 to the Company’s Current Report
on Form 8-K dated June 12, 2009, filed with the Securities and Exchange
Commission on June 18, 2009).
|
|
|
10.25
|
Employment
Agreement, dated June 12, 2008, between the Company and David Sharp
(incorporated by reference to Exhibit 10.1 to the Company’s Current Report
on Form 8-K dated June 12, 2009, filed with the Securities and Exchange
Commission on June 18, 2009).
|
|
|
10.26
|
Employment
Agreement, dated June 12, 2008, between the Company and James E. McDonald
(incorporated by reference to Exhibit 10.3 to the Company’s Current Report
on Form 8-K dated June 12, 2009, filed with the Securities and Exchange
Commission on June 18, 2009).
|
|
|
10.27*
|
Description
of Material Terms of Rocky Brands, Inc.’s Bonus Plan for Fiscal Year
Ending December 31, 2010.
|
35
|
21
|
Subsidiaries
of the Company (incorporated by reference to Exhibit 21 to the Company’s
Annual Report of Form 10-K for the fiscal year ended December 31,
2006).
|
|
|
23*
|
Independent
Registered Public Accounting Firm’s Consent of Schneider Downs & Co.,
Inc.
|
|
|
24*
|
Powers
of Attorney.
|
|
|
31.1*
|
Rule
13a-14(a) Certification of Principal Executive Officer.
|
|
|
31.2*
|
Rule
13a-14(a) Certification of Principal Financial Officer.
|
|
|
32**
|
Section
1350 Certification of Principal Executive Officer and Principal Financial
Officer.
|
|
|
99.1*
|
Independent
Registered Public Accounting Firm’s Report of Schneider Downs & Co.,
Inc. on Schedules.
|
|
|
99.2*
|
|
Financial
Statement Schedule.
|
*
Filed with this Annual Report on Form 10-K.
**
Furnished with this Annual Report on Form 10-K.
The
Registrant agrees to furnish to the Commission upon its request copies of any
omitted schedules or exhibits to any Exhibit filed
herewith.
36
SIGNATURES
Pursuant to the requirements of Section
13 or 15(d) of the Securities Exchange Act of 1934, the Registrant has duly
caused this report to be signed on its behalf by the undersigned, thereunto duly
authorized.
|
ROCKY
BRANDS, INC.
|
||
|
Date:
March 2, 2010
|
By:
|
/s/ James E. McDonald
|
|
James
E. McDonald, Executive Vice
|
||
|
President
and Chief Financial
Officer
|
||
Pursuant to the requirements of the
Securities Exchange Act of 1934, this report has been signed below by the
following persons on behalf of the Registrant and in the capacities indicated on
the dates indicated.
|
Signature
|
Title
|
Date
|
||
|
/s/ Mike Brooks
|
Chairman,
Chief Executive Officer and
|
March
2, 2010
|
||
|
Mike
Brooks
|
Director
(Principal Executive Officer)
|
|||
|
/s/ James E. McDonald
|
Executive
Vice President and
|
March
2, 2010
|
||
|
James
E. McDonald
|
Chief
Financial Officer
|
|||
|
(Principal
Financial and Accounting Officer)
|
||||
|
* Curtis A.
Loveland
|
Secretary
and Director
|
March
2, 2010
|
||
|
Curtis
A. Loveland
|
||||
|
* J. Patrick
Campbell
|
Director
|
March
2, 2010
|
||
|
J.
Patrick Campbell
|
||||
|
* Glenn E. Corlett
|
Director
|
March
2, 2010
|
||
|
Glenn
E. Corlett
|
||||
|
* Michael L.
Finn
|
Director
|
March
2, 2010
|
||
|
Michael
L. Finn
|
||||
|
* G. Courtney Haning
|
Director
|
March
2, 2010
|
||
|
G.
Courtney Haning
|
||||
|
* Harley E. Rouda
|
Director
|
March
2, 2010
|
||
|
Harley
E. Rouda
|
||||
|
* James L.
Stewart
|
Director
|
March
2, 2010
|
||
|
James
L. Stewart
|
||||
|
* By: /s/
Mike Brooks
|
||||
|
Mike
Brooks, Attorney-in-Fact
|
|
|
37
ROCKY
BRANDS, INC.
AND
SUBSIDIARIES
INDEX
TO CONSOLIDATED FINANCIAL STATEMENTS
|
Reports
of Independent Registered Public Accounting Firm
|
F-1
|
|
Consolidated
Balance Sheets as of December 31, 2009 and 2008
|
F-2 - F-3
|
|
Consolidated
Statements of Operations for the Years Ended December 31, 2009, 2008 and
2007
|
F-4
|
|
Consolidated
Statements of Shareholders’ Equity for the Years Ended December 31, 2009,
2008 and 2007
|
F-5
|
|
Consolidated
Statements of Cash Flows for the Years Ended December 31, 2009, 2008 and
2007
|
F-6
|
|
Notes
to Consolidated Financial Statements
|
F-7 - F-30
|
REPORT OF INDEPENDENT
REGISTERED PUBLIC ACCOUNTING FIRM
To the
Board of Directors and Shareholders of Rocky Brands, Inc.:
We have
audited the accompanying consolidated balance sheets of Rocky Brands, Inc. and
subsidiaries (the “Company”) as of December 31, 2009 and 2008 and the related
consolidated statements of operations, shareholders’ equity and cash flows for
the years ended December 31, 2009, 2008 and 2007. The Company’s management is
responsible for these financial statements. Our responsibility is to express an
opinion on these consolidated financial statements based on our
audits.
We
conducted our audits in accordance with the standards of the Public Company
Accounting Oversight Board (United States). Those standards require that we plan
and perform the audits to obtain reasonable assurance about whether the
consolidated financial statements are free of material misstatement. An audit
includes examining, on a test basis, evidence supporting the amounts and
disclosures in the consolidated financial statements. An audit also includes
assessing the accounting principles used and significant estimates made by
management, as well as evaluating the overall consolidated financial statement
presentation. We believe that our audits provide a reasonable basis for our
opinion.
In our
opinion, the consolidated financial statements referred to above present fairly,
in all material respects, the financial position of Rocky Brands, Inc. and
subsidiaries as of December 31, 2009, and 2008, and the results of their
operations and their cash flows for the years ended December 31, 2009, 2008 and
2007, in conformity with accounting principles generally accepted in the United
States of America.
We also
have audited, in accordance with the standards of the Public Company Accounting
Oversight Board (United States), the Company’s internal control over financial
reporting as of December 31, 2009, based on criteria established in Internal Control—Integrated
Framework issued by the Committee of Sponsoring Organizations of the
Treadway Commission (COSO), and our report dated March 2, 2010 expressed an
unqualified opinion.
/s/
Schneider Downs & Co., Inc.
Columbus,
Ohio
March 2,
2010
F -
1
ROCKY
BRANDS, INC.
AND
SUBSIDIARIES
CONSOLIDATED
BALANCE SHEETS
|
December
31,
|
||||||||
|
2009
|
2008
|
|||||||
|
CURRENT
ASSETS:
|
||||||||
|
Cash
and cash equivalents
|
$ | 1,797,093 | $ | 4,311,313 | ||||
|
Trade
receivables – net
|
45,831,558 | 60,133,493 | ||||||
|
Other
receivables
|
1,476,643 | 1,394,235 | ||||||
|
Inventories
|
55,420,467 | 70,302,174 | ||||||
|
Deferred
income taxes
|
1,475,695 | 2,167,966 | ||||||
|
Income
tax receivable
|
- | 75,481 | ||||||
|
Prepaid
expenses
|
1,309,138 | 1,455,158 | ||||||
|
Total
current assets
|
107,310,594 | 139,839,820 | ||||||
|
FIXED
ASSETS – net
|
22,669,876 | 23,549,319 | ||||||
|
IDENTIFIED
INTANGIBLES
|
30,516,910 | 31,020,478 | ||||||
|
OTHER
ASSETS
|
2,892,683 | 2,452,501 | ||||||
|
TOTAL
ASSETS
|
$ | 163,390,063 | $ | 196,862,118 | ||||
See notes
to consolidated financial statements
F -
2
ROCKY
BRANDS, INC.
AND
SUBSIDIARIES
CONSOLIDATED
BALANCE SHEETS
|
December
31,
|
||||||||
|
2009
|
2008
|
|||||||
|
CURRENT
LIABILITIES:
|
||||||||
|
Accounts
payable
|
$ | 6,781,534 | $ | 9,869,948 | ||||
|
Current
maturities - long term debt
|
511,870 | 480,723 | ||||||
|
Accrued
expenses:
|
||||||||
|
Salaries
and wages
|
343,345 | 480,500 | ||||||
|
Co-op
advertising
|
460,190 | 636,408 | ||||||
|
Interest
|
471,091 | 451,434 | ||||||
|
Taxes
- other
|
440,223 | 641,670 | ||||||
|
Commissions
|
487,340 | 387,242 | ||||||
|
Current
portion of pension funding
|
700,000 | - | ||||||
|
Income
taxes payable
|
26,242 | - | ||||||
|
Other
|
2,764,783 | 2,306,105 | ||||||
|
Total
current liabilities
|
12,986,618 | 15,254,030 | ||||||
|
LONG
TERM DEBT-less current maturities
|
55,079,776 | 87,258,939 | ||||||
|
DEFERRED
LIABILITIES:
|
||||||||
|
Deferred
income taxes
|
9,071,639 | 9,438,921 | ||||||
|
Pension
liability
|
3,589,875 | 3,743,552 | ||||||
|
Other
deferred liabilities
|
184,481 | 216,920 | ||||||
|
TOTAL
LIABILITIES
|
80,912,389 | 115,912,362 | ||||||
|
COMMITMENTS
AND CONTINGENCIES
|
||||||||
|
SHAREHOLDERS'
EQUITY:
|
||||||||
|
Preferred
stock, Series A, no par value, $.06 stated value; none
outstanding
|
- | - | ||||||
|
Common
stock, no par value; 25,000,000 shares authorized; outstanding; 2009 -
5,576,465 and 2008 - 5,516,898; and additional paid-in
capital
|
54,598,104 | 54,250,064 | ||||||
|
Accumulated
other comprehensive loss
|
(3,217,144 | ) | (3,222,215 | ) | ||||
|
Retained
earnings
|
31,096,714 | 29,921,907 | ||||||
|
Total
shareholders' equity
|
82,477,674 | 80,949,756 | ||||||
|
TOTAL
LIABILITIES AND SHAREHOLDERS' EQUITY
|
$ | 163,390,063 | $ | 196,862,118 | ||||
See notes
to consolidated financial statements.
F -
3
ROCKY
BRANDS, INC.
AND
SUBSIDIARIES
CONSOLIDATED
STATEMENTS OF OPERATIONS
|
Years Ended December 31,
|
||||||||||||
|
2009
|
2008
|
2007
|
||||||||||
|
NET
SALES
|
$ | 229,485,575 | $ | 259,538,145 | $ | 275,266,811 | ||||||
|
COST
OF GOODS SOLD
|
144,928,219 | 157,294,936 | 167,272,735 | |||||||||
|
GROSS
MARGIN
|
84,557,356 | 102,243,209 | 107,994,076 | |||||||||
|
OPERATING
EXPENSES
|
||||||||||||
|
Selling,
general and administrative expenses
|
75,072,208 | 87,496,049 | 96,409,467 | |||||||||
|
Restructuring
charges
|
711,169 | - | - | |||||||||
|
Non-cash
intangible impairment charges
|
- | 4,862,514 | 24,874,368 | |||||||||
|
Total
operating expenses
|
75,783,377 | 92,358,563 | 121,283,835 | |||||||||
|
INCOME
(LOSS) FROM OPERATIONS
|
8,773,979 | 9,884,646 | (13,289,759 | ) | ||||||||
|
OTHER
INCOME AND (EXPENSES):
|
||||||||||||
|
Interest
expense
|
(7,500,513 | ) | (9,318,454 | ) | (11,643,870 | ) | ||||||
|
Other
– net
|
577,856 | (26,718 | ) | 389,519 | ||||||||
|
Total
other - net
|
(6,922,657 | ) | (9,345,172 | ) | (11,254,351 | ) | ||||||
|
INCOME
(LOSS) BEFORE INCOME TAXES
|
1,851,322 | 539,474 | (24,544,110 | ) | ||||||||
|
INCOME
TAX EXPENSE (BENEFIT)
|
676,515 | (627,665 | ) | (1,439,582 | ) | |||||||
|
NET
INCOME (LOSS)
|
$ | 1,174,807 | $ | 1,167,139 | $ | (23,104,528 | ) | |||||
|
NET
INCOME (LOSS) PER SHARE
|
||||||||||||
|
Basic
|
$ | 0.21 | $ | 0.21 | $ | (4.22 | ) | |||||
|
Diluted
|
$ | 0.21 | $ | 0.21 | $ | (4.22 | ) | |||||
|
WEIGHTED
AVERAGE NUMBER OF
|
||||||||||||
|
COMMON
SHARES OUTSTANDING
|
||||||||||||
|
Basic
|
5,551,382 | 5,508,614 | 5,476,281 | |||||||||
|
Diluted
|
5,551,382 | 5,513,430 | 5,476,281 | |||||||||
See notes
to consolidated financial statements
F -
4
ROCKY
BRANDS, INC.
AND
SUBSIDIARIES
CONSOLIDATED
STATEMENTS OF SHAREHOLDERS' EQUITY
|
Common
Stock and
|
Accumulated
|
|||||||||||||||||||
|
Additional Paid-in Capital
|
Other
|
Total
|
||||||||||||||||||
|
Shares
|
Comprehensive
|
Retained
|
Shareholders'
|
|||||||||||||||||
|
Outstanding
|
Amount
|
Loss
|
Earnings
|
Equity
|
||||||||||||||||
|
BALANCE
- December 31, 2006
|
5,417,198 | $ | 53,238,841 | $ | (993,182 | ) | $ | 51,882,391 | $ | 104,128,050 | ||||||||||
|
YEAR
ENDED DECEMBER 31, 2007
|
||||||||||||||||||||
|
Net
loss
|
(23,104,528 | ) | (23,104,528 | ) | ||||||||||||||||
|
Change
in pension liability, net of tax benefit of $32,682
|
(58,050 | ) | (58,050 | ) | ||||||||||||||||
|
Comprehensive
loss
|
(23,162,578 | ) | ||||||||||||||||||
|
Stock
compensation expense
|
7,595 | 340,479 | 340,479 | |||||||||||||||||
|
Stock
issued and options exercised including related tax
benefits
|
63,500 | 418,640 | 418,640 | |||||||||||||||||
|
|
||||||||||||||||||||
|
BALANCE
- December 31, 2007
|
5,488,293 | $ | 53,997,960 | $ | (1,051,232 | ) | $ | 28,777,863 | $ | 81,724,591 | ||||||||||
|
|
||||||||||||||||||||
|
YEAR
ENDED DECEMBER 31, 2008
|
||||||||||||||||||||
|
Adoption
of SFAS 158 change in measursement date, net of tax benefit of
$296,125
|
(526,850 | ) | (23,095 | ) | (549,945 | ) | ||||||||||||||
|
Net
income
|
1,167,139 | 1,167,139 | ||||||||||||||||||
|
Change
in pension liability, net of tax benefit of $979,187
|
(1,644,133 | ) | (1,644,133 | ) | ||||||||||||||||
|
Comprehensive
loss
|
(1,026,939 | ) | ||||||||||||||||||
|
Stock
compensation expense
|
218,163 | 218,163 | ||||||||||||||||||
|
Stock
issued and options exercised including related tax
benefits
|
28,605 | 33,941 | 33,941 | |||||||||||||||||
|
|
||||||||||||||||||||
|
BALANCE
- December 31, 2008
|
5,516,898 | $ | 54,250,064 | $ | (3,222,215 | ) | $ | 29,921,907 | $ | 80,949,756 | ||||||||||
|
|
||||||||||||||||||||
|
YEAR
ENDED DECEMBER 31, 2009
|
||||||||||||||||||||
|
Net
income
|
1,174,807 | 1,174,807 | ||||||||||||||||||
|
Change
in pension liability, net of tax benefit of $2,876
|
5,071 | 5,071 | ||||||||||||||||||
|
Comprehensive
income
|
1,179,878 | |||||||||||||||||||
|
Stock
compensation expense
|
30,317 | 158,477 | 158,477 | |||||||||||||||||
|
Stock
issued and options exercised including related tax
benefits
|
29,250 | 189,563 | 189,563 | |||||||||||||||||
|
BALANCE
- December 31, 2009
|
5,576,465 | $ | 54,598,104 | $ | (3,217,144 | ) | $ | 31,096,714 | $ | 82,477,674 | ||||||||||
See notes
to consolidated financial statements.
F -
5
ROCKY
BRANDS, INC.
AND
SUBSIDIARIES
CONSOLIDATED
STATEMENT OF CASH FLOWS
|
2009
|
2008
|
2007
|
||||||||||
|
CASH
FLOWS FROM OPERATING ACTIVITIES:
|
||||||||||||
|
Net
income (loss)
|
$ | 1,174,807 | $ | 1,167,139 | $ | (23,104,528 | ) | |||||
|
Adjustments
to reconcile net income (loss) to net cash provided by operating
activities:
|
||||||||||||
|
Depreciation
and amortization
|
6,337,942 | 6,430,910 | 5,761,976 | |||||||||
|
Deferred
income taxes
|
322,111 | (2,772,194 | ) | (1,778,154 | ) | |||||||
|
Deferred
compensation and pension
|
(178,169 | ) | 130,153 | (84,821 | ) | |||||||
|
(Gain)
loss on disposal of fixed assets
|
40,710 | (24,930 | ) | 43,632 | ||||||||
|
Stock
compensation expense
|
158,477 | 218,164 | 340,479 | |||||||||
|
Intangible
impairment charge
|
- | 4,862,514 | 24,874,368 | |||||||||
|
Write
off of deferred financing costs for repayment
|
- | - | 811,582 | |||||||||
|
Change
in assets and liabilities:
|
||||||||||||
|
Receivables
|
14,219,527 | 5,078,071 | (186,775 | ) | ||||||||
|
Inventories
|
14,881,707 | 5,101,490 | 2,545,312 | |||||||||
|
Income
tax receivable
|
(75,481 | ) | 644,464 | 2,912,863 | ||||||||
|
Other
current assets
|
296,982 | 794,806 | (645,616 | ) | ||||||||
|
Other
assets
|
1,075,734 | (168,462 | ) | 1,164,845 | ||||||||
|
Accounts
payable
|
(3,127,202 | ) | (2,095,531 | ) | 2,062,628 | |||||||
|
Accrued
and other liabilities
|
789,855 | (1,033,762 | ) | 1,740,839 | ||||||||
|
Net
cash provided by operating activities
|
35,917,000 | 18,332,832 | 16,458,630 | |||||||||
|
CASH
FLOWS FROM INVESTING ACTIVITIES:
|
||||||||||||
|
Purchase
of fixed assets
|
(4,918,816 | ) | (4,810,370 | ) | (5,842,107 | ) | ||||||
|
Proceeds
from sales of fixed assets
|
41,424 | 61,885 | 250,002 | |||||||||
|
Investment
in trademarks and patents
|
(79,458 | ) | (39,490 | ) | (68,295 | ) | ||||||
|
Net
cash used in investing activities
|
(4,956,850 | ) | (4,787,975 | ) | (5,660,400 | ) | ||||||
|
CASH
FLOWS FROM FINANCING ACTIVITIES:
|
||||||||||||
|
Proceeds
from revolving credit facility
|
214,198,296 | 250,144,347 | 273,823,538 | |||||||||
|
Repayments
of revolving credit facility
|
(245,865,589 | ) | (265,953,951 | ) | (287,973,509 | ) | ||||||
|
Proceeds
from long-term debt
|
- | 407,243 | 40,000,000 | |||||||||
|
Repayments
of long-term debt
|
(480,724 | ) | (403,008 | ) | (32,796,578 | ) | ||||||
|
Debt
financing costs
|
(1,515,916 | ) | - | (1,463,690 | ) | |||||||
|
Proceeds
from exercise of stock options
|
164,532 | 32,938 | 372,275 | |||||||||
|
Tax
benefit related to stock options
|
25,031 | 1,003 | 46,365 | |||||||||
|
Net
cash used in financing activities
|
(33,474,370 | ) | (15,771,428 | ) | (7,991,599 | ) | ||||||
|
(DECREASE)
INCREASE IN CASH AND CASH EQUIVALENTS
|
(2,514,220 | ) | (2,226,571 | ) | 2,806,631 | |||||||
|
CASH
AND CASH EQUIVALENTS:
|
||||||||||||
|
BEGINNING
OF PERIOD
|
4,311,313 | 6,537,884 | 3,731,253 | |||||||||
|
END
OF PERIOD
|
$ | 1,797,093 | $ | 4,311,313 | $ | 6,537,884 | ||||||
See notes
to consolidated financial statements
F -
6
ROCKY
BRANDS, INC.
AND
SUBSIDIARIES
NOTES
TO CONSOLIDATED FINANCIAL STATEMENTS
FOR
THE YEARS ENDED DECEMBER 31, 2009, 2008 AND 2007
|
1.
|
SUMMARY
OF SIGNIFICANT ACCOUNTING POLICIES
|
Principles of
Consolidation - The accompanying consolidated financial statements
include the accounts of Rocky Brands, Inc. (“Rocky”) and its wholly-owned
subsidiaries, Lifestyle Footwear, Inc. (“Lifestyle”), Five Star Enterprises Ltd.
(“Five Star”), Rocky Canada, Inc. (“Rocky Canada”), Rocky Brands Wholesale, LLC,
Rocky Brands International, LLC and Lehigh Outfitters, LLC, collectively
referred to as the “Company.” All inter-company transactions have been
eliminated.
Business
Activity - We are a leading designer, manufacturer and marketer of
premium quality footwear marketed under a portfolio of well recognized brand
names including Rocky Outdoor Gear, Georgia Boot, Durango, Lehigh and Dickies.
Our brands have a long history of representing high quality, comfortable,
functional and durable footwear and our products are organized around four
target markets: outdoor, work, duty and western. In addition, as part of our
strategy of outfitting consumers from head-to-toe, we market complementary
branded apparel and accessories that we believe leverage the strength and
positioning of each of our brands.
Our
products are distributed through three distinct business segments: wholesale,
retail and military. In our wholesale business, we distribute our products
through a wide range of distribution channels representing over ten thousand
retail store locations in the U.S. and Canada. Our wholesale channels vary by
product line and include sporting goods stores, outdoor retailers, independent
shoe retailers, hardware stores, catalogs, mass merchants, uniform stores, farm
store chains, specialty safety stores and other specialty retailers. Our retail
business includes direct sales of our products to consumers through our Lehigh
mobile and retail stores (including a fleet of 70 trucks, supported by 19 small
warehouses that include retail stores, which we refer to as mini-stores), our
Rocky outlet store and our websites. We also sell footwear under the Rocky label
to the U.S. military.
We did
not have any single customer account for more than 10% of consolidated net sales
in 2009, 2008 or 2007.
Estimates
- The preparation of financial statements in conformity with accounting
principles generally accepted in the United States of America requires
management to make estimates and assumptions that affect the reported amounts of
assets and liabilities and disclosure of contingent assets and liabilities at
the date of the financial statements and the reported amounts of revenues and
expenses during the reporting period. Actual results could differ from those
estimates.
Cash and Cash
Equivalents - We consider all highly liquid investments purchased with
original maturities of three months or less to be cash equivalents. Our cash and
cash equivalents are primarily held in four banks. Balances may exceed federally
insured limits.
Trade
Receivables - Trade receivables are presented net of the related
allowance for uncollectible accounts of approximately $1,178,000 and $2,026,000
at December 31, 2009 and 2008, respectively. The allowance for uncollectible
accounts is calculated based on the relative age and size of trade receivable
balances.
F -
7
Concentration of
Credit Risk - We have significant transactions with a large number of
customers. No customer represented 10% of trade receivables - net as of December
31, 2009 and 2008. Our exposure to credit risk is impacted by the economic
climate affecting the retail shoe industry. We manage this risk by performing
ongoing credit evaluations of our customers and maintain reserves for potential
uncollectible accounts.
Supplier and Labor Concentrations - We purchase raw materials from a number of domestic and foreign sources. We currently buy the majority of our waterproof fabric, a component used in a significant portion of our shoes and boots, from one supplier (W.L. Gore & Associates, Inc.). We have had a relationship with this supplier for over 20 years and have no reason to believe that such relationship will not continue.
We
produce a portion of our shoes and boots in our Dominican Republic operation and
in our Puerto Rico operation. We are not aware of any governmental or economic
restrictions that would alter these current operations.
We source
a significant portion of our footwear, apparel and gloves from manufacturers in
the Far East, primarily China. We are not aware of any governmental or economic
restrictions that would alter our current sourcing operations.
Inventories
- Inventories are valued at the lower of cost, determined on a first-in,
first-out (FIFO) basis, or market. Reserves are established for inventories when
the net realizable value (NRV) is deemed to be less than its cost based on our
periodic estimates of NRV.
Fixed
Assets - The Company records fixed assets at historical cost and
generally utilizes the straight-line method of computing depreciation for
financial reporting purposes over the estimated useful lives of the assets as
follows:
|
Years
|
||
|
Buildings
and improvements
|
5-40
|
|
|
Machinery
and equipment
|
3-8
|
|
|
Furniture
and fixtures
|
3-8
|
|
|
Lasts,
dies, and patterns
|
3
|
For
income tax purposes, the Company generally computes depreciation utilizing
accelerated methods.
Identified
intangible assets - Identified intangible assets consist of indefinite
lived trademarks and definite lived trademarks, patents and customer lists.
Indefinite lived intangible assets are not amortized.
If events
or circumstances change, a determination is made by management, in accordance
with the accounting standard for “Property, Plant and Equipment” to ascertain
whether property, equipment and certain finite-lived intangibles have been
impaired based on the sum of expected future undiscounted cash flows from
operating activities. If the estimated net cash flows are less than the carrying
amount of such assets, we will recognize an impairment loss in an amount
necessary to write down the assets to fair value as determined from expected
future discounted cash flows.
F -
8
In
accordance with the accounting standard for “Intangibles – Goodwill and Other”,
we test intangible assets with indefinite lives for impairment annually or when
conditions indicate impairment may have occurred. We perform such testing of our
indefinite-lived intangible assets in the fourth quarter of each year or as
events occur or circumstances change that would more likely than not reduce the
fair value of a reporting unit below its carrying amount.
Advertising
- We expense advertising costs as incurred. Advertising expense was
approximately $5,247,000, $7,005,000, and $6,709,000 for 2009, 2008 and 2007,
respectively.
Revenue
Recognition - Revenue
and related cost of goods sold are recognized at the time products are shipped
to the customer and title transfers. Revenue is recorded net of estimated sales
discounts and returns based upon specific customer agreements and historical
trends.
Shipping
Costs - In accordance with the accounting standard for “Revenue
Recognition,” all shipping costs billed to customers have been included in net
sales. Shipping costs associated with those billed to customers and included in
selling, general and administrative costs totaled approximately $5,547,000,
$7,299,000 and $9,236,000 in 2009, 2008 and 2007, respectively. Our gross profit
may not be comparable to other entities whose shipping and handling is a
component of cost of sales.
Per Share
Information - Basic net income (loss) per common share is computed based
on the weighted average number of common shares outstanding during the period.
Diluted net income per common share is computed similarly but includes the
dilutive effect of stock options. A reconciliation of the shares used in the
basic and diluted income per share computations is as follows:
|
|
Years
Ended December 31,
|
|||||||||||
|
2009
|
2008
|
2007
|
||||||||||
|
Basic
- weighted average shares outstanding
|
5,551,382 | 5,508,614 | 5,476,281 | |||||||||
|
Dilutive
securities - stock options
|
- | 4,816 | - | |||||||||
|
Diluted
- weighted average shares outstanding
|
5,551,382 | 5,513,430 | 5,476,281 | |||||||||
|
Anti-Diluted
securities - stock options
|
387,031 | 404,562 | 472,551 | |||||||||
Comprehensive
Income (Loss) - Comprehensive income (loss) includes changes in equity
that result from transactions and economic events from non-owner sources.
Comprehensive income (loss) is composed of two subsets – net income (loss) and
other comprehensive income (loss).
Fair Value
Measurements – The fair value accounting standard defines fair value,
establishes a framework for measuring fair value, and expands disclosures about
fair value measurements. This standard clarifies how to measure fair value as
permitted under other accounting pronouncements.
The fair
value accounting standard defines fair value as the exchange price that would be
received for an asset or paid to transfer a liability (an exit price) in the
principal or most advantageous market for the asset or liability in an orderly
transaction between market participants at the measurement date. This standard
also establishes a three-level fair value hierarchy that prioritizes the inputs
used to measure fair value. This hierarchy requires entities to maximize the use
of observable inputs and minimize the use of unobservable inputs. The three
levels of inputs used to measure fair value are as follows:
|
|
·
|
Level
1 – Quoted prices in active markets for identical assets or
liabilities.
|
F -
9
|
|
·
|
Level
2 – Observable inputs other than quoted market prices included in Level 1,
such as quoted prices for similar assets and liabilities in active
markets; quoted prices for identical or similar assets and liabilities in
markets that are not active; or other inputs that are observable or can be
corroborated by observable market
data.
|
|
|
·
|
Level
3 – Unobservable inputs that are supported by little or no market activity
and that are significant to the fair value of the assets or liabilities.
This includes certain pricing models, discounted cash flow methodologies
and similar techniques that use significant unobservable
inputs.
|
Reclassifications
– Certain amounts in the accompanying financial statements and footnotes thereto
have been reclassified to conform to the current period’s
presentation.
Recently
Adopted Accounting Pronouncements
FASB
Accounting Standards Codification and the Hierarchy of
GAAP
In
June 2009, the Financial Accounting Standards Board (“FASB”) issued the
FASB Accounting Standards Codification (the “Codification”). The Codification is
the single source for all authoritative GAAP recognized by the FASB to be
applied in the preparation of financial statements of nongovernmental entities
issued for periods ending after September 15, 2009. The Codification
supersedes all existing non-SEC accounting and reporting standards. The
Codification did not change GAAP and did not have a material impact on our
consolidated financial statements.
Fair
Value Measurements
In
January 2009, we adopted the Financial Accounting Standards Board’s (“FASB”)
Statement “Fair Value
Measurements” related to nonfinancial assets and nonfinancial
liabilities. This statement defines fair value, establishes a
framework for measuring fair value in GAAP, and expands disclosures about fair
value measurements. This statement applies whenever another standard
requires (or permits) assets or liabilities to be measured at fair
value. The standard does not expand the use of fair value to any new
circumstances. The adoption of this pronouncement did not have a
material impact on our consolidated financial statements.
Disclosures
about Derivative Instruments and Hedging Activities
In
January 2009, we adopted the FASB’s Statement “Disclosures about Derivative
Instruments and Hedging Activities.” This statement requires
enhanced disclosures about derivative and hedging activities and thereby
improves the transparency of financial reporting. This statement also
encourages, but does not require, comparative disclosures for earlier periods at
initial adoption. The adoption of this pronouncement did not have an
impact on our consolidated financial statements.
F -
10
Non-controlling
Interests in Consolidated Financial Statements
In
January 2009, we adopted the FASB’s statement “Non-controlling Interests in
Consolidated Financial Statements.” This statement improves the
relevance, comparability, and transparency of the financial information that a
company provides in its consolidated financial statements. This statement
requires a company to clearly identify and present ownership interests in
subsidiaries held by parties other than the company in the consolidated
financial statements within the equity section but separate from the company’s
equity. It also requires that the amount of consolidated net income attributable
to the parent and to the non-controlling interest be clearly identified and
presented on the face of the consolidated statement of income; that changes in
ownership interest be accounted for similarly, as equity transactions; and when
a subsidiary is deconsolidated, that any retained non-controlling equity
investment in the former subsidiary and the gain or loss on the deconsolidation
of the subsidiary be measured at fair value. The adoption this pronouncement did
not have an impact on our consolidated financial statements.
Recognition
and Presentation of Other-Than-Temporary Impairments
In June
2009, we adopted the FASB’s statement “Recognition and Presentation of
Other-Than-Temporary Impairments.” This statement provides additional
guidance to provide greater clarity about the credit and noncredit component of
an other-than-temporary impairment event and to improve presentation and
disclosure of other-than-temporary impairments in the financial statements. The
adoption of this pronouncement did not have a material impact on our
consolidated financial statements.
Interim
Disclosures about Fair Value of Financial Instruments
In June
2009, we adopted the FASB’s statement “Interim Disclosures about Fair
Value of Financial Instruments.” This statement requires disclosures
about fair value of financial instruments in interim as well as in annual
financial statements. The adoption of this pronouncement did not have a material
impact on our consolidated financial statements.
Employers’
Disclosures about Postretirement Benefit Plan Assets
In
December 2009, we adopted the FASB’s statement “Employers’ Disclosures about
Postretirement Benefit Plan Assets.” This statement expands the
disclosure requirements to include more detailed disclosures about employers’
plan assets, including employers’ investment strategies, major categories of
plan assets, concentrations of risk within plan assets, and valuation techniques
used to measure the fair value of plan assets. The adoption did not have a
material impact on our consolidated financial statements.
Recently
Issued Accounting Pronouncements
Consolidation
— Variable Interest Entities
In
June 2009, the FASB issued new accounting rules related to the accounting
and disclosure requirements for the consolidation of variable interest entities.
The new accounting rules are effective for the Company’s first fiscal year that
begins after November 15, 2009. We are currently assessing the potential
impact of the adoption of these rules on our consolidated financial statement
disclosures.
F -
11
Accounting
for Transfers of Financial Assets
In
June 2009, the FASB issued new accounting rules for transfers of financial
assets. These new rules require greater transparency and additional disclosures
for transfers of financial assets; the entity’s continuing involvement with
them; and changes the requirements for derecognizing financial assets. The new
accounting rules are effective for financial asset transfers occurring after the
beginning of the Company’s first fiscal year that begins after November 15,
2009. We are currently assessing the potential impact of the adoption of these
rules on our consolidated financial statement disclosures.
Revenue
Arrangements with Multiple Deliverables
In
September 2009, the Emerging Issues Task Force (“EITF”) issued “Revenue Arrangements with Multiple
Deliverables.” This issue addresses how to determine whether
an arrangement involving multiple deliverables contains more than one unit of
accounting, and how to allocate the consideration to each unit of
accounting. This issue eliminates the use of the residual value
method for determining allocation of arrangement consideration; and allows the
use of an entity's best estimate to determine the selling price if vendor
specific objective evidence and third-party evidence cannot be
determined. This issue also requires additional disclosure to provide
both qualitative and quantitative information regarding the significant
judgments made in applying this issue. In addition, for each
reporting period in the initial year of adoption, this issue requires disclosure
of the amount of revenue recognized subject to the measurement requirements of
this issue and the amount of revenue that would have been recognized if the
related transactions were subject to the measurement requirements of Issue
00-21. This issue is effective for revenue arrangements entered into
or materially modified in fiscal years beginning after June 15,
2010. Early adoption is permitted. We are currently
assessing the potential impact of the adoption of these rules on our
consolidated financial statement disclosures.
Fair
Value Measurements
In
January 2010, the FASB issued “Fair Value Measurements and
Disclosures - Improving Disclosures about Fair Value
Measurements.” This statement requires some new disclosures
and clarifies some existing disclosure requirements about fair value measurement
as set forth in FASB Statement “Fair Value Measurement”. The
amendments are effective for interim and annual reporting periods beginning
after December 15, 2009, except for the disclosures about purchases, sales,
issuances, and settlements in the roll forward of activity in Level 3 fair value
measurements. Those disclosures are effective for fiscal years
beginning after December 15, 2010, and for interim periods within those fiscal
years. The adoption of this pronouncement should not have an impact
on our consolidated financial statement disclosures.
F -
12
|
2.
|
INVENTORIES
|
Inventories
are comprised of the following:
|
December
31,
|
||||||||
|
2009
|
2008
|
|||||||
|
Raw
materials
|
$ | 5,438,055 | $ | 7,311,837 | ||||
|
Work-in-process
|
497,914 | 351,951 | ||||||
|
Finished
goods
|
49,522,542 | 62,676,986 | ||||||
|
Reserve
for obsolescence or
|
||||||||
|
lower
of cost or market
|
(38,044 | ) | (38,600 | ) | ||||
|
Total
|
$ | 55,420,467 | $ | 70,302,174 | ||||
|
3.
|
IDENTIFIED
INTANGIBLE ASSETS
|
A
schedule of identified intangible assets is as follows:
|
Gross
|
Accumulated
|
Carrying
|
||||||||||
|
December 31, 2009
|
Amount
|
Amortization
|
Amount
|
|||||||||
|
Trademarks
|
||||||||||||
|
Wholesale
|
$ | 27,243,578 | $ | - | $ | 27,243,578 | ||||||
|
Retail
|
2,900,000 | - | 2,900,000 | |||||||||
|
Patents
|
2,388,999 | 2,015,667 | 373,332 | |||||||||
|
Customer
Relationships
|
1,000,000 | 1,000,000 | - | |||||||||
|
Total
Intangibles
|
$ | 33,532,577 | $ | 3,015,667 | $ | 30,516,910 | ||||||
|
Gross
|
Accumulated
|
Carrying
|
||||||||||
|
December 31, 2008
|
Amount
|
Amortization
|
Amount
|
|||||||||
|
Trademarks
|
||||||||||||
|
Wholesale
|
$ | 27,243,578 | $ | - | $ | 27,243,578 | ||||||
|
Retail
|
2,900,000 | - | 2,900,000 | |||||||||
|
Patents
|
2,309,541 | 1,632,641 | 676,900 | |||||||||
|
Customer
Relationships
|
1,000,000 | 800,000 | 200,000 | |||||||||
|
Total
Intangibles
|
$ | 33,453,119 | $ | 2,432,641 | $ | 31,020,478 | ||||||
Amortization
expense related to finite-lived intangible assets was approximately $583,000,
$666,000 and $664,000 in 2009, 2008 and 2007, respectively. Such amortization
expense will be approximately $46,000 for 2010 and $44,000 for 2011 through
2014.
The
weighted average lives of patents and customer relationships are 5
years.
Intangible
assets, including trademarks and patents are reviewed for impairment annually,
and more frequently, if necessary. We perform such testing of indefinite-lived
intangible assets in the fourth quarter of each year or as events occur or
circumstances change that would more likely than not reduce the fair value of
the asset below its carrying amount. Fair value, for the testing, of other
indefinite-lived intangible assets is determined using the relief from royalty
method.
F -
13
In
assessing whether indefinite-lived intangible assets are impaired, we must make
certain estimates and assumptions regarding future cash flows, long-term growth
rates of our business, operating margins, weighted average cost of capital and
other factors such as; discount rates, royalty rates, cost of capital, and
market multiples to determine the fair value of our assets. These estimates and
assumptions require management’s judgment, and changes to these estimates and
assumptions could materially affect the determination of fair value and/or
impairment for each of our indefinite-lived intangible assets. Future events
could cause us to conclude that indications of intangible asset impairment
exist. Impairment may result from, among other things, deterioration in the
performance of our business, adverse market conditions, adverse changes in
applicable laws and regulations, competition, or the sale or disposition of a
reporting segment. Any resulting impairment loss could have a material adverse
impact on our financial condition and results of operations.
We
evaluate our finite and indefinite lived trademarks under the terms and
provisions of the accounting standards for “Intangibles - Goodwill and Other”;
and “Property, Plant and Equipment.” These pronouncements require that we
compare the fair value of an intangible asset with its carrying amount. Our 2009
evaluation did not result in the impairment of any of our indefinite lived
intangible assets.
As a
result of our 2008 evaluation, we recognized impairment losses on the carrying
values of the Lehigh and Gates trademarks in the amounts of $4.0 million and
$0.9 million, respectively, in the fourth quarter of 2008. We estimated fair
value based on projections of the future cash flows for each of the trademarks.
We then compared the carrying value for each trademark to its estimated fair
value. Since the fair value of the trademark was less than its carrying value we
recognized the reductions in fair value as non-cash intangible impairment
charges in our 2008 operating expenses. These charges are reflected in operating
expenses under the caption, “Non-cash intangible impairment charges.” The Lehigh
trademark is reported under our Retail segment. The Gates trademark is reported
under our Wholesale segment.
As a
result of our 2007 evaluation, we recognized an impairment loss on the entire
carrying value of our goodwill in the amount of $24.9 million in the fourth
quarter of 2007. This evaluation indicated that the entire amount of goodwill
was impaired, principally due to weakness in the calculated enterprise value in
comparison to the carrying value. This charge is reflected in operating expenses
under the caption, “Non-cash intangible impairment charges.” Because the trading
value of our shares indicated a level of equity market capitalization below our
book value at the time of the annual impairment test, there was indication that
our goodwill could be impaired. In performing the first step of the impairment
test, the company valued the wholesale segment, for which all the goodwill
applied, based on the guideline company method. The companies we selected are
publicly traded wholesale competitors who manufacture shoes and apparel. While
the selected companies may differ from the wholesale division in terms of the
specific products they provide, they have similar financial risks and operating
performance and reflect current economic conditions for the footwear and apparel
industry in general. As a result of this analysis, it was determined that an
indication of impairment did exist and the results of the second step of the
impairment test resulted in an impairment of $24.9 million; or $23.5 million,
net of tax benefit; to our goodwill.
F -
14
|
4.
|
OTHER
ASSETS
|
Other
assets consist of the following:
|
December
31,
|
||||||||
|
2009
|
2008
|
|||||||
|
Deferred
financing costs
|
$ | 2,010,624 | $ | 1,328,771 | ||||
|
Prepaid
royalties
|
446,595 | 643,050 | ||||||
|
Other
|
435,464 | 480,680 | ||||||
|
Total
|
$ | 2,892,683 | $ | 2,452,501 | ||||
|
5.
|
FIXED
ASSETS
|
Fixed
assets are comprised of the following:
|
December
31,
|
||||||||
|
2009
|
2008
|
|||||||
|
Land
|
$ | 671,035 | $ | 671,035 | ||||
|
Buildings
|
17,589,521 | 17,387,532 | ||||||
|
Machinery
and equipment
|
28,698,770 | 27,044,564 | ||||||
|
Furniture
and fixtures
|
4,259,742 | 4,202,216 | ||||||
|
Lasts,
dies and patterns
|
13,804,952 | 12,842,480 | ||||||
|
Construction
work-in-progress
|
203,614 | 14,419 | ||||||
|
Total
|
65,227,634 | 62,162,246 | ||||||
|
Less
- accumulated depreciation
|
(42,557,758 | ) | (38,612,927 | ) | ||||
|
Net
Fixed Assets
|
$ | 22,669,876 | $ | 23,549,319 | ||||
We
incurred approximately $5,739,000, $5,765,000 and $5,098,000 in depreciation
expense for 2009, 2008 and 2007, respectively.
|
6.
|
LONG-TERM
DEBT
|
Long-term
debt is comprised of the following:
|
December
31,
|
||||||||
|
2009
|
2008
|
|||||||
|
Bank
- revolving credit facility
|
$ | 13,081,791 | $ | 44,749,084 | ||||
|
Term
loans
|
40,000,000 | 40,000,000 | ||||||
|
Real
estate obligations
|
2,309,140 | 2,661,695 | ||||||
|
Other
|
200,715 | 328,883 | ||||||
|
Total
|
55,591,646 | 87,739,662 | ||||||
|
Less
- current maturities
|
511,870 | 480,723 | ||||||
|
Net
long-term debt
|
$ | 55,079,776 | $ | 87,258,939 | ||||
F -
15
In March
2009, we amended the terms of our revolving credit facility with GMAC Commercial
Finance (“GMAC”) which was set to expire on January 5, 2010. The size
of the facility was reduced to $85 million from $100 million and the maturity
date was extended to April 30, 2012. The interest rates for the term
of this amendment are LIBOR plus 3.75% or prime plus 2.25%, at our
option. The financing costs associated with this amendment totaled
approximately $1.5 million.
The total
amount available on our revolving credit facility is subject to a borrowing base
calculation based on various percentages of accounts receivable and inventory.
As of December 31, 2009, we had $13.1 million in borrowings under this
facility and total capacity of $50.0 million.
In May
2007, we entered into a Note Purchase Agreement, totaling $40 million, with
Laminar Direct Capital L.P., Whitebox Hedged High Yield Partners, L.P. and GPC
LIX L.L.C., and issued notes to them for $20 million, $17.5 million and $2.5
million, respectively, at an interest rate of 11.5% payable semi-annually over
the five year term of the notes. Principal repayment is due at
maturity in May 2012. The proceeds from these notes were used to pay
down the GMAC Commercial Finance (“GMAC”) term loans which totaled approximately
$17.5 million and the $15 million American Capital Strategies, LTD (“ACAS”) term
loan. The balance of the proceeds, net of debt acquisition costs of
approximately $1.5 million, was used to reduce the outstanding balance on the
revolving credit facility. The Note Purchase Agreement is secured by
a security interest in our assets and is subordinate to the security interest
under the GMAC line of credit.
Our
credit facilities contain certain restrictive covenants which require us to
maintain fixed charge coverage ratios; and places limits on the amount of our
annual capital expenditures. Our credit facility places a restriction
on the amount of dividends that may be paid. At December 31, 2009, we
had no retained earnings available for the payment of dividends. As
of December 31, 2009, we were in compliance with these restrictive
covenants.
Long-term
debt maturities are as follows for the years ended December 31:
|
2010
|
$ | 511,870 | ||
|
2011
|
487,481 | |||
|
2012
|
53,533,305 | |||
|
2013
|
490,327 | |||
|
2014
|
532,476 | |||
|
Thereafter
|
36,187 | |||
|
Total
|
$ | 55,591,646 |
As of
December 31, 2009, our real estate obligations incur interest at a rate of
8.275%.
|
7.
|
OPERATING
LEASES
|
We lease
certain machinery, trucks, and facilities under operating leases that generally
provide for renewal options. We incurred approximately $3,258,872,
$3,297,618 and $3,613,000 in rent expense under operating lease arrangements for
2009, 2008 and 2007, respectively.
F -
16
Future
minimum lease payments under non-cancelable operating leases are as follows for
the years ended December 31:
|
2010
|
$ | 1,500,159 | ||
|
2011
|
1,068,607 | |||
|
2012
|
714,867 | |||
|
2013
|
397,505 | |||
|
2014
|
82,125 | |||
|
Total
|
$ | 3,763,263 |
|
8.
|
FINANCIAL
INSTRUMENTS
|
During
2008, we adopted a new accounting standard issued by the FASB, related to fair
value measurements and disclosures.
Fair
value measures are classified into a three-tiered fair value hierarchy, which
prioritizes the inputs used in measuring fair values as follows:
|
|
·
|
Level
1 - Observable inputs such as quoted prices in active
markets.
|
|
|
·
|
Level
2 - Inputs, other than quoted prices in active markets, that are
observable either directly or
indirectly.
|
|
|
·
|
Level
3 - Unobservable inputs in which there is little or no market data, which
require a reporting entity to develop its own
assumptions.
|
Assets
and liabilities measured at fair value are based on one or more of the following
valuation techniques:
|
|
·
|
Market
approach (Level 1) - Prices and other relevant information generated by
market transactions involving identical or comparable assets or
liabilities.
|
|
|
·
|
Cost
approach (Level 2) - Amount that would be required to replace the service
capacity of an asset (replacement
cost).
|
|
|
·
|
Income
approach (Level 3) - Techniques to convert future amounts to a single
present amount based on market expectations (including present-value
techniques, option-pricing and excess earning
models).
|
The fair
values of cash, accounts receivable, other receivables and accounts payable
approximated their carrying values because of the short-term nature of these
instruments. Accounts receivable consists primarily of amounts due
from our customers, net of allowances. Other receivables consist
primarily of amounts due from employees (sales persons’ advances in excess of
commissions earned and employee travel advances); other customer receivables,
net of allowances; and expected insurance recoveries. The carrying
amounts of the mortgages and other short-term financing obligations also
approximate fair value, as they are comparable to the available financing in the
marketplace during the year.
F -
17
The
carrying amount and fair value of our long-term debt not measured on a recurring
basis subject to fair value reporting is as follows:
| 2009 |
2008
|
|||||||||||||||
|
Fair
|
Fair
|
|||||||||||||||
|
Carrying
|
Value
|
Carrying
|
Value
|
|||||||||||||
|
Amount
|
(Level 2)
|
Amount
|
(Level 2)
|
|||||||||||||
|
Debt
|
||||||||||||||||
|
Long-term
debt and current maturities
|
$ | 55,591,647 | $ | 53,655,448 | $ | 87,739,662 | $ | 83,474,798 | ||||||||
We
estimated the fair value of debt using market quotes and calculations based on
market rates.
|
9.
|
INCOME
TAXES
|
The
Company accounts for income taxes in accordance with the accounting standard for
Income Taxes, which requires an asset and liability approach to financial
accounting and reporting for income taxes. Accordingly, deferred income taxes
have been provided for the temporary differences between the financial reporting
and the income tax basis of the Company’s assets and liabilities by applying
enacted statutory tax rates applicable to future years to the basis
differences.
|
Years
Ended December 31,
|
||||||||||||
|
2009
|
2008
|
2007
|
||||||||||
|
Federal:
|
||||||||||||
|
Current
|
$ | (70,496 | ) | $ | 1,871,007 | $ | 194,685 | |||||
|
Deferred
|
333,197 | (2,145,508 | ) | (1,415,442 | ) | |||||||
|
Total
Federal
|
262,701 | (274,501 | ) | (1,220,757 | ) | |||||||
|
State
& local:
|
||||||||||||
|
Current
|
186,574 | 163,906 | 59,522 | |||||||||
|
Deferred
|
4,540 | (675,680 | ) | (355,883 | ) | |||||||
|
Total
State & local
|
191,114 | (511,774 | ) | (296,361 | ) | |||||||
|
Foreign
|
||||||||||||
|
Current
|
238,326 | 109,616 | 84,365 | |||||||||
|
Deferred
|
(15,626 | ) | 48,994 | (6,829 | ) | |||||||
|
Total
Foreign
|
222,700 | 158,610 | 77,536 | |||||||||
|
Total
|
$ | 676,515 | $ | (627,665 | ) | $ | (1,439,582 | ) | ||||
F -
18
A
reconciliation of recorded Federal income tax expense (benefit) to the expected
expense (benefit) computed by applying the applicable Federal statutory rate for
all periods to income before income taxes follows:
|
Years
Ended December 31,
|
||||||||||||
|
2009
|
2008
|
2007
|
||||||||||
|
Expected
expense (benefit) at statutory rate
|
$ | 653,852 | $ | 191,538 | $ | (8,589,116 | ) | |||||
|
Increase
(decrease) in income taxes resulting from:
|
||||||||||||
|
Exempt
income from Dominican Republic operations due to tax
holiday
|
(842,277 | ) | (670,105 | ) | (563,920 | ) | ||||||
|
Tax
on repatriated earnings from Dominican Republic operations
|
842,277 | 464,116 | 563,920 | |||||||||
|
Goodwill
impairment
|
- | - | 7,374,919 | |||||||||
|
State
and local income taxes
|
47,045 | (114,095 | ) | (248,867 | ) | |||||||
|
Section
199 manufacturing deduction
|
(2,041 | ) | (37,152 | ) | (13,711 | ) | ||||||
|
Meals
and entertainment
|
71,254 | 69,420 | 85,958 | |||||||||
|
Nondeductible
penalties
|
2,010 | 51,183 | 19,556 | |||||||||
|
Stock
compensation expense
|
- | 34,107 | 77,749 | |||||||||
|
Provision
to return filing adjustment
|
(95,605 | ) | (616,677 | ) | (146,070 | ) | ||||||
|
Other
— net
|
- | - | - | |||||||||
|
Total
|
$ | 676,515 | $ | (627,665 | ) | $ | (1,439,582 | ) | ||||
F -
19
Deferred
income taxes recorded in the consolidated balance sheets at December 31, 2009
and 2008 consist of the following:
|
December
31,
|
||||||||
|
2009
|
2008
|
|||||||
|
Deferred
tax assets:
|
||||||||
|
Asset
valuation allowances and accrued expenses
|
$ | 2,793,624 | $ | 3,343,150 | ||||
|
Inventories
|
407,844 | 539,938 | ||||||
|
State
and local income taxes
|
288,310 | 286,864 | ||||||
|
Pension
and deferred compensation
|
326,867 | 131,124 | ||||||
|
Net
operating losses
|
693,989 | 772,978 | ||||||
|
Total
deferred tax assets
|
4,510,634 | 5,074,054 | ||||||
|
Valuation
allowances
|
(582,343 | ) | (640,068 | ) | ||||
|
Total
deferred tax assets
|
3,928,291 | 4,433,986 | ||||||
|
Deferred
tax liabilities:
|
||||||||
|
Fixed
assets
|
(492,243 | ) | (669,214 | ) | ||||
|
Intangible
assets
|
(10,324,861 | ) | (10,336,591 | ) | ||||
|
Other
assets
|
(327,859 | ) | (319,868 | ) | ||||
|
Tollgate
tax on Lifestyle earnings
|
(379,271 | ) | (379,271 | ) | ||||
|
Total
deferred tax liabilities
|
(11,524,234 | ) | (11,704,944 | ) | ||||
|
Net
deferred tax liability
|
$ | (7,595,943 | ) | $ | (7,270,958 | ) | ||
|
Deferred
income taxes - current
|
$ | 1,475,694 | $ | 2,167,966 | ||||
|
Deferred
income taxes - non-current
|
(9,071,639 | ) | (9,438,921 | ) | ||||
| $ | (7,595,945 | ) | $ | (7,270,955 | ) | |||
The
valuation allowance is related to certain state and local income tax net
operating losses.
We have
provided Puerto Rico tollgate taxes on approximately $3,684,000 of accumulated
undistributed earnings of Lifestyle prior to the fiscal year ended June 30,
1994, that would be payable if such earnings were repatriated to the United
States. In 2001, we received abatement for Puerto Rico tollgate taxes
on all earnings subsequent to June 30, 1994, thus no other provision for
tollgate tax has been made on earnings after that date. If we
repatriate the earnings from Lifestyle, approximately $379,000 of tollgate tax
would be due.
As of
December 31, 2009, we had approximately $13,130,000 of undistributed earnings
from non-U.S. subsidiaries that are intended to be permanently reinvested in
non-U.S. operations. Because these earnings are considered
permanently reinvested, no U.S. tax provision has been accrued related to the
repatriation of these earnings. If the Five Star and Rocky Canada
undistributed earnings were distributed to the Company in the form of dividends,
the related taxes on such distributions would be approximately $3,801,000 and
$795,000, respectively.
On
January 1, 2007, we adopted the provisions of the accounting standard for Income
Taxes relating to uncertain tax provisions. We did not have any unrecognized tax
benefits and there was no effect on our financial condition or results of
operations as a result of implementing the provisions of this accounting
standard.
F -
20
We file
income tax returns in the U.S. Federal jurisdiction and various state and
foreign jurisdictions. We are no longer subject to U.S. Federal tax
examinations for years before 2006. State jurisdictions that remain
subject to examination range from 2005 to 2008. Foreign jurisdiction
(Canada and Puerto Rico) tax returns that remain subject to examination range
from 2003 to 2008. We do not believe there will be any material
changes in our unrecognized tax positions over the next 12 months.
Our
policy is to recognize interest and penalties accrued on any unrecognized tax
benefits as a component of income tax expense. As of the date of adoption of the
accounting standard for Income Taxes relating to uncertain tax provisions,
accrued interest or penalties were not material, and no such expenses were
recognized during the year.
|
10.
|
RETIREMENT
PLANS
|
We
sponsor a noncontributory defined benefit pension plan covering our non-union
workers in our Ohio and Puerto Rico operations. Benefits under the
non-union plan are based upon years of service and highest compensation levels
as defined. We contribute to the plan the minimum amount required by
regulation. On December 31, 2005 we froze the noncontributory defined
benefit pension plan for all non-U.S. territorial employees.
The
accounting standard for Compensation – Retirement Benefits requires a fiscal
year end measurement of plan assets and benefit obligations, eliminating the use
of earlier measurement dates previously permissible. The new
measurement date requirement was effective for fiscal years ending after
December 15, 2008. As a result, we changed our measurement date to
December 31 and recognized the pension expense related to the period October 1,
2007 through December 31, 2007 as an adjustment to the January 1, 2008 beginning
retained earnings and accumulated other comprehensive loss.
As a
result of the change in measurement date, we recognized the increase in the
under-funded status of the defined benefit pension plan between September 30,
2007 and December 31, 2007 of $846,071, as well as the corresponding increase in
accumulated other comprehensive loss of $526,850 and related decrease in our
deferred tax liability of $296,125. The increase in accumulated other
comprehensive loss of $526,850 has been recognized as an adjustment to the
opening balance of accumulated other comprehensive loss as of January 1,
2008. We also recognized the net pension expense of $23,095 relating
to the period October 1, 2007 through December 31, 2007 as a reduction of the
opening balance of retained earnings as of January 1, 2008.
F -
21
The
funded status of the Company’s plan and reconciliation of accrued pension cost
at December 31, 2009 and 2008 are presented below (information with respect
to benefit obligations and plan assets are as of December 31):
|
December
31,
|
||||||||
|
2009
|
2008
|
|||||||
|
Change
in benefit obligation:
|
||||||||
|
Projected
benefit obligation at beginning of the year
|
$ | 10,024,643 | $ | 9,809,903 | ||||
|
Impact
of adoption of the Compensation – Retirement
|
||||||||
|
Benefits
accounting standard change in measurment date
|
- | (97,223 | ) | |||||
|
Service
cost
|
115,372 | 107,851 | ||||||
|
Interest
cost
|
605,817 | 572,246 | ||||||
|
Change
in discount rate
|
- | - | ||||||
|
Curtailment
decrease
|
- | - | ||||||
|
Actuarial
(gain)/loss
|
816,376 | - | ||||||
|
Benefits
paid
|
(380,658 | ) | (368,134 | ) | ||||
|
Projected
benefit obligation at end of year
|
$ | 11,181,550 | $ | 10,024,643 | ||||
|
Change
in plan assets:
|
||||||||
|
Fair
value of plan assets at beginning of year
|
$ | 6,281,091 | $ | 9,684,179 | ||||
|
Impact
of adoption of the Compensation – Retirement
|
||||||||
|
Benefits
accounting standard change in measurment date
|
- | (943,294 | ) | |||||
|
Actual
return on plan assets
|
991,242 | (2,091,660 | ) | |||||
|
Benefits
paid
|
(380,658 | ) | (368,134 | ) | ||||
|
Fair
value of plan assets at end of year
|
$ | 6,891,675 | $ | 6,281,091 | ||||
|
Funded
status:
|
||||||||
|
Underfunded
|
$ | (4,289,875 | ) | $ | (3,743,552 | ) | ||
|
Remaining
unrecognized benefit obligation existing at transition
|
- | - | ||||||
|
Unrecognized
prior service costs due to plan amendments
|
- | - | ||||||
|
Unrecognized
net loss
|
- | - | ||||||
|
Total
|
$ | (4,289,875 | ) | $ | (3,743,552 | ) | ||
|
Amounts
in accumulated other comprehensive income that have not yet been
recognized as net pension cost:
|
||||||||
|
Remaining
unrecognized benefit obligation existing at transition
|
$ | - | $ | - | ||||
|
Unrecognized
prior service costs due to plan amendments
|
326,043 | 398,435 | ||||||
|
Unrecognized
net loss
|
4,774,048 | 4,709,603 | ||||||
|
Total
|
$ | 5,100,091 | $ | 5,108,038 | ||||
|
Amounts
recognized in the consolidated financial statements:
|
||||||||
|
Pension
liability
|
$ | (4,289,875 | ) | $ | (3,743,552 | ) | ||
|
Accumulated
other comprehensive loss, net of tax effect of $1,882,947 for 2009 and
$1,885,823 for 2008
|
3,217,144 | 3,222,215 | ||||||
|
Net
amount recognized
|
$ | (1,072,731 | ) | $ | (521,337 | ) | ||
|
Accumulated
benefit obligation
|
$ | 11,581,550 | $ | 9,906,852 | ||||
|
Of
the amounts in accumulated other comprehensive income as of December 31,
2009, we expect the following
to
be recognized as net pension cost in 2010:
|
||||||||
|
Remaining
unrecognized benefit obligation existing at transition
|
$ | - | ||||||
|
Unrecognized
prior service costs due to plan amendments
|
72,392 | |||||||
|
Unrecognized
net loss
|
287,413 | |||||||
|
Total
|
$ | 359,805 | ||||||
F -
22
Net
pension cost of our plan is as follows:
|
Years Ended December 31,
|
||||||||||||
|
2009
|
2008
|
2007
|
||||||||||
|
Service
cost
|
$ | 115,372 | $ | 107,851 | $ | 105,197 | ||||||
|
Interest
cost
|
605,817 | 572,246 | 558,025 | |||||||||
|
Expected
return on assets
|
(486,454 | ) | (685,251 | ) | (716,956 | ) | ||||||
|
Amortization
of unrecognized net loss
|
247,143 | 68,673 | - | |||||||||
|
Amortization
of unrecognized transition obligation
|
- | 4,036 | 10,762 | |||||||||
|
Amortization
of unrecognized prior service cost
|
72,392 | 73,913 | 91,529 | |||||||||
|
Net
periodic pension cost
|
$ | 554,270 | $ | 141,468 | $ | 48,557 | ||||||
Our
unrecognized benefit obligation existing at the date of transition for the plan
is being amortized over 21 years. Actuarial assumptions used in the
accounting for the plan was as follows:
|
December 31,
|
||||||||
|
2009
|
2008
|
|||||||
|
Discount
rate
|
6.00 | % | 6.00 | % | ||||
|
Average
rate increase in compensation levels
|
3.00 | % | 3.00 | % | ||||
|
Expected
long-term rate of return on plan assets
|
8.00 | % | 8.00 | % | ||||
Our
pension plan’s asset allocations at December 31, 2009 and 2008 by asset category
are:
|
December 31,
|
||||||||
|
2009
|
2008
|
|||||||
|
Rocky
common stock
|
8.0 | % | 4.6 | % | ||||
|
Other
equity securities
|
53.0 | % | 45.4 | % | ||||
|
Municipal
bonds
|
21.0 | % | 37.8 | % | ||||
|
Cash
and cash equivalents
|
18.0 | % | 11.9 | % | ||||
|
Accrued
income
|
0.0 | % | 0.3 | % | ||||
|
Total
|
100.0 | % | 100.0 | % | ||||
Our
investment objectives are to: (1) maintain the purchasing power of
the current assets and all future contributions; (2) maximize return within
reasonable and prudent levels of risk; (3) maintain an appropriate asset
allocation policy (approximately 80% equity securities and 20% debt securities)
that is compatible with the actuarial assumptions, while still having the
potential to produce positive returns; and (4) control costs of administering
the plan and managing the investments.
Our
desired investment result is a long-term rate of return on assets that is at
least 8%. The target rate of return for the plans have been based
upon the assumption that returns will approximate the long-term rates of return
experienced for each asset class in our investment policy. Our
investment guidelines are based upon an investment horizon of greater than five
years, so that interim fluctuations should be viewed with appropriate
perspective. Similarly, the Plans’ strategic asset allocation is
based on this long-term perspective.
F -
23
The
expected benefit payments for pensions are as follows for the years ended
December 31:
|
2010
|
$ | 478,000 | ||
|
2011
|
491,000 | |||
|
2012
|
575,000 | |||
|
2013
|
592,000 | |||
|
2014
|
609,000 | |||
|
Thereafter
|
3,552,000 | |||
|
Total
|
$ | 6,297,000 |
We
anticipate making a contribution of approximately $700,000 to the pension plan
in 2010.
Our
overall investment strategy is to achieve a balanced return of income and growth
of principal for long-term growth and for near-term benefit payments with a
diversification of asset types and fund strategies. The target
allocation for plan assets is generally 55% equity, 40% fixed income and 5%
cash. Of the target allocation for equity securities, approximately
60% is allocated to U.S. large-cap, 20% to U.S. mid and small-cap companies and
20% to international equity. The target allocation for fixed income
is allocated 100% to government securities.
The fair
values of our pension plan assets at December 31, 2009, by asset category are as
follows:
|
December 31, 2009
|
||||||||||||||||
|
Other
|
||||||||||||||||
|
significant
|
Significant
|
|||||||||||||||
|
Quoted
|
observable
|
unobservable
|
||||||||||||||
|
Prices
|
inputs
|
inputs
|
||||||||||||||
|
Asset Category
|
(Level 1)
|
(Level 2)
|
(Level 3)
|
Total
|
||||||||||||
|
Cash
and cash equivalents
|
$ | 1,207,701 | $ | - | $ | - | $ | 1,207,701 | ||||||||
|
Equity
Securities:
|
||||||||||||||||
|
U.
S. companies
|
3,760,277 | - | - | 3,760,277 | ||||||||||||
|
International
companies
|
474,087 | - | - | 474,087 | ||||||||||||
|
Government
securites:
|
||||||||||||||||
|
U.S.
government agencies
|
754,610 | - | - | 754,610 | ||||||||||||
|
Municipal
obligations
|
695,000 | - | - | 695,000 | ||||||||||||
| $ | 6,891,675 | $ | - | $ | - | $ | 6,891,675 | |||||||||
We also
sponsor a 401(k) savings plan for substantially all of our
employees. We provide a contribution of 3% of applicable salary to
the plan for all employees with greater than six months of
service. Additionally, we match eligible employee contributions at a
rate of 0.25%, per one percent of applicable salary contributed to the plan by
the employee. This matching contribution will be made by us up to a
maximum of 1% of the employee’s applicable salary for all qualified
employees. Our contributions to the 401(k) plan were approximately
$1.0 million in 2009 and $1.1 million in, 2008 and 2007.
|
11.
|
COMMITMENTS
AND CONTINGENCIES
|
We are,
from time to time, a party to litigation which arises in the normal course of
its business. Although the ultimate resolution of pending proceedings
cannot be determined, in the opinion of management, the resolution of such
proceedings in the aggregate will not have a material adverse effect on our
financial position, results of operations, or liquidity.
F -
24
|
12.
|
CAPITAL
STOCK AND STOCK BASED COMPENSATION
|
The
Company has authorized 250,000 shares of voting preferred stock without par
value. No shares are issued or outstanding. Also, the
Company has authorized 250,000 shares of non-voting preferred stock without par
value. Of these, 125,000 shares have been designated Series A
non-voting convertible preferred stock with a stated value of $.06 per share, of
which no shares are issued or outstanding at December 31, 2009 and 2008,
respectively.
In June
2009, our Board of Directors adopted a Rights Agreement, which provides for one
preferred share purchase right to be associated with each share of our
outstanding common stock. Shareholders exercising these rights would
become entitled to purchase shares of Series B Junior Participating Cumulative
Preferred Stock. The rights are exercisable after the time when a
person or group of persons without the approval of the Board of Directors
acquire beneficial ownership of 20 percent or more of our common stock or
announce the initiation of a tender or exchange offer which if successful would
cause such person or group to beneficially own 20 percent or more of the common
stock. Such exercise would ultimately entitle the holders of the
rights to purchase at the exercise price, shares of common stock of the
surviving corporation or purchaser, respectively, with an aggregate market value
equal to two times the exercise price. The person or groups effecting
such 20 percent acquisition or undertaking such tender offer would not be
entitled to exercise any rights. These rights expire during July
2012.
During
2006, the shareholders voted to increase our authorized shares from
10,000,000 to 25,000,000.
On
January 1, 2006, we adopted the provisions of the accounting standard for
Compensation – Stock Compensation, which requires that companies measure and
recognize compensation expense at an amount equal to the fair value of
share-based payments granted under compensation arrangements. Prior
to January 1, 2006, the Company accounted for its stock-based compensation plans
under the recognition and measurement principles of the accounting standard for
“Compensation – Stock Compensation,” and recognized no compensation expense for
stock option grants because all options granted had an exercise price equal to
the market value of the underlying common stock on the date of
grant.
We
adopted this standard using the “modified prospective” method, which results in
no restatement of prior period amounts. Under this method, the
provisions of the accounting standard for “Compensation – Stock Compensation”
apply to all awards granted or modified after the date of
adoption. In addition, compensation expense must be recognized for
any unvested stock option awards outstanding as of the date of adoption on a
straight-line basis over the remaining vesting period. We calculate
the fair value of options using a Black-Scholes option pricing
model. For the twelve-month period ended December 31, 2006, our
compensation expense related to stock option grants was approximately
$391,674. The impact per share of the adoption of the accounting
standard for “Compensation – Stock Compensation” was $0.07 for both basic and
diluted earnings per share.
F -
25
On
October 11, 1995, we adopted the 1995 Stock Option Plan which provides for the
issuance of options to purchase up to 400,000 common shares. In May
1998, we adopted the Amended and Restated 1995 Stock Option Plan which provides
for the issuance of options to purchase up to an additional 500,000 common
shares. In addition in May 2002, our shareholders approved the
issuance of a total of 400,000 additional common shares of our stock under the
1995 Stock Option Plan. All employees, officers, directors,
consultants and advisors providing services to us are eligible to receive
options under the Plans. On May 11, 2004 our shareholders approved
the 2004 Stock Incentive Plan. The 2004 Stock Incentive Plan includes
750,000 of our common shares that may be granted for stock options and
restricted stock awards. As of December 31, 2009, the Company is authorized to
issue 376,103 options under the 2004 Stock Incentive Plan; no options can be
granted under the amended and restated 1995 Stock Option Plan.
The plans
generally provide for grants with the exercise price equal to fair value on the
date of grant, graduated vesting periods of up to 5 years, and lives not
exceeding 10 years.
The
following summarizes stock option transactions from January 1, 2008 through
December 31, 2009:
|
Number of
Options
|
Weighted
Average
Exercise
Price
|
Weighted
Average
Remaining
Actual Term
|
Aggregate
Intrinsic Value
|
|||||||||||||
|
Outstanding
at December 31, 2007
|
472,551 | $ | 15.37 | |||||||||||||
|
Issued
|
- | $ | - | |||||||||||||
|
Exercised
|
(8,500 | ) | $ | 3.88 | ||||||||||||
|
Forfeited
|
(28,250 | ) | $ | 10.88 | ||||||||||||
|
Outstanding
at December 31, 2008
|
435,801 | $ | 15.88 | 2.5 | $ | 1,980 | ||||||||||
|
Options
exercisable at December 31, 2008
|
412,051 | $ | 15.80 | 2.3 | $ | 1,980 | ||||||||||
|
Unvested
options at December 31, 2008
|
23,750 | $ | 17.27 | 5.7 | $ | - | ||||||||||
|
Outstanding
at December 31, 2008
|
435,801 | $ | 15.88 | |||||||||||||
|
Issued
|
- | $ | - | |||||||||||||
|
Exercised
|
(29,250 | ) | $ | 5.63 | ||||||||||||
|
Forfeited
|
(71,301 | ) | $ | 8.97 | ||||||||||||
|
Outstanding
at December 31, 2009
|
335,250 | $ | 18.25 | 1.6 | $ | 188,358 | ||||||||||
|
Options
exercisable at December 31, 2009
|
335,250 | $ | 18.25 | 1.6 | $ | 188,358 | ||||||||||
|
Unvested
options at December 31, 2009
|
- | $ | - | 0 | $ | - | ||||||||||
|
Fair
value of options granted during the year:
|
||||||||||||||||
|
2009
|
$ | - | ||||||||||||||
|
2008
|
$ | - | ||||||||||||||
|
2007
|
$ | 7.82 | ||||||||||||||
F -
26
In
determining the estimated fair value of each option granted on the date of grant
we use the Black-Scholes option-pricing model with the following
weighted-average assumptions used for grants:
|
2009
|
2008
|
2007
|
||||||||||
|
Dividend
yields
|
- | * | - | * | 0 | % | ||||||
|
Expected
volatility
|
- | * | - | * | 51 | % | ||||||
|
Risk-free
interest rates
|
- | * | - | * | 4.76 | % | ||||||
|
Expected
life
|
- | * | - | * | 6 | |||||||
|
* No
options were issued in 2009 or 2008.
|
||||||||||||
During
the years ended December 31, 2009, 2008 and 2007, a total of 29,250, 8,500 and
63,500 options were exercised with an intrinsic value of approximately $0.1
million, zero and $0.7 million, respectively. During the years ended
December 31, 2009, 2008 and 2007, a total of zero, zero and 15,000 options were
issued with a fair value of approximately zero, zero and $0.1 million,
respectively. During the year ended December 31, 2009, a total of
71,301 options were forfeited with a fair value of approximately $0.3
million. A total of 5,000, 28,000 and 56,000 options vested during
the years ended December 31, 2009, 2008 and 2007 with a fair value of zero, zero
and zero, respectively. At December 31, 2009, a total of zero options
were unvested with a fair value of zero. At December 31, 2008, a
total of 23,750 options were unvested with a fair value of zero. At
December 31, 2007, a total of 51,750 options were unvested with a fair value of
zero. There are no unvested options as of December 31,
2009. For the twelve-month periods ended December 31, 2009 and 2008,
our compensation expense related to stock option grants was approximately
$20,251 and $218,164, respectively.
|
13.
|
SUPPLEMENTAL
CASH FLOW INFORMATION
|
Supplemental
cash flow information including other cash paid for interest and Federal, state
and local income taxes was as follows:
|
Years Ended December 31,
|
||||||||||||
|
2009
|
2008
|
2007
|
||||||||||
|
Interest
paid
|
$ | 6,749,462 | $ | 8,726,251 | $ | 10,009,485 | ||||||
|
Federal,
state and local income taxes paid (refunds) - net
|
$ | 222,629 | $ | 1,463,675 | $ | (2,641,227 | ) | |||||
|
Capitalized
interest
|
$ | 5,983 | $ | 7,555 | $ | 14,561 | ||||||
|
Fixed
asset purchases in accounts payable
|
$ | 151,534 | $ | 112,742 | $ | 56,166 | ||||||
|
14.
|
SEGMENT
INFORMATION
|
Operating
Segments - We operate our business through three business segments:
wholesale, retail and military.
F -
27
Wholesale. In
our wholesale segment, our products are offered in over ten thousand retail
locations representing a wide range of distribution channels in the U.S. and
Canada. These distribution channels vary by product line and target market and
include sporting goods stores, outdoor retailers, independent shoe retailers,
hardware stores, catalogs, mass merchants, uniform stores, farm store chains,
specialty safety stores and other specialty retailers.
Retail. In
our retail segment, we sell our products directly to consumers through our
Lehigh mobile and retail stores, our Rocky outlet store and our websites. Our
Lehigh operations include a fleet of trucks, supported by small warehouses that
include retail stores, which we refer to as mini-stores. Through our outlet
store, we generally sell first quality or discontinued products in addition to a
limited amount of factory damaged goods, which typically carry lower gross
margins. Prior to our acquisition of the EJ Footwear Group and its Lehigh
division, our retail segment represented only a small portion of our
business.
Military. While
we are focused on continuing to build our wholesale and retail business, we also
actively bid, from time to time, on footwear contracts with the U.S. military.
As of December 31, 2009, we have three contracts totaling approximately $12.2
million to produce goods for the U.S. military. These are annual
contracts which contain options for yearly renewal over periods ranging from one
to four years. Our military sales fluctuate from year to
year.
The
following is a summary of segment results for the Wholesale, Retail, and
Military segments.
|
Years Ended December 31,
|
||||||||||||
|
2009
|
2008
|
2007
|
||||||||||
|
NET
SALES:
|
||||||||||||
|
Wholesale
|
$ | 174,260,798 | $ | 187,322,975 | $ | 202,594,947 | ||||||
|
Retail
|
50,007,177 | 65,837,775 | 70,714,315 | |||||||||
|
Military
|
5,217,600 | 6,377,395 | 1,957,549 | |||||||||
|
Total
Net Sales
|
$ | 229,485,575 | $ | 259,538,145 | $ | 275,266,811 | ||||||
|
GROSS
MARGIN:
|
||||||||||||
|
Wholesale
|
$ | 60,562,741 | $ | 68,482,473 | $ | 70,443,168 | ||||||
|
Retail
|
23,435,034 | 33,182,929 | 36,123,123 | |||||||||
|
Military
|
559,581 | 577,807 | 1,427,785 | (a) | ||||||||
|
Total
Gross Margin
|
$ | 84,557,356 | $ | 102,243,209 | $ | 107,994,076 | ||||||
|
(a)
Gross margin for 2007 includes a $1.2 million settlement of a previously
cancelled military contract.
|
||||||||||||
Segment
asset information is not prepared or used to assess segment
performance.
F -
28
Product Group
Information - The following is supplemental information on net sales by
product group:
|
2009
|
% of
Sales
|
2008
|
% of
Sales
|
2007
|
% of
Sales
|
|||||||||||||||||||
|
Work
footwear
|
$ | 124,095,030 | 54.1 | % | $ | 151,285,523 | 58.3 | % | $ | 160,415,927 | 58.3 | % | ||||||||||||
|
Outdoor
footwear
|
26,541,959 | 11.6 | % | 29,498,557 | 11.4 | % | 31,457,005 | 11.4 | % | |||||||||||||||
|
Western
footwear
|
29,522,876 | 12.9 | % | 30,971,343 | 11.9 | % | 37,636,995 | 13.7 | % | |||||||||||||||
|
Duty
footwear
|
19,869,232 | 8.7 | % | 17,860,778 | 6.9 | % | 17,794,005 | 6.5 | % | |||||||||||||||
|
Military
footwear
|
5,217,600 | 2.3 | % | 6,377,395 | 2.5 | % | 1,957,549 | 0.7 | % | |||||||||||||||
|
Apparel
|
12,210,926 | 5.3 | % | 15,807,910 | 6.1 | % | 16,385,664 | 6.0 | % | |||||||||||||||
|
Other
|
12,027,952 | 5.2 | % | 7,736,639 | 3.0 | % | 9,619,666 | 3.5 | % | |||||||||||||||
| $ | 229,485,575 | 100 | % | $ | 259,538,145 | 100 | % | $ | 275,266,811 | 100 | % | |||||||||||||
Net sales
to foreign countries, primarily Canada, represented approximately 2.4% in 2009,
3.0% of net sales in 2008, and 2.6% of net sales in 2007.
|
15.
|
QUARTERLY
RESULTS OF OPERATIONS (UNAUDITED)
|
The
following is a summary of the unaudited quarterly results of operations for the
years ended December 31, 2009 and 2008:
|
1st Quarter
|
2nd Quarter
|
3rd Quarter
|
4th Quarter
|
Total Year
|
||||||||||||||||
|
2009
|
||||||||||||||||||||
|
Net
sales
|
$ | 50,064,561 | $ | 51,188,615 | $ | 66,572,437 | $ | 61,659,962 | $ | 229,485,575 | ||||||||||
|
Gross
margin
|
20,092,488 | 17,717,672 | 24,715,786 | $ | 22,031,410 | 84,557,356 | ||||||||||||||
|
Net
income (loss)
|
(1,121,136 | ) | (1,394,968 | ) | 2,781,445 | $ | 909,466 | (b) | 1,174,807 | |||||||||||
|
Net
income (loss) per common share:
|
||||||||||||||||||||
|
Basic
|
$ | (0.20 | ) | $ | (0.25 | ) | $ | 0.50 | $ | 0.16 | $ | 0.21 | ||||||||
|
Diluted
|
$ | (0.20 | ) | $ | (0.25 | ) | $ | 0.50 | $ | 0.16 | $ | 0.21 | ||||||||
|
2008
|
||||||||||||||||||||
|
Net
sales
|
$ | 60,484,716 | $ | 60,507,421 | $ | 72,500,603 | $ | 66,045,405 | $ | 259,538,145 | ||||||||||
|
Gross
margin
|
25,949,665 | 24,396,093 | 27,086,070 | 24,811,381 | 102,243,209 | |||||||||||||||
|
Net
income (loss)
|
300,915 | 732,842 | 2,374,241 | (2,240,859 | ) (a) | 1,167,139 | ||||||||||||||
|
Net
income (loss) per common share:
|
||||||||||||||||||||
|
Basic
|
$ | 0.05 | $ | 0.13 | $ | 0.43 | $ | (0.41 | ) | $ | 0.21 | |||||||||
|
Diluted
|
$ | 0.05 | $ | 0.13 | $ | 0.43 | $ | (0.41 | ) | $ | 0.21 | |||||||||
No cash
dividends were paid during 2009 or 2008.
(a)
Includes an impairment loss of approximately $2,977,000 or $0.54 per share, net
of tax benefits.
(b)
Includes restructuring charges of approximately $451,000 or $0.08 per share, net
of tax benefits.
F -
29
|
16.
|
RESTRUCTURING
CHARGES
|
During
the fourth quarter of 2009, we initiated a comprehensive series of actions to
reduce the operating cost structure and increase the operating efficiency of
both our wholesale and retail divisions.These actions involved the relocation of
our wholesale division’s customer care function from Franklin, TN to
Nelsonville, OH; and the closing of underperforming mini-stores and trucks in
our retail division. These charges were composed of severance and
employee benefits related costs; transition costs; and facility exit costs,
which includes facility shut down and lease contract termination
costs.
The
schedule below summarizes the charges included in the accompanying consolidated
statement of operations for 2009 for our wholesale and retail
divisions:
|
Liability
|
Liability
|
|||||||||||||||
|
Beginning
|
Ending
|
|||||||||||||||
|
Balance
|
Balance
|
|||||||||||||||
|
12/31/2008
|
Expense
|
Payments
|
12/31/2009
|
|||||||||||||
|
Wholesale
|
||||||||||||||||
|
Severance
and employee benefits
|
$ | - | $ | 240,252 | $ | 92,172 | $ | 148,080 | ||||||||
|
Transition
costs
|
- | 40,978 | 40,978 | - | ||||||||||||
|
Facility
exit costs
|
- | 47,213 | 15,738 | 31,475 | ||||||||||||
|
Total
Wholesale
|
$ | - | $ | 328,443 | $ | 148,888 | $ | 179,555 | ||||||||
|
Retail
|
||||||||||||||||
|
Severance
and employee benefits
|
$ | - | $ | 63,881 | $ | 63,881 | $ | - | ||||||||
|
Transition
costs
|
- | 107,381 | 71,290 | 36,091 | ||||||||||||
|
Facility
exit costs
|
- | 211,464 | 50,747 | 160,717 | ||||||||||||
|
Total
Retail
|
$ | - | $ | 382,726 | $ | 185,918 | $ | 196,808 | ||||||||
|
Total
|
$ | - | $ | 711,169 | $ | 334,806 | $ | 376,363 | ||||||||
The
liability ending balance at December 31, 2009 is included in our Consolidated
Balance Sheet under Accrued Expenses. The restructuring reserve
balances presented are considered adequate to cover the committed restructuring
actions that we expect to complete in 2010. The $711,169 of
restructuring charges recorded in 2009, are included in the Consolidated
Statement of Operations under the caption: Restructuring
charges.
F -
30