Attached files
Table of Contents
Index to Financial Statements
UNITED STATES
SECURITIES AND EXCHANGE COMMISSION
Washington, D.C. 20549
FORM 10-K
FOR ANNUAL AND TRANSITION REPORTS
PURSUANT TO SECTIONS 13 OR 15(d) OF THE
SECURITIES EXCHANGE ACT OF 1934
(Mark One)
| x | Annual report pursuant to Section 13 or 15(d) of the Securities Exchange Act of 1934 for the fiscal year ended December 31, 2009 |
| ¨ | Transition report pursuant to Section 13 or 15(d) of the Securities Exchange Act of 1934 for the transition period from to |
Commission File Number 000-14993

CARMIKE CINEMAS, INC.
(Exact Name of Registrant as Specified in its Charter)
| Delaware | 58-1469127 | |
| (State or Other Jurisdiction of Incorporation or Organization) |
(I.R.S. Employer Identification No.) | |
| 1301 First Avenue, Columbus, Georgia | 31901 | |
| (Address of Principal Executive Offices) | (Zip Code) | |
(706) 576-3400
(Registrant’s Telephone Number, including Area Code)
Securities registered pursuant to Section 12(b) of the Act:
| Title of each class | Name of each exchange on which registered | |
| Common stock, par value $.03 per share | The NASDAQ Global Market |
Securities registered pursuant to Section 12(g) of the Act:
None
Indicate by check mark if the registrant is a well-known seasoned issuer, as defined in Rule 405 of the Securities Act. Yes ¨ No x
Indicate by check mark if the registrant is not required to file reports pursuant to Section 13 or 15(d) of the Act. Yes ¨ No x
Indicate by check mark whether the registrant: (1) has filed all reports required to be filed by Section 13 or 15(d) of the Securities Exchange Act of 1934 during the preceding 12 months (or for such shorter period that the registrant was required to file such reports), and (2) has been subject to such filing requirements for the past 90 days. Yes x No ¨
Indicate by checkmark whether the registrant has submitted electronically and posted on its corporate Website, if any, every Interactive Data File required to be submitted and posted pursuant to Rule 405 of Regulation S-T during the preceding 12 months (or for such shorter period that the registrant was required to submit and post such files). Yes ¨ No ¨
Indicate by check mark if disclosure of delinquent filers pursuant to Item 405 of Regulation S-K is not contained herein, and will not be contained, to the best of registrant’s knowledge, in definitive proxy or information statements incorporated by reference in Part III of this Form 10-K or any amendment to this Form 10-K x
Indicate by check mark whether the registrant is a large accelerated filer, an accelerated filer, a non-accelerated filer or a smaller reporting company. See definitions of “large accelerated filer,” “accelerated filer” and “smaller reporting company” in Rule 12b-2 of the Exchange Act. (Check one):
Large accelerated filer ¨ Accelerated filer x Non-accelerated filer ¨ Smaller reporting company ¨
(Do not check if a smaller
reporting company)
Indicate by check mark whether the registrant is a shell company (as defined in Rule 12b-2 of the Exchange Act). Yes ¨ No x
As of January 30, 2010, 12,862,963 shares of common stock were outstanding. The aggregate market value of the shares of common stock held by non-affiliates (based on the closing price on NASDAQ) as of June 30, 2009 was approximately $111.3 million.
Documents Incorporated by Reference
Portions of the proxy statement for the registrant’s 2010 annual meeting of stockholders, to be filed subsequently with the Securities and Exchange Commission pursuant to Regulation 14A, are incorporated by reference in Part III of this Annual Report on Form 10-K.
Table of Contents
Index to Financial Statements
| Page | ||||
| ITEM 1. |
2 | |||
| ITEM X. |
9 | |||
| ITEM 1A. |
11 | |||
| ITEM 1B. |
18 | |||
| ITEM 2. |
18 | |||
| ITEM 3. |
18 | |||
| ITEM 4. |
18 | |||
| ITEM 5. |
19 | |||
| ITEM 6. |
21 | |||
| ITEM 7. |
MANAGEMENT’S DISCUSSION AND ANALYSIS OF FINANCIAL CONDITION AND RESULTS OF OPERATIONS |
23 | ||
| ITEM 7A. |
40 | |||
| ITEM 8. |
42 | |||
| ITEM 9. |
CHANGES IN AND DISAGREEMENTS WITH ACCOUNTANTS ON ACCOUNTING AND FINANCIAL DISCLOSURE |
66 | ||
| ITEM 9A. |
66 | |||
| ITEM 9B. |
68 | |||
| ITEM 10. |
69 | |||
| ITEM 11. |
69 | |||
| ITEM 12. |
SECURITY OWNERSHIP OF CERTAIN BENEFICIAL OWNERS AND MANAGEMENT AND RELATED STOCKHOLDER MATTERS |
69 | ||
| ITEM 13. |
CERTAIN RELATIONSHIPS AND RELATED TRANSACTIONS, AND DIRECTOR INDEPENDENCE |
69 | ||
| ITEM 14. |
69 | |||
| ITEM 15. |
EXHIBITS AND FINANCIAL STATEMENT SCHEDULES | 70 | ||
Table of Contents
Index to Financial Statements
Cautionary Statement Regarding Forward-Looking Information
This Annual Report on Form 10-K contains statements that are considered forward-looking statements within the meaning of the Securities Act of 1933 and the Securities Exchange Act of 1934. Statements that are not historical facts, including statements about our beliefs and expectations, are forward-looking statements. Forward-looking statements include statements preceded by, followed by or that include the words “believes,” “expects,” “anticipates,” “plans,” “estimates” or similar expressions. Examples of forward-looking statements include the potential disposition of assets, the estimated value of our real estate, the amount of proceeds from these transactions, our ticket and concession price increases, our cost control measures, our strategies and operating goals, and our capital expenditure and theater expansion/closing plans. These statements are based on beliefs and assumptions of management, which in turn are based on currently available information. The forward-looking statements also involve risks and uncertainties, which could cause actual results to differ materially from those contained in any forward-looking statement. Many of these factors are beyond our ability to control or predict. Important factors that could cause actual results to differ materially from those contained in any forward-looking statement include, but are not limited to:
| • | general economic conditions in our regional and national markets; |
| • | our ability to comply with covenants contained in our senior credit agreement; |
| • | our ability to operate at expected levels of cash flow; |
| • | financial market conditions including, but not limited to, changes in interest rates and the availability and cost of capital; |
| • | our ability to meet our contractual obligations, including all outstanding financing commitments; |
| • | the availability of suitable motion pictures for exhibition in our markets; |
| • | ompetition in our markets; |
| • | competition with other forms of entertainment; |
| • | the effect of our leverage on our financial condition; |
| • | prices and availability of operating supplies; |
| • | impact of continued cost control procedures on operating results; |
| • | the impact of asset impairments |
| • | the impact of terrorist acts; |
| • | changes in tax laws, regulations and rates; and |
| • | financial, legal, tax, regulatory, legislative or accounting changes or actions that may affect the overall performance of our business. |
This report includes important information as to these factors in Item 1A. “Risk Factors”, and in the Notes to our Consolidated Financial Statements. Additional important information as to these factors is included in Item 7 “Management’s Discussion and Analysis of Financial Condition and Results of Operations” and in Carmike’s other United States Securities and Exchange Commission (“SEC”) reports, accessible on the SEC’s website at www.sec.gov and our website at www.carmike.com.
1
Table of Contents
Index to Financial Statements
| ITEM 1. | BUSINESS. |
Overview
We are one of the largest motion picture exhibitors in the United States and as of December 31, 2009, we owned, operated or had an interest in 244 theatres with 2,277 screens located in 35 states. We are a leader in digital cinema and 3-D cinema deployments and as of December 31, 2009, we had 225 theatres (92% of our theatres) with 2,141 screens (94% of our screens) on a digital-based platform. In addition, we had 193 theatres (79% of our theatres) with 503 screens (22% of our screens) equipped for 3-D.
We target small to mid-size non-urban markets with the belief that they provide a number of operating benefits, including lower operating costs and fewer alternative forms of entertainment.
The following table sets forth geographic information regarding our theatre circuit as of December 31, 2009:
| State |
Theatres | Screens | ||
| Alabama |
13 | 147 | ||
| Arkansas |
8 | 68 | ||
| Colorado |
6 | 51 | ||
| Delaware |
2 | 26 | ||
| Florida |
7 | 62 | ||
| Georgia |
22 | 226 | ||
| Idaho |
2 | 17 | ||
| Illinois |
12 | 116 | ||
| Indiana |
3 | 42 | ||
| Iowa |
5 | 61 | ||
| Kansas |
1 | 12 | ||
| Kentucky |
5 | 27 | ||
| Michigan |
13 | 100 | ||
| Minnesota |
6 | 65 | ||
| Missouri |
1 | 10 | ||
| Montana |
6 | 56 | ||
| Nebraska |
2 | 12 | ||
| New Mexico |
1 | 2 | ||
| New York |
1 | 8 | ||
| North Carolina |
25 | 268 | ||
| North Dakota |
5 | 33 | ||
| Ohio |
6 | 49 | ||
| Oklahoma |
9 | 53 | ||
| Oregon |
1 | 12 | ||
| Pennsylvania |
18 | 149 | ||
| South Carolina |
10 | 87 | ||
| South Dakota |
5 | 38 | ||
| Tennessee |
22 | 224 | ||
| Texas |
9 | 92 | ||
| Utah |
3 | 39 | ||
| Virginia |
7 | 54 | ||
| Washington |
1 | 12 | ||
| West Virginia |
2 | 20 | ||
| Wisconsin |
3 | 27 | ||
| Wyoming |
2 | 12 | ||
| Totals |
244 | 2,277 | ||
2
Table of Contents
Index to Financial Statements
From time to time, we convert weaker performing theatres to discount theatres for the exhibition of films that have previously been shown on a first-run basis. At December 31, 2009, we operated 20 theatres with 136 screens as discount theatres.
We are a major exhibitor in many of the small to mid-size markets in which we operate. The introduction of a competing theatre in these markets could significantly impact the performance of our theatres. In addition, the type of motion pictures preferred by patrons in these markets is typically more limited than in larger markets, which increases the importance of selecting films that will appeal to patrons in our specific theatre markets.
Theatre Development, Acquisitions and Operations
The following table shows information about the changes in our theatre circuit during the years presented:
| Theatres | Screens | Average Screens/ Theatre | ||||||
| Total at January 1, 2007 |
289 | 2,447 | 8.5 | |||||
| New construction and acquisition |
2 | 24 | ||||||
| Closures |
(27 | ) | (122 | ) | ||||
| Total at December 31, 2007 |
264 | 2,349 | 8.9 | |||||
| New construction |
3 | 32 | ||||||
| Closures |
(17 | ) | (94 | ) | ||||
| Total at December 31, 2008 |
250 | 2,287 | 9.1 | |||||
| New construction |
5 | 60 | ||||||
| Closures |
(11 | ) | (70 | ) | ||||
| Total at December 31, 2009 |
244 | 2,277 | 9.3 | |||||
Development
We carefully review small to mid-size markets to evaluate the return on capital of opportunities to build new theatres or renovate our existing theatres. The circumstances under which we believe we are best positioned to benefit from building new theatres are in markets in which:
| • | we believe building a new theatre provides an attractive cash flow opportunity; |
| • | we already operate a theatre and could best protect that market by expanding our presence; or |
| • | a film licensing zone is currently underserved by an exhibitor. |
We opened five theatres during the year ended December 31, 2009. If opportunities exist where new construction will be profitable to us, we will consider building additional theatres in future periods. We expect our development activity in 2010 will consist of two theatres. Additionally, as opportunities present themselves for consolidation we will evaluate each instance to obtain the highest level of return on investment.
Acquisitions
Our strategy is to selectively pursue accretive theatre acquisitions in opportunistic small to mid-size markets that improve our consolidated operating results. Our most recent acquisition was May 19, 2005, when we acquired 100% of the stock of George G. Kerasotes Corporation (“GKC Theatres”) for a net purchase price of $61.6 million. GKC Theatres operated 30 theatres with 263 screens in four Midwestern states where our presence was very limited. The acquisition upholds our traditional focus of acquiring existing operations in opportunistic small markets.
3
Table of Contents
Index to Financial Statements
Operations
Our theatre operations are under the supervision of our Senior Vice President and Chief Operating Officer, our Vice President—General Manager Theatre Operations and our two division managers. The division managers are responsible for implementing our operating policies and supervising our fourteen operating districts. Each operating district has a district manager who is responsible for overseeing the day-to-day operations of our theatres. Corporate policy development, strategic planning, site selection and lease negotiation, theatre design and construction, concession purchasing, film licensing, advertising, and financial and accounting activities are centralized at our corporate headquarters.
We have an incentive bonus program for theatre-level management, which provides for bonuses based on incremental improvements in theatre profitability, including concession sales. As part of this program, we evaluate “mystery shopper” reports on the quality of service, cleanliness and film presentation at individual theatres.
Box office admissions. The majority of our revenues come from the sale of movie tickets. For the year ended December 31, 2009, box office admissions totaled $345.7 million, or 67% of total revenues. At December 31, 2009, of our 244 theatres, 224 showed “first-run” films, which we license from distributors owned by the major studios, as well as from independent distributors, thirteen of which exhibited first-run films at a reduced admission price, and the remaining 20 of our theatres featured films at a discount price.
Most of the tickets we sell are sold at our theatre box offices immediately before the start of a film. Patrons can also buy tickets in advance either over the phone or on the Internet. These alternate sales methods do not currently represent a meaningful portion of our revenues, nor are they expected to in the near term.
Concessions and other revenues. Concession and other revenues totaled $169.0 million, or 33% of total revenues for the year ended December 31, 2009. Our strategy emphasizes quick and efficient service built around a limited menu primarily focused on higher margin items such as popcorn, flavored popcorn, candy, cotton candy, bottled water and soft drinks. In addition, in a limited number of markets, we offer frozen drinks, coffee, ice cream, hot dogs and pretzels in order to respond to competitive conditions. We manage our inventory purchasing centrally with authorization required from our central office before orders may be placed. We operate two family entertainment centers under the name Hollywood Connection® which feature multiplex theatres and other forms of family entertainment.
During 2009, we purchased substantially all of our concession and janitorial supplies, except for beverage supplies, from Showtime Concession Supply, Inc. (“Showtime Concession”). We are a significant customer of Showtime Concession. Our current agreement with Showtime Concession will expire on December 31, 2012. If this relationship was disrupted, we could be forced to negotiate a number of substitute arrangements with alternative vendors which are likely to be, in the aggregate, less favorable to us than the current arrangement.
During 2009, we purchased most of our beverage supplies from The Coca-Cola Company. In addition, as a result of the GKC theatre acquisition, we assumed their Pepsi-Cola contract to provide beverage supplies to our 29 GKC theatres. Pepsi-Cola beverage supplies are made available to us at our GKC theatres at Pepsi-Cola’s national account pricing in effect from time to time during the contract term. The term of the Pepsi-Cola contract is based on the volume of our purchases, and we expect it to expire during 2011. Effective January 1, 2009 we entered into a new agreement with The Coca-Cola Company to provide beverage supplies to our theatres through December 31, 2013. The Coca-Cola Company contract initially covers all theatres not subject to the Pepsi-Cola contract, and will expand to cover all our theatres upon the expiration of the Pepsi-Cola contract. In connection with our agreement with The Coca-Cola Company, a cost increase of 3.3% is expected for 2010. This 2010 cost increase is partially offset by an increase in incentives and rebates such that we do not expect our overall costs for 2010 to increase at the same rate.
4
Table of Contents
Index to Financial Statements
Seasonality
Typically, movie studios release films with the highest expected revenues during the summer and the holiday period between Thanksgiving and Christmas, causing seasonal fluctuations in revenues. However, movie studios are increasingly introducing more popular film titles throughout the year. In addition, in years where Christmas falls on a weekend day, our revenues are typically lower because our patrons generally have shorter holiday periods away from work or school.
Film Licensing
We obtain licenses to exhibit films by directly negotiating with film distributors. We license films through our booking office located in Columbus, Georgia. Our Vice President—Film, in consultation with our Chief Operating Officer, directs our motion picture bookings. Prior to negotiating for a film license, our Vice President—Film and film-booking personnel evaluate the prospects for upcoming films. The criteria considered for each film include cast, director, plot, performance of similar films, estimated film rental costs and expected Motion Picture Association of America (“MPAA”) rating. Because we only license a portion of newly released first-run films, our success in licensing depends greatly upon the availability of commercially popular motion pictures, and also upon our knowledge of the preferences of patrons in our markets and insight into trends in those preferences. We maintain a database that includes revenue information on films previously exhibited in our markets. We use this historical information to match new films with particular markets so as to maximize revenues.
The table below depicts the industry’s top 10 films for the year ended December 31, 2009 compared to our top 10 films for the same period, based on reported gross receipts:
| Industry |
Carmike Cinemas | |||||
| 1 | Transformers: Revenge of the Fallen | 1 | Transformers: Revenge of the Fallen | |||
| 2 | Harry Potter and the Half-Blood Prince | 2 | The Twilight Saga: New Moon | |||
| 3 | Up | 3 | Up | |||
| 4 | The Twilight Saga: New Moon | 4 | Harry Potter & The Half-Blood Prince | |||
| 5 | Avatar | 5 | Avatar | |||
| 6 | The Hangover | 6 | The Blind Side | |||
| 7 | Star Trek | 7 | Ice Age: Dawn of the Dinosaurs | |||
| 8 | Monsters Vs. Aliens | 8 | Monsters Vs. Aliens | |||
| 9 | The Blind Side | 9 | The Hangover | |||
| 10 | Ice Age: Dawn of the Dinosaurs | 10 | Night at the Museum 2 |
Film Rental Fees
We typically enter into film licenses that provide for rental fees based on “firm terms” which are negotiated and established prior to the opening of the picture; mutually agreed “settlement” upon the conclusion of the film run; or a sliding scale formula which is based on a percentage of the box office receipts using a pre-determined and agreed-upon film rental scale. Under a firm terms formula, we pay the distributor a specified percentage of the box office receipts, and this percentage declines over the term of the run. Many of our distributors award aggregate percentage terms for the run of the film. Under such an agreement, a set percentage is paid for the entire run of the film with no adjustments. The sliding scale formula provides for a fee equal to a percentage of box office receipts, with such percentage increasing as box office receipts increase nationally.
Film Licensing Zones
Film licensing zones are geographic areas established by film distributors where any given film is allocated to only one theatre within that area. In our markets, these zones generally encompass three to five miles. In film licensing zones where we have little or no competition, we obtain film licenses by selecting a film from among
5
Table of Contents
Index to Financial Statements
those offered and negotiating directly with the distributor. In competitive film licensing zones, a distributor will allocate its films among the exhibitors in the zone. When films are licensed under the allocation process, a distributor will choose which exhibitor is offered a movie and then that exhibitor will negotiate film rental terms directly with the distributor for the film.
Relationship with Distributors
We depend on, among other things, the quality, quantity, availability and acceptance by movie-going customers of the motion pictures produced by the motion picture production companies and licensed for exhibition to the motion picture exhibitors by distribution companies. Disruption in the production of motion pictures by the major studios and/or independent producers or poor performance of motion pictures could have an adverse effect on our business.
While there are numerous distributors that provide quality first-run movies to the motion picture exhibition industry, the following twelve major distributors accounted for over 90% of our box office admissions for the year ended December 31, 2009: Walt Disney Studios Motion Pictures, 20th Century Fox, MGM/UA, Miramax, Paramount, Sony Pictures Entertainment, Sony Classics, Universal, Warner Brothers, Lions Gate Features, Focus Features, and Weinstein Co.
Digital Cinema
We executed a Master License Agreement with Christie/AIX (“Christie”) on December 16, 2005. This agreement calls for Christie to license and install up to 2,300 digital cinema projection systems in our theatre auditoriums at a per screen installation cost of $800. The term of the agreement is from the date of installation in a specific auditorium until December 31, 2020 unless renewed for successive one year periods for up to ten years. Additionally, we are responsible for the maintenance of the installed equipment and have entered into a service agreement with Christie at an annual per screen cost of $2,340.
As of December 31, 2009, we had 225 theatres with 2,141 screens on a digital-based platform, and 193 theatres with 503 screens equipped for 3-D. We believe our leading-edge technologies allow us not only greater flexibility in showing feature films, but also enable us to achieve higher ticket prices for 3-D content and provide us with the capability to explore revenue-enhancing alternative content programming, such as live concerts and sporting events. Digital film content can be easily moved to and from auditoriums in our theatres to maximize attendance and enhance capacity utilization. The superior quality of digital cinema and our 3-D capability could provide a competitive advantage to us in markets where we compete for film and patrons.
We have experienced an increase in alternative content available to us as well as a growing slate of 3-D content. As directors and producers continue to embrace new technology in their productions, we expect new and innovative content generation to continue. Recently, 3-D versions of a movie have generated significantly more attendance than 2-D versions of the same movie at an additional $2.50 to $3.50 more per ticket for 3-D movies. We believe the benefits associated with digital technologies will be significant for our theatre circuit and will provide us with the opportunity for incremental revenues as the availability of 3-D and alternative content increases.
Management Information Systems
We utilize a computer system developed for us, which we call IQ-2000 that is installed in each of our theatres. IQ-2000 allows us to centralize most theatre-level administrative functions at our corporate headquarters. IQ-2000 allows corporate management to monitor ticket and concession sales and box office and concession staffing on a daily basis, enabling our theatre managers to focus on the day-to-day operations of the theatre. IQ-2000 also coordinates payroll, generates operating reports analyzing film performance and theatre profitability, and generates information we use to quickly detect theft. IQ-2000 also facilitates new services such
6
Table of Contents
Index to Financial Statements
as advanced ticket sales and Internet ticket sales. The system’s expanded capacity allows for future growth and more detailed data tracking and trend analysis. We have active communication between the theatres and corporate headquarters, which allows our senior management to react to vital profit and staffing information on a daily basis and perform the majority of the theatre-level administrative functions.
Competition
The motion picture exhibition industry is fragmented and highly competitive. In markets where we are not the sole exhibitor, we compete against regional and independent operators as well as the larger theatre circuit operators.
Our operations are subject to varying degrees of competition with respect to film licensing, attracting customers, obtaining new theatre sites or acquiring theatre circuits. In those areas where real estate is readily available, there are few barriers preventing competing companies from opening theatres near one of our existing theatres, which may have a material adverse effect on our theatres. Competitors have built or are planning to build theatres in certain areas in which we operate, which has resulted and may continue to result in excess capacity in such areas which adversely affects attendance and pricing at our theatres in such areas. To the best of our knowledge, in 2009 competitors opened, announced plans or started construction on new theatres in markets where we have 8 theatres with 78 screens, representing 3.6% of our total attendance for the year ended December 31, 2009.
The opening of large multiplexes and theatres with stadium seating by us and certain of our competitors has tended to, and is expected to continue to, draw audiences away from certain older and smaller theatres, including theatres operated by us. Demographic changes and competitive pressures can also lead to a theatre location becoming impaired.
In addition to competition with other motion picture exhibitors, our theatres face competition from a number of alternative motion picture exhibition delivery systems, such as cable television, satellite and pay-per-view services and home video systems. The expansion of such delivery systems could have a material adverse effect upon our business and results of operations. We also compete for the public’s leisure time and disposable income with all forms of entertainment, including sporting events, concerts, live theatre and restaurants.
Regulatory Environment
The distribution of motion pictures is in large part regulated by federal and state antitrust laws and has been the subject of numerous antitrust cases. Certain consent decrees resulting from such cases bind certain major motion picture distributors and require the motion pictures of such distributors to be offered and licensed to exhibitors, including us, on a theatre-by-theatre basis. Consequently, exhibitors such as our company cannot assure themselves of a supply of motion pictures by entering into long-term arrangements with major distributors, but must compete for licenses on a film-by-film and theatre-by-theatre basis.
The Americans with Disabilities Act (“ADA”), which became effective in 1992, and certain state statutes and local ordinances, among other things, require that places of public accommodation, including theatres (both existing and newly constructed), be accessible to patrons with disabilities. The ADA requires that theatres be constructed to permit persons with disabilities full use of a theatre and its facilities. Also, the ADA may require certain modifications be made to existing theatres in order to make them accessible to patrons and employees who are disabled. For example, we are aware of several lawsuits that have been filed against other exhibitors by disabled moviegoers alleging that certain stadium seating designs violate the ADA.
7
Table of Contents
Index to Financial Statements
Our theatre operations are also subject to federal, state and local laws governing such matters as construction, renovation and operation of our theatres as well as wages, working conditions, citizenship, and health and sanitation requirements and licensing. We believe that our theatres are in material compliance with such requirements.
We own, manage and operate theatres and other properties which may be subject to certain U.S. federal, state and local laws and regulations relating to environmental protection, including those governing past or present releases of hazardous substances. Certain of these laws and regulations may impose joint and several liability on certain statutory classes of persons for the costs of investigation or remediation of such contamination, regardless of fault or the legality of original disposal. These persons include the present or former owner or operator of a contaminated property and companies that generated, disposed of or arranged for the disposal of hazardous substances found at the property. Other environmental laws, such as those regulating wetlands, may affect our site development activities, and some environmental laws, such as those regulating the use of fuel tanks, could affect our ongoing operations. Additionally, in the course of maintaining and renovating our theatres and other properties, we periodically encounter asbestos containing materials that must be handled and disposed of in accordance with federal, state and local laws, regulations and ordinances. Such laws may impose liability for release of asbestos containing materials and may entitle third parties to seek recovery from owners or operators of real properties for personal injury associated with asbestos containing materials. We believe that our activities are in material compliance with such requirements.
Employees
As of December 31, 2009, we had approximately 6,635 employees, of which none were covered by collective bargaining agreements and 6,061 were part-time. As of December 31, 2009, approximately 65% of our hourly employees were paid at the federal minimum wage and accordingly, the minimum wage largely determines our labor costs for those employees. We believe we are more dependent upon minimum wage employees than most other motion picture exhibitors. Although our ability to secure employees at the minimum wage in our smaller markets is advantageous to us because it lowers our labor costs, we are also more likely than other exhibitors to be immediately and adversely affected if the minimum wage is raised. On July 24, 2009, the federal minimum wage increased from $6.55 to $7.25 per hour.
Trademarks and Trade-Names
We own or have rights to trademarks or trade-names that are used in conjunction with the operations of our theatres. We own Carmike Cinemas® and Hollywood Connection®, the Carmike C® and its film strip design, and Wynnsong Cinemas® trademarks. In addition, our logo is our trademark. Coca-Cola®, Pepsi-Cola®, Christie®, RealD® and Texas Instruments “DLP”® are registered trademarks used in this Annual Report on Form 10-K and are owned by and belong to each of these companies, respectively.
Corporate Information
Carmike Cinemas, Inc. was organized as a Delaware corporation in April 1982 in connection with the leveraged buy-out of our predecessor, the Martin Theatres circuit. Our predecessor companies date back to the 1930s. Our principal executive offices are located at 1301 First Avenue, Columbus, Georgia 31901, and our telephone number is (706) 576-3400.
Website Access
Our website address is www.carmike.com. You may obtain free electronic copies of our annual report on Form 10-K, quarterly reports on Form 10-Q, current reports on Form 8-K and all amendments to such reports required to be filed or furnished pursuant to Section 13 or 15(d) of the Securities Exchange Act of 1934, as amended, at our website under the heading “Investor Relations, Securities and Exchange Commission Filings.” These reports are available on our website as soon as reasonably practicable after we electronically file such material or furnish it to the SEC.
8
Table of Contents
Index to Financial Statements
| ITEM X. | EXECUTIVE OFFICERS OF THE REGISTRANT |
The following sets forth certain information as of March 1, 2010 regarding our executive officers.
| Name |
Age | Title | ||
| S. David Passman III |
57 | President and Chief Executive Officer | ||
| Fred W. Van Noy |
52 | Senior Vice President, Chief Operating Officer and Director | ||
| Richard B. Hare |
43 | Senior Vice President—Finance, Treasurer and Chief Financial Officer | ||
| Lee Champion |
59 | Senior Vice President, General Counsel and Secretary | ||
| H. Madison Shirley |
58 | Senior Vice President—Concessions and Assistant Secretary | ||
| Gary F. Krannacker |
47 | Vice President—General Manager Theatre Operations | ||
| John A. Lundin |
60 | Vice President—Film | ||
| Jeffrey A. Cole |
50 | Assistant Vice President—Controller | ||
| Paul G. Reitz |
37 | Assistant Vice President—Chief Accounting Officer |
S. David Passman III, 57, has served as President of Carmike since June 2009 and director since June 2003. Mr. Passman served as President and CEO of IBS-STL, Inc., a book publishing and distribution company, from June 2005 until January 2009. He served as President of the Harland Printed Products and Harland Checks divisions of John H. Harland Company, a provider of printed products and software and related services to the financial institution market, from 1999 to 2003, and also served as its CFO from 1996 to 1999. Mr. Passman is a former partner of Deloitte & Touche LLP, a public accounting firm, where he served as the Managing Partner of the Atlanta office from 1993 to 1996.
Fred W. Van Noy, 52, has served as a director since December 2004. Mr. Van Noy joined us in 1975. He served as a District Manager from 1984 to 1985 and as Western Division Manager from 1985 to 1988, when he became Vice President—General Manager. In December 1997, he was elected to the position of Senior Vice President—Operations. In November 2000, he became Senior Vice President—Chief Operating Officer.
Richard B. Hare, 43, joined us as Senior Vice President—Finance, Treasurer and Chief Financial Officer in March 2006. Mr. Hare served as Chief Accounting Officer and Controller for Greenfuels Holding Company, LLC, an energy development and management services company, and its affiliates from August 2002 to March 2006. From October 2000 until June 2002, Mr. Hare served as Assistant Treasurer for Sanmina-SCI Corporation, a manufacturer of electronic components. From 1997 until October 2000, Mr. Hare served as Treasurer of Wolverine Tube, Inc., a manufacturer of copper and copper alloy products. Mr. Hare, a Certified Public Accountant, began his career in 1989 at Coopers & Lybrand, a public accounting firm.
Lee Champion, 59, rejoined us as Senior Vice President, General Counsel and Secretary in September 2005. Mr. Champion had previously served in the same capacity from January 1998 to December 2001. From January 2002 until his return to Carmike, he was a partner at Page, Scrantom, Sprouse, Tucker and Ford in Columbus, Georgia. From 1975 until 1998, he was a partner in the law firm of Champion & Champion, Columbus, Georgia.
H. Madison Shirley, 58, joined us in 1977 as a theatre manager. He served as a District Manager from 1983 to 1987 and as Director of Concessions from 1987 until 1990. He became Vice President—Concessions in 1990 and Senior Vice President—Concessions and Assistant Secretary in December 1997.
Gary F. Krannacker, 47, joined us in May 1994 as City Manager, Pittsburgh, Pennsylvania. He served as Regional Manager from October 1995 until February 1998, and as Mid-Western Division Manager from 1998 until April 2003. He became General Manager of Theatre Operations in April 2003 and Vice President and General Manager of Theatre Operations in July 2004.
9
Table of Contents
Index to Financial Statements
John Lundin, 60, joined us in January 2010 as Vice President—Film. Prior to joining us, Mr. Lundin served as the District Manager for Sony Pictures Distribution, a motion picture distributor, from July 2009 to January 2010. Prior to joining Sony Pictures, he served as VP-Film for Cinemark USA, Inc., a motion picture exhibitor since 1995.
Jeffrey A. Cole, 50, joined us in December 2005 as Assistant Vice President-Controller. Prior to joining us, Mr. Cole served as the Executive Vice President and Chief Financial Officer of George Kerasotes Corporation (GKC Theatres) from July 1995 until May 2005. Prior to joining George Kerasotes Corporation, he served as the Chief Financial Officer—Controller of a bank holding company in Springfield, Illinois.
Paul G. Reitz, 37, joined us in July 2008 and was named Assistant Vice President and Chief Accounting Officer in June 2009. He previously served as Controller at Yellowbook USA Inc., a U.S. publisher of phone directories in 48 states, from April 2002 to July 2008. Mr. Reitz also served as Controller for McLeodUSA Publishing, a regional publisher of phone directories, from July 1997 to April 2002. Prior to his position at McLeodUSA Publishing, Mr. Reitz was an auditor at Deloitte & Touche LLP, a public accounting firm.
10
Table of Contents
Index to Financial Statements
| ITEM 1A. | RISK FACTORS |
The risk factors set forth below are applicable to us. You should carefully consider the following risks in evaluating us and our operations. The occurrence of any of the following risks could materially adversely affect, among other things, our business, financial condition and results of operations.
Our business will be adversely affected if there is a decline in the number of motion pictures available for screening or in the appeal of motion pictures to our patrons.
Our business depends to a substantial degree on the availability of suitable motion pictures for screening in our theatres and the appeal of such motion pictures to patrons in our specific theatre markets. Our results of operations will vary from period to period based upon the number and popularity of the motion pictures we show in our theatres. A disruption in the production of motion pictures by, or a reduction in the marketing efforts of, the major studios and/or independent producers, a lack of motion pictures, the poor performance of motion pictures in general or the failure of motion pictures to attract the patrons in our theatre markets will likely adversely affect our business and results of operations.
Our substantial lease and debt obligations could impair our financial flexibility and our competitive position.
We now have, and will continue to have, significant debt obligations. Our long-term debt obligations consist of the following:
| • | a $265.0 million six year term loan facility effective January 27, 2010; |
| • | a $30.0 million three year revolving credit facility; and |
| • | financing obligations of $185.5 million as of December 31, 2009 inclusive of interest but net of $62.8 million which is expected to be settled through non-cash consideration consisting of property subject to financing obligations. |
Our long-term debt obligations mature as follows:
| • | the final maturity date of the revolving credit facility is January 27, 2013; and |
| • | the final maturity date of the term loan facility is January 27, 2016. |
The term loan borrowings are to be repaid in 23 consecutive quarterly installments, each in the amount of $662,500, with the balance of $249,762,500 due at final maturity on January 27, 2016. Any amounts that may become outstanding under our revolving credit facility would be due and payable on January 27, 2013.
We also have, and will continue to have, significant lease obligations. As of December 31, 2009, our total operating, capital and financing lease obligations with terms over one year totaled $696.1 million.
These obligations could have important consequences for us. For example, they could:
| • | limit our ability to obtain necessary financing in the future and make it more difficult for us to satisfy our lease and debt obligations; |
| • | require us to dedicate a substantial portion of our cash flow to payments on our lease and debt obligations, thereby reducing the availability of our cash flow to fund working capital, capital expenditures and other corporate requirements; |
| • | make us more vulnerable to a downturn in our business and limit our flexibility to plan for, or react to, changes in our business; and |
| • | place us at a competitive disadvantage compared to competitors that might have stronger balance sheets or better access to capital by, for example, limiting our ability to enter into new markets or renovate our theatres. |
11
Table of Contents
Index to Financial Statements
If we are unable to meet our lease and debt obligations, we could be forced to restructure or refinance our obligations, to seek additional equity financing or to sell assets, which we may not be able to do on satisfactory terms or at all. In particular, the current global financial crisis affecting the banking system and financial markets and the possibility that financial institutions may consolidate or go out of business have resulted in a tightening in the credit markets, a low level of liquidity in many financial markets, and extreme volatility in credit and equity markets, which could affect our ability to refinance our existing obligations, obtain additional financing, or raise additional capital. As a result, we could default on our lease or debt obligations.
We may not generate sufficient cash flow to meet our needs.
Our ability to service our indebtedness and to fund capital expenditures for theatre construction, expansion or renovation will require a significant amount of cash, which depends on many factors beyond our control. Our ability to make scheduled payments of principal, to pay the interest on or to refinance our indebtedness is subject to general industry economic, financial, competitive, legislative, regulatory and other factors that are beyond our control, and may be limited because of our current leverage.
In addition, we may have difficulty obtaining financing for new development on terms that we find attractive. Traditional sources of financing new theatres through landlords may be unavailable.
The opening of large multiplexes by our competitors and the opening of newer theatres with stadium seating in certain of our markets have led us to reassess a number of our theatre locations to determine whether to renovate or to dispose of underperforming locations. Further advances in theatre design may also require us to make substantial capital expenditures in the future or to close older theatres that cannot be economically renovated in order to compete with new developments in theatre design.
We cannot assure you that our business will generate sufficient cash flow from operations, that currently anticipated revenue growth will be realized or that future capital will be available for us to fund our capital expenditure needs.
Our business is subject to significant competitive pressures.
Large multiplex theatres, which we and some of our competitors built, have tended to and are expected to continue to draw audiences away from certain older theatres, including some of our theatres. In addition, demographic changes and competitive pressures can lead to the impairment of a theatre. Over the last several years, we and many of our competitors have closed a number of theatres. Our competitors or smaller entrepreneurial developers may purchase or lease these abandoned buildings and reopen them as theatres in competition with us.
We face varying degrees of competition from other motion picture exhibitors with respect to licensing films, attracting customers, obtaining new theatre sites and acquiring theatre circuits. In those areas where real estate is readily available, there are few barriers preventing competing companies from opening theatres near one of our existing theatres. Competitors have built and are planning to build theatres in certain areas in which we operate. In the past, these developments have resulted and may continue to result in excess capacity in those areas, adversely affecting attendance and pricing at our theatres in those areas. Even where we are the only exhibitor in a film licensing zone (and therefore do not compete for films), we still may experience competition for patrons from theatres in neighboring zones. There have also been a number of consolidations in the film exhibition industry, and the impact of these consolidations could have an adverse effect on our business if greater size would give larger operators an advantage in negotiating licensing terms.
Our theatres also compete with a number of other motion picture delivery systems including network, cable and satellite television, DVD’s, as well as video-on-demand, pay-per-view services and downloads via the Internet. While the impact of these alternative types of motion picture delivery systems on the motion picture exhibition industry is difficult to determine precisely, there is a risk that they could adversely affect attendance at motion pictures shown in theatres.
12
Table of Contents
Index to Financial Statements
Our ability to attract patrons is also affected by the DVD release window, which is the time between the release of a film for play in theatres and when the film is available on DVD for general public sale or rental. The release window has been narrowing over the past several years and currently averages approximately four months. If the release window continues to shorten, it will impact our ability to attract patrons to our theatres.
Theatres also face competition from a variety of other forms of entertainment competing for the public’s leisure time and disposable income, including sporting events, concerts, live theatre and restaurants.
Our revenues vary significantly depending upon the timing of the motion picture releases by distributors.
Our business is seasonal, with a disproportionate amount of our revenues generated during the summer months and year-end holiday season. While motion picture distributors have begun to release major motion pictures more evenly throughout the year, the most marketable motion pictures are usually released during the summer months and the year-end holiday season, and we usually generate more revenue and cash flows during those periods than in other periods during the year. As a result, the timing of motion picture releases affects our results of operations, which may vary significantly from quarter to quarter and year to year. If we do not adequately manage our theatre costs of operations, it could significantly affect our cash flow and potential for future growth.
We may have a limited time window to remain an industry leader in 3-D deployment.
We have invested a significant amount of resources into becoming a leading motion picture exhibitor in 3-D. Other exhibitors have experienced delays in upgrading their screens with digital and 3-D capability. We cannot assure you that we will maintain our position as a leader in digital and 3-D screen count. This may adversely affect our ability to generate additional revenue from the digital and 3-D movie experience in the future.
If we do not comply with the covenants in our credit agreement or otherwise default under the credit agreement, we may not have the funds necessary to pay all our amounts that could become due.
Our ability to service our indebtedness will require a significant amount of cash. Our ability to generate this cash will depend largely on future operations. Based upon our current level of operations and our 2010 business plan, we believe that cash flow from operations, available cash and available borrowings under our credit agreement will be adequate to meet our liquidity needs for the next 12 months. However, the possibility exists that, if our operating performance is worse than expected, we could come into default under our debt instruments, causing the agents or trustees to accelerate maturity and declare all payments immediately due and payable.
The following are some factors that could affect our ability to generate sufficient cash from operations:
| • | further substantial declines in box office attendance, as a result of a continued general economic downturn, competition and a lack of consumers’ acceptance of the movie products in our markets; and |
| • | inability to achieve targeted admissions and concessions price increases, due to competition in our markets. |
We are subject to a number of covenants contained in our January 27, 2010 credit agreement, which restrict our ability, among other things, to: pay dividends; incur additional indebtedness; create liens on our assets; make certain investments; sell or otherwise dispose of our assets; consolidate, merge or otherwise transfer all or any substantial part of our assets; enter into transactions with our affiliates; and make capital expenditures. The credit agreement also contains financial covenants that require us to maintain a ratio of funded debt to adjusted EBITDA (“leverage ratio”) of no more than 4.75, a ratio of adjusted EBITDA to interest expense (“interest coverage ratio”) of no less than 1.75 and a ratio of total adjusted debt (adjusted for certain leases and financing obligations) to EBITDA plus rental expense (“EBITDAR ratio”) of no more than 7.15.
13
Table of Contents
Index to Financial Statements
It is possible that we may not comply with some or all of our financial covenants in the future. In order to avoid such non-compliance, we have the ability to reduce, postpone or cancel certain identified discretionary spending. We could also seek waivers or amendments to the senior secured credit agreement in order to avoid non-compliance. However, we can provide no assurance that we will successfully obtain such waivers or amendments from our lenders if necessary.
The failure to comply with such covenants may result in an event of default under the senior secured credit facilities, in which case, the lenders may terminate the revolving credit facility and may declare all or any portion of the obligations under the revolving credit facility and the term loan facilities due and payable. In such event, we would be required to raise additional equity or debt financing. We may not be able to obtain such financing on acceptable terms or at all. In such event, our financial position and results of operations would be materially adversely affected.
Deterioration in our relationships with any of the major film distributors could adversely affect our access to commercially successful films and could adversely affect our business and results of operations.
Our business depends to a significant degree on maintaining good relationships with the major film distributors that license films to our theatres. Deterioration in our relationships with any of the major film distributors could adversely affect our access to commercially successful films and adversely affect our business and results of operations. In addition, because the distribution of motion pictures is in large part regulated by federal and state antitrust laws and has been the subject of numerous antitrust cases, we cannot ensure a supply of motion pictures by entering into long-term arrangements with major distributors. Rather, we must compete for licenses on a film-by-film and theatre-by-theatre basis and are required to negotiate licenses for each film and for each theatre individually.
The global economic crisis could adversely affect our business and financial results by reducing amounts consumers spend on attending movies and purchasing concessions.
Our business depends on consumers voluntarily spending discretionary funds on leisure activities. Movie theatre attendance and concessions sales may be affected by prolonged negative trends in the general economy that adversely affect consumer spending, such as the current severe global recession. Our customers may have less money for discretionary purchases because of negative economic conditions such as job losses, foreclosures, bankruptcies, sharply falling home prices, reduced availability of credit and other matters, resulting in a decrease in consumer spending or causing consumers to shift their spending to alternative forms of entertainment. This may affect the demand for movies or severely impact the motion picture production industry such that our business and operations could be adversely affected.
Labor disputes in the motion picture industry may adversely affect our business.
Any disruption in the production or distribution of motion pictures related to disputes between film producers and film actors or other labor disputes in the motion picture industry could adversely affect our business and results of operations.
We rely heavily on IQ-2000, our computer system, to operate our business and a failure of this system could harm our business.
We depend on IQ-2000, our computer system, to operate our business and issue tickets to patrons at our theatres. A substantial system failure could restrict our ability to issue tickets timely to our patrons and could reduce the attractiveness of our services and cause our patrons to attend another theatre. In addition, we rely on IQ-2000 to centralize most theatre-level administrative functions at our corporate headquarters such as coordinating payroll, tracking theatre invoices, generating operating reports to analyze film performance and theatre profitability, and generating information to quickly detect theft. Disruption in, changes to, or a breach of the IQ-2000 system could result in the loss of important data, an increase of our expenses and a possible temporary cessation of our operations.
14
Table of Contents
Index to Financial Statements
We depend on key personnel for our current and future performance.
Our current and future performance depends to a significant degree upon the continued contributions of our senior management team and other key personnel. The loss or unavailability to us of any member of our senior management team or a key employee could significantly harm us. We cannot assure you that we would be able to locate or employ qualified replacements for senior management or key employees on acceptable terms.
Compliance with the ADA could require us to incur significant capital expenditures and litigation costs in the future.
The ADA and certain state statutes and local ordinances, among other things, require that places of public accommodation, including both existing and newly constructed theatres, be accessible to customers with disabilities. The ADA requires that theatres be constructed to permit persons with disabilities full use of a theatre and its facilities. The ADA may also require that certain modifications be made to existing theatres in order to make them accessible to patrons and employees who are disabled.
We are aware of several lawsuits that have been filed against other motion picture exhibitors by disabled moviegoers alleging that certain stadium seating designs violated the ADA. If we fail to comply with the ADA, remedies could include imposition of injunctive relief, fines, awards for damages to private litigants and additional capital expenditures to remedy non-compliance. Imposition of significant fines, damage awards or capital expenditures to cure non-compliance could adversely affect our business and operating results.
We are subject to other federal, state and local laws which limit the manner in which we may conduct our business.
Our theatre operations are subject to federal, state and local laws governing matters such as construction, renovation and operation of our theatres as well as wages, working conditions, citizenship and health and sanitation requirements and licensing. While we believe that our theatres are in material compliance with these requirements, we cannot predict the extent to which any future laws or regulations that regulate employment matters will impact our operations. At December 31, 2009, approximately 65% of our hourly employees were paid at the federal minimum wage and, accordingly, the minimum wage largely determines our labor costs for those employees. Increases in the minimum wage will increase our labor costs.
We may be limited in our ability to utilize, or may not be able to utilize, net operating loss carryforwards to reduce our future tax liability.
As of December 31, 2009 after applying Internal Revenue Code (“IRC”) Section 382 limitations, we had $18.9 million of federal and state operating loss carryforwards with which to offset our future taxable income. The federal and state net operating loss carryforwards will begin to expire in the year 2020. If these loss carryforwards are unavailable for our use in future periods, this may adversely affect our results of operations and financial position.
We experienced an “ownership change” within the meaning of Section 382(g) of the Internal Revenue Code of 1986, as amended, during the fourth quarter of 2008. The ownership change has and will continue to subject our net operating loss carryforwards to an annual limitation, which will significantly restrict our ability to use them to offset our taxable income in periods following the ownership change. In general, the annual use limitation equals the aggregate value of our stock at the time of the ownership change multiplied by a specified tax-exempt interest rate.
We determined that at the date of the ownership change, we had a net unrealized built-in loss (“NUBIL”). The NUBIL was determined based on the difference between the fair market value of our assets and their tax basis as of the ownership change date. Because of the NUBIL, certain deductions recognized during the five-year period beginning on the date of the IRC Section 382 ownership change (the “recognition period”) are subject to
15
Table of Contents
Index to Financial Statements
the same limitation as the net operating loss carryforwards. The amount of realized built-in losses (“RBILs”) limited was $6.0 million in 2009, which contributed to our current income tax expense. The amount of disallowed RBILs could increase if the Company disposes of assets with built-in losses at the ownership change date within the recognition period.
Disruption of our relationship with our primary concession suppliers could harm our margins on concessions.
We purchase substantially all of our concession supplies, except for beverage supplies, as well as janitorial supplies from Showtime Concession, and we are by far its largest customer. In return for our concession supplies, we pay Showtime Concession at contractual prices that are based on the type of concession supplied. Our current agreement with Showtime Concession will expire on December 31, 2012. If this relationship were disrupted, we could be forced to negotiate a number of substitute arrangements with alternative vendors which are likely to be, in the aggregate, less favorable to us than the current arrangement.
We purchase most of our beverage supplies from The Coca-Cola Company. On January 1, 2009 we entered into a new agreement with The Coca-Cola Company that expires on December 31, 2013. Under the agreement, The Coca-Cola Company may raise beverage supply costs up to 10% annually through the term of the agreement. Our margins on concessions revenue may decline to the extent we are unable to pass on increases in our concession costs to our customers in a rate at or near the rate of cost increases.
Our development of new theatres poses a number of risks.
We plan to continue to expand our operations through the development of new theatres and the expansion of existing theatres. However, we anticipate our development activities in 2010 will be limited to two theatres. Developing new theatres requires a significant amount of time, significant amount of resources and poses a number of risks. Construction of new theatres may result in cost overruns, delays or unanticipated expenses related to zoning or tax laws. Desirable sites for new theatres may be unavailable or expensive, and the markets in which new theatres are located may deteriorate over time. Additionally, the market potential of new theatre sites cannot be precisely determined, and our theatres may face competition in new markets from unexpected sources. Newly constructed theatres may not perform up to our expectations.
We face significant competition for potential theatre locations and for opportunities to acquire existing theatres and theatre circuits. Because of this competition, we may be unable to add to our theatre circuit on terms we consider acceptable.
If we determine that assets are impaired, we will be required to recognize a charge to earnings.
The opening of large multiplexes and theatres with stadium seating by us and certain of our competitors has tended to, and is expected to continue to, draw audiences away from certain older theatres, including some of our theatres. In addition, demographic changes and competitive pressures can lead to the impairment of a theatre.
We perform our theatre impairment analysis at the individual theatre level, the lowest level of independent, identifiable cash flow. We review all available evidence when assessing long-lived assets for potential impairment, including negative trends in theatre-level cash flow, the impact of competition, the age of the theatre and alternative uses of the assets. Our evaluation of negative trends in theatre-level cash flow considers seasonality of the business, with significant revenues and cash-flow being generated in the summer and year-end holiday season. Absent any unusual circumstances, we evaluate new theatres for potential impairment only after such theatres have been open and operational for a sufficient period of time to allow the market to mature.
When an impairment indicator or triggering event has occurred, we estimate future, undiscounted theatre-level cash flow using assumptions based on historical performance and our internal budgets and projections, adjusted for market specific facts and circumstances. If the undiscounted cash flow is not sufficient to support
16
Table of Contents
Index to Financial Statements
recovery of the asset group’s carrying value, an impairment loss is recorded in the amount by which the carrying value exceeds estimated fair value of the asset group. Fair value is determined primarily by discounting the estimated future cash flow, at a rate commensurate with the related risk. Significant judgment is required in estimating future cash flow, and significant assumptions include future attendance, admissions and concessions price increases, and film rent and other theatre operating costs. Accordingly, actual results could vary significantly from such estimates. We had long-lived asset impairment charges, from our continuing operations, in each of the last five fiscal years totaling $84.8 million. For fiscal years 2009, 2008 and 2007, our impairment charges from our continuing operations were $17.6 million, $36.3 million and $22.8 million, respectively.
Our common stock is currently listed for quotation on the Nasdaq Global Market. If we were unable to maintain our listing on the Nasdaq Global Market, it may be more difficult for our stockholders to sell our stock in the public market.
If we were unable to continue to maintain our listing on the Nasdaq Global Market it may become more difficult for our stockholders to sell our stock in the public market and the price of our common stock may be adversely affected because of the anticipated decreased liquidity. Should our stock be delisted from the Nasdaq Global Market, it may continue to be quoted on an over-the-counter market; however, its liquidity may be adversely affected, as well as the price at which it is traded. A delisting from the Nasdaq Global Market could affect the ability or willingness of broker-dealers to sell or make a market in our common stock and the ability of purchasers of our common stock to sell their securities in the secondary market.
Our business makes us vulnerable to future fears of terrorism.
If future terrorist incidents or threats cause our customers to avoid crowded settings such as theatres, our attendance would be adversely affected.
Our disclosure controls and procedures may not prevent or detect all errors or acts of fraud and our business could be adversely impacted if we have deficiencies in our disclosure controls and procedures or internal control over financial reporting.
Our disclosure controls and procedures are designed to reasonably assure that information required to be disclosed by us in reports we file or submit under the Exchange Act is accumulated and communicated to management, and recorded, processed, summarized and reported within the time periods specified in the SEC’s rules and forms. We believe that any disclosure controls and procedures or internal controls and procedures, no matter how well conceived and operated, can provide only reasonable, not absolute, assurance that the objectives of the control system are met.
These inherent limitations include the realities that judgments in decision-making can be faulty, that alternative reasoned judgments can be drawn, or that breakdowns can occur because of simple error or mistake. Additionally, controls can be circumvented by the individual acts of some persons, by collusion of two or more people or by an unauthorized override of the controls. Accordingly, because of the inherent limitations in our control system, misstatements due to error or fraud may occur and not be detected.
Deficiencies, including any material weakness, in our internal control over financial reporting which may occur in the future could result in misstatements of our results of operations, restatements of our financial statements, a decline in our stock price, or otherwise materially adversely affect our business, reputation, results of operations, financial condition or liquidity.
Our certificate of incorporation and bylaws contain provisions that make it more difficult to effect a change in control of the Company.
Certain provisions of our certificate of incorporation and bylaws and the Delaware General Corporation Law could have the effect of delaying, deterring or preventing a change in control of the Company not approved
17
Table of Contents
Index to Financial Statements
by the Board of Directors, even if the change in control were in the stockholders’ interests. Under our certificate of incorporation, our Board of Directors has the authority to issue up to one million shares of preferred stock and to determine the price, rights, preferences and privileges of those shares without any further vote or action by our stockholders. The rights of the holders of common stock will be subject to, and may be adversely affected by, the rights of the holders of any preferred stock that may be issued in the future. While we have no present intention to issue shares of preferred stock, an issuance of preferred stock in the future could have the effect of making it more difficult for a third party to acquire a majority of our outstanding voting stock. In addition, our bylaws provide that the request of stockholders owning 66 2/3% of our capital stock then issued and outstanding and entitled to vote is required for stockholders to request a special meeting.
Further, we are subject to the anti-takeover provisions of Section 203 of the Delaware General Corporation Law, which prohibits us from engaging in a “business combination” with an “interested stockholder” for a period of three years after the date of the transaction in which the person became an interested stockholder, unless the business combination is approved in a prescribed manner. The application of Section 203 could have the effect of delaying or preventing a change of control that could be advantageous to the stockholders.
| ITEM 1B. | UNRESOLVED STAFF COMMENTS. |
None.
| ITEM 2. | PROPERTIES. |
As of December 31, 2009, we owned 62 of our theatres and leased 180 of our theatres. We operated an additional two theatres under shared ownership. A list of our theatres, by state, is included above under “Business—Overview.”
We typically enter into long-term leases that provide for the payment of fixed monthly rentals, contingent rentals based on a percentage of revenue over a specified amount and the payment of property taxes, common area maintenance, insurance and repairs. We, at our option, can renew a substantial portion of our theatre leases at the then fair rental rate for various periods with renewal periods of up to 20 years.
We own our headquarters building, which has approximately 48,500 square feet, as well as a closed theatre that we have converted to additional office space and a records retention center. Both of these facilities are located in Columbus, Georgia.
| ITEM 3. | LEGAL PROCEEDINGS. |
From time to time we are involved in routine litigation and legal proceedings in the ordinary course of our business, such as personal injury claims, employment matters, contractual disputes and claims alleging Americans with Disabilities Act violations. Currently, there is no pending litigation or proceedings that we believe will have a material adverse effect, either individually or in the aggregate, on our business or financial condition.
| ITEM 4. | RESERVED |
18
Table of Contents
Index to Financial Statements
| ITEM 5. | MARKET FOR REGISTRANT’S COMMON EQUITY, RELATED STOCKHOLDER MATTERS AND ISSUER PURCHASES OF EQUITY SECURITIES. |
Our common stock is currently traded on the NASDAQ Global Market under the symbol “CKEC.” The last reported sale price of the common stock on December 31, 2009 was $7.56 per share. The table below sets forth the high and low sales prices of our common stock from January 1, 2008 through December 31, 2009.
| 2009 |
High | Low | Dividends | ||||||
| Fourth Quarter |
$ | 11.54 | $ | 5.55 | $ | — | |||
| Third Quarter |
$ | 10.49 | $ | 7.72 | $ | — | |||
| Second Quarter |
$ | 9.99 | $ | 2.50 | $ | — | |||
| First Quarter |
$ | 3.77 | $ | 1.00 | $ | — | |||
| 2008 |
High | Low | Dividends | ||||||
| Fourth Quarter |
$ | 4.40 | $ | 1.37 | $ | — | |||
| Third Quarter |
$ | 6.80 | $ | 1.93 | $ | — | |||
| Second Quarter |
$ | 11.14 | $ | 4.25 | $ | 0.175 | |||
| First Quarter |
$ | 11.37 | $ | 3.77 | $ | 0.175 | |||
As of December 31, 2009, there were 322 shareholders of record of our common stock and there were no shares of any other class of stock issued and outstanding.
During fiscal year 2009, we did not make any sales of unregistered equity securities. During the three months ended December 31, 2009, we did not repurchase any of our equity securities.
Beginning the second quarter of 2004, our Board of Directors declared dividends of $0.175 per share related to each quarter through June 30, 2008, which were paid as described above. In September 2008, our Board of Directors announced the decision to suspend the Company’s quarterly dividend in light of challenging conditions in the credit markets and the wider economy. Currently, the Company plans to allocate its capital primarily to reducing its overall leverage. The payment of future dividends is subject to our Board of Directors’ discretion and dependent on many considerations, including limitations imposed by covenants in our credit facilities, operating results, capital requirements, strategic considerations and other factors. We do not anticipate paying cash dividends in the foreseeable future. See Item 7, “Management’s Discussion and Analysis of Financial Condition and Results of Operations—Liquidity and Capital Resources—Material Credit Agreement and Covenant Compliance.”
19
Table of Contents
Index to Financial Statements
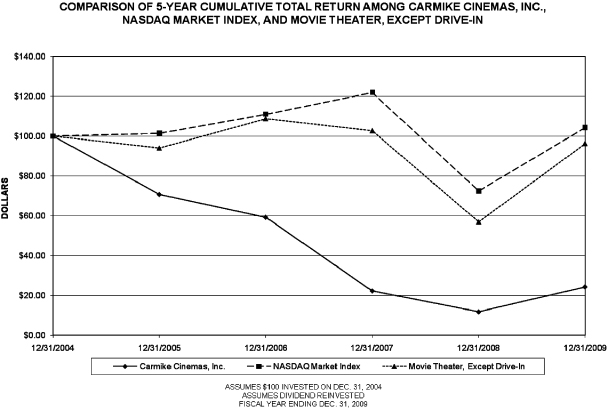
Performance Graph
The following stock price performance graph should not be deemed incorporated by reference by any general statement incorporating by reference this Annual Report on Form 10-K into any filing under the Exchange Act or the Securities Act of 1933, as amended, except to the extent that we specifically incorporate this information by reference, and shall not otherwise be deemed filed under such acts.
The following stock performance graph compares, for the five year period ended December 31, 2009, the cumulative total stockholder return for Carmike’s common stock, the NASDAQ Stock Market (U.S. companies) Index (the “NASDAQ Market Index”) and our comparative industry group (the “SIC Code Index”). Measurement points are the last trading day for each year ended December 31, 2004, December 31, 2005, December 31, 2006, December 31, 2007, December 31, 2008 and December 31, 2009. The graph assumes that $100 was invested on December 31, 2004 in our common stock, the NASDAQ Market Index and the SIC Code Index (7830-Services-Motion Picture Theatres) and assumes reinvestment of any dividends. The stock price performance on the following graph is not necessarily indicative of future stock price performance.
20
Table of Contents
Index to Financial Statements
| ITEM 6. | SELECTED FINANCIAL DATA. |
The consolidated selected historical financial and other data below should be read in conjunction with “Item 6. Management’s Discussion and Analysis of Financial Condition and Results of Operations” and with the consolidated financial statements and notes thereto contained in “Item 8. Financial Statements and Supplementary Data”. The selected historical financial data for each of the five fiscal years in the year ended December 31, 2009 (other than operating data) are derived from our audited consolidated financial statements.
| Year Ended December 31, | ||||||||||||||||||||
| 2009 | 2008 | 2007 | 2006 | 2005 | ||||||||||||||||
| (Amounts in millions, except per share data) | ||||||||||||||||||||
| Statement of Operations Data: |
||||||||||||||||||||
| Revenues: |
||||||||||||||||||||
| Admissions |
$ | 345.7 | $ | 312.5 | $ | 317.4 | $ | 313.4 | $ | 292.5 | ||||||||||
| Concessions and other |
169.0 | 160.2 | 164.7 | 164.3 | 150.2 | |||||||||||||||
| Total operating revenues |
514.7 | 472.7 | 482.1 | 477.7 | 442.7 | |||||||||||||||
| Operating costs and expenses: |
||||||||||||||||||||
| Film exhibition costs |
191.3 | 171.2 | 174.8 | 170.7 | 159.4 | |||||||||||||||
| Concession costs |
17.4 | 17.3 | 17.2 | 16.8 | 15.3 | |||||||||||||||
| Other theatre operating costs |
210.5 | 192.8 | 190.6 | 188.6 | 170.9 | |||||||||||||||
| General and administrative expenses |
16.1 | 19.4 | 21.7 | 29.4 | 19.8 | |||||||||||||||
| Separation Agreement Charges |
5.5 | — | — | — | 0.0 | |||||||||||||||
| Depreciation and amortization |
34.3 | 37.6 | 39.5 | 41.0 | 37.2 | |||||||||||||||
| (Gain) loss on sales of property and equipment |
(0.4 | ) | (1.4 | ) | (1.4 | ) | 0.3 | (2.6 | ) | |||||||||||
| Impairment of goodwill (2) |
— | — | 38.2 | — | 0.0 | |||||||||||||||
| Impairment of long-lived assets (2) |
17.6 | 36.3 | 22.8 | 5.7 | 2.4 | |||||||||||||||
| Total operating costs and expenses |
492.3 | 473.2 | 503.4 | 452.5 | 402.4 | |||||||||||||||
| Operating (loss) income |
22.4 | (0.5 | ) | (21.3 | ) | 25.2 | 40.3 | |||||||||||||
| Interest expense |
33.0 | 40.7 | 47.9 | 47.5 | 35.3 | |||||||||||||||
| Gain on sale of investments |
— | (0.5 | ) | (1.7 | ) | — | 0.0 | |||||||||||||
| Loss in extinguishment of debt |
— | — | — | 4.8 | 5.8 | |||||||||||||||
| Loss before reorganization benefit, income taxes, discontinued operations and cumulative effect of change in accounting principle |
(10.6 | ) | (40.7 | ) | (67.5 | ) | (27.1 | ) | (0.8 | ) | ||||||||||
| Reorganization benefit (1) |
— | — | — | — | 2.4 | |||||||||||||||
| (Loss) income before income taxes, discontinued operations and cumulative effect of change in accounting principle |
(10.6 | ) | (40.7 | ) | (67.5 | ) | (27.1 | ) | 1.6 | |||||||||||
| Income tax expense (benefit) (4) |
4.4 | 0.4 | 55.9 | (9.2 | ) | 2.4 | ||||||||||||||
| Loss before discontinued operations and cumulative effect of change in accounting principle |
(15.0 | ) | (41.1 | ) | (123.4 | ) | (17.9 | ) | (0.8 | ) | ||||||||||
| Income (loss) from discontinued operations, net of tax |
(0.4 | ) | (0.3 | ) | (3.5 | ) | (1.5 | ) | 1.1 | |||||||||||
| (Loss) income before cumulative effect of change in accounting principle |
(15.4 | ) | (41.4 | ) | (126.9 | ) | (19.4 | ) | 0.3 | |||||||||||
| Cumulative effect of change in accounting principle, net of taxes |
— | — | — | — | (0.1 | ) | ||||||||||||||
| Net income (loss) |
$ | (15.4 | ) | $ | (41.4 | ) | $ | (126.9 | ) | $ | (19.4 | ) | $ | 0.2 | ||||||
| Weighted average shares outstanding (in thousands) |
||||||||||||||||||||
| Basic |
12,678 | 12,661 | 12,599 | 12,341 | 12,194 | |||||||||||||||
| Diluted |
12,678 | 12,661 | 12,599 | 12,341 | 12,704 | |||||||||||||||
| Loss per common share: |
||||||||||||||||||||
| Basic |
$ | (1.22 | ) | $ | (3.27 | ) | $ | (10.07 | ) | $ | (1.57 | ) | $ | 0.02 | ||||||
| Diluted |
$ | (1.22 | ) | $ | (3.27 | ) | $ | (10.07 | ) | $ | (1.57 | ) | $ | 0.02 | ||||||
| Dividends declared per share |
$ | — | $ | 0.35 | $ | 0.70 | $ | 0.70 | $ | 0.70 | ||||||||||
21
Table of Contents
Index to Financial Statements
| Year Ended December 31, | ||||||||||||||||||||
| 2009 | 2008 | 2007 | 2006 | 2005 | ||||||||||||||||
| Balance Sheet Data (at year end): |
||||||||||||||||||||
| Cash and cash equivalents |
$ | 25.7 | $ | 10.9 | $ | 22.0 | $ | 26.0 | $ | 23.6 | ||||||||||
| Property and equipment, net of accumulated depreciation (2) |
390.6 | 431.8 | 497.3 | 545.1 | 568.5 | |||||||||||||||
| Total assets |
454.0 | 483.5 | 568.0 | 720.6 | 738.1 | |||||||||||||||
| Total debt (3) |
369.1 | 392.3 | 421.7 | 440.1 | 432.0 | |||||||||||||||
| Accumulated deficit |
(265.1 | ) | (249.6 | ) | (208.2 | ) | (81.4 | ) | (59.7 | ) | ||||||||||
| Total stockholders’ equity |
$ | 11.3 | $ | 25.2 | $ | 69.0 | $ | 203.6 | $ | 232.7 | ||||||||||
| Other Financial Data: |
||||||||||||||||||||
| Net cash provided by operating activities |
$ | 49.9 | $ | 25.1 | $ | 37.0 | $ | 38.2 | $ | 42.9 | ||||||||||
| Net cash provided by (used in) investing activities |
(10.5 | ) | 0.6 | (10.4 | ) | (31.6 | ) | (146.5 | ) | |||||||||||
| Net cash (used in) provided by financing activities |
(24.5 | ) | (36.8 | ) | (30.6 | ) | (4.2 | ) | 70.3 | |||||||||||
| Capital expenditures |
$ | 13.5 | $ | 11.7 | $ | 22.7 | $ | 35.7 | $ | 87.6 | ||||||||||
| Operating Data: |
||||||||||||||||||||
| Theatres at year end |
244 | 250 | 264 | 289 | 301 | |||||||||||||||
| Screens at year end |
2,277 | 2,287 | 2,349 | 2,447 | 2,475 | |||||||||||||||
| Average screens in operation |
2,285 | 2,309 | 2,401 | 2,454 | 2,383 | |||||||||||||||
| Average screens per theatre |
9.2 | 9.0 | 8.7 | 8.5 | 8.2 | |||||||||||||||
| Total attendance (in thousands) |
52,702 | 49,872 | 55,089 | 59,615 | 57,866 | |||||||||||||||
| Average admissions per patron |
$ | 6.52 | $ | 6.32 | $ | 5.89 | $ | 5.44 | $ | 5.35 | ||||||||||
| Average concessions and other sales per patron |
$ | 3.21 | $ | 3.24 | $ | 3.05 | $ | 2.87 | $ | 2.76 | ||||||||||
| Average attendance per screen |
23,070 | 21,598 | 22,949 | 24,296 | 24,283 | |||||||||||||||
| (1) | See our 2005 Annual Report on Form 10-K with respect to our reorganization, financial reporting in accordance with Statement of Position 90-7 and costs incurred during our reorganization. |
| (2) | See the notes to our annual consolidated financial statements with respect to impairments of long-lived assets. |
| (3) | Includes current maturities of long-term indebtedness, capital lease obligations and financing obligations; excludes long-term trade payables and liabilities subject to compromise. |
| (4) | During the quarter ended June 30, 2007, we determined that it is more likely than not that our deferred tax assets would not be realized in the future and accordingly we provided a valuation allowance against our deferred tax assets of $55.9 million. During the year ended December 31, 2009, we incurred additional tax expense due to the effects of the limitations imposed by the IRC Section 382 ownership change that occurred in October 2008. |
22
Table of Contents
Index to Financial Statements
| ITEM 7. | MANAGEMENT’S DISCUSSION AND ANALYSIS OF FINANCIAL CONDITION AND RESULTS OF OPERATIONS. |
The following discussion of our results of operations and financial condition should be read in conjunction with “Selected Financial Data” and the consolidated financial statements and related notes included elsewhere in this Form 10-K. The following discussion includes forward-looking statements that involve certain risks and uncertainties. See “Business—Cautionary Statement Regarding Forward-Looking Information.”
Overview
We are one of the largest motion picture exhibitors in the United States and as of December 31, 2009 we owned, operated or had an interest in 244 theatres with 2,277 screens located in 35 states. We target small to mid-size non-urban markets with the belief that they provide a number of operating benefits, including lower operating costs and fewer alternative forms of entertainment.
As of December 31, 2009, we had 225 theatres with 2,141 screens on a digital-based platform, and 193 theatres with 503 screens equipped for 3-D. We believe our leading-edge technologies allow us not only greater flexibility in showing feature films, but also provide us with the capability to explore revenue-enhancing alternative content programming. Digital film content can be easily moved to and from auditoriums in our theatres to maximize attendance. The superior quality of digital cinema and our 3-D capability provides a competitive advantage to us in markets where we compete for film and patrons.
Our business depends to a substantial degree on the availability of suitable motion pictures for screening in our theatres and the appeal of such motion pictures to patrons in our specific theatre markets. Our results of operations vary from period to period based upon the number and popularity of the films we show in our theatres. A disruption in the production of motion pictures, a lack of motion pictures, or the failure of motion pictures to attract the patrons in our theatre markets will likely adversely affect our business and results of operations.
Our revenue also varies significantly depending upon the timing of the film releases by distributors. While motion picture distributors have begun to release major motion pictures more evenly throughout the year, the most marketable films are usually released during the summer months and the year-end holiday season, and we usually generate higher attendance during those periods than in other periods during the year. As a result, the timing of such releases affects our results of operations, which may vary significantly from quarter to quarter and year to year.
We compete with other motion picture exhibitors and a number of other film delivery methods, including DVD’s, video-on-demand, pay-per view services and downloads via the Internet. We also compete for the public’s leisure time and disposable income with all forms of entertainment, including sporting events, concerts, live theatre and restaurants. A prolonged economic downturn could materially affect our business by reducing amounts consumers spend on entertainment including attending movies and purchasing concessions. Any reduction in consumer confidence or disposable income in general may affect the demand for movies or severely impact the motion picture production industry such that our business and operations could be adversely affected.
The ultimate performance of our film product any time during the calendar year will have a dramatic impact on our cash needs. In addition, the seasonal nature of the exhibition industry and positioning of film product makes our needs for cash vary significantly from quarter to quarter. Generally, our liquidity needs are funded by operating cash flow and available funds under our credit agreement. Our ability to generate this cash will depend largely on future operations.
We continue to focus on operating performance improvements, including managing our operating costs, implementing pricing initiatives and closing underperforming theatres. We also intend to allocate our available capital primarily to reducing our overall leverage. To this end, during the year ended December 31, 2009, we
23
Table of Contents
Index to Financial Statements
made voluntary pre-payments of $20 million to reduce our term debt, and in September 2008 we announced our decision to suspend our quarterly dividend. In addition, we continue to sell surplus property in order to generate additional cash.
In January 2009, the Company’s Chairman, Chief Executive Officer and President, Michael W. Patrick, ceased employment with the Company. Refer to Note 17—Separation Agreement Charges.
In June 2009, the Board of Directors appointed S. David Passman III to serve as President and Chief Executive Officer of the Company and entered into an employment agreement with Mr. Passman (the “Commencement Date”). The agreement provides that Mr. Passman will receive an annual base salary of $630,000 and will be eligible to receive an annual bonus with a target amount of 50% of base salary. Additionally, Mr. Passman was granted stock options to purchase 200,000 shares of the Company’s common stock at a per share exercise price equal to the fair market value of one share on the Commencement Date. Also, on the Commencement Date Mr. Passman was granted 50,000 shares of restricted common stock.
In January 2010, the Company entered into a new Credit Agreement (the “Credit Agreement”), by and among the Company, as borrower, and the several banks and other financial institutions or entities from time to time parties to the Credit Agreement, as lenders. The Credit Agreement provides for new senior secured credit facilities in the aggregate principal amount of $295.0 million. The new senior secured credit facilities consist of a $265.0 million six year term loan facility and a $30.0 million three year revolving credit facility. The Company used the $265.0 million term loan to repay borrowings of approximately $251.4 million (including principal, interest, and fees) under the former term loan facilities, to pay related fees and expenses associated with the new senior secured credit facilities, and for general corporate purposes. In connection with the transactions described above, the Company terminated its former $50.0 million revolving credit facility, dated as of May 19, 2005, and paid approximately $20,000 in accrued commitment fees.
For a summary of risks and uncertainties relevant to our business, please see “Item 1A. Risk Factors.”
Results of Operations
Seasonality
Typically, movie studios release films with the highest expected revenues during the summer and the holiday period between Thanksgiving and Christmas, causing seasonal fluctuations in revenues. However, movie studios are increasingly introducing more popular film titles throughout the year. In addition, in years where Christmas falls on a weekend day, our revenues are typically lower because our patrons generally have shorter holiday periods away from work or school.
Revenues
We derive almost all of our revenues from box office receipts and concession sales with additional revenues from screen advertising sales, our two Hollywood Connection fun centers, and other revenue streams, such as electronic video games located in some of our theatres and theatre rental fees. Successful films released during the year ended December 31, 2009 included Transformers: Revenge of the Fallen, which grossed over $400 million in domestic box office; Harry Potter and the Half-Blood Prince, which grossed over $300 million in domestic box office; and The Twilight Saga: New Moon, Up, Star Trek, Avatar and The Hangover, which all grossed over $200 million in domestic box office. We recognize admissions revenues when movie tickets are sold at the box office and concession sales revenues when the products are sold in the theatre. Admissions and concession sales revenues depend primarily upon attendance, ticket price and the price and volume of concession sales. Our attendance is affected by the quality and timing of movie releases and our ability to obtain films that appeal to patrons in our markets.
24
Table of Contents
Index to Financial Statements
Expenses
Film exhibition costs vary according to box office admissions and are accrued based on our terms and agreements with movie distributors. The agreements usually provide for a decreasing percentage of box office admissions to be paid to the movie studio over the first few weeks of the movie’s run, subject to a floor for later weeks. If “firm terms” do not apply, film exhibition costs are accrued based on the expected success of the film over a thirty to sixty day period and estimates of the final settlement with the movie studio. Settlements between us and the movie studios are completed three to four weeks after the movie’s run.
Concession costs are variable in nature and fluctuate with our concessions revenues. We purchase concessions to replace units sold. We negotiate prices for concessions with our concession vendors, primarily Showtime Concessions, to obtain lower rates.
Our theatre operating costs include labor, utilities and occupancy, and facility lease expenses. Labor costs have both a variable and fixed cost component. During non-peak periods, a minimum number of staff is required to operate a theatre facility. However, to handle attendance volume increases, theatre staffing is increased during peak periods and thus salaries and wages vary in relation to revenues. Utilities, repairs and maintenance services also have variable and fixed cost components. Our occupancy expenses and property taxes are primarily fixed costs, as we are generally required to pay applicable taxes, insurance and fixed minimum rent under our leases. In addition, several of our theatre leases contain provisions for contingent rent whereby a portion of our rent expense is based on an agreed upon percentage of revenue exceeding a specified level. In these theatres, a portion of rental expenses can vary directly with changes in revenue.
Our general and administrative expenses include costs not specific to theatre operations, and are composed primarily of corporate overhead.
25
Table of Contents
Index to Financial Statements
Operating Statement Information
The following table sets forth for the periods indicated the percentage of total revenues represented by certain items reflected in our consolidated statements of operations.
| Year Ended December 31, |
|||||||||
| 2009 | 2008 | 2007 | |||||||
| Revenues: |
|||||||||
| Admissions |
67 | % | 66 | % | 66 | % | |||
| Concessions and other |
33 | % | 34 | % | 34 | % | |||
| Total operating revenues |
100 | % | 100 | % | 100 | % | |||
| Operating costs and expenses: |
|||||||||
| Film exhibition costs (1) |
37 | % | 36 | % | 36 | % | |||
| Concession costs |
4 | % | 4 | % | 4 | % | |||
| Other theatre operating costs |
41 | % | 41 | % | 40 | % | |||
| General and administrative expenses |
3 | % | 4 | % | 4 | % | |||
| Separation Agreement Charges |
1 | % | (0 | )% | (0 | )% | |||
| Depreciation and amortization |
7 | % | 8 | % | 8 | % | |||
| Gain on sale of property and equipment |
(0 | )% | (0 | )% | (0 | )% | |||
| Impairment of goodwill |
(0 | )% | (0 | )% | 8 | % | |||
| Impairment of long-lived assets |
3 | % | 7 | % | 5 | % | |||
| Total operating costs and expenses |
96 | % | 100 | % | 104 | % | |||
| Operating (loss) income |
4 | % | 0 | % | (4 | )% | |||
| Interest expense |
6 | % | 9 | % | 10 | % | |||
| Gain on sale of investments |
(0 | )% | (0 | )% | (0 | )% | |||
| Loss before income tax and discontinued operations |
(2 | )% | (8 | )% | (14 | )% | |||
| Income tax expense |
1 | % | 0 | % | 12 | % | |||
| Loss from continuing operations |
(3 | )% | (8 | )% | (26 | )% | |||
| Loss from discontinued operations |
(0 | )% | (0 | )% | (0 | )% | |||
| Net loss |
(3 | )% | (8 | )% | (26 | )% | |||
| (1) | Film exhibition costs include advertising expenses. |
Year Ended December 31, 2009 Compared to Year Ended December 31, 2008
Revenues. We collect substantially all of our revenues from the sale of admission tickets and concessions. The table below provides a comparative summary of the operating data for this revenue generation.
| Years ended December 31, | ||||||
| 2009 | 2008 | |||||
| Average theatres |
247 | 256 | ||||
| Average screens |
2,285 | 2,309 | ||||
| Average attendance per screen (1) |
23,070 | 21,598 | ||||
| Average admission per patron (1) |
$ | 6.52 | $ | 6.32 | ||
| Average concessions and other sales per patron (1) |
$ | 3.21 | $ | 3.24 | ||
| Total attendance (in thousands) (1) |
52,702 | 49,872 | ||||
| Total revenues (in thousands) |
$ | 514,715 | $ | 472,678 | ||
| (1) | Includes activity from theatres designated as discontinued operations and reported as such in the consolidated statements of operations. |
26
Table of Contents
Index to Financial Statements
According to boxofficemojo.com, a website focused on the movie industry, national box office revenues for 2009 were estimated to have increased by 10.0% in comparison to 2008. The industry-wide increase was primarily driven by the success of high profile films in the fourth quarter, such as The Twilight Saga: New Moon, Avatar, and The Blind Side. We experienced an increase of 10.6% in admissions revenues for 2009. We believe our greater than industry increase in admissions revenue was attributable to the higher quantity and quality of 3-D film offerings in 2009.
Total revenues increased 8.9% to $514.7 million for the year ended December 31, 2009 compared to $472.7 million for the year ended December 31, 2008, due to an increase in total attendance from 49.9 million in 2008 to 52.7 million in 2009, and an increase in average admissions per patron from $6.32 in 2008 to $6.52 in 2009, partially offset by a decrease in concessions and other sales per patron from $3.24 in 2008 to $3.21 in 2009. Admissions revenue increased 10.6% to $345.7 million in 2009 from $312.5 million in 2008 due to an increase in total attendance from 49.9 million in 2008 to 52.7 million in 2009 and an increase in average admissions per patron from $6.32 in 2008 to $6.52 in 2009 primarily due to price increases and 3-D surcharges. Concessions and other revenue increased 5.5% to $169.0 million in 2009 from $160.2 million in 2008, due to an increase in total attendance from 49.9 million in 2008 to 52.7 million in 2009, partially offset by a decrease in average concessions and other sales per patron from $3.24 in 2008 to $3.21 in 2009.
We operated 244 theatres with 2,277 screens at December 31, 2009 and 250 theatres with 2,287 screens at December 31, 2008.
Operating costs and expenses. The table below summarizes operating expense data for the periods presented.
| Year ended December 31, | |||||||||||
| ($’s in thousands) | 2009 | 2008 | % Change | ||||||||
| Film exhibition costs |
$ | 191,379 | $ | 171,195 | 12 | ||||||
| Concession costs |
$ | 17,415 | $ | 17,283 | 1 | ||||||
| Other theatre operating costs |
$ | 210,487 | $ | 192,760 | 9 | ||||||
| General and administrative expenses |
$ | 16,139 | $ | 19,358 | (17 | ) | |||||
| Depreciation and amortization |
$ | 34,324 | $ | 37,552 | (9 | ) | |||||
| Gain on sale of property and equipment |
$ | (425 | ) | $ | (1,369 | ) | n/m | ||||
| Impairment of long-lived assets |
$ | 17,554 | $ | 36,339 | (52 | ) | |||||
| Separation agreements charges |
$ | 5,462 | $ | — | N/A | ||||||
Film exhibition costs. Film exhibition costs fluctuate in direct relation to the increases and decreases in admissions revenue and the mix of aggregate and term film deals. Film exhibition costs as a percentage of revenues are generally higher for periods with more blockbuster films. Film exhibition costs for the year ended December 31, 2009 increased to $191.4 million as compared to $171.2 million for the year ended December 31, 2008 primarily due to an increase in admissions revenue. As a percentage of admissions revenue, film exhibition costs were 55.4% for the year ended December 31, 2009, as compared to 54.8% for the year ended December 31, 2008 primarily as a result of a higher percentage of revenues generated by top tier films, partially offset by a reduction in advertising expenses.
Concession costs. Concession costs for the year ended December 31, 2009 increased to $17.4 million as compared to $17.3 million for the year ended December 31, 2008. As a percentage of concessions and other revenues, concession costs were 10.3% for the year ended December 31, 2009, as compared to 10.8% for the year ended December 31, 2008 primarily due to an increase in concession volume rebates. Our focus continues to be a limited concessions offering of high margin products such as soft drinks, popcorn and individually packaged candy, to maximize our profit potential.
Other theatre operating costs. Other theatre operating costs for the year ended December 31, 2009 increased to $210.5 million as compared to $192.8 million for the year ended December 31, 2008. The increase in our other
27
Table of Contents
Index to Financial Statements
theatre operating costs is primarily the result of an increase in salaries and wages expense that is due to the increase in the federal minimum wage in July 2009, an increase in attendance, an increase in repair and maintenance costs associated with improving the condition of our theatres, an increase in occupancy costs due to the opening of new theatres that more than offset the impact of closing theatres, and an increase in 3-D equipment service charges.
General and administrative expenses. General and administrative expenses for the year ended December 31, 2009 decreased to $16.1 million as compared to $19.4 million for the year ended December 31, 2008. The decrease in our general and administrative expenses is due to reductions in our salaries and wages expense, incentive compensation and professional fees.
Depreciation and amortization. Depreciation and amortization expenses for the year ended December 31, 2009 decreased approximately 8.6% as compared to the year ended December 31, 2008 due to a combination of lower balances of property and equipment due to theatre closures, asset sales, prior period impairment and other property and equipment disposals, as well as a portion of our long-lived assets becoming fully depreciated.
Gain on sales of property and equipment. We recognized a gain of $0.4 million on the sales of property and equipment for the year ended December 31, 2009 as compared to a gain of $1.4 million for the year ended December 31, 2008. Our gains primarily resulted from the disposition of underperforming theatres and surplus property and equipment.
Impairment of long-lived assets. Impairment of long-lived assets for the year ended December 31, 2009 decreased to $17.8 million compared to $36.9 million for the year ended December 31, 2008. For 2009, we recorded impairment charges relating to continuing operations of $17.6 million and impairment charges relating to discontinued operations of $260,000. The impairment charges affected 25 theatres with 248 screens, and were primarily the result of (1) deterioration in the full-year operating results of 22 theatres, resulting in $16.2 million in impairment charges; (2) the decline in fair market value of one owned theatre, resulting in $0.4 million in impairment charges; (3) a decrease in net realizable value of excess 35 millimeter projectors, resulting in a charge of $0.8 million; and (4) excess seat and equipment inventory from our theatre closures, resulting in a charge of $0.2.
When evaluating declining trends in theatre-level operating results, we give consideration to the seasonality of the business, with significant revenue and cash flow being generated in the summer and year-end holiday season as well as the effects of competition. Additionally, we evaluate the financial results on an on-going basis, but only after the theatre and its financial results have matured. For purposes of estimating the impairment loss, the fair value of the asset group was determined primarily by use of a discounted cash flow model that included inputs consistent with those expected to be used by market participants.
Separation agreement charges. We recognized charges of $5.2 million for estimated expenses pertaining to the separation agreement with our former Chairman, Chief Executive Officer and President, Michael W. Patrick and $.3 million for separation agreement charges pertaining to other employees for the year ended December 31, 2009, as compared to no expense recorded for the year ended December 31, 2008.
Operating income (loss). Operating income for the year ended December 31, 2009 was $22.4 million as compared to an operating loss of $440,000 for the year ended December 31, 2008. The increase in our operating income is primarily due to a decrease in impairment of long-lived assets in 2009 and the other factors described above.
Interest expense, net. Interest expense, net for the year ended December 31, 2009 decreased to $33.1 million from $40.7 million for the year ended December 31, 2008. The decrease is primarily related to lower average outstanding debt during 2009, and a lower weighted average interest rate. Interest income, included in interest expense, net for the year ended December 31, 2009 decreased to $93,000 from $252,000 for the year ended December 31, 2008.
28
Table of Contents
Index to Financial Statements
Gain on sale of investments. We recognized zero gain on investments for the year ended December 31, 2009 as compared to a gain on investments of $451,000 for the year ended December 31, 2008. This gain was a result of our sale of an equity method investment and final settlement of the conversion of an investment in a third-party ticket distributor.
Income taxes.
| Year Ended December 31, | ||||||||
| 2009 | 2008 | |||||||
| Pre-tax loss from continuing operations |
$ | (10,687 | ) | $ | (40,708 | ) | ||
| Federal tax (benefit) expense, at statutory rates |
(3,740 | ) | (14,422 | ) | ||||
| State tax (benefit) expense, net of federal tax effects |
(364 | ) | (1,174 | ) | ||||
| Other |
45 | (31 | ) | |||||
| Reduction in gross deferred tax assets due to IRC Section 382 |
1,693 | 33,653 | ||||||
| Increase (decrease) in valuation allowance |
6,725 | (17,663 | ) | |||||
| Total tax expense (benefit) from continuing operations |
$ | 4,359 | $ | 363 | ||||
As a result of an “ownership change” within the meaning of Section 382(g) of the Internal Revenue Code of 1986, as amended, which occurred in the fourth quarter of 2008, the Company is limited in its ability to utilize its net operating loss carryforwards and certain other built in deductions in computing its taxable income for a five year period beginning with the ownership change date. These limitations have increased the Company’s current tax expense, and taxes payable.
At December 31, 2009 and December 31, 2008, our consolidated net deferred tax assets were $63.2 million and $56.4 million, respectively, before the effects of any valuation allowance. We regularly assess whether it is more likely than not that our deferred tax asset balance will be recovered from future taxable income, taking into account such factors as our earnings history, carryback and carryforward periods, IRC limitations and tax planning strategies. When sufficient evidence exists that indicates that recovery is uncertain, a valuation allowance is established against the deferred tax asset, increasing our income tax expense in the period that such conclusion is made.
We expect that we will not recognize income tax benefits until a determination is made that a valuation allowance for all or some portion of the deferred tax assets is no longer required.
Income (loss) from discontinued operations. We generally consider theatres for closure due to an expiring lease term, underperformance, or the opportunity to better deploy invested capital. In 2009 and 2008, we closed four and eleven theatres, respectively, and reported the results of these operations, including gains or losses on disposal, as discontinued operations. The operations and cash flow of these theatres have been eliminated from the Company’s operations, and the Company will not have any continuing involvement in their operations. All prior years included in the accompanying consolidated statements of operations have been reclassified to separately show the results of operations from discontinued operations through the respective date of the theatre closings. Loss from discontinued operations for the year ended December 31, 2009 was $367,000, including loss on disposal of assets of $106,000, as compared to a loss of $320,000, including gain on disposal of assets of $1.1 million for the year ended December 31, 2008.
29
Table of Contents
Index to Financial Statements
Year Ended December 31, 2008 Compared to Year Ended December 31, 2007
Revenues. We collect substantially all of our revenues from the sale of admission tickets and concessions. The table below provides a comparative summary of the operating data for this revenue generation.
| ‘ | Years ended December 31, | |||||
| 2008 | 2007 | |||||
| Average theatres |
256 | 277 | ||||
| Average screens |
2,309 | 2,401 | ||||
| Average attendance per screen (1) |
21,598 | 22,949 | ||||
| Average admission per patron (1) |
$ | 6.32 | $ | 5.89 | ||
| Average concessions and other sales per patron (1) |
$ | 3.24 | $ | 3.06 | ||
| Total attendance (in thousands) (1) |
49,872 | 55,089 | ||||
| Total revenues (in thousands) |
$ | 472,678 | $ | 482,060 | ||
| (1) | Includes activity from theatres designated as discontinued operations and reported as such in the consolidated statements of operations. |
Total revenues decreased 1.9% to $472.7 million for the year ended December 31, 2008 compared to $482.1 million for the year ended December 31, 2007, due to the closure of underperforming theatres and a decrease in the average attendance per screen offset by an increase in average admissions per patron and concessions and other sales per patron. Admissions revenue decreased 1.5% to $312.5 million in 2008 from $317.4 million in 2007, due to a decrease in our average attendance per screen offset by an increase in average admissions per patron. Concessions and other revenue decreased 2.7% to $160.2 million in 2008 from $164.7 million in 2007, due to a decrease in attendance offset by an increase in our average concessions and other sales per patron.
We operated 250 theatres with 2,287 screens at December 31, 2008 and 264 theatres with 2,349 screens at December 31, 2007.
Operating costs and expenses. The table below summarizes operating expense data for the periods presented.
| Year ended December 31, | |||||||||||
| ($’s in thousands) | 2008 | 2007 | % Change | ||||||||
| Film exhibition costs |
$ | 171,195 | $ | 174,837 | (2 | ) | |||||
| Concession costs |
$ | 17,283 | $ | 17,163 | 1 | ||||||
| Other theatre operating costs |
$ | 192,760 | $ | 190,628 | 1 | ||||||
| General and administrative expenses |
$ | 19,358 | $ | 21,690 | (11 | ) | |||||
| Depreciation and amortization |
$ | 37,552 | $ | 39,502 | (5 | ) | |||||
| Loss (gain) on sale of property and equipment |
$ | (1,369 | ) | $ | (1,354 | ) | n/m | ||||
| Impairment of goodwill |
$ | — | $ | 38,240 | N/A | ||||||
| Impairment of long-lived assets |
$ | 36,339 | $ | 22,757 | 60 | ||||||
Film exhibition costs. Film exhibition costs for the year ended December 31, 2008 decreased to $171.2 million as compared to $174.8 million for the year ended December 31, 2007 due to a decrease in admissions revenue primarily as a result of a decrease in attendance. As a percentage of admissions revenue, film exhibition costs were 54.8% for the year ended December 31, 2008, as compared to 55.1% for the year ended December 31, 2007.
Concession costs. Concession costs for the year ended December 31, 2008 increased to $17.3 million as compared to $17.2 million for the year ended December 31, 2007. As a percentage of concessions and other revenues, concession costs were 10.8% for the year ended December 31, 2008, as compared to 10.4% for the
30
Table of Contents
Index to Financial Statements
year ended December 31, 2007 due to increased commodity costs and fuel surcharges. Our focus continues to be a limited concessions offering of high margin products such as soft drinks, popcorn and individually packaged candy, to maximize our profit potential.
Other theatre operating costs. Other theatre operating costs for the year ended December 31, 2008 increased to $192.8 million as compared to $190.6 million for the year ended December 31, 2007 due to increased maintenance costs, utility costs, property taxes and bank fees which were offset by decreased personnel costs, occupancy costs and insurance.
General and administrative expenses. General and administrative expenses for the year ended December 31, 2008 decreased to $19.4 million as compared to $21.7 million for the year ended December 31, 2007. The decrease in our general and administrative expenses is due to reductions in our salaries and wages expense, incentive compensation and legal and professional fees.
Depreciation and amortization. Depreciation and amortization expenses for the year ended December 31, 2008 decreased approximately 4.9% as compared to the year ended December 31, 2007 due to a combination of lower balances of property and equipment due to theatre closures, asset sales and other property and equipment disposals, as well as a portion of our long-lived assets becoming fully depreciated.
Gain on sales of property and equipment. We recognized a gain of $1.4 million on the sales of property and equipment for each of the years ended December 31, 2008 and 2007. Our gains and losses primarily result from the disposition of underperforming and surplus property and equipment.
Goodwill Impairment. Our goodwill was fully impaired in 2007 resulting in a non-cash charge to earnings of $38.2 million for the year ended December 31, 2007. This impairment charge was the result of full year 2007 operating results that were significantly lower than expectations and a fourth quarter decline in our stock price. We estimated the fair value of the Company using a combination of a discounted cash flow model and references to quoted market prices.
Impairment of long-lived assets. Impairment of long-lived assets for the year ended December 31, 2008 increased to $36.9 million compared to $26.2 million for the year ended December 31, 2007. For 2008, the impairment charges relating to continuing operations were $36.3 million and impairment charges relating to discontinued operations were $0.6 million. The impairment charges affected 43 theatres with 379 screens in 2008 and were primarily the result of (1) deterioration in the full-year operating results of 33 of these theatres, resulting in $32.2 million in impairment charges; (2) the contemplated sale of one closed theatre with a contract price less than carrying value, resulting in $49,000 in impairment charges; (3) a decrease in the fair market value of excess 35 millimeter projectors, resulting in $2.1 million in impairment charges; and (4) excess seat and equipment inventory from our theatre closures, resulting in $2.1 million in impairment charges. For 2007, we recorded impairment charges relating to continuing operations of $22.8 million and impairment charges relating to discontinued operations of $3.5 million. The impairment charges affected 31 theatres with 225 screens and were primarily the result of (1) deterioration in the full-year operating results of 25 of these theatres, resulting in $22.4 million in impairment charges; (2) a fourth quarter decision to market one parcel of land and close six owned theatres and sell the related assets, resulting in $3.1 million in impairment charges; and (3) excess 35 millimeter projectors as a result of the completion of our digital projection installation, resulting in $740,000 in impairment charges.
When evaluating declining trends in theatre-level operating results, we give consideration to the seasonality of the business, with significant revenue and cash flow being generated in the summer and year-end holiday season as well as the effects of competition. Additionally, we evaluate the financial results on an on-going basis, but only after the theatre and its financial results have matured. For purposes of estimating the impairment loss, the fair value of the asset group was determined primarily by use of a discounted cash flow model.
31
Table of Contents
Index to Financial Statements
Operating loss. Operating loss for the year ended December 31, 2008 was $440,000 as compared to $21.3 million for the year ended December 31, 2007. The decrease in our operating loss is largely due to a 2007 impairment of goodwill offset by an increase in impairment of long-lived assets in 2008.
Interest expense. Interest expense for the year ended December 31, 2008 decreased to $40.7 million from $47.8 million for the year ended December 31, 2007. The decrease is primarily related to lower average outstanding debt during 2008, and a lower weighted average interest rate.
Gain on sale of investments. We recognized a gain on the sale of investments of $451,000 for the year ended December 31, 2008. This gain is a result of our sale of an equity method investment and final settlement of the conversion of an investment in a third-party ticket distributor. We recognized a gain on the sale of investments of $1.7 million for the year ended December 31, 2007, as a result of the conversion of an investment in a third-party ticket distributor.
Income tax. As a result of an “ownership change” within the meaning of Section 382(g) of the Internal Revenue Code of 1986, as amended, which occurred in the fourth quarter of 2008, the Company is limited in its ability to utilize its net operating loss carryforwards and certain other built in deductions in computing its taxable income for a five year period beginning with the ownership change date. These limitations have increased the Company’s current tax expense, taxes payable and deferred tax asset.
At December 31, 2008 and December 31, 2007, our consolidated net deferred tax assets, net of IRC Section 382 limitations, were $56.4 million and $71.6 million, respectively, before the effects of any valuation allowance. We regularly assess whether it is more likely than not that our deferred tax asset balance will be recovered from future taxable income, taking into account such factors as our earnings history, carryback and carryforward periods, and tax planning strategies. When sufficient evidence exists that indicates that recovery is uncertain, a valuation allowance is established against the deferred tax asset, increasing our income tax expense in the period that such conclusion is made.
A significant factor in our assessment of the recoverability of the deferred tax asset is our history of cumulative losses. During 2007, we concluded that the recoverability of the deferred tax assets was uncertain based upon cumulative losses in that year and the preceding two years and determined that a valuation allowance was necessary to fully reserve our deferred tax assets. The valuation allowance decreased by $17.7 million in 2008 as a result of the permanent limitations imposed by IRC Section 382 on our net operating loss carryforwards and the related decrease in our deferred tax assets.
We expect that we will not recognize income tax benefits until a determination is made that a valuation allowance for all or some portion of the deferred tax assets is no longer required.
Income (loss) from discontinued operations. We generally consider theatres for closure due to an expiring lease term, underperformance, or the opportunity to better deploy invested capital. In 2008 and 2007, we closed eleven and twenty theatres, respectively, and reported the results of these operations, including gains or losses on disposal, as discontinued operations. The operations and cash flow of these theatres have been eliminated from the Company’s operations, and the Company will not have any continuing involvement in their operations. All prior years included in the accompanying consolidated statements of operations have been reclassified to separately show the results of operations from discontinued operations through the respective date of the theatre closings. Loss from discontinued operations for the year ended December 31, 2008 was $320,000, including gain on disposal of assets of $1.1 million, as compared to a loss of $3.5 million, including gain on disposal of assets of $2.2 million for the year ended December 31, 2007.
32
Table of Contents
Index to Financial Statements
Liquidity and Capital Resources
General
We typically maintain current liabilities in excess of our current assets which results in a working capital deficit. We are able to operate with a substantial working capital deficit because our operations are primarily conducted on a cash basis. Rather than maintain significant cash balances that would result from this pattern of operating cash flows, we utilize operating cash flows in excess of those required for investing activities to make discretionary payments on our debt balances. We had a working capital deficit of $23.3 million as of December 31, 2009 compared to $34.0 million at December 31, 2008.
At December 31, 2009, we had available borrowing capacity of $50 million under our revolving credit facility and approximately $25.7 million in cash and cash equivalents on hand as compared to $10.9 million at December 31, 2008. As of January 27, 2010, we terminated our existing $50.0 million revolving credit facility and entered into a new $30.0 million three year revolving credit facility. The material terms of our new revolving credit facility (including limitation on our ability to freely use all the available borrowing capacity) are described below in “Credit Agreement and Covenant Compliance.”
Net cash provided by operating activities was $49.9 million for the year ended December 31, 2009 as compared to $25.1 million for the same period in 2008. This increase in our cash provided by operating activities was due primarily to an increase in accounts payable and accrued expenses as compared to the prior period and a reduction in non-cash impairment of long-lived assets. Net cash used in investing activities was $10.5 million for the year ended December 31, 2009 as compared to net cash provided by investing activities of $0.6 million for the same period in 2008. The decrease in our net cash provided by investing activities is primarily due to an increase in cash used for the purchases of property and equipment in 2009 and a decrease in proceeds from the sale of property and equipment and investments. Capital expenditures were $13.5 million for the year ended December 31, 2009 as compared to $11.7 million for the same period in 2008. For the year ended December 31, 2009, net cash used in financing activities was $24.5 million as compared to $36.8 million for the same period in 2008. The decrease in our net cash used in financing activities is primarily due to $20.0 million of unscheduled prepayments of long-term debt in 2009 as compared to $25.0 million of unscheduled prepayments of long-term debt in 2008 and no dividends paid in 2009 as compared to $6.7 million of dividends paid during 2008.
Net cash provided by operating activities was $25.1 million for the year ended December 31, 2008 as compared to $37.0 million for the same period in 2007. This decrease in our cash provided by operating activities was due primarily to a reduction in accounts payable and accrued expenses as compared to the prior period. Net cash provided by investing activities was $0.6 million for the year ended December 31, 2008 as compared to net cash used in investing activities of $10.4 million for the same period in 2007. The decrease in our net cash used by investing activities is primarily due to a decrease in cash used for the purchases of property and equipment in 2008. Capital expenditures were $11.7 million for the year ended December 31, 2008 as compared to $22.7 million for the same period in 2007. For the year ended December 31, 2008, net cash used in financing activities was $36.8 million as compared to $30.6 million for the same period in 2007. The increase in our net cash used in financing activities is primarily due to $25.0 million of prepayments of long-term debt in 2008 as compared to $15.0 million of unscheduled prepayments of long-term debt in 2007, offset by a decrease in dividends paid of $6.7 million in 2008 as compared to $8.9 million of dividends paid during 2007.
Our liquidity needs are funded by operating cash flow and availability under our credit agreements. The exhibition industry is seasonal with the studios normally releasing their premiere film product during the holiday season and summer months. This seasonal positioning of film product makes our needs for cash vary significantly from quarter to quarter. Additionally, the ultimate performance of the films any time during the calendar year will have a dramatic impact on our cash needs.
We from time to time close older theatres or do not renew the leases, and the expenses associated with exiting these closed theatres typically relate to costs associated with removing owned equipment for
33
Table of Contents
Index to Financial Statements
redeployment in other locations and are not material to our operations. In 2009, we closed eleven of our underperforming theatres and estimate closing up to ten theatres in 2010.
We plan to make a total of approximately $20 million in capital expenditures for calendar year 2010. Pursuant to our January 2010 senior secured credit agreement, the aggregate capital expenditures that we may make, or commit to make for any fiscal year is limited to $22 million, provided that up to $5 million of the unused capital expenditures in a fiscal year may be carried over to the succeeding fiscal year.
In September 2008, our Board of Directors announced the decision to suspend our quarterly dividend in light of the challenging conditions in the credit markets and the wider economy. At that time, we announced plans to allocate our capital primarily to reducing our overall leverage. The cash dividend of $0.175 per share, paid on August 1, 2008 to shareholders of record at the close of business on July 1, 2008, was the last dividend declared by the Board of Directors prior to this decision. The payment of future dividends is subject to the Board of Directors’ discretion and dependent on many considerations, including limitations imposed by covenants in our credit facilities, operating results, capital requirements, strategic considerations and other factors. We do not anticipate paying cash dividends in the foreseeable future.
Credit Agreement and Covenant Compliance
In 2005, we entered into a credit agreement that provided for senior secured credit facilities in the aggregate principal amount of $405 million consisting of:
| • | a $170 million seven year term loan facility maturing in May 2012; |
| • | a $185 million seven year delayed-draw term loan facility maturing in May 2012; and |
| • | a $50 million five year revolving credit facility available for general corporate purposes maturing in May 2010. |
In addition, the credit agreement provided for future increases (subject to certain conditions and requirements) to the revolving credit and term loan facilities in an aggregate principal amount of up to $125 million.
As of December 31, 2009, we had the following amounts outstanding under each of the facilities described above:
| • | $139.6 million was outstanding under our $170 million term loan facility; |
| • | $111.2 million was outstanding under our $185 million delayed-draw term loan facility; and |
| • | no amounts were outstanding under our $50 million revolving credit facility. |
The interest rate for borrowings under the then existing credit agreement, as amended, is set to a margin above the London interbank offered rate (“LIBOR”) or base rate, as the case may be, based on our consolidated leverage ratio as defined in the credit agreement, with the margin ranging from 3.00% to 3.50% for loans based on LIBOR and 2.00% to 2.50% for loans based on the base rate. At December 31, 2009 and 2008, the average interest rate was 4.07% and 5.80%, respectively.
On January 27, 2010, we entered into a new Credit Agreement (the “Credit Agreement”), by and among the Company, as borrower, and the several banks and other financial institutions or entities from time to time parties to the Credit Agreement, as lenders. Our new long-term debt obligations consist of the following:
| • | a $265.0 million six year term loan facility; and |
| • | a $30.0 million three year revolving credit facility. |
34
Table of Contents
Index to Financial Statements
Our long-term debt obligations mature as follows:
| • | the final maturity date of the revolving credit facility is January 27, 2013; and |
| • | the final maturity date of the term loans is January 27, 2016. |
The interest rate for borrowings under the new term loan facility is LIBOR (subject to a 2.00% floor) plus a margin of 3.50%, or the Base Rate (as defined in the Credit Agreement) (subject to a 3.00% floor) plus a margin of 2.50%, as the Company may elect.
The interest rate for borrowings under the new revolving credit facility is LIBOR (subject to a 2.00% floor) plus an initial margin of 4.00%, or Base Rate (subject to a 3.00% floor) plus margin of 3.00%, as the Company may elect. Thereafter, the applicable margins are subject to adjustment based on the Company’s ratio of total debt to EBITDA as reflected in the Company’s quarterly or annual financial statements, with the margins ranging from 3.50% to 4.00% on LIBOR based loans, and from 2.50% to 3.00% on Base Rate based loans.
The Credit Agreement requires that mandatory prepayments be made from (1) 100% of the net cash proceeds from certain asset sales, dispositions, other than issuances of certain debt, (2) 100% of the net cash proceeds from sales-leaseback transactions, (3) various percentages (ranging from 0% to 75% depending on our consolidated leverage ratio) of excess cash flow as defined in the credit agreement, and (4) 50% of the net cash proceeds from the issuance of certain equity and capital contributions.
Debt Covenants
The new senior secured credit facilities contain covenants which, among other things, limit our ability, and that of our subsidiaries, to:
| • | pay dividends or make any other restricted payments to parties other than the Company; |
| • | incur additional indebtedness and financing obligations; |
| • | create liens on our assets; |
| • | make certain investments; |
| • | sell or otherwise dispose of our assets other than in the ordinary course of business; |
| • | consolidate, merge or otherwise transfer all or any substantial part of our assets; |
| • | enter into transactions with our affiliates; and |
| • | engage in businesses other than those in which we are currently engaged or those reasonably related thereto. |
The new senior secured credit facilities also contain financial covenants measured quarterly that require us to maintain on a consolidated basis specified ratios of total debt to EBITDA; EBITDA to total cash interest expense; and total adjusted debt (adjusted for certain leases and financing obligations) to EBITDA plus rental expense.
The Credit Agreement imposes an annual limit of $22.0 million on our ability to make capital expenditures. In addition to the dollar limitation, we may not make any capital expenditure if any default or event of default under the Credit Agreement has occurred and is continuing, or if a breach of the financial covenants contained in the Credit Agreement would result on a pro forma basis after giving effect to the capital expenditure.
Debt Service
Our ability to service our indebtedness will require a significant amount of cash. Our ability to generate this cash will depend largely on future operations. Based upon our current level of operations and our 2010 business
35
Table of Contents
Index to Financial Statements
plan, we believe that cash flow from operations, available cash and available borrowings under our Credit Agreement will be adequate to meet our liquidity needs for the next 12 months. However, the possibility exists that, if our operating performance is worse than expected, we could come into default under our debt instruments, causing our lenders to accelerate maturity and declare all payments immediately due and payable.
We are required to make principal repayments of our term loan borrowings in 23 consecutive quarterly installments, each in the amount of $662,500, with the balance of $249,762,500 due at final maturity on January 27, 2016. Any amounts that may become outstanding under our revolving credit facility would be due and payable on January 27, 2013.
Debt Covenant Compliance
As of December 31, 2009, we were in compliance with all of the financial covenants in our then existing credit agreement. As of December 31, 2009, our leverage and interest coverage ratios were 3.5 and 2.9, respectively.
The new Credit Agreement also contains financial covenants that require us to maintain a ratio of funded debt to adjusted EBITDA (“leverage ratio”) of no more than 4.75, a ratio of adjusted EBITDA to interest expense (“interest coverage ratio”) of no less than 1.75 and a ratio of total adjusted debt (adjusted for certain leases and financing obligations) to EBITDA plus rental expense (“EBITDAR ratio”) of no more than 7.15.
While we currently believe we will remain in compliance with these financial covenants through December 31, 2010 based on current projections, it is possible that we may not comply with some or all of our financial covenants. In order to avoid such non-compliance, we have the ability to reduce, postpone or cancel certain identified discretionary spending. We could also seek waivers or amendments to the credit agreement in order to avoid non-compliance. However, we can provide no assurance that we will successfully obtain such waivers or amendments from our lenders. If we are unable to comply with some or all of the financial or non-financial covenants and if we fail to obtain future waivers or amendments to the credit agreement, the lenders may terminate our revolving credit facility with respect to additional advances and may declare all or any portion of the obligations under the revolving credit facility and the term loan facilities due and payable.
Other events of default under the new senior secured credit facilities include:
| • | the Company’s failure to pay principal on the loans when due and payable, or its failure to pay interest on the loans or to pay certain fees and expenses (subject to applicable grace periods); |
| • | the occurrence of a change of control (as defined in the Credit Agreement); |
| • | a breach or default by the Company or its subsidiaries on the payment of principal of any other indebtedness in an aggregate amount greater than $10 million; |
| • | breach of representations or warranties in any material respect; or |
| • | failure to perform other obligations under the Credit Agreement and the security documents for the senior secured credit facilities (subject to applicable cure periods). |
The senior secured credit facilities are guaranteed by each of our subsidiaries and secured by a perfected first priority security interest in substantially all of our present and future assets.
36
Table of Contents
Index to Financial Statements
Contractual Obligations
In January 2010, we entered into the new senior secured credit facilities under the Credit Agreement. The proceeds were used to repay our existing term loan credit agreement and delayed draw term loan credit agreement (refer to Note 6: Debt—New Senior Secured Term Loan Facility to the consolidated financial statements included elsewhere herein). The following table reflects our contractual obligations, including those associated with the new credit facility:
| Less than one year |
1-3 years | 3-5 years | More than 5 years |
Total | |||||||||||
| Senior secured term loan |
$ | 2.7 | $ | 5.3 | $ | 5.3 | $ | 251.7 | $ | 265.0 | |||||
| Interest payments (1) |
13.5 | 29.0 | 28.4 | 15.0 | 85.9 | ||||||||||
| Financing obligations |
10.4 | 22.7 | 23.3 | 192.0 | 248.4 | ||||||||||
| Capital lease obligations |
6.4 | 12.3 | 12.0 | 37.9 | 68.5 | ||||||||||
| Operating leases |
44.4 | 81.2 | 75.8 | 239.0 | 440.4 | ||||||||||
| Christie contract |
0.2 | 0.3 | 0.3 | 0.3 | 1.1 | ||||||||||
| Income taxes (2) |
4.4 | 5.7 | — | — | 10.1 | ||||||||||
| Employment agreement with Chief Executive Officer |
0.6 | 0.6 | — | — | 1.2 | ||||||||||
| Total contractual cash obligations |
$ | 82.5 | $ | 157.1 | $ | 145.1 | $ | 735.9 | $ | 1,120.6 | |||||
| (1) | The interest rate under the new senior secured Credit Agreement is set to a margin above LIBOR or base rate, as the case may be, based on our consolidated leverage ratio as defined in the Credit Agreement, with the margin of 3.50% (subject to a 2.0% floor) for loans based on LIBOR and a margin of 2.50% (subject to a 3.0% floor) for loans based on the base rate. The average interest rate of 5.50% was used to calculate future interest payments herein. |
| (2) | The 2010 income tax obligation has been estimated based on 2010 budgeted taxable income and consideration of limitations on certain deductions as a result of Section 382(g) of the IRC. |
Off-Balance Sheet Arrangements
As of December 31, 2009, we did not have any off-balance sheet financing transactions or arrangements other than disclosed in the table above.
Critical Accounting Policies
The preparation of our financial statements requires our management to make estimates and assumptions that affect the reported amounts of assets and liabilities and the disclosure of contingent assets and liabilities at the date of the financial statements and the reported amounts of revenue and expenses during the period. On an on-going basis, we evaluate our estimates and judgments, including those related to exhibition costs, leasing transactions, depreciation of property and equipment, income taxes, and those related to impairment of long-lived assets. We base our estimates and judgments on historical experience and on various other factors that we believe to be reasonable under the circumstances, the results of which form the basis for making judgments about the carrying value of assets and liabilities that are not readily apparent from other sources. Actual results may differ from these estimates under different assumptions and conditions and such difference could be material. All critical accounting estimates have been discussed with our audit committee.
We believe the following critical accounting policies, among others, affect our more significant judgments and estimates used in the preparation of our consolidated financial statements in accordance with accounting principles generally accepted in the United States.
37
Table of Contents
Index to Financial Statements
Revenue and Expense Recognition
Admissions and concessions revenue is recognized at the point of sale for tickets and concessions. Sales taxes collected from customers are excluded from revenue and are recorded in accrued expenses. Other revenues primarily consist of screen advertising and are recognized over the period that the related advertising is delivered on-screen.
We record proceeds from the sale of gift cards and other advanced sale-type certificates in current liabilities and recognize admission and concession revenue when a holder redeems a gift card or other advanced sale-type certificate. We recognize revenue from unredeemed gift cards and other advanced sale-type certificates upon the later of expiration or when redemption becomes unlikely. Our conclusion that redemption is unlikely is based on an analysis of historical trends. Revenue recognition related to unredeemed gift cards and other advanced sale-type certificates totaled $2.5 million, $3.3 million and $1.6 million in 2009, 2008 and 2007, respectively.
Film rental costs are accrued based on the applicable box office receipts and either the mutually agreed upon firm terms or a sliding scale formula, which are established prior to the opening of the film. Under a firm terms formula, we pay the distributor a mutually agreed upon specified percentage of box office receipts, which reflects either a mutually agreed upon aggregate rate for the life of the film or rates that decline over the term of the movie run life. Under the sliding scale formula, film rental is paid as a percentage of box office revenues using a pre-determined matrix based upon box office performance of the film.
Our occupancy expenses and property taxes are primarily fixed costs, as we are generally required to pay applicable taxes, insurance and fixed minimum rent under our leases. In addition, several of our theatre leases contain provisions for contingent rent whereby a portion of our rent expense is based on an agreed upon percentage of revenue exceeding a specified level. In these theatres, a portion of rental expenses can vary directly with changes in revenue. Percentage rent expense is recorded for these theatres on a monthly basis if the theatre’s historical performance or forecasted performance indicates that the target will be reached. Certain of our leases are subject to monthly percentage rent only, which is accrued each month based on actual revenues.
Property and Equipment
Property and equipment are carried at cost (reduced for any impairment charges), net of accumulated depreciation. Assets held for sale are reported at the lower of the asset’s carrying amount or its fair value less costs to sell.
Depreciation is computed on a straight-line basis as follows.
| Buildings and building improvements |
15-30 years | ||
| Assets subject to financing leases |
15-30 years | ||
| Leasehold improvements |
15-30 years | * | |
| Assets under capital leases |
11-25 years | * | |
| Equipment |
5-15 years |
| * | Based on the lesser of the useful life of the asset or the term of the applicable lease. |
Impairment of Long-Lived Assets
In accordance with ASC 360-10 Impairment of Long-Lived Assets (“ASC 360-10”), long-lived assets are tested for recoverability whenever events or circumstances indicate that the assets’ carrying values may not be recoverable. We perform our theatre impairment analysis at the individual theatre level, the lowest level of independent, identifiable cash flow. We review all available evidence when assessing long-lived assets for potential impairment, including negative trends in theatre- level cash flow, the impact of competition, the age of the theatre, and alternative uses of the assets. Our evaluation of negative trends in theatre-level cash flow
38
Table of Contents
Index to Financial Statements
considers seasonality of the business, with significant revenues and cash-flow being generated in the summer and year-end holiday season. Absent any unusual circumstances, we evaluate new theatres for potential impairment only after such theatre has been open and operational for a sufficient period of time to allow its operations to mature.
When an impairment indicator or triggering event has occurred, we estimate future, undiscounted theatre-level cash flow using assumptions based on historical performance and our internal budgets and projections, adjusted for market specific facts and circumstances. If the undiscounted cash flow is not sufficient to support recovery of the asset group’s carrying value, an impairment loss is recorded in the amount by which the carrying value exceeds estimated fair value of the asset group. Fair value of the asset group is determined primarily by discounting the estimated future cash flow at a rate commensurate with the related risk and giving consideration to market participant assumptions. Significant judgment is required in estimating future cash flows, including significant assumptions regarding future attendance, admissions and concessions price increases, and film rent and other theatre operating costs. Accordingly, actual results could vary significantly from such estimates.
For the years ended December 31, 2009, 2008 and 2007, we recorded impairment charges of $17.8 million, $36.9 million and $26.2 million, respectively, that were primarily as a result of deterioration in the full-year operating results of 25, 43, and 31 theatres, respectively.
Leases
We operate most of our theatres under non-cancelable lease agreements with initial base terms ranging generally from 15 to 20 years, and classify these as operating, capital or financing based on an assessment at lease inception and when a modification is made to a lease. These leases generally provide for the payment of fixed monthly rentals, property taxes, common area maintenance, insurance and repairs. Certain of these leases provide for escalating lease payments over the terms of the leases. Certain leases for our theatres provide for contingent rentals based on the revenue results of the underlying theatre. The Company, at its option, can renew a portion of most of our leases at defined or then fair rental rates over varying periods. We generally do not consider the exercise of the renewal options as reasonably assured at lease inception.
For leases classified as operating leases, we record rent expense on a straight-line basis over the lease term in accordance with ASC 840-20 Operating Leases (“ASC 840-20”) beginning with the date that we have access to the property which in some cases is prior to commencement of lease payments. Accordingly, the amount of rental expense recognized in excess of lease payments is recorded as a deferred rent liability and is amortized to rental expense over the remaining term of the lease. In some leases, we funded costs to the benefit of the landlord, which have been recorded as prepaid rent and are amortized over the term of the lease on a straight-line basis.
For leases that are classified as capital leases, the property is recorded as a capital lease asset and a corresponding amount is recorded as a capital lease obligation in an amount equal to the lesser of the present value of minimum lease payments to be made over the lease life, beginning with the lease inception date, or the fair value of the property being leased. We amortize our capital lease assets on a straight-line basis over the lesser of the lease term or the economic life of the property. Each minimum lease payment is allocated between a reduction of the lease obligation and interest expense, yielding a fixed rate of interest throughout the lease obligation.
On certain leases we are involved with the construction of the building (typically on land owned by the landlord) and thus are subject to the provisions of ASC 840-40 Sales-Leaseback Transcations (“ASC 840-40”) When we are the deemed owner of the project for accounting purposes, we record the amount of total project costs incurred during the construction period. At completion of the construction project, we evaluate whether the transfer to the landlord/owner meets the requirements of ASC 840-40 for sale-leaseback treatment. If it does not meet such requirements, which is typical, the amounts funded by/received from the landlord are recorded as a
39
Table of Contents
Index to Financial Statements
financing obligation. Payments under such leases are bifurcated between the ground rent on the land, which is considered to be an operating lease, and payments for the building portion which is a financing obligation. We then allocate the lease payment for the building portion between a reduction of the financing obligation and interest expense, yielding a fixed rate of interest throughout the lease obligation. In certain leases, the last payment at the end of the lease term is settled by a transfer of the property to the landlord in settlement of the remaining financing obligation. The amount of amortization of the asset and the financing obligation is structured at the outset such that the remaining residual book value of the asset is always equal to or less than the remaining financing obligation at the end of the lease term. If the remaining financing obligation is greater than the residual book value at the end of the lease term, we will recognize a gain at the end of the lease term.
Income Taxes
Our effective tax rate is based on expected income, statutory tax rates and tax planning opportunities available in the various jurisdictions in which we operate. For interim financial reporting, we estimate the annual tax rate based on our projected taxable income for the full year and record a quarterly income tax provision in accordance with the anticipated annual rate. Throughout the year we refine our estimates of taxable income as new information becomes available, including year-to-date financial results. This progressive estimation process often results in a change to our expected effective tax rate for the year. When this occurs, we adjust the income tax provision during the quarter in which our change in estimates occurs to develop a year-to-date provision that reflects the expected annual tax rate. We may exercise significant judgment in determining our effective tax rate and evaluating our tax positions.
We recognize deferred tax assets and liabilities based on the differences between the financial statements carrying amounts and the tax basis of assets and liabilities. Deferred tax assets represent items to be used as a tax deduction or credit in future tax returns for which we have already properly recorded the tax benefit in the income statement. We regularly assess the probability that the deferred tax asset balance will be recovered against future taxable income, taking into account such factors as our earnings history, expected future earnings, carryback and carryforward periods, IRC limitations and tax strategies that could enhance the chances of a realization of a deferred tax asset. When factors indicate that recovery is unlikely, a valuation allowance is established against the deferred tax asset, increasing our income tax expense in the year that conclusion is made.
Impact of Recently Issued Accounting Standards
In April 2009, the FASB issued ASC 825-10-65, Financial Instruments—Transition Related to FSP FAS 107-1 and APB 28-1, Interim Disclosures about Fair Value of Financial Instruments (“ASC 820-10-65”). This guidance amended previously issued guidance that pertained to Disclosures about Fair Values of Financial Instruments to require disclosures about fair value of financial instruments in interim financial statements. The guidance is effective for interim periods ending after June 15, 2009, but early adoption was permitted for interim periods ending after March 15, 2009. The adoption of the guidance did not have a significant impact on our disclosures. Refer to Note 14—Financial Instruments. An entity that elects to early adopt the guidance on Interim Disclosures about Fair Value of Financial Instruments must also early adopt FASB guidance on determining whether a market is not active and a transaction is not distressed and recognition and presentation of other-than temporary impairments. The adoption of the guidance did not have an impact on our consolidated results of operations or financial position.
| ITEM 7A. | QUANTITATIVE AND QUALITATIVE DISCLOSURES ABOUT MARKET RISK. |
We are exposed to various market risks. We have floating rate debt instruments and, therefore, are subject to the market risk related to changes in interest rates. Interest paid on our debt is largely subject to changes in interest rates in the market. Our debt is based on a structure that is priced over an index or LIBOR rate option. As of December 31, 2009, an increase of 1% in interest rates would increase the interest expense on our debt by approximately $2.5 million on an annual basis. As of December 31, 2009, if our $50 million revolving credit agreement was fully drawn, a 1% increase in interest rates would increase interest expense by $500,000 on an annual basis.
40
Table of Contents
Index to Financial Statements
On January 27, 2010 we entered into a new $265 million senior secured term loan facility and a new $30 million revolving credit facility and used the proceeds to repay all balances outstanding under our then-existing senior secured credit facilities. We do not believe this refinancing will have a material impact on our exposure to market risk.
We have 36 theatre leases that have increases contingent on changes in the Consumer Price Index (“CPI”). A 1% change in the CPI would increase rent expense by approximately $2.2 million over the remaining lives of these leases.
41
Table of Contents
Index to Financial Statements
| ITEM 8. | FINANCIAL STATEMENTS AND SUPPLEMENTARY DATA. |
Index to Consolidated Financial Statements.
42
Table of Contents
Index to Financial Statements
REPORT OF INDEPENDENT REGISTERED PUBLIC ACCOUNTING FIRM
To the Board of Directors and Stockholders of Carmike Cinemas, Inc.
Columbus, Georgia
We have audited the accompanying consolidated balance sheets of Carmike Cinemas, Inc. and subsidiaries (the “Company”) as of December 31, 2009 and 2008, and the related consolidated statements of operations, stockholders’ equity, and cash flows for each of the three years in the period ended December 31, 2009. These financial statements are the responsibility of the Company’s management. Our responsibility is to express an opinion on the financial statements based on our audits.
We conducted our audits in accordance with the standards of the Public Company Accounting Oversight Board (United States). Those standards require that we plan and perform the audit to obtain reasonable assurance about whether the financial statements are free of material misstatement. An audit includes examining, on a test basis, evidence supporting the amounts and disclosures in the financial statements. An audit also includes assessing the accounting principles used and significant estimates made by management, as well as evaluating the overall financial statement presentation. We believe that our audits provide a reasonable basis for our opinion.
In our opinion, the consolidated financial statements referred to above present fairly, in all material respects, the financial position of Carmike Cinemas, Inc. and subsidiaries as of December 31, 2009 and 2008, and the results of their operations and their cash flows for each of the three years in the period ended December 31, 2009, in conformity with accounting principles generally accepted in the United States of America.
We have also audited, in accordance with the standards of the Public Company Accounting Oversight Board (United States), the Company’s internal control over financial reporting as of December 31, 2009, based on the criteria established in Internal Control—Integrated Framework issued by the Committee of Sponsoring Organizations of the Treadway Commission and our report dated March 1, 2010 expressed an unqualified opinion on the Company’s internal control over financial reporting.
/s/ Deloitte & Touche LLP
Atlanta, Georgia
March 1, 2010
43
Table of Contents
Index to Financial Statements
CARMIKE CINEMAS, INC. and SUBSIDIARIES
CONSOLIDATED BALANCE SHEETS
(in thousands except share and per share data)
| December 31, | ||||||||
| 2009 | 2008 | |||||||
| Assets: |
||||||||
| Current assets: |
||||||||
| Cash and cash equivalents |
$ | 25,696 | $ | 10,867 | ||||
| Restricted cash |
403 | 184 | ||||||
| Accounts receivable |
5,010 | 4,032 | ||||||
| Inventories |
2,551 | 2,373 | ||||||
| Prepaid expenses |
6,791 | 5,768 | ||||||
| Total current assets |
40,451 | 23,224 | ||||||
| Property and equipment: |
||||||||
| Land |
54,671 | 55,615 | ||||||
| Buildings and building improvements |
274,050 | 290,395 | ||||||
| Leasehold improvements |
125,075 | 127,638 | ||||||
| Assets under capital leases |
53,787 | 60,986 | ||||||
| Equipment |
214,293 | 219,348 | ||||||
| Construction in progress |
431 | 629 | ||||||
| Total property and equipment |
722,307 | 754,611 | ||||||
| Accumulated depreciation and amortization |
(331,728 | ) | (322,805 | ) | ||||
| Property and equipment, net of accumulated depreciation |
390,579 | 431,806 | ||||||
| Assets held for sale |
2,249 | 3,655 | ||||||
| Other |
19,448 | 23,386 | ||||||
| Intangible assets, net of accumulated amortization |
1,251 | 1,392 | ||||||
| Total assets |
$ | 453,978 | $ | 483,463 | ||||
| Liabilities and stockholders’ equity: |
||||||||
| Current liabilities: |
||||||||
| Accounts payable |
$ | 26,152 | $ | 23,995 | ||||
| Accrued expenses |
33,376 | 28,684 | ||||||
| Current maturities of long-term debt, capital leases and long-term financing obligations |
4,261 | 4,497 | ||||||
| Total current liabilities |
63,789 | 57,176 | ||||||
| Long-term liabilities: |
||||||||
| Long-term debt, less current maturities |
248,171 | 270,694 | ||||||
| Capital leases and long-term financing obligations, less current maturities |
116,684 | 117,059 | ||||||
| Other |
14,032 | 13,286 | ||||||
| Total long-term liabilities |
378,887 | 401,039 | ||||||
| Commitments and contingencies (Notes 12 and 13) |
||||||||
| Stockholders’ equity: |
||||||||
| Preferred Stock, $1.00 par value per share: 1,000,000 shares authorized, no shares issued |
— | — | ||||||
| Common Stock, $0.03 par value per share: 20,000,000 shares authorized, 13,266,372 shares issued and 12,862,963 shares outstanding at December 31, 2009, and 13,230,872 shares issued and 12,828,890 shares outstanding at December 31, 2008 |
395 | 394 | ||||||
| Treasury stock, 403,409 and 401,982 shares at cost, at December 31, 2009 and 2008, respectively |
(10,945 | ) | (10,938 | ) | ||||
| Paid-in capital |
286,903 | 285,430 | ||||||
| Accumulated deficit |
(265,051 | ) | (249,638 | ) | ||||
| Total stockholders’ equity |
11,302 | 25,248 | ||||||
| Total liabilities and stockholders’ equity |
$ | 453,978 | $ | 483,463 | ||||
The accompanying notes are an integral part of these consolidated financial statements
44
Table of Contents
Index to Financial Statements
CARMIKE CINEMAS, INC. and SUBSIDIARIES
CONSOLIDATED STATEMENTS OF OPERATIONS
(in thousands except per share data)
| Year Ended December 31, | ||||||||||||
| 2009 | 2008 | 2007 | ||||||||||
| Revenues: |
||||||||||||
| Admissions |
$ | 345,742 | $ | 312,491 | $ | 317,403 | ||||||
| Concessions and other |
168,973 | 160,187 | 164,657 | |||||||||
| Total operating revenues |
514,715 | 472,678 | 482,060 | |||||||||
| Operating costs and expenses: |
||||||||||||
| Film exhibition costs |
191,379 | 171,195 | 174,837 | |||||||||
| Concession costs |
17,415 | 17,283 | 17,163 | |||||||||
| Other theatre operating costs |
210,487 | 192,760 | 190,628 | |||||||||
| General and administrative expenses |
16,139 | 19,358 | 21,690 | |||||||||
| Separation agreement charges (Note 17) |
5,462 | — | — | |||||||||
| Depreciation and amortization |
34,324 | 37,552 | 39,502 | |||||||||
| Gain on sale of property and equipment |
(425 | ) | (1,369 | ) | (1,354 | ) | ||||||
| Impairment of goodwill |
— | — | 38,240 | |||||||||
| Impairment of long-lived assets |
17,554 | 36,339 | 22,757 | |||||||||
| Total operating costs and expenses |
492,335 | 473,118 | 503,463 | |||||||||
| Operating (loss) income |
22,380 | (440 | ) | (21,403 | ) | |||||||
| Interest expense |
33,067 | 40,719 | 47,794 | |||||||||
| Gain on sale of investments |
— | (451 | ) | (1,700 | ) | |||||||
| Loss before income tax |
(10,687 | ) | (40,708 | ) | (67,497 | ) | ||||||
| Income tax expense (Note 8) |
4,359 | 363 | 55,903 | |||||||||
| Loss from continuing operations |
(15,046 | ) | (41,071 | ) | (123,400 | ) | ||||||
| Loss from discontinued operations (Note 10) |
(367 | ) | (320 | ) | (3,490 | ) | ||||||
| Net loss |
$ | (15,413 | ) | $ | (41,391 | ) | $ | (126,890 | ) | |||
| Weighted average shares outstanding: |
||||||||||||
| Basic |
12,678 | 12,661 | 12,599 | |||||||||
| Diluted |
12,678 | 12,661 | 12,599 | |||||||||
| Loss per common share (Basic and Diluted): |
||||||||||||
| Loss from continuing operations |
$ | (1.19 | ) | $ | (3.24 | ) | $ | (9.79 | ) | |||
| Loss from discontinued operations |
(0.03 | ) | (0.03 | ) | (0.28 | ) | ||||||
| Basic and diluted net loss |
$ | (1.22 | ) | $ | (3.27 | ) | $ | (10.07 | ) | |||
| Dividends declared per share |
$ | — | $ | 0.35 | $ | 0.70 | ||||||
The accompanying notes are an integral part of these consolidated financial statements
45
Table of Contents
Index to Financial Statements
CARMIKE CINEMAS, INC. and SUBSIDIARIES
CONSOLIDATED STATEMENTS OF CASH FLOWS
(in thousands)
| Year Ended December 31, | ||||||||||||
| 2009 | 2008 | 2007 | ||||||||||
| Cash flows from operating activities: |
||||||||||||
| Net loss |
$ | (15,413 | ) | $ | (41,391 | ) | $ | (126,890 | ) | |||
| Adjustments to reconcile net loss to net cash provided by operating activities: |
||||||||||||
| Depreciation and amortization |
34,404 | 37,950 | 40,328 | |||||||||
| Amortization of debt issuance costs |
2,068 | 2,420 | 2,410 | |||||||||
| Impairment of long-lived assets |
17,814 | 36,875 | 26,222 | |||||||||
| Impairment of goodwill |
— | — | 38,240 | |||||||||
| Deferred income taxes |
— | — | 55,903 | |||||||||
| Stock-based compensation |
1,473 | 2,130 | 2,670 | |||||||||
| Other |
1,451 | 1,139 | 1,310 | |||||||||
| Gain on sale of investments |
— | (451 | ) | (1,700 | ) | |||||||
| Gain on sale of property and equipment |
(319 | ) | (2,513 | ) | (3,582 | ) | ||||||
| Changes in operating assets and liabilities: |
||||||||||||
| Accounts receivable and inventories |
(1,237 | ) | (279 | ) | (140 | ) | ||||||
| Prepaid expenses and other assets |
940 | (1,075 | ) | 515 | ||||||||
| Accounts payable |
3,012 | (3,895 | ) | 4,696 | ||||||||
| Accrued expenses and other liabilities |
5,660 | (5,838 | ) | (2,988 | ) | |||||||
| Net cash provided by operating activities |
49,853 | 25,072 | 36,994 | |||||||||
| Cash flows from investing activities: |
||||||||||||
| Purchases of property and equipment |
(13,546 | ) | (11,676 | ) | (22,682 | ) | ||||||
| Release (funding) of restricted cash |
(219 | ) | 41 | 2,378 | ||||||||
| Proceeds from sale of investments |
— | 2,925 | 1,700 | |||||||||
| Proceeds from sale of property and equipment |
3,256 | 9,314 | 8,218 | |||||||||
| Net cash provided by (used in) investing activities |
(10,509 | ) | 604 | (10,386 | ) | |||||||
| Cash flows from financing activities: |
||||||||||||
| Debt activities: |
||||||||||||
| Repayments of long-term debt |
(22,731 | ) | (28,028 | ) | (18,231 | ) | ||||||
| Repayments of capital lease and long-term financing obligations |
(1,682 | ) | (2,011 | ) | (1,344 | ) | ||||||
| Proceeds from long-term financing arrangements |
— | — | 239 | |||||||||
| Proceeds from the exercise of stock options |
1 | — | 1,198 | |||||||||
| Purchase of treasury stock |
(7 | ) | (13 | ) | (2,667 | ) | ||||||
| Debt issuance costs |
(96 | ) | — | (971 | ) | |||||||
| Dividends paid |
— | (6,732 | ) | (8,873 | ) | |||||||
| Net cash used in financing activities |
(24,515 | ) | (36,784 | ) | (30,649 | ) | ||||||
| (Decrease) increase in cash and cash equivalents |
14,829 | (11,108 | ) | (4,041 | ) | |||||||
| Cash and cash equivalents at beginning of year |
10,867 | 21,975 | 26,016 | |||||||||
| Cash and cash equivalents at end of year |
$ | 25,696 | $ | 10,867 | $ | 21,975 | ||||||
| SUPPLEMENTAL DISCLOSURES OF CASH FLOW INFORMATION: |
||||||||||||
| Cash paid during the year for: |
||||||||||||
| Interest |
$ | 30,062 | $ | 40,812 | $ | 45,322 | ||||||
| Income taxes |
$ | 300 | $ | — | $ | — | ||||||
| Non-cash investing and financing activities: |
||||||||||||
| Assets acquired through capital lease obligations |
$ | — | $ | 491 | $ | — | ||||||
| Dividends declared not yet paid |
$ | — | $ | — | $ | 2,244 | ||||||
| Non-cash proceeds from sale of property |
$ | — | $ | 750 | $ | — | ||||||
| Non-cash purchase of property and equipment |
$ | 7 | $ | 858 | $ | 1,156 | ||||||
The accompanying notes are an integral part of these consolidated financial statements
46
Table of Contents
Index to Financial Statements
CARMIKE CINEMAS, INC. and SUBSIDIARIES
CONSOLIDATED STATEMENTS OF STOCKHOLDERS’ EQUITY
(in thousands)
| Common Stock | Treasury Stock | Paid in Capital |
Accumulated Deficit |
Total | ||||||||||||||||||||
| Shares | Amount | Shares | Amount | |||||||||||||||||||||
| Balance at January 1, 2007 |
12,744 | $ | 383 | (281 | ) | $ | (8,258 | ) | $ | 292,870 | $ | (81,357 | ) | $ | 203,638 | |||||||||
| Stock issuance |
479 | 11 | — | — | 1,187 | — | 1,198 | |||||||||||||||||
| Net loss |
— | — | — | — | — | (126,890 | ) | (126,890 | ) | |||||||||||||||
| Purchase of treasury stock |
— | — | (120 | ) | (2,667 | ) | — | — | (2,667 | ) | ||||||||||||||
| Dividends declared |
— | — | — | — | (8,939 | ) | — | (8,939 | ) | |||||||||||||||
| Stock-based compensation |
— | — | — | — | 2,670 | — | 2,670 | |||||||||||||||||
| Balance at December 31, 2007 |
13,223 | 394 | (401 | ) | (10,925 | ) | 287,788 | (208,247 | ) | 69,010 | ||||||||||||||
| Stock issuance |
8 | — | — | — | — | — | — | |||||||||||||||||
| Net loss |
— | — | — | — | — | (41,391 | ) | (41,391 | ) | |||||||||||||||
| Purchase of treasury stock |
— | — | (1 | ) | (13 | ) | — | — | (13 | ) | ||||||||||||||
| Dividends declared |
— | — | — | — | (4,488 | ) | — | (4,488 | ) | |||||||||||||||
| Stock-based compensation |
— | — | — | — | 2,130 | — | 2,130 | |||||||||||||||||
| Balance at December 31, 2008 |
13,231 | 394 | (402 | ) | (10,938 | ) | 285,430 | (249,638 | ) | 25,248 | ||||||||||||||
| Stock issuance |
35 | 1 | — | — | — | — | 1 | |||||||||||||||||
| Net loss |
— | — | — | — | — | (15,413 | ) | (15,413 | ) | |||||||||||||||
| Purchase of treasury stock |
— | — | (1 | ) | (7 | ) | — | — | (7 | ) | ||||||||||||||
| Dividends declared |
— | — | — | — | — | — | — | |||||||||||||||||
| Stock-based compensation |
— | — | — | — | 1,473 | — | 1,473 | |||||||||||||||||
| Balance at December 31, 2009 |
13,266 | $ | 395 | (403 | ) | $ | (10,945 | ) | $ | 286,903 | $ | (265,051 | ) | $ | 11,302 | |||||||||
The accompanying notes are an integral part of these consolidated financial statements
47
Table of Contents
Index to Financial Statements
CARMIKE CINEMAS, INC. and SUBSIDIARIES
NOTES TO CONSOLIDATED FINANCIAL STATEMENTS
AS OF DECEMBER 31, 2009 AND 2008, AND FOR THE YEARS ENDED DECEMBER 31, 2009, 2008 AND 2007
(in thousands except per share data)
NOTE 1—ORGANIZATION, NATURE OF BUSINESS AND BASIS OF PRESENTATION
Carmike Cinemas, Inc. and its subsidiaries (referred to as “Carmike”, “we”, “us”, “our”, and the “Company”) is one of the largest motion picture exhibitors in the United States. The Company owns, operates or has an interest in 244 theatres in 35 states. Of the Company’s 244 theatres, 224 show films on a first-run basis and 20 are discount theatres. The Company targets small to mid-size non-urban markets with the belief that they provide a number of operating benefits, including lower operating costs and fewer alternative forms of entertainment. The Company operates motion picture theatres which generate revenues principally through admissions and concessions sales.
Basis of Presentation
The accompanying consolidated financial statements include those of Carmike and its subsidiaries, after elimination of all intercompany accounts and transactions. We have prepared the accompanying consolidated financial statements in accordance with accounting principles generally accepted in the United States of America (“GAAP”) and pursuant to the rules and regulations of the United States Securities and Exchange Commission (“SEC”).
NOTE 2—SIGNIFICANT ACCOUNTING POLICIES
Accounting Estimates
In the preparation of financial statements in conformity with GAAP, management must make certain estimates, judgments and assumptions. These estimates, judgments and assumptions are made when accounting for items and matters such as, but not limited to, depreciation, amortization, asset valuations, impairment assessments, lease classification, employee benefits, income taxes, reserves and other provisions and contingencies. These estimates are based on the information available when recorded. These estimates, judgments and assumptions can affect the reported amounts of assets and liabilities as of the date of the financial statements, as well as the reported amounts of revenue and expenses during the periods presented. The Company bases its estimates on historical experience and on various other assumptions that are believed to be reasonable under the circumstances, the results of which form the basis for making judgments about the carrying values of assets and liabilities that are not readily apparent from other sources. Actual results may differ from these estimates under different assumptions or conditions. Changes in estimates are recognized in the period they are determined.
Concentration of Risk
During 2009, we purchased substantially all of our concession and janitorial supplies, except for beverage supplies, from Showtime Concession Supply, Inc. (“Showtime Concession”). We are a significant customer of Showtime Concession. Our current agreement with Showtime Concession will expire on December 31, 2012. If this relationship was disrupted, we could be forced to negotiate a number of substitute arrangements with alternative vendors which are likely to be, in the aggregate, less favorable to us than the current arrangement.
Revenue Recognition
Admissions and concessions revenue is recognized at the point of sale for tickets and concessions. Sales taxes collected from customers are excluded from revenue and are recorded in accrued expenses in the accompanying consolidated balance sheets.
48
Table of Contents
Index to Financial Statements
The Company records proceeds from the sale of gift cards and other advanced sale-type certificates in current liabilities and recognizes admission and concession revenue when a holder redeems a gift card or other advanced sale-type certificate. The Company recognizes revenue from unredeemed gift cards and other advanced sale-type certificates upon the later of expiration of the cards or when redemption becomes unlikely. The Company’s conclusion that redemption is unlikely is based on an analysis of historical trends. Revenue recognition related to unredeemed gift cards and other advanced sale-type certificates totaled $2,509, $3,306 and $1,627 in 2009, 2008 and 2007, respectively.
Film Exhibition Costs
Film exhibition costs vary according to box office admissions and are accrued based on the Company’s terms and agreements with movie distributors. The agreements usually provide for a decreasing percentage of box office admissions to be paid to the movie studio over the first few weeks of the movie’s run, subject to a floor for later weeks. If firm terms do not apply, film exhibition costs are accrued based on the expected success of the film over a thirty to sixty day period and estimates of the final settlement with the movie studio. Settlements between the Company and the movie studios are completed three to four weeks after the movie’s run and have not historically resulted in significant adjustments to amounts previously recorded.
Comprehensive Income
The Company has no other comprehensive income items.
Segment Reporting
The Company’s chief operating decision maker currently manages the business as one operating segment. The Company’s measure of segment profit is consolidated operating income (loss).
Cash and Cash Equivalents
Cash equivalents are highly liquid investments with original maturities of three months or less at the date of purchase and consist primarily of money market accounts and deposits with banks that are federally insured in limited amounts. Payment due from banks for third-party credit and debit card transactions are generally received within 24 to 48 hours, except for transactions occurring on a Friday, which are generally processed the following Monday. Such amounts due from banks for credit and debit card transactions are also classified as cash and cash equivalents and aggregated $1,866 and $1,071 at December 31, 2009 and 2008, respectively.
Restricted Cash
Certain balances collected and due to third parties are classified as restricted cash.
Accounts Receivable
Accounts receivable consists of amounts owed from companies that operate under national contracts with the Company and are stated at their estimated collectible amounts, primarily vendor rebates and amounts due from advertisers. We have determined that no allowance for doubtful accounts is required as of December 31, 2009 and 2008 based on historical experience that payment is received in full.
Inventories
Inventories consist principally of concessions and theatre supplies and are stated at the lower of cost (first-in, first-out method) or market.
49
Table of Contents
Index to Financial Statements
Property and Equipment
Property and equipment are carried at cost (reduced for any impairment charges), net of accumulated depreciation and amortization.
Depreciation and amortization is computed on a straight-line basis as follows:
| Buildings and building improvements |
15-30 years | ||
| Assets subject to financing leases |
15-30 years | ||
| Leasehold improvements |
15-30 years | * | |
| Assets under capital leases |
11-25 years | * | |
| Equipment |
5-15 years |
| * | Based on the lesser of the useful life of the asset or the term of the applicable lease. |
Depreciation expense for continuing operations for the years ended December 31, 2009, 2008 and 2007 was $34,324, $37,552 and $39,502, respectively.
Included in buildings and building improvements are assets subject to financing leases with costs of $87,287 and $109,399 at December 31, 2009 and 2008, respectively, and accumulated depreciation of $24,194 and $25,405, respectively.
The Company capitalized interest of $0, $0 and $252 for the years ended December 31, 2009, 2008 and 2007, respectively, in connection with the construction of new theatres or additions to existing theatres.
The Company records the fair value of a liability for an asset retirement obligation in the period in which it is incurred (typically when a new lease is finalized) and capitalizes that amount as part of the book value of the long-lived asset. Over time, the liability is accreted to its present value, and the capitalized cost is depreciated over the estimated useful life of the related asset.
Assets Held for Sale
Assets identified for disposition are classified as assets held for sale, no longer subject to depreciation, and reported at the lower of their carrying amount or fair value less costs to sell. At December 31, 2009, the asset classifications that comprise “Assets held for Sale” include the carrying value of land of $1,093, building and building improvements of $1,041, and equipment of $115. Based on independent appraisals, the fair value of the assets less costs to sell exceeds the current carrying value of the assets held for sale. At December 31, 2008, the asset classifications that comprise “Assets held for Sale” include the carrying value of land of $1,928, building and building improvements of $1,398, and equipment of $329.
Fair Value Measurements
The methods and assumptions used to estimate fair value are as follows:
Cash and cash equivalents, accounts receivable, accounts payable and accrued liabilities:
The carrying amounts approximate fair value because of the short maturity of these instruments.
Long-term debt, excluding capital leases and financing obligations:
The fair value of the Senior Secured Credit Facilities is estimated based on quoted market prices on the date of measurement.
50
Table of Contents
Index to Financial Statements
Long-Lived Assets
The fair value of theatre assets that are determined to be impaired are based primarily on discounted cash flows, using market participant assumptions. Significant judgment is involved in estimating cash flows and fair value, and significant assumptions include attendance levels, admissions and concessions pricing, and the weighted average cost of capital. Management’s estimates are based on historical and projected operating performance.
Impairment of Long-Lived Assets
Long-lived assets are tested for recoverability whenever events or circumstances indicate that the assets’ carrying values may not be recoverable. The Company performs its impairment analysis at the individual theatre- level, the lowest level of independent, identifiable cash flow. Management reviews all available evidence when assessing long-lived assets for potential impairment, including negative trends in theatre-level cash flow, the impact of competition, the age of the theatre, and alternative uses of the assets. The Company’s evaluation of negative trends in theatre level cash flow considers seasonality of the business, with significant revenues and cash-flow being generated in the summer and year-end holiday season. Absent any unusual circumstances, management evaluates new theatres for potential impairment only after such theatre has been open and operational for a sufficient period of time to allow its operations to mature.
When an impairment indicator or triggering event has occurred, management estimates future, undiscounted theatre-level cash flow using assumptions based on historical performance and its internal budgets and projections, adjusted for market specific facts and circumstances. If the undiscounted cash flow is not sufficient to support recovery of the asset group’s carrying value, an impairment loss is recorded in the amount by which the carrying value exceeds estimated fair value of the asset group.
For the years ended December 31, 2009, 2008 and 2007, the Company recorded impairment charges of $17,814, $36,875 and $26,223, respectively, that were primarily as a result of deterioration in the full-year operating results of 25, 43, and 31 theatres, respectively.
Discontinued Operations
The results of operations for theatres that have been disposed of or classified as held for sale are eliminated from the Company’s continuing operations and classified as discontinued operations for each period presented within the Company’s consolidated statements of operations. Theatres are reported as discontinued when the Company no longer has continuing involvement in the theatre operations and the cash flows have been eliminated, which generally occurs when the Company no longer has operations in a given market. See Note 10—Discontinued Operations.
Income Taxes
The Company recognizes deferred tax assets and liabilities based on the differences between the financial statement carrying amounts and the tax basis of assets and liabilities. The Company regularly assesses the probability that the deferred tax asset balance will be recovered against future taxable income, taking into account such factors as earnings history, carryback and carryforward periods, limitations imposed by The Internal Revenue Code, and tax strategies. When the indications are that realization is unlikely, a valuation allowance is established against the deferred tax asset, increasing income tax expense in the year that conclusion is made. See Note 8—Income Taxes.
The accounting for uncertainty in income taxes currently prescribes a recognition threshold and measurement attribute for financial statement recognition and measurement of a tax position taken or expected to be taken in a tax return, provides guidance on derecognition, classification, interest and penalties, accounting in interim periods, and disclosure.
51
Table of Contents
Index to Financial Statements
Advertising
Advertising costs are expensed as incurred and included in film exhibition costs in the accompanying consolidated statements of operations. Advertising expenses totaled $5,663, $6,427 and $6,474 in 2009, 2008 and 2007, respectively.
Stock Based Compensation
Compensation expense for all stock-based compensation benefits is recognized over the requisite service period at the estimated fair value of the award at grant date. See Note 9 for a description of the Company’s stock plans and related disclosures.
Leases
The Company operates most of its theatres under non-cancelable lease agreements with initial base terms ranging generally from 15 to 20 years, and classifies these as operating, capital or financing based on an assessment at lease inception and when a modification is made to a lease. These leases generally provide for the payment of fixed monthly rentals, property taxes, common area maintenance, insurance, repairs and some of these leases provide for escalating payments over the lease period. The Company, at its option, can renew most of its leases at defined or then fair rental rates over varying periods. The Company generally does not consider the exercise of the renewal options as reasonably assured at lease inception for purposes of evaluating lease classification.
Several leases have a contingent component called percentage rent within the lease agreement. Percentage rent is generally based on a percentage of revenue in excess of a stated annual minimum as described within the lease. The Company recognizes contingent rent expense prior to achievement of the fixed breakpoint when it becomes probable that the breakpoint will be achieved. Contingent payments under capital leases and arrangements accounted for as financing obligations are charged to interest expense.
For leases classified as operating leases, the Company records rent expense on a straight-line basis, over the lease term, beginning with the date the Company has access to the property which in some cases is prior to commencement of lease payments. Accordingly, expense recognized in excess of lease payments is recorded as a deferred rent liability and is amortized to rental expense over the remaining term of the lease. The portion of our deferred rent liability that will be amortized to rent expense beyond one year is classified in other long-term liabilities. In some leases, the Company funded costs to the benefit of the landlord, which have been recorded as prepaid rent and amortized over the term of the lease on a straight-line basis.
For leases that are classified as capital leases, the property is recorded as a capital lease asset and a corresponding amount is recorded as a capital lease obligation in an amount equal to the lesser of the present value of minimum lease payments to be made over the lease life or the fair value of the property being leased. The Company amortizes its capital lease assets on a straight-line basis over the lesser of the lease term or the economic life of the property. The Company allocates each minimum lease payment between a reduction of the lease obligation and interest expense, yielding a fixed rate of interest throughout the lease obligation.
On certain leases the Company is involved with the construction of the building (typically on land owned by the landlord). When the Company is the deemed owner of the project for accounting purposes, the Company records the amount of total project costs incurred during the construction period. At completion of the construction project, the Company evaluates whether the transfer to the landlord/owner meets the requirements for sale-leaseback treatment. If it does not meet such requirements, which is typical, the Company records amounts funded by or received from the landlord as a financing obligation. Payments under such leases are bifurcated between the ground rent on the land, which is considered to be an operating lease, and payments for the building portion which is a financing obligation. The Company then allocates the lease payment for the building portion between a reduction of the financing obligation and interest expense, yielding a fixed rate of interest throughout the lease obligation.
52
Table of Contents
Index to Financial Statements
In certain leases, the last payment at the end of the lease term is settled by a transfer of the property to the landlord in settlement of the remaining financing obligation. The amount of amortization of the asset and the financing obligation is structured at the outset such that the remaining residual book value of the asset is always equal to or less than the remaining financing obligation at the end of the lease term. If the remaining financing obligation is greater than the residual book value at the end of the lease term, the Company will recognize a gain at the end of the lease term.
Debt Issuance Costs
Debt issuance costs are amortized to interest expense using the effective interest method over the life of the related debt.
New Senior Secured Term Loan Facility
On January 27, 2010, the Company entered into a new $265,000 senior secured term loan facility with an interest rate of LIBOR plus a margin of 3.5% (subject to a floor of 2.0%), or the base rate plus a margin of 2.5% (subject to a floor of 3.0%), as the Company may elect.
Recent Accounting Pronouncements
In April 2009, the Financial Accounting Standards Board (“FASB”) issued Accounting Standards Codification (“ASC”) 825-10-65, Financial Instruments—Transition Related to FSP FAS 107-1 and APB 28-1, Interim Disclosures about Fair Value of Financial Instruments to require disclosures about fair value of financial instruments in interim financial statements, which is effective for interim periods ending after September 15, 2009, but early adoption was permitted for interim periods ending after March 15, 2009. Refer to Note 14—Financial Instruments. An entity that elects to early adopt this provision must also early adopt other guidance that pertains to determining whether a market is not active and a transaction is not distressed and the recognition and presentation of other-than temporary impairments. The adoption of this guidance did not have an impact on the Company’s consolidated results of operations or financial position.
NOTE 3—IMPAIRMENT OF PROPERTY AND EQUIPMENT
Long-lived assets are tested for recoverability whenever events or circumstances indicate that the assets’ carrying values may not be recoverable. The Company performs its impairment analysis at the individual theatre- level, the lowest level of independent, identifiable cash flow. Management reviews all available evidence when assessing long-lived assets for potential impairment, including negative trends in theatre-level cash flow, the impact of competition, the age of the theatre, and alternative uses of the assets. The Company’s evaluation of negative trends in theatre level cash flow considers seasonality of the business, with significant revenues and cash-flow being generated in the summer and year-end holiday season. Absent any unusual circumstances, management evaluates new theatres for potential impairment only after such theatre has been open and operational for a sufficient period of time to allow its operations to mature.
53
Table of Contents
Index to Financial Statements
The Company recorded impairment charges of $17,814, $36,875, and $26,222, for the years ended December 31, 2009, 2008, and 2007, respectively, a portion of which was recorded in discontinued operations. These fair value estimates are considered Level 3 estimates. The estimated aggregate fair value of the long-lived assets impaired during the year ended December 31, 2009 was approximately $6,430.
| Years ended December 31, | |||||||||
| 2009 | 2008 | 2007 | |||||||
| Continuing Operations: |
|||||||||
| Theatre properties |
$ | 16,595 | $ | 32,122 | $ | 22,017 | |||
| Equipment |
959 | 4,217 | 740 | ||||||
| Impairment of long-lived assets |
$ | 17,554 | $ | 36,339 | $ | 22,757 | |||
| Discontinued Operations: |
|||||||||
| Theatre properties |
$ | 260 | $ | 536 | $ | 3,466 | |||
| Equipment |
— | — | — | ||||||
| Impairment of long-lived assets |
$ | 260 | $ | 536 | $ | 3,466 | |||
For 2009, impairment charges affected 25 theatres with 248 screens, and were primarily the result of (1) deterioration in the full-year operating results of 22 theatres, resulting in $16,216 in impairment charges using valuation inputs as of November 30, 2009; (2) the decline in fair market value of one owned theatre, resulting in $379 in impairment charges using valuation inputs as of December 31, 2009; (3) a decrease in the net realizable value of excess 35 millimeter projectors, resulting in a charge of $762; and (4) excess seat and equipment inventory from our theatre closures, resulting in a charge of $197.
For 2008, impairment charges affected 43 theatres with 379 screens, and were primarily the result of (1) deterioration in the full-year operating results of 33 theatres, resulting in $32,073 in impairment charges; (2) the pending sale of one closed theatre with a contract price less than carrying value, resulting in $49 in impairment charges; (3) a decrease in the net realizable value of excess 35 millimeter projectors, resulting in a charge of $2,085; and (4) excess seat and equipment inventory from our theatre closures, resulting in a charge of $2,132.
For 2007, impairment charges affected 31 theatres with 225 screens and were primarily the result of (1) deterioration in the full-year operating results of 25 of these theatres, resulting in $18,905 in impairment charges; (2) a fourth quarter decision to market one parcel of land and close six owned theatres and sell the related assets, resulting in $3,112 in impairment charges; and (3) excess 35 millimeter projectors as a result of the completion of our digital projection installation, resulting in charges of $740.
NOTE 4—GOODWILL AND OTHER INTANGIBLES
As of December 31, 2007, goodwill was evaluated for impairment in connection with the Company’s annual assessment. As a result of this assessment, goodwill was fully impaired resulting in a non-cash charge to earnings of $38,240. This impairment charge was the result of a fourth quarter decline in the Company’s stock price and full year 2007 operating results that were significantly lower than expectations. The Company estimated fair value using a combination of a discounted cash flow model and references to quoted market prices.
54
Table of Contents
Index to Financial Statements
At December 31, 2009 and 2008, the Company has recorded the value of certain lease intangibles and trade names as follows:
| December 31, | ||||||
| 2009 | 2008 | |||||
| Lease related intangibles |
$ | 1,862 | $ | 1,862 | ||
| Trade names |
500 | 500 | ||||
| Gross carrying value of intangible assets subject to amortization |
2,362 | 2,362 | ||||
| Less accumulated amortization |
1,111 | 970 | ||||
| Net carrying value |
$ | 1,251 | $ | 1,392 | ||
Amortization of such intangible assets was $142, $136, and $114, for the years ended December 31, 2009, 2008 and 2007, respectively. Accumulated amortization of such intangible assets was $ 1,111 and $970 as of December 31, 2009 and 2008, respectively.
Amortization expense of intangible assets for fiscal years 2010 through 2014 and thereafter is estimated to be approximately $149, $122, $112, $108, $104 and $656, respectively, with a remaining weighted average useful life of 7 years.
NOTE 5—OTHER ASSETS
At December 31, 2009 and 2008, other assets are as follows:
| December 31, | ||||||
| 2009 | 2008 | |||||
| Prepaid rent |
$ | 4,542 | $ | 4,966 | ||
| Debt issuance costs, net of amortization |
2,734 | 4,712 | ||||
| Deposits and insurance binders |
4,480 | 4,483 | ||||
| Note receivable |
750 | 750 | ||||
| Other |
6,942 | 8,475 | ||||
| $ | 19,448 | $ | 23,386 | |||
Note receivable is a three-year note that resulted from the sale of a theatre property in July 2008 that bears interest at 7% and is secured by a second mortgage on the property.
NOTE 6—DEBT
Former Term Loan Facilities
Debt consisted of the following as of December 31, 2009 and 2008:
| December 31, | ||||||||
| 2009 | 2008 | |||||||
| Term loan |
$ | 139,634 | $ | 161,213 | ||||
| Delayed draw term loan credit agreement |
111,152 | 112,303 | ||||||
| 250,786 | 273,516 | |||||||
| Current maturities |
(2,614 | ) | (2,822 | ) | ||||
| $ | 248,172 | $ | 270,694 | |||||
55
Table of Contents
Index to Financial Statements
In 2005, the Company entered into a credit agreement that provided for senior secured credit facilities in the aggregate principal amount of $405,000 consisting of:
| • | a $170,000 seven year term loan facility maturing in May 2012; |
| • | a $185,000 seven year delayed-draw term loan facility maturing in May 2012; and |
| • | a $50,000 five year revolving credit facility available for general corporate purposes maturing in May 2010 for which no amounts were outstanding as of December 31, 2009 or December 31, 2008. |
The Company was required to make principal repayments of the term loans in the amount of $653 on the last day of each calendar quarter. Beginning on September 30, 2011 this repayment amount would have increased to $61,716, due on each of September 30, 2011, December 31, 2011, March 31, 2012 and May 19, 2012 and reduced pro-rata based on any debt prepayments. Any amounts that would have been outstanding under the revolving credit facility would have been due and payable on May 19, 2010.
The interest rate for borrowings under the credit agreement, as amended, was set to a margin above the London interbank offered rate (“LIBOR”) or base rate, as the case may be, based on the Company’s corporate consolidated leverage ratio as defined in the credit agreement, with the margin ranging from 3.00% to 3.50% for loans based on LIBOR and 2.00% to 2.50% for loans based on the base rate. At December 31, 2009 and 2008, the average interest rate was 4.07% and 5.80%, respectively.
The credit agreement required that mandatory prepayments be made from (1) 100% of the net cash proceeds from certain asset sales and dispositions, other than a sales-leaseback transaction, and issuances of certain debt, (2) 85% of the net cash proceeds from sales-leaseback transactions, (3) various percentages (ranging from 0% to 75% depending on our consolidated leverage ratio) of excess cash flow as defined in the credit agreement, and (4) 50% of the net cash proceeds from the issuance of certain equity and capital contributions.
The senior secured credit facilities contained covenants which, among other things, restricted the Company’s ability, and that of its restricted subsidiaries, to:
| • | pay dividends or make any other restricted payments to parties other than to the Company; |
| • | incur additional indebtedness; |
| • | create liens on their assets; |
| • | make certain investments; |
| • | sell or otherwise dispose of their assets; |
| • | consolidate, merge or otherwise transfer all or any substantial part of their assets; and |
| • | enter into transactions with their affiliates. |
The senior secured credit facilities also contained financial covenants measured quarterly that required the Company to maintain specified ratios of funded debt to adjusted EBITDA (the “leverage ratio”) and adjusted EBITDA to interest expense (the “interest coverage ratio”).
The senior secured credit agreement placed certain restrictions on the Company ability to make capital expenditures.
As of December 31, 2009, the Company was in compliance with all of the financial covenants in its credit agreement.
The senior secured credit facilities were guaranteed by each of the Company’s subsidiaries and secured by a perfected first priority security interest in substantially all of its present and future assets.
56
Table of Contents
Index to Financial Statements
New Senior Secured Term Loan Facility and Revolving Credit Facility
On January 27, 2010, the Company entered into a new $265,000 senior secured term loan facility with an interest rate of LIBOR plus a margin of 3.5% (subject to a floor of 2.0%), or the base rate plus a margin of 2.5% (subject to a floor of 3.0%), as the Company may elect. The term loan borrowings are to be repaid in 23 consecutive quarterly installments, each in the amount of $663, with a balance of $249,763 due at final maturity on January 27, 2016. The proceeds were primarily used to repay the Company’s $170,000 seven year term loan that was due in May 2012 with an outstanding balance of $139,600 and its $185,000 seven year delayed-draw term loan facility that was due in May 2012 with an outstanding balance of $111,150. The Company will record a loss on early retirement of debt of approximately $2,700 during the three months ended March 31, 2010, which includes the write-off of unamortized debt issuance costs.
On January 27, 2010, the Company also entered into a new $30,000 revolving credit facility with an interest rate of LIBOR plus a margin of 4.0% (subject to a floor of 2.0%), or base rate plus a margin 3.0% (subject to a 3.0% floor), as the Company may elect. Thereafter, the applicable margins are subject to adjustment based on the Company’s ratio of total debt to EBITDA as reflected in the Company’s quarterly or annual financial statements, with the margins ranging from 3.50% to 4.00% on LIBOR based loans, and from 2.50% to 3.00% on base rate based loans. In addition, the Company is required to pay commitment fees on the unused portion of the new revolving credit facility. The commitment fee rate is initially 0.75% per annum, and is also subject to adjustment thereafter based on the Company’s ratio of total debt to EBITDA, with the rates ranging from 0.50% to 0.75%. The final maturity date of the new revolving credit facility is January 27, 2013.
The new senior secured term loan facility also contains financial covenants that require the Company to maintain a ratio of funded debt to adjusted EBITDA (“leverage ratio”) of no more than 4.75, a ratio of adjusted EBITDA to interest expense (“interest coverage ratio”) of no less than 1.75 and a ratio of total adjusted debt (adjusted for certain leases and financing obligations) to EBITDA plus rental expense (“EBITDAR ratio”) of no more than 7.15.
Within 90 days of the closing date of January 27, 2010, the Company is required as part of the new senior secured term loan facility to enter into interest rate protection to the extent necessary to provide that at least 50% of the term loan is subject to either a fixed interest rate or interest rate protection for a period of not less than three years.
Debt Maturities
The Company’s new senior secured term loan facility long-term debt obligations are as follows:
| 2010 | 2011 | 2012 | 2013 | 2014 | Thereafter | Total | ||||||||||||||
| Senior secured term loan |
$ | 2,650 | $ | 2,650 | $ | 2,650 | $ | 2,650 | $ | 2,650 | 251,750 | $ | 265,000 | |||||||
NOTE 7—ACCRUED EXPENSES
At December 31, 2009 and 2008, accrued expenses consisted of the following:
| December 31, | ||||||
| 2009 | 2008 | |||||
| Deferred revenues |
$ | 7,722 | $ | 9,696 | ||
| Accrued rents |
3,197 | 2,548 | ||||
| Property taxes |
6,669 | 6,539 | ||||
| Accrued interest |
1,104 | 1,331 | ||||
| Accrued salaries |
3,862 | 2,974 | ||||
| Sales taxes |
3,521 | 2,382 | ||||
| Income taxes |
3,835 | — | ||||
| Other accruals |
3,467 | 3,214 | ||||
| $ | 33,376 | $ | 28,684 | |||
57
Table of Contents
Index to Financial Statements
NOTE 8—INCOME TAXES
Income tax expense from continuing operations is summarized as follows:
| Year Ended December 31, | |||||||||
| 2009 | 2008 | 2007 | |||||||
| Current: |
|||||||||
| Federal |
$ | 3,605 | $ | — | $ | — | |||
| State |
754 | 363 | — | ||||||
| Deferred: |
|||||||||
| Federal |
— | — | 52,176 | ||||||
| State |
— | — | 3,727 | ||||||
| Total income tax expense |
$ | 4,359 | $ | 363 | $ | 55,903 | |||
The consolidated income tax expense was different from the amount computed using the U.S. statutory income tax rate for the following reasons:
| Year Ended December 31, | ||||||||||||
| 2009 | 2008 | 2007 | ||||||||||
| Pre-tax loss from continuing operations |
$ | (10,687 | ) | $ | (40,708 | ) | $ | (67,497 | ) | |||
| Federal tax (benefit) expense, at statutory rates |
(3,740 | ) | (14,422 | ) | (24,533 | ) | ||||||
| State tax (benefit) expense, net of federal tax effects |
(364 | ) | (1,174 | ) | (1,753 | ) | ||||||
| Non-deductible executive compensation |
— | — | 129 | |||||||||
| Non-deductible goodwill impairment |
— | — | 5,841 | |||||||||
| Other |
45 | (31 | ) | (71 | ) | |||||||
| Reduction in gross deferred tax assets due to IRC Section 382 limitations |
1,693 | 33,653 | 4,936 | |||||||||
| Increase (decrease) in valuation allowance |
6,725 | (17,663 | ) | 71,354 | ||||||||
| Total tax expense (benefit) from continuing operations |
$ | 4,359 | $ | 363 | $ | 55,903 | ||||||
Components of the Company’s deferred tax assets (liabilities) are as follows:
| December 31, | |||||||
| 2009 | 2008 | ||||||
| Net operating loss carryforwards |
$ | 7,242 | 7,394 | ||||
| Alternative minimum tax credit carryforwards |
760 | 760 | |||||
| Tax basis of property, equipment and other assets over book basis |
46,113 | 40,030 | |||||
| Deferred compensation |
849 | 939 | |||||
| Deferred rent |
5,627 | 5,298 | |||||
| Compensation accruals |
2,575 | 2,021 | |||||
| Other |
— | — | |||||
| Valuation allowance |
(63,166 | ) | (56,442 | ) | |||
| Net deferred tax asset |
$ | — | — | ||||
The Company experienced an “ownership change” within the meaning of Section 382(g) of the Internal Revenue Code of 1986, as amended, during the fourth quarter of 2008. The ownership change has and will continue to subject the Company’s net operating loss carryforwards to an annual limitation, which will significantly restrict its ability to use them to offset taxable income in periods following the ownership change. In general, the annual use limitation equals the aggregate value of the Company’s stock at the time of the ownership change multiplied by a specified tax-exempt interest rate.
58
Table of Contents
Index to Financial Statements
The Company determined that at the date of the ownership change, it had a net unrealized built-in loss (“NUBIL”). The NUBIL is determined based on the difference between the fair market value of the Company’s assets and their tax basis at the ownership change. Because of the NUBIL, certain deductions recognized during the five-year period beginning on the date of the IRC Section 382 ownership change (the “recognition period”) are subjected to the same limitation as the net operating loss carryforwards. Because the annual limitation is applied first against the realized built-in losses (“RBILs”), the Company does not expect to utilize any of its net operating carryforwards during the five year recognition period. The amount of RBILs limited was $6.0 million in 2009, which contributed to the current income tax expense. The amount of the disallowed RBILs could increase if the Company disposes of assets with built-in losses at the date of the ownership change during the recognition period.
At December 31, 2009, the Company had federal and state net operating loss carryforwards of $18.9 million, net of IRC Section 382 limitations, to offset the Company’s future taxable income. The federal and state operating loss carryforwards begin to expire in the year 2020. In addition, the Company’s alternative minimum tax credit carryforward has an indefinite carryforward life.
Valuation Allowance
At December 31, 2009 and December 31, 2008, the Company’s consolidated net deferred tax assets, net of IRC Section 382 limitations, were $63,166 and $56,442, respectively, before the effects of any valuation allowance. The Company regularly assesses whether it is more likely than not that its deferred tax asset balances will be recovered from future taxable income, taking into account such factors as earnings history, carryback and carryforward periods, IRC limitations and tax planning strategies. When sufficient evidence exists that indicates that recovery is uncertain, a valuation allowance is established against the deferred tax assets, increasing the Company’s income tax expense in the period that such conclusion is made.
A significant factor in the Company’s assessment of the recoverability of its deferred tax asset is its history of cumulative losses. During 2007, the Company concluded that the recoverability of the deferred tax assets was uncertain based upon cumulative losses in that year and the preceding two years and recorded at that time a valuation allowance to fully reserve its deferred tax assets. The valuation allowance increased during 2009 primarily due to the tax effect of impairment losses not deductible in the current period for tax purposes, which served to increase the gross deferred tax assets. The valuation allowance decreased during 2008 as a result of the limitations imposed by Section 382 on the Company’s net operating loss carryforwards and the related decrease in our deferred tax assets.
Income Tax Uncertainties
The tax benefit of the Company’s uncertain tax positions is reflected in its net operating loss carryforwards which have been significantly limited by IRC Section 382. As a result of the fourth quarter 2008 ownership change, the Company decreased its gross unrecognized tax benefits by $3,037 to reflect the de-recognition of tax positions resulting from the Section 382 limitations.
As of December 31, 2009, there are no tax positions the disallowance of which would significantly affect the Company’s annual effective income tax rate.
The Company files consolidated and separate income tax returns in the United States federal jurisdiction and in many state jurisdictions. The Company is no longer subject to United States federal income tax examinations for years before 2000 and is no longer subject to state and local income tax examinations by tax authorities for years before 1998.
The Company recognizes potential accrued interest and penalties related to unrecognized tax benefits within its income tax expense. Due to its net operating loss carryforward position, the Company recognized no interest and penalties at December 31, 2009 and December 31, 2008.
59
Table of Contents
Index to Financial Statements
NOTE 9—STOCKHOLDERS’ EQUITY
In March 2004, the Board of Directors adopted the 2004 Incentive Stock Plan (the “2004 Incentive Stock Plan”). The Company’s Compensation and Nominating Committee (or similar committee) may grant stock options, stock grants, stock units, and stock appreciation rights under the 2004 Incentive Stock Plan to certain eligible employees and to outside directors. As of December 31, 2009, there were 649,250 shares available for future grants under the 2004 Incentive Stock Plan.
The determination of the fair value of stock option awards on the date of grant using option-pricing models is affected by the Company’s stock price, as well as assumptions regarding a number of complex and subjective variables. These variables include the Company’s expected stock price volatility over the expected term of the awards, actual and projected employee stock option exercise behaviors, risk-free interest rates and expected dividends. The expected volatility is based on the historical volatility. The Company uses historical data to estimate stock option exercise and forfeiture rates. The expected term represents the period over which the share-based awards are expected to be outstanding. The dividend yield is an estimate of the expected dividend yield on the Company’s stock. The risk-free rate is based on U.S. Treasury yields in effect at the time of the grant for the expected term of the stock options. All stock option awards are amortized based on their graded vesting over the requisite service period of the awards.
The Company also issues restricted stock awards to certain key employees. Generally, the restricted stock vests over a one to three year period and compensation expense is recognized over the one to three year period equal to the grant date value of the shares awarded to the employee.
The Company’s policy is to issue new shares upon exercise of options and the issuance of stock grants.
The Company’s total stock-based compensation expense was approximately $1,473, $2,130 and $2,670 in 2009, 2008 and 2007, respectively. These amounts were recorded in general and administrative expenses. As of December 31, 2009, the Company had approximately $1,953 of total unrecognized compensation cost related to non-vested share-based compensation arrangements granted under the Company’s plans. This cost is expected to be recognized as stock-based compensation expense over a weighted-average period of 2.1 years. This expected cost does not include the impact of any future stock-based compensation awards.
Options—Service Condition Vesting
The Company currently uses the Black-Scholes option pricing model to determine the fair value of its stock options. The stock options shall automatically vest equally over a three-year period dependent that the employee remains continuously employed through the vesting date, except for options granted to members of the Board of Directors that vest immediately upon issuance. The stock options expire 10 years after the grant date.
The following table sets forth information about the weighted-average fair value of options granted, and the weighted-average assumptions for such options granted, during 2009 and 2007 (no options were granted during 2008):
| 2009 | 2007 | |||||||
| Weighted average fair value of options on grant date |
$ | 5.23 | $ | 5.50 | ||||
| Expected life (years) |
6.0 | 6.0 | ||||||
| Risk-free interest rate |
2.7 | % | 4.7 | % | ||||
| Expected dividend yield |
— | % | 2.70 | % | ||||
| Expected volatility |
68.4 | % | 34.0 | % | ||||
60
Table of Contents
Index to Financial Statements
The following table sets forth the summary of option activity for stock options with service vesting conditions for the year ended December 31, 2009:
| Shares | Weighted Average Exercise Price |
Weighted Average Remaining Contractual Life |
Aggregate Intrinsic Value | ||||||||
| Outstanding at January 1, 2009 |
165,000 | $ | 29.65 | ||||||||
| Granted |
410,000 | $ | 8.32 | 33 | |||||||
| Exercised |
— | $ | — | ||||||||
| Forfeited |
(25,000 | ) | $ | 10.82 | |||||||
| Outstanding at December 31, 2009 |
550,000 | $ | 14.60 | 7.77 | $ | 33 | |||||
| Exercisable on December 31, 2009 |
170,000 | $ | 28.43 | 3.98 | $ | 33 | |||||
| Expected to vest at December 31, 2009 |
380,000 | $ | 8.32 | 9.47 | $ | — | |||||
The intrinsic value of the options exercised during the years ended December 31, 2009, 2008 and 2007 was $0, $0 and $230, respectively. The fair value of options vested during the years ended December 31, 2009, 2008 and 2007 was $33, $0, and $0, respectively.
Options—Market Condition Vesting
In April 2007, the Compensation and Nominating Committee approved (pursuant to the 2004 Incentive Stock Plan) the grant of an aggregate of 260,000 stock options, at an exercise price equal to $25.95 per share, to a group of eight senior executives. The April 2007 stock option grants are aligned with market performance, as one-third of these stock options each will vest when the Company achieves an increase in the trading price of its common stock equal to 25%, 30% and 35%, respectively. The stock option grants expire 10 years from date of issuance. The Company determined the aggregate grant date fair value of these stock options to be approximately $1,430. The fair value of these options was estimated on the date of grant using a Monte Carlo simulation model. The model generates the fair value of the award at the grant date and compensation expense is not subsequently adjusted for the number of shares that are ultimately vested.
The following table sets forth the summary of option activity for the Company’s stock options with market condition vesting for the year ended December 31, 2009:
| Shares | Weighted Average Exercise Price |
Weighted Average Remaining Contractual Life |
Aggregate Intrinsic Value | ||||||||
| Outstanding at January 1, 2009 |
260,000 | $ | 25.95 | 8.29 | |||||||
| Granted |
— | — | |||||||||
| Forfeited |
(70,000 | ) | |||||||||
| Outstanding at December 31, 2009 |
190,000 | $ | 25.95 | 7.29 | $ | — | |||||
| Exercisable at December 31, 2009 |
— | $ | — | — | $ | — | |||||
| Expected to vest at December 31, 2009 |
— | $ | — | — | $ | — | |||||
61
Table of Contents
Index to Financial Statements
Restricted Stock
The following table sets forth the summary of activity for restricted stock grants for the year ended December 31, 2009:
| Shares | Weighted Average Grant Date Fair Value | |||||
| Nonvested at December 31, 2008 |
160,668 | $ | 24.45 | |||
| Granted |
65,000 | $ | 8.31 | |||
| Vested |
(16,668 | ) | $ | 11.48 | ||
| Forfeited |
(29,500 | ) | $ | 25.95 | ||
| Nonvested at December 31, 2009 |
179,500 | $ | 19.56 | |||
NOTE 10—DISCONTINUED OPERATIONS
Theatres are generally considered for closure due to an expiring lease term, underperformance, or the opportunity to better deploy invested capital. In 2009, 2008 and 2007, the Company closed eleven, seventeen and twenty-eight theatres, respectively. Of those closures, in 2009, 2008 and 2007, the Company classified three, eleven, and twenty theatres, respectively, as discontinued operations. The Company reported the results of these operations, including gains or losses in disposal, as discontinued operations. The operations and cash flow of these theatres have been eliminated from the Company’s operations, and the Company will not have any continuing involvement in their operations. There was no tax expense or benefit allocated to discontinued operations for 2008 and 2007 because the Company had a loss from continuing and discontinued operations in those periods and a full tax valuation allowance.
All activity from prior years included in the accompanying consolidated statements of operations has been reclassified to separately reflect the results of operations from discontinued operations through the respective date of the theatre closings. Assets and liabilities associated with the discontinued operations have not been segregated from assets and liabilities from continuing operations as they are not material.
The following table sets forth the summary of activity for discontinued operations for the years ended December 31, 2009, 2008, and 2007:
| For the year ended December 31, | ||||||||||||
| 2009 | 2008 | 2007 | ||||||||||
| Revenue from discontinued operations |
$ | 457 | $ | 4,142 | 11,079 | |||||||
| Operating loss before income taxes |
$ | (491 | ) | $ | (1,464 | ) | $ | (5,718 | ) | |||
| Income tax benefit for discontinued operations |
$ | 189 | $ | — | $ | — | ||||||
| Gain (loss) on disposal, before taxes |
$ | (106 | ) | $ | 1,144 | $ | 2,228 | |||||
| Income tax benefit on disposal |
$ | 41 | $ | — | $ | — | ||||||
| Loss from discontinued operations |
$ | (367 | ) | $ | (320 | ) | $ | (3,490 | ) | |||
NOTE 11—BENEFIT PLANS
The Company maintains a funded non-qualified deferred compensation program for its senior executives pursuant to which it pays additional compensation equal to 10% of the senior executive’s annual compensation. The Company directs this additional cash compensation first into the senior executive’s individual retirement account, up to the legal limit, with the remainder directed into a trust. Distributions from the applicable trust are made upon or shortly after the executive reaches age 70, disability, death, or earlier election by the executive after age 60. The Company also pays certain non-executive employees additional cash contributions to the employee’s individual retirement account in amounts that are determined at management’s discretion. Aggregate contributions to all such accounts in cash amounted to $480, $562 and $1,365 for the years ended December 31, 2009, 2008 and 2007, respectively.
62
Table of Contents
Index to Financial Statements
NOTE 12—COMMITMENTS AND CONTINGENCIES
Lease Obligations
At December 31, 2009, payments required on operating leases, capital leases and financing obligations are as follows:
| Operating Leases |
Capital Leases |
Financing Obligations |
||||||||
| 2010 |
$ | 44,394 | $ | 6,355 | 10,374 | |||||
| 2011 |
41,541 | 6,248 | 11,243 | |||||||
| 2012 |
39,641 | 5,993 | 11,409 | |||||||
| 2013 |
38,313 | 6,067 | 11,741 | |||||||
| 2014 |
37,458 | 5,963 | 11,553 | |||||||
| Thereafter |
239,035 | 37,848 | 192,031 | |||||||
| Total minimum lease payments |
$ | 440,382 | 68,474 | 248,351 | ||||||
| Less interest on capital and financing obligations |
(37,083 | ) | (161,411 | ) | ||||||
| Present value of future minimum lease payments |
31,391 | 86,940 | ||||||||
| Less current maturities |
(1,532 | ) | (115 | ) | ||||||
| Long-term obligations |
$ | 29,859 | 86,825 | |||||||
Rent expense on operating leases was approximately $47,462, $43,647 and $45,094 for 2009, 2008 and 2007, respectively. Included in such amounts are approximately $1,597, $1,085 and $1,236 in contingent rental expense for 2009, 2008 and 2007, respectively. Interest expense includes $1,452, $1,274 and $1,366 for 2009, 2008 and 2007, respectively, related to contingent rent on capital leases and financing obligations.
Self Insurance – General Liability and Workers Compensation Insurance
The Company maintains a deductible of $150 per claim on its general liability insurance policy and a deductible of $300 per claim on its workers compensation insurance policy. The Company uses historical data and actuarial estimates to estimate the cost of claims incurred that are not covered by the insurance policies as of the balance sheet date. The Company recorded a liability of $1,404, $1,505 and $1,733 at December 31, 2009, 2008, and 2007, respectively.
NOTE 13—LITIGATION
From time to time, the Company is involved in routine litigation and legal proceedings in the ordinary course of its business, such as personal injury claims, employment matters, contractual disputes and claims alleging Americans with Disabilities Act violations. Currently, there is no pending litigation or proceedings that the Company’s management believes will have a material adverse effect, either individually or in the aggregate, on its business or financial condition.
NOTE 14—FINANCIAL INSTRUMENTS
The fair value of the Senior Secured Credit Facilities described in Note 6—“Debt” which consists of the Term Loan Facility, Delayed-Draw Term Loan Facility, and the Revolving Facility, is estimated based on quoted market prices at the date of measurement.
| Years ended December 31, | ||||||
| 2009 | 2008 | |||||
| Carrying amount |
$ | 250,785 | $ | 273,516 | ||
| Fair value |
$ | 242,885 | $ | 211,975 | ||
63
Table of Contents
Index to Financial Statements
NOTE 15—NET INCOME (LOSS) PER SHARE
Basic net income (loss) per common share has been computed using the weighted-average number of shares of common stock outstanding during the period. Diluted income (loss) per share is computed using the weighted average number of common shares and common stock equivalents outstanding. As a result of the Company’s net losses, for the years ended December 31, 2009, 2008, and 2007, common stock equivalents of 11, 0, and 41 respectively, were excluded from the calculation of diluted loss per share given their anti-dilutive effect.
| Years ended December 31, | ||||||||||||
| 2009 | 2008 | 2007 | ||||||||||
| Weighted average shares outstanding |
12,852 | 12,826 | 12,709 | |||||||||
| Less: restricted stock issued |
(174 | ) | (165 | ) | (110 | ) | ||||||
| Basic divisor |
12,678 | 12,661 | 12,599 | |||||||||
| Dilutive Shares: |
||||||||||||
| Stock Options |
— | — | — | |||||||||
| Diluted divisor |
12,678 | 12,661 | 12,599 | |||||||||
| Net loss per share: |
||||||||||||
| Basic and Diluted |
$ | (1.22 | ) | $ | (3.27 | ) | $ | (10.07 | ) | |||
NOTE 16—QUARTERLY RESULTS (UNAUDITED)
The following tables set forth certain unaudited results of operations for each quarter during 2009 and 2008. The unaudited information has been prepared on the same basis as the annual consolidated financial statements and includes all adjustments which management considers necessary for a fair presentation of the financial data shown. The operating results for any quarter are not necessarily indicative of the results to be attained for any future period. Basic and diluted income (loss) per share is computed independently for each of the periods presented. Accordingly, the sum of the quarterly income (loss) per share may not agree to the total for the year.
| 1st Quarter (1) |
2nd Quarter (1) |
3rd Quarter (1) |
4th Quarter (2) |
Total | ||||||||||||||||
| Year ended December 31, 2009 |
||||||||||||||||||||
| Total revenues from continuing operations |
$ | 121,802 | $ | 133,104 | $ | 122,372 | $ | 137,436 | $ | 514,714 | ||||||||||
| Operating income (loss) from continuing operations |
5,329 | 11,739 | (12,912 | ) | 18,225 | 22,380 | ||||||||||||||
| Net income (loss) |
$ | (3,997 | ) | $ | 2,826 | $ | (20,655 | ) | $ | 6,070 | $ | (15,756 | ) | |||||||
| Net loss per common share: |
||||||||||||||||||||
| Basic |
$ | (0.32 | ) | $ | 0.22 | $ | (1.63 | ) | $ | 0.48 | $ | (1.24 | ) | |||||||
| Diluted |
$ | (0.32 | ) | $ | 0.22 | $ | (1.63 | ) | $ | 0.48 | $ | (1.24 | ) | |||||||
| 1st Quarter (1) |
2nd Quarter (1)(3) |
3rd Quarter (1) |
4th Quarter (2) |
Total | ||||||||||||||||
| Year ended December 31, 2008 |
||||||||||||||||||||
| Total revenues from continuing operations |
$ | 116,138 | $ | 117,318 | $ | 122,238 | $ | 116,984 | $ | 472,678 | ||||||||||
| Operating income (loss) from continuing operations |
6,424 | 8,464 | 9,707 | (25,036 | ) | (441 | ) | |||||||||||||
| Net loss |
$ | (4,338 | ) | $ | (2,219 | ) | $ | (203 | ) | $ | (34,631 | ) | $ | (41,391 | ) | |||||
| Net income (loss) per common share: |
||||||||||||||||||||
| Basic |
$ | (0.34 | ) | $ | (0.18 | ) | $ | (0.02 | ) | $ | (2.73 | ) | $ | (3.27 | ) | |||||
| Diluted |
$ | (0.34 | ) | $ | (0.18 | ) | $ | (0.02 | ) | $ | (2.73 | ) | $ | (3.27 | ) | |||||
| (1) | In connection with reporting for discontinued operations the Company has reclassified the quarterly results. |
64
Table of Contents
Index to Financial Statements
| (2) | In connection with the asset impairment evaluations, the Company recognized additional impairment charges attributable to underperforming assets in the third quarter 2009 and fourth quarter of 2008 (see Note 3 for additional information). |
| (3) | In connection with the separation agreement with the former Chief Executive Officer and other former employees, the Company recognized charges in the first quarter of 2009. |
NOTE 17—SEPARATION AGREEMENT CHARGES
In January 2009, the Company’s former Chairman, Chief Executive Officer and President, Michael W. Patrick, ceased employment with the Company. In February 2009, the Company and Mr. Patrick entered into a separation agreement and general release (the “Separation Agreement”) setting forth the terms of his departure from the Company. Pursuant to the Separation Agreement, the Company made a lump sum payment to Mr. Patrick of $5,000 in July 2009 and paid all of Mr. Patrick’s club membership dues through 2009. Mr. Patrick will continue to receive medical benefits and group life insurance coverage until January 2012. Should Mr. Patrick die on or before January 31, 2012, the Company will pay the sum of $850 to Mr. Patrick’s surviving spouse or other designated beneficiary. The consideration payable to Mr. Patrick under the Separation Agreement was based on the terms of his employment agreement and the other agreements contained in the Separation Agreement, including its mutual release, non-compete and standstill provisions. The Company recorded charges of $5,462, including legal and related costs, in its results of operations for the year ended December 31, 2009 for the estimated costs associated with the separation agreement.
65
Table of Contents
Index to Financial Statements
| ITEM 9. | CHANGES IN AND DISAGREEMENTS WITH ACCOUNTANTS ON ACCOUNTING AND FINANCIAL DISCLOSURE. |
None.
| ITEM 9A. | CONTROLS AND PROCEDURES. |
Disclosure Controls and Procedures
We maintain disclosure controls and procedures designed to ensure that information required to be disclosed in the reports that we file or submit under the Exchange Act is recorded, processed, summarized and reported within the time periods specified in the SEC’s rules and forms. Disclosure controls and procedures, as defined in Rules 13a-15(e) and 15d-15(e) under the Exchange Act, include controls and procedures designed to ensure that information required to be disclosed in the reports we file or submit under the Exchange Act is accumulated and communicated to our management, including the principal executive officer and the chief financial officer, as appropriate, to allow timely decisions regarding required disclosure. It should be noted that any system of controls, however well designed and operated, can provide only reasonable, and not absolute, assurance that the objectives of the system are met.
As required by SEC rules, we have evaluated the effectiveness of the design and operation of our disclosure controls and procedures as of the end of the period covered by this Annual Report on Form 10-K. This evaluation was carried out under the supervision and with the participation of our management, including our principal executive officer and chief financial officer. Based on this evaluation, these officers have concluded that, as of December 31, 2009 our disclosure controls and procedures were effective.
Management’s Report on Internal Control Over Financial Reporting
Our management is responsible for establishing and maintaining adequate internal control over financial reporting, as such term is defined in Exchange Act Rule 13a-15(f). Internal control over financial reporting is a process designed under the supervision of our principal executive officer and chief financial officer to provide reasonable assurance regarding the reliability of financial reporting and the preparation of financial statements for external purposes in accordance with generally accepted accounting principles. Under the supervision and with the participation of our management, including our principal executive officer and chief financial officer, we conducted an evaluation of the effectiveness of our internal control over financial reporting based on the criteria established in Internal Control—Integrated Framework issued by the Committee of Sponsoring Organizations of the Treadway Commission (COSO). Based on this assessment, management concluded that our internal control over financial reporting was effective as of December 31, 2009.
Our internal control over financial reporting as of December 31, 2009 has been audited by Deloitte & Touche LLP, an independent registered public accounting firm. Their report is included herein.
Changes in Internal Control Over Financial Reporting
There has been no change in the Company’s internal control over financial reporting during the three months ended December 31, 2009 that has materially affected, or is reasonably likely to materially affect, the Company’s internal control over financial reporting.
Limitation on Controls
Management does not expect that our disclosure controls and procedures or our internal control over financial reporting will prevent or detect all errors or fraud. Any control system, no matter how well designed and operated, is based upon certain assumptions and can provide only reasonable, not absolute, assurance that its objectives will be met. Further, no evaluation of controls can provide absolute assurance that misstatements due to error or fraud will not occur or that all control issues and instances of fraud, if any, with the Company have been detected.
66
Table of Contents
Index to Financial Statements
REPORT OF INDEPENDENT REGISTERED PUBLIC ACCOUNTING FIRM
To the Board of Directors and Stockholders of Carmike Cinemas, Inc.
Columbus, Georgia
We have audited the internal control over financial reporting of Carmike Cinemas, Inc. and subsidiaries (the “Company”) as of December 31, 2009, based on criteria established in Internal Control—Integrated Framework issued by the Committee of Sponsoring Organizations of the Treadway Commission. The Company’s management is responsible for maintaining effective internal control over financial reporting and for its assessment of the effectiveness of internal control over financial reporting in the accompanying “Management’s Report on Internal Control Over Financial Reporting”. Our responsibility is to express an opinion on the Company’s internal control over financial reporting based on our audit.
We conducted our audit in accordance with the standards of the Public Company Accounting Oversight Board (United States). Those standards require that we plan and perform the audit to obtain reasonable assurance about whether effective internal control over financial reporting was maintained in all material respects. Our audit included obtaining an understanding of internal control over financial reporting, assessing the risk that a material weakness exists, testing and evaluating the design and operating effectiveness of internal control based on that risk, and performing such other procedures as we considered necessary in the circumstances. We believe that our audit provides a reasonable basis for our opinion.
A company’s internal control over financial reporting is a process designed by, or under the supervision of, the company’s principal executive and principal financial officers, or persons performing similar functions, and effected by the company’s board of directors, management, and other personnel to provide reasonable assurance regarding the reliability of financial reporting and the preparation of financial statements for external purposes in accordance with generally accepted accounting principles. A company’s internal control over financial reporting includes those policies and procedures that (1) pertain to the maintenance of records that, in reasonable detail, accurately and fairly reflect the transactions and dispositions of the assets of the company; (2) provide reasonable assurance that transactions are recorded as necessary to permit preparation of financial statements in accordance with generally accepted accounting principles, and that receipts and expenditures of the company are being made only in accordance with authorizations of management and directors of the company; and (3) provide reasonable assurance regarding prevention or timely detection of unauthorized acquisition, use, or disposition of the company’s assets that could have a material effect on the financial statements.
Because of the inherent limitations of internal control over financial reporting, including the possibility of collusion or improper management override of controls, material misstatements due to error or fraud may not be prevented or detected on a timely basis. Also, projections of any evaluation of the effectiveness of the internal control over financial reporting to future periods are subject to the risk that the controls may become inadequate because of changes in conditions, or that the degree of compliance with the policies or procedures may deteriorate.
In our opinion, the Company maintained, in all material respects, effective internal control over financial reporting as of December 31, 2009, based on the criteria established in Internal Control—Integrated Framework issued by the Committee of Sponsoring Organizations of the Treadway Commission.
We have also audited in accordance with the standards of the Public Company Accounting Oversight Board (United States) the Company’s consolidated financial statements as of and for the year ended December 31, 2009 and our report dated March 1, 2010 expressed an unqualified opinion on those financial statements.
/s/ Deloitte & Touche LLP
Atlanta, Georgia
March 1, 2010
67
Table of Contents
Index to Financial Statements
| ITEM 9B. | OTHER INFORMATION. |
None.
68
Table of Contents
Index to Financial Statements
| ITEM 10. | DIRECTORS, EXECUTIVE OFFICERS AND CORPORATE GOVERNANCE. |
Information regarding our executive officers is set forth in Item X of Part I “Executive Officers of the Registrant” of this annual report on Form 10-K.
Information regarding our directors is incorporated by reference from the section entitled “Proposal One—Election of Directors” in our Proxy Statement relating to our 2010 Annual Meeting of Stockholders (“2010 Proxy Statement”).
Information regarding compliance with Section 16(a) of the Exchange Act is incorporated by reference from the section entitled “Section 16(a) Beneficial Ownership Reporting Compliance” contained in the 2010 Proxy Statement.
We have adopted a Code of Ethics for Senior Executive and Financial Officers (the “Code of Ethics”) that applies to our principal executive officer, principal financial officer and principal accounting officer. The Code of Ethics is available on our website at www.carmike.com under the “Corporate Governance” caption. Any amendments to, or waivers of, the Code of Ethics will be disclosed on our website promptly following the date of such amendment or waiver.
There have been no material changes to the procedures by which stockholders may recommend nominees to our board of directors since we reported such procedures in the 2010 Proxy Statement.
Information regarding our Audit Committee, its members and the audit committee financial experts is incorporated by reference from the subsection entitled “Committees of the Board of Directors—Audit Committee” in the section entitled “Corporate Governance” in our 2010 Proxy Statement.
| ITEM 11. | EXECUTIVE COMPENSATION. |
Information regarding executive compensation is incorporated by reference from the sections entitled “Executive Compensation” and “Compensation and Nominating Committee Interlocks and Insider Participation” contained in the 2010 Proxy Statement.
| ITEM 12. | SECURITY OWNERSHIP OF CERTAIN BENEFICIAL OWNERS AND MANAGEMENT AND RELATED STOCKHOLDER MATTERS. |
Information required by this item is incorporated by reference from the sections entitled “Security Ownership of Certain Beneficial Holders and Management” and “Compensation Plans” contained in the 2010 Proxy Statement.
| ITEM 13. | CERTAIN RELATIONSHIPS AND RELATED TRANSACTIONS AND DIRECTOR INDEPENDENCE. |
Information regarding certain relationships and related party transactions is incorporated by reference from the section entitled “Certain Relationships and Related Party Transactions” contained in the 2010 Proxy Statement. Information regarding director independence is incorporated by reference from the section entitled “Proposal One—Election of Directors” contained in the 2010 Proxy Statement.
| ITEM 14. | PRINCIPAL ACCOUNTANT FEES AND SERVICES. |
Information regarding principal accountant fees and services is incorporated by reference from the section entitled “Fees Paid to Independent Auditors” contained in the 2010 Proxy Statement.
69
Table of Contents
Index to Financial Statements
| ITEM 15. | EXHIBITS AND FINANCIAL STATEMENT SCHEDULES. |
(a)(1) The following consolidated financial statements of Carmike Cinemas, Inc. are included in Item 8. Financial Statements and Supplementary Data.
Financial Statements:
| Report of Deloitte & Touche LLP, Independent Registered Public Accounting Firm |
| Consolidated Balance Sheets as of December 31, 2009 and 2008 |
| Consolidated Statements of Operations for Years ended December 31, 2009, 2008 and 2007 |
| Consolidated Statements of Cash Flows for Years ended December 31, 2009, 2008 and 2007 |
| Consolidated Statements of Stockholders’ Equity for Years ended December 31, 2009, 2008 and 2007 |
| Notes to Consolidated Financial Statements |
(a)(2) All financial statement schedules are omitted because they are not applicable or not required under the related instructions, or because the required information is shown either in the consolidated financial statements or in the notes thereto.
(a)(3) Listing of Exhibits
Periodic reports, proxy statements and other information filed by Carmike with the SEC pursuant to the informational requirements of the Exchange Act may be inspected and copied at the public reference facilities maintained by the SEC at 100 F Street, N.E., Room 1580, Washington, D.C. 20549. Information on the operation of the Public Reference Room may be obtained by calling the SEC at 1-800-SEC-0330. The SEC also maintains a web site (http://www.sec.gov) that makes available reports, proxy statements and other information regarding Carmike. Carmike’s SEC file number reference is Commission File No. 000-14993.
| Exhibit |
Description | |
| 2.3 | Stock Purchase Agreement, dated as of April 19, 2005, by and among Carmike and each of Beth Kerasotes (individually and as executor and trustee under the will of George G. Kerasotes) and Marjorie Kerasotes, the shareholders of George G. Kerasotes Corporation, a Delaware corporation (filed as Exhibit 2.3 to Carmike’s Form 10-Q for the quarter ended March 31, 2005 and incorporated herein by reference). | |
| 3.1 | Amended and Restated Certificate of Incorporation of Carmike Cinemas, Inc. (filed as Exhibit 3.1 to Carmike’s Amendment to Form 8-A filed January 31, 2002 and incorporated herein by reference). | |
| 3.2 | Amended and Restated By-Laws of Carmike Cinemas, Inc. (filed as Exhibit 3.1 to Carmike’s Form 8-K filed January 22, 2009 and incorporated herein by reference). | |
| 10.1 | Credit Agreement, dated as of May 19, 2005, by and among Carmike Cinemas, Inc., as Borrower, the several banks and other financial institutions or entities from time to time parties to the Credit Agreement, Bear, Stearns & Co. Inc., as Sole Lead Arranger and Sole Bookrunner, Wells Fargo Foothill, Inc., as Documentation Agent, and Bear Stearns Corporate Lending Inc., as Administrative Agent (filed as Exhibit 10.1 to Carmike’s Current Report on Form 8-K filed May 25, 2005 and incorporated herein by reference). | |
| 10.2 | First Amendment, dated as of June 7, 2005, to the Credit Agreement, dated as of May 19, 2005, by and among Carmike Cinemas, Inc., as Borrower, the several banks and other financial institutions or entities from time to time parties to the Credit Agreement, Bear, Stearns & Co. Inc., as Sole Lead Arranger and Sole Bookrunner, Wells Fargo Foothill, Inc., as Documentation Agent, and Bear Stearns Corporate Lending Inc., as Administrative Agent (filed as Exhibit 10.1 to Carmike’s Current Report on Form 8-K filed June 28, 2005 and incorporated herein by reference). | |
70
Table of Contents
Index to Financial Statements
| Exhibit |
Description | |
| 10.3 | Second Amendment, dated as of March 28, 2006, to the Credit Agreement, dated as of May 19, 2005, by and among Carmike Cinemas, Inc., the several banks and other financial institutions parties thereto, Wells Fargo Foothill, Inc. and Bear Stearns Corporate Lending Inc. (filed as Exhibit 10.1 to Carmike’s Current Report on Form 8-K filed April 5, 2006 and incorporated herein by reference). | |
| 10.4 | Third Amendment, dated as of May 9, 2006, to the Credit Agreement, dated as of May 19, 2005, by and among Carmike Cinemas, Inc., the several banks and other financial institutions parties thereto, Wells Fargo Foothill, Inc. and Bear Stearns Corporate Lending Inc. (filed as Exhibit 10.1 to Carmike’s Current Report on Form 8-K filed May 15, 2006 and incorporated herein by reference). | |
| 10.5 | Fourth Amendment, dated as of June 2, 2006, to the Credit Agreement, dated as of May 19, 2005, by and among Carmike Cinemas, Inc., the several banks and other financial institutions parties thereto, Wells Fargo Foothill, Inc. and Bear Stearns Corporate Lending Inc. (filed as Exhibit 10.36 to Carmike’s Annual Report on Form 10-K for the year ended December 31, 2005 and incorporated herein by reference). | |
| 10.6 | Fifth Amendment, dated as of July 27, 2006, to the Credit Agreement, dated as of May 19, 2005, by and among Carmike Cinemas, Inc., the several banks and other financial institutions parties thereto, Wells Fargo Foothill, Inc. and Bear Stearns Corporate Lending Inc. and First Amendment, dated as of July 27, 2006, to Guarantee and Collateral Agreement, dated as of May 19, 2005, made by Carmike Cinemas, Inc. and certain of its subsidiaries in favor of Bear Stearns Corporate Lending Inc. (filed as Exhibit 10.37 to Carmike’s Annual Report on Form 10-K for the year ended December 31, 2005 and incorporated herein by reference). | |
| 10.7 | Sixth Amendment, dated as of September 28, 2006, to the Credit Agreement, dated as of May 19, 2005, by and among Carmike Cinemas, Inc., the several banks and other financial institutions parties thereto, Wells Fargo Foothill, Inc. and Bear Stearns Corporate Lending Inc. (filed as Exhibit 10.1 to Carmike’s Current Report on Form 8-K filed October 4, 2006 and incorporated herein by reference). | |
| 10.8 | Seventh Amendment, dated as of July 27, 2007, to the Credit Agreement, dated as of May 19, 2005, by and among Carmike Cinemas, Inc., as Borrower, the several banks and other financial institutions or entities from time to time parties to the Credit Agreement, Bear, Stearns & Co. Inc., as Sole Lead Arranger and Sole Bookrunner, Wells Fargo Foothill, Inc., as Documentation Agent, and Bear Stearns Corporate Lending Inc., as Administrative Agent (filed as Exhibit 10.1 to Carmike’s Quarterly Report on Form 10-Q filed on August 7, 2007 and incorporated herein by reference). | |
| 10.9 | Eighth Amendment, dated as of October 17, 2007, to the Credit Agreement, dated as of May 19, 2005, by and among Carmike Cinemas, Inc., as Borrower, the several banks and other financial institutions or entities from time to time parties to the Credit Agreement, Bear, Stearns & Co. Inc., as Sole Lead Arranger and Sole Bookrunner, Wells Fargo Foothill, Inc., as Documentation Agent, and Bear Stearns Corporate Lending Inc., as Administrative Agent (filed as Exhibit 10.1 to Carmike’s Current Report on Form 8-K filed October 22, 2007 and incorporated herein by reference). | |
| 10.10 | Credit Agreement, dated as of January 27, 2010, by and among Carmike Cinemas, Inc., as borrower, the several banks and other financial institutions or entities from time to time parties to the Credit Agreement, as lenders, J.P. Morgan Securities Inc. and Citigroup Global Markets Inc., as joint lead arrangers and joint bookrunners, Macquarie Capital (USA) Inc., as documentation agent, Citibank, N.A., as syndication agent, and JPMorgan Chase Bank, N.A., as administrative agent (filed as Exhibit 10.1 to Carmike’s Current Report on Form 8-K filed on January 27, 2010 and incorporated herein by reference). | |
| 10.11 | Second Amended and Restated Master Lease, dated September 1, 2001, between MoviePlex Realty Leasing, L.L.C. and Carmike Cinemas, Inc. (filed as Exhibit 10.17 to Carmike’s Annual Report on Form 10-K for the year ended December 31, 2001 and incorporated herein by reference). | |
71
Table of Contents
Index to Financial Statements
| Exhibit |
Description | |
| 10.12 | First Amendment to Second Amended and Restated Master Lease, dated as of July 12, 2004, between MoviePlex Realty Leasing L.L.C. and Carmike Cinemas, Inc. (filed an Exhibit 10.2 to Carmike’s Form S-3 (Registration No. 333-117403) filed July 16, 2004 and incorporated herein by reference). | |
| 10.13* | Form of Deferred Compensation Agreement and Schedule of Officers who have entered into such agreement (filed as Exhibit 10.11 to Carmike’s Annual Report on Form 10-K for the year ended December 31, 2006 and incorporated herein by reference). | |
| 10.14* | Form Amendment Number One to the Deferred Compensation Agreement (filed as Exhibit 10.1 to Carmike’s Current Report on Form 8-K/A filed July 2, 2007 and incorporated herein by reference). | |
| 10.15* | Form of Trust Agreement in connection with the Deferred Compensation Agreement and Schedule of Officers identified as beneficiaries of the Trust Agreement (filed as Exhibit 10.12 to Carmike’s Annual Report on Form 10-K for the year ended December 31, 2006 and incorporated herein by reference). | |
| 10.16* | Non-Employee Director Compensation Package (filed as Exhibit 99.3 to Carmike’s Current Report on Form 8-K filed March 28, 2005 and incorporated herein by reference). | |
| 10.17* | Employment Agreement, dated as of January 31, 2002, between Carmike Cinemas, Inc. and Michael W. Patrick (filed as Exhibit 10 to Carmike’s Form 10-Q for the quarter ended March 31, 2002 and incorporated herein by reference). | |
| 10.18* | Amendment No. 1 to Employment Agreement, between Carmike Cinemas, Inc. and Michael W. Patrick, dated as of December 31, 2009 (filed as Exhibit 10.17 to Carmike’s Annual Report on Form 10-K for the year ended December 31, 2008 and incorporated herein by reference). | |
| 10.19* | Separation Agreement and General Release, dated February 12, 2009, by and between Michael W. Patrick and Carmike Cinemas, Inc. (filed as Exhibit 10.1 to Carmike’s Form 8-K filed on February 13, 2009 and incorporated herein by reference). | |
| 10.20* | Michael W. Patrick Dividend-Related Bonus Agreement, effective as of January 29, 2004, between Carmike Cinemas, Inc. and Michael W. Patrick (filed as Exhibit 10.3 to Carmike’s Form 10-Q for the quarter ended March 31, 2004 and incorporated herein by reference). | |
| 10.21* | Carmike Cinemas, Inc. 2002 Stock Plan (filed as Exhibit 4.2 to Carmike’s Form S-8 (Registration No. 333-85194) filed March 29, 2002 and incorporated herein by reference). | |
| 10.22* | Carmike Cinemas, Inc. Non-Employee Directors Long-Term Stock Incentive Plan (filed as Appendix C to Carmike’s 2002 Definitive Proxy Statement filed July 24, 2002 and incorporated herein by reference). | |
| 10.23* | Carmike Cinemas, Inc. Employee and Consultant Long-Term Stock Incentive Plan (filed as Appendix D to Carmike’s 2002 Definitive Proxy Statement filed July 24, 2002 and incorporated herein by reference). | |
| 10.24* | Carmike Cinemas, Inc. 2004 Incentive Stock Plan (filed as Appendix A to Carmike’s Definitive Proxy Statement for the 2004 Annual Meeting of Stockholders, filed on April 16, 2004 and incorporated herein by reference). | |
| 10.25* | Form of Non-Employee Director Stock Option Agreement pursuant to the Carmike Cinemas, Inc. 2004 Incentive Stock Plan (filed as Exhibit 10.2 to Carmike’s Current Report on Form 8-K filed on November 14, 2005 and incorporated herein by reference). | |
| 10.26* | Form of Employee Stock Option Agreement pursuant to the Carmike Cinemas, Inc. 2004 Incentive Stock Plan (filed as exhibit 10.1 to Carmike’s Current Report on Form 8-K filed April 19, 2007 and incorporated herein by reference). | |
| 10.27* | Form of Restricted Stock Grant Agreement for Carmike’s Directors pursuant to the Carmike Cinemas, Inc. 2004 Incentive Stock Plan (filed as Exhibit 10.3 to Carmike’s Current Report on Form 8-K filed May 25, 2005 and incorporated herein by reference). | |
72
Table of Contents
Index to Financial Statements
| Exhibit |
Description | |
| 10.28* | Form of Restricted Stock Grant Agreement pursuant to the Carmike Cinemas, Inc. 2004 Incentive Stock Plan (filed as Exhibit 10.32 to Carmike’s Annual Report on Form 10-K for the year ended December 31, 2005 and incorporated herein by reference). | |
| 10.29* | Form of Employee Stock Option Agreement pursuant to the Carmike Cinemas, Inc. 2004 Incentive Stock Plan (filed as Exhibit 10.2 to Carmike’s Quarterly Report on Form 10-Q filed on August 3, 2009 and incorporated herein by reference). | |
| 10.30* | Restricted Stock Grant Agreement for S. David Passman III, dated June 4, 2009, pursuant to the Carmike Cinemas, Inc. 2004 Incentive Stock Plan (filed as Exhibit 10.3 to Carmike’s Quarterly Report on Form 10-Q filed on August 3, 2009 and incorporated herein by reference). | |
| 10.31* | Stock Option Agreement for S. David Passman III, dated June 4, 2009, pursuant to the Carmike Cinemas, Inc. 2004 Incentive Stock Plan (filed as Exhibit 10.4 to Carmike’s Quarterly Report on Form 10-Q filed on August 3, 2009 and incorporated herein by reference). | |
| 10.32* | Employment Agreement by and between Carmike Cinemas, Inc. and S. David Passman III, dated June 4, 2009 (filed as Exhibit 10.1 to Carmike’s current Report on Form 8-K filed on June 4, 2009 and incorporated herein by reference). | |
| 10.33* | Amendment No. 1 to Separation Agreement between Carmike Cinemas, Inc. and Fred W. Van Noy (filed as Exhibit 10.29 to Carmike’s Annual Report on Form 10-K for the year ended December 31, 2008 and incorporated herein by reference). | |
| 10.34* | Form Separation Agreement and schedule of officers who have entered into such agreement (filed as Exhibit 10.1 to Carmike’s Current Report on Form 8-K filed May 23, 2007 and incorporated herein by reference). | |
| 10.35* | Form of Amendment No. 1 to Separation Agreement and schedule of officers who have entered into such amendment (filed as Exhibit 10.31 to Carmike’s Annual Report on Form 10-K for the year ended December 31, 2008 and incorporated herein by reference). | |
| 10.36+ | Master License Agreement, dated as of December 16, 2005, by and between Carmike Cinemas, Inc. and Christie/AIX, Inc (filed as Exhibit 10.30 to Carmike’s Annual Report on Form 10-K for the year ended December 31, 2005 and incorporated herein by reference). | |
| 10.37 | Digital Cinema Service Agreement, dated as of December 16, 2005, by and between Carmike Cinemas, Inc. and Christie Digital Systems USA, Inc (filed as Exhibit 10.31 to Carmike’s Annual Report on Form 10-K for the year ended December 31, 2005 and incorporated herein by reference). | |
| 10.38* | Release and Consulting Services Agreement, dated as of March 31, 2006, by and between Carmike Cinemas, Inc. and Martin A. Durant (filed as Exhibit 10.1 to Carmike’s Current Report on Form 8-K filed March 15, 2006 and incorporated herein by reference). | |
| 10.39* | Release and Consulting Services Agreement, dated as of June 15, 2007, by and between Anthony J. Rhead and Carmike Cinemas, Inc. (filed as Exhibit 10.5 to Carmike’s Quarterly Report on Form 10-Q filed August 7, 2007 and incorporated herein by reference). | |
| 10.40 | Form of Indemnification Agreement and Schedule of Directors who have entered into such agreement (filed as Exhibit 10.1 to Carmike’s Form S-3 (Registration No. 333-117403) filed July 16, 2004 and incorporated herein by reference). | |
| 10.41 | Indemnification Agreement, effective as of December 10, 2004, by and between Carmike Cinemas, Inc. and Fred W. Van Noy (filed as Exhibit 10.1 to Carmike’s Current Report on Form 8-K filed on January 24, 2005 and incorporated herein by reference). | |
| 10.42 | Indemnification Agreement, effective as of November 11, 2005, by and between Carmike Cinemas, Inc. and James J. Gaffney (filed as Exhibit 10.1 to Carmike’s Current Report on Form 8-K filed on November 14, 2005 and incorporated herein by reference). | |
| 10.43 | Indemnification Agreement, dated as of October 20, 2006, between Carmike Cinemas, Inc. and Kevin D. Katari (filed as Exhibit 10.1 to Carmike’s Current Report on Form 8-K filed October 25, 2006 and incorporated herein by reference). | |
73
Table of Contents
Index to Financial Statements
| Exhibit |
Description | |
| 10.44* | 2006 Base Salaries for Named Executive Officers (filed as Exhibit 10.1 to Carmike’s Current Report on Form 8-K filed August 21, 2006 and incorporated herein by reference). | |
| 10.45* | 2006 Cash Bonus Targets for Named Executive Officers (filed as Exhibit 10.2 to Carmike’s Current Report on Form 8-K filed August 21, 2006 and incorporated herein by reference). | |
| 10.46* | 2007 Base Salaries for Named Executive Officers (filed as Exhibit 10.1 to Carmike’s Current Report on Form 8-K filed March 29, 2007 and incorporated herein by reference). | |
| 10.47* | 2007 Cash Bonus Targets for Named Executive Officers (filed as Exhibit 10.2 to Carmike’s Current Report on Form 8-K filed March 29, 2007 and incorporated herein by reference). | |
| 10.48* | Carmike Cinemas, Inc. Annual Executive Bonus Program (filed as Appendix A to Carmike’s Definitive Proxy Statement for the 2007 Annual Meeting of Stockholders, filed on April 18, 2007 and incorporated herein by reference). | |
| 10.49* | Amendment No. 1 to Carmike Cinemas, Inc. Annual Executive Bonus Program, effective January 1, 2009 (filed as Exhibit 10.45 to Carmike’s Annual Report on Form 10-K for the year ended December 31, 2008 and incorporated herein by reference). | |
| 11 | Computation of per share earnings (provided in Note 15 to the Notes to Audited Consolidated Financial Statements included in this report under the caption “Earnings Per Share”). | |
| 21 | List of Subsidiaries. | |
| 23.1 | Consent of Deloitte & Touche LLP. | |
| 31.1 | Certification of the Chief Executive Officer Pursuant to Rule 13a-14(a) or 15d-14(a) of the Securities Exchange Act of 1934, as amended, as Adopted Pursuant to Section 302 of the Sarbanes-Oxley Act of 2002. | |
| 31.2 | Certification of the Chief Financial Officer Pursuant to Rule 13a-14(a) or 15d-14(a) of the Securities Exchange Act of 1934, as amended, as Adopted Pursuant to Section 302 of the Sarbanes-Oxley Act of 2002. | |
| 32.1 | Certificate of the Chief Executive Officer Pursuant to 18 U.S.C. Section 1350, as Adopted Pursuant to Section 906 of the Sarbanes-Oxley Act of 2002. | |
| 32.2 | Certificate of the Chief Financial Officer Pursuant to 18 U.S.C. Section 1350, as Adopted Pursuant to Section 906 of the Sarbanes-Oxley Act of 2002. | |
| * | Management contract or compensatory plan or arrangement required to be filed as an exhibit pursuant to Item 15(b) of Form 10-K. |
| + | Confidential treatment has been granted for certain portions of this document under Rule 24b-2 of the Securities Exchange Act of 1934, which portions have been omitted and filed separately with the SEC. |
(b) Exhibits
The response to this portion of Item 15 is submitted as a separate section of this report.
(c) Financial Statement Schedules
See Item 15(a) (1) and (2).
74
Table of Contents
Index to Financial Statements
SIGNATURES
Pursuant to the requirements of Section 13 or 15(d) of the Securities Exchange Act of 1934, the Registrant has duly caused this report to be signed on its behalf by the undersigned, thereunto duly authorized.
| CARMIKE CINEMAS, INC. | ||||
| Date: March 1, 2010 | By: | /s/ S. DAVID PASSMAN | ||
| President, Chief Executive Officer and Director (Principal Executive Officer) | ||||
Pursuant to the requirements of the Securities Exchange Act of 1934, this report has been signed below by the following persons on behalf of the Registrant in the capacities indicated and as of the date indicated above.
| Signature |
Title | |
| /S/ S. DAVID PASSMAN III S. David Passman III |
President, Chief Executive Officer and Director (Principal Executive Officer) | |
| /S/ FRED W. VAN NOY Fred W. Van Noy |
Senior Vice President, Chief Operating Officer and Director | |
| /S/ RICHARD B. HARE Richard B. Hare |
Senior Vice President—Finance, Treasurer and Chief Financial Officer (Principal Financial Officer) | |
| /S/ PAUL G. REITZ Paul G. Reitz |
Assistant Vice President—Chief Accounting Officer (Principal Accounting Officer) | |
| /S/ JEFFREY W. BERKMAN Jeffrey W. Berkman |
Director | |
| /S/ JAMES A. FLEMING James A. Flemig |
Director | |
| /S/ ALAN J. HIRSCHFIELD Alan J. Hirschfield |
Director | |
| /S/ ROLAND C. SMITH Roland C. Smith |
Chairman of the Board of Directors | |
| /S/ PATRICIA A. WILSON Patricia A. Wilson |
Director | |
75