Exhibit 13.1
Dear Fellow Shareholders:
In the year since our last letter to you, we have witnessed a recession that was deeper and more
traumatic than any in recent memory. Unemployment levels entered double digits, mortgage
delinquencies in the United States reached record levels, and foreclosure filings followed suit.
And yet, despite these occurrences, Hudson City’s proven business model and conservative banking
principles sheltered your investment from the worst of the storm. While the current economic
conditions brought increasing levels of non-performing loans and charge-offs, they were not
significant enough to imperil our 11th straight year of record earnings.
The Secret to Our Success
Hudson City’s financial performance is not the result of precarious financial engineering
instruments, such as hedges or derivatives, nor is it an outgrowth of additional fees for
investment banking or mortgage banking services. Instead, Hudson City achieved record performance
by making sensible residential first mortgage loans, which we
continue to keep on our own books. During 2009 we were able to fund
substantially all of our loan production with deposit growth.
We believe in doing business “the right way.” Hudson City’s customers can feel confident that “what
you see is what you get.” We have never offered
payment-option loans or loans with negative amortization. And our deposit customers receive similar
benefits of honesty and transparency, as well as assurance that our deposit products do not contain
hidden fees and charges. Furthermore, to meet our customers’ service expectations, we manage the
small details, such as ensuring that every Hudson City branch has its own phone number (answered by
a person willing to help you) rather than requiring customers to talk to a machine or respond to
telephone prompts. In turn, our business model and core values have led to a consistent track
record of financial strength and a high degree of customer loyalty that increases long-term
shareholder value.
Record Earnings and More
Earnings for the year totaled $527.2 million, or $1.07 per diluted share. This is an 18.3% increase
over 2008. During 2009, our net interest margin grew to 2.21% from 1.96% in 2008 as funding costs
decreased at a faster pace than the yields on our interest-earning assets. One important component
of our earnings growth is expense management. Through our industry-leading efficiency ratio, we
are able to maintain a competitive advantage in both deposit and loan products. In 2009, our
efficiency ratio was 20.80%, meaning that it cost us $0.21 in overhead to produce one dollar of revenue. We
maintain our efficiency, in part, because we stay focused on our customers’ mortgage and savings
needs rather than trying to be “all things to all people.” We simply target customers looking for
exceptional value and deliver competitive deposit yields, low fees, and competitive mortgage rates.
We grew our assets by $6.12 billion during 2009 to $60.27 billion at December 31, 2009, comprising
loan growth of $2.28 billion and additions to our securities portfolio of $3.41 billion. This
achievement was funded with deposit growth of $6.12 billion. Our loan production in 2009 amounted
to $9.22 billion as compared to $8.10 billion in 2008. The increase in loan production was due in
large part to customers who refinanced loans from other banks. We regard these as very high-quality
loans because they meet our strict underwriting standards based on an updated property appraisal,
and they were previously performing loans at other banks that are simply repricing to a lower rate.
Reality Check
With all of the good news to report about our performance during 2009, there is no escaping that
the economic recession affected our asset quality, as it did with other banks. Our primary loan
products are residential first mortgage loans. As unemployment rates rise, some borrowers find it
difficult to make regular loan payments. Compounding the unemployment effects are weak housing
markets that make it challenging to sell a home at just the time that declining house prices are
reducing borrowers’ equity. Non-performing loans amounted to
Page 1
$627.7 million at December 31, 2009, as compared to $217.6 million at December 31, 2008. At
December 31, 2009, non-performing loans included $613.6 million of one- to four-family first
mortgage loans as compared to $207.0 million at December 31, 2008. Although we experienced
increased levels of charge-offs in 2009, which totaled $47.2 million, our charge-offs have been
moderated by our loan product philosophy and underwriting standards which resulted in an average
loan-to-value ratio, using appraised values at origination, of 61% at year-end which has helped to
protect our portfolio.
We are very pleased with our record deposit growth in 2009. Many customers sought out Hudson City
as a safe haven for their money during these tumultuous times. Our long-standing reputation and
financial strength helped us to increase market share in 96% of our branch locations for the period
June 2008 through June 2009. Furthermore, Hudson City branches average more than double the
deposits-per-branch of the Bank’s competitors, amounting to $188 million in deposits-per-branch
compared to the national average of $76 million for FDIC-insured institutions. We believe this is
an important indication of customer satisfaction.
Our financial results since Hudson City’s initial public offering in 1999 demonstrate our ability
to leverage capital and provide consistent earnings growth. We believe that as the economy emerges
from the recession, there will be further opportunities for Hudson City to continue to grow its
franchise and prosper. In December, we filed a shelf registration statement with the Securities
and Exchange Commission. The shelf registration statement enables us to easily access the capital
markets should an opportunistic transaction arise. In addition, we believe that the banking
regulators, as well as the banking committees of the United States Congress, may be calling for
increased regulatory capital requirements. While we are currently considered to be well
capitalized with a Tier 1 leverage capital ratio of 7.59% and a total risk-based capital ratio of
21.02%, this shelf registration statement affords us greater flexibility to continue to execute our
business model and to pursue opportunities that current market conditions may provide.
A Bond of Trust
In summary, Hudson City is performing admirably and is well positioned for the future. While there
is uncertainty surrounding banking legislation and regulatory reform, we believe that our financial
strength, strong capital position, and customer-focused business model will enable us to benefit
from a housing market recovery and strengthening economic conditions when they occur. In the
meantime, we expect our business model to continue to serve our shareholders well. It has been
this strategy of sticking to our core values and principles that has yielded record earnings and
allowed us to continue to prosper without the need for government assistance.
On behalf of the Board of Directors and all of our employees, we thank you for your confidence and
pledge to continue to earn your trust. We will continue to lead the Bank in a way that makes you
proud—with quality, passion, and integrity.
/s/ Ronald E. Hermance, Jr.
Chairman, President
& Chief Executive Officer
/s/ Denis J. Salamone
Senior Executive Vice President
& Chief Operating Officer
Page 2
Selected Consolidated Financial Information
The summary information presented below under “Selected Financial Condition Data,” “Selected
Operating Data” and “Selected Financial Ratios and Other Data” at or for each of the years
presented is derived in part from the audited consolidated financial statements of Hudson City
Bancorp, Inc. Certain share, per share and dividend information reflects the 3.206 to 1 stock split
effected in conjunction with our second-step conversion and stock offering completed on June 7,
2005.
| |
|
|
|
|
|
|
|
|
|
|
|
|
|
|
|
|
|
|
|
|
| |
|
At December 31, |
| |
| |
|
2009 |
|
2008 |
|
2007 |
|
2006 |
|
2005 |
| |
| |
|
(In thousands) |
|
|
|
|
|
|
|
|
|
|
|
|
|
|
|
|
|
|
|
|
|
Selected Financial Condition Data: |
|
|
|
|
|
|
|
|
|
|
|
|
|
|
|
|
|
|
|
|
Total assets |
|
$ |
60,267,760 |
|
|
$ |
54,145,328 |
|
|
$ |
44,423,971 |
|
|
$ |
35,506,581 |
|
|
$ |
28,075,353 |
|
Total loans |
|
|
31,779,921 |
|
|
|
29,418,888 |
|
|
|
24,192,281 |
|
|
|
19,083,617 |
|
|
|
15,062,449 |
|
Federal Home Loan Bank of New York stock |
|
|
874,768 |
|
|
|
865,570 |
|
|
|
695,351 |
|
|
|
445,006 |
|
|
|
226,962 |
|
Investment securities held to maturity |
|
|
4,187,704 |
|
|
|
50,086 |
|
|
|
1,408,501 |
|
|
|
1,533,969 |
|
|
|
1,534,216 |
|
Investment securities available for sale |
|
|
1,095,240 |
|
|
|
3,413,633 |
|
|
|
2,765,491 |
|
|
|
4,379,615 |
|
|
|
3,962,511 |
|
Mortgage-backed securities held to
maturity |
|
|
9,963,554 |
|
|
|
9,572,257 |
|
|
|
9,565,526 |
|
|
|
6,925,210 |
|
|
|
4,389,864 |
|
Mortgage-backed securities available
for sale |
|
|
11,116,531 |
|
|
|
9,915,554 |
|
|
|
5,005,409 |
|
|
|
2,404,421 |
|
|
|
2,520,633 |
|
Total cash and cash equivalents |
|
|
561,201 |
|
|
|
261,811 |
|
|
|
217,544 |
|
|
|
182,246 |
|
|
|
102,259 |
|
Foreclosed real estate, net |
|
|
16,736 |
|
|
|
15,532 |
|
|
|
4,055 |
|
|
|
3,161 |
|
|
|
1,040 |
|
Total deposits |
|
|
24,578,048 |
|
|
|
18,464,042 |
|
|
|
15,153,382 |
|
|
|
13,415,587 |
|
|
|
11,383,300 |
|
Total borrowed funds |
|
|
29,975,000 |
|
|
|
30,225,000 |
|
|
|
24,141,000 |
|
|
|
16,973,000 |
|
|
|
11,350,000 |
|
Total stockholders’ equity |
|
|
5,339,152 |
|
|
|
4,938,796 |
|
|
|
4,611,307 |
|
|
|
4,930,256 |
|
|
|
5,201,476 |
|
| |
|
|
|
|
|
|
|
|
|
|
|
|
|
|
|
|
|
|
|
|
| |
|
For the Year Ended December 31, |
|
| |
| |
|
2009 |
|
|
2008 |
|
|
2007 |
|
|
2006 |
|
|
2005 |
|
| |
| |
|
(In thousands) |
|
Selected Operating Data: |
|
|
|
|
|
|
|
|
|
|
|
|
|
|
|
|
|
|
|
|
Total interest and dividend income |
|
$ |
2,941,786 |
|
|
$ |
2,653,225 |
|
|
$ |
2,127,505 |
|
|
$ |
1,614,843 |
|
|
$ |
1,178,908 |
|
Total interest expense |
|
|
1,698,308 |
|
|
|
1,711,248 |
|
|
|
1,480,322 |
|
|
|
1,001,610 |
|
|
|
616,774 |
|
| |
Net interest income |
|
|
1,243,478 |
|
|
|
941,977 |
|
|
|
647,183 |
|
|
|
613,233 |
|
|
|
562,134 |
|
Provision for loan losses |
|
|
137,500 |
|
|
|
19,500 |
|
|
|
4,800 |
|
|
|
— |
|
|
|
65 |
|
| |
Net interest income after provision
for loan losses |
|
|
1,105,978 |
|
|
|
922,477 |
|
|
|
642,383 |
|
|
|
613,233 |
|
|
|
562,069 |
|
| |
Non-interest income: |
|
|
|
|
|
|
|
|
|
|
|
|
|
|
|
|
|
|
|
|
Service charges and other income |
|
|
9,399 |
|
|
|
8,485 |
|
|
|
7,267 |
|
|
|
6,287 |
|
|
|
5,267 |
|
Gains on securities transactions, net |
|
|
24,185 |
|
|
|
— |
|
|
|
6 |
|
|
|
4 |
|
|
|
2,740 |
|
| |
Total non-interest income |
|
|
33,584 |
|
|
|
8,485 |
|
|
|
7,273 |
|
|
|
6,291 |
|
|
|
8,007 |
|
| |
Total non-interest expense |
|
|
265,596 |
|
|
|
198,076 |
|
|
|
167,913 |
|
|
|
158,955 |
|
|
|
127,703 |
|
| |
Income before income tax expense |
|
|
873,966 |
|
|
|
732,886 |
|
|
|
481,743 |
|
|
|
460,569 |
|
|
|
442,373 |
|
Income tax expense |
|
|
346,722 |
|
|
|
287,328 |
|
|
|
185,885 |
|
|
|
171,990 |
|
|
|
166,318 |
|
| |
Net income |
|
$ |
527,244 |
|
|
$ |
445,558 |
|
|
$ |
295,858 |
|
|
$ |
288,579 |
|
|
$ |
276,055 |
|
|
|
|
|
|
|
|
|
|
|
|
|
|
|
|
|
Page 3
Selected Consolidated Financial Information (continued)
(Dollars in thousands, except per share data)
| |
|
|
|
|
|
|
|
|
|
|
|
|
|
|
|
|
|
|
|
|
| |
|
At or for the Year Ended December 31, |
| |
| |
|
2009 |
|
2008 |
|
2007 |
|
2006 |
|
2005 |
| |
Selected Financial Ratios and Other Data: |
|
|
|
|
|
|
|
|
|
|
|
|
|
|
|
|
|
|
|
|
Performance Ratios: |
|
|
|
|
|
|
|
|
|
|
|
|
|
|
|
|
|
|
|
|
Return on average assets |
|
|
0.92 |
% |
|
|
0.91 |
% |
|
|
0.74 |
% |
|
|
0.91 |
% |
|
|
1.14 |
% |
Return on average stockholders’ equity |
|
|
10.18 |
|
|
|
9.36 |
|
|
|
6.23 |
|
|
|
5.70 |
|
|
|
7.52 |
|
Net interest rate spread (1) |
|
|
1.92 |
|
|
|
1.57 |
|
|
|
1.11 |
|
|
|
1.31 |
|
|
|
1.84 |
|
Net interest margin (2) |
|
|
2.21 |
|
|
|
1.96 |
|
|
|
1.65 |
|
|
|
1.96 |
|
|
|
2.35 |
|
Non-interest expense to average assets |
|
|
0.46 |
|
|
|
0.41 |
|
|
|
0.42 |
|
|
|
0.50 |
|
|
|
0.53 |
|
Efficiency ratio (3) |
|
|
20.80 |
|
|
|
20.84 |
|
|
|
25.66 |
|
|
|
25.66 |
|
|
|
22.40 |
|
Average interest-earning assets to
average interest-bearing liabilities |
|
|
1.10 |
x |
|
|
1.11 |
x |
|
|
1.14 |
x |
|
|
1.20 |
x |
|
|
1.20 |
x |
|
|
|
|
|
|
|
|
|
|
|
|
|
|
|
|
|
|
|
|
|
Share and Per Share Data: |
|
|
|
|
|
|
|
|
|
|
|
|
|
|
|
|
|
|
|
|
Basic earnings per share |
|
$ |
1.08 |
|
|
$ |
0.92 |
|
|
$ |
0.59 |
|
|
$ |
0.54 |
|
|
$ |
0.49 |
|
Diluted earnings per share |
|
|
1.07 |
|
|
|
0.90 |
|
|
|
0.58 |
|
|
|
0.53 |
|
|
|
0.48 |
|
Cash dividends paid per common share |
|
|
0.59 |
|
|
|
0.45 |
|
|
|
0.33 |
|
|
|
0.30 |
|
|
|
0.27 |
|
Dividend pay-out ratio (4) |
|
|
54.63 |
% |
|
|
48.91 |
% |
|
|
55.93 |
% |
|
|
55.56 |
% |
|
|
54.69 |
% |
Book value per share (5) |
|
$ |
10.85 |
|
|
$ |
10.10 |
|
|
$ |
9.55 |
|
|
$ |
9.47 |
|
|
$ |
9.44 |
|
Tangible book value per share (5) |
|
|
10.53 |
|
|
|
9.77 |
|
|
|
9.22 |
|
|
|
9.15 |
|
|
|
9.44 |
|
Weighted average number of common
shares outstanding: |
|
|
|
|
|
|
|
|
|
|
|
|
|
|
|
|
|
|
|
|
Basic |
|
|
488,908,260 |
|
|
|
484,907,441 |
|
|
|
499,607,828 |
|
|
|
536,214,778 |
|
|
|
567,789,397 |
|
Diluted |
|
|
491,295,511 |
|
|
|
495,856,156 |
|
|
|
509,927,433 |
|
|
|
546,790,604 |
|
|
|
581,063,426 |
|
|
|
|
|
|
|
|
|
|
|
|
|
|
|
|
|
|
|
|
|
|
Capital Ratios: |
|
|
|
|
|
|
|
|
|
|
|
|
|
|
|
|
|
|
|
|
Average stockholders’ equity to average assets |
|
|
9.03 |
% |
|
|
9.74 |
% |
|
|
11.93 |
% |
|
|
16.00 |
% |
|
|
15.10 |
% |
Stockholders’ equity to assets |
|
|
8.86 |
|
|
|
9.12 |
|
|
|
10.38 |
|
|
|
13.89 |
|
|
|
18.53 |
|
|
|
|
|
|
|
|
|
|
|
|
|
|
|
|
|
|
|
|
|
|
Regulatory Capital Ratios of Bank: |
|
|
|
|
|
|
|
|
|
|
|
|
|
|
|
|
|
|
|
|
Leverage capital |
|
|
7.59 |
% |
|
|
7.99 |
% |
|
|
9.16 |
% |
|
|
11.30 |
% |
|
|
14.68 |
% |
Total risk-based capital |
|
|
21.02 |
|
|
|
21.52 |
|
|
|
24.83 |
|
|
|
30.99 |
|
|
|
41.31 |
|
|
|
|
|
|
|
|
|
|
|
|
|
|
|
|
|
|
|
|
|
|
Asset Quality Ratios: |
|
|
|
|
|
|
|
|
|
|
|
|
|
|
|
|
|
|
|
|
Non-performing loans to total loans |
|
|
1.98 |
% |
|
|
0.74 |
% |
|
|
0.33 |
% |
|
|
0.16 |
% |
|
|
0.13 |
% |
Non-performing assets to total assets |
|
|
1.07 |
|
|
|
0.43 |
|
|
|
0.19 |
|
|
|
0.09 |
|
|
|
0.07 |
|
Allowance for loan losses to non-performing loans |
|
|
22.32 |
|
|
|
22.89 |
|
|
|
43.75 |
|
|
|
102.09 |
|
|
|
141.84 |
|
Allowance for loan losses to total loans |
|
|
0.44 |
|
|
|
0.17 |
|
|
|
0.14 |
|
|
|
0.16 |
|
|
|
0.18 |
|
|
|
|
|
|
|
|
|
|
|
|
|
|
|
|
|
|
|
|
|
|
Branch and Deposit Data: |
|
|
|
|
|
|
|
|
|
|
|
|
|
|
|
|
|
|
|
|
Number of deposit accounts |
|
|
725,979 |
|
|
|
638,951 |
|
|
|
605,018 |
|
|
|
580,987 |
|
|
|
484,956 |
|
Branches |
|
|
131 |
|
|
|
127 |
|
|
|
119 |
|
|
|
111 |
|
|
|
90 |
|
Average deposits per branch (thousands) |
|
$ |
187,619 |
|
|
$ |
145,386 |
|
|
$ |
127,339 |
|
|
$ |
120,861 |
|
|
$ |
126,481 |
|
|
|
|
| (1) |
|
Determined by subtracting the weighted average cost of average total interest-bearing liabilities from the weighted average yield
on average total interest-earning assets. |
| |
| (2) |
|
Determined by dividing net interest income by average total interest-earning assets. |
| |
| (3) |
|
Determined by dividing total non-interest expense by the sum of net interest income and total non-interest income. For 2009, the
efficiency ratio includes the FDIC special assessment of $21.1 million and net securities gains of $24.2 million. |
| |
| (4) |
|
The dividend pay-out ratio for 2005 uses per share information that does not reflect the dividend waiver by Hudson City, MHC. |
| |
| (5) |
|
Computed based on total common shares issued, less treasury shares, unallocated ESOP shares and unvested stock award shares.
Tangible book value excludes goodwill and other intangible assets. |
Page 4
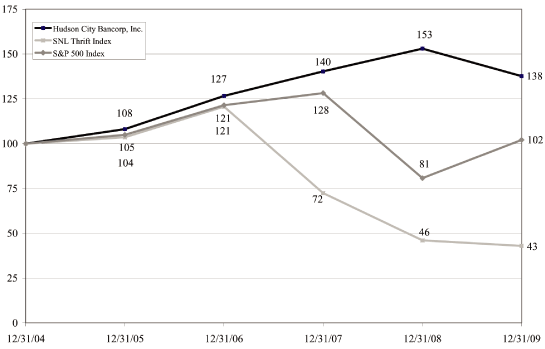
Performance Graph
Pursuant to the regulations of the Securities and Exchange Commission, the graph below compares the
performance of Hudson City Bancorp, Inc. with that of the Standard and Poor’s 500 Stock Index, and for all thrift
stocks as reported by SNL Securities L.C. from December 31, 2004 through December 31, 2009. The graph
assumes the reinvestment of dividends in all additional shares of the same class of equity securities as those listed
below. The index level for all series was set to 100.00 on December 31, 2004.
Hudson City Bancorp, Inc. Total Return Performance
| |
|
|
|
|
|
|
|
|
|
|
|
|
|
|
|
|
|
|
|
|
|
|
|
|
|
|
|
|
|
|
|
|
| |
| |
|
|
|
12/31/04 |
|
|
12/31/05 |
|
|
12/31/06 |
|
|
12/31/07 |
|
|
12/31/08 |
|
|
12/31/09 |
|
| |
Hudson City Bancorp, Inc. |
|
|
|
100 |
|
|
|
|
108 |
|
|
|
|
127 |
|
|
|
|
140 |
|
|
|
|
153 |
|
|
|
|
138 |
|
|
| |
SNL Thrift Index |
|
|
|
100 |
|
|
|
|
104 |
|
|
|
|
121 |
|
|
|
|
72 |
|
|
|
|
46 |
|
|
|
|
43 |
|
|
| |
S&P 500 Index |
|
|
|
100 |
|
|
|
|
105 |
|
|
|
|
121 |
|
|
|
|
128 |
|
|
|
|
81 |
|
|
|
|
102 |
|
|
| |
* Source: SNL Financial LC and Bloomberg Financial Database
There can be no assurance that stock performance will continue in the future with the same or similar trends as those
depicted in the graph above.
Page 5
MANAGEMENT’S DISCUSSION AND ANALYSIS OF
FINANCIAL CONDITION AND RESULTS OF OPERATIONS
Executive Summary
We continue to focus on our traditional consumer-oriented business model by growing our franchise
through the origination and purchase of one- to four-family mortgage loans. We have traditionally
funded this loan production with customer deposits and borrowings. During 2009 we were able to
fund substantially all of our loan production with deposit growth.
Our results of operations depend primarily on net interest income, which in part, is a direct
result of the market interest rate environment. Net interest income is the difference between the
interest income we earn on our interest-earning assets, primarily mortgage loans, mortgage-backed
securities and investment securities, and the interest we pay on our interest-bearing liabilities,
primarily time deposits, interest-bearing transaction accounts and borrowed funds. Net interest
income is affected by the shape of the market yield curve, the timing of the placement and
repricing of interest-earning assets and interest-bearing liabilities on our balance sheet, the
prepayment rate on our mortgage-related assets and the calls of our borrowings. Our results of
operations may also be affected significantly by general and local economic and competitive
conditions, particularly those with respect to changes in market interest rates, credit quality,
government policies and actions of regulatory authorities. Our results are also affected by the
market price of our stock, as the expense of our employee stock ownership plan is related to the
current price of our common stock.
The Federal Open Market Committee of the Board of Governors of the Federal Reserve System (the
“FOMC”) noted that economic activity improved during the fourth quarter of 2009. The FOMC also
noted that the housing sector has shown signs of improvement. However, the national unemployment
rate continued to rise to 10.0% in December 2009 as compared to 9.8% in September 2009 and 7.4% in
December 2008. The S&P/Case-Shiller Home Price Index for the New York metropolitan area, where
most of our lending activity occurs, declined by approximately 7.1% in 2009 and by 9.2% in 2008.
The S&P/Case-Shiller U.S. National Home Price Index decreased by 5.2% in 2009 and by 18.2% in 2008.
Lower household wealth and tight credit conditions in addition to the increase in the national
unemployment rate has resulted in the FOMC maintaining the overnight lending rate at zero to 0.25%
during 2009. As a result, short-term market interest rates have remained at low levels during 2009.
This allowed us to continue to re-price our short-term deposits thereby reducing our cost of
funds. While longer-term market interest rates increased during 2009, rates on mortgage-related
assets declined slightly, although to a lesser extent than the decline in our cost of funds. As a
result, our net interest rate spread and net interest margin increased for 2009 as compared to
2008.
Net income amounted to $527.2 million for 2009, as compared to $445.6 million for 2008. For the
year ended December 31, 2009, our return on average assets and average shareholders’ equity were
0.92% and 10.18%, respectively, as compared to 0.91% and 9.36% for 2008. The increases in our
return on average equity and average assets are due primarily to the increase in our net income
during 2009 as compared to 2008. The increase in net income occurred despite significantly higher
deposit insurance fees, including the special assessment imposed in the second quarter of 2009 by
the Federal Deposit Insurance Corporation (the “FDIC”), as well as a significantly higher provision
for loan losses.
Net interest income increased $301.5 million, or 32.0%, to $1.24 billion for the 2009 as compared
to $942.0 million for 2008. During 2009, our net interest rate spread increased 35 basis points to
1.92% and our net interest margin increased 25 basis points to 2.21% as compared to 2008. The
increases in our net interest rate spread and net interest margin were due to a steeper yield curve
which allowed us to reduce deposit costs at a faster pace than the decrease in our mortgage yields.
Page 6
The provision for loan losses amounted to $137.5 million for 2009 as compared to $19.5 million for
2008. The increase in the provision for loan losses reflects the risks inherent in our loan
portfolio due to decreases in real estate values in our lending markets, the increase in
non-performing and delinquent loans, the increase in loan charge-offs, the continued weakened
economic conditions and rising levels of unemployment during 2009 as well as the growth of the loan
portfolio in the past year. Non-performing loans were $627.7 million or 1.98% of total loans at
December 31, 2009 as compared to $217.6 million or 0.74% of total loans at December 31, 2008.
Significant increases in job losses and unemployment throughout 2009 have had a negative impact on
the financial condition of residential borrowers and their ability to remain current on their
mortgage loans, which has had a material adverse impact on the quality of our loan portfolio. As a
result, we experienced an increase in loan delinquencies, as well as an adverse impact on our loan
loss experience, reflected in an increase in our charge-offs. These factors contributed to a
significant increase in our provision for loan losses for 2009 and resulted in an increase in our
allowance for loan losses.
Total non-interest income was $33.6 million for 2009 as compared to $8.5 million for 2008.
Included in non-interest income were net gains on securities transactions of $24.2 million,
substantially all of which resulted from the sale of $761.6 million of mortgage-backed securities
available-for-sale. Proceeds from the securities sale were primarily used to fund the purchase of
first mortgage loans during the second quarter of 2009. In addition, total non-interest income
includes service charges and other income which increased slightly for 2009 as compared to 2008.
Total non-interest expense increased $67.5 million, or 34.1%, to $265.6 million for 2009 from
$198.1 million for 2008. The increase is primarily due to the FDIC special assessment of $21.1
million and increases of $30.8 million in Federal deposit insurance expense, $9.9 million in
compensation and employee benefits expense, and $4.0 million in other non-interest expense.
We grew our assets by 11.3% to $60.27 billion at December 31, 2009 from $54.15 billion at December
31, 2008. We grew our assets by 21.9% during 2008. We slowed our growth rate in 2009 as mortgage
refinancing activity caused an increase in loan repayments and available reinvestment yields on
securities decreased. We may continue to grow at a slower rate than in the past until market
conditions allow us to grow interest-earning assets with higher yields than currently available and at a more favorable interest rate spread to the funding cost of interest-bearing liabilities.
Loans increased $2.28 billion to $31.72 billion at December 31, 2009 from $29.44 billion at
December 31, 2008. While the residential real estate markets have weakened considerably during
the past year, low market interest rates and an increase in mortgage refinancing caused by market
interest rates that are at near-historic lows have resulted in increased loan originations. The
increase in refinancing activity has also resulted in an increase in principal repayments.
Total securities increased $3.41 billion to $26.36 billion at December 31, 2009 from $22.95 billion
at December 31, 2008. The increase in securities was primarily due to purchases (including
purchases recorded in the fourth quarter of 2009 with settlement dates after December 31, 2009) of
mortgage-backed and investment securities of $6.87 billion and $5.87 billion, respectively,
partially offset by principal collections on mortgage-backed securities of $4.73 billion and sales
of mortgage-backed securities of $761.6 million and calls of investment securities of $4.02
billion.
The increase in our total assets during 2009 was funded primarily by an increase in customer
deposits. Deposits increased $6.12 billion to $24.58 billion at December 31, 2009 from $18.46
billion at December 31, 2008. The increase in deposits was attributable to growth in our time
deposits and money market accounts. Borrowed funds decreased $250.0 million to $29.98 billion at
December 31, 2009 from $30.23 billion at December 31, 2008. We anticipate that we will be able to
fund our future growth primarily with customer deposits, using borrowed funds as a supplemental
funding source if deposit growth decreases.
Page 7
Comparison of Financial Condition at December 31, 2009 and December 31, 2008
During 2009, our total assets increased $6.12 billion, or 11.3%, to $60.27 billion at December 31,
2009 from $54.15 billion at December 31, 2008.
Net loans increased $2.28 billion, or 7.7%, to $31.72 billion at December 31, 2009 from $29.44
billion at December 31, 2008 due primarily to the origination of one-to four- family first mortgage
loans in New Jersey, New York and Connecticut as well as our continued loan purchase activity.
For 2009, we originated $6.06 billion and purchased $3.16 billion of loans, compared to
originations of $5.04 billion and purchases of $3.06 billion for 2008. The origination and
purchases of loans were partially offset by principal repayments of $6.77 billion in 2009 as
compared to $2.82 billion for 2008. Loan originations have increased primarily due to our
competitive rates and an increase in mortgage refinancing caused by market interest rates that are
at near-historic lows. The increase in refinancing activity occurring in the marketplace also
caused the increase in principal repayments during 2009.
Our first mortgage loan originations and purchases during 2009 were substantially all in one-to
four-family mortgage loans. Approximately 47.0% of mortgage loan originations for 2009 were
variable-rate loans as compared to approximately 58.0% for 2008. Approximately 61.0% of mortgage
loans purchased during 2009 were fixed-rate mortgage loans. Fixed-rate mortgage loans accounted
for 69.1% of our first mortgage loan portfolio at December 31, 2009 and 75.7% at December 31, 2008.
Non-performing loans amounted to $627.7 million or 1.98% of total loans at December 31, 2009 as
compared to $217.6 million or 0.74% of total loans at December 31, 2008.
Total mortgage-backed securities increased $1.59 million to $21.08 billion at December 31, 2009
from $19.49 billion at December 31, 2008. This increase in total mortgage-backed securities
resulted from the purchase of $6.87 billion of variable-rate mortgage-backed securities and
collateralized mortgage obligations (“CMOs”), all of which were issued by U.S. government-sponsored
enterprises (“GSEs”). The increase was partially offset by repayments of $4.73 billion and sales of
$761.6 million. At December 31, 2009, variable-rate mortgage-backed securities accounted for 70.7%
of our portfolio compared with 83.5% at December 31, 2008. The purchase of variable-rate
mortgage-backed securities is a component of our interest rate risk management strategy. Since our
loan portfolio includes a concentration of fixed-rate mortgage loans, the purchase of variable-rate
mortgage-backed securities provides us with an asset that reduces our exposure to interest rate
fluctuations.
Total investment securities increased $1.82 billion to $5.28 billion at December 31, 2009 as
compared to $3.46 billion at December 31, 2008. The increase in investment securities is primarily
due to purchases of $5.87 billion. The increase was partially offset by calls of investment
securities of $4.02 billion.
Since we invest primarily in securities issued by GSEs, there were no debt securities past due or
securities for which the Company currently believes it is not probable that it will collect all
amounts due according to the contractual terms of the security.
Total cash and cash equivalents increased $299.4 million to $561.2 million at December 31, 2009 as
compared to $261.8 million at December 31, 2008. This increase is due to liquidity provided by
strong deposit growth and increased repayments on mortgage-related assets. In addition, we have
maintained a higher level of Federal funds sold since other types of short- and medium-term
investments are currently providing relatively low yields. Other assets increased $119.1 million,
primarily due to the prepayment of the FDIC insurance assessment for 2010, 2011 and 2012 in the
amount of $162.5 million. The required prepayment of the insurance assessment was a measure taken
by the FDIC to restore the reserve ratio of the Deposit Insurance Fund (DIF). This increase was
partially offset by a decrease in deferred tax assets of $45.8 million.
Page 8
Total liabilities increased $5.72 billion, or 11.6%, to $54.93 billion at December 31, 2009 from
$49.21 billion at December 31, 2008. The increase in total liabilities primarily reflected a $6.12
billion increase in deposits, partially offset by a $250.0 million decrease in borrowed funds.
Total deposits increased $6.12 billion, or 33.2%, to $24.58 billion at December 31, 2009 as
compared to $18.46 billion at December 31, 2008. The increase in total deposits included a $3.12
billion increase in our time deposits, a $2.34 billion increase in our money market checking
accounts and a $575.5 million increase in our interest-bearing transaction accounts and savings
accounts. The increases in our deposits reflect our growth strategy, competitive pricing and the
apparent increases in the U.S. household savings rate during the recent recessionary economy. At
December 31, 2009 we had 131 branches as compared to 127 at December 31, 2008. We also began
accepting deposits through our internet banking service in December 2008, which had $224.3 million
in deposits at December 31, 2009.
Borrowings amounted to $29.98 billion at December 31, 2009 as compared to $30.23 billion at
December 31, 2008. The decrease in borrowed funds was the result of repayments of $1.00 billion
with a weighted average rate of 1.62%, largely offset by $750.0 million of new borrowings at a
weighted-average rate of 1.69%. Borrowed funds at December 31, 2009 were comprised of $14.88
billion of Federal Home Loan Bank of New York (“FHLB”) advances and $15.10 billion of securities
sold under agreements to repurchase.
Substantially all of our borrowed funds are callable at the discretion of the lender after an
initial no-call period. Our callable borrowings typically have a final maturity of ten years, are
callable quarterly and may not be called for an initial period of one to five years. We have used
this type of borrowing primarily to fund our loan growth because these borrowings have a longer
duration than shorter-term non-callable borrowings and have a lower cost than a non-callable
borrowing with a maturity date similar to the initial call date of the callable borrowing. If
interest rates were to decrease, or remain consistent with current rates, these borrowings would
probably not be called and our average cost of existing borrowings would not decrease even as
market interest rates decrease. Conversely, if interest rates increase above the market interest
rate for similar borrowings, these borrowings would likely be called at their next call date and
our cost to replace these borrowings would increase. We believe, given current market conditions,
that the likelihood that a significant portion of these borrowings would be called will not
increase substantially unless interest rates were to increase by at least 300 basis points.
During 2009, we have been able to fund our asset growth with deposit inflows. We anticipate that
we will be able to continue to use deposit growth to fund our asset growth, however, we may use
borrowings as a supplemental funding source if deposit growth decreases. We anticipate that we
would use longer term fixed-maturity borrowings with terms of two to five years for this purpose.
Our new borrowings during 2009 consisted of non-callable borrowings of $400.0 million with
maturities of one to three months and $350.0 million of non-callable borrowings with maturities of
two to three years. In addition, during 2009, we modified $1.73 billion of borrowings to extend the
call dates of the borrowings by between three and four years while keeping the interest rate
consistent.
The Company has two collateralized borrowings in the form of repurchase agreements totaling $100.0
million with Lehman Brothers, Inc. Lehman Brothers, Inc. is currently in liquidation under the
Securities Industry Protection Act. Mortgage-backed securities with an amortized cost of
approximately $114.5 million are pledged as collateral for these borrowings. We intend to pursue
full recovery of the pledged collateral in accordance with the contractual terms of the repurchase
agreements. There can be no assurances that the final settlement of this transaction will result
in the full recovery of the collateral or the full amount of the claim. We have not recognized a
loss in our financial statements related to these repurchase agreements.
Due to brokers amounted to $100.0 million at December 31, 2009 as compared to $239.1 million at
December 31, 2008. Due to brokers at December 31, 2009 represents securities purchased in the
fourth quarter of 2009 with settlement dates in the first quarter of 2010. Other liabilities
decreased to $275.6 million at December 31, 2009 as compared to $278.4 million at December 31,
2008. The decrease is primarily the result of a decrease in
Page 9
accrued expenses of $31.6 million, partially offset by an increase in accrued taxes of $25.8
million and in accrued interest payable on borrowings of $3.5 million. The decrease in accrued
expenses is due primarily to a $39.9 million decrease in accrued pension liabilities that resulted
from an increase in the pension plan’s funded status.
Total shareholders’ equity increased $400.4 million to $5.34 billion at December 31, 2009 from
$4.94 billion at December 31, 2008. The increase was primarily due to net income of $527.2 million
for 2009 and a $136.9 million increase in accumulated other comprehensive income, primarily due to
an increase in the net unrealized gain on securities available-for-sale. The net unrealized gain
reflects the general increase in value of our available-for-sale securities portfolio in the
generally low prevailing interest rate environment at year-end. These increases to shareholders’
equity were partially offset by cash dividends paid to common shareholders of $288.4 million and
repurchases of our common stock of $43.5 million.
As of December 31, 2009, there remained 50,123,550 shares that may be purchased under our existing
stock repurchase programs. During 2009, we repurchased 4.0 million shares of our outstanding
common stock at a total cost of $43.5 million. The average price per share repurchased in 2009 was
$10.95. Our capital ratios remain in excess of the regulatory requirements for a well-capitalized
bank. See “Liquidity and Capital Resources”.
The accumulated other comprehensive income of $184.5 million at December 31, 2009 includes a $205.8
million after-tax net unrealized gain on securities available-for-sale ($347.9 million pre-tax)
partially offset by a $21.3 million after-tax accumulated other comprehensive loss related to the
funded status of our employee benefit plans.
At December 31, 2009, our shareholders’ equity to asset ratio was 8.86% compared with 9.12% at
December 31, 2008. For 2009, the ratio of average shareholders’ equity to average assets was 9.03%
compared with 9.74% for 2008. The lower equity-to-assets ratios reflect our strategy to grow assets
and pay dividends. Our book value per share, using the period-end number of outstanding shares,
less purchased but unallocated employee stock ownership plan shares and less purchased but unvested
recognition and retention plan shares, was $10.85 at December 31, 2009 and $10.10 at December 31,
2008. Our tangible book value per share, calculated by deducting goodwill and the core deposit
intangible from shareholders’ equity, was $10.53 as of December 31, 2009 and $9.77 at December 31,
2008.
Analysis of Net Interest Income
Net interest income represents the difference between the interest income we earn on our
interest-earning assets, such as mortgage loans, mortgage-backed securities and investment
securities, and the expense we pay on interest-bearing liabilities, such as time deposits and
borrowed funds. Net interest income depends on our volume of interest-earning assets and
interest-bearing liabilities and the interest rates we earned or paid on them.
Page 10
Average Balance Sheet. The following table presents certain information regarding our financial
condition and net interest income for 2009, 2008, and 2007. The table presents the average yield on
interest-earning assets and the average cost of interest-bearing liabilities for the periods
indicated. We derived the yields and costs by dividing income or expense by the average balance of
interest-earning assets or interest-bearing liabilities, respectively, for the periods shown. We
derived average balances from daily balances over the periods indicated. Interest income includes
fees that we considered adjustments to yields. Yields on tax-exempt obligations were not computed
on a tax equivalent basis. Non-accrual loans were included in the computation of average balances
and therefore have a zero yield. The yields set forth below include the effect of deferred loan
origination fees and costs, and purchase premiums and discounts that are amortized or accreted to
interest income.
| |
|
|
|
|
|
|
|
|
|
|
|
|
|
|
|
|
|
|
|
|
|
|
|
|
|
|
|
|
|
|
|
|
|
|
|
|
| |
|
For the Year Ended December 31, |
|
| |
| |
|
2009 |
|
|
2008 |
|
|
2007 |
|
| |
| |
|
|
|
|
|
|
|
|
|
Average |
|
|
|
|
|
|
|
|
|
|
Average |
|
|
|
|
|
|
|
|
|
|
Average |
|
| |
|
Average |
|
|
|
|
|
|
Yield/ |
|
|
Average |
|
|
|
|
|
|
Yield/ |
|
|
Average |
|
|
|
|
|
|
Yield/ |
|
| |
|
Balance |
|
|
Interest |
|
|
Cost |
|
|
Balance |
|
|
Interest |
|
|
Cost |
|
|
Balance |
|
|
Interest |
|
|
Cost |
|
| |
| |
|
(Dollars in thousands) |
|
Assets: |
|
|
|
|
|
|
|
|
|
|
|
|
|
|
|
|
|
|
|
|
|
|
|
|
|
|
|
|
|
|
|
|
|
|
|
|
Interest-earning assets: |
|
|
|
|
|
|
|
|
|
|
|
|
|
|
|
|
|
|
|
|
|
|
|
|
|
|
|
|
|
|
|
|
|
|
|
|
First mortgage loans, net (1) |
|
$ |
30,126,469 |
|
|
$ |
1,678,789 |
|
|
|
5.57 |
% |
|
$ |
26,379,724 |
|
|
$ |
1,523,521 |
|
|
|
5.78 |
% |
|
$ |
21,208,167 |
|
|
$ |
1,205,461 |
|
|
|
5.68 |
% |
Consumer and other loans |
|
|
381,029 |
|
|
|
21,676 |
|
|
|
5.69 |
|
|
|
422,097 |
|
|
|
26,184 |
|
|
|
6.20 |
|
|
|
431,491 |
|
|
|
28,247 |
|
|
|
6.55 |
|
Federal funds sold |
|
|
566,079 |
|
|
|
1,186 |
|
|
|
0.21 |
|
|
|
209,607 |
|
|
|
4,295 |
|
|
|
2.05 |
|
|
|
248,201 |
|
|
|
12,293 |
|
|
|
4.95 |
|
Mortgage-backed securities,
at amortized cost |
|
|
19,768,874 |
|
|
|
983,658 |
|
|
|
4.98 |
|
|
|
16,694,279 |
|
|
|
875,008 |
|
|
|
5.24 |
|
|
|
11,391,487 |
|
|
|
587,905 |
|
|
|
5.16 |
|
Federal Home Loan Bank stock |
|
|
876,736 |
|
|
|
43,103 |
|
|
|
4.92 |
|
|
|
790,305 |
|
|
|
48,009 |
|
|
|
6.07 |
|
|
|
586,021 |
|
|
|
39,492 |
|
|
|
6.74 |
|
Investment securities, at amortized cost |
|
|
4,577,148 |
|
|
|
213,374 |
|
|
|
4.66 |
|
|
|
3,602,206 |
|
|
|
176,208 |
|
|
|
4.89 |
|
|
|
5,358,155 |
|
|
|
254,107 |
|
|
|
4.74 |
|
|
|
|
|
|
|
|
|
|
|
|
|
|
|
|
|
|
|
|
|
|
|
|
|
|
|
|
|
|
|
|
Total interest-earning assets |
|
|
56,296,335 |
|
|
|
2,941,786 |
|
|
|
5.23 |
|
|
|
48,098,218 |
|
|
|
2,653,225 |
|
|
|
5.52 |
|
|
|
39,223,522 |
|
|
|
2,127,505 |
|
|
|
5.42 |
|
Noninterest-earning assets |
|
|
1,044,983 |
|
|
|
|
|
|
|
|
|
|
|
788,032 |
|
|
|
|
|
|
|
|
|
|
|
621,860 |
|
|
|
|
|
|
|
|
|
|
|
|
|
|
|
|
|
|
|
|
|
|
|
|
|
|
|
|
|
|
|
|
|
|
|
|
|
|
|
|
|
|
|
Total assets |
|
$ |
57,341,318 |
|
|
|
|
|
|
|
|
|
|
$ |
48,886,250 |
|
|
|
|
|
|
|
|
|
|
$ |
39,845,382 |
|
|
|
|
|
|
|
|
|
|
|
|
|
|
|
|
|
|
|
|
|
|
|
|
|
|
|
|
|
|
|
|
|
|
|
|
|
|
|
|
|
|
|
Liabilities and stockholders’ equity: |
|
|
|
|
|
|
|
|
|
|
|
|
|
|
|
|
|
|
|
|
|
|
|
|
|
|
|
|
|
|
|
|
|
|
|
|
Interest-bearing liabilities: |
|
|
|
|
|
|
|
|
|
|
|
|
|
|
|
|
|
|
|
|
|
|
|
|
|
|
|
|
|
|
|
|
|
|
|
|
Savings accounts |
|
$ |
749,439 |
|
|
|
5,640 |
|
|
|
0.75 |
% |
|
$ |
724,943 |
|
|
|
5,485 |
|
|
|
0.76 |
% |
|
$ |
775,802 |
|
|
|
6,330 |
|
|
|
0.82 |
% |
Interest-bearing transaction accounts |
|
|
1,789,361 |
|
|
|
31,903 |
|
|
|
1.78 |
|
|
|
1,578,419 |
|
|
|
48,444 |
|
|
|
3.07 |
|
|
|
1,806,203 |
|
|
|
60,641 |
|
|
|
3.36 |
|
Money market accounts |
|
|
3,823,116 |
|
|
|
69,008 |
|
|
|
1.81 |
|
|
|
2,227,261 |
|
|
|
73,180 |
|
|
|
3.29 |
|
|
|
1,176,185 |
|
|
|
47,172 |
|
|
|
4.01 |
|
Time deposits |
|
|
14,771,051 |
|
|
|
376,917 |
|
|
|
2.55 |
|
|
|
11,546,958 |
|
|
|
454,248 |
|
|
|
3.93 |
|
|
|
10,005,377 |
|
|
|
492,793 |
|
|
|
4.93 |
|
|
|
|
|
|
|
|
|
|
|
|
|
|
|
|
|
|
|
|
|
|
|
|
|
|
|
|
|
|
|
|
Total interest-bearing deposits |
|
|
21,132,967 |
|
|
|
483,468 |
|
|
|
2.29 |
|
|
|
16,077,581 |
|
|
|
581,357 |
|
|
|
3.62 |
|
|
|
13,763,567 |
|
|
|
606,936 |
|
|
|
4.41 |
|
Repurchase agreements |
|
|
15,100,221 |
|
|
|
611,776 |
|
|
|
4.05 |
|
|
|
13,465,540 |
|
|
|
561,301 |
|
|
|
4.17 |
|
|
|
10,305,216 |
|
|
|
432,852 |
|
|
|
4.20 |
|
FHLB advances |
|
|
15,035,798 |
|
|
|
603,064 |
|
|
|
4.01 |
|
|
|
13,737,057 |
|
|
|
568,590 |
|
|
|
4.14 |
|
|
|
10,286,869 |
|
|
|
440,534 |
|
|
|
4.28 |
|
|
|
|
|
|
|
|
|
|
|
|
|
|
|
|
|
|
|
|
|
|
|
|
|
|
|
|
|
|
|
|
Total borrowed funds |
|
|
30,136,019 |
|
|
|
1,214,840 |
|
|
|
4.03 |
|
|
|
27,202,597 |
|
|
|
1,129,891 |
|
|
|
4.15 |
|
|
|
20,592,085 |
|
|
|
873,386 |
|
|
|
4.24 |
|
|
|
|
|
|
|
|
|
|
|
|
|
|
|
|
|
|
|
|
|
|
|
|
|
|
|
|
|
|
|
|
Total interest-bearing liabilities |
|
|
51,268,986 |
|
|
|
1,698,308 |
|
|
|
3.31 |
|
|
|
43,280,178 |
|
|
|
1,711,248 |
|
|
|
3.95 |
|
|
|
34,355,652 |
|
|
|
1,480,322 |
|
|
|
4.31 |
|
|
|
|
|
|
|
|
|
|
|
|
|
|
|
|
|
|
|
|
|
|
|
|
|
|
|
|
|
|
|
|
Noninterest-bearing liabilities: |
|
|
|
|
|
|
|
|
|
|
|
|
|
|
|
|
|
|
|
|
|
|
|
|
|
|
|
|
|
|
|
|
|
|
|
|
Noninterest-bearing deposits |
|
|
576,575 |
|
|
|
|
|
|
|
|
|
|
|
554,584 |
|
|
|
|
|
|
|
|
|
|
|
514,685 |
|
|
|
|
|
|
|
|
|
Other noninterest-bearing liabilities |
|
|
317,972 |
|
|
|
|
|
|
|
|
|
|
|
289,930 |
|
|
|
|
|
|
|
|
|
|
|
222,760 |
|
|
|
|
|
|
|
|
|
|
|
|
|
|
|
|
|
|
|
|
|
|
|
|
|
|
|
|
|
|
|
|
|
|
|
|
|
|
|
|
|
|
|
Total noninterest-bearing liabilities |
|
|
894,547 |
|
|
|
|
|
|
|
|
|
|
|
844,514 |
|
|
|
|
|
|
|
|
|
|
|
737,445 |
|
|
|
|
|
|
|
|
|
|
|
|
|
|
|
|
|
|
|
|
|
|
|
|
|
|
|
|
|
|
|
|
|
|
|
|
|
|
|
|
|
|
|
Total liabilities |
|
|
52,163,533 |
|
|
|
|
|
|
|
|
|
|
|
44,124,692 |
|
|
|
|
|
|
|
|
|
|
|
35,093,097 |
|
|
|
|
|
|
|
|
|
Stockholders’ equity |
|
|
5,177,785 |
|
|
|
|
|
|
|
|
|
|
|
4,761,558 |
|
|
|
|
|
|
|
|
|
|
|
4,752,285 |
|
|
|
|
|
|
|
|
|
|
|
|
|
|
|
|
|
|
|
|
|
|
|
|
|
|
|
|
|
|
|
|
|
|
|
|
|
|
|
|
|
|
|
Total liabilities and
stockholders’ equity |
|
$ |
57,341,318 |
|
|
|
|
|
|
|
|
|
|
$ |
48,886,250 |
|
|
|
|
|
|
|
|
|
|
$ |
39,845,382 |
|
|
|
|
|
|
|
|
|
|
|
|
|
|
|
|
|
|
|
|
|
|
|
|
|
|
|
|
|
|
|
|
|
|
|
|
|
|
|
|
|
|
|
Net interest income |
|
|
|
|
|
$ |
1,243,478 |
|
|
|
|
|
|
|
|
|
|
$ |
941,977 |
|
|
|
|
|
|
|
|
|
|
$ |
647,183 |
|
|
|
|
|
|
|
|
|
|
|
|
|
|
|
|
|
|
|
|
|
|
|
|
|
|
|
|
|
|
|
|
|
|
|
|
|
|
|
Net interest rate spread (2) |
|
|
|
|
|
|
|
|
|
|
1.92 |
|
|
|
|
|
|
|
|
|
|
|
1.57 |
|
|
|
|
|
|
|
|
|
|
|
1.11 |
|
Net interest-earning assets |
|
$ |
5,027,349 |
|
|
|
|
|
|
|
|
|
|
$ |
4,818,040 |
|
|
|
|
|
|
|
|
|
|
$ |
4,867,870 |
|
|
|
|
|
|
|
|
|
|
|
|
|
|
|
|
|
|
|
|
|
|
|
|
|
|
|
|
|
|
|
|
|
|
|
|
|
|
|
|
|
|
|
Net interest margin (3) |
|
|
|
|
|
|
|
|
|
|
2.21 |
% |
|
|
|
|
|
|
|
|
|
|
1.96 |
% |
|
|
|
|
|
|
|
|
|
|
1.65 |
% |
Ratio of interest-earning assets to
interest-bearing liabilities |
|
|
|
|
|
|
|
|
|
|
1.10 |
x |
|
|
|
|
|
|
|
|
|
|
1.11 |
x |
|
|
|
|
|
|
|
|
|
|
1.14 |
x |
|
|
|
| (1) |
|
Amount is net of deferred loan costs and allowance for loan losses and includes non-performing loans. |
| |
| (2) |
|
Determined by subtracting the weighted average cost of average total interest-bearing liabilities from the weighted average yield on average total interest-earning assets. |
| |
| (3) |
|
Determined by dividing net interest income by average total interest-earning assets. |
Page 11
Rate/Volume Analysis. The following table presents the extent to which the changes in
interest rates and the changes in volume of our interest-earning assets and interest-bearing
liabilities have affected our interest income and interest expense during the periods indicated.
Information is provided in each category with respect to:
| • |
|
changes attributable to changes in volume (changes in volume multiplied by prior rate); |
| |
| • |
|
changes attributable to changes in rate (changes in rate multiplied by prior volume); and |
| |
| • |
|
the net change. |
The changes attributable to the combined impact of volume and rate have been allocated
proportionately to the changes due to volume and the changes due to rate.
| |
|
|
|
|
|
|
|
|
|
|
|
|
|
|
|
|
|
|
|
|
|
|
|
|
| |
|
2009 Compared to 2008 |
|
|
2008 Compared to 2007 |
|
| |
|
Increase (Decrease) Due To |
|
|
Increase (Decrease) Due To |
|
| |
|
Volume |
|
|
Rate |
|
|
Net |
|
|
Volume |
|
|
Rate |
|
|
Net |
|
| |
|
|
|
|
|
|
| |
|
(In thousands) |
|
Interest-earning assets: |
|
|
|
|
|
|
|
|
|
|
|
|
|
|
|
|
|
|
|
|
|
|
|
|
First mortgage loans, net |
|
$ |
211,866 |
|
|
$ |
(56,598 |
) |
|
$ |
155,268 |
|
|
$ |
296,643 |
|
|
$ |
21,417 |
|
|
$ |
318,060 |
|
Consumer and other loans |
|
|
(2,443 |
) |
|
|
(2,065 |
) |
|
|
(4,508 |
) |
|
|
(597 |
) |
|
|
(1,466 |
) |
|
|
(2,063 |
) |
Federal funds sold |
|
|
3,014 |
|
|
|
(6,123 |
) |
|
|
(3,109 |
) |
|
|
(1,677 |
) |
|
|
(6,321 |
) |
|
|
(7,998 |
) |
Mortgage-backed securities |
|
|
153,977 |
|
|
|
(45,327 |
) |
|
|
108,650 |
|
|
|
277,849 |
|
|
|
9,254 |
|
|
|
287,103 |
|
Federal Home Loan Bank stock |
|
|
4,857 |
|
|
|
(9,763 |
) |
|
|
(4,906 |
) |
|
|
12,737 |
|
|
|
(4,220 |
) |
|
|
8,517 |
|
Investment securities |
|
|
45,780 |
|
|
|
(8,614 |
) |
|
|
37,166 |
|
|
|
(85,698 |
) |
|
|
7,799 |
|
|
|
(77,899 |
) |
| |
Total |
|
|
417,051 |
|
|
|
(128,490 |
) |
|
|
288,561 |
|
|
|
499,257 |
|
|
|
26,463 |
|
|
|
525,720 |
|
| |
|
|
|
|
|
|
|
|
|
|
|
|
|
|
|
|
|
|
|
|
|
|
|
|
|
Interest-bearing liabilities: |
|
|
|
|
|
|
|
|
|
|
|
|
|
|
|
|
|
|
|
|
|
|
|
|
Savings accounts |
|
|
215 |
|
|
|
(60 |
) |
|
|
155 |
|
|
|
(400 |
) |
|
|
(445 |
) |
|
|
(845 |
) |
Interest-bearing transaction accounts |
|
|
5,835 |
|
|
|
(22,376 |
) |
|
|
(16,541 |
) |
|
|
(7,241 |
) |
|
|
(4,956 |
) |
|
|
(12,197 |
) |
Money market accounts |
|
|
37,937 |
|
|
|
(42,109 |
) |
|
|
(4,172 |
) |
|
|
35,760 |
|
|
|
(9,752 |
) |
|
|
26,008 |
|
Time deposits |
|
|
106,911 |
|
|
|
(184,242 |
) |
|
|
(77,331 |
) |
|
|
69,745 |
|
|
|
(108,290 |
) |
|
|
(38,545 |
) |
Repurchase agreements |
|
|
66,928 |
|
|
|
(16,453 |
) |
|
|
50,475 |
|
|
|
131,568 |
|
|
|
(3,119 |
) |
|
|
128,449 |
|
FHLB advances |
|
|
52,690 |
|
|
|
(18,216 |
) |
|
|
34,474 |
|
|
|
142,921 |
|
|
|
(14,865 |
) |
|
|
128,056 |
|
| |
Total |
|
|
270,516 |
|
|
|
(283,456 |
) |
|
|
(12,940 |
) |
|
|
372,353 |
|
|
|
(141,427 |
) |
|
|
230,926 |
|
| |
|
|
|
|
|
|
|
|
|
|
|
|
|
|
|
|
|
|
|
|
|
|
|
|
|
Net change in net
interest income |
|
$ |
146,535 |
|
|
$ |
154,966 |
|
|
$ |
301,501 |
|
|
$ |
126,904 |
|
|
$ |
167,890 |
|
|
$ |
294,794 |
|
|
|
|
|
|
|
|
|
|
|
|
|
|
|
|
|
|
|
|
Comparison of Operating Results for the Years Ended December 31, 2009 and 2008
General. Net income was $527.2 million for 2009, an increase of $81.6 million, or 18.3%,
compared with net income of $445.6 million for 2008. Basic and diluted earnings per common share
were $1.08 and $1.07, respectively for 2009 as compared to basic and diluted earnings per share of
$0.92 and $0.90, respectively for 2008. For 2009, our return on average shareholders’ equity was
10.18%, compared with 9.36% for 2008. Our return on average assets for 2009 was 0.92% as compared
to 0.91% for 2008. The increase in the return on average equity and assets is primarily due to the
increase in net income during 2009.
Interest and Dividend Income. Total interest and dividend income for 2009 increased $288.6
million, or 10.9%, to $2.94 billion as compared to $2.65 billion for 2008. The increase in total
interest and dividend income was primarily due to an $8.20 billion, or 17.0%, increase in the
average balance of total interest-earning assets to $56.30 billion for 2009 as compared to $48.10
billion for 2008. The increase in the average balance of total
Page 12
interest-earning assets was partially offset by a decrease of 29 basis points in the
weighted-average yield on total interest-earning assets to 5.23% for 2009 from 5.52% for 2008.
Interest on first mortgage loans increased $155.3 million, or 10.2%, to $1.68 billion for 2009 as
compared to $1.52 billion for 2008. This was primarily due to a $3.75 billion increase in the
average balance of first mortgage loans to $30.13 billion during 2009 as compared to $26.38 billion
for 2008, which reflected our continued emphasis on the growth of our mortgage loan portfolio and
an increase in mortgage originations due to the refinancing activity caused by market interest
rates that are at near-historic lows. The positive impact on first mortgage loan interest income
from the increase in the average balance was partially offset by a 21 basis point decrease in the
weighted-average yield to 5.57% for 2009 as compared to 5.78% for 2008. The decrease in the
average yield earned was due to lower market interest rates on mortgage products and also due to
the continued mortgage refinancing activity. During 2009, existing mortgage customers refinanced
or modified approximately $2.80 billion in mortgage loans with a weighted average rate of 5.78% to
a new rate of 5.03%. We allow existing customers to modify their mortgage loans, for a fee, with
the intent of maintaining our customer relationship in periods of extensive refinancing due to a
low interest rate environment. The modification changes the existing interest rate to the market
rate for a product currently offered by us with a similar or reduced term. We generally do not
extend the maturity date of the loan. To qualify for a modification, the loan should be current
and our review of past payment performance should indicate that no payments were past due in any of
the 12 preceding months. In general, all other terms and conditions of the existing mortgage
remain the same.
Interest on consumer and other loans decreased $4.5 million to $21.7 million for 2009 from $26.2
million for 2008. The average balance of consumer and other loans decreased $41.1 million to
$381.0 million for 2009 as compared to $422.1 million for 2008 and the average yield earned
decreased 51 basis points to 5.69% as compared to 6.20% for 2008.
Interest on mortgage-backed securities increased $108.7 million, or 12.4%, to $983.7 million for
2009 as compared to $875.0 million for 2008. This increase was due primarily to a $3.08 billion
increase in the average balance of mortgage-backed securities to $19.77 billion during 2009 as
compared to $16.69 billion for 2008, partially offset by a 26 basis point decrease in the
weighted-average yield to 4.98% as compared to 5.24% for the same respective periods.
The increase in the average balance of mortgage-backed securities is due to purchases of these
securities during 2009 which provide us with a source of cash flow from monthly principal and
interest payments. The decrease in the weighted average yield on mortgage-backed securities is a
result of lower yields on securities purchased during the second half of 2008 and for 2009 compared
to the yields on the $4.73 billion of mortgage-backed securities that matured during the year.
Interest on investment securities increased $37.2 million to $213.4 million for 2009 as compared to
$176.2 million for 2008. This increase was due primarily to a $974.9 million increase in the
average balance of investment securities to $4.58 billion for 2009 from $3.60 billion for 2008.
The impact on interest income from the increase in the average balance of investment securities was
partially offset by a decrease in the average yield of investment securities of 23 basis points to
4.66% in 2009 as compared to 4.89% in 2008.
Dividends on FHLB stock decreased $4.9 million, or 10.2%, to $43.1 million for 2009 as compared to
$48.0 million for 2008. The decrease was due primarily to a 115 basis point decrease in the
average yield to 4.92% as compared to 6.07% for 2008. The decrease in the average yield earned was
partially offset by an $86.4 million increase in the average balance to $876.7 million for 2009 as
compared to $790.3 million for 2008.
Interest Expense. Total interest expense for 2009 decreased $12.9 million to $1.70 billion as
compared to $1.71 billion for 2008. This decrease was primarily due to a 64 basis point decrease
in the weighted-average cost of total interest-bearing liabilities to 3.31% for 2009 compared with
3.95% for 2008. The decrease was
Page 13
partially offset by a $7.99 billion, or 18.5%, increase in the average balance of total
interest-bearing liabilities to $51.27 billion for the year ended December 31, 2009 as compared to
$43.28 billion for 2008.
Interest expense on our time deposit accounts decreased $77.3 million to $376.9 million for 2009 as
compared to $454.2 million for 2008. This decrease was due to a decrease in the weighted-average
cost of 138 basis points to 2.55% for 2009 from 3.93% for 2008. This decrease was partially offset
by a $3.22 billion increase in the average balance of time deposit accounts to $14.77 billion for
2009 from $11.55 billion for 2008. Interest expense on money market accounts decreased $4.2
million to $69.0 million for 2009 as compared to $73.2 million for the same period in 2008. This
decrease was due to a 148 basis point decrease in the weighted-average cost to 1.81%, partially
offset by a $1.59 billion increase in the average balance to $3.82 billion as compared to $2.23
billion for 2008. Interest expense on our interest-bearing transaction accounts decreased $16.5
million to $31.9 million for 2009 as compared to $48.4 million for 2008. The decrease is due to a
129 basis point decrease in the weighted-average cost to 1.78%, partially offset by a $210.9
million increase in the average balance to $1.79 billion.
The increases in the average balances of interest-bearing deposits reflect our plan to expand our
branch network and to grow deposits in our existing branches by offering competitive rates. Also,
in response to the economic recession, we believe that households have increased their personal
savings and customers have sought insured bank deposit products as an alternative to investments
such as equity securities and bonds. We believe these factors contributed to our deposit growth.
The decrease in the average cost of deposits for 2009 reflected lower market interest rates.
Interest expense on borrowed funds increased $84.9 million to $1.21 billion for 2009 as compared to
$1.13 billion for 2008. This was primarily due to a $2.94 billion increase in the average balance
of borrowed funds to $30.14 billion, partially offset by a 12 basis point decrease in the
weighted-average cost of borrowed funds to 4.03%.
The decrease in the average cost of borrowings for 2009 reflected new borrowings in 2009 and 2008,
when market interest rates were lower than existing borrowings and borrowings that matured.
Substantially all of our borrowings are callable quarterly at the discretion of the lender after an
initial no-call period of one to five years with a final maturity of ten years. At December 31,
2009, we had $22.25 billion of borrowed funds with a weighted-average rate of 4.14% and with call
dates within one year. We believe, given current market conditions, that the likelihood that a
significant portion of these borrowings would be called will not increase substantially unless
interest rates were to increase by at least 300 basis points. During 2009, we modified $1.73
billion of borrowings to extend the call dates of the borrowings by between three and four years
while keeping the interest rates consistent. See “Liquidity and Capital Resources.”
Net Interest Income. Net interest income increased $301.5 million, or 32.0%, to $1.24 billion
for 2009 compared to $942.0 million for 2008. Our net interest rate spread increased 35 basis
points to 1.92% for 2009 from 1.57% for 2008. Our net interest margin increased 25 basis points to
2.21% for 2009 from 1.96% for 2008.
The increase in our net interest margin and net interest rate spread was primarily due to the
decrease in the weighted-average cost of interest-bearing liabilities. The yield curve steepened
during 2009, with short-term rates decreasing slightly while longer-term rates increased.
Notwithstanding the increase in long-term rates, market rates on mortgage loans remain at
near-historic lows, resulting in increased refinancing activity which resulted in a decrease in the
yield we earned on mortgage-related assets. However, we were able to reduce deposit costs to a
greater extent than the decrease in mortgage yields thereby increasing our net interest rate spread
and net interest margin.
Provision for Loan Losses. The provision for loan losses amounted to $137.5 million for 2009 as
compared to $19.5 million for 2008. The allowance for loan losses (“ALL”) amounted to $140.1
million and $49.8 million
Page 14
at December 31, 2009 and 2008, respectively. We recorded our provision for loan losses during 2009
based on our ALL methodology that considers a number of quantitative and qualitative factors,
including the amount of non-performing loans, the loss experience of our non-performing loans,
conditions in the real estate and housing markets, current economic conditions, particularly
increasing levels of unemployment, and growth in the loan portfolio. See “Critical Accounting
Policies — Allowance for Loan Losses.”
Our primary lending emphasis is the origination and purchase of one- to four-family first mortgage
loans on residential properties and, to a lesser extent, second mortgage loans on one- to
four-family residential properties. Our loan growth is primarily concentrated in one- to
four-family mortgage loans with original loan-to-value (“LTV”) ratios of less than 80%. The
average LTV ratio of our 2009 one- to four-family first mortgage loan originations and our total
one- to four-family first mortgage loan portfolio were 60.5% and 60.8%, respectively using the
appraised value at the time of origination. The value of the property used as collateral for our
loans is dependent upon local market conditions. As part of our estimation of the ALL, we monitor
changes in the values of homes in each market using indices published by various organizations.
Based on our analysis of the data for the fourth quarter of 2009, we concluded that home values in
the Northeast quadrant of the United States, where most of our lending activity occurs, have
continued to decline from 2008 levels, as evidenced by reduced levels of sales, increasing
inventories of houses on the market, declining house prices and an increase in the length of time
houses remain on the market. However, the rate of decline in home values decreased during the
second half of 2009. We define the Northeast quadrant of the country generally as those states that
are east of the Mississippi River and as far south as South Carolina.
The following table presents the geographic distribution of our loan portfolio as a percentage of
total loans and of our non-performing loans as a percentage of total non-performing loans. The LTV
ratio is for non-performing first mortgage loans and is based on appraised value at the time of
origination.
| |
|
|
|
|
|
|
|
|
|
|
|
|
| |
|
At December 31, 2009 |
|
| |
|
|
|
|
|
|
|
|
|
Average LTV ratio |
|
| |
|
|
|
|
|
|
|
|
|
of Non-performing |
|
| |
|
Total loans |
|
|
Non-performing loans |
|
|
first mortgage loans |
|
New Jersey |
|
|
43.0 |
% |
|
|
41.6 |
% |
|
|
69 |
% |
New York |
|
|
18.2 |
|
|
|
18.0 |
|
|
|
70 |
|
Connecticut |
|
|
12.6 |
|
|
|
4.2 |
|
|
|
72 |
|
|
|
|
|
|
|
|
|
|
|
|
Total New York
metropolitan area |
|
|
73.8 |
|
|
|
63.8 |
|
|
|
69 |
|
|
|
|
|
|
|
|
|
|
|
|
|
|
Virginia |
|
|
4.6 |
|
|
|
6.2 |
|
|
|
78 |
|
Illinois |
|
|
3.9 |
|
|
|
5.6 |
|
|
|
78 |
|
Maryland |
|
|
3.5 |
|
|
|
5.1 |
|
|
|
76 |
|
Massachusetts |
|
|
2.7 |
|
|
|
2.3 |
|
|
|
75 |
|
Pennsylvania |
|
|
2.0 |
|
|
|
1.9 |
|
|
|
75 |
|
Minnesota |
|
|
1.4 |
|
|
|
1.8 |
|
|
|
82 |
|
Michigan |
|
|
1.3 |
|
|
|
4.2 |
|
|
|
75 |
|
All others |
|
|
6.8 |
|
|
|
9.1 |
|
|
|
71 |
|
|
|
|
|
|
|
|
|
|
|
|
Total Outside New
York
metropolitan area |
|
|
26.2 |
|
|
|
36.2 |
|
|
|
75 |
|
|
|
|
|
|
|
|
|
|
|
|
|
|
|
100.0 |
% |
|
|
100.0 |
% |
|
|
72 |
% |
|
|
|
|
|
|
|
|
|
|
|
The national economy has been in a recessionary cycle for approximately 2 years with the
housing and real estate markets suffering significant losses in value. The faltering economy has
been marked by contractions in the availability of business and consumer credit, increases in
corporate borrowing rates, falling home prices,
Page 15
increasing home foreclosures and rising levels of unemployment. Economic conditions have improved
slightly during the second half of 2009 although unemployment rates continued to increase. We
continue to closely monitor the local and national real estate markets and other factors related to
risks inherent in our loan portfolio. We determined the provision for
loan losses for
2009 based on our evaluation of the foregoing factors, the growth of the loan portfolio,
the recent increases in delinquent loans, non-performing loans and net loan charge-offs, and the
increasing trend in the unemployment rate.
At December 31, 2009, first mortgage loans secured by one-to four-family properties accounted for
98.7% of total loans. Fixed-rate mortgage loans represent 69.1% of our first mortgage loans.
Compared to adjustable-rate loans, fixed-rate loans possess less inherent credit risk since loan
payments do not change in response to changes in interest rates. In addition, we do not originate
or purchase loans with payment options, negative amortization loans or sub-prime loans.
Included in our loan portfolio at December 31, 2009 and December 31, 2008 are interest-only loans
of approximately $4.59 billion and $3.47 billion, respectively. These loans are originated as
adjustable rate mortgage loans with initial terms of five, seven or ten years with the
interest-only portion of the payment based upon the initial loan term, or offered on a 30-year
fixed-rate loan, with interest-only payments for the first 10 years of the obligation. At the end
of the initial 5-, 7- or 10-year interest-only period, the loan payment will adjust to include both
principal and interest and will amortize over the remaining term so the loan will be repaid at the
end of its original life. These loans are underwritten using the fully-amortizing payment amount.
We had $82.2 million and $16.6 million of non-performing interest-only loans at December 31, 2009
and December 31, 2008, respectively.
Non-performing loans amounted to $627.7 million at December 31, 2009 as compared to $217.6 million
at December 31, 2008. Non-performing loans at December 31, 2009 included $613.6 million of one- to
four-family first mortgage loans as compared to $207.0 million at December 31, 2008. The ratio of
non-performing loans to total loans was 1.98% at December 31, 2009 compared with 0.74% at December
31, 2008. Loans delinquent 60 to 89 days amounted to $182.5 million at December 31, 2009 as
compared to $104.7 million at December 31, 2008. Foreclosed real estate amounted to $16.7 million
at December 31, 2009 as compared to $15.5 million at December 31, 2008. As a result of our
conservative underwriting policies, our borrowers typically have a significant amount of equity, at
the time of origination, in the underlying real estate that we use as collateral for our loans.
Due to the steady deterioration of real estate values over the last
three
years, the LTV ratios based on appraisals obtained
at time of origination do not necessarily indicate the extent to which we may incur a loss on any
given loan that may go into foreclosure. However, our lower average
LTV ratios have helped to moderate our charge-offs as there has generally been adequate equity behind our first lien as of the
foreclosure date to satisfy our loan.
As a result of the increase in non-performing loans, the ratio of the ALL to non-performing loans
decreased from 102.09% at December 31, 2006 to 22.32% at December 31, 2009. During this same
period, the ratio of the ALL to total loans increased from 0.17% to 0.44%. Historically, our
non-performing loans have been a negligible percentage of our total loan portfolio and, as a
result, our ratio of the ALL to non-performing loans was high and did not serve as a reasonable
measure of the adequacy of our ALL. The decline in the ratio of the ALL to non-performing loans
is not, absent other factors, an indication of the adequacy of the ALL since there is not
necessarily a direct relationship between changes in various asset quality ratios and changes in
the ALL and non-performing loans. In the current economic environment, a loan generally becomes
non-performing when the borrower experiences financial difficulty. In many cases, the borrower
also has a second mortgage or home equity loan on the property. In substantially all of these
cases, we do not hold the second mortgage or home equity loan as this is not a business we have
actively pursued.
The Company’s losses on non-performing loans increased in 2009 but, overall, have been modest due
to our first lien position and relatively low average LTV ratios. We generally obtain new
collateral values for loans after 180 days of delinquency. If the estimated fair value of the
collateral (less estimated selling costs) is less
Page 16
than the recorded investment in the loan, we charge-off an amount to reduce the loan to the fair
value of the collateral less estimated selling costs. As a result, certain losses inherent in
our non-performing loans are being recognized as charge-offs which may result in a lower ratio of
the ALL to non-performing loans when accompanied by a concurrent increase in total non-performing
loans (i.e. due to the addition of new non-performing loans). Charge-offs amounted to $47.2
million, consisting of 517 loans, for 2009 and $4.4 million, consisting of 47 loans, in 2008.
These charge-offs were primarily due to the results of our reappraisal process for our
non-performing residential first mortgage loans with only 55 loans disposed of through the
foreclosure process during 2009 with a final loss on sale (after previous charge-offs) of $2.4
million. The results of our reappraisal process and our recent charge-off history are also
considered in the determination of the ALL. At December 31, 2009 the average LTV ratio (using
appraised values at the time of origination) of our non-performing loans was 72.4% and was 60.8%
for our total mortgage loan portfolio. Thus, the ratio of the ALL to non-performing loans needs
to be viewed in the context of the underlying LTV’s of the non-performing loans and the relative
decline in home values.
As part of our estimation of the ALL, we monitor changes in the values of homes in each market
using indices published by various organizations including the Office of Federal Housing
Enterprise Oversight and Case-Shiller. Our Asset Quality Committee (“AQC”) uses these indices
and a stratification of our loan portfolio by state as part of its quarterly determination of the
ALL. We do not apply different loss factors based on geographic locations since, at December
31, 2009, 73.8% of our loan portfolio and 63.8% of our non-performing loans are located in the
New York metropolitan area. In addition, we obtain updated collateral values when a loan becomes
180 days past due which we believe identifies potential charge-offs more accurately than a house
price index that is based on a wide geographic area and includes many different types of houses.
However, we use the house price indices to identify geographic areas experiencing weaknesses in
housing markets to determine if an overall adjustment to the ALL is required based on loans we
have in those geographic areas and to determine if changes in the loss factors used in the ALL
quantitative analysis are necessary. Our quantitative analysis of the ALL accounts for increases
in non-performing loans by applying progressively higher risk factors to loans as they become
more delinquent.
Due to the nature of our loan portfolio, our evaluation of the adequacy of our ALL is performed
primarily on a “pooled” basis. Each month we prepare an analysis which categorizes the entire
loan portfolio by certain risk characteristics such as loan type (one- to four-family,
multi-family, commercial, construction, etc.), loan source (originated or purchased) and payment
status (i.e., current or number of days delinquent). Loans with known potential losses are
categorized separately. We assign potential loss factors to the payment status categories on the
basis of our assessment of the potential risk inherent in each loan type. These factors are
periodically reviewed for appropriateness giving consideration to charge-off history, delinquency
trends, portfolio growth and the status of the regional economy and housing market, in order to
ascertain that the loss factors cover probable and estimable losses inherent in the portfolio.
Based on our recent loss experience on non-performing loans, we increased the loss factors used
in our quantitative analysis of the ALL for our one- to four-family first mortgage loans during
2009. If our future loss experience requires additional increases in our loss factors, this may
result in increased levels of loan loss provisions.
In addition to our quantitative systematic methodology, we also use qualitative analyses to
determine the adequacy of our ALL. Our qualitative analyses include further evaluation of economic
factors, such as trends in the unemployment rate, as well as a ratio analysis to evaluate the
overall measurement of the ALL. This analysis includes a review of delinquency ratios, net
charge-off ratios and the ratio of the ALL to both non-performing loans and total loans. This
qualitative review is used to reassess the overall determination of the ALL and to ensure that
directional changes in the ALL and the provision for loan losses are supported by relevant internal
and external data.
We consider the average LTV of our non-performing loans and our total portfolio in relation to the
overall changes in house prices in our lending markets when determining the ALL. This provides us
with a “macro” indication of the severity of potential losses that might be expected. Since
substantially all our portfolio consists
Page 17
of first mortgage loans on residential properties, the LTV is particularly important to us when a
loan becomes non-performing. The weighted average LTV in our one- to four-family mortgage loan
portfolio at December 31, 2009 was 60.8%, using appraised values at the time of origination. The
average LTV ratio of our non-performing loans was 72.4% at December 31, 2009. Based on the
valuation indices, house prices have declined in the New York metropolitan area, where 63.8% of our
non-performing loans were located at December 31, 2009, by approximately 20% from the peak of the
market in 2006 through November 2009 and by 29% nationwide
during that period. Changes in house values may affect our loss experience which may require that we change the loss factors used in
our quantitative analysis of the allowance for loan losses. There can be no
assurance whether significant further declines in house values may occur and result in a higher
loss experience and increased levels of charge-offs and loan loss provisions.
Net charge-offs amounted to $47.2 million for 2009 as compared to net charge-offs of $4.4 million
for 2008. Our charge-offs on non-performing loans have historically been low relative to the size
of our portfolio due to the amount of underlying equity in the properties collateralizing our first
mortgage loans. Until this current recessionary cycle, it was our experience that as a
non-performing loan approached foreclosure, the borrower sold the underlying property or, if there
was a second mortgage or other subordinated lien, the subordinated lien holder would purchase the
property to protect their interest thereby resulting in the full payment of principal and interest
to Hudson City Savings Bank (“Hudson City Savings”). This process normally took approximately 12
months. However, due to the unprecedented level of foreclosures and the desire by most states to
slow the foreclosure process, we are now experiencing a time frame to repayment or foreclosure
ranging from 24 to 30 months from the initial non-performing period. If real estate prices decline
further, this extended time may result in further charge-offs. In addition, current conditions in
the housing market have made it more difficult for borrowers to sell homes to satisfy the mortgage
and second lien holders are less likely to purchase the property and repay our loan if the value of
the property is not enough to satisfy their loan. We continue to monitor closely the property
values underlying our non-performing loans during this timeframe and take appropriate charge-offs
when the loan balances exceed the underlying property values.
At December 31, 2009 and December 31, 2008, commercial and construction loans evaluated for
impairment in accordance with Financial Accounting Standards Board (“FASB”) guidance amounted to
$11.2 million and $9.5 million, respectively. Based on this evaluation, we established an ALL of
$2.1 million for loans classified as impaired at December 31, 2009 compared to $818,000 at December
31, 2008.
The markets in which we lend have experienced significant declines in real estate values which we
have taken into account in evaluating our ALL. Although we believe that we have established and
maintained the ALL at adequate levels, additions may be necessary if future economic and other
conditions differ substantially from the current operating environment. Increases in our loss
experience on non-performing loans, the loss factors used in our quantitative analysis of the ALL
and continued increases in overall loan delinquencies can have a significant impact on our need for
increased levels of loan loss provisions in the future. No assurance can be given in any
particular case that our LTV ratios will provide full protection in the event of borrower default.
Although we use the best information available, the level of the ALL remains an estimate that is
subject to significant judgment and short-term change. See “Critical Accounting Policies.”
Non-Interest Income. Total non-interest income was $33.6 million for 2009 as compared to $8.5
million for 2008. Non-interest income primarily consists of service charges on loans and deposits.
Included in non-interest income of 2009 were net gains on securities transactions of $24.2 million
which resulted primarily from the sale of $761.6 million of mortgage-backed securities
available-for-sale. Proceeds from the securities sale were primarily used to fund the purchase of
first mortgage loans during the second quarter of 2009.
Non-Interest Expense. Total non-interest expense for the year ended December 31, 2009 was
$265.6 million as compared to $198.1 million during 2008. The increase is primarily due to the FDIC
special assessment of $21.1 million, a $30.8 million increase in Federal deposit insurance expense,
a $9.9 million increase in compensation and employee benefits expense, and a $4.0 million increase
in other non-interest expense. The special assessment and the increase in Federal deposit
insurance expense were the result of the restoration plan implemented by the FDIC to recapitalize
the Deposit Insurance Fund. The increase in compensation and
Page 18
employee benefits expense included a $6.0 million increase in compensation costs, due primarily to
normal increases in salary as well as additional full time employees, a $3.3 million increase in
pension costs and a $3.4 million increase in costs related to our health plan. These increases
were partially offset by a $2.8 million decrease in expense related to our stock benefit plans.
This decrease was due primarily to a decrease in ESOP expense as a result of changes in the price
of our common stock during 2009. Included in other non-interest expense for the year ended
December 31, 2009 were write-downs on foreclosed real estate and net losses on the sale of
foreclosed real estate, of $2.4 million as compared to $1.3 million for 2008.
Our efficiency ratio was 20.80% for 2009 as compared to 20.84% for 2008. The efficiency ratio is
calculated by dividing non-interest expense by the sum of net interest income and non-interest
income. Our ratio of non-interest expense to average total assets for 2009 was 0.46% as compared to
0.41% for 2008.
Income Taxes. Income tax expense amounted to $346.7 million for 2009 compared with $287.3
million for 2008. Our effective tax rate for 2009 was 39.67% compared with 39.21% for 2008.
Comparison of Operating Results for the Years Ended December 31, 2008 and 2007
General. Net income was $445.6 million for 2008, an increase of $149.7 million, or 50.6%, as
compared to $295.9 million for 2007. Basic and diluted earnings per common share were $0.92 and
$0.90, respectively, for 2008, as compared to $0.59 and $0.58, respectively, for 2007. For 2008,
our return on average shareholders’ equity was 9.36%, compared with 6.23% for 2007. Our return on
average assets for 2008 was 0.91% as compared to 0.74% for 2007. The increase in the return on
average equity and assets is primarily due to the increase in net income during 2008.
Interest and Dividend Income. Total interest and dividend income for 2008 increased $525.7
million, or 24.7%, to $2.65 billion as compared to $2.13 billion for 2007. The increase in total
interest and dividend income was primarily due to an $8.88 billion, or 22.6%, increase in the
average balance of total interest-earning assets to $48.10 billion for 2008 as compared to $39.22
billion for 2007. The increase in interest and dividend income was also partially due to an
increase of 10 basis points in the weighted-average yield on total interest-earning assets to 5.52%
for 2008 from 5.42% for 2007.
Interest on first mortgage loans increased $318.1 million to $1.52 billion for 2008 as compared to
$1.21 billion for 2007. This was primarily due to a $5.17 billion increase in the average balance
of first mortgage loans to $26.38 billion for 2008 as compared to $21.21 billion for 2007. This
increase reflected our continued emphasis on the growth of our mortgage loan portfolio. The
increase in first mortgage loan interest income was also due to a 10 basis point increase in the
weighted-average yield to 5.78% for 2008. Notwithstanding the decrease in long-term market
interest rates noted above, mortgage rates have remained at a wider spread relative to U.S.
Treasury securities resulting in higher yields on mortgage loans.
Interest on consumer and other loans decreased $2.0 million to $26.2 million for 2008 as compared
to $28.2 million for 2007. The average balance of consumer and other loans decreased $9.4 million
to $422.1 million for 2008 as compared to $431.5 million for 2007 and the average yield earned
decreased 35 basis points to 6.20% as compared to 6.55% for the same periods.
Interest on mortgage-backed securities increased $287.1 million to $875.0 million for 2008 as
compared to $587.9 million for 2007. This increase was due primarily to a $5.30 billion increase
in the average balance of mortgage-backed securities to $16.69 billion during 2008 as compared to
$11.39 billion for 2007, and an 8 basis point increase in the weighted-average yield to 5.24% for
2008.
The increases in the average balances of mortgage-backed securities were due to purchases of
variable-rate mortgage-backed securities as part of our interest rate risk management strategy.
Since a substantial portion of our loan production consists of fixed-rate mortgage loans, the
purchase of variable-rate mortgage-backed
Page 19
securities provides us with an asset that reduces our exposure to interest rate fluctuations while
providing a source of cash flow from monthly principal and interest payments. The increase in the
weighted average yields for 2008 on mortgage-backed securities is a result of the purchase of new
securities during the second half of 2007 and the first half of 2008 when market interest rates
were higher than the yield earned on the existing portfolio.
Interest on investment securities decreased $77.9 million to $176.2 million during 2008 as compared
to $254.1 million for 2007. This decrease was due primarily to a $1.76 billion decrease in the
average balance of investment securities to $3.60 billion for 2008 as compared to $5.36 billion for
2007. The decrease in the average balance of investment securities was due to increased call
activity as a result of the decrease in market rates of securities with a shorter duration during
2008. The average yield on investment securities increased 15 basis points to 4.89% during 2008.
Dividends on FHLB stock increased $8.5 million, or 21.5%, to $48.0 million for 2008 as compared to
$39.5 million for 2007. This increase was due to a $204.3 million increase in the average balance
to $790.3 million for 2008 as compared to $586.0 million for 2007. The increase was partially
offset by a 67 basis point decrease in the average yield to 6.07% as compared to 6.74% for 2007.
Interest Expense. Total interest expense for 2008 increased $230.9 million, or 15.6%, to $1.71
billion as compared to $1.48 billion for 2007. This increase was primarily due to an $8.92
billion, or 26.0%, increase in the average balance of total interest-bearing liabilities to $43.28
billion for 2008 compared with $34.36 billion for 2007. The increase in the average balance of
total interest-bearing liabilities was partially offset by a 36 basis point decrease in the
weighted-average cost of total interest-bearing liabilities to 3.95% for 2008 compared with 4.31%
for 2007.
Interest expense on our time deposit accounts decreased $38.6 million to $454.2 million for 2008 as
compared to $492.8 million for 2007. This decrease was due primarily to a decrease of 100 basis
points in the weighted-average cost to 3.93%. This decrease was partially offset by a $1.54 billion
increase in the average balance of time deposit accounts to $11.55 billion for 2008 from $10.01
billion for 2007. Interest expense on money market accounts increased $26.0 million to $73.2
million for 2008 as compared to $47.2 million for 2007. This increase was due to a $1.05 billion
increase in the average balance to $2.23 billion, partially offset by a 72 basis point decrease in
the weighted-average cost to 3.29% for 2008. The increase in our time deposits and money market
checking accounts reflects our competitive pricing, our branch expansion and customer preference
for short-term deposit products. In addition, the turmoil in the credit and equity markets has
made deposit products in strong financial institutions desirable for many customers.
Interest expense on our interest-bearing transaction accounts decreased $12.2 million to $48.4
million for 2008 as compared to $60.6 million for 2007. This decrease was primarily due to a
$227.8 million decrease in the average balance to $1.58 billion and a 29 basis point decrease in
the average cost to 3.07% for 2008. The decrease in the average balance reflects customer
preferences for short-term time and money market deposit products.
Interest expense on borrowed funds increased $256.5 million to $1.13 billion for 2008 as compared
to $873.4 million for 2007 primarily due to a $6.61 billion increase in the average balance of
borrowed funds to $27.20 billion as compared to $20.59 billion for 2007. The weighted average cost
of borrowed funds decreased 9 basis points to 4.15% for 2008 as compared to 4.24% for 2007.
Borrowed funds were used to fund a significant portion of the growth in interest-earning assets in
2008. The decrease in the average cost of borrowings during 2008 reflected new borrowings in 2008,
when market interest rates were lower than existing borrowings and borrowings that were called.
Substantially all of our borrowings are callable quarterly at the discretion of the lender after an
initial non-call period of one to five years with a final maturity of ten years.
Page 20
Net Interest Income. Net interest income increased $294.8 million, or 45.6%, to $942.0 million
for 2008 as compared with $647.2 million for 2007. Our net interest rate spread increased 46 basis
points to 1.57% for 2008 from 1.11% for 2007. Our net interest margin increased 31 basis points to
1.96% from 1.65% for the same respective periods.
The increase in our net interest margin and net interest rate spread was primarily due to the
increase in the weighted-average yield on interest-earning assets and a decrease in the
weighted-average cost of interest-bearing liabilities. The decreases in market interest rates that
began during the second half of 2007 and continued through 2008 allowed us to lower the cost of our
deposits while the yields on our mortgage-related assets remained stable. As a result, our net
interest rate margin and net interest rate spread increased during 2008.
Provision for Loan Losses. The provision for loan losses amounted to $19.5 million for 2008 as
compared to $4.8 million for 2007. The ALL amounted to $49.8 million and $34.7 million at December
31, 2008 and 2007, respectively. We recorded our provision for loan losses during 2008 based on
our ALL methodology that considers a number of quantitative and qualitative factors, including the
amount of non-performing loans, which increased to $217.6 million at December 31, 2008 as compared
to $79.4 million at December 31, 2007. The higher provision for loan losses during 2008 reflects
the risks inherent in our loan portfolio due to weakening real estate markets, the increases in
non-performing loans and net charge-offs and the overall growth in the loan portfolio. See
“Critical Accounting Policies — Allowance for Loan Losses.”
Our primary lending emphasis is the origination and purchase of one- to four-family first mortgage
loans on residential properties and, to a lesser extent, second mortgage loans on one- to
four-family residential properties. Our loan growth was primarily concentrated in one- to
four-family mortgage loans with original loan-to-value ratios of less than 80%. The average
loan-to-value ratio of our 2008 first mortgage loan originations and our total first mortgage loan
portfolio was 60% and 61%, respectively using the appraised value at the time of origination. The
value of the property used as collateral for our loans is dependent upon local market conditions.
As part of our estimation of the ALL, we monitor changes in the values of homes in each market
using indices published by various organizations. Based on our analysis of the data for 2008, we
concluded that home values in the Northeast quadrant of the United States, where most of our
lending activity occurs, deteriorated during 2007 and 2008 as evidenced by reduced levels of sales,
increasing inventories of houses on the market, declining house prices and an increase in the
length of time houses remain on the market. In addition, general economic conditions in the United
States also worsened and entered a recession by the first quarter of 2008. We considered these
trends in economic and market conditions in determining the provision for loan losses also taking
into account the continued growth of our loan portfolio.
We define the Northeast quadrant of the country generally as those states that are east of the
Mississippi River and as far south as South Carolina. At December 31, 2008, approximately 69.7% of
our total loans are in the New York metropolitan area. Additionally, the states of Virginia,
Illinois, Maryland, Massachusetts, Minnesota, Michigan and Pennsylvania accounted for 5.5%, 4.3%,
4.2%, 3.0%, 1.8%, 1.7% and 1.5%, respectively of total loans. The remaining 8.3% of the loan
portfolio is secured by real estate primarily in the remainder of the Northeast quadrant of the
United States. With respect to our non-performing loans, approximately 65.3% are in the New York
metropolitan area and 4.2%, 3.5%, 5.4%, 2.7%, 3.8%, 3.7% and 1.5% are located in the states of
Virginia, Illinois, Maryland, Massachusetts, Minnesota, Michigan and Pennsylvania, respectively.
The remaining 9.9% of our non-performing loans are secured by real estate primarily in the
remainder of the Northeast quadrant of the United States.
During 2008, the fallout from the sub-prime mortgage market continued and the national economy
entered a recession with particular emphasis on the deterioration of the housing and real estate
markets. The faltering economy was marked by contractions in the availability of business and
consumer credit, increases in corporate borrowing rates, falling home prices, increasing home
foreclosures and unemployment. As a result, the
Page 21
financial, capital and credit markets experienced significant adverse conditions. These conditions
caused significant deterioration in the activity of the secondary residential mortgage market and a
lack of available liquidity. The disruptions were exacerbated by the acceleration of the decline
of the real estate and housing market. We determined the provision for loan losses for 2008 based
on our evaluation of the foregoing factors, the growth of the loan portfolio, the recent increases
in non-performing loans and net loan charge-offs and expected growth in non-performing loans.
At December 31, 2008, first mortgage loans secured by one-to four-family properties accounted for
98.4% of total loans. Fixed-rate mortgage loans represent 75.7% of our first mortgage loans.
Compared to adjustable-rate loans, fixed-rate loans possess less inherent credit risk since loan
payments do not change in response to changes in interest rates. In addition, we do not originate
or purchase loans with payment options, negative amortization loans or sub-prime loans.
Non-performing loans amounted to $217.6 million at December 31, 2008 as compared to $79.4 million
at December 31, 2007. Non-performing loans at December 31, 2008 included $207.0 million of one- to
four-family first mortgage loans as compared to $75.8 million at December 31, 2007. The ratio of
non-performing loans to total loans was 0.74% at December 31, 2008 compared with 0.33% at December
31, 2007. The ALL as a percent of total loans and non-performing loans was 0.17% and 22.89%,
respectively at December 31, 2008 as compared to 0.14% and 43.75%, respectively at December 31,
2007. Loans delinquent 60 to 89 days amounted to $104.7 million at December 31, 2008 as compared
to $40.6 million at December 31, 2007. Foreclosed real estate amounted to $15.5 million at
December 31, 2008 as compared to $4.1 million at December 31, 2007. As a result of our
underwriting policies, our borrowers typically have a significant amount of equity, at the time of
origination, in the underlying real estate that we use as collateral for our loans. At December
31, 2008, our non-performing mortgage loans had an average loan-to-value ratio of approximately
68.3% based on the appraised value at the time of origination. Due to the steady deterioration of
real estate values, the loan-to-value ratios based on appraisals obtained at time of origination do
not necessarily indicate the extent to which we may incur a loss on any given loan that may go into
foreclosure. In January 2009, our non-performing loans increased by $37.0 million to $254.6
million.
Net charge-offs amounted to $4.4 million for 2008 as compared to net charge-offs of $684,000 for
2007. The increase in charge-offs was primarily related to non-performing residential loans for
which current appraised values indicated declines in the value of the underlying collateral. Our
charge-offs on non-performing loans have historically been low due to the amount of underlying
equity in the properties collateralizing our first mortgage loans. Typically, as a non-performing
loan approaches foreclosure, the borrower will sell the underlying property or, if there is a
subordinated lien eliminating the borrower’s equity, the subordinated lien holder would purchase
the property to protect its interest resulting in the full payment of principal and interest to
Hudson City Savings. In normal markets this process takes 6 to 12 months. However, due to the
unprecedented level of foreclosures and the desire by most states to slow the foreclosure process,
we are now experiencing a time frame to repayment or foreclosure ranging from 18 to 24 months from
the initial non-performing period. As real estate prices continue to decline, this extended time
may result in further charge-offs. In addition, current conditions in the housing market have made
it more difficult for borrowers to sell homes to satisfy the mortgage and second lien holders are
less likely to purchase the property and repay our loan if the value of the property is not enough
to satisfy their loan. We continue to monitor closely the property values underlying our
non-performing loans during this timeframe and take appropriate charge-offs when the loan balances
exceed the underlying property values.
At December 31, 2008 and 2007, commercial and construction loans evaluated for impairment in
accordance with FASB guidance amounted to $9.5 million and $3.5 million, respectively. Based on
this evaluation, we established an ALL of $818,000 for loans classified as impaired at December 31,
2008 compared to $268,000 at December 31, 2007.
Page 22
Non-Interest Income. Total non-interest income was $8.5 million for 2008 compared with $7.3
million for 2007. The increase in non-interest income is primarily due to an increase in service
charges on deposits as a result of deposit account growth.
Non-Interest Expense. Total non-interest expense increased $30.2 million, or 18.0%, for the
year ended December 31, 2008 to $198.1 million compared with $167.9 million during 2007. The
increase is primarily due to a $20.6 million increase in compensation and employee benefits
expense, a $2.6 million increase in Federal deposit insurance expense and a $5.9 million increase
in other non-interest expense. The increase in compensation and employee benefits expense included
an $8.4 million increase in expense related to our employee stock ownership plan primarily as a
result of increases in our stock price, a $6.3 million increase in compensation costs, due
primarily to normal increases in salary and additional full time employees for our new branches,
and a $2.3 million increase in stock option plan expense. The increase in the Federal deposit
insurance expense is the result of an assessment credit that was used to offset 100% of our 2007
deposit insurance assessment of $7.3 million. During 2008, we used the remaining assessment credit
of $5.1 million to offset a portion of our 2008 deposit insurance. Included in other non-interest
expense for the year ended December 31, 2008 were write-downs on foreclosed real estate and net
losses on the sale of foreclosed real estate, of $1.3 million as compared to $112,000 for 2007.
Our efficiency ratio was 20.84% for 2008 as compared to 25.66% for the year ended December 31,
2007. Our ratio of non-interest expense to average total assets for 2008 was 0.41% as compared to
0.42% for 2007.
Income Taxes. Income tax expense amounted to $287.3 million for 2008 compared with $185.9
million for 2007. Our effective tax rate for 2008 was 39.21% compared with 38.59% for 2007.
Asset Quality
One of our key operating objectives has been, and continues to be, to maintain a high level of
asset quality. Through a variety of strategies we have been proactive in addressing problem
loans and non-performing assets. The national economy has been in a recessionary cycle for
approximately two years. The faltering economy has been marked by contractions in the
availability of business and consumer credit, falling home prices, increasing home foreclosures
and rising unemployment levels. See “Critical Accounting Policies – Allowance for Loan Losses”
and “Comparison of Operating Results for the Years Ended December 31, 2009 and 2008 – Provision
for Loan Losses”.
Loans delinquent 60 days to 89 days and 90 days or more were as follows as of the dates
indicated:
| |
|
|
|
|
|
|
|
|
|
|
|
|
|
|
|
|
|
|
|
|
|
|
|
|
|
|
|
|
|
|
|
|
|
|
|
|
|
|
|
|
|
|
|
|
|
|
|
|
| |
|
At December 31, |
|
| |
|
2009 |
|
|
|
|
|
|
2008 |
|
|
|
|
|
|
2007 |
|
| |
|
60-89 Days |
|
|
90 Days or More |
|
|
60-89 Days |
|
|
90 Days or More |
|
|
60-89 Days |
|
|
90 Days or More |
|
| |
|
|
|
|
|
Principal |
|
|
|
|
|
|
Principal |
|
|
|
|
|
|
Principal |
|
|
|
|
|
|
Principal |
|
|
|
|
|
|
Principal |
|
|
|
|
|
|
Principal |
|
| |
|
No. of |
|
|
Balance |
|
|
No. of |
|
|
Balance |
|
|
No. of |
|
|
Balance |
|
|
No. of |
|
|
Balance |
|
|
No. of |
|
|
Balance |
|
|
No. of |
|
|
Balance |
|
| |
|
Loans |
|
|
of Loans |
|
|
Loans |
|
|
of Loans |
|
|
Loans |
|
|
of Loans |
|
|
Loans |
|
|
of Loans |
|
|
Loans |
|
|
of Loans |
|
|
Loans |
|
|
of Loans |
|
| |
| |
|
(Dollars in thousands) |
|
One- to four-family
first mortgages |
|
|
408 |
|
|
$ |
171,913 |
|
|
|
1,480 |
|
|
$ |
581,786 |
|
|
|
265 |
|
|
$ |
100,604 |
|
|
|
527 |
|
|
$ |
200,642 |
|
|
|
103 |
|
|
$ |
32,448 |
|
|
|
198 |
|
|
$ |
71,614 |
|
FHA/VA first mortgages |
|
|
35 |
|
|
|
8,650 |
|
|
|
115 |
|
|
|
31,855 |
|
|
|
5 |
|
|
|
874 |
|
|
|
30 |
|
|
|
6,407 |
|
|
|
12 |
|
|
|
1,995 |
|
|
|
21 |
|
|
|
4,157 |
|
Multi-family and
commercial mortgages |
|
|
2 |
|
|
|
1,088 |
|
|
|
1 |
|
|
|
1,414 |
|
|
|
1 |
|
|
|
1,417 |
|
|
|
4 |
|
|
|
1,854 |
|
|
|
3 |
|
|
|
1,393 |
|
|
|
2 |
|
|
|
2,028 |
|
Construction loans |
|
|
— |
|
|
|
— |
|
|
|
6 |
|
|
|
9,764 |
|
|
|
— |
|
|
|
— |
|
|
|
5 |
|
|
|
7,610 |
|
|
|
3 |
|
|
|
4,457 |
|
|
|
1 |
|
|
|
647 |
|
Consumer and other loans |
|
|
14 |
|
|
|
882 |
|
|
|
34 |
|
|
|
2,876 |
|
|
|
11 |
|
|
|
1,850 |
|
|
|
14 |
|
|
|
1,061 |
|
|
|
7 |
|
|
|
329 |
|
|
|
12 |
|
|
|
956 |
|
| |
Total delinquent loans
(60 days and over) |
|
|
459 |
|
|
$ |
182,533 |
|
|
|
1,636 |
|
|
$ |
627,695 |
|
|
|
282 |
|
|
$ |
104,745 |
|
|
|
580 |
|
|
$ |
217,574 |
|
|
|
128 |
|
|
$ |
40,622 |
|
|
|
234 |
|
|
$ |
79,402 |
|
|
|
|
|
|
|
|
|
|
|
|
|
|
|
|
|
|
|
|
|
|
|
|
|
|
|
|
|
|
|
|
|
|
|
|
|
|
Delinquent loans
(60 days and over)
to total loans |
|
|
|
|
|
|
0.57 |
% |
|
|
|
|
|
|
1.98 |
% |
|
|
|
|
|
|
0.36 |
% |
|
|
|
|
|
|
0.74 |
% |
|
|
|
|
|
|
0.17 |
% |
|
|
|
|
|
|
0.33 |
% |
| |
| |
|
The following table presents information regarding non-performing assets as of the dates
indicated. |
| |
|
|
|
|
|
|
|
|
|
|
|
|
|
|
|
|
|
|
|
|
| |
|
At December 31, |
|
| |
|
2009 |
|
|
2008 |
|
|
2007 |
|
|
2006 |
|
|
2005 |
|
| |
|
(Dollars in thousands) |
|
| |
Non-accrual first mortgage loans |
|
$ |
583,200 |
|
|
$ |
202,496 |
|
|
$ |
71,932 |
|
|
$ |
20,053 |
|
|
$ |
9,649 |
|
Non-accrual construction loans |
|
|
6,624 |
|
|
|
7,610 |
|
|
|
647 |
|
|
|
3,098 |
|
|
|
— |
|
Non-accrual consumer and other loans |
|
|
1,916 |
|
|
|
626 |
|
|
|
956 |
|
|
|
1,217 |
|
|
|
2 |
|
Accruing loans delinquent 90 days or more |
|
|
35,955 |
|
|
|
6,842 |
|
|
|
5,867 |
|
|
|
5,630 |
|
|
|
9,661 |
|
| |
Total non-performing loans |
|
|
627,695 |
|
|
|
217,574 |
|
|
|
79,402 |
|
|
|
29,998 |
|
|
|
19,312 |
|
Foreclosed real estate, net |
|
|
16,736 |
|
|
|
15,532 |
|
|
|
4,055 |
|
|
|
3,161 |
|
|
|
1,040 |
|
| |
Total non-performing assets |
|
$ |
644,431 |
|
|
$ |
233,106 |
|
|
$ |
83,457 |
|
|
$ |
33,159 |
|
|
$ |
20,352 |
|
|
|
|
|
|
|
|
|
|
|
|
|
|
|
|
|
Non-performing loans to total loans |
|
|
1.98 |
% |
|
|
0.74 |
% |
|
|
0.33 |
% |
|
|
0.16 |
% |
|
|
0.13 |
% |
Non-performing assets to total assets |
|
|
1.07 |
|
|
|
0.43 |
|
|
|
0.19 |
|
|
|
0.09 |
|
|
|
0.07 |
|
| |
Liquidity and Capital Resources
The term “liquidity” refers to our ability to generate adequate amounts of cash to fund loan
originations, loan and security purchases, deposit withdrawals, repayment of borrowings and
operating expenses. Our primary sources of funds are deposits, borrowings, the proceeds from
principal and interest payments on loans and mortgage-backed securities, the maturities and calls
of investment securities and funds provided by our operations. Deposit flows, calls of investment
securities and borrowed funds, and prepayments of loans and mortgage-backed securities are strongly
influenced by interest rates, general and local economic conditions and competition in the
marketplace. These factors reduce the predictability of the receipt of these sources of funds. Our
membership in the FHLB provides us access to additional sources of borrowed funds, which is
generally limited to approximately twenty times the amount of FHLB stock owned. We also have the
ability to access the capital markets from time to time, depending on market conditions.
Our primary investing activities are the origination and purchase of one-to four-family real estate
loans and consumer and other loans, the purchase of mortgage-backed securities, and the purchase of
investment securities. These activities are funded primarily by deposit growth, borrowings and
principal and interest payments on loans, mortgage-backed securities and investment securities. We
originated $6.06 billion and purchased $3.16 billion of loans during of 2009 as compared to $5.04
billion and $3.06 billion during 2008. While the residential real estate markets have slowed
during the past year, our competitive rates and an increase in mortgage refinancing have resulted
in increased origination production for 2009. The increase in refinancing activity occurring in
the marketplace has also caused an increase in principal repayments which amounted to $6.77 billion
for 2009 as compared to $2.82 billion for 2008. At December 31, 2009, commitments to originate and
purchase mortgage loans amounted to $538.0 million and $157.5 million, respectively as compared to
$337.6 million and $219.1 million, respectively at December 31, 2008. Conditions in the secondary
mortgage market have made it more difficult for us to purchase loans that meet our underwriting
standards. We expect that the amount of loan purchases may be at reduced levels for the near-term.
Page 23
Purchases of mortgage-backed securities during 2009 were $7.11 billion as compared to $7.18 billion
during 2008. The slight decrease in the purchases of mortgage-backed securities was due to our
ability to utilize deposit growth for the increased mortgage loan production during 2009. In
addition, we increased our purchases of investment securities since the yields on these securities
were more attractive than the yields currently being earned on mortgage-backed securities. We sold
$761.6 million of mortgage-backed securities during 2009, resulting in a gain of $24.0 million. We
used the proceeds from the sales to fund the purchase of first mortgage loans. There were no
securities sales in 2008.
We purchased $5.87 billion of investment securities during 2009 as compared to $2.10 billion during
2008. Proceeds from the calls of investment securities amounted to $4.02 billion during 2009 as
compared to $2.81 billion for 2008.
During 2009, principal repayments on loans totaled $6.77 billion as compared to $2.82 billion for
2008. Principal payments on mortgage-backed securities amounted to $4.73 billion and $2.31 billion
for those same respective periods. These increases in principal repayments were due primarily to
the refinancing activity caused by market interest rates that are at near-historic lows.
As part of the membership requirements of the FHLB, we are required to hold a certain dollar amount
of FHLB common stock based on our mortgage-related assets and borrowings from the FHLB. During
2009, we purchased a net $9.2 million of FHLB common stock compared with net purchases of $170.2
million during 2008.
Our primary financing activities consist of gathering deposits, engaging in wholesale borrowings,
repurchases of our common stock and the payment of dividends.
Total deposits increased $6.12 billion during 2009 as compared to an increase of $3.31 billion for
2008. These increases reflect our growth strategy, competitive pricing and the apparent recent
increases in the U.S. household savings rate during the recent recessionary economy. Deposit flows
are typically affected by the level of market interest rates, the interest rates and products
offered by competitors, the volatility of equity markets, and other factors. Time deposits
scheduled to mature within one year were $13.08 billion at December 31, 2009. These time deposits
have a weighted average rate of 1.87%. We anticipate that we will have sufficient resources to
meet this current funding commitment. Based on our deposit retention experience and current pricing
strategy, we anticipate that a significant portion of these time deposits will remain with us as
renewed time deposits or as transfers to other deposit products at the prevailing interest rate.
We have historically used wholesale borrowings to fund our investing and financing activities.
However, during 2009, we were able to fund substantially all of our growth with deposit inflows.
Principal repayments of borrowed funds totaled $1.00 billion, largely offset by $750.0 million in
new borrowings. At December 31, 2009, we had $22.25 billion of borrowed funds with a
weighted-average rate of 4.14% and with call dates within one year. We anticipate that none of
these borrowings will be called assuming current market interest rates remain stable. We believe,
given current market conditions, that the likelihood that a significant portion of these borrowings
would be called will not increase substantially unless interest rates were to increase by at least
300 basis points. However, in the event borrowings are called, we anticipate that we will have
sufficient resources to meet this funding commitment by borrowing new funds at the prevailing
market interest rate, using funds generated by deposit growth or by using proceeds from securities
sales. In addition, at December 31, 2009 we had $300.0 million of borrowings with a weighted
average rate of 5.68% that are scheduled to mature within one year.
Our borrowings have traditionally consisted of structured callable borrowings with ten year final
maturities and initial non-call periods of one to five years. We have used this type of borrowing
primarily to fund our loan growth because they have a longer duration than shorter-term
non-callable borrowings and have a slightly lower cost than a no-callable borrowing with a maturity
date similar to the initial call date of the callable borrowing.
Page 24
During 2009, we were able to fund our asset growth primarily with deposit inflows. In order to
effectively manage our interest rate risk and liquidity risk resulting from our current callable
borrowing position, we are pursuing a variety of strategies to reduce callable borrowings while
continuing to pursue our growth plans. We intend to continue focusing on funding our growth
primarily with customer deposits, using borrowed funds as a supplemental funding source if deposit
growth decreases which will allow us to achieve a greater balance between deposits and borrowings.
If necessary to fund our growth and provide for liquidity, we may borrow a combination of short-
term borrowings with maturities of three to six months and longer-term fixed-maturity borrowings
with terms of two to five years. We also intend to modify certain borrowings to extend their call
dates, which we began to do during 2009. During 2009, we modified approximately $1.73 billion of
callable borrowings to extend the call dates of the borrowings by between three and four years as part
of this strategy. In addition, we are considering prepayment of certain borrowings; however, at this
time, we have no immediate plans to make any such prepayments, and we anticipate that any
prepayment of borrowings will be limited.
Our new borrowings in 2009 consisted of non-callable borrowings of $400.0 million with maturities of one to three months and $350.0 million
of non-callable borrowings with maturities of two to three years.
Total cash and cash equivalents increased $299.4 million to $561.2 million at December 31, 2009 as
compared to $261.8 million at December 31, 2008. This increase is due to liquidity being provided
by the strong deposit growth and increased repayments on mortgage-related assets. In addition, we
have maintained a higher level of Federal funds sold since other types of short- and medium-term
investments are currently providing relatively low yields.
Cash dividends paid during 2009 were $288.4 million. During 2009, we purchased 4.0 million shares
of our common stock at an aggregate cost of $43.5 million. At December 31, 2009, there remained
50,123,550 shares that may be purchased under existing stock repurchase programs.
The primary source of liquidity for Hudson City Bancorp, the holding company of Hudson City
Savings, is capital distributions from Hudson City Savings. During 2009, Hudson City Bancorp
received $338.5 million in dividend payments from Hudson City Savings. The primary use of these
funds is the payment of dividends to our shareholders and, when appropriate as part of our capital
management strategy, the repurchase of our outstanding common stock. Hudson City Bancorp’s ability
to continue these activities is dependent upon capital distributions from Hudson City Savings.
Applicable federal law may limit the amount of capital distributions Hudson City Savings may make.
At December 31, 2009, Hudson City Bancorp had total cash and due from banks of $224.6 million.
At December 31, 2009, Hudson City Savings exceeded all regulatory capital requirements. Hudson City
Savings’ tangible capital ratio, leverage (core) capital ratio and total risk-based capital ratio
were 7.59%, 7.59% and 21.02%, respectively.
Off-Balance Sheet Arrangements and Contractual Obligations
Hudson City Bancorp is a party to certain off-balance sheet arrangements, which occur in the normal
course of our business, to meet the credit needs of our customers and the growth initiatives of the
Bank. These arrangements are primarily commitments to originate and purchase mortgage loans, and
to purchase mortgage-backed securities. We are also obligated under a number of non-cancelable
operating leases.
The following table summarizes contractual obligations of Hudson City by contractual payment
period, as of December 31, 2009.
| |
|
|
|
|
|
|
|
|
|
|
|
|
|
|
|
|
|
|
|
|
| |
|
Payments Due By Period |
|
| |
|
|
|
|
|
Less Than |
|
|
One Year to |
|
|
Three Years to |
|
|
More Than |
|
| Contractual Obligation |
|
Total |
|
|
One Year |
|
|
Three Years |
|
|
Five Years |
|
|
Five Years |
|
| |
|
(In thousands) |
|
|
|
|
|
|
|
|
|
|
|
|
|
|
|
|
|
|
|
|
|
|
Mortgage loan originations |
|
$ |
537,997 |
|
|
$ |
537,997 |
|
|
$ |
— |
|
|
$ |
— |
|
|
$ |
— |
|
Mortgage loan purchases |
|
|
157,476 |
|
|
|
157,476 |
|
|
|
— |
|
|
|
— |
|
|
|
— |
|
Mortgage-backed security purchases |
|
|
1,251,000 |
|
|
|
1,251,000 |
|
|
|
— |
|
|
|
— |
|
|
|
— |
|
Operating leases |
|
|
151,453 |
|
|
|
8,974 |
|
|
|
18,302 |
|
|
|
17,695 |
|
|
|
106,482 |
|
| |
|
|
|
|
|
|
|
|
|
|
|
|
|
|
|
|
|
|
|
|
|
Total |
|
$ |
2,097,926 |
|
|
$ |
1,955,447 |
|
|
$ |
18,302 |
|
|
$ |
17,695 |
|
|
$ |
106,482 |
|
|
|
|
|
|
|
|
|
|
|
|
|
|
|
|
|
Page 25
Commitments to extend credit are agreements to lend money to a customer as long as there is
no violation of any condition established in the contract. Commitments to fund first mortgage
loans generally have fixed expiration dates of approximately 90 days and other termination clauses.
Since some commitments are expected to expire without being drawn upon, the total commitment
amounts do not necessarily represent future cash requirements. Hudson City Savings evaluates each
customer’s credit-worthiness on a case-by-case basis. Additionally, we have available home equity,
overdraft and commercial/construction lines of credit, which do not have fixed expiration dates, of
approximately $179.7 million, $2.9 million, and $12.8 million. We are not obligated to advance
further amounts on credit lines if the customer is delinquent, or otherwise in violation of the
agreement. The commitments to purchase first mortgage loans and mortgage-backed securities had a
normal period from trade date to settlement date of approximately 60 days.
Recent Accounting Pronouncements
In January 2010, the FASB issued an accounting standards update regarding disclosure requirements
for fair value measurement. This update provides amendments to fair value measurement that require
new disclosures related to transfers in and out of Levels 1 and 2 and activity in Level 3 fair
value measurements. The update also provides amendments clarifying level of disaggregation and
disclosures about inputs and valuation techniques along with conforming amendments to the guidance
on employers’ disclosures about postretirement benefit plan assets. This update is effective for
interim and annual reporting periods beginning after December 15, 2009, except for the disclosures
about purchases, sales, issuances, and settlements in the rollforward of activity in Level 3 fair
value measurements which are effective for fiscal years beginning after December 15, 2010. We do
not expect that this accounting standard update will have a material impact on our financial
condition, results of operations or financial statement disclosures.
In June 2009, the FASB Codification (the “Codification”) was issued. The Codification is the source
of authoritative U.S. generally accepted accounting principles (“GAAP”) recognized by the FASB to
be applied by non-governmental entities. Rules and interpretive releases of the Securities and
Exchange Commission (“SEC”) under authority of federal securities laws are also sources of
authoritative GAAP for SEC registrants. The Codification supersedes all existing non-SEC accounting
and reporting standards. All other non-grandfathered non-SEC accounting literature not included in
the Codification became non-authoritative. The Codification was effective for financial
statements issued for interim and annual periods ending after September 15, 2009. The
implementation of the Codification did not have an impact on our consolidated financial condition
and results of operations.
In June 2009, the FASB issued an accounting standards update to the accounting and disclosure
requirements for the consolidation of variable interest entities. The guidance affects the overall
consolidation analysis and requires enhanced disclosure on involvement with variable interest
entities. The guidance is effective for fiscal years beginning after November 15, 2009. We do not
expect that the guidance will have a material impact on our financial condition, results of
operations or financial statement disclosures.
In June 2009, the FASB issued an accounting standards update to the accounting and disclosure
requirements for transfers of financial assets. The guidance defines the term “participating
interest” to establish specific conditions for reporting a transfer of a portion of a financial
asset as a sale. If the transfer does not meet those conditions, a transferor should account for
the transfer as a sale only if it transfers an entire financial asset or a group of entire
financial assets and surrenders control over the entire transferred asset(s). The guidance requires
that a transferor recognize and initially measure at fair value all assets obtained (including a
transferor’s beneficial interest) and liabilities incurred as a result of a transfer of financial
assets accounted for as a sale. The guidance is effective as of the beginning of each reporting
entity’s first annual reporting period that begins after November 15, 2009, for interim periods
within that first annual reporting period, and for interim and annual reporting periods thereafter.
We do not expect that the guidance will have a material impact on our financial condition, results
of operations or financial statement disclosures.
Page 26
Impact of Inflation and Changing Prices
The Consolidated Financial Statements and accompanying Notes to Consolidated Financial Statements
of Hudson City Bancorp have been prepared in accordance with U.S. generally accepted accounting
principles, commonly referred as GAAP. GAAP generally requires the measurement of financial
position and operating results in terms of historical dollars without consideration for changes in
the relative purchasing power of money over time due to inflation. The impact of inflation is
reflected in the increased cost of our operations. Unlike industrial companies, our assets and
liabilities are primarily monetary in nature. As a result, changes in market interest rates have a
greater impact on performance than do the effects of inflation.
Critical Accounting Policies
We have identified the accounting policies below as critical to understanding our financial
results. In addition, Note 2 to the Audited Consolidated Financial Statements contains a summary of
our significant accounting policies. We believe our policies with respect to the methodology for
our determination of the ALL, the measurement of stock-based compensation expense and the
measurement of the funded status and cost of our pension and other post-retirement benefit plans
involve a higher degree of complexity and require management to make difficult and subjective
judgments which often require assumptions or estimates about highly uncertain matters. Changes in
these judgments, assumptions or estimates could cause reported results to differ materially. These
critical policies and their application are continually reviewed by management, and are
periodically reviewed with the Audit Committee and our Board of Directors.
Allowance for Loan Losses
The ALL has been determined in accordance with GAAP, under which we are required to maintain an
adequate ALL at December 31, 2009. We are responsible for the timely and periodic determination of
the amount of the allowance required. We believe that our ALL is adequate to cover specifically
identifiable loan losses, as well as estimated losses inherent in our portfolio for which certain
losses are probable but not specifically identifiable.
Our primary lending emphasis is the origination and purchase of one- to four-family first mortgage
loans on residential properties and, to a lesser extent, second mortgage loans on one- to
four-family residential properties resulting in a loan concentration in residential first mortgage
loans at December 31, 2009. As a result of our lending practices, we also have a concentration of
loans secured by real property located primarily in New Jersey, New York and Connecticut. At
December 31, 2009, approximately 73.8% of our total loans were in the New York metropolitan area.
Additionally, the states of Virginia, Illinois, Maryland, Massachusetts, Minnesota, Michigan and
Pennsylvania accounted for 4.6%, 3.9%, 3.5%, 2.7%, 1.4%, 1.3% and 2.0%, respectively, of total
loans. The remaining 6.8% of the loan portfolio is secured by real estate primarily in the
remainder of the Northeast quadrant of the United States. Based on the composition of our loan
portfolio and the growth in our loan portfolio, we believe the primary risks inherent in our
portfolio are the continued weakened economic conditions due to the recent U.S. recession,
continued high levels of unemployment, rising interest rates in the markets we lend and a
continuing decline in real estate market values. Any one or a combination of these adverse trends
may adversely affect our loan portfolio resulting in increased delinquencies, non-performing
assets, loan losses and future levels of loan loss provisions. We consider these trends in market
conditions in determining the ALL.
Due to the nature of our loan portfolio, our evaluation of the adequacy of our ALL is performed
primarily on a “pooled” basis. Each month we prepare an analysis which categorizes the entire
loan portfolio by certain risk characteristics such as loan type (one- to four-family,
multi-family, commercial, construction, etc.), loan source (originated or purchased) and payment
status (i.e., current or number of days delinquent). Loans with known potential losses are
categorized separately. We assign potential loss factors to the payment status categories on the
basis of our assessment of the potential risk inherent in each loan type. These factors are
periodically reviewed for appropriateness giving consideration to charge-off history, delinquency
trends,
Page 27
portfolio growth and the status of the regional economy and housing market, in order to ascertain
that the loss factors cover probable and estimable losses inherent in the portfolio. Based on our
recent loss experience on non-performing loans, we increased the loss factors used in our
quantitative analysis of the ALL for our one- to four-family first mortgage loans during 2009.
We use this analysis, as a tool, together with principal balances and delinquency reports, to
evaluate the adequacy of the ALL. Other key factors we consider in this process are current real
estate market conditions in geographic areas where our loans are located, changes in the trend of
non-performing loans, the results of our foreclosed property transactions, the current state of
the local and national economy, changes in interest rates and loan portfolio growth. Any one or
a combination of these adverse trends may adversely affect our loan portfolio resulting in
increased delinquencies, loan losses and future levels of provisions.
We maintain the ALL through provisions for loan losses that we charge to income. We charge losses
on loans against the ALL when we believe the collection of loan principal is unlikely. We
establish the provision for loan losses after considering the results of our review as described
above. We apply this process and methodology in a consistent manner and we reassess and modify the
estimation methods and assumptions used in response to changing conditions. Such changes, if any,
are approved by our AQC each quarter.
Hudson City Savings defines the population of potential impaired loans to be all non-accrual
construction, commercial real estate and multi-family loans. Impaired loans are individually
assessed to determine that the loan’s carrying value is not in excess of the fair value of the
collateral or the present value of the loan’s expected future cash flows. Smaller balance
homogeneous loans that are collectively evaluated for impairment, such as residential mortgage
loans and consumer loans, are specifically excluded from the impaired loan analysis.
We believe that we have established and maintained the ALL at adequate levels. Additions may be
necessary if future economic and other conditions differ substantially from the current operating
environment. Although management uses the best information available, the level of the ALL remains
an estimate that is subject to significant judgment and short-term change.
Stock-Based Compensation
We recognize the cost of employee services received in exchange for awards of equity instruments
based on the grant-date fair value for all awards granted, modified, repurchased or cancelled after
January 1, 2006 and for the portion of outstanding awards for which the requisite service was not
rendered as of January 1, 2006, in accordance with ASC 718-10. We have made annual grants of
performance-based stock options since 2006 that vest if certain financial performance measures are
met. In accordance with ASC 718-10-30-6, we assess the probability of achieving these financial
performance measures and recognize the cost of these performance-based grants if it is probable
that the financial performance measures will be met. This probability assessment is subjective in
nature and may change over the assessment period for the performance measures.
We estimate the per share fair value of option grants on the date of grant using the Black-Scholes
option pricing model using assumptions for the expected dividend yield, expected stock price
volatility, risk-free interest rate and expected option term. These assumptions are based on our
analysis of our historical option exercise experience and our judgments regarding future option
exercise experience and market conditions. These assumptions are subjective in nature, involve
uncertainties and, therefore, cannot be determined with precision. The Black-Scholes option pricing
model also contains certain inherent limitations when applied to options that are not traded on
public markets.
The per share fair value of options is highly sensitive to changes in assumptions. In general, the
per share fair value of options will move in the same direction as changes in the expected stock
price volatility, risk-free interest rate and expected option term, and in the opposite direction
of changes in the expected dividend yield. For example, the per share fair value of options will
generally increase as expected stock price volatility increases, risk-free interest rate increases,
expected option term increases and expected dividend yield
Page 28
decreases. The use of different assumptions or different option pricing models could result in
materially different per share fair values of options.
Pension and Other Post-retirement Benefit Assumptions
Non-contributory retirement and post-retirement defined benefit plans are maintained for certain
employees, including retired employees hired on or before July 31, 2005 who have met other
eligibility requirements of the plans. We adopted ASC 715, Retirement Benefits. This ASC requires
an employer to: (a) recognize in its statement of financial condition an asset for a plan’s
overfunded status or a liability for a plan’s underfunded status; (b) measure a plan’s assets and
its obligations that determine its funded status as of the end of the employer’s fiscal year; and
(c) recognize, in comprehensive income, changes in the funded status of a defined benefit
post-retirement plan in the year in which the changes occur.
We provide our actuary with certain rate assumptions used in measuring our benefit obligation. We
monitor these rates in relation to the current market interest rate environment and update our
actuarial analysis accordingly. The most significant of these is the discount rate used to
calculate the period-end present value of the benefit obligations, and the expense to be included
in the following year’s financial statements. A lower discount rate will result in a higher benefit
obligation and expense, while a higher discount rate will result in a lower benefit obligation and
expense. The discount rate assumption was determined based on a cash flow/yield curve model
specific to our pension and post-retirement plans. We compare this rate to certain market indices,
such as long-term treasury bonds, or the Moody’s bond indices, for reasonableness. A discount rate
of 6.00% was selected for the December 31, 2009 measurement date and the 2010 expense calculation.
For our pension plan, we also assumed an annual rate of salary increase of 4.00% for future
periods. This rate is corresponding to actual salary increases experienced over prior years. We
assumed a return on plan assets of 8.25% for future periods. We actuarially determine the return on
plan assets based on actual plan experience over the previous ten years. The actual return on plan
assets was 12.9% for 2009 and a net loss of 28.2% in 2008. Our net loss on plan assets during 2008
was a result of the economic recession and conditions in the equity and credit markets during that
year. There can be no assurances with respect to actual return on plan assets in the future. We
continually review and evaluate all actuarial assumptions affecting the pension plan, including
assumed return on assets.
For our post-retirement benefit plan, the assumed health care cost trend rate used to measure the
expected cost of other benefits for 2009 was 8.50%. The rate was assumed to decrease gradually to
4.75% for 2016 and remain at that level thereafter. Changes to the assumed health care cost trend
rate are expected to have an immaterial impact as we capped our obligations to contribute to the
premium cost of coverage to the post-retirement health benefit plan at the 2007 premium level.
Securities Impairment
Our available-for-sale securities portfolio is carried at estimated fair value with any unrealized
gains and losses, net of taxes, reported as accumulated other comprehensive income/loss in
shareholders’ equity. Debt securities which we have the positive intent and ability to hold to
maturity are classified as held-to-maturity and are carried at amortized cost. The fair values for
our securities are obtained from an independent nationally recognized pricing service.
Substantially all of our securities portfolio is comprised of mortgage-backed securities and debt
securities issued by a GSE. The fair value of these securities is primarily impacted by changes in
interest rates. We generally view changes in fair value caused by changes in interest rates as
temporary, which is consistent with our experience.
Page 29
In April 2009, the FASB issued guidance which changes the method for determining whether an
other-than-temporary impairment exists for debt securities and the amount of the impairment to be
recognized in earnings. This staff position requires that an entity assess whether an impairment
of a debt security is other-than-temporary and, as part of that assessment, determine its intent
and ability to hold the security. If the entity intends to sell the debt security, an
other-than-temporary impairment shall be considered to have occurred. In addition, an
other-than-temporary impairment shall be considered to have occurred if it is more likely than not
that it will be required to sell the security before recovery of its amortized cost.
We conduct a periodic review and evaluation of the securities portfolio to determine if a decline
in the fair value of any security below its cost basis is other-than-temporary. Our evaluation of
other-than-temporary impairment considers the duration and severity of the impairment, our intent
and ability to hold the securities and our assessments of the reason for the decline in value and
the likelihood of a near-term recovery. The unrealized losses on securities in our portfolio were
due primarily to changes in market interest rates subsequent to purchase. In addition, we only
purchase securities issued by GSEs. As a result, the unrealized losses on our securities were not
considered to be other-than-temporary and, accordingly, no impairment loss was recognized during
2009.
Management of Market Risk
General
As a financial institution, our primary component of market risk is interest rate volatility. Our
net income is primarily based on net interest income, and fluctuations in interest rates will
ultimately impact the level of both income and expense recorded on a large portion of our assets
and liabilities. Fluctuations in interest rates will also affect the market value of our
interest-earning assets and interest-bearing liabilities, other than those that possess a short
term to maturity. Due to the nature of our operations, we are not subject to foreign currency
exchange or commodity price risk. We do not own any trading assets. We did not engage in any
hedging transactions that use derivative instruments (such as interest rate swaps and caps) during
2009 and did not have any such hedging transactions in place at December 31, 2009. Our mortgage
loan and mortgage-backed security portfolios, which comprise 87.1% of our balance sheet, are
subject to risks associated with the economy in the New York metropolitan area, the general economy
of the United States and the recent pressure on housing prices. We continually analyze our asset
quality and believe our allowance for loan losses is adequate to
cover known or potential losses.
The difference between rates on the yield curve, or the shape of the yield curve, impacts our net
interest income. The Federal Open Market Committee of the Board of Governors of the Federal Reserve
System (the “FOMC”) noted that economic activity has continued to improve during the fourth quarter
of 2009. The FOMC also noted that the housing sector has shown signs of improvement. However, the
national unemployment rate continued to rise to 10.0% in December 2009 as compared to 9.8% in
September 2009 and 7.4% in December 2008. The S&P/Case-Shiller Home Price Index for the New York
metropolitan area, where most of our lending activity occurs, declined by approximately 7.1% in
2009 and by 9.2% in 2008. The S&P/Case-Shiller U.S. National Home Price Index decreased by 5.3% in
2009 and by 18.2% in 2008. Lower household wealth and tight credit conditions in addition to the
increase in the national unemployment rate has resulted in the FOMC maintaining the overnight
lending rate at zero to 0.25% during the fourth quarter of 2009, with plans to maintain this level
for an “extended period.”
As a result, short-term market interest rates have remained at low levels during the fourth quarter
of 2009. This allowed us to continue to re-price our short-term deposits thereby reducing our cost
of funds. While longer-term market interest rates increased during the fourth quarter of 2009, thus
steepening the slope of the market yield curve, rates on mortgage-related assets declined slightly,
although to a lesser extent than the decline in our cost of funds. Due to our investment and
financing decisions, the more positive the slope of the yield curve the more favorable the
environment is for our ability to generate net interest income. Our interest-bearing liabilities
Page 30
generally reflect movements in short- and intermediate-term rates, while our interest-earning assets, a majority of which have initial terms to
maturity or repricing greater than one year, generally reflect movements in intermediate- and long-term interest rates. A positive slope of the yield
curve allows us to invest in interest-earning assets at a wider spread to the cost of interest-bearing liabilities. Due to these changes in market rates,
our net interest rate spread and net interest margin increased for the fourth quarter and full year of 2009 from the three and twelve-month periods
ended December 31, 2008.
The impact of interest rate changes on our interest income is generally felt in later periods than the impact on our interest expense due to differences
in the timing of the recognition of items on our balance sheet. The timing of the recognition of interest-earning assets on our balance sheet generally
lags the current market rates by 60 to 90 days due to the normal time period between commitment and settlement dates. In contrast, the recognition of
interest-bearing liabilities on our balance sheet generally reflects current market interest rates as we generally fund purchases at the time of settlement.
During a period of decreasing short-term interest rates, as was experienced during these past 12 months, this timing difference had a positive impact on
our net interest income as our interest-bearing liabilities reset to the current lower interest rates. If short-term interest rates were to increase, the cost of
our interest-bearing liabilities would also increase and have an adverse impact on our net interest income.
Also impacting our net interest income and net interest rate spread is the level of prepayment activity on our interest-sensitive assets. The actual amount
of time before mortgage loans and mortgage-backed securities are repaid can be significantly impacted by changes in market interest rates and mortgage
prepayment rates. Mortgage prepayment rates will vary due to a number of factors, including the regional economy in the area where the underlying mortgages
were originated, availability of credit, seasonal factors and demographic variables. However, the major factors affecting prepayment rates are prevailing interest
rates, related mortgage refinancing opportunities and competition. Generally, the level of prepayment activity directly affects the yield earned on those assets, as
the payments received on the interest-earning assets will be reinvested at the prevailing lower market interest rate. Prepayment rates are generally inversely
related to the prevailing market interest rate, thus, as market interest rates increase, prepayment rates tend to decrease. Prepayment rates on our mortgage-related
assets have increased during 2009, due to the current low market interest rate environment. We believe the higher level of prepayment activity may continue as market
interest rates are expected to remain at the current low levels through at least the first half of 2010.
Calls of investment securities and borrowed funds are also impacted by the level of market interest rates. The level of calls of investment securities
are generally inversely related to the prevailing market interest rate, meaning as rates decrease the likelihood of a security being called would increase.
The level of call activity generally affects the yield earned on these assets, as the payment received on the security would be reinvested at the prevailing
lower market interest rate. During 2009 we saw an increase in call activity on our investment securities as market interest rates remained at these historic
lows. We anticipate continued calls of investment securities due to the anticipated continuation of the low current market interest rate environment. However,
the level of calls may not be as great as in 2009 as we experienced significant turnover of the portfolio in 2009 and the interest rates for the new securities are
already close to current market.
Our borrowings have traditionally consisted of structured callable borrowings with ten year final maturities and initial non-call
periods of one to five years. We have used this type of borrowing primarily to fund our loan growth because they have a longer
duration than shorter-term non-callable borrowings and have a slightly lower cost than a non-callable borrowing with a maturity date similar
to the initial call date of the callable borrowing. Our new borrowings in 2009 consisted of non-callable borrowings of
Page 31
$400.0 million with maturities of one to three months and $350.0 million of non-callable
borrowings with maturities of two to three years.
During 2009, we were able to fund our asset growth primarily with deposit inflows. In order to
effectively manage our interest rate risk and liquidity risk resulting from our current callable
borrowing position, we are pursuing a variety of strategies to reduce callable borrowings while
continuing to pursue our growth plans. We intend to continue focusing on funding our growth
primarily with customer deposits, using borrowed funds as a supplemental funding source if deposit
growth decreases which will allow us to achieve a greater balance between deposits and borrowings.
If necessary to fund our growth and provide for liquidity, we may borrow a combination of short-
term borrowings with maturities of three to six months and longer-term fixed-maturity borrowings
with terms of two to five years. We also intend to modify certain borrowings to extend their call
dates, which we began to do during 2009. During 2009, we modified approximately $1.73 billion of
callable borrowings to extend the call dates of the borrowings by between three and four years as part
of this strategy. In addition, we are considering prepayment of certain borrowings; however, at this
time, we have no immediate plans to make any such prepayments, and we anticipate that any
prepayment of borrowings will be limited.
The likelihood of a borrowing being called is directly related to the current market interest
rates, meaning the higher that interest rates move, the more likely the borrowing would be called.
The level of call activity generally affects the cost of our borrowed funds, as the call of a
borrowing would generally necessitate the re-borrowing of the funds at the higher current market
interest rate. During 2009 we experienced no call activity on our borrowed funds due to the
continued low levels of market interest rates. At December 31, 2009, we had $22.25 billion of
borrowed funds, with a weighted-average rate of 4.14%, with call dates within one year. We
anticipate that none of these borrowings will be called assuming current market interest rates
remain stable or increase modestly. We believe, given current market conditions, that the
likelihood that a significant portion of these borrowings would be called will not increase
substantially unless interest rates were to increase by at least 300 basis points. However, in the
event borrowings are called, we anticipate that we will have sufficient resources to meet this
funding commitment by borrowing new funds at the prevailing market interest rate, using funds
generated by deposit growth or by using proceeds from securities sales.
Management of Interest Rate Risk
The primary objectives of our interest rate risk management strategy are to:
| |
• |
|
evaluate the interest rate risk inherent in our balance sheet accounts; |
| |
| |
• |
|
determine the appropriate level of interest rate risk given our business plan, the
current business environment and our capital and liquidity requirements; and |
| |
| |
• |
|
manage interest rate risk in a manner consistent with the approved guidelines and
policies set by our Board of Directors. |
We seek to manage our asset/liability mix to help minimize the impact that interest rate
fluctuations may have on our earnings. To achieve the objectives of managing interest rate risk,
our Asset/Liability Committee meets weekly to discuss and monitor the market interest rate
environment compared to interest rates that are offered on our products. This committee consists of
the Chief Executive Officer, the Chief Operating Officer, the Chief Financial Officer and other
senior officers of the institution as required. The Asset/Liability Committee presents periodic
reports to the Board of Directors at its regular meetings and, on a quarterly basis, presents a
comprehensive report addressing the results of activities and strategies and the effect that
changes in interest rates will have on our results of operations and the present value of our
equity.
Historically, our lending activities have emphasized one- to four-family fixed-rate first and
second mortgage loans, while purchasing variable-rate or hybrid mortgage-backed securities to
offset our predominantly fixed-rate loan portfolio. The current prevailing interest rate
environment and the desires of our customers have resulted in a demand for long-term hybrid and
fixed-rate mortgage loans. In the past several years, we have attempted to originate and purchase a
larger percentage of variable-rate mortgage-related assets in order to better manage our interest
rate risk. Variable-rate mortgage-related assets include those loans or securities with a
contractual annual rate adjustment after an initial fixed-rate period of one to ten years. These
variable-rate instruments are more rate-sensitive, given the potential interest rate adjustment,
than the long-term fixed-rate loans that we have traditionally held in our portfolio. This growth
in variable-rate mortgage-related assets has helped reduce our exposure to interest rate
fluctuations and is expected to benefit our long-term profitability, as the rate earned on the
mortgage loan will increase as prevailing market rates increase. However, this strategy to
originate a higher percentage of variable-rate instruments may have an initial adverse impact on
our net interest
Page 32
income and net interest margin in the short-term, as variable-rate interest-earning assets
generally have initial interest rates lower than alternative fixed-rate investments.
Variable-rate products constituted 47.4% of loan originations, 60.6% of loan purchases and 36.5% of
mortgage-backed security purchases made during 2009. In aggregate, 45.0% of our mortgage-related
asset originations and purchases had variable rates. Of the growth in our total mortgage-related
assets, 30.5% was due to growth in our variable-rate products. In 2010, we intend to originate and
purchase similar percentages to 2009 of variable-rate mortgage loans, but increase the percent of
variable-rate mortgage-backed security purchases as we believe more variable-rate product will be
available. Our percentage of fixed-rate interest-earning assets to total interest-earning assets
was 49.6% at December 31, 2009, slightly increased from 48.2% at December 31, 2008. Our fixed-rate
interest earning assets may have an adverse impact on our earnings in a rising rate environment as
the interest rate on these interest-earning assets would not reprice to current market interest
rates as fast as the interest rates on our interest-bearing deposits and callable borrowed funds.
Our primary sources of funds have traditionally been deposits, consisting primarily of time
deposits and interest-bearing demand accounts, and borrowings. Our deposits have substantially
shorter terms to maturity than our mortgage loan portfolio and borrowed funds. The borrowings have
been generally long-term to maturity, in an effort to offset our short-term deposit liabilities and
assist in managing our interest rate risk. These long-term borrowings have call options that could
shorten their maturities in a changing interest rate environment. If we experience a significant
rising interest rate environment where interest rates increase above the interest rate for the
borrowings, these borrowings will likely be called at their next call date and our cost to replace
these borrowings would likely increase. Of our borrowings outstanding at December 31, 2009, $29.33
billion were structured callable borrowings. Of these, $22.25 billion with a weighted-average rate
of 4.14% have the contractual right to be called within the next twelve months. Given the current
market rate environment, we believe none of these borrowings will be called during the next twelve
months. As of December 31, 2009, we had $300.0 million of borrowings with terms to maturity of less
than one year.
Cash Flow Determination. In preparing the following analyses, we were required to estimate the
future cash flows of our interest-earning assets and interest-bearing liabilities. These items are
generally reported at their maturity date, subject to assumptions regarding prepayment rates,
non-maturity deposit decay rates, and the call of certain of our investment securities and borrowed
funds. These assumptions can have a significant impact on the simulation model. While we believe
our assumptions are reasonable, there can be no assurance that assumed prepayment rates, assumed
calls of securities and borrowed funds, and deposit decay rates will approximate actual future cash
flows. Increases in market interest rates may tend to reduce prepayment speeds on our
mortgage-related assets, as fewer borrowers refinance their loans, and reduce the anticipated calls
of our investment securities. At the same time, deposit decay rates and calls of our borrowed funds
may tend to increase. If these trends occur, we could experience larger negative percent changes
in our model results in the varying rate shock scenarios.
The information presented in the following tables is based on the following assumptions:
| |
• |
|
we assumed an annual prepayment rate for our first mortgage loans using market
prepayment speeds appropriate for the loan type; |
| |
| |
• |
|
we assumed an annual prepayment rate for our mortgage-backed securities using the
prepayment rate associated with the security type; |
| |
| |
• |
|
for savings accounts that had no stated maturity, we used decay rates (the assumed rate
at which the balance of existing accounts would decline) of: 7.5% in less than six months,
7.5% in six months to one year, 10.0% in one year to two years, 10.0% in two years to three
years, 25.0% in three years to five years, and 40.0% in more than five years; |
Page 33
| |
• |
|
for our High Value Checking product, which is included in interest-bearing transaction
accounts, we used decay rates of: 10.0% in less than six months, 10.0% in six months to one
year, 15% in one to two years, 15% in two to three years, 25% in three to five years, and
25% in more than five years; |
| |
| |
• |
|
for other interest-bearing transaction accounts that had no stated maturity, we used
decay rates of : 7.5% in less than six months, 7.5% in six months to one year, 10.0% in
one to two years, 10.0% in two to three years, 25.0% in three years to five years, and
40.0% in more than five years; |
| |
| |
• |
|
for money market accounts that had no stated maturity, we used decay rates of: 10.0% in
less than six months, 10.0% in six months to one year, 20.0% in one to two years, 20.0% in
two to three years, 35.0% in three years to five years, and 5.0% in more than five years; |
| |
| |
• |
|
for the net interest income simulation model and GAP analysis, callable investment
securities are shown at the earlier of their probable call date, maturity date or the next
rate adjustment date (step-up securities); the model assumed calls of investment securities
of $250.0 million over the next year in the current (zero basis point) change scenario; we
currently hold $4.15 billion of step-up bonds, none of which were reported at their next
call date; and |
| |
| |
• |
|
for the net interest income simulation model and GAP analysis, borrowed funds are shown
at the earlier of their probable call date or maturity date given the rate of the
instrument in relation to the current market rate environment and the call option
frequency; the model assumed there were no calls of borrowed funds over the next year in
the current (zero basis point) change scenario.
|
Simulation Model. We use simulation models as our primary means to calculate and monitor the
interest rate risk inherent in our portfolio. These models report changes to net interest income
and the present value of equity in different interest rate environments, assuming an instantaneous
and permanent interest rate shock to all interest rate-sensitive assets and liabilities. We assume
maturing or called instruments are reinvested into the same type of product, with the rate earned
or paid reset to our currently offered rate for loans and deposits, or the current market rate for
securities and borrowed funds. We have not reported the minus 200 basis point or minus 100 basis
point interest rate shock scenarios in either of our simulation model analyses, as we believe,
given the current interest rate environment and historical interest rate levels, the resulting
information would not be meaningful.
Net Interest Income. As a primary means of managing interest rate risk, we monitor the impact
of interest rate changes on our net interest income over the next twelve-month period. This model
does not purport to provide estimates of net interest income over the next twelve-month period, but
attempts to assess the impact of a simultaneous and parallel interest rate change on our net
interest income.
Page 34
The following table reports the changes to our net interest income over the next 12 months
ending
December 31, 2010 assuming
incremental and permanent changes in interest rates for the given rate shock scenarios. The
incremental interest rate changes occur over a 12 month period.
| |
|
|
|
|
|
|
| Change in |
|
Percent Change in |
| Interest Rates |
|
Net Interest Income |
| (Basis points) |
|
|
|
200 |
|
|
|
(1.66 |
)% |
|
100 |
|
|
|
(0.90 |
) |
|
50 |
|
|
|
(0.47 |
) |
|
(50 |
) |
|
|
0.01 |
|
The preceding table indicates that at December 31, 2009, in the event of a 200 basis point
increase in interest rates over the next 12 months, we would expect to experience a 1.66% decrease
in net interest income from the base case (no interest rate changes) analysis. If market rates were
to increase 200 basis points instantaneously, we would expect to experience a 6.02% decrease in net
interest income from the base case analysis. The negative change to net interest income in the
increasing interest rate scenarios in both these analyses was primarily due to the increased
expense of our short-term time deposits. Our internal policy sets a maximum change of 20.0% given
an instantaneous 200 basis point increase or decrease shock in interest rates.
The preceding table also indicates that at December 31, 2009, in the event of a 50 basis point
decrease in interest rates over the next 12 months, we would expect to experience a 0.01% increase
in net interest income from the base case analysis. In this analysis, where the rates change over
the 12 month period, the decrease in deposit expense offsets the decrease in interest income on
assets, which will decrease due to accelerated prepayments on these instruments. If market rates
were to decrease 50 basis points instantaneously, we would expect to experience a 4.83% decrease in
net interest income from the base case. This decrease is primarily due to the acceleration of
prepayment speeds on our mortgage-related assets and calls of our investment securities in the
lower shocked environment, and the subsequent replacement of these instruments at the lower
prevailing market rate.
Present Value of Equity. We also monitor our interest rate risk by monitoring changes in the
present value of equity in the different rate environments. The present value of equity is the
difference between the estimated fair value of interest rate-sensitive assets and liabilities. The
changes in market value of assets and liabilities due to changes in interest rates reflect the
interest sensitivity of those assets and liabilities as their values are derived from the
characteristics of the asset or liability (i.e., fixed-rate, adjustable-rate, caps, floors)
relative to the current interest rate environment. For example, in a rising interest rate
environment the fair market value of a fixed-rate asset will decline, whereas the fair market value
of an adjustable-rate asset, depending on its repricing characteristics, may not decline. Increases
in the market value of assets will increase the present value of equity whereas decreases in the
market value of assets will decrease the present value of equity. Conversely, increases in the
market value of liabilities will decrease the present value of equity whereas decreases in the
market value of liabilities will increase the present value of equity.
The following table presents the estimated present value of equity over a range of interest rate
change scenarios at December 31, 2009. The present value ratio shown in the table is the present
value of equity as a percent of the present value of total assets in each of the different rate
environments. Our current policy sets a minimum ratio of the present value of equity to the fair
value of assets in the current interest rate environment (no rate shock) of 6.00% and a minimum
present value ratio of 4.00% in the plus 200 basis point interest rate shock
Page 35
scenario. Additionally, our current policy sets a maximum basis point change in the plus 200 basis
point change scenario of 400 basis points.
| |
|
|
|
|
|
|
|
|
|
|
| Present Value of Equity |
| As Percent of Present |
| Value of Assets |
| Change in |
|
Present |
|
Basis Point |
| Interest Rates |
|
Value Ratio |
|
Change |
| (Basis points) |
|
|
|
|
|
200 |
|
|
|
4.81 |
% |
|
|
(258 |
) |
|
100 |
|
|
|
6.73 |
|
|
|
(66 |
) |
|
50 |
|
|
|
7.25 |
|
|
|
(14 |
) |
|
0 |
|
|
|
7.39 |
|
|
|
|
|
|
(50 |
) |
|
|
7.07 |
|
|
|
(32 |
) |
In the 200 basis point increase scenario, the present value ratio was 4.81% at December 31,
2009 as compared to 3.84% at December 31, 2008. The change in the present value ratio was negative
258 basis points at December 31, 2009 as compared to positive 8 basis points at December 31, 2008.
The decreases in the present value ratio and the sensitivity measure in the current period positive
200 basis point shock scenario reflect the decrease in the value of our primarily fixed-rate assets
below par while the value of our borrowing portfolio remains above par due to call options. The
increase in the present value ratio in the base case and the 200 basis point shock scenario from
December 31, 2008 reflects the higher long-term market interest rates and steeper market yield
curve as short-term rates did not change as much as long-term rates during the year. The increase
in the present value ratio is also due to the growth of our deposit
portfolio during 2009 as deposits price closer to par in the base case analysis. The decrease in the present value ratio in the
negative basis point change was primarily due to higher pricing of our borrowed funds as the
structures will increase in duration.
The methods we used in simulation modeling are inherently imprecise. This type of modeling requires
that we make assumptions that may not reflect the manner in which actual yields and costs respond
to changes in market interest rates. For example, we assume the composition of the interest
rate-sensitive assets and liabilities will remain constant over the period being measured and that
all interest rate shocks will be uniformly reflected across the yield curve, regardless of the
duration to maturity or repricing. The table assumes that we will take no action in response to the
changes in interest rates. In addition, prepayment estimates and other assumptions within the model
are subjective in nature, involve uncertainties, and, therefore, cannot be determined with
precision. Accordingly, although the previous two tables may provide an estimate of our interest
rate risk at a particular point in time, such measurements are not intended to and do not provide a
precise forecast of the effect of changes in interest rates on our net interest income or present
value of equity.
Gap Analysis. The matching of the repricing characteristics of assets and liabilities may be
analyzed by examining the extent to which such assets and liabilities are “interest rate-sensitive”
and by monitoring a financial institution’s interest rate sensitivity “gap.” An asset or liability
is said to be “interest rate-sensitive” within a specific time period if it will mature or reprice
within that time period. The interest rate sensitivity gap is defined as the difference between the
amount of interest-earning assets maturing or repricing within a specific time period and the
amount of interest-bearing liabilities maturing or repricing within that same time period.
A gap is considered negative when the amount of interest-bearing liabilities maturing or repricing
within a specific time period exceeds the amount of interest-earning assets maturing or repricing
within that same period. A gap is considered positive when the amount of interest-earning assets
maturing or repricing within a specific time period exceeds the amount of interest-bearing
liabilities maturing or repricing within that same time period. During a period of rising interest
rates, a financial institution with a negative gap position would be expected,
Page 36
absent the effects of other factors, to experience a greater increase in the costs of its
interest-bearing liabilities relative to the yields of its interest-earning assets and thus a
decrease in the institution’s net interest income. An institution with a positive gap position
would be expected, absent the effect of other factors, to experience the opposite result.
Conversely, during a period of falling interest rates, a negative gap would tend to result in an
increase in net interest income while a positive gap would tend to reduce net interest income.
The following table presents the amounts of our interest-earning assets and interest-bearing
liabilities outstanding at December 31, 2009, which we anticipate to reprice or mature in each of
the future time periods shown. Except for prepayment or call activity and non-maturity deposit
decay rates, we determined the amounts of assets and liabilities that reprice or mature during a
particular period in accordance with the earlier of the term to rate reset or the contractual
maturity of the asset or liability. Assumptions used for decay rates are the same as those used in
the preparation of our December 31, 2008 model. Prepayment speeds on our mortgage-related assets
have increased from our December 31, 2008 analysis to reflect actual prepayment speeds for these
items. Callable investment securities and borrowed funds are reported at the anticipated call date,
for those that are callable within one year, or at their contractual maturity date. Investment
securities with step-up features, totaling $4.15 billion, are reported at the earlier of their next
step-up date or anticipated call date. We reported $250.0 million of investment securities at their
anticipated call date. We have reported no borrowings at their anticipated call date due to the low
interest rate environment. We have excluded non-accrual mortgage loans of $589.8 million and
non-accrual other loans of $1.9 million from the table.
| |
|
|
|
|
|
|
|
|
|
|
|
|
|
|
|
|
|
|
|
|
|
|
|
|
|
|
|
|
| |
|
At December 31, 2009 |
|
| |
|
|
|
|
|
|
|
|
|
|
|
|
|
More than |
|
|
More than |
|
|
|
|
|
|
|
| |
|
|
|
|
|
More than |
|
|
More than |
|
|
two years |
|
|
three years |
|
|
|
|
|
|
|
| |
|
Six months |
|
|
six months |
|
|
one year to |
|
|
to three |
|
|
to five |
|
|
More than |
|
|
|
|
| |
|
or less |
|
|
to one year |
|
|
two years |
|
|
years |
|
|
years |
|
|
five years |
|
|
Total |
|
| |
| |
|
(Dollars in thousands) |
|
Interest-earning assets: |
|
|
|
|
|
|
|
|
|
|
|
|
|
|
|
|
|
|
|
|
|
|
|
|
|
|
|
|
First mortgage loans |
|
$ |
2,796,213 |
|
|
$ |
2,923,905 |
|
|
$ |
4,034,420 |
|
|
$ |
3,495,763 |
|
|
$ |
5,438,851 |
|
|
$ |
12,151,578 |
|
|
$ |
30,840,730 |
|
Consumer and other loans |
|
|
125,942 |
|
|
|
3,413 |
|
|
|
19,222 |
|
|
|
3,293 |
|
|
|
11,305 |
|
|
|
184,276 |
|
|
|
347,451 |
|
Federal funds sold |
|
|
362,449 |
|
|
|
— |
|
|
|
— |
|
|
|
— |
|
|
|
— |
|
|
|
— |
|
|
|
362,449 |
|
Mortgage-backed securities |
|
|
2,663,458 |
|
|
|
2,380,191 |
|
|
|
4,621,713 |
|
|
|
4,020,140 |
|
|
|
5,296,600 |
|
|
|
2,097,983 |
|
|
|
21,080,085 |
|
FHLB stock |
|
|
874,768 |
|
|
|
— |
|
|
|
— |
|
|
|
— |
|
|
|
— |
|
|
|
— |
|
|
|
874,768 |
|
Investment securities |
|
|
257,080 |
|
|
|
300,100 |
|
|
|
1,000,000 |
|
|
|
1,750,000 |
|
|
|
1,000,000 |
|
|
|
975,764 |
|
|
|
5,282,944 |
|
| |
Total interest-earning assets |
|
|
7,079,910 |
|
|
|
5,607,609 |
|
|
|
9,675,355 |
|
|
|
9,269,196 |
|
|
|
11,746,756 |
|
|
|
15,409,601 |
|
|
|
58,788,427 |
|
| |
|
|
|
|
|
|
|
|
|
|
|
|
|
|
|
|
|
|
|
|
|
|
|
|
|
|
|
|
|
Interest-bearing liabilities: |
|
|
|
|
|
|
|
|
|
|
|
|
|
|
|
|
|
|
|
|
|
|
|
|
|
|
|
|
Savings accounts |
|
|
58,992 |
|
|
|
58,992 |
|
|
|
78,656 |
|
|
|
78,656 |
|
|
|
196,640 |
|
|
|
314,623 |
|
|
|
786,559 |
|
Interest-bearing demand accounts |
|
|
202,270 |
|
|
|
202,270 |
|
|
|
300,781 |
|
|
|
300,781 |
|
|
|
518,794 |
|
|
|
550,279 |
|
|
|
2,075,175 |
|
Money market accounts |
|
|
505,884 |
|
|
|
505,884 |
|
|
|
1,011,768 |
|
|
|
1,011,768 |
|
|
|
1,770,595 |
|
|
|
252,943 |
|
|
|
5,058,842 |
|
Time deposits |
|
|
10,636,606 |
|
|
|
2,445,111 |
|
|
|
2,146,191 |
|
|
|
497,046 |
|
|
|
346,477 |
|
|
|
— |
|
|
|
16,071,431 |
|
Borrowed funds |
|
|
— |
|
|
|
300,000 |
|
|
|
450,000 |
|
|
|
250,000 |
|
|
|
600,000 |
|
|
|
28,375,000 |
|
|
|
29,975,000 |
|
| |
Total interest-bearing liabilities |
|
|
11,403,753 |
|
|
|
3,512,256 |
|
|
|
3,987,396 |
|
|
|
2,138,250 |
|
|
|
3,432,507 |
|
|
|
29,492,845 |
|
|
|
53,967,007 |
|
| |
|
|
|
|
|
|
|
|
|
|
|
|
|
|
|
|
|
|
|
|
|
|
|
|
|
|
|
|
|
Interest rate sensitivity gap |
|
$ |
(4,323,843 |
) |
|
$ |
2,095,353 |
|
|
$ |
5,687,959 |
|
|
$ |
7,130,946 |
|
|
$ |
8,314,249 |
|
|
$ |
(14,083,244 |
) |
|
$ |
4,821,420 |
|
|
|
|
|
|
|
|
|
|
|
|
|
|
|
|
|
|
|
|
|
|
|
|
|
|
|
|
|
|
|
|
|
|
|
|
|
|
|
|
|
|
|
|
|
|
|
|
|
|
|
|
Cumulative interest rate sensitivity gap |
|
$ |
(4,323,843 |
) |
|
$ |
(2,228,490 |
) |
|
$ |
3,459,469 |
|
|
$ |
10,590,415 |
|
|
$ |
18,904,664 |
|
|
$ |
4,821,420 |
|
|
|
|
|
|
|
|
|
|
|
|
|
|
|
|
|
|
|
|
|
|
|
|
|
|
|
|
|
|
|
|
|
|
|
|
|
|
|
|
|
|
|
|
|
|
|
|
|
|
|
|
|
|
|
|
|
Cumulative interest rate sensitivity gap
as a percent of total assets |
|
|
(7.17 |
)% |
|
|
(3.70 |
)% |
|
|
5.74 |
% |
|
|
17.57 |
% |
|
|
31.37 |
% |
|
|
8.00 |
% |
|
|
|
|
|
|
|
|
|
|
|
|
|
|
|
|
|
|
|
|
|
|
|
|
|
|
|
|
|
|
|
|
|
Cumulative interest-earning assets
as a percent of interest-bearing
liabilities |
|
|
62.08 |
% |
|
|
85.06 |
% |
|
|
118.30 |
% |
|
|
150.33 |
% |
|
|
177.24 |
% |
|
|
108.93 |
% |
|
|
|
|
The cumulative one-year gap as a percent of total assets was negative 3.70% at December 31,
2009 compared with negative 7.09% at December 31, 2008. The lower negative cumulative one-year gap
primarily reflects the increase in longer-term (over one year to maturity) time deposits and money
market deposit accounts placed on
Page 37
our balance sheet during 2009. The decrease also reflects the amount of mortgage-related assets in
the lower repricing categories due to the current prepayment levels.
The methods used in the gap table are also inherently imprecise. For example, although certain
assets and liabilities may have similar maturities or periods to repricing, they may react in
different degrees to changes in market interest rates. Interest rates on certain types of assets
and liabilities may fluctuate in advance of changes in market interest rates, while interest rates
on other types may lag behind changes in market rates. Certain assets, such as adjustable-rate
loans and mortgage-backed securities, have features that limit changes in interest rates on a
short-term basis and over the life of the loan. If interest rates change, prepayment and early
withdrawal levels would likely deviate from those assumed in calculating the table. Finally, the
ability of borrowers to make payments on their adjustable-rate loans may decrease if interest rates
increase.
Page 38
Report of Independent Registered Public Accounting Firm
The Board of Directors and Shareholders
Hudson City Bancorp, Inc.:
We have audited the accompanying consolidated statements of financial condition of Hudson City
Bancorp, Inc. and subsidiary (the “Company”) as of December 31, 2009 and 2008, and the related
consolidated statements of income, changes in stockholders’ equity, and cash flows for each of the
years in the three-year period ended December 31, 2009. These consolidated financial statements are
the responsibility of the Company’s management. Our responsibility is to express an opinion on
these consolidated financial statements based on our audits.
We conducted our audits in accordance with the standards of the Public Company Accounting Oversight
Board (United States). Those standards require that we plan and perform the audit to obtain
reasonable assurance about whether the financial statements are free of material misstatement. An
audit includes examining, on a test basis, evidence supporting the amounts and disclosures in the
financial statements. An audit also includes assessing the accounting principles used and
significant estimates made by management, as well as evaluating the overall financial statement
presentation. We believe that our audits provide a reasonable basis for our opinion.
In our opinion, the consolidated financial statements referred to above present fairly, in all
material respects, the financial position of Hudson City Bancorp, Inc. and subsidiary as of
December 31, 2009 and 2008, and the results of their operations and their cash flows for each of
the years in the three-year period ended December 31, 2009, in conformity with U.S. generally
accepted accounting principles.
We also have audited, in accordance with the standards of the Public Company Accounting Oversight
Board (United States), the Company’s internal control over financial reporting as of December 31,
2009, based on criteria established in Internal Control — Integrated Framework issued by the
Committee of Sponsoring Organizations of the Treadway Commission (COSO), and our report dated
February 26, 2010 expressed an unqualified opinion on the effectiveness of the Company’s internal
control over financial reporting.
New York, New York
February 26, 2010
Page 39
Report of Independent Registered Public Accounting Firm
The Board of Directors and Shareholders
Hudson City Bancorp, Inc.:
We have audited the internal control over financial reporting of Hudson City Bancorp, Inc. and
subsidiary (the “Company”) as of December 31, 2009, based on criteria established in Internal
Control — Integrated Framework issued by the Committee of Sponsoring Organizations of the Treadway
Commission (COSO). The Company’s management is responsible for maintaining effective internal
control over financial reporting and for its assessment of the effectiveness of internal control
over financial reporting, included in the accompanying Management Report on Internal Control Over
Financial Reporting. Our responsibility is to express an opinion on the Company’s internal control
over financial reporting based on our audit.
We conducted our audit in accordance with the standards of the Public Company Accounting Oversight
Board (United States). Those standards require that we plan and perform the audit to obtain
reasonable assurance about whether effective internal control over financial reporting was
maintained in all material respects. Our audit included obtaining an understanding of internal
control over financial reporting, assessing the risk that a material weakness exists, and testing
and evaluating the design and operating effectiveness of internal control based on the assessed
risk. Our audit also included performing such other procedures as we considered necessary in the
circumstances. We believe that our audit provides a reasonable basis for our opinion.
A company’s internal control over financial reporting is a process designed to provide reasonable
assurance regarding the reliability of financial reporting and the preparation of financial
statements for external purposes in accordance with generally accepted accounting principles. A
company’s internal control over financial reporting includes those policies and procedures that (1)
pertain to the maintenance of records that, in reasonable detail, accurately and fairly reflect the
transactions and dispositions of the assets of the company; (2) provide reasonable assurance that
transactions are recorded as necessary to permit preparation of financial statements in accordance
with generally accepted accounting principles, and that receipts and expenditures of the company
are being made only in accordance with authorizations of management and directors of the company;
and (3) provide reasonable assurance regarding prevention or timely detection of unauthorized
acquisition, use, or disposition of the company’s assets that could have a material effect on the
financial statements.
Because of its inherent limitations, internal control over financial reporting may not prevent or
detect misstatements. Also, projections of any evaluation of effectiveness to future periods are
subject to the risk that controls may become inadequate because of changes in conditions, or that
the degree of compliance with the policies or procedures may deteriorate.
In our opinion, Hudson City Bancorp, Inc. and subsidiary maintained, in all material respects,
effective internal control over financial reporting as of December 31, 2009, based on criteria
established in Internal Control — Integrated Framework issued by the Committee of Sponsoring
Organizations of the Treadway Commission.
We also have audited, in accordance with the standards of the Public Company Accounting Oversight
Board (United States), the consolidated statements of financial condition of the Company as of
December 31, 2009 and 2008, and the related consolidated statements of income, changes in
stockholders’ equity, and cash flows for each of the years in the three-year period ended December
31, 2009, and our report dated February 26, 2010 expressed an unqualified opinion on those
consolidated financial statements.
New York, New York
February 26, 2010
Page 40
Hudson City Bancorp, Inc. and Subsidiary
Consolidated Statements of Financial Condition
| |
|
|
|
|
|
|
|
|
| |
|
December 31, |
|
|
December 31, |
|
| |
|
2009 |
|
|
2008 |
|
| |
|
(In thousands, except share and per share amounts) |
|
Assets: |
|
|
|
|
|
|
|
|
Cash and due from banks |
|
$ |
198,752 |
|
|
$ |
184,915 |
|
Federal funds sold |
|
|
362,449 |
|
|
|
76,896 |
|
| |
Total cash and cash equivalents |
|
|
561,201 |
|
|
|
261,811 |
|
Securities available for sale: |
|
|
|
|
|
|
|
|
Mortgage-backed securities |
|
|
11,116,531 |
|
|
|
9,915,554 |
|
Investment securities |
|
|
1,095,240 |
|
|
|
3,413,633 |
|
Securities held to maturity: |
|
|
|
|
|
|
|
|
Mortgage-backed securities (fair value of $10,324,831 and $9,695,445
at December 31, 2009 and 2008, respectively) |
|
|
9,963,554 |
|
|
|
9,572,257 |
|
Investment securities (fair value of $4,071,005 and $50,512
at December 31, 2009 and 2008, respectively) |
|
|
4,187,704 |
|
|
|
50,086 |
|
| |
Total securities |
|
|
26,363,029 |
|
|
|
22,951,530 |
|
|
|
|
|
|
|
|
|
|
Loans |
|
|
31,779,921 |
|
|
|
29,418,888 |
|
Deferred loan costs |
|
|
81,307 |
|
|
|
71,670 |
|
Allowance for loan losses |
|
|
(140,074 |
) |
|
|
(49,797 |
) |
| |
Net loans |
|
|
31,721,154 |
|
|
|
29,440,761 |
|
Federal Home Loan Bank of New York stock |
|
|
874,768 |
|
|
|
865,570 |
|
Foreclosed real estate, net |
|
|
16,736 |
|
|
|
15,532 |
|
Accrued interest receivable |
|
|
304,091 |
|
|
|
299,045 |
|
Banking premises and equipment, net |
|
|
70,116 |
|
|
|
73,502 |
|
Goodwill |
|
|
152,109 |
|
|
|
152,109 |
|
Other assets |
|
|
204,556 |
|
|
|
85,468 |
|
| |
Total Assets |
|
$ |
60,267,760 |
|
|
$ |
54,145,328 |
|
|
|
|
|
|
|
|
|
|
|
|
|
|
|
|
|
Liabilities and Stockholders’ Equity: |
|
|
|
|
|
|
|
|
Deposits: |
|
|
|
|
|
|
|
|
Interest-bearing |
|
$ |
23,992,007 |
|
|
$ |
17,949,846 |
|
Noninterest-bearing |
|
|
586,041 |
|
|
|
514,196 |
|
| |
Total deposits |
|
|
24,578,048 |
|
|
|
18,464,042 |
|
Repurchase agreements |
|
|
15,100,000 |
|
|
|
15,100,000 |
|
Federal Home Loan Bank of New York advances |
|
|
14,875,000 |
|
|
|
15,125,000 |
|
| |
Total borrowed funds |
|
|
29,975,000 |
|
|
|
30,225,000 |
|
Due to brokers for securities purchases |
|
|
100,000 |
|
|
|
239,100 |
|
Accrued expenses and other liabilities |
|
|
275,560 |
|
|
|
278,390 |
|
| |
Total liabilities |
|
|
54,928,608 |
|
|
|
49,206,532 |
|
| |
Commitments and Contingencies (Notes 1, 7, 9 and 14) |
|
|
|
|
|
|
|
|
Common stock, $0.01 par value, 3,200,000,000 shares authorized;
741,466,555 shares issued; 526,493,676 and 523,770,617
shares
outstanding at December 31, 2009 and 2008, respectively |
|
|
7,415 |
|
|
|
7,415 |
|
Additional paid-in capital |
|
|
4,683,414 |
|
|
|
4,641,571 |
|
Retained earnings |
|
|
2,401,606 |
|
|
|
2,196,235 |
|
Treasury stock, at cost; 214,972,879 and 217,695,938 shares at
December 31, 2009 and 2008, respectively |
|
|
(1,727,579 |
) |
|
|
(1,737,838 |
) |
Unallocated common stock held by the employee stock ownership plan |
|
|
(210,237 |
) |
|
|
(216,244 |
) |
Accumulated other comprehensive income, net of tax |
|
|
184,533 |
|
|
|
47,657 |
|
| |
Total stockholders’ equity |
|
|
5,339,152 |
|
|
|
4,938,796 |
|
| |
Total Liabilities and Stockholders’ Equity |
|
$ |
60,267,760 |
|
|
$ |
54,145,328 |
|
|
|
|
|
|
|
|
See accompanying notes to consolidated financial statements.
Page 41
Hudson City Bancorp, Inc. and Subsidiary
Consolidated Statements of Income
| |
|
|
|
|
|
|
|
|
|
|
|
|
| |
|
Year Ended December 31, |
|
| |
|
2009 |
|
|
2008 |
|
|
2007 |
|
| |
|
(In thousands, except per share data) |
|
Interest and Dividend Income: |
|
|
|
|
|
|
|
|
|
|
|
|
First mortgage loans |
|
$ |
1,678,789 |
|
|
$ |
1,523,521 |
|
|
$ |
1,205,461 |
|
Consumer and other loans |
|
|
21,676 |
|
|
|
26,184 |
|
|
|
28,247 |
|
Mortgage-backed securities held to maturity |
|
|
493,549 |
|
|
|
497,912 |
|
|
|
457,720 |
|
Mortgage-backed securities available for sale |
|
|
490,109 |
|
|
|
377,096 |
|
|
|
130,185 |
|
Investment securities held to maturity |
|
|
86,581 |
|
|
|
13,390 |
|
|
|
74,198 |
|
Investment securities available for sale |
|
|
126,793 |
|
|
|
162,818 |
|
|
|
179,909 |
|
Dividends on Federal Home Loan Bank of New York stock |
|
|
43,103 |
|
|
|
48,009 |
|
|
|
39,492 |
|
Federal funds sold |
|
|
1,186 |
|
|
|
4,295 |
|
|
|
12,293 |
|
| |
Total interest and dividend income |
|
|
2,941,786 |
|
|
|
2,653,225 |
|
|
|
2,127,505 |
|
| |
|
|
|
|
|
|
|
|
|
|
|
|
|
Interest Expense: |
|
|
|
|
|
|
|
|
|
|
|
|
Deposits |
|
|
483,468 |
|
|
|
581,357 |
|
|
|
606,936 |
|
Borrowed funds |
|
|
1,214,840 |
|
|
|
1,129,891 |
|
|
|
873,386 |
|
| |
Total interest expense |
|
|
1,698,308 |
|
|
|
1,711,248 |
|
|
|
1,480,322 |
|
| |
Net interest income |
|
|
1,243,478 |
|
|
|
941,977 |
|
|
|
647,183 |
|
|
|
|
|
|
|
|
|
|
|
|
|
|
Provision for Loan Losses |
|
|
137,500 |
|
|
|
19,500 |
|
|
|
4,800 |
|
| |
Net interest income after provision for loan losses |
|
|
1,105,978 |
|
|
|
922,477 |
|
|
|
642,383 |
|
| |
|
|
|
|
|
|
|
|
|
|
|
|
|
Non-Interest Income: |
|
|
|
|
|
|
|
|
|
|
|
|
Service charges and other income |
|
|
9,399 |
|
|
|
8,485 |
|
|
|
7,267 |
|
Gains on securities transactions |
|
|
24,185 |
|
|
|
— |
|
|
|
6 |
|
| |
Total non-interest income |
|
|
33,584 |
|
|
|
8,485 |
|
|
|
7,273 |
|
| |
|
|
|
|
|
|
|
|
|
|
|
|
|
Non-Interest Expense: |
|
|
|
|
|
|
|
|
|
|
|
|
Compensation and employee benefits |
|
|
137,071 |
|
|
|
127,198 |
|
|
|
106,630 |
|
Net occupancy expense |
|
|
32,270 |
|
|
|
30,457 |
|
|
|
29,589 |
|
Federal deposit insurance assessment |
|
|
35,094 |
|
|
|
4,320 |
|
|
|
1,701 |
|
FDIC special assessment |
|
|
21,098 |
|
|
|
— |
|
|
|
— |
|
Other expense |
|
|
40,063 |
|
|
|
36,101 |
|
|
|
29,993 |
|
| |
Total non-interest expense |
|
|
265,596 |
|
|
|
198,076 |
|
|
|
167,913 |
|
| |
Income before income tax expense |
|
|
873,966 |
|
|
|
732,886 |
|
|
|
481,743 |
|
|
|
|
|
|
|
|
|
|
|
|
|
|
Income Tax Expense |
|
|
346,722 |
|
|
|
287,328 |
|
|
|
185,885 |
|
| |
Net income |
|
$ |
527,244 |
|
|
$ |
445,558 |
|
|
$ |
295,858 |
|
|
|
|
|
|
|
|
|
|
|
Basic Earnings Per Share |
|
$ |
1.08 |
|
|
$ |
0.92 |
|
|
$ |
0.59 |
|
|
|
|
|
|
|
|
|
|
|
Diluted Earnings Per Share |
|
$ |
1.07 |
|
|
$ |
0.90 |
|
|
$ |
0.58 |
|
|
|
|
|
|
|
|
|
|
|
See accompanying notes to consolidated financial statements.
Page 42
Hudson City Bancorp, Inc. and Subsidiary
Consolidated Statements of Changes in Stockholders’ Equity
| |
|
|
|
|
|
|
|
|
|
|
|
|
| |
|
Year Ended December 31, |
|
| |
|
2009 |
|
|
2008 |
|
|
2007 |
|
| |
|
(In thousands , except share amounts) |
|
Common Stock |
|
$ |
7,415 |
|
|
$ |
7,415 |
|
|
$ |
7,415 |
|
| |
|
|
|
|
|
|
|
|
|
|
|
|
|
Additional paid-in capital: |
|
|
|
|
|
|
|
|
|
|
|
|
Balance at beginning of year |
|
|
4,641,571 |
|
|
|
4,578,578 |
|
|
|
4,553,614 |
|
Stock option plan expense |
|
|
12,869 |
|
|
|
15,043 |
|
|
|
12,242 |
|
Tax benefit from stock plans |
|
|
24,834 |
|
|
|
36,119 |
|
|
|
3,761 |
|
Allocation of ESOP stock |
|
|
6,319 |
|
|
|
10,471 |
|
|
|
7,313 |
|
RRP stock granted |
|
|
(6,771 |
) |
|
|
— |
|
|
|
— |
|
Vesting of RRP stock |
|
|
4,592 |
|
|
|
1,360 |
|
|
|
1,648 |
|
| |
Balance at end of year |
|
|
4,683,414 |
|
|
|
4,641,571 |
|
|
|
4,578,578 |
|
| |
|
|
|
|
|
|
|
|
|
|
|
|
|
Retained Earnings: |
|
|
|
|
|
|
|
|
|
|
|
|
Balance at beginning of year |
|
|
2,196,235 |
|
|
|
2,002,049 |
|
|
|
1,877,840 |
|
Net income |
|
|
527,244 |
|
|
|
445,558 |
|
|
|
295,858 |
|
Dividends paid on common stock ($0.59, $0.45, and
$0.33 per share, respectively) |
|
|
(288,408 |
) |
|
|
(217,995 |
) |
|
|
(165,376 |
) |
Exercise of stock options |
|
|
(33,465 |
) |
|
|
(33,377 |
) |
|
|
(6,273 |
) |
| |
Balance at end of year |
|
|
2,401,606 |
|
|
|
2,196,235 |
|
|
|
2,002,049 |
|
| |
|
|
|
|
|
|
|
|
|
|
|
|
|
Treasury Stock: |
|
|
|
|
|
|
|
|
|
|
|
|
Balance at beginning of year |
|
|
(1,737,838 |
) |
|
|
(1,771,106 |
) |
|
|
(1,230,793 |
) |
Purchase of common stock |
|
|
(43,477 |
) |
|
|
(17,045 |
) |
|
|
(550,215 |
) |
Exercise of stock options |
|
|
46,965 |
|
|
|
50,313 |
|
|
|
9,902 |
|
RRP stock granted |
|
|
6,771 |
|
|
|
— |
|
|
|
— |
|
| |
Balance at end of year |
|
|
(1,727,579 |
) |
|
|
(1,737,838 |
) |
|
|
(1,771,106 |
) |
| |
|
|
|
|
|
|
|
|
|
|
|
|
|
Unallocated common stock held by the ESOP: |
|
|
|
|
|
|
|
|
|
|
|
|
Balance at beginning of year |
|
|
(216,244 |
) |
|
|
(222,251 |
) |
|
|
(228,257 |
) |
Allocation of ESOP stock |
|
|
6,007 |
|
|
|
6,007 |
|
|
|
6,006 |
|
| |
Balance at end of year |
|
|
(210,237 |
) |
|
|
(216,244 |
) |
|
|
(222,251 |
) |
| |
|
|
|
|
|
|
|
|
|
|
|
|
|
Accumulated other comprehensive income (loss): |
|
|
|
|
|
|
|
|
|
|
|
|
Balance at beginning of year |
|
|
47,657 |
|
|
|
16,622 |
|
|
|
(49,563 |
) |
|
|
|
|
|
|
|
|
|
|
Net change in unrealized gains on securities available for sale
arising
during the year, net of tax expense of $100,466 for 2009, $37,961
for 2008 and $47,073 for 2007 |
|
|
145,473 |
|
|
|
54,967 |
|
|
|
68,173 |
|
Reclassification adjustment for gains included in net income, net
of tax of $9,880 for 2009, $0 for 2008 and $2 for 2007 |
|
|
(14,305 |
) |
|
|
— |
|
|
|
(4 |
) |
Pension and other postretirement benefits adjustment, net of tax
benefit (expense) of ($3,792) for 2009, $16,528 for 2008 and
$1,366 for 2007 |
|
|
5,708 |
|
|
|
(23,932 |
) |
|
|
(1,984 |
) |
|
|
|
|
|
|
|
|
|
|
Other comprehensive income, net of tax |
|
|
136,876 |
|
|
|
31,035 |
|
|
|
66,185 |
|
| |
Balance at end of year |
|
|
184,533 |
|
|
|
47,657 |
|
|
|
16,622 |
|
| |
|
|
|
|
|
|
|
|
|
|
|
|
|
Total Stockholders’ Equity |
|
$ |
5,339,152 |
|
|
$ |
4,938,796 |
|
|
$ |
4,611,307 |
|
|
|
|
|
|
|
|
|
|
|
|
|
|
|
|
|
|
|
|
|
|
|
|
Summary of comprehensive income |
|
|
|
|
|
|
|
|
|
|
|
|
Net income |
|
$ |
527,244 |
|
|
$ |
445,558 |
|
|
$ |
295,858 |
|
Other comprehensive income, net of tax |
|
|
136,876 |
|
|
|
31,035 |
|
|
|
66,185 |
|
|
|
|
|
|
|
|
|
|
|
Total comprehensive income |
|
$ |
664,120 |
|
|
$ |
476,593 |
|
|
$ |
362,043 |
|
|
|
|
|
|
|
|
|
|
|
See accompanying notes to consolidated financial statements.
Page 43
Hudson City Bancorp, Inc. and Subsidiary
Consolidated Statements of Cash Flows
| |
|
|
|
|
|
|
|
|
|
|
|
|
| |
|
Year Ended December 31, |
|
| |
|
2009 |
|
|
2008 |
|
|
2007 |
|
| |
|
(In thousands) |
|
Cash Flows from Operating Activities: |
|
|
|
|
|
|
|
|
|
|
|
|
Net income |
|
$ |
527,244 |
|
|
$ |
445,558 |
|
|
$ |
295,858 |
|
Adjustments to reconcile net income to net cash provided
by operating activities: |
|
|
|
|
|
|
|
|
|
|
|
|
Depreciation, accretion and amortization expense |
|
|
65,984 |
|
|
|
26,329 |
|
|
|
22,484 |
|
Provision for loan losses |
|
|
137,500 |
|
|
|
19,500 |
|
|
|
4,800 |
|
Gains on securities transactions, net |
|
|
(24,185 |
) |
|
|
— |
|
|
|
(6 |
) |
Share-based compensation, including committed ESOP shares |
|
|
29,787 |
|
|
|
32,881 |
|
|
|
27,209 |
|
Deferred tax benefit |
|
|
(46,700 |
) |
|
|
(12,868 |
) |
|
|
(9,430 |
) |
Increase in accrued interest receivable |
|
|
(5,046 |
) |
|
|
(53,932 |
) |
|
|
(50,884 |
) |
(Increase) decrease in other assets |
|
|
(164,846 |
) |
|
|
(21,053 |
) |
|
|
11,871 |
|
Increase in accrued expenses and other liabilities |
|
|
2,878 |
|
|
|
18,029 |
|
|
|
45,901 |
|
| |
Net Cash Provided by Operating Activities |
|
|
522,616 |
|
|
|
454,444 |
|
|
|
347,803 |
|
| |
Cash Flows from Investing Activities: |
|
|
|
|
|
|
|
|
|
|
|
|
Originations of loans |
|
|
(6,063,870 |
) |
|
|
(5,040,221 |
) |
|
|
(3,352,511 |
) |
Purchases of loans |
|
|
(3,161,401 |
) |
|
|
(3,061,859 |
) |
|
|
(3,971,273 |
) |
Payments on loans |
|
|
6,768,470 |
|
|
|
2,820,381 |
|
|
|
2,189,018 |
|
Principal collection of mortgage-backed securities held to maturity |
|
|
2,609,338 |
|
|
|
1,348,304 |
|
|
|
1,215,867 |
|
Purchases of mortgage-backed securities held to maturity |
|
|
(3,017,730 |
) |
|
|
(1,360,861 |
) |
|
|
(3,861,633 |
) |
Principal collection of mortgage-backed securities available for sale |
|
|
2,123,330 |
|
|
|
956,710 |
|
|
|
696,560 |
|
Proceeds from sales of mortgage-backed securities available for sale |
|
|
785,594 |
|
|
|
— |
|
|
|
— |
|
Purchases of mortgage-backed securities available for sale |
|
|
(4,088,367 |
) |
|
|
(5,820,531 |
) |
|
|
(2,966,473 |
) |
Proceeds from maturities and calls of investment securities held to maturity |
|
|
400,000 |
|
|
|
1,358,485 |
|
|
|
125,480 |
|
Purchases of investment securities held to maturity |
|
|
(4,440,329 |
) |
|
|
— |
|
|
|
— |
|
Proceeds from maturities and calls of investment securities available for sale |
|
|
3,622,225 |
|
|
|
1,449,906 |
|
|
|
3,825,060 |
|
Proceeds from sales of investment securities available for sale |
|
|
316 |
|
|
|
— |
|
|
|
— |
|
Purchases of investment securities available for sale |
|
|
(1,331,300 |
) |
|
|
(2,100,000 |
) |
|
|
(2,148,705 |
) |
Purchases of Federal Home Loan Bank of New York stock |
|
|
(78,273 |
) |
|
|
(193,277 |
) |
|
|
(259,660 |
) |
Redemption of Federal Home Loan Bank of New York stock |
|
|
69,075 |
|
|
|
23,058 |
|
|
|
9,315 |
|
Purchases of premises and equipment, net |
|
|
(6,316 |
) |
|
|
(8,565 |
) |
|
|
(11,694 |
) |
Net proceeds from sale of foreclosed real estate |
|
|
15,557 |
|
|
|
5,618 |
|
|
|
550 |
|
| |
Net Cash Used in Investing Activities |
|
|
(5,793,681 |
) |
|
|
(9,622,852 |
) |
|
|
(8,510,099 |
) |
| |
Cash Flows from Financing Activities: |
|
|
|
|
|
|
|
|
|
|
|
|
Net increase in deposits |
|
|
6,114,006 |
|
|
|
3,310,660 |
|
|
|
1,737,795 |
|
Proceeds from borrowed funds |
|
|
750,000 |
|
|
|
6,650,000 |
|
|
|
10,725,000 |
|
Principal payments on borrowed funds |
|
|
(1,000,000 |
) |
|
|
(566,000 |
) |
|
|
(3,557,000 |
) |
Dividends paid |
|
|
(288,408 |
) |
|
|
(217,995 |
) |
|
|
(165,376 |
) |
Purchases of treasury stock |
|
|
(43,477 |
) |
|
|
(17,045 |
) |
|
|
(550,215 |
) |
Exercise of stock options |
|
|
13,500 |
|
|
|
16,936 |
|
|
|
3,629 |
|
Tax benefit from stock plans |
|
|
24,834 |
|
|
|
36,119 |
|
|
|
3,761 |
|
| |
Net Cash Provided by Financing Activities |
|
|
5,570,455 |
|
|
|
9,212,675 |
|
|
|
8,197,594 |
|
| |
|
|
|
|
|
|
|
|
|
|
|
|
|
Net Increase in Cash and Cash Equivalents |
|
|
299,390 |
|
|
|
44,267 |
|
|
|
35,298 |
|
|
|
|
|
|
|
|
|
|
|
|
|
|
Cash and Cash Equivalents at Beginning of Year |
|
|
261,811 |
|
|
|
217,544 |
|
|
|
182,246 |
|
| |
|
|
|
|
|
|
|
|
|
|
|
|
|
Cash and Cash Equivalents at End of Year |
|
$ |
561,201 |
|
|
$ |
261,811 |
|
|
$ |
217,544 |
|
|
|
|
|
|
|
|
|
|
|
|
|
|
|
|
|
|
|
|
|
|
|
|
Supplemental Disclosures: |
|
|
|
|
|
|
|
|
|
|
|
|
Interest paid |
|
$ |
1,696,279 |
|
|
$ |
1,689,934 |
|
|
$ |
1,413,140 |
|
|
|
|
|
|
|
|
|
|
|
Loans transferred to foreclosed real estate |
|
$ |
26,581 |
|
|
$ |
18,892 |
|
|
$ |
1,752 |
|
|
|
|
|
|
|
|
|
|
|
Income taxes paid |
|
$ |
350,712 |
|
|
$ |
282,009 |
|
|
$ |
161,983 |
|
|
|
|
|
|
|
|
|
|
|
See accompanying notes to consolidated financial statements.
Page 44
Notes to Consolidated Financial Statements
1. Organization
Hudson City Bancorp, Inc. (“Hudson City Bancorp” or the “Company”) is a Delaware corporation
organized in March 1999 by Hudson City Savings Bank (“Hudson City Savings”) in connection with the
conversion and reorganization of Hudson City Savings from a New Jersey mutual savings bank into a
two-tiered mutual savings bank holding company structure. Prior to June 7, 2005, a majority of
Hudson City Bancorp’s common stock was owned by Hudson City, MHC, a mutual holding company. On
June 7, 2005, Hudson City Bancorp, Hudson City Savings and Hudson City, MHC reorganized from a
two-tier mutual holding company structure to a stock holding company structure, and Hudson City
Bancorp completed a stock offering, all in accordance with a Plan of Conversion and Reorganization
(the “Plan”).
2. Summary of Significant Accounting Policies
Basis of Presentation
The following are the significant accounting and reporting policies applied by Hudson City Bancorp
and its wholly-owned subsidiary, Hudson City Savings, in the preparation of the accompanying
consolidated financial statements. The consolidated financial statements have been prepared in
conformity with U.S. generally accepted accounting principles. All significant intercompany
transactions and balances have been eliminated in consolidation. As used in these consolidated
financial statements, “Hudson City” refers to Hudson City Bancorp, Inc. or Hudson City Bancorp,
Inc. and its consolidated subsidiary, depending on the context. In preparing the consolidated
financial statements, management is required to make estimates and assumptions that affect the
reported amounts of assets and liabilities as of the date of the statements of financial condition
and revenues and expenses for the period. Actual results could differ from these estimates. The
allowance for loan losses is a material estimate that is particularly susceptible to near-term
change. The current economic environment has increased the degree of uncertainty inherent in this
material estimate.
Cash and Cash Equivalents
For purposes of reporting cash flows, cash and cash equivalents includes cash on hand, amounts due
from banks and federal funds sold. Generally, federal funds are sold for one-day periods. Cash
reserves are required to be maintained on deposit with the Federal Reserve Bank of New York based
on deposits. The amount of the required reserves for the years ended December 31, 2009 and 2008
was $24.5 million and $21.8 million, respectively.
Mortgage-Backed Securities
Mortgage-backed securities include U.S. Government-sponsored enterprise (“GSEs”) and U.S.
Government agency pass-through certificates, which represent participating interests in pools of
long-term first mortgage loans originated and serviced by third-party issuers of the securities,
and real estate mortgage investment conduits (“REMIC’s”), which are securities derived by
reallocating cash flows from mortgage pass-through securities or from pools of mortgage loans held
by a trust. REMICs are a form of, and are often referred to as, collateralized mortgage
obligations (“CMOs”).
Mortgage-backed securities are classified as either held to maturity or available for sale. For
the years ended December 31, 2009, 2008 and 2007, we did not maintain a trading portfolio.
Mortgage-backed securities classified as held to maturity are stated at cost, adjusted for
amortization of premiums and accretion of discounts. Amortization and accretion is reflected as an
adjustment to interest income over the life of the security, adjusted for estimated prepayments,
using the effective interest method. Hudson City has both the ability and the positive intent to
hold these investment securities to maturity. Mortgage-backed securities
Page 45
available for sale are carried at fair value, with unrealized gains and losses, net of tax,
reported as a component of other comprehensive income or loss, which is included in stockholders’
equity. Amortization and accretion of premiums and discounts are reflected as an adjustment to
interest income over the life of the security, adjusted for estimated prepayments, using the
effective interest method. Realized gains and losses are recognized when securities are sold using
the specific identification method. The estimated fair value of substantially all of these
securities is determined by the use of market prices obtained from independent third-party pricing
services. We conduct a periodic review and evaluation of the securities portfolio to determine if
a decline in the fair value of any security below its cost basis is other-than-temporary. Our
evaluation of other-than-temporary impairment considers the duration and severity of the
impairment, our intent and ability to hold the securities and our assessments of the reason for the
decline in value and the likelihood of a near-term recovery. If such a decline is deemed
other-than-temporary, the security is written down to a new cost basis and the resulting loss is
charged to income as a component of non-interest expense. See “Critical Accounting Policies –
Securities Impairment”.
Investment Securities
Investment securities are classified as either held to maturity or available for sale. For the
years ended December 31, 2009, 2008 and 2007, we did not maintain a trading portfolio. Investment
securities classified as held to maturity are stated at cost, adjusted for amortization of premiums
and accretion of discounts. Amortization and accretion is reflected as an adjustment to interest
income over the life of the security using the effective interest method. Hudson City has both the
ability and the positive intent to hold these investment securities to maturity. Securities
available for sale are carried at fair value, with unrealized gains and losses, net of tax,
reported as a component of accumulated other comprehensive income or loss, which is included in
stockholders’ equity. Amortization and accretion of premiums and discounts are reflected as an
adjustment to interest income over the life of the security using the effective interest method.
Realized gains and losses are recognized when securities are sold or called using the specific
identification method. The estimated fair value of substantially all of these securities is
determined by the use of quoted market prices obtained from independent third-party pricing
services. We conduct a periodic review and evaluation of the securities portfolio to determine if
a decline in the fair value of any security below its cost basis is other-than-temporary. Our
evaluation of other-than-temporary impairment considers the duration and severity of the
impairment, our intent and ability to hold the securities and our assessments of the reason for the
decline in value and the likelihood of a near-term recovery. If such a decline is deemed
other-than-temporary, the security is written down to a new cost basis and the resulting loss is
charged to income as a component of non-interest expense. See “Critical Accounting Policies –
Securities Impairment”.
Loans
Loans are stated at their principal amounts outstanding. Interest income on loans is accrued and
credited to income as earned. Net loan origination fees and broker costs are deferred and
amortized to interest income over the life of the loan using the effective interest method.
Amortization and accretion of premiums and discounts is reflected as an adjustment to interest
income over the life of the purchased loan using the effective interest method.
Existing customers in good credit standing are permitted to modify the terms of their mortgage
loan, for a fee, to the terms of the currently offered fixed-rate product with a similar or reduced
period to maturity than the current remaining period of their existing loan. The modified terms of
these loans are at least as favorable to us as the terms of mortgage loans we offer to new
customers. The fee assessed for modifying the mortgage loan is deferred and accreted over the life
of the modified loan using the effective interest method. Such accretion is reflected as an
adjustment to interest income. We have determined that the modification of the terms of the loan
(i.e. the change in rate and period to maturity), represents a more than minor change to the loan.
Accordingly, pre-modification deferred fees or costs associated with the mortgage loan are
recognized in interest income at the time of the modification.
Page 46
A loan is considered delinquent when we have not received a payment within 30 days of its
contractual due date. The accrual of income on loans that do not carry private mortgage insurance
or are not guaranteed by a U.S. Government agency is generally discontinued when interest or
principal payments are 90 days in arrears or when the timely collection of such income is doubtful.
Loans on which the accrual of income has been discontinued are designated as non-accrual loans and
outstanding interest previously credited to income is reversed. Interest income on non-accrual
loans and impaired loans is recognized in the period collected unless the ultimate collection of
principal is considered doubtful. A non-accrual loan is returned to accrual status when factors
indicating doubtful collection no longer exist.
Hudson City defines the population of potential impaired loans to be all non-accrual commercial
real estate and multi-family loans. Impaired loans are individually assessed to determine that the
loan’s carrying value is not in excess of the fair value of the collateral or the present value of
the loan’s expected future cash flows. Smaller balance homogeneous loans that are collectively
evaluated for impairment, such as residential mortgage loans and consumer loans, are specifically
excluded from the impaired loan portfolio.
Allowance for Loan Losses
The allowance for loan losses has been determined in accordance with U.S. generally accepted
accounting principles, under which we are required to maintain adequate allowances for loan losses.
We are responsible for the timely and periodic determination of the amount of the allowance
required. We believe that our allowance for loan losses is adequate to cover specifically
identifiable loan losses, as well as estimated losses inherent in our portfolio for which certain
losses are probable but not specifically identifiable.
Our primary lending emphasis is the origination and purchase of one- to four-family first mortgage
loans on residential properties and, to a lesser extent, second mortgage loans on one- to
four-family residential properties resulting in a loan concentration in residential first mortgage
loans at December 31, 2009. As a result of our lending practices, we also have a concentration of
loans secured by real property located in New Jersey, New York and Connecticut that is 73.8% of our
total loans. Based on the composition of our loan portfolio and the growth in our loan portfolio,
we believe the primary risks inherent in our portfolio are increases in interest rates, a decline
in the economy, rising unemployment levels and a decline in real estate market values. Any one or a
combination of these events may adversely affect our loan portfolio resulting in increased
delinquencies, charge-offs and future levels of loan loss provisions. Our Asset Quality Committee
considers these trends in market conditions, as well as other factors, in estimating the allowance
for loan losses.
Due to the nature of our loan portfolio, our evaluation of the adequacy of our ALL is performed
primarily on a “pooled” basis. Each month we prepare an analysis which categorizes the entire loan
portfolio by certain risk characteristics such as loan type (one- to four-family, multi-family,
commercial, construction, etc.), loan source (originated or purchased) and payment status (i.e.,
current or number of days delinquent). Loans with known potential losses are categorized
separately. We assign potential loss factors to the payment status categories on the basis of our
assessment of the potential risk inherent in each loan type. These factors are periodically
reviewed for appropriateness giving consideration to charge-off history, delinquency trends,
portfolio growth and the status of the regional economy and housing market, in order to ascertain
that the loss factors cover probable and estimable losses inherent in the portfolio. Based on our
recent loss experience on non-performing loans, we increased the loss factors used in our
quantitative analysis of the ALL for certain loan types during 2009.
We maintain the allowance for loan losses through provisions for loan losses that we charge to
income. We charge losses on loans against the allowance for loan losses when we believe the
collection of loan principal is unlikely. We establish the provision for loan losses based on our
systematic process which reflects various asset quality trends and recent charge-off experience. We
apply this process and methodology in a consistent manner and we reassess and modify the estimation
methods and assumptions used in response to changing conditions.
Page 47
Federal Home Loan Bank of New York Stock
As a member of the Federal Home Loan Bank of New York (“FHLB”), we are required to acquire and hold
shares of FHLB Class B stock. Our holding requirement varies based on our activities, primarily
our outstanding borrowings, with the FHLB. Our investment in FHLB stock is carried at cost. We
conduct a periodic review and evaluation of our FHLB stock to determine if any impairment exists.
Foreclosed Real Estate
Foreclosed real estate is property acquired through foreclosure or deed in lieu of foreclosure.
Write-downs to fair value (net of estimated cost to sell) at the time of acquisition are charged to
the allowance for loan losses. After acquisition, foreclosed properties are held for sale and
carried at the lower of fair value less estimated selling costs. Fair value is estimated through
current appraisals, where practical, or an inspection and a comparison of the property securing the
loan with similar properties in the area by either a licensed appraiser or real estate broker.
Subsequent provisions for losses, which may result from the ongoing periodic valuations of these
properties, are charged to income in the period in which they are identified. Carrying costs, such
as maintenance and taxes, are charged to operating expenses as incurred.
Banking Premises and Equipment
Land is carried at cost. Buildings, leasehold improvements and furniture, fixtures and equipment
are carried at cost, less accumulated depreciation and leasehold amortization. Buildings are
depreciated over their estimated useful lives using the straight-line method. Furniture, fixtures
and equipment are depreciated over their estimated useful lives using the double-declining balance
method. Leasehold improvements are amortized over the shorter of their estimated useful lives or
the term of the respective leases. The costs for major improvements and renovations are
capitalized, while maintenance, repairs and minor improvements are charged to operating expenses as
incurred. Gains and losses on dispositions are reflected currently as other non-interest income or
expense.
Goodwill and Other Intangible Assets
FASB guidance requires that goodwill and intangible assets with indefinite useful lives no longer
be amortized, but instead be tested for impairment at least annually using a fair-value based
approach. Other intangible assets include the core deposit intangible recorded as a result of
Hudson City Bancorp’s acquisition of Sound Federal Bancorp, Inc. in 2006. These
other intangible assets are amortizing intangible assets and as such are evaluated for impairment
in accordance with FASB guidance. We did not recognize any impairment of goodwill or other
intangible assets for the years ended December 31, 2009, 2008 and 2007.
Income Taxes
We utilize the asset and liability method of accounting for income taxes. Under this method,
deferred tax assets and liabilities are recognized for the future tax consequences attributable to
differences between the financial statement carrying amounts of existing assets and liabilities and
their respective tax bases.
Deferred tax assets and liabilities are measured using enacted tax rates expected to apply to
taxable income in the years in which those temporary differences are expected to be recovered or
settled. The effect on deferred tax assets and liabilities of a change in tax rates is recognized
in income in the period that includes the enactment date. Certain tax benefits attributable to
stock options and restricted stock are credited to additional paid-in capital. In July 2006, the
FASB issued guidance which clarifies the accounting for uncertainty in income taxes recognized in
an enterprise’s financial statements. This guidance prescribes a recognition threshold and
measurement attribute for the financial statement recognition and measurement of a tax position
Page 48
taken, or expected to be taken, in a tax return. We adopted this guidance on January 1, 2007.
Accruals of interest and penalties related to unrecognized tax benefits are recognized in income
tax expense.
Employee Benefit Plans
Hudson City maintains certain noncontributory retirement and postretirement benefit plans, which
cover employees hired prior to August 1, 2005 who have met the eligibility requirements of the
plans. Certain health care and life insurance benefits are provided for retired employees. The
expected cost of benefits provided for retired employees is actuarially determined and accrued
ratably from the date of hire to the date the employee is fully eligible to receive the benefits.
The accounting guidance related to retirement benefits requires an employer to: (a) recognize in
its statement of financial position an asset for a plan’s overfunded status or a liability for a
plan’s underfunded status; (b) measure a plan’s assets and its obligations that determine its
funded status as of the end of the employer’s fiscal year; and (c) recognize, in comprehensive
income, changes in the funded status of a defined benefit postretirement plan in the year in which
the changes occur. The accounting guidance requires that plan assets and benefit obligations be
measured as of the date of the employer’s fiscal year-end statement of financial condition. This
requirement became effective for the Company as of December 31, 2008. We have historically used
our fiscal year-end as the measurement date for plan assets and benefit obligations and therefore
the measurement date provisions of the FASB guidance did not affect us.
The employee stock ownership plan (“ESOP”) is accounted for in accordance with FASB guidance
related to employee stock ownership plans. The funds borrowed by the ESOP from Hudson City Bancorp
to purchase Hudson City Bancorp common stock are being repaid from Hudson City Savings’
contributions and dividends paid on unallocated ESOP shares over a period of up to 40 years.
Hudson City common stock not allocated to participants is recorded as a reduction of stockholders’
equity at cost. Compensation expense for the ESOP is based on the average market price of our
stock during each quarter.
Stock-Based Compensation
Effective January 1, 2006, Hudson City Bancorp adopted FASB guidance using the modified prospective
method. Stock-based compensation expense is recognized for new stock-based awards granted,
modified, repurchased or cancelled after January 1, 2006, and the remaining portion of the
requisite service under previously granted unvested awards outstanding as of January 1, 2006 based
upon the grant-date fair value of those awards.
Bank-Owned Life Insurance
Bank-owned life insurance (“BOLI”) is accounted for in accordance with FASB guidance related to
Split-Dollar Life Insurance Agreements. The cash surrender value of BOLI is recorded on our
consolidated statement of financial condition as an asset and the change in the cash surrender
value is recorded as non-interest income. The amount by which any death benefits received exceeds
a policy’s cash surrender value is recorded in non-interest income at the time of receipt. A
liability is also recorded on our consolidated statement of financial condition for postretirement
death benefits provided by the split-dollar endorsement policy. A corresponding expense is
recorded in non-interest expense for the accrual of benefits over the period during which employees
provide services to earn the benefits.
Borrowed Funds
Hudson City enters into sales of securities under agreements to repurchase with selected brokers
and the FHLB. These agreements are recorded as financing transactions as Hudson City maintains
effective control over the transferred securities. The dollar amount of the securities underlying
the agreements continues to be carried in
Page 49
Hudson City’s securities portfolio. The obligations to repurchase the securities are reported as a
liability in the consolidated statements of financial condition. The securities underlying the
agreements are delivered to the party with whom each transaction is executed. They agree to resell
to Hudson City the same securities at the maturity or call of the agreement. Hudson City retains
the right of substitution of the underlying securities throughout the terms of the agreements.
Hudson City has also obtained advances from the FHLB, which are generally secured by a blanket lien
against our mortgage portfolio. Total borrowings with the FHLB are generally limited to
approximately twenty times the amount of FHLB stock owned or the fair value of our mortgage
portfolio, whichever is greater.
Comprehensive Income
Comprehensive income is comprised of net income and other comprehensive income. Other
comprehensive income includes items such as changes in unrealized gains and losses on securities
available for sale, net of tax and changes in the unrecognized prior service costs or credits of
defined benefit pension and other postretirement plans, net of tax. Comprehensive income is
presented in the consolidated statements of changes in stockholders’ equity.
Segment Information
FASB guidance requires public companies to report certain financial information about significant
revenue-producing segments of the business for which such information is available and utilized by
the chief operating decision maker. As a community-oriented financial institution, substantially
all of our operations involve the delivery of loan and deposit products to customers. Management
makes operating decisions and assesses performance based on an ongoing review of these community
banking operations, which constitute our only operating segment for financial reporting purposes.
Earnings per Share
Basic earnings per share is computed by dividing income available to common stockholders by the
weighted average number of shares outstanding for the period. Diluted earnings per share reflects
the potential dilution that could occur if securities or other contracts to issue common stock
(such as stock options) were exercised or resulted in the issuance of common stock. These
potentially dilutive shares would then be included in the weighted average number of shares
outstanding for the period using the treasury stock method. Shares issued and shares reacquired
during any period are weighted for the portion of the period that they were outstanding.
In computing both basic and diluted earnings per share, the weighted average number of common
shares outstanding includes the ESOP shares previously allocated to participants and shares
committed to be released for allocation to participants and the recognition and retention plans
(“RRP”) shares which have vested or have been allocated to participants. ESOP and RRP shares that
have been purchased but have not been committed to be released or have not vested are excluded from
the computation of basic and diluted earnings per share.
Subsequent Events
The Company has evaluated all events subsequent to the balance sheet date of December 31, 2009,
through February 26, 2010, which is the date these consolidation financial statements were issued,
and have determined that there are no subsequent events that require disclosure under FASB
guidance.
Page 50
3. Stock Repurchase Programs
We have previously announced several stock repurchase programs. Under our stock repurchase
programs, shares of Hudson City Bancorp common stock may be purchased in the open market or through
other privately negotiated transactions, depending on market conditions. The repurchased shares
are held as treasury stock for general corporate use. During the years ended December 31, 2009,
2008 and 2007 we purchased 3,970,605, 1,124,262 and 40,578,954 shares of our common stock at an
aggregate cost of $43.5 million, $17.0 million and 550.2 million, respectively. As of December 31,
2009, there remained 50,123,550 shares to be purchased under the existing stock repurchase
programs.
4. Mortgage-Backed Securities
The amortized cost and estimated fair market value of mortgage-backed securities at December 31 are
as follows:
| |
|
|
|
|
|
|
|
|
|
|
|
|
|
|
|
|
| |
|
|
|
|
|
Gross |
|
|
Gross |
|
|
Estimated |
|
| |
|
Amortized |
|
|
Unrealized |
|
|
Unrealized |
|
|
Fair Market |
|
| |
|
Cost |
|
|
Gains |
|
|
Losses |
|
|
Value |
|
| |
|
(In thousands) |
|
2009 |
|
|
|
|
|
|
|
|
|
|
|
|
|
|
|
|
Held to Maturity: |
|
|
|
|
|
|
|
|
|
|
|
|
|
|
|
|
GNMA pass-through certificates |
|
$ |
112,019 |
|
|
$ |
2,769 |
|
|
$ |
(1 |
) |
|
$ |
114,787 |
|
FNMA pass-through certificates |
|
|
2,510,095 |
|
|
|
106,509 |
|
|
|
— |
|
|
|
2,616,604 |
|
FHLMC pass-through certificates |
|
|
4,764,429 |
|
|
|
231,356 |
|
|
|
(3 |
) |
|
|
4,995,782 |
|
FHLMC and FNMA — REMICs |
|
|
2,577,011 |
|
|
|
37,119 |
|
|
|
(16,472 |
) |
|
|
2,597,658 |
|
| |
Total held to maturity |
|
$ |
9,963,554 |
|
|
$ |
377,753 |
|
|
$ |
(16,476 |
) |
|
$ |
10,324,831 |
|
|
|
|
|
|
|
|
|
|
|
|
|
|
|
|
|
|
|
|
|
|
|
|
|
|
|
|
|
|
|
Available for Sale: |
|
|
|
|
|
|
|
|
|
|
|
|
|
|
|
|
GNMA pass-through certificates |
|
$ |
1,257,590 |
|
|
$ |
13,365 |
|
|
$ |
(881 |
) |
|
$ |
1,270,074 |
|
FNMA pass-through certificates |
|
|
3,782,198 |
|
|
|
128,429 |
|
|
|
(3,259 |
) |
|
|
3,907,368 |
|
FHLMC pass-through certificates |
|
|
4,655,629 |
|
|
|
232,697 |
|
|
|
— |
|
|
|
4,888,326 |
|
FHLMC and FNMA — REMICs |
|
|
1,057,007 |
|
|
|
5,938 |
|
|
|
(12,182 |
) |
|
|
1,050,763 |
|
| |
Total available for sale |
|
$ |
10,752,424 |
|
|
$ |
380,429 |
|
|
$ |
(16,322 |
) |
|
$ |
11,116,531 |
|
|
|
|
|
|
|
|
|
|
|
|
|
|
|
|
|
|
|
|
|
|
|
|
|
|
|
|
|
|
|
2008 |
|
|
|
|
|
|
|
|
|
|
|
|
|
|
|
|
Held to Maturity: |
|
|
|
|
|
|
|
|
|
|
|
|
|
|
|
|
GNMA pass-through certificates |
|
$ |
128,906 |
|
|
$ |
108 |
|
|
$ |
(1,705 |
) |
|
$ |
127,309 |
|
FNMA pass-through certificates |
|
|
3,203,799 |
|
|
|
44,905 |
|
|
|
(857 |
) |
|
|
3,247,847 |
|
FHLMC pass-through certificates |
|
|
5,859,297 |
|
|
|
85,885 |
|
|
|
(2,027 |
) |
|
|
5,943,155 |
|
FHLMC and FNMA — REMICs |
|
|
380,255 |
|
|
|
363 |
|
|
|
(3,484 |
) |
|
|
377,134 |
|
| |
Total held to maturity |
|
$ |
9,572,257 |
|
|
$ |
131,261 |
|
|
$ |
(8,073 |
) |
|
$ |
9,695,445 |
|
|
|
|
|
|
|
|
|
|
|
|
|
|
|
|
|
|
|
|
|
|
|
|
|
|
|
|
|
|
|
Available for Sale: |
|
|
|
|
|
|
|
|
|
|
|
|
|
|
|
|
GNMA pass-through certificates |
|
$ |
938,393 |
|
|
$ |
2,425 |
|
|
$ |
(24,823 |
) |
|
$ |
915,995 |
|
FNMA pass-through certificates |
|
|
3,253,463 |
|
|
|
47,425 |
|
|
|
— |
|
|
|
3,300,888 |
|
FHLMC pass-through certificates |
|
|
5,607,066 |
|
|
|
91,657 |
|
|
|
(52 |
) |
|
|
5,698,671 |
|
| |
Total available for sale |
|
$ |
9,798,922 |
|
|
$ |
141,507 |
|
|
$ |
(24,875 |
) |
|
$ |
9,915,554 |
|
|
|
|
|
|
|
|
|
|
|
|
|
|
Page 51
The following tables summarize the fair values and unrealized losses of mortgage-backed
securities with an unrealized loss at December 31, 2009 and 2008, segregated between securities
that had been in a continuous unrealized loss position for less than twelve months or longer than
twelve months at the respective dates.
| |
|
|
|
|
|
|
|
|
|
|
|
|
|
|
|
|
|
|
|
|
|
|
|
|
| |
|
Less Than 12 Months |
|
|
12 Months or Longer |
|
|
Total |
|
| |
|
|
|
|
|
Unrealized |
|
|
|
|
|
|
Unrealized |
|
|
|
|
|
|
Unrealized |
|
| |
|
Fair Value |
|
|
Losses |
|
|
Fair Value |
|
|
Losses |
|
|
Fair Value |
|
|
Losses |
|
| |
|
(In thousands) |
|
2009 |
|
|
|
|
|
|
|
|
|
|
|
|
|
|
|
|
|
|
|
|
|
|
|
|
Held to Maturity: |
|
|
|
|
|
|
|
|
|
|
|
|
|
|
|
|
|
|
|
|
|
|
|
|
GNMA pass-through certificates |
|
$ |
— |
|
|
$ |
— |
|
|
$ |
582 |
|
|
$ |
(1 |
) |
|
$ |
582 |
|
|
$ |
(1 |
) |
FNMA pass-through certificates |
|
|
— |
|
|
|
— |
|
|
|
— |
|
|
|
— |
|
|
|
— |
|
|
|
— |
|
FHLMC pass-through
certificates |
|
|
642 |
|
|
|
(2 |
) |
|
|
52 |
|
|
|
(1 |
) |
|
|
694 |
|
|
|
(3 |
) |
FHLMC and FNMA — REMIC’s |
|
|
617,463 |
|
|
|
(10,747 |
) |
|
|
171,031 |
|
|
|
(5,725 |
) |
|
|
788,494 |
|
|
|
(16,472 |
) |
| |
Total held to maturity |
|
|
618,105 |
|
|
|
(10,749 |
) |
|
|
171,665 |
|
|
|
(5,727 |
) |
|
|
789,770 |
|
|
|
(16,476 |
) |
| |
Available for Sale: |
|
|
|
|
|
|
|
|
|
|
|
|
|
|
|
|
|
|
|
|
|
|
|
|
GNMA pass-through certificates |
|
|
156,668 |
|
|
|
(878 |
) |
|
|
19,690 |
|
|
|
(3 |
) |
|
|
176,358 |
|
|
|
(881 |
) |
FNMA pass-through certificates |
|
|
694,543 |
|
|
|
(3,259 |
) |
|
|
— |
|
|
|
— |
|
|
|
694,543 |
|
|
|
(3,259 |
) |
FHLMC pass-through
certificates |
|
|
— |
|
|
|
— |
|
|
|
— |
|
|
|
— |
|
|
|
— |
|
|
|
— |
|
FHLMC and FNMA — REMIC’s |
|
|
476,797 |
|
|
|
(12,182 |
) |
|
|
— |
|
|
|
— |
|
|
|
476,797 |
|
|
|
(12,182 |
) |
| |
Total available for sale |
|
|
1,328,008 |
|
|
|
(16,319 |
) |
|
|
19,690 |
|
|
|
(3 |
) |
|
|
1,347,698 |
|
|
|
(16,322 |
) |
| |
Total |
|
$ |
1,946,113 |
|
|
$ |
(27,068 |
) |
|
$ |
191,355 |
|
|
$ |
(5,730 |
) |
|
$ |
2,137,468 |
|
|
$ |
(32,798 |
) |
|
|
|
|
|
|
|
|
|
|
|
|
|
|
|
|
|
|
|
|
|
|
|
|
|
|
|
|
|
|
|
|
|
|
|
|
|
|
|
|
|
|
|
|
2008 |
|
|
|
|
|
|
|
|
|
|
|
|
|
|
|
|
|
|
|
|
|
|
|
|
Held to Maturity: |
|
|
|
|
|
|
|
|
|
|
|
|
|
|
|
|
|
|
|
|
|
|
|
|
GNMA pass-through certificates |
|
$ |
99,059 |
|
|
$ |
(1,333 |
) |
|
$ |
12,753 |
|
|
$ |
(372 |
) |
|
$ |
111,812 |
|
|
$ |
(1,705 |
) |
FNMA pass-through certificates |
|
|
53,796 |
|
|
|
(230 |
) |
|
|
154,150 |
|
|
|
(627 |
) |
|
|
207,946 |
|
|
|
(857 |
) |
FHLMC pass-through certificates |
|
|
88,814 |
|
|
|
(310 |
) |
|
|
186,866 |
|
|
|
(1,717 |
) |
|
|
275,680 |
|
|
|
(2,027 |
) |
FHLMC and FNMA — REMIC’s |
|
|
— |
|
|
|
— |
|
|
|
274,434 |
|
|
|
(3,484 |
) |
|
|
274,434 |
|
|
|
(3,484 |
) |
| |
Total held to maturity |
|
|
241,669 |
|
|
|
(1,873 |
) |
|
|
628,203 |
|
|
|
(6,200 |
) |
|
|
869,872 |
|
|
|
(8,073 |
) |
| |
Available for Sale: |
|
|
|
|
|
|
|
|
|
|
|
|
|
|
|
|
|
|
|
|
|
|
|
|
GNMA pass-through certificates |
|
|
312,112 |
|
|
|
(6,714 |
) |
|
|
467,660 |
|
|
|
(18,109 |
) |
|
|
779,772 |
|
|
|
(24,823 |
) |
FNMA pass-through certificates |
|
|
— |
|
|
|
— |
|
|
|
— |
|
|
|
— |
|
|
|
— |
|
|
|
— |
|
FHLMC pass-through certificates |
|
|
95,928 |
|
|
|
(52 |
) |
|
|
— |
|
|
|
— |
|
|
|
95,928 |
|
|
|
(52 |
) |
| |
Total available for sale |
|
|
408,040 |
|
|
|
(6,766 |
) |
|
|
467,660 |
|
|
|
(18,109 |
) |
|
|
875,700 |
|
|
|
(24,875 |
) |
| |
Total |
|
$ |
649,709 |
|
|
$ |
(8,639 |
) |
|
$ |
1,095,863 |
|
|
$ |
(24,309 |
) |
|
$ |
1,745,572 |
|
|
$ |
(32,948 |
) |
|
|
|
|
|
|
|
|
|
|
|
|
|
|
|
|
|
|
|
The unrealized losses are primarily due to the changes in market interest rates subsequent
to purchase. At December 31, 2009, a total of 54 securities were in an unrealized loss position
(417 at December 31, 2008). We only purchase securities issued by GSEs and do not own any unrated
or private label securities or other high-risk securities such as those backed by sub-prime loans.
Accordingly, it is expected that the securities would not be settled at a price less than the
Company’s amortized cost basis. We do not consider these investments to be other-than-temporarily
impaired at December 31, 2009 and December 31, 2008 since the decline in market value is
attributable to changes in interest rates and not credit quality and the Company has the intent and
ability to hold these investments until there is a full recovery of the unrealized loss, which may
be at maturity. As a result no impairment loss has been recognized during the years ended December
31, 2009, 2008 and 2007, respectively.
Page 52
The amortized cost and estimated fair market value of mortgage-backed securities held to maturity
and available for sale at December 31, 2009, by contractual maturity, are shown below. The table
does not include the effect of prepayments or scheduled principal amortization.
| |
|
|
|
|
|
|
|
|
| |
|
|
|
|
|
Estimated |
|
| |
|
Amortized |
|
|
Fair Market |
|
| |
|
Cost |
|
|
Value |
|
| |
|
(In thousands) |
|
Held to Maturity: |
|
|
|
|
|
|
|
|
Due in one year or less |
|
$ |
73 |
|
|
$ |
75 |
|
Due after one year through five years |
|
|
527 |
|
|
|
558 |
|
Due after five years through ten years |
|
|
13,704 |
|
|
|
14,676 |
|
Due after ten years |
|
|
9,949,250 |
|
|
|
10,309,522 |
|
| |
Total held to maturity |
|
$ |
9,963,554 |
|
|
$ |
10,324,831 |
|
|
|
|
|
|
|
|
|
|
|
|
|
|
|
|
|
Available for Sale: |
|
|
|
|
|
|
|
|
Due after ten years |
|
$ |
10,752,424 |
|
|
$ |
11,116,531 |
|
| |
Total available for sale |
|
$ |
10,752,424 |
|
|
$ |
11,116,531 |
|
|
|
|
|
|
|
|
Sales of mortgage-backed securities available-for-sale amounted to $761.6 million during
2009. There were no sales of mortgage-backed securities available-for-sale or held-to-maturity
during 2008 and 2007. Realized gains on the sales of mortgage-backed securities amounted to $24.0
million during 2009.
5. Investment Securities
The amortized cost and estimated fair market value of investment securities at December 31 are as
follows:
| |
|
|
|
|
|
|
|
|
|
|
|
|
|
|
|
|
| |
|
|
|
|
|
Gross |
|
|
Gross |
|
|
Estimated |
|
| |
|
Amortized |
|
|
Unrealized |
|
|
Unrealized |
|
|
Fair Market |
|
| |
|
Cost |
|
|
Gains |
|
|
Losses |
|
|
Value |
|
| |
|
(In thousands) |
|
2009 |
|
|
|
|
|
|
|
|
|
|
|
|
|
|
|
|
Held to Maturity: |
|
|
|
|
|
|
|
|
|
|
|
|
|
|
|
|
United States government-sponsored
enterprises debt |
|
$ |
4,187,599 |
|
|
$ |
915 |
|
|
$ |
(117,614 |
) |
|
$ |
4,070,900 |
|
Municipal bonds |
|
|
105 |
|
|
|
— |
|
|
|
— |
|
|
|
105 |
|
| |
Total held to maturity |
|
$ |
4,187,704 |
|
|
$ |
915 |
|
|
$ |
(117,614 |
) |
|
$ |
4,071,005 |
|
|
|
|
|
|
|
|
|
|
|
|
|
|
|
|
|
|
|
|
|
|
|
|
|
|
|
|
|
|
|
Available for Sale: |
|
|
|
|
|
|
|
|
|
|
|
|
|
|
|
|
United States government-sponsored
enterprises debt |
|
$ |
1,104,699 |
|
|
$ |
1,890 |
|
|
$ |
(18,424 |
) |
|
$ |
1,088,165 |
|
Equity securities |
|
|
6,770 |
|
|
|
305 |
|
|
|
— |
|
|
|
7,075 |
|
| |
Total available for sale |
|
$ |
1,111,469 |
|
|
$ |
2,195 |
|
|
$ |
(18,424 |
) |
|
$ |
1,095,240 |
|
|
|
|
|
|
|
|
|
|
|
|
|
|
2008 |
|
|
|
|
|
|
|
|
|
|
|
|
|
|
|
|
Held to Maturity: |
|
|
|
|
|
|
|
|
|
|
|
|
|
|
|
|
United States government-sponsored
enterprises debt |
|
$ |
49,981 |
|
|
$ |
425 |
|
|
$ |
— |
|
|
$ |
50,406 |
|
Municipal bonds |
|
|
105 |
|
|
|
1 |
|
|
|
— |
|
|
|
106 |
|
| |
Total held to maturity |
|
$ |
50,086 |
|
|
$ |
426 |
|
|
$ |
— |
|
|
$ |
50,512 |
|
|
|
|
|
|
|
|
|
|
|
|
|
|
|
|
|
|
|
|
|
|
|
|
|
|
|
|
|
|
|
Available for Sale: |
|
|
|
|
|
|
|
|
|
|
|
|
|
|
|
|
United States government-sponsored
enterprises debt |
|
$ |
3,397,204 |
|
|
$ |
14,137 |
|
|
$ |
(5,093 |
) |
|
$ |
3,406,248 |
|
Equity securities |
|
|
6,935 |
|
|
|
450 |
|
|
|
— |
|
|
|
7,385 |
|
| |
Total available for sale |
|
$ |
3,404,139 |
|
|
$ |
14,587 |
|
|
$ |
(5,093 |
) |
|
$ |
3,413,633 |
|
|
|
|
|
|
|
|
|
|
|
|
|
|
Page 53
The following tables summarize the fair values and unrealized losses of investment
securities with an unrealized loss at December 31, 2009 and 2008, and if the unrealized loss
position was for a continuous period of less than twelve months or longer than twelve months at the
respective dates.
| |
|
|
|
|
|
|
|
|
|
|
|
|
|
|
|
|
|
|
|
|
|
|
|
|
| |
|
Less Than 12 Months |
|
|
12 Months or Longer |
|
|
Total |
|
| |
|
|
|
|
|
Unrealized |
|
|
|
|
|
|
Unrealized |
|
|
|
|
|
|
Unrealized |
|
| |
|
Fair Value |
|
|
Losses |
|
|
Fair Value |
|
|
Losses |
|
|
Fair Value |
|
|
Losses |
|
| |
|
(In thousands) |
|
2009 |
|
|
|
|
|
|
|
|
|
|
|
|
|
|
|
|
|
|
|
|
|
|
|
|
Held to Maturity: |
|
|
|
|
|
|
|
|
|
|
|
|
|
|
|
|
|
|
|
|
|
|
|
|
United States government
-sponsored enterprises
debt |
|
$ |
3,930,974 |
|
|
$ |
(117,614 |
) |
|
$ |
— |
|
|
$ |
— |
|
|
$ |
3,930,974 |
|
|
$ |
(117,614 |
) |
| |
Total held to maturity |
|
|
3,930,974 |
|
|
|
(117,614 |
) |
|
|
— |
|
|
|
— |
|
|
|
3,930,974 |
|
|
|
(117,614 |
) |
| |
Available for Sale: |
|
|
|
|
|
|
|
|
|
|
|
|
|
|
|
|
|
|
|
|
|
|
|
|
United States government
-sponsored enterprises
debt |
|
|
472,545 |
|
|
|
(7,263 |
) |
|
|
263,730 |
|
|
|
(11,161 |
) |
|
|
736,275 |
|
|
|
(18,424 |
) |
| |
Total available for sale |
|
|
472,545 |
|
|
|
(7,263 |
) |
|
|
263,730 |
|
|
|
(11,161 |
) |
|
|
736,275 |
|
|
|
(18,424 |
) |
| |
Total |
|
$ |
4,403,519 |
|
|
$ |
(124,877 |
) |
|
$ |
263,730 |
|
|
$ |
(11,161 |
) |
|
$ |
4,667,249 |
|
|
$ |
(136,038 |
) |
|
|
|
|
|
|
|
|
|
|
|
|
|
|
|
|
|
|
|
2008 |
|
|
|
|
|
|
|
|
|
|
|
|
|
|
|
|
|
|
|
|
|
|
|
|
Available for Sale: |
|
|
|
|
|
|
|
|
|
|
|
|
|
|
|
|
|
|
|
|
|
|
|
|
United States government
-sponsored enterprises
debt |
|
$ |
594,907 |
|
|
$ |
(5,093 |
) |
|
$ |
— |
|
|
$ |
— |
|
|
$ |
594,907 |
|
|
$ |
(5,093 |
) |
| |
Total |
|
$ |
594,907 |
|
|
$ |
(5,093 |
) |
|
$ |
— |
|
|
$ |
— |
|
|
$ |
594,907 |
|
|
$ |
(5,093 |
) |
|
|
|
|
|
|
|
|
|
|
|
|
|
|
|
|
|
|
|
The unrealized losses are primarily due to changes in market interest rates subsequent to
purchase. At December 31, 2009, a total of 47 securities were in an unrealized loss position (6 at
December 31, 2008). We only purchase securities issued by GSEs and do not own any unrated or
private label securities or other high-risk securities such as those backed by sub-prime loans.
Accordingly, it is expected that the securities would not be settled at a price less than the
Company’s amortized cost basis. We do not consider these investments to be other-than-temporarily
impaired at December 31, 2009 and December 31, 2008 since the decline in market value is
attributable to changes in interest rates and not credit quality and the Company has the intent and
ability to hold these investments until there is a full recovery of the unrealized loss, which may
be at maturity. As a result no impairment loss has been recognized during the years ended December
31, 2009, 2008 and 2007, respectively.
The amortized cost and estimated fair market value of investment securities held to maturity and
available for sale at December 31, 2009, by contractual maturity, are shown below. The expected
maturity may differ from the contractual maturity because issuers may have the right to call or
prepay obligations. Equity securities have been excluded from this table.
Page 54
| |
|
|
|
|
|
|
|
|
| |
|
|
|
|
|
Estimated |
|
| |
|
Amortized |
|
|
Fair Market |
|
| |
|
Cost |
|
|
Value |
|
| |
|
(In thousands) |
|
Held to Maturity: |
|
|
|
|
|
|
|
|
Due after one year through five years |
|
$ |
105 |
|
|
$ |
105 |
|
Due after five years through ten years |
|
|
1,299,130 |
|
|
|
1,275,505 |
|
Due after ten years |
|
|
2,888,469 |
|
|
|
2,795,395 |
|
| |
Total held to maturity |
|
$ |
4,187,704 |
|
|
$ |
4,071,005 |
|
|
|
|
|
|
|
|
|
|
|
|
|
|
|
|
|
Available for Sale: |
|
|
|
|
|
|
|
|
Due after five years through ten years |
|
$ |
399,905 |
|
|
$ |
396,941 |
|
Due after ten years |
|
|
704,794 |
|
|
|
691,224 |
|
| |
Total available for sale |
|
$ |
1,104,699 |
|
|
$ |
1,088,165 |
|
|
|
|
|
|
|
|
There were sales of $168,000 of investment securities available-for-sale during 2009. There
were no sales of investment securities available-for-sale or held-to-maturity during the years
ended December 31, 2008 and 2007. Gross realized gains on sales and calls of investment securities
available for sale were$148,000 during 2009 and $6,000 during 2007 (none during 2008). The
carrying value of securities pledged as required security for deposits and for other purposes
required by law amounted to $20.1 million and $20.0 million at December 31, 2009 and 2008,
respectively.
6. Loans and Allowance for Loan Losses
Loans at December 31 are summarized as follows:
| |
|
|
|
|
|
|
|
|
| |
|
2009 |
|
|
2008 |
|
| |
|
(In thousands) |
|
First mortgage loans: |
|
|
|
|
|
|
|
|
One- to four-family |
|
$ |
31,076,829 |
|
|
$ |
28,931,237 |
|
FHA/VA |
|
|
285,003 |
|
|
|
20,197 |
|
Multi-family and commercial |
|
|
54,694 |
|
|
|
57,829 |
|
Construction |
|
|
13,030 |
|
|
|
24,830 |
|
| |
Total first mortgage loans |
|
|
31,429,556 |
|
|
|
29,034,093 |
|
| |
Consumer and other loans: |
|
|
|
|
|
|
|
|
Fixed–rate second mortgages |
|
|
201,375 |
|
|
|
262,538 |
|
Home equity credit lines |
|
|
127,987 |
|
|
|
101,751 |
|
Other |
|
|
21,003 |
|
|
|
20,506 |
|
| |
Total consumer and other loans |
|
|
350,365 |
|
|
|
384,795 |
|
| |
Total loans |
|
$ |
31,779,921 |
|
|
$ |
29,418,888 |
|
|
|
|
|
|
|
|
Originating loans secured by residential real estate is our primary business. Our financial
results may be adversely affected by changes in prevailing economic conditions, either nationally
or in our local New Jersey and metropolitan New York market areas, including decreases in real
estate values, adverse employment conditions, the monetary and fiscal policies of the federal and
state government and other significant external events. As a result of our lending practices, we
have a concentration of loans secured by real property located primarily in New Jersey, New York
and Connecticut. At December 31, 2009, approximately 73.8% of our total loans are in the New York
metropolitan area.
Page 55
Included in our loan portfolio at December 31, 2009 and 2008 are $4.59 billion and $3.47 billion,
respectively, of interest-only loans. These loans are originated as adjustable-rate mortgage
(“ARM”) loans with initial terms of five, seven or ten years with the interest-only portion of the
payment based upon the initial loan term, or offered on a 30-year fixed-rate loan, with
interest-only payments for the first 10 years of the obligation. At the end of the initial 5-, 7-
or 10-year interest-only period, the loan payment will adjust to include both principal and
interest and will amortize over the remaining term so the loan will be repaid at the end of its
original life. We had $82.2 million and $16.6 million of non-performing interest-only loans at
December 31, 2009 and 2008, respectively.
In addition to our full documentation loan program, we process loans to certain eligible borrowers
as limited documentation loans. We have originated these types of loans for over 15 years. Loans
eligible for limited documentation processing are ARM loans, interest-only first mortgage loans and
10-, 15-, 20-, 30- and 40-year fixed-rate loans to owner-occupied primary and second home
applicants. These loans are available in amounts up to 70% of the lower of the appraised value or
purchase price of the property. Generally the maximum loan amount for limited documentation loans
is $750,000 and these loans are subject to higher interest rates than our full documentation loan
products. We also allow certain borrowers to obtain mortgage loans without verification of income.
However, in these cases, we do verify the borrowers’ assets. These loans are subject to somewhat
higher interest rates than our regular products, and are generally limited to a maximum
loan-to-value ratio of 60%. Limited documentation and no income verification loans have an
inherently higher level of risk compared to loans with full documentation. We had $68.0 million
and $7.6 million of non-performing reduced-documentation loans at December 31, 2009 and 2008,
respectively.
The following table presents the geographic distribution of our loan portfolio as a percentage of
total loans and of our non-performing loans as a percentage of total non-performing loans.
| |
|
|
|
|
|
|
|
|
|
|
|
|
|
|
|
|
| |
|
At December 31, 2009 |
|
At December 31, 2008 |
| |
|
Total loans |
|
Non-performing loans |
|
Total loans |
|
Non-performing loans |
New Jersey |
|
|
43.0 |
% |
|
|
41.6 |
% |
|
|
44.8 |
% |
|
|
40.4 |
% |
New York |
|
|
18.2 |
|
|
|
18.0 |
|
|
|
15.6 |
|
|
|
22.6 |
|
Connecticut |
|
|
12.6 |
|
|
|
4.2 |
|
|
|
9.3 |
|
|
|
2.3 |
|
|
|
|
|
|
|
|
|
|
|
|
|
|
|
|
|
|
Total New York
metropolitan area |
|
|
73.8 |
|
|
|
63.8 |
|
|
|
69.7 |
|
|
|
65.3 |
|
|
|
|
|
|
|
|
|
|
|
|
|
|
|
|
|
|
|
|
|
|
|
|
|
|
|
|
|
|
|
|
|
|
|
Virginia |
|
|
4.6 |
|
|
|
6.2 |
|
|
|
5.5 |
|
|
|
4.2 |
|
Illinois |
|
|
3.9 |
|
|
|
5.6 |
|
|
|
4.3 |
|
|
|
3.5 |
|
Maryland |
|
|
3.5 |
|
|
|
5.1 |
|
|
|
4.2 |
|
|
|
5.4 |
|
Massachusetts |
|
|
2.7 |
|
|
|
2.3 |
|
|
|
3.0 |
|
|
|
2.7 |
|
Pennsylvania |
|
|
2.0 |
|
|
|
1.9 |
|
|
|
1.5 |
|
|
|
1.5 |
|
Minnesota |
|
|
1.4 |
|
|
|
1.8 |
|
|
|
1.8 |
|
|
|
3.8 |
|
Michigan |
|
|
1.3 |
|
|
|
4.2 |
|
|
|
1.7 |
|
|
|
3.7 |
|
All others |
|
|
6.8 |
|
|
|
9.1 |
|
|
|
8.3 |
|
|
|
9.9 |
|
|
|
|
|
|
|
|
|
|
|
|
|
|
|
|
|
|
Total Outside New
York
metropolitan area |
|
|
26.2 |
|
|
|
36.2 |
|
|
|
30.3 |
|
|
|
34.7 |
|
|
|
|
|
|
|
|
|
|
|
|
|
|
|
|
|
|
|
|
|
100.0 |
% |
|
|
100.0 |
% |
|
|
100.0 |
% |
|
|
100.0 |
% |
|
|
|
|
|
|
|
|
|
|
|
|
|
|
|
|
|
The ultimate ability to collect the loan portfolio is subject to changes in the real estate
market and future economic conditions. During 2009 and 2008, there was a decline in the housing
and real estate markets, both nationally and locally. Housing market conditions in the Northeast
quadrant of the United States, where most of our lending activity occurs, weakened during 2009 and
2008 as evidenced by reduced levels of sales, increasing inventories of houses on the market,
declining house prices, an increase in the length of time houses remain on the market and rising
unemployment levels.
Page 56
Although we believe that we have established and maintained the allowance for loan losses at
adequate levels, additions may be necessary if future economic and other conditions differ
substantially from the current operating environment. While we continue to adhere to prudent
underwriting standards, we are geographically concentrated in the New York metropolitan area of the
United States and, therefore, are not immune to negative consequences arising from overall economic
weakness and, in particular, a sharp downturn in the housing industry. Continued decreases in real
estate values could adversely affect the value of property used as collateral for our loans. No
assurance can be given in any particular case that our loan-to-value ratios will provide full
protection in the event of borrower default. Adverse changes in the economy and increasing
unemployment rates may have a negative effect on the ability of our borrowers to make timely loan
payments, which would have an adverse impact on our earnings. A further increase in loan
delinquencies would decrease our net interest income and may adversely impact our loss experience
on non-performing loans which may result in an increase in the loss factors used in our
quantitative analysis of the ALL, causing increases in our provision and allowance for loan losses.
Although we use the best information available, the level of the allowance for loan losses remains
an estimate that is subject to significant judgment and short-term change.
There were no loans held for sale at December 31, 2009 and 2008.
The following is a comparative summary of loans on which the accrual of income has been
discontinued and loans that are contractually past due 90 days or more but have not been classified
non-accrual at December 31:
| |
|
|
|
|
|
|
|
|
| |
|
2009 |
|
|
2008 |
|
| |
|
(In thousands) |
|
Non-accrual loans: |
|
|
|
|
|
|
|
|
One-to four-family |
|
$ |
581,786 |
|
|
$ |
200,642 |
|
Multi-family and commercial mortgages |
|
|
1,414 |
|
|
|
1,854 |
|
Construction loans |
|
|
6,624 |
|
|
|
7,610 |
|
Consumer loans |
|
|
1,916 |
|
|
|
626 |
|
|
|
|
|
|
|
|
Total non-accrual loans |
|
|
591,740 |
|
|
|
210,732 |
|
Accruing loans delinquent 90 days or more |
|
|
35,955 |
|
|
|
6,842 |
|
|
|
|
|
|
|
|
Total non-performing loans |
|
$ |
627,695 |
|
|
$ |
217,574 |
|
|
|
|
|
|
|
|
At December 31, 2009, approximately $402.8 million of our non-performing loans were in the New York
metropolitan area and $175.2 million were in other states in the Northeast quadrant of the United
States.
The total amount of interest income received during the year on non-accrual loans outstanding and
additional interest income on non-accrual loans that would have been recognized if interest on all
such loans had been recorded based upon original contract terms is immaterial. Hudson City is not
committed to lend additional funds to borrowers on non-accrual status.
At December 31, 2009 and 2008, loans evaluated for impairment in accordance with FASB guidance
amounted to $11.2 million and $9.5 million, respectively. Based on this evaluation, the allowance
for loan losses related to loans classified as impaired at December 31, 2009 and 2008 amounted to
$2.1 million and $818,000, respectively. Interest income received during the year on loans
classified as impaired was immaterial.
Page 57
An analysis of the allowance for loan losses at December 31 follows:
| |
|
|
|
|
|
|
|
|
|
|
|
|
| |
|
2009 |
|
|
2008 |
|
|
2007 |
|
| |
|
(In thousands) |
|
Balance at beginning of year |
|
$ |
49,797 |
|
|
$ |
34,741 |
|
|
$ |
30,625 |
|
|
|
|
|
|
|
|
|
|
|
Charge-offs |
|
|
(48,133 |
) |
|
|
(4,522 |
) |
|
|
(763 |
) |
Recoveries |
|
|
910 |
|
|
|
78 |
|
|
|
79 |
|
| |
Net charge-offs |
|
|
(47,223 |
) |
|
|
(4,444 |
) |
|
|
(684 |
) |
| |
Provision for loan losses |
|
|
137,500 |
|
|
|
19,500 |
|
|
|
4,800 |
|
| |
|
|
|
|
|
|
|
|
|
|
|
|
|
Balance at end of year |
|
$ |
140,074 |
|
|
$ |
49,797 |
|
|
$ |
34,741 |
|
|
|
|
|
|
|
|
|
|
|
7. Banking Premises and Equipment, net
A summary of the net carrying value of banking premises and equipment at December 31 is as follows:
| |
|
|
|
|
|
|
|
|
| |
|
2009 |
|
|
2008 |
|
| |
|
(In thousands) |
|
Land |
|
$ |
5,806 |
|
|
$ |
5,806 |
|
Buildings |
|
|
55,100 |
|
|
|
54,757 |
|
Leasehold improvements |
|
|
43,550 |
|
|
|
41,279 |
|
Furniture, fixtures and equipment |
|
|
78,998 |
|
|
|
75,756 |
|
| |
Total acquisition cost |
|
|
183,454 |
|
|
|
177,598 |
|
Accumulated depreciation and amortization |
|
|
(113,338 |
) |
|
|
(104,096 |
) |
| |
Total banking
premises and
equipment, net |
|
$ |
70,116 |
|
|
$ |
73,502 |
|
|
|
|
|
|
|
|
Amounts charged to net occupancy expense for depreciation and amortization of banking
premises and equipment amounted to $9.7 million, $10.2 million and $10.1 million in 2009, 2008 and
2007, respectively.
Hudson City has entered into non-cancelable operating lease agreements with respect to banking
premises and equipment. It is expected that many agreements will be renewed at expiration in the
normal course of business. Future minimum rental commitments required under operating leases that
have initial or remaining non-cancelable lease terms in excess of one year are as follows:
| |
|
|
|
|
| Year |
|
Amount |
|
| |
|
(in thousands) |
|
2010 |
|
$ |
8,974 |
|
2011 |
|
|
9,196 |
|
2012 |
|
|
9,106 |
|
2013 |
|
|
8,940 |
|
2014 |
|
|
8,755 |
|
Thereafter |
|
|
106,482 |
|
| |
Total |
|
$ |
151,453 |
|
|
|
|
|
Page 58
Net occupancy expense included gross rental expense for bank premises of $10.4 million, $9.4
million, and $8.5 million in 2009, 2008, and 2007, respectively, and rental income of $356,000,
$324,000, and $384,000 for the respective years.
8. Deposits
Deposits at December 31 are summarized as follows:
| |
|
|
|
|
|
|
|
|
|
|
|
|
|
|
|
|
|
|
|
|
|
|
|
|
| |
|
2009 |
|
|
2008 |
|
| |
|
|
|
|
|
|
|
|
|
Weighted |
|
|
|
|
|
|
|
|
|
|
Weighted |
|
| |
|
Balance |
|
|
Percent |
|
|
Average Rate |
|
|
Balance |
|
|
Percent |
|
|
Average Rate |
|
| |
|
(Dollars in thousands) |
|
Savings |
|
$ |
786,559 |
|
|
|
3.20 |
% |
|
|
0.74 |
% |
|
$ |
712,420 |
|
|
|
3.86 |
% |
|
|
0.76 |
% |
Noninterest-bearing demand |
|
|
586,041 |
|
|
|
2.38 |
|
|
|
— |
|
|
|
514,196 |
|
|
|
2.78 |
|
|
|
— |
|
Interest-bearing demand |
|
|
2,075,175 |
|
|
|
8.44 |
|
|
|
1.36 |
|
|
|
1,573,771 |
|
|
|
8.52 |
|
|
|
2.47 |
|
Money market |
|
|
5,058,842 |
|
|
|
20.59 |
|
|
|
1.38 |
|
|
|
2,716,429 |
|
|
|
14.72 |
|
|
|
2.87 |
|
Time deposits |
|
|
16,071,431 |
|
|
|
65.39 |
|
|
|
2.01 |
|
|
|
12,947,226 |
|
|
|
70.12 |
|
|
|
3.69 |
|
| |
Total deposits |
|
$ |
24,578,048 |
|
|
|
100.00 |
% |
|
|
1.74 |
% |
|
$ |
18,464,042 |
|
|
|
100.00 |
% |
|
|
3.25 |
% |
|
|
|
|
|
|
|
|
|
|
|
|
|
|
|
|
|
|
|
|
|
Time deposits of $100,000 or more amounted to $5.94 billion and $4.60 billion at December
31, 2009 and 2008, respectively. Interest expense on time deposits of $100,000 or more for the
years ended December 31, 2009, 2008 and 2007 was $112.1 million, $119.9 million, and $131.5
million, respectively. Included in noninterest-bearing demand accounts are mortgage escrow
deposits of $102.8 million and $98.7 million at December 31, 2009 and 2008, respectively.
Scheduled maturities of time deposits at December 31, 2009 are as follows:
| |
|
|
|
|
| Year |
|
Amount |
|
| |
|
(In thousands) |
|
2010 |
|
$ |
13,081,717 |
|
2011 |
|
|
2,146,191 |
|
2012 |
|
|
497,046 |
|
2013 |
|
|
85,380 |
|
2014 |
|
|
261,097 |
|
|
|
|
|
Total |
|
$ |
16,071,431 |
|
|
|
|
|
Page 59
9. Borrowed Funds
Borrowed funds at December 31 are summarized as follows:
| |
|
|
|
|
|
|
|
|
|
|
|
|
|
|
|
|
| |
|
2009 |
|
|
2008 |
|
| |
|
|
|
|
|
Weighted |
|
|
|
|
|
|
Weighted |
|
| |
|
|
|
|
|
Average |
|
|
|
|
|
|
Average |
|
| |
|
Principal |
|
|
Rate |
|
|
Principal |
|
|
Rate |
|
| |
|
(Dollars in thousands) |
|
Securities sold under agreements to repurchase: |
|
|
|
|
|
|
|
|
|
|
|
|
|
|
|
|
FHLB |
|
$ |
2,400,000 |
|
|
|
4.44 |
% |
|
$ |
2,400,000 |
|
|
|
4.44 |
% |
Other brokers |
|
|
12,700,000 |
|
|
|
3.93 |
|
|
|
12,700,000 |
|
|
|
3.91 |
|
| |
Total securities sold under
agreements to
repurchase |
|
|
15,100,000 |
|
|
|
4.01 |
|
|
|
15,100,000 |
|
|
|
3.99 |
|
|
|
|
|
|
|
|
|
|
|
|
|
|
|
|
|
|
Advances from the FHLB |
|
|
14,875,000 |
|
|
|
3.99 |
|
|
|
15,125,000 |
|
|
|
3.94 |
|
| |
Total borrowed funds |
|
$ |
29,975,000 |
|
|
|
4.00 |
% |
|
$ |
30,225,000 |
|
|
|
3.97 |
% |
|
|
|
|
|
|
|
|
|
|
|
|
|
|
|
Accrued interest payable |
|
$ |
141,828 |
|
|
|
|
|
|
$ |
138,351 |
|
|
|
|
|
The average balances of borrowings and the maximum amount outstanding at any month-end are
as follows:
| |
|
|
|
|
|
|
|
|
|
|
|
|
| |
|
At or for the Year Ended December 31, |
|
| |
|
2009 |
|
|
2008 |
|
|
2007 |
|
| |
|
(Dollars in thousands) |
|
Repurchase Agreements: |
|
|
|
|
|
|
|
|
|
|
|
|
Average balance outstanding during the year |
|
$ |
15,100,221 |
|
|
$ |
13,465,540 |
|
|
$ |
10,305,216 |
|
|
|
|
|
|
|
|
|
|
|
Maximum balance outstanding at any month-end
during the year |
|
$ |
15,100,000 |
|
|
$ |
15,100,000 |
|
|
$ |
12,016,000 |
|
|
|
|
|
|
|
|
|
|
|
Weighted average rate during the period |
|
|
4.05 |
% |
|
|
4.17 |
% |
|
|
4.20 |
% |
|
|
|
|
|
|
|
|
|
|
| |
FHLB Advances: |
|
|
|
|
|
|
|
|
|
|
|
|
Average balance outstanding during the year |
|
$ |
15,035,798 |
|
|
$ |
13,737,057 |
|
|
$ |
10,286,869 |
|
|
|
|
|
|
|
|
|
|
|
Maximum balance outstanding at any month-end
during the year |
|
$ |
15,575,000 |
|
|
$ |
15,125,000 |
|
|
$ |
12,125,000 |
|
|
|
|
|
|
|
|
|
|
|
Weighted average rate during the period |
|
|
4.01 |
% |
|
|
4.14 |
% |
|
|
4.28 |
% |
|
|
|
|
|
|
|
|
|
|
Page 60
Substantially all of our borrowed funds are callable at the discretion of the issuer after
an initial no-call period. At December 31, 2009, borrowed funds had scheduled maturities and
potential call dates as follows:
| |
|
|
|
|
|
|
|
|
|
|
|
|
|
|
|
|
| |
|
Borrowings by Scheduled |
|
|
Borrowings by Earlier of Scheduled |
|
| |
|
Maturity Date |
|
|
Maturity or Next Potential Call Date |
|
| |
|
|
|
|
|
Weighted |
|
|
|
|
|
|
Weighted |
|
| |
|
|
|
|
|
Average |
|
|
|
|
|
|
Average |
|
| Year |
|
Principal |
|
|
Rate |
|
|
Principal |
|
|
Rate |
|
| |
|
(Dollars in thousands) |
|
2010 |
|
$ |
300,000 |
|
|
|
5.68 |
% |
|
$ |
22,250,000 |
|
|
|
4.14 |
% |
2011 |
|
|
450,000 |
|
|
|
3.71 |
|
|
|
5,350,000 |
|
|
|
3.20 |
|
2012 |
|
|
250,000 |
|
|
|
3.55 |
|
|
|
1,050,000 |
|
|
|
4.15 |
|
2013 |
|
|
250,000 |
|
|
|
5.30 |
|
|
|
1,325,000 |
|
|
|
4.69 |
|
2014 |
|
|
350,000 |
|
|
|
3.37 |
|
|
|
— |
|
|
|
— |
|
2015 |
|
|
3,725,000 |
|
|
|
3.85 |
|
|
|
— |
|
|
|
— |
|
2016 |
|
|
7,100,000 |
|
|
|
4.31 |
|
|
|
— |
|
|
|
— |
|
2017 |
|
|
9,975,000 |
|
|
|
4.20 |
|
|
|
— |
|
|
|
— |
|
2018 |
|
|
5,850,000 |
|
|
|
3.13 |
|
|
|
— |
|
|
|
— |
|
2019 |
|
|
1,725,000 |
|
|
|
4.63 |
|
|
|
— |
|
|
|
— |
|
|
|
|
|
|
|
|
|
|
|
Total |
|
$ |
29,975,000 |
|
|
|
4.00 |
% |
|
$ |
29,975,000 |
|
|
|
4.00 |
% |
|
|
|
|
|
|
|
|
|
|
|
|
|
|
|
The amortized cost and fair value of the underlying securities used as collateral for
securities sold under agreements to repurchase, at or for the years ended December 31 are as
follows:
| |
|
|
|
|
|
|
|
|
|
|
|
|
| |
|
At or for the Year Ended December 31, |
|
| |
|
2009 |
|
|
2008 |
|
|
2007 |
|
| |
|
(Dollars in thousands) |
|
Amortized cost of collateral: |
|
|
|
|
|
|
|
|
|
|
|
|
United States government-sponsored
enterprise securities |
|
$ |
2,429,640 |
|
|
$ |
2,150,000 |
|
|
$ |
3,620,083 |
|
Mortgage-backed securities |
|
|
14,482,533 |
|
|
|
15,572,838 |
|
|
|
9,308,551 |
|
| |
Total amortized cost of collateral |
|
$ |
16,912,173 |
|
|
$ |
17,722,838 |
|
|
$ |
12,928,634 |
|
|
|
|
|
|
|
|
|
|
|
|
|
|
|
|
|
|
|
|
|
|
|
|
Fair value of collateral: |
|
|
|
|
|
|
|
|
|
|
|
|
United States government-sponsored
enterprise securities |
|
$ |
2,363,328 |
|
|
$ |
2,159,471 |
|
|
$ |
3,626,572 |
|
Mortgage-backed securities |
|
|
15,115,964 |
|
|
|
15,759,490 |
|
|
|
9,294,264 |
|
| |
Total fair value of collateral |
|
$ |
17,479,292 |
|
|
$ |
17,918,961 |
|
|
$ |
12,920,836 |
|
|
|
|
|
|
|
|
|
|
|
We have two collateralized borrowings in the form of repurchase agreements totaling $100.0
million with Lehman Brothers, Inc. that mature in the first quarter of 2013. Lehman Brothers, Inc.
is currently in liquidation under the Securities Industry Protection Act. Mortgage-backed
securities with an amortized cost of approximately $114.5 million are pledged as collateral for
these borrowings. We intend to pursue full recovery of the pledged collateral in accordance with
the contractual terms of the repurchase agreements. There can be no assurances that the final
settlement of this transaction will result in the full recovery of the collateral or the full
amount of the claim. We have not recognized a loss in our financial statements related to these
repurchase agreements.
At December 31, 2009, we had unused lines of credit available from the FHLB, other than repurchase
agreements, of up to $200.0 million. These lines of credit are renewed on an annual basis by the
FHLB.
Page 61
Our advances from the FHLB are secured by our investment in FHLB stock and by a blanket security
agreement. This agreement requires us to maintain as collateral certain qualifying assets (such as
one- to-four family residential mortgage loans) with a fair value, as defined, at least equal to
110% of any outstanding advances.
10. Employee Benefit Plans
a) Retirement and Other Postretirement Benefits
Non-contributory retirement and postretirement plans are maintained to cover employees hired prior
to August 1, 2005, including retired employees, who have met the eligibility requirements of the
plans. Benefits under the qualified and non-qualified defined benefit retirement plans are based
primarily on years of service and compensation. In 2005, participation in the non-contributory
retirement plan was restricted to those employees hired on or before July 31, 2005. Employees hired
on or after August 1, 2005 will not participate in the plan. Also in 2005, the plan for
postretirement benefits, other than pensions, was changed to restrict participation to those
employees hired on or before July 31, 2005, and placed a cap on the premium value of the
non-contributory coverage provided at the 2007 premium rate, beginning in 2008, for those eligible
employees who retire after December 31, 2005.
Funding of the qualified retirement plan is actuarially determined on an annual basis. It is our
policy to fund the qualified retirement plan sufficiently to meet the minimum requirements set
forth in the Employee Retirement Income Security Act of 1974. The non-qualified retirement plan,
for certain executive officers, is unfunded and had a projected benefit obligation of $17.1 million
at December 31, 2009 and $12.4 million at December 31, 2008. Certain health care and life
insurance benefits are provided to eligible retired employees (“other benefits”). Participants
generally become eligible for retiree health care and life insurance benefits after 10 years of
service. The measurement date for year-end disclosure information is December 31 and the
measurement date for net periodic benefit cost is January 1.
Page 62
The following table shows the change in benefit obligation, the change in plan assets, and the
funded status for the retirement plans and other benefits at December 31:
| |
|
|
|
|
|
|
|
|
|
|
|
|
|
|
|
|
| |
|
Retirement Plans |
|
|
Other Benefits |
|
| |
|
2009 |
|
|
2008 |
|
|
2009 |
|
|
2008 |
|
| |
|
(In thousands) |
|
Change in Benefit Obligation: |
|
|
|
|
|
|
|
|
|
|
|
|
|
|
|
|
Benefit obligation at beginning of year |
|
$ |
132,134 |
|
|
$ |
114,491 |
|
|
$ |
37,820 |
|
|
$ |
37,245 |
|
Service cost |
|
|
4,001 |
|
|
|
3,285 |
|
|
|
583 |
|
|
|
1,122 |
|
Interest cost |
|
|
7,776 |
|
|
|
6,675 |
|
|
|
1,884 |
|
|
|
2,272 |
|
Participant contributions |
|
|
— |
|
|
|
— |
|
|
|
46 |
|
|
|
40 |
|
Actuarial loss (gain) |
|
|
2,403 |
|
|
|
11,921 |
|
|
|
(4,197 |
) |
|
|
(1,116 |
) |
Benefits paid |
|
|
(4,486 |
) |
|
|
(4,238 |
) |
|
|
(1,915 |
) |
|
|
(1,851 |
) |
Medicare subsidy |
|
|
— |
|
|
|
— |
|
|
|
— |
|
|
|
108 |
|
| |
Benefit obligation at end of year |
|
|
141,828 |
|
|
|
132,134 |
|
|
|
34,221 |
|
|
|
37,820 |
|
| |
|
|
|
|
|
|
|
|
|
|
|
|
|
|
|
|
|
Change in Plan Assets: |
|
|
|
|
|
|
|
|
|
|
|
|
|
|
|
|
Fair value of plan assets at beginning
of year |
|
|
96,327 |
|
|
|
104,063 |
|
|
|
— |
|
|
|
— |
|
Actual return on plan assets |
|
|
16,595 |
|
|
|
(22,030 |
) |
|
|
— |
|
|
|
— |
|
Employer contributions |
|
|
35,332 |
|
|
|
18,532 |
|
|
|
1,869 |
|
|
|
1,811 |
|
Participant contributions |
|
|
— |
|
|
|
— |
|
|
|
46 |
|
|
|
40 |
|
Benefits paid |
|
|
(4,486 |
) |
|
|
(4,238 |
) |
|
|
(1,915 |
) |
|
|
(1,851 |
) |
| |
|
|
|
|
|
|
|
|
|
|
|
|
|
|
|
|
|
Fair value of plan assets at end of year |
|
|
143,768 |
|
|
|
96,327 |
|
|
|
— |
|
|
|
— |
|
| |
|
|
|
|
|
|
|
|
|
|
|
|
|
|
|
|
|
Funded status |
|
$ |
1,940 |
|
|
$ |
(35,807 |
) |
|
$ |
(34,221 |
) |
|
$ |
(37,820 |
) |
|
|
|
|
|
|
|
|
|
|
|
|
|
Funded status amounts recognized in the consolidated statements of financial condition at
December 31 consist of:
| |
|
|
|
|
|
|
|
|
|
|
|
|
|
|
|
|
| |
|
Retirement Plans |
|
Other Benefits |
| |
|
2009 |
|
2008 |
|
2009 |
|
2008 |
| |
|
(In thousands) |
Other assets |
|
$ |
1,940 |
|
|
$ |
— |
|
|
$ |
— |
|
|
$ |
— |
|
Accrued expenses
and other
liabilities |
|
|
— |
|
|
|
(35,807 |
) |
|
|
(34,221 |
) |
|
|
(37,820 |
) |
Pre-tax amounts recognized as components of total accumulated other comprehensive income at
December 31 consist of:
| |
|
|
|
|
|
|
|
|
|
|
|
|
|
|
|
|
| |
|
Retirement Plans |
|
|
Other Benefits |
|
| |
|
2009 |
|
|
2008 |
|
|
2009 |
|
|
2008 |
|
| |
|
|
|
|
|
(In thousands) |
|
|
|
|
|
Net actuarial loss |
|
$ |
47,981 |
|
|
$ |
55,748 |
|
|
$ |
8,301 |
|
|
$ |
11,261 |
|
Prior service cost
(credit) |
|
|
2,239 |
|
|
|
2,577 |
|
|
|
(22,470 |
) |
|
|
(24,035 |
) |
| |
Total |
|
$ |
50,220 |
|
|
$ |
58,325 |
|
|
$ |
(14,169 |
) |
|
$ |
(12,774 |
) |
|
|
|
|
|
|
|
|
|
|
|
|
|
The accumulated benefit obligation for all defined benefit retirement plans was $120.9
million and $113.7 million at December 31, 2009 and 2008, respectively.
Page 63
Net periodic benefit cost for the years ended December 31 included the following components:
| |
|
|
|
|
|
|
|
|
|
|
|
|
|
|
|
|
|
|
|
|
|
|
|
|
| |
|
Retirement Plans |
|
|
Other Benefits |
|
| |
|
2009 |
|
|
2008 |
|
|
2007 |
|
|
2009 |
|
|
2008 |
|
|
2007 |
|
| |
|
(In thousands) |
|
Net periodic benefit cost: |
|
|
|
|
|
|
|
|
|
|
|
|
|
|
|
|
|
|
|
|
|
|
|
|
Service cost |
|
$ |
4,001 |
|
|
$ |
3,285 |
|
|
$ |
3,358 |
|
|
$ |
583 |
|
|
$ |
1,122 |
|
|
$ |
945 |
|
Interest cost |
|
|
7,776 |
|
|
|
6,675 |
|
|
|
6,392 |
|
|
|
1,884 |
|
|
|
2,272 |
|
|
|
2,058 |
|
Expected return on assets |
|
|
(8,575 |
) |
|
|
(8,530 |
) |
|
|
(8,269 |
) |
|
|
— |
|
|
|
— |
|
|
|
— |
|
Amortization of: |
|
|
|
|
|
|
|
|
|
|
|
|
|
|
|
|
|
|
|
|
|
|
|
|
Net actuarial loss |
|
|
3,686 |
|
|
|
252 |
|
|
|
284 |
|
|
|
301 |
|
|
|
687 |
|
|
|
575 |
|
Prior service cost (credit) |
|
|
338 |
|
|
|
325 |
|
|
|
300 |
|
|
|
(1,565 |
) |
|
|
(1,565 |
) |
|
|
(1,565 |
) |
| |
Net periodic benefit cost |
|
|
7,226 |
|
|
|
2,007 |
|
|
|
2,065 |
|
|
|
1,203 |
|
|
|
2,516 |
|
|
|
2,013 |
|
|
|
|
|
|
|
|
|
|
|
|
|
|
|
|
|
|
|
|
|
|
|
|
|
|
Other changes in plan assets
and benefit obligations recognized
in other comprehensive income: |
|
|
|
|
|
|
|
|
|
|
|
|
|
|
|
|
|
|
|
|
|
|
|
|
Net actuarial (gain) loss |
|
|
(4,081 |
) |
|
|
41,275 |
|
|
|
3,878 |
|
|
|
(2,659 |
) |
|
|
(1,116 |
) |
|
|
(74 |
) |
Prior service cost (credit) |
|
|
— |
|
|
|
— |
|
|
|
677 |
|
|
|
— |
|
|
|
— |
|
|
|
(1,537 |
) |
Amortization of net actuarial loss |
|
|
(3,686 |
) |
|
|
(252 |
) |
|
|
(284 |
) |
|
|
(301 |
) |
|
|
(687 |
) |
|
|
(575 |
) |
Amortization of prior service cost |
|
|
(338 |
) |
|
|
(325 |
) |
|
|
(300 |
) |
|
|
1,565 |
|
|
|
1,565 |
|
|
|
1,565 |
|
| |
Total recognized in other comprehensive
income |
|
|
(8,105 |
) |
|
|
40,698 |
|
|
|
3,971 |
|
|
|
(1,395 |
) |
|
|
(238 |
) |
|
|
(621 |
) |
| |
|
|
|
|
|
|
|
|
|
|
|
|
|
|
|
|
|
|
|
|
|
|
|
|
|
Total recognized in net periodic benefit
cost and other comprehensive income |
|
$ |
(879 |
) |
|
$ |
42,705 |
|
|
$ |
6,036 |
|
|
$ |
(192 |
) |
|
$ |
2,278 |
|
|
$ |
1,392 |
|
|
|
|
|
|
|
|
|
|
|
|
|
|
|
|
|
|
|
|
The estimated net actuarial loss and prior service cost for the defined benefit pension
plans that will be amortized from accumulated other comprehensive income into net periodic benefit
cost during 2010 are $2.7 million and $339,000, respectively. The estimated net actuarial loss and prior
service credit for other defined benefit post-retirement plans that will be amortized from
accumulated other comprehensive income into net periodic benefit cost
during 2010 are $264,000 and
($1.6) million, respectively.
The following are the weighted average assumptions used to determine net periodic benefit cost for
the years ended December 31:
| |
|
|
|
|
|
|
|
|
|
|
|
|
|
|
|
|
|
|
|
|
|
|
|
|
| |
|
Retirement Plans |
|
Other Benefits |
| |
|
2009 |
|
2008 |
|
2007 |
|
2009 |
|
2008 |
|
2007 |
| |
Discount rate |
|
|
5.75 |
% |
|
|
6.00 |
% |
|
|
6.00 |
% |
|
|
5.75 |
% |
|
|
6.00 |
% |
|
|
6.00 |
% |
Expected return on assets |
|
|
8.25 |
|
|
|
8.25 |
|
|
|
8.25 |
|
|
|
— |
|
|
|
— |
|
|
|
— |
|
Rate of compensation
increase |
|
|
4.25 |
|
|
|
4.25 |
|
|
|
4.25 |
|
|
|
— |
|
|
|
— |
|
|
|
— |
|
The following are the weighted-average assumptions used to determine benefit obligations at
December 31:
| |
|
|
|
|
|
|
|
|
|
|
|
|
|
|
|
|
| |
|
Retirement Plans |
|
Other Benefits |
| |
|
2009 |
|
2008 |
|
2009 |
|
2008 |
| |
Discount rate |
|
|
6.00 |
% |
|
|
5.75 |
% |
|
|
5.75 |
% |
|
|
5.75 |
% |
Rate of
compensation
increase |
|
|
4.00 |
|
|
|
4.00 |
|
|
|
— |
|
|
|
— |
|
Page 64
The overall expected return on assets assumption is based on the historical performance of
the pension fund. The average return over the past ten years was determined for the market value
of assets, which is the value used in the calculation of annual net periodic benefit cost.
The assumed health care cost trend rate used to measure the expected cost of other benefits for
2009 was 8.5%. The rate was assumed to decrease gradually to 4.75% for 2016 and remain at that
level thereafter.
A 1% change in the assumed health care cost trend rate would have the following effects on other
benefits:
| |
|
|
|
|
|
|
|
|
| |
|
1% Increase |
|
1% Decrease |
| |
| |
|
(in thousands) |
Effect on total service cost
and interest cost |
|
$ |
35 |
|
|
$ |
(81 |
) |
Effect on other benefit obligations |
|
|
476 |
|
|
|
(51 |
) |
Funds in Hudson City’s qualified retirement plan are invested in a commingled asset allocation fund
(the “Fund”) of a well-established asset management company and in Hudson City Bancorp, Inc. common
stock. The purpose of the Fund is to provide a diversified portfolio of equities, fixed income
instruments and cash. The plan trustee, in its absolute discretion, manages the Fund. The Fund is
maintained with the objective of providing investment results that outperform a static mix of 55%
equity, 35% bond and 10% cash, as well as the median manager of balanced funds. In order to
achieve the Fund’s return objective, the Fund will combine fundamental analysis and a quantitative
proprietary model to allocate and reallocate assets among the three broad investment categories of
equities, money market instruments and other fixed income obligations. As market and economic
conditions change, these ratios will be adjusted in moderate increments of about five percentage
points. It is intended that the equity portion will represent approximately 40% to 70%, the bond
portion approximately 25% to 55% and the money market portion 0% to 25%. Performance results are
reviewed at least annually with the asset management company of the Fund.
Equity securities held by the Fund include Hudson City Bancorp, Inc. common stock in the
amount of $9.6 million (6.7% of total plan assets) as of December 31, 2009, and $11.2 million
(11.6% of total plan assets) as of December 31, 2008. This stock was purchased at an aggregate cost
of $6.0 million using a cash contribution made by Hudson City Savings in July 2003. Our plan may
not purchase our common stock if, after the purchase, the fair value of our common stock held by the plan equals or
exceeds 10% of the fair value of plan assets. We review with the plan administrator the rebalancing
of plan assets if the fair value of our common stock held by the plan exceeds 20% of the fair value
of the total plan assets.
Page 65
The following table presents the fair value of the retirement plan’s assets at December 31,
2009 by asset class:
| |
|
|
|
|
|
|
|
|
|
|
|
|
|
|
|
|
| |
|
|
|
|
|
Fair Value Measurements at December 31, 2009 |
|
| |
|
|
|
|
|
Quoted Prices in Active |
|
|
Significant Other |
|
|
Significant |
|
| |
|
Carrying |
|
|
Markets for Identical |
|
|
Observable Inputs |
|
|
Unobservable |
|
| Asset Class |
|
Value |
|
|
Assets (Level 1) |
|
|
(Level 2) |
|
|
Inputs (Level 3) |
|
| |
|
(In thousands) |
|
Cash |
|
|
8,732 |
|
|
|
8,732 |
|
|
|
— |
|
|
|
— |
|
Guaranteed deposit
fund (a) |
|
|
12,059 |
|
|
|
— |
|
|
|
— |
|
|
|
12,059 |
|
Equity Securities (b) |
|
|
78,475 |
|
|
|
78,475 |
|
|
|
— |
|
|
|
— |
|
Fixed income
securities (c) |
|
|
44,502 |
|
|
|
44,502 |
|
|
|
— |
|
|
|
— |
|
|
|
|
|
|
|
|
|
|
|
|
|
|
|
|
$ |
143,768 |
|
|
$ |
131,709 |
|
|
$ |
— |
|
|
$ |
12,059 |
|
|
|
|
|
|
|
|
|
|
|
|
|
|
|
|
|
| (a) |
|
The Guaranteed Deposit Fund (the “Fund”) is an investment in the general account of the
Prudential Retirement Insurance and Annuity Company and represents an insurance claim
supported by all general account assets. |
| |
| |
|
The Fund’s assets are intermediate-term, high-grade fixed income securities consisting of
commercial mortgages, private placement bonds, publicly-traded debt securities and
asset-backed securities. |
| |
| (b) |
|
This class includes mutual funds that invest primarily in companies listed in the Russell 1000 Growth Index and Russell 1000 Value
Index. The objectives of the mutual funds are to outperform these indices. The mutual
funds also invest in other equity securities, derivative instruments and cash-equivalent
securities or funds. This class also includes $9.6 million of Hudson City Bancorp, Inc.
common stock. |
| |
| (c) |
|
This class includes a mutual fund that invests in international, emerging markets and
high-yield fixed income markets. |
The following table presents a reconciliation of Level 3 assets measured at fair value for
the period of January 1, 2009 to December 31, 2009:
| |
|
|
|
|
| |
|
Fair Value Measurements Using |
|
| |
|
Significant Unobservable Inputs (Level 3) |
|
| |
|
(In thousands) |
|
| |
|
Guaranteed |
|
| |
|
Deposit Fund |
|
Beginning balance at December 31, 2008 |
|
$ |
12,273 |
|
Purchases, sales, issuances and
settlements (net) |
|
|
(214 |
) |
Transfer into level 3 |
|
|
— |
|
|
|
|
|
Ending balance at December 31, 2009 |
|
$ |
12,059 |
|
|
|
|
|
We contributed $35.0 million to the qualified retirement plan’s assets in 2009. We expect to
contribute $10.0 million during 2010.
Page 66
The following benefit payments, which reflect expected future service, as appropriate, are expected
to be paid under the current provisions of the plans.
| |
|
|
|
|
|
|
|
|
| |
|
Retirement |
|
Other |
| Year |
|
Plans |
|
Benefits |
| |
|
(In thousands) |
2010 |
|
$ |
5,431 |
|
|
$ |
2,307 |
|
2011 |
|
|
5,737 |
|
|
|
2,440 |
|
2012 |
|
|
6,113 |
|
|
|
2,581 |
|
2013 |
|
|
7,375 |
|
|
|
2,710 |
|
2014 |
|
|
7,927 |
|
|
|
2,819 |
|
2015 through 2019 |
|
|
50,083 |
|
|
|
14,926 |
|
b) Employee Stock Ownership Plan
The ESOP is a tax-qualified plan designed to invest primarily in Hudson City common stock that
provides employees with the opportunity to receive an employer-funded retirement benefit based
primarily on the value of Hudson City common stock.
Employees are generally eligible to participate in the ESOP after one year of service
providing they worked at least 1,000 hours during the plan year and attained age 21.
Participants who do not have at least 1,000 hours of service during the plan year or are not
employed on the last working day of a plan year are generally not eligible for an allocation of
stock for such year.
The ESOP was authorized to purchase 27,879,385
shares following our initial public offering and an additional 15,719,223 shares following our
second-step conversion. The ESOP administrator did purchase, in aggregate, 43,598,608 shares of
Hudson City common stock at an average price of $5.69 per share with loans from Hudson City
Bancorp.
The combined outstanding loan principal at December 31, 2009 was $231.9 million. Those shares
purchased were pledged as collateral for the loan and are released from the pledge for allocation
to participants as loan payments are made. The loan will be repaid and the shares purchased will be
allocated to employees in equal installments of 962,185 shares per
year over a forty-year period.
The annual allocation of shares is based on the ratio of a participant’s eligible compensation,
as defined in the ESOP document, as a percentage of total eligible compensation of all
participants in the ESOP. Dividends on allocated and unallocated shares, to the extent that they
exceed the scheduled principal and interest payments on the ESOP loan, are paid to participants
in cash.
Through December 31, 2008, a total of 9,922,144 shares have been allocated to participants. For
the plan year ended December 31, 2009, there are 962,185 shares that are committed to be released
and will be allocated to participants. Unallocated ESOP shares held in suspense totaled 33,676,464
at December 31, 2009 and had a fair market value of $462.4 million. ESOP compensation expense for
the years ended December 31, 2009, 2008 and 2007 was $20.8 million, $23.0 million, and $17.3
million, respectively.
The ESOP restoration plan is a non-qualified plan that provides supplemental benefits to certain
executives who are prevented from receiving the full benefits contemplated by the employee stock
ownership plan’s benefit formula. The supplemental cash payments consist of payments representing
shares that cannot be allocated to participants under the ESOP due to the legal limitations imposed
on tax-qualified plans and, in the case of participants who retire before the repayment in full of
the ESOP’s loan, payments representing the shares that would have been allocated if employment had
continued through the full term of the loan. We accrue for these benefits over the period during
which employees provide services to earn these benefits. At December 31, 2009 and 2008, we had
accrued $33.3 million and $30.0 million, respectively for the ESOP restoration plan. During 2007,
two former executives received benefit payments from the ESOP restoration plan and no longer
participate in the plan. Compensation expense related to this plan amounted to $3.7 million, $6.5
million and $5.8 million in 2009, 2008, and 2007, respectively.
c) Recognition and Retention Plans
Hudson City Bancorp granted stock awards pursuant to the Recognition and Retention Plan (the “RRP)
established in January 2000 and the Stock Incentive Plan (the “SIP Plan”) established in January
2006. The
Page 67
purpose of both plans is to promote the growth and profitability of Hudson City Bancorp by
providing directors, officers and employees with an equity interest in Hudson City Bancorp as an
incentive to achieve corporate goals. The plans have invested primarily in shares of Hudson City
common stock that were used to make restricted stock awards. Expense for both plans in the amount
of the fair value of the common stock at the date of grant is recognized ratably over the vesting
period.
The RRP were authorized, in the aggregate, to purchase not more than 14,901,480 shares of common
stock, and have purchased 14,887,855 shares on the open market at an average price of $2.91 per
share. Generally, restricted stock grants are held in escrow for the benefit of the award recipient
until vested. Awards outstanding generally vest in five annual installments commencing one year
from the date of the award. As of December 31, 2009, common stock that had not been awarded
totaled 13,625 shares.
During 2009, the Compensation Committee authorized performance-based stock awards (the “2009 stock
awards”) pursuant to the SIP Plan for 847,750 shares of our common stock. These shares were issued
from treasury stock and will vest in annual installments over a three-year period if certain
performance measures are met and employment continues through the vesting date. None of these
shares may be sold or transferred before the January 2012 vesting date. We have determined that it
is probable these performance measures will be met and have therefore recorded compensation expense
for the 2009 stock awards. Expense for the 2009 stock awards is recognized over the vesting period
and is based on the fair value of the shares on the grant date which was $12.03. Expense
attributable to both plans amounted to $4.6 million, $1.4 million and $1.6 million for the years
ended December 31, 2009, 2008 and 2007, respectively.
A summary of the status of the granted, but unvested shares under the RRP and SIP Plan as of
December 31, and changes during those years, is presented below:
| |
|
|
|
|
|
|
|
|
|
|
|
|
|
|
|
|
|
|
|
|
|
|
|
|
| |
|
Restricted Stock Awards |
| |
|
2009 |
|
2008 |
|
2007 |
| |
|
|
|
|
|
Weighted |
|
|
|
|
|
Weighted |
|
|
|
|
|
Weighted |
| |
|
|
|
|
|
Average |
|
|
|
|
|
Average |
|
|
|
|
|
Average |
| |
|
Number of |
|
Grant Date |
|
Number of |
|
Grant Date |
|
Number of |
|
Grant Date |
| |
|
Shares |
|
Fair Value |
|
Shares |
|
Fair Value |
|
Shares |
|
Fair Value |
| |
Outstanding at beginning of period |
|
|
224,417 |
|
|
$ |
11.73 |
|
|
|
350,576 |
|
|
$ |
11.74 |
|
|
|
540,851 |
|
|
$ |
11.57 |
|
Granted |
|
|
847,750 |
|
|
|
12.03 |
|
|
|
— |
|
|
|
— |
|
|
|
— |
|
|
|
— |
|
Vested |
|
|
(112,211 |
) |
|
|
11.73 |
|
|
|
(126,159 |
) |
|
|
11.75 |
|
|
|
(190,275 |
) |
|
|
11.27 |
|
| |
|
|
|
|
|
|
|
|
|
|
|
|
|
|
|
|
|
|
|
|
|
|
|
|
|
Outstanding at end of period |
|
|
959,956 |
|
|
$ |
12.00 |
|
|
|
224,417 |
|
|
$ |
11.73 |
|
|
|
350,576 |
|
|
$ |
11.74 |
|
|
|
|
|
|
|
|
|
|
|
|
|
|
|
|
|
|
|
|
|
|
|
|
|
|
The per share weighted-average vesting date fair value of the shares vested during 2009,
2008, and 2007 was $12.56, $18.47, and $13.46, respectively.
d) Stock Option Plans
In accordance with FASB guidance on stock compensation, compensation expense is recognized for new
stock-based awards granted after January 1, 2006, awards modified, repurchased or cancelled after
January 1, 2006, and the remaining portion of the requisite service under previously granted
unvested awards outstanding as of January 1, 2006 based upon the grant-date fair value of those
awards. There was no impact of the adoption on previously reported periods, in accordance with the
transition FASB guidance.
Each stock option granted entitles the holder to purchase one share of Hudson City’s common stock
at an exercise price not less than the fair market value of a share of common stock at the date of
grant. Options granted generally vest over a five year period from the date of grant and will
expire no later than 10 years following the grant date. Under the Hudson City stock option plans
existing prior to 2006, 36,323,960 shares of
Page 68
Hudson City Bancorp, Inc. common stock have been reserved for issuance. Directors and employees
have been granted 36,503,507 stock options, including 240,819 shares previously issued, but
forfeited by plan participants prior to exercise.
In June 2006, our shareholders approved the Hudson City Bancorp, Inc. 2006 Stock Incentive Plan
(the “SIP Plan”) authorizing us to grant up to 30,000,000 shares of common stock. In July 2006, the
Compensation Committee of the Board of Directors of Hudson City Bancorp (the “Committee”),
authorized grants to each non-employee director, executive officers and other employees to purchase
shares of the Company’s common stock, pursuant to the SIP Plan. Grants were made in 2006, 2007 and
2008 pursuant to the SIP Plan for 7,960,000, 3,527,500 and 4,025,000 options, respectively, at an
exercise price equal to the fair value of our common stock on the grant date, based on quoted
market prices. Of these options, 5,035,000 have vesting periods ranging from one to five years and
an expiration period of ten years (“Retention Options”). The remaining 10,477,500 shares have vesting periods ranging
from two to three years if certain financial performance measures are
met (“Performance Options”). Subject to review and
verification by the Committee, we believe we attained these performance measures and have therefore
recorded compensation expense for the 2006, 2007 and 2008 grants.
During 2009, the Committee authorized stock option grants (the “2009 grants”) pursuant to the SIP
Plan for 3,375,000 options at an exercise price equal to the fair value of our common stock on the
grant date, based on quoted market prices. Of these options, 2,875,000 will vest in January 2012 if
certain financial performance measures are met and employment
continues through the vesting date (“2009 Performance Options”).
The remaining 500,000 options will vest between January 2010 and
April 2010 (“2009 Retention Options”). The 2009 grants have
an expiration period of ten years. We have determined that it is probable these performance
measures will be met and have therefore recorded compensation expense for the 2009 grants.
The dividend yield assumption for the 2009, 2008 and 2007 grants were based on our current
declared dividend as a percentage of the stock price on the grant date. The expected volatility
assumption for 2009, 2008 and 2007 were calculated based on the weighting of our historical and
rolling volatility for the expected term of the option grants. The risk-free interest rate was
determined for 2009, 2008, and 2007 by reference to the continuously compounded yield on Treasury
obligations for the expected term.
The expected option life was based on historic optionee behavior for prior option grant awards.
The fair values of the 2009, 2008 and 2007 grants were estimated on the date of grant using
the Black-Scholes option-pricing model with the following weighted average assumptions.
| |
|
|
|
|
|
|
|
|
|
|
|
|
|
|
|
|
|
|
|
|
|
|
|
|
| |
|
2009 |
|
2008 |
|
2007 |
| |
|
2009 Retention Options |
|
2009 Performance Options |
|
Retention Options |
|
Performance Options |
|
Retention Options |
|
Performance Options |
| |
Expected dividend yield |
|
|
4.80 |
% |
|
|
4.80 |
% |
|
|
2.30 |
% |
|
|
2.30 |
% |
|
|
2.32 |
% |
|
|
2.32 |
% |
Expected volatility |
|
|
33.43 |
|
|
|
29.08 |
|
|
|
19.59 |
|
|
|
20.75 |
|
|
|
16.72 |
|
|
|
19.50 |
|
Risk-free interest rate |
|
|
1.29 |
|
|
|
1.75 |
|
|
|
2.41 |
|
|
|
2.88 |
|
|
|
4.90 |
|
|
|
4.87 |
|
Expected option life |
|
|
3.5 years |
|
|
|
5.5 years |
|
|
|
3.5 years |
|
|
|
5.5 years |
|
|
|
3.5 years |
|
|
|
5.5 years |
|
Fair value of options granted |
|
$ |
2.05 |
|
|
$ |
1.92 |
|
|
$ |
2.14 |
|
|
$ |
2.85 |
|
|
$ |
2.10 |
|
|
$ |
2.88 |
|
Compensation expense related to our outstanding stock options amounted to $12.9 million,
$15.0 million and $12.2 million for the years ended December 31, 2009, 2008 and 2007, respectively.
Page 69
A summary of the status of the granted, but unexercised stock options as of December 31, and
changes during those years, is presented below:
| |
|
|
|
|
|
|
|
|
|
|
|
|
|
|
|
|
|
|
|
|
|
|
|
|
| |
|
2009 |
|
2008 |
|
2007 |
| |
|
|
|
|
|
Weighted |
|
|
|
|
|
Weighted |
|
|
|
|
|
Weighted |
| |
|
Number of |
|
Average |
|
Number of |
|
Average |
|
Number of |
|
Average |
| |
|
Stock |
|
Exercise |
|
Stock |
|
Exercise |
|
Stock |
|
Exercise |
| |
|
Options |
|
Price |
|
Options |
|
Price |
|
Options |
|
Price |
| |
Outstanding at beginning of year |
|
|
26,728,119 |
|
|
$ |
10.35 |
|
|
|
29,080,114 |
|
|
$ |
7.91 |
|
|
|
26,979,989 |
|
|
$ |
6.89 |
|
Granted |
|
|
3,375,000 |
|
|
|
12.11 |
|
|
|
4,025,000 |
|
|
|
15.96 |
|
|
|
3,527,500 |
|
|
|
13.74 |
|
Exercised |
|
|
(5,840,427 |
) |
|
|
2.30 |
|
|
|
(6,325,277 |
) |
|
|
2.69 |
|
|
|
(1,360,635 |
) |
|
|
2.67 |
|
Forfeited |
|
|
— |
|
|
|
— |
|
|
|
(51,718 |
) |
|
|
13.10 |
|
|
|
(66,740 |
) |
|
|
10.03 |
|
| |
Outstanding at end of year |
|
|
24,262,692 |
|
|
$ |
12.51 |
|
|
|
26,728,119 |
|
|
$ |
10.35 |
|
|
|
29,080,114 |
|
|
$ |
7.91 |
|
|
|
|
|
|
|
|
|
|
|
|
|
|
|
|
|
|
|
|
|
|
|
|
|
|
Shares issued upon the exercise of stock options are issued from treasury stock. Hudson City
has an adequate number of treasury shares available for sale for future stock option exercises. The
total intrinsic value of the options exercised during 2009, 2008 and 2007 was $63.0 million, $92.4
million, and $15.0 million, respectively.
The following table summarizes information about our stock options outstanding at December 31,
2009:
| |
|
|
|
|
|
|
|
|
|
|
|
|
|
|
|
|
|
|
| Options Outstanding |
|
Options Exercisable |
| |
|
|
|
Weighted |
|
|
|
|
|
|
|
|
| |
|
|
|
Average |
|
Weighted |
|
|
|
|
|
Weighted |
| Number |
|
Remaining |
|
Average |
|
Number |
|
Average |
| Of Options |
|
Contractual |
|
Exercise |
|
Of Options |
|
Exercise |
| Outstanding |
|
Life |
|
Price |
|
Exercisable |
|
Price |
| |
|
46,000 |
|
|
1 month |
|
$ |
2.16 |
|
|
|
46,000 |
|
|
$ |
2.16 |
|
|
121,383 |
|
|
1 year |
|
|
3.09 |
|
|
|
121,383 |
|
|
|
3.09 |
|
|
820,736 |
|
|
1 year |
|
|
3.59 |
|
|
|
820,736 |
|
|
|
3.59 |
|
|
63,801 |
|
|
2 years |
|
|
4.20 |
|
|
|
63,801 |
|
|
|
4.20 |
|
|
614,440 |
|
|
2 years |
|
|
5.53 |
|
|
|
614,440 |
|
|
|
5.53 |
|
|
131,395 |
|
|
3 years |
|
|
5.96 |
|
|
|
131,395 |
|
|
|
5.96 |
|
|
206,480 |
|
|
3 years |
|
|
6.35 |
|
|
|
206,480 |
|
|
|
6.35 |
|
|
448,840 |
|
|
4 years |
|
|
10.33 |
|
|
|
448,840 |
|
|
|
10.33 |
|
|
417,184 |
|
|
5 years |
|
|
11.17 |
|
|
|
329,320 |
|
|
|
11.17 |
|
|
305,592 |
|
|
4 years |
|
|
11.91 |
|
|
|
297,201 |
|
|
|
11.91 |
|
|
2,299,341 |
|
|
4 years |
|
|
12.22 |
|
|
|
1,840,875 |
|
|
|
12.22 |
|
|
8,055,000 |
|
|
6.5 years |
|
|
12.76 |
|
|
|
6,895,000 |
|
|
|
12.76 |
|
|
350,000 |
|
|
7.5 years |
|
|
13.35 |
|
|
|
350,000 |
|
|
|
13.35 |
|
|
3,182,500 |
|
|
7 years |
|
|
13.78 |
|
|
|
157,500 |
|
|
|
13.78 |
|
|
3,475,000 |
|
|
8 years |
|
|
15.69 |
|
|
|
25,000 |
|
|
|
15.69 |
|
|
350,000 |
|
|
8 years |
|
|
18.84 |
|
|
|
350,000 |
|
|
|
18.84 |
|
|
350,000 |
|
|
9 years |
|
|
12.81 |
|
|
|
— |
|
|
|
12.81 |
|
|
3,025,000 |
|
|
9 years |
|
|
12.03 |
|
|
|
25,000 |
|
|
|
12.03 |
|
| |
|
24,262,692 |
|
|
|
|
|
|
$ |
12.51 |
|
|
|
12,722,971 |
|
|
$ |
11.45 |
|
|
|
|
|
|
|
|
|
|
|
|
|
|
|
|
|
|
|
|
The total intrinsic value of the options outstanding and options exercisable were $29.6
million and $29.0 million, respectively, as of December 31, 2009. At December 31, 2009, unearned
compensation costs related to
all nonvested awards of options and restricted stock not yet recognized totaled $34.0 million, and
will be recognized over a weighted-average period of approximately 2.3 years.
Page 70
e) Incentive Plans
A tax-qualified profit sharing and savings plan is maintained based on Hudson City’s profitability.
All employees are eligible after one year of employment and the attainment of age 21. Expense
related to this plan was $3.0 million, $2.0 million, and $1.8 million in 2009, 2008 and 2007,
respectively.
Certain incentive plans are maintained to recognize key executives who are able to make substantial
contributions to the long-term success and financial strength of Hudson City. At the end of each
performance period, the value of the award is determined in accordance with established criteria.
Participants can elect cash payment or elect to defer the award until retirement. The expense
related to these plans was $7.3 million, $6.2 million, and $4.8 million in 2009, 2008 and 2007,
respectively.
11. Income Taxes
Income tax expense (benefit) is summarized as follows for the years ended December 31:
| |
|
|
|
|
|
|
|
|
|
|
|
|
| |
|
2009 |
|
|
2008 |
|
|
2007 |
|
| |
| |
|
(In thousands) |
|
Federal: |
|
|
|
|
|
|
|
|
|
|
|
|
Current |
|
$ |
323,152 |
|
|
$ |
255,511 |
|
|
$ |
170,374 |
|
Deferred |
|
|
(36,368 |
) |
|
|
(9,372 |
) |
|
|
(7,896 |
) |
| |
Total federal |
|
|
286,784 |
|
|
|
246,139 |
|
|
|
162,478 |
|
| |
State: |
|
|
|
|
|
|
|
|
|
|
|
|
Current |
|
|
70,270 |
|
|
|
44,685 |
|
|
|
24,941 |
|
Deferred |
|
|
(10,332 |
) |
|
|
(3,496 |
) |
|
|
(1,534 |
) |
| |
Total state |
|
|
59,938 |
|
|
|
41,189 |
|
|
|
23,407 |
|
| |
Total income tax expense |
|
$ |
346,722 |
|
|
$ |
287,328 |
|
|
$ |
185,885 |
|
|
|
|
|
|
|
|
|
|
|
Not included in the above table are deferred income tax expense amounts of $94.4 million,
$21.4 million and $45.7 million for 2009, 2008 and 2007, respectively, which represent the deferred
income taxes relating to the changes in accumulated other comprehensive income (loss).
The amounts reported as income tax expense vary from the amounts that would be reported by applying
the statutory federal income tax rate to income before income taxes due to the following:
| |
|
|
|
|
|
|
|
|
|
|
|
|
| |
|
2009 |
|
|
2008 |
|
|
2007 |
|
| |
| |
|
(Dollars in thousands) |
|
Income before income tax expense |
|
$ |
873,966 |
|
|
$ |
732,886 |
|
|
$ |
481,743 |
|
Statutory income tax rate |
|
|
35 |
% |
|
|
35 |
% |
|
|
35 |
% |
| |
Computed expected income tax expense |
|
|
305,888 |
|
|
|
256,510 |
|
|
|
168,610 |
|
State income taxes, net of federal
income tax benefit |
|
|
38,960 |
|
|
|
26,773 |
|
|
|
15,215 |
|
ESOP fair market value adjustment |
|
|
2,212 |
|
|
|
3,665 |
|
|
|
2,559 |
|
Other, net |
|
|
(338 |
) |
|
|
380 |
|
|
|
(499 |
) |
| |
|
|
|
|
|
|
|
|
|
|
|
|
|
Income tax expense |
|
$ |
346,722 |
|
|
$ |
287,328 |
|
|
$ |
185,885 |
|
|
|
|
|
|
|
|
|
|
|
Page 71
The net deferred tax asset consists of the following at December 31:
| |
|
|
|
|
|
|
|
|
| |
|
2009 |
|
|
2008 |
|
| |
| |
|
(In thousands) |
|
Deferred tax asset: |
|
|
|
|
|
|
|
|
Postretirement benefits |
|
$ |
41,873 |
|
|
$ |
43,462 |
|
Allowance for loan losses |
|
|
56,621 |
|
|
|
19,701 |
|
Mortgage premium amortization |
|
|
6,281 |
|
|
|
7,269 |
|
Non-qualified benefit plans |
|
|
44,393 |
|
|
|
37,314 |
|
ESOP expense |
|
|
8,700 |
|
|
|
7,245 |
|
Fair value adjustment on mortgages recorded in Acquisition |
|
|
2,826 |
|
|
|
3,548 |
|
Interest on non-accrual loans |
|
|
11,483 |
|
|
|
2,569 |
|
Other |
|
|
7,359 |
|
|
|
4,766 |
|
| |
|
|
|
179,536 |
|
|
|
125,874 |
|
| |
Deferred tax liabilities: |
|
|
|
|
|
|
|
|
Postretirement benefits |
|
|
30,340 |
|
|
|
17,874 |
|
Net unrealized gain on securities available for sale |
|
|
142,109 |
|
|
|
51,522 |
|
Fair value adjustments related to the Acquisition: |
|
|
|
|
|
|
|
|
Core deposit intangible |
|
|
2,544 |
|
|
|
3,308 |
|
Buildings |
|
|
1,648 |
|
|
|
1,827 |
|
Other |
|
|
83 |
|
|
|
702 |
|
| |
|
|
|
176,724 |
|
|
|
75,233 |
|
| |
Net deferred tax asset (included in other assets) |
|
$ |
2,812 |
|
|
$ |
50,641 |
|
|
|
|
|
|
|
|
The net deferred tax asset represents the anticipated federal and state tax benefits
expected to be realized in future years upon the utilization of the underlying tax attributes
comprising this balance. In management’s opinion, in view of Hudson City’s previous, current and
projected future earnings trends, such net deferred tax asset will more likely than not be fully
realized. Accordingly, no valuation allowance was deemed to be required at December 31, 2009 and
2008.
In July 2006, FASB issued guidance which clarifies the accounting for uncertainty in income taxes
recognized in an enterprise’s financial statements. This guidance prescribes a recognition
threshold and measurement attribute for the financial statement recognition and measurement of a
tax position taken, or expected to be taken, in a tax return. Accrued estimated penalties and
interest on unrecognized tax benefits were approximately $645,000 and $915,000 at December 31, 2009
and 2008, respectively. Estimated penalties and interest of ($270,000), $470,000, and $445,000 are
included in income tax expense at December 31, 2009, 2008, and 2007, respectively. The Company’s
tax returns are subject to examination in the normal course by federal tax authorities for the
years 2006 through 2009 and by state authorities for the years 2005 through 2009.
Page 72
A reconciliation of the beginning and ending amount of unrecognized tax benefits for the years
ended December 31 is as follows:
| |
|
|
|
|
|
|
|
|
| |
|
2009 |
|
|
2008 |
|
| |
| |
|
(in thousands) |
|
Balance at January 1 |
|
$ |
3,212 |
|
|
$ |
2,189 |
|
| |
Additions based on tax positions related
to the current year |
|
|
3,156 |
|
|
|
1,266 |
|
Additions for tax positions of prior years |
|
|
— |
|
|
|
— |
|
Reductions for tax positions of prior
years |
|
|
(2,315 |
) |
|
|
(243 |
) |
| |
|
|
|
|
|
|
|
Balance at December 31 |
|
$ |
4,053 |
|
|
$ |
3,212 |
|
|
|
|
|
|
|
|
Retained earnings at December 31, 2009 included approximately $58.0 million for which no
deferred income taxes have been provided. This amount represents the base year allocation of
income to bad debt deduction for tax purposes. Under FASB guidance, this amount is treated as a
permanent difference and deferred taxes are not recognized unless it appears that the amount will
be reduced and result in taxable income in the foreseeable future. Events that would result in
taxation of these reserves include failure to qualify as a bank for tax purposes or distributions
in excess of Hudson City Savings’ current and accumulated earnings and profits, distributions in
redemption of stock and distributions in partial or complete liquidation. The unrecognized
deferred tax liability with respect to our base-year deduction amounted to $23.5 million at
December 31, 2009 and 2008.
12. Fair Value Measurements and Disclosures
a) Fair Value Measurements
The Accounting Standards Codification (“ASC”) Topic 820, Fair Value Measurements and Disclosures,
defines fair value, establishes a framework for measuring fair value and expands disclosures about
fair value measurements. ASC Topic 820 applies only to fair value measurements already required or
permitted by other accounting standards and does not impose requirements for additional fair value
measures. ASC Topic 820 was issued to increase consistency and comparability in reporting fair
values.
We use fair value measurements to record fair value adjustments to certain assets and to determine
fair value disclosures. We did not have any liabilities that were measured at fair value at
December 31, 2009. Our securities available-for-sale are recorded at fair value on a recurring
basis. Additionally, from time to time, we may be required to record at fair value other assets or
liabilities on a non-recurring basis, such as foreclosed real estate owned, certain impaired loans
and goodwill. These non-recurring fair value adjustments generally involve the write-down of
individual assets due to impairment losses.
In accordance with ASC Topic 820-10-35-01, we group our assets at fair value in three levels, based
on the markets in which the assets are traded and the reliability of the assumptions used to
determine fair value. These levels are:
• Level 1 — Valuation is based upon quoted prices for identical instruments traded in active
markets.
• Level 2 — Valuation is based upon quoted prices for similar instruments in active markets, quoted
prices for identical or similar instruments in markets that are not active and model-based
valuation techniques for which all significant assumptions are observable in the market.
Page 73
• Level 3 — Valuation is generated from model-based techniques that use significant assumptions not
observable in the market. These unobservable assumptions reflect our own estimates of assumptions
that market participants would use in pricing the asset or liability. Valuation techniques include
the use of option pricing models, discounted cash flow models and similar techniques. The results
cannot be determined with precision and may not be realized in an actual sale or immediate
settlement of the asset or liability.
We base our fair values on the price that would be received to sell an asset in an orderly
transaction between market participants at the measurement date. ASC Topic 820 requires us to
maximize the use of observable inputs and minimize the use of unobservable inputs when measuring
fair value.
Assets that we measure on a recurring basis are limited to our available-for-sale securities
portfolio. Our available-for-sale portfolio is carried at estimated fair value with any unrealized
gains and losses, net of taxes, reported as accumulated other comprehensive income or loss in
shareholders’ equity. Substantially all of our available-for-sale portfolio consists of
mortgage-backed securities and investment securities issued by government-sponsored enterprises.
The fair values for substantially all of these securities are obtained from an independent
nationally recognized pricing service. Based on the nature of our securities, our independent
pricing service provides us with prices which are categorized as Level 2 since quoted prices in
active markets for identical assets are generally not available for the majority of securities in
our portfolio. Various modeling techniques are used to determine pricing for our mortgage-backed
securities, including option pricing and discounted cash flow models. The inputs to these models
include benchmark yields, reported trades, broker/dealer quotes, issuer spreads, two-sided markets,
benchmark securities, bids, offers and reference data. We also own equity securities with a
carrying value of $7.1 million and $7.4 million at December 31,
2009 and 2008, respectively
for which fair values are obtained from quoted market prices in
active markets and, as such, are classified as Level 1.
The following table provides the level of valuation assumptions used to determine the carrying
value of our assets measured at fair value on a recurring basis at December 31, 2009 and 2008.
| |
|
|
|
|
|
|
|
|
|
|
|
|
|
|
|
|
| |
|
|
|
|
|
Fair Value at December 31, 2009 using |
|
| |
| |
|
|
|
|
|
Quoted Prices in Active |
|
|
Significant Other |
|
|
Significant |
|
| |
|
Carrying |
|
|
Markets for Identical |
|
|
Observable Inputs |
|
|
Unobservable Inputs |
|
| Description |
|
Value |
|
|
Assets (Level 1) |
|
|
(Level 2) |
|
|
(Level 3) |
|
| |
|
|
|
|
|
(In thousands) |
|
Available for sale debt
securities: |
|
|
|
|
|
|
|
|
|
|
|
|
|
|
|
|
Mortgage-backed securities |
|
$ |
11,116,531 |
|
|
$ |
— |
|
|
$ |
11,116,531 |
|
|
$ |
— |
|
U.S. government-sponsored
enterprises debt |
|
|
1,088,165 |
|
|
|
— |
|
|
|
1,088,165 |
|
|
|
— |
|
|
|
|
|
|
|
|
|
|
|
|
|
|
Total available for sale
debt securities |
|
|
12,204,696 |
|
|
|
— |
|
|
|
12,204,696 |
|
|
|
— |
|
|
|
|
|
|
|
|
|
|
|
|
|
|
|
|
|
|
|
|
|
|
|
|
|
|
|
|
|
|
|
Available for sale
equity securities: |
|
|
|
|
|
|
|
|
|
|
|
|
|
|
|
|
Financial services industry |
|
$ |
7,075 |
|
|
$ |
7,075 |
|
|
$ |
— |
|
|
$ |
— |
|
|
|
|
|
|
|
|
|
|
|
|
|
|
Total available for sale
equity securities |
|
|
7,075 |
|
|
|
7,075 |
|
|
|
— |
|
|
|
— |
|
|
|
|
|
|
|
|
|
|
|
|
|
|
Total available for sale
securities |
|
$ |
12,211,771 |
|
|
$ |
7,075 |
|
|
$ |
12,204,696 |
|
|
$ |
— |
|
|
|
|
|
|
|
|
|
|
|
|
|
|
| |
| |
Fair Value Measurements at December 31, 2008 |
|
| |
|
|
|
|
|
Quoted Prices in Active |
|
|
Significant Other |
|
|
Significant |
|
| |
|
Carrying |
|
|
Markets for Identical |
|
|
Observable Inputs |
|
|
Unobservable Inputs |
|
| Description |
|
Value |
|
|
Assets (Level 1) |
|
|
(Level 2) |
|
|
(Level 3) |
|
| |
|
|
|
|
|
|
|
|
|
(In thousands) |
|
|
|
|
|
Available for sale: |
|
|
|
|
|
|
|
|
|
|
|
|
|
|
|
|
Mortgage-backed securities |
|
$ |
9,915,554 |
|
|
$ |
— |
|
|
$ |
9,915,554 |
|
|
$ |
— |
|
U.S. government-sponsored
enterprises debt |
|
|
3,406,248 |
|
|
|
|
|
|
|
3,406,248 |
|
|
|
— |
|
|
|
|
|
|
|
|
|
|
|
|
|
|
Total available for sale
debt securities |
|
$ |
13,321,802 |
|
|
$ |
— |
|
|
$ |
13,321,802 |
|
|
$ |
— |
|
|
|
|
|
|
|
|
|
|
|
|
|
|
|
|
|
|
|
|
|
|
|
|
|
|
|
|
|
|
|
Available for sale equity securities: |
|
|
|
|
|
|
|
|
|
|
|
|
|
|
|
|
Financial services industry |
|
$ |
7,385 |
|
|
$ |
7,385 |
|
|
$ |
— |
|
|
$ |
— |
|
|
|
|
|
|
|
|
|
|
|
|
|
|
Total available for sale
equity securities |
|
|
7,385 |
|
|
|
7,385 |
|
|
|
— |
|
|
|
— |
|
|
|
|
|
|
|
|
|
|
|
|
|
|
Total available for sale securities |
|
$ |
13,329,187 |
|
|
$ |
7,385 |
|
|
$ |
13,321,802 |
|
|
$ |
— |
|
|
|
|
|
|
|
|
|
|
|
|
|
|
Assets that were measured at fair value on a non-recurring basis
at December 31, 2009 and 2008 were limited to non-performing commercial and construction loans that are collateral dependent and
foreclosed real estate. Commercial and construction loans evaluated for impairment in accordance
with FASB guidance amounted to $11.2 million and $9.5 million at December 31, 2009 and 2008, respectively.
Based on this evaluation, we established an allowance for loan losses of $2.1 million and $818,000 for such impaired loans for
those same respective periods. The
provision for loan losses related to these loans amounted to $1.3 million and $550,000 for 2009 and 2008. These impaired
loans are individually assessed to determine that the loan’s carrying value is not in excess of the
fair value of the collateral, less estimated selling costs. Since all of our impaired loans at
December 31, 2009 are secured by real estate, fair value is estimated through current appraisals,
where
Page 74
practical, or an inspection and a comparison of the property securing the loan with similar
properties in the area by either a licensed appraiser or real estate broker and, as such, are
classified as Level 3.
Foreclosed real estate represents real estate acquired as a result of foreclosure or by deed in
lieu of foreclosure and is carried at the lower of cost or fair value less estimated selling costs.
Fair value is estimated through current appraisals, where practical, or an inspection and a
comparison of the property securing the loan with similar properties in the area by either a
licensed appraiser or real estate broker and, as such, foreclosed real estate properties are
classified as Level 3. Foreclosed real estate at December 31,
2009 and 2008 amounted to $16.7 million and $15.5 million, respectively.
During 2009 and 2008, charge-offs to the allowance for loan losses related to loans that were
transferred to foreclosed real estate amounted to $9.8 million and $1.8 million, respectively.
Write downs and net loss on sale related to foreclosed real estate that were charged to
non-interest expense amounted to $2.4 million and $1.3 million for those same respective periods.
The following table provides the level of valuation assumptions used to determine the carrying
value of our assets measured at fair value on a non-recurring basis at December 31, 2009 and 2008.
| |
|
|
|
|
|
|
|
|
|
|
|
|
|
|
|
|
| |
|
Fair Value Measurments at December 31, 2009 using |
|
|
|
|
| |
| |
|
Quoted Prices in Active |
|
|
Significant Other |
|
|
Significant |
|
|
Total |
|
| |
|
Markets for Identical |
|
|
Observable Inputs |
|
|
Unobservable Inputs |
|
|
Gains |
|
| Description |
|
Assets (Level 1) |
|
|
(Level 2) |
|
|
(Level 3) |
|
|
(Losses) |
|
| |
|
|
|
|
|
(In thousands) |
|
|
|
|
|
|
|
|
|
Impaired loans |
|
$ |
— |
|
|
$ |
— |
|
|
$ |
11,178 |
|
|
$ |
— |
|
Foreclosed real
estate |
|
|
— |
|
|
|
— |
|
|
|
16,736 |
|
|
|
(2,365 |
) |
| |
| |
|
Fair Value Measurements at December 31, 2008 |
|
|
|
|
|
| |
|
Quoted Prices in Active |
|
Significant Other |
|
Significant |
|
Total |
| |
|
Markets for Identical |
|
Observable Inputs |
|
Unobservable Inputs |
|
Gains |
| Description |
|
Assets (Level 1) |
|
(Level 2) |
|
(Level 3) |
|
(Losses) |
| |
|
|
|
|
|
(In thousands) |
|
|
|
|
|
|
|
|
Impaired loans |
|
$ |
— |
|
|
$ |
— |
|
|
$ |
9,464 |
|
|
$ |
— |
|
Foreclosed real estate |
|
|
— |
|
|
|
— |
|
|
|
15,532 |
|
|
|
(1,343 |
) |
b) Fair Value Disclosures
The fair value of financial instruments represents the estimated amounts at which the asset or
liability could be exchanged in a current transaction between willing parties, other than in a
forced liquidation sale. These estimates are subjective in nature, involve uncertainties and
matters of judgment and, therefore, cannot be determined with precision. Changes in assumptions
could significantly affect the estimates. Further, certain tax implications related to the
realization of the unrealized gains and losses could have a substantial impact on these fair value
estimates and have not been incorporated into any of the estimates.
Carrying amounts of cash, due from banks and federal funds sold are considered to approximate fair
value. The carrying value of FHLB stock equals cost. The fair value of FHLB stock is based on
redemption at par value.
The fair value of one- to four-family mortgages and home equity loans are generally estimated using
the present value of expected future cash flows, assuming future prepayments and using market rates
for new loans with comparable credit risk. The method of estimating
fair value does not incorporate the exit-price concept of fair value
prescribed by ASC 820-10.
For time deposits and fixed-maturity borrowed funds, the fair value is estimated by discounting
estimated future cash flows using currently offered rates. Structured borrowed funds are valued
using an option valuation model which uses assumptions for anticipated calls of borrowings based on
market interest rates and weighted-average life. For deposit liabilities payable on demand, the
fair value is the carrying value at the reporting date. There is no material difference between
the fair value and the carrying amounts recognized with respect to our off-balance sheet
commitments.
Other important elements that are not deemed to be financial assets or liabilities and, therefore,
not considered in these estimates include the value of Hudson City’s retail branch delivery system,
its existing core deposit base and banking premises and equipment.
Page 75
The estimated fair value of Hudson City’s financial instruments is summarized as follows at
December 31:
| |
|
|
|
|
|
|
|
|
|
|
|
|
|
|
|
|
| |
|
2009 |
|
2008 |
| |
| |
|
Carrying |
|
Estimated |
|
Carrying |
|
Estimated |
| |
|
Amount |
|
Fair Value |
|
Amount |
|
Fair Value |
| |
| |
|
(In thousands) |
|
|
|
|
|
|
|
|
|
|
|
|
|
|
|
|
|
Assets: |
|
|
|
|
|
|
|
|
|
|
|
|
|
|
|
|
Cash and due from banks |
|
$ |
198,752 |
|
|
$ |
198,752 |
|
|
$ |
184,915 |
|
|
$ |
184,915 |
|
Federal funds sold |
|
|
362,449 |
|
|
|
362,449 |
|
|
|
76,896 |
|
|
|
76,896 |
|
Investment securities held to maturity |
|
|
4,187,704 |
|
|
|
4,071,005 |
|
|
|
50,086 |
|
|
|
50,512 |
|
Investment securities available for sale |
|
|
1,095,240 |
|
|
|
1,095,240 |
|
|
|
3,413,633 |
|
|
|
3,413,633 |
|
Federal Home Loan Bank of New York stock |
|
|
874,768 |
|
|
|
874,768 |
|
|
|
865,570 |
|
|
|
865,570 |
|
Mortgage-backed securities held to maturity |
|
|
9,963,554 |
|
|
|
10,324,831 |
|
|
|
9,572,257 |
|
|
|
9,695,445 |
|
Mortgage-backed securities available for sale |
|
|
11,116,531 |
|
|
|
11,116,531 |
|
|
|
9,915,554 |
|
|
|
9,915,554 |
|
Loans |
|
|
31,721,154 |
|
|
|
32,758,247 |
|
|
|
29,440,761 |
|
|
|
29,743,919 |
|
|
|
|
|
|
|
|
|
|
|
|
|
|
|
|
|
|
Liabilities: |
|
|
|
|
|
|
|
|
|
|
|
|
|
|
|
|
Deposits |
|
|
24,578,048 |
|
|
|
24,913,407 |
|
|
|
18,464,042 |
|
|
|
18,486,681 |
|
Borrowed funds |
|
|
29,975,000 |
|
|
|
32,485,513 |
|
|
|
30,225,000 |
|
|
|
34,156,052 |
|
13. Regulatory Matters
Hudson City Savings is subject to comprehensive regulation, supervision and periodic examination by
the Office of Thrift Supervision (“OTS”). Deposits at Hudson City Savings are insured up to
standard limits of coverage provided by the Deposit Insurance Fund (“DIF”) of the Federal Deposit
Insurance Corporation (“FDIC”).
OTS regulations require federally chartered savings banks to meet three minimum capital ratios: a
1.5% tangible capital ratio, a 4% leverage (core capital) ratio and an 8% total risk-based capital
ratio. In assessing an institution’s capital adequacy, the OTS takes into consideration not only
these numeric factors but also qualitative factors as well, and has the authority to establish
higher capital requirements for individual institutions where necessary. Management believes that,
as of December 31, 2009, Hudson City Savings met all capital adequacy requirements to which it is
subject and would have been categorized as a well-capitalized institution under the prompt
corrective action regulations as of that date.
The following is a summary of Hudson City Savings’ actual capital amounts and ratios as of December
31, 2009 and 2008, compared to the OTS minimum capital adequacy requirements and the OTS
requirements for classification as a well-capitalized institution:
| |
|
|
|
|
|
|
|
|
|
|
|
|
|
|
|
|
|
|
|
|
|
|
|
|
| |
|
|
|
|
|
|
|
|
|
OTS Requirements |
| |
| |
|
|
|
|
|
|
|
|
|
Minimum Capital |
|
For Classification as |
| |
|
Bank Actual |
|
Adequacy |
|
Well-Capitalized |
| |
| |
|
Amount |
|
Ratio |
|
Amount |
|
Ratio |
|
Amount |
|
Ratio |
| |
| |
|
(Dollars in thousands) |
December 31, 2009 |
|
|
|
|
|
|
|
|
|
|
|
|
|
|
|
|
|
|
|
|
|
|
|
|
Tangible capital |
|
$ |
4,539,630 |
|
|
|
7.59 |
% |
|
$ |
897,374 |
|
|
|
1.50 |
% |
|
|
n/a |
|
|
|
n/a |
|
Leverage (core)
capital |
|
|
4,539,630 |
|
|
|
7.59 |
|
|
|
2,392,955 |
|
|
|
4.00 |
|
|
$ |
2,991,245 |
|
|
|
5.00 |
% |
Total-risk-based
capital |
|
|
4,679,843 |
|
|
|
21.02 |
|
|
|
1,781,277 |
|
|
|
8.00 |
|
|
|
2,226,597 |
|
|
|
10.00 |
|
|
|
|
|
|
|
|
|
|
|
|
|
|
|
|
|
|
|
|
|
|
|
|
|
|
December 31, 2008 |
|
|
|
|
|
|
|
|
|
|
|
|
|
|
|
|
|
|
|
|
|
|
|
|
Tangible capital |
|
$ |
4,290,316 |
|
|
|
7.99 |
% |
|
$ |
805,475 |
|
|
|
1.50 |
% |
|
|
n/a |
|
|
|
n/a |
|
Leverage (core)
capital |
|
|
4,290,316 |
|
|
|
7.99 |
|
|
|
2,147,935 |
|
|
|
4.00 |
|
|
$ |
2,684,918 |
|
|
|
5.00 |
% |
Total-risk-based
capital |
|
|
4,340,315 |
|
|
|
21.52 |
|
|
|
1,613,657 |
|
|
|
8.00 |
|
|
|
2,017,071 |
|
|
|
10.00 |
|
Page 76
The OTS may take certain supervisory actions under the prompt corrective action regulations
of the Federal Deposit Insurance Corporation Improvement Act with respect to an undercapitalized
institution. Such actions could have a direct material effect on the institution’s financial
statements. The regulations establish a framework for the classification of savings institutions
into five categories: well-capitalized, adequately-capitalized, undercapitalized, significantly
undercapitalized, and critically undercapitalized. Under the OTS regulations, an institution is
considered well-capitalized if it has a leverage (Tier 1) capital ratio of at least 5.0% and a
total risk-based capital ratio of at least 10.0%. The OTS regulates all capital distributions by
Hudson City Savings directly or indirectly to Hudson City Bancorp, including dividend payments.
Hudson City Savings may not pay dividends to Hudson City Bancorp if, after paying those dividends,
it would fail to meet the required minimum levels under risk-based capital guidelines and the
minimum leverage and tangible capital ratio requirements. As the subsidiary of a savings and loan
holding company, Hudson City Savings currently must file a notice with the OTS at least 30 days
prior to each capital distribution. However, if the total amount of all capital distributions
(including each proposed capital distribution) for the applicable calendar year exceeds net income
for that year to date plus the retained net income for the preceding two years, then Hudson City
Savings must file an application to receive the approval of the OTS for a proposed capital
distribution.
The foregoing capital ratios are based in part on specific quantitative measures of assets,
liabilities and certain off-balance sheet items as calculated under regulatory accounting
practices. Capital amounts and classifications are also subject to qualitative judgments by the
OTS about capital components, risk-weightings and other factors.
Hudson City Bancorp is regulated, supervised and examined by the OTS as a savings and loan holding
company and, as such, is not subject to regulatory capital requirements.
Upon completion of the second-step conversion, Hudson City Bancorp established a “liquidation
account” in an amount equal to the total equity of Hudson City Savings as of the latest practicable
date prior to the second-step conversion. The liquidation account was established to provide a
limited priority claim to the assets of Hudson City Savings to “eligible account holders” and
“supplemental eligible account holders”, as defined in the Plan, who continue to maintain deposits
in Hudson City Savings after the second-step conversion. In the unlikely event of a complete
liquidation of Hudson City Savings at a time when Hudson City Savings has a positive net worth, and
only in such event, each eligible account holder and supplemental eligible account holder would be
entitled to receive a liquidation distribution, prior to any payment to the stockholders of Hudson
City Bancorp. In the unlikely event of a complete liquidation of Hudson City Savings and Hudson
City Bancorp does not have sufficient assets (other than the stock of Hudson City Savings) to fund
the obligation under the liquidation account, Hudson City Savings will fund the remaining
obligation as if Hudson City Savings had established the liquidation account rather than Hudson
City Bancorp. Any assets remaining after the liquidation rights of eligible account holders and
supplemental eligible account holders are satisfied would be distributed to Hudson City Bancorp as
the sole stockholder of Hudson City Savings.
14. Commitments and Contingencies
Hudson City Savings is a party to commitments to extend credit in the normal course of business to
meet the financial needs of its customers and commitments to purchase loans and mortgage-backed
securities to meet our growth initiatives. Commitments to extend credit are agreements to lend
money to a customer as long as there is no violation of any condition established in the contract.
Commitments to fund first mortgage loans generally have fixed expiration dates or other termination
clauses, whereas home equity lines of credit have no expiration date. Since some commitments are
expected to expire without being drawn upon, the total commitment amounts do not necessarily
represent future cash requirements. Hudson City Savings evaluates each customer’s credit-worthiness
on a case-by-case basis.
Page 77
At December 31, 2009, Hudson City Savings had variable- and fixed-rate first mortgage loan
commitments to extend credit of approximately $288.8 million and $249.2 million, respectively;
commitments to purchase variable- and fixed-rate first mortgage loans of $91.0 million and $66.5
million, respectively; commitments to purchase variable- and fixed-rate mortgage-backed securities
of $1.24 billion and $7.5 million, respectively; and unused home equity, overdraft and
commercial/construction lines of credit of approximately $179.7 million, $2.9 million, and $12.8
million, respectively. At December 31, 2008, Hudson City Savings had variable- and fixed-rate
first mortgage loan commitments to extend credit of approximately $211.2 million and $126.4
million, respectively, commitments to purchase fixed-rate first mortgage loans of $219.1 million,
commitments to purchase variable rate mortgage-backed securities of $516.0 million and unused home
equity, overdraft and commercial/construction lines of credit of approximately $134.4 million, $3.0
million, and $15.2 million, respectively. These commitment amounts are not included in the
accompanying financial statements. There is no exposure to credit loss in the event the other
party to commitments to extend credit does not exercise its rights to borrow under the commitment.
In the normal course of business, there are various outstanding legal proceedings. In the opinion
of management, the consolidated financial statements of Hudson City will not be materially affected
as a result of such legal proceedings.
15. Parent Company Only Financial Statements
Set forth below are the condensed financial statements for Hudson City Bancorp, Inc.:
Statements of Financial Condition
| |
|
|
|
|
|
|
|
|
| |
|
December 31, 2009 |
|
|
December 31, 2008 |
|
| |
| |
|
(In thousands) |
|
|
|
|
|
|
|
|
|
|
Assets: |
|
|
|
|
|
|
|
|
Cash and due from subsidiary bank |
|
$ |
224,601 |
|
|
$ |
205,765 |
|
Investment in subsidiary |
|
|
4,882,609 |
|
|
|
4,498,248 |
|
ESOP loan receivable |
|
|
231,856 |
|
|
|
234,300 |
|
Other assets |
|
|
86 |
|
|
|
483 |
|
| |
Total Assets |
|
$ |
5,339,152 |
|
|
$ |
4,938,796 |
|
|
|
|
|
|
|
|
|
|
|
|
|
|
|
|
|
Stockholders’ Equity: |
|
|
|
|
|
|
|
|
Total stockholders’ equity |
|
|
5,339,152 |
|
|
|
4,938,796 |
|
| |
Total Liabilities
and Stockholders’
Equity |
|
$ |
5,339,152 |
|
|
$ |
4,938,796 |
|
|
|
|
|
|
|
|
Page 78
Statements of Income
| |
|
|
|
|
|
|
|
|
|
|
|
|
| |
|
Year Ended December 31, |
|
| |
| |
|
2009 |
|
|
2008 |
|
|
2007 |
|
| |
| |
|
(In thousands) |
|
Income: |
|
|
|
|
|
|
|
|
|
|
|
|
Dividends received from subsidiary |
|
$ |
338,500 |
|
|
$ |
288,442 |
|
|
$ |
278,176 |
|
Interest on ESOP loan receivable |
|
|
11,715 |
|
|
|
11,831 |
|
|
|
11,942 |
|
Interest on deposit with subsidiary |
|
|
2,646 |
|
|
|
3,017 |
|
|
|
2,820 |
|
| |
Total income |
|
|
352,861 |
|
|
|
303,290 |
|
|
|
292,938 |
|
Expenses |
|
|
1,419 |
|
|
|
1,037 |
|
|
|
1,059 |
|
| |
Income before income tax expense and equity in
undistributed (overdistributed) earnings of
subsidiary |
|
|
351,442 |
|
|
|
302,253 |
|
|
|
291,879 |
|
Income tax expense |
|
|
3,397 |
|
|
|
4,461 |
|
|
|
5,115 |
|
| |
Income before equity in undistributed
(overdistributed)
earnings of subsidiary |
|
|
348,045 |
|
|
|
297,792 |
|
|
|
286,764 |
|
Equity in undistributed (overdistributed) earnings
of subsidiary |
|
|
179,199 |
|
|
|
147,766 |
|
|
|
9,094 |
|
| |
Net income |
|
$ |
527,244 |
|
|
$ |
445,558 |
|
|
$ |
295,858 |
|
|
|
|
|
|
|
|
|
|
|
Statements of Cash Flows
| |
|
|
|
|
|
|
|
|
|
|
|
|
| |
|
Year Ended December 31, |
|
| |
| |
|
2009 |
|
|
2008 |
|
|
2007 |
|
| |
| |
|
(In thousands) |
|
|
|
|
|
|
|
|
|
|
|
|
|
|
Cash Flows from Operating Activities: |
|
|
|
|
|
|
|
|
|
|
|
|
Net income |
|
$ |
527,244 |
|
|
$ |
445,558 |
|
|
$ |
295,858 |
|
Adjustments to reconcile net income
to net cash provided by operating activities: |
|
|
|
|
|
|
|
|
|
|
|
|
Equity in undistributed earnings |
|
|
(179,199 |
) |
|
|
(147,766 |
) |
|
|
(9,094 |
) |
Decrease (increase) in other assets |
|
|
7,168 |
|
|
|
(483 |
) |
|
|
— |
|
Decrease in accrued expenses |
|
|
— |
|
|
|
(236 |
) |
|
|
(729 |
) |
| |
Net Cash Provided by Operating Activities |
|
|
355,213 |
|
|
|
297,073 |
|
|
|
286,035 |
|
| |
Cash Flows from Investing Activities: |
|
|
|
|
|
|
|
|
|
|
|
|
Principal collected on ESOP loan |
|
|
2,444 |
|
|
|
2,329 |
|
|
|
2,217 |
|
| |
Net Cash Provided by Investing Activities |
|
|
2,444 |
|
|
|
2,329 |
|
|
|
2,217 |
|
| |
Cash Flows from Financing Activities: |
|
|
|
|
|
|
|
|
|
|
|
|
Purchases of treasury stock |
|
|
(43,477 |
) |
|
|
(17,045 |
) |
|
|
(550,215 |
) |
Exercise of stock options |
|
|
13,500 |
|
|
|
16,936 |
|
|
|
3,629 |
|
Cash dividends paid on unallocated ESOP
shares |
|
|
(20,436 |
) |
|
|
(16,019 |
) |
|
|
(12,067 |
) |
Cash dividends paid |
|
|
(288,408 |
) |
|
|
(217,995 |
) |
|
|
(165,376 |
) |
| |
Net Cash Used in Financing Activities |
|
|
(338,821 |
) |
|
|
(234,123 |
) |
|
|
(724,029 |
) |
| |
Net Increase (Decrease) in Cash Due from Bank |
|
|
18,836 |
|
|
|
65,279 |
|
|
|
(435,777 |
) |
Cash Due from Bank at Beginning of Year |
|
|
205,765 |
|
|
|
140,486 |
|
|
|
576,263 |
|
| |
Cash Due from Bank at End of Year |
|
$ |
224,601 |
|
|
$ |
205,765 |
|
|
$ |
140,486 |
|
|
|
|
|
|
|
|
|
Page 79
16. Selected Quarterly Financial Data (Unaudited)
The following tables are a summary of certain quarterly financial data for the years ended December
31, 2009 and 2008.
| |
|
|
|
|
|
|
|
|
|
|
|
|
|
|
|
|
| |
|
2009 Quarter Ended |
|
| |
| |
|
March 31 |
|
|
June 30 |
|
|
September 30 |
|
|
December 31 |
|
| |
| |
|
(In thousands, except per share data) |
|
Interest and dividend income |
|
$ |
723,322 |
|
|
$ |
727,759 |
|
|
$ |
744,165 |
|
|
$ |
746,540 |
|
Interest expense |
|
|
439,491 |
|
|
|
425,362 |
|
|
|
418,708 |
|
|
|
414,747 |
|
| |
Net interest income |
|
|
283,831 |
|
|
|
302,397 |
|
|
|
325,457 |
|
|
|
331,793 |
|
Provision for loan losses |
|
|
20,000 |
|
|
|
32,500 |
|
|
|
40,000 |
|
|
|
45,000 |
|
| |
Net interest income after
provision for loan losses |
|
|
263,831 |
|
|
|
269,897 |
|
|
|
285,457 |
|
|
|
286,793 |
|
Non-interest income |
|
|
2,273 |
|
|
|
26,606 |
|
|
|
2,513 |
|
|
|
2,192 |
|
Non-interest expense |
|
|
54,794 |
|
|
|
84,947 |
|
|
|
62,920 |
|
|
|
62,935 |
|
| |
Income before income tax expense |
|
|
211,310 |
|
|
|
211,556 |
|
|
|
225,050 |
|
|
|
226,050 |
|
Income tax expense |
|
|
83,647 |
|
|
|
83,637 |
|
|
|
89,964 |
|
|
|
89,474 |
|
| |
Net income |
|
$ |
127,663 |
|
|
$ |
127,919 |
|
|
$ |
135,086 |
|
|
$ |
136,576 |
|
|
|
|
|
|
|
|
|
|
|
|
|
|
Basic earnings per share |
|
$ |
0.26 |
|
|
$ |
0.26 |
|
|
$ |
0.28 |
|
|
$ |
0.28 |
|
|
|
|
|
|
|
|
|
|
|
|
|
|
Diluted earnings per share |
|
$ |
0.26 |
|
|
$ |
0.26 |
|
|
$ |
0.27 |
|
|
$ |
0.28 |
|
|
|
|
|
|
|
|
|
|
|
|
|
|
| |
|
|
|
|
|
|
|
|
|
|
|
|
|
|
|
|
| |
|
2008 Quarter Ended |
|
| |
| |
|
March 31 |
|
|
June 30 |
|
|
September 30 |
|
|
December 31 |
|
| |
| |
|
(In thousands, except per share data) |
|
|
|
|
|
|
|
|
|
|
|
|
|
|
|
|
|
|
Interest and dividend income |
|
$ |
613,288 |
|
|
$ |
646,660 |
|
|
$ |
681,317 |
|
|
$ |
711,960 |
|
Interest expense |
|
|
419,973 |
|
|
|
413,528 |
|
|
|
426,239 |
|
|
|
451,508 |
|
| |
Net interest income |
|
|
193,315 |
|
|
|
233,132 |
|
|
|
255,078 |
|
|
|
260,452 |
|
Provision for loan losses |
|
|
2,500 |
|
|
|
3,000 |
|
|
|
5,000 |
|
|
|
9,000 |
|
| |
Net interest income after
provision for loan losses |
|
|
190,815 |
|
|
|
230,132 |
|
|
|
250,078 |
|
|
|
251,452 |
|
Non-interest income |
|
|
2,221 |
|
|
|
2,088 |
|
|
|
2,181 |
|
|
|
1,995 |
|
Non-interest expense |
|
|
48,112 |
|
|
|
48,277 |
|
|
|
49,423 |
|
|
|
52,264 |
|
| |
Income before income tax expense |
|
|
144,924 |
|
|
|
183,943 |
|
|
|
202,836 |
|
|
|
201,183 |
|
Income tax expense |
|
|
56,255 |
|
|
|
73,240 |
|
|
|
80,928 |
|
|
|
76,905 |
|
| |
Net income |
|
$ |
88,669 |
|
|
$ |
110,703 |
|
|
$ |
121,908 |
|
|
$ |
124,278 |
|
|
|
|
|
|
|
|
|
|
|
|
|
|
Basic earnings per share |
|
$ |
0.18 |
|
|
$ |
0.23 |
|
|
$ |
0.25 |
|
|
$ |
0.25 |
|
|
|
|
|
|
|
|
|
|
|
|
|
|
Diluted earnings per share |
|
$ |
0.18 |
|
|
$ |
0.22 |
|
|
$ |
0.25 |
|
|
$ |
0.25 |
|
|
|
|
|
|
|
|
|
|
|
|
|
|
Page 80
17. Earnings Per Share
The following is a reconciliation of the numerators and denominators of the basic and diluted
earnings per share computations.
| |
|
|
|
|
|
|
|
|
|
|
|
|
|
|
|
|
|
|
|
|
|
|
|
|
|
|
|
|
|
|
|
|
|
|
|
|
| |
|
For the Year Ended December 31, |
|
| |
| |
|
2009 |
|
|
2008 |
|
|
2007 |
|
| |
| |
|
|
|
|
|
|
|
|
|
Per |
|
|
|
|
|
|
|
|
|
|
Per |
|
|
|
|
|
|
|
|
|
|
Per |
|
| |
|
|
|
|
|
|
|
|
|
Share |
|
|
|
|
|
|
|
|
|
|
Share |
|
|
|
|
|
|
|
|
|
|
Share |
|
| |
|
Income |
|
|
Shares |
|
|
Amount |
|
|
Income |
|
|
Shares |
|
|
Amount |
|
|
Income |
|
|
Shares |
|
|
Amount |
|
| |
| |
|
(In thousands, except per share data) |
|
Net income |
|
$ |
527,244 |
|
|
|
|
|
|
|
|
|
|
$ |
445,558 |
|
|
|
|
|
|
|
|
|
|
$ |
295,858 |
|
|
|
|
|
|
|
|
|
|
|
|
|
|
|
|
|
|
|
|
|
|
|
|
|
|
|
|
|
|
|
|
|
|
|
|
|
|
|
|
|
|
|
Basic earnings per share: |
|
|
|
|
|
|
|
|
|
|
|
|
|
|
|
|
|
|
|
|
|
|
|
|
|
|
|
|
|
|
|
|
|
|
|
|
Income available to
common stockholders |
|
$ |
527,244 |
|
|
|
488,908 |
|
|
$ |
1.08 |
|
|
$ |
445,558 |
|
|
|
484,907 |
|
|
$ |
0.92 |
|
|
$ |
295,858 |
|
|
|
499,608 |
|
|
$ |
0.59 |
|
|
|
|
|
|
|
|
|
|
|
|
|
|
|
|
|
|
|
|
|
|
|
|
|
|
|
|
|
|
|
|
|
|
|
Effect of dilutive common
stock equivalents |
|
|
— |
|
|
|
2,388 |
|
|
|
|
|
|
|
— |
|
|
|
10,949 |
|
|
|
|
|
|
|
— |
|
|
|
10,319 |
|
|
|
|
|
| |
Diluted earnings per share: |
|
|
|
|
|
|
|
|
|
|
|
|
|
|
|
|
|
|
|
|
|
|
|
|
|
|
|
|
|
|
|
|
|
|
|
|
Income available to
common stockholders |
|
$ |
527,244 |
|
|
|
491,296 |
|
|
$ |
1.07 |
|
|
$ |
445,558 |
|
|
|
495,856 |
|
|
$ |
0.90 |
|
|
$ |
295,858 |
|
|
|
509,927 |
|
|
$ |
0.58 |
|
|
|
|
|
|
|
|
|
|
|
|
|
|
|
|
|
|
|
|
|
|
|
|
|
|
|
|
|
18. Recent Accounting Pronouncements
In January 2010, the FASB issued an accounting standards update regarding disclosure requirements
for fair value measurement. This update provides amendments to fair value measurement that require
new disclosures related to transfers in and out of Levels 1 and 2 and activity in Level 3 fair
value measurements. The update also provides amendments clarifying level of disaggregation and
disclosures about inputs and valuation techniques along with conforming amendments to the guidance
on employers’ disclosures about postretirement benefit plan assets. This update is effective for
interim and annual reporting periods beginning after December 15, 2009, except for the disclosures
about purchases, sales, issuances, and settlements in the rollforward of activity in Level 3 fair
value measurements which are effective for fiscal years beginning after December 15, 2010. We do
not expect that this accounting standard update will have a material impact on our financial
condition, results of operations or financial statement disclosures.
In June 2009, the FASB Codification (the “Codification”) was issued. The Codification is the source
of authoritative U.S. generally accepted accounting principles (“GAAP”) recognized by the FASB to
be applied by non-governmental entities. Rules and interpretive releases of the SEC under authority of federal securities laws are also sources of
authoritative GAAP for SEC registrants. The Codification supersedes all existing non-SEC accounting
and reporting standards. All other non-grandfathered non-SEC accounting literature not included in
the Codification became non-authoritative. The Codification was effective for financial
statements issued for interim and annual periods ending after September 15, 2009. The
implementation of the Codification did not have an impact on our consolidated financial condition
and results of operations.
In June 2009, the FASB issued an accounting standards update to the accounting and disclosure
requirements for the consolidation of variable interest entities. The guidance affects the overall
consolidation analysis and requires enhanced disclosure on involvement with variable interest
entities. The guidance is effective for fiscal
Page 81
years beginning after November 15, 2009. We do not expect that the guidance will have a material
impact on our financial condition, results of operations or financial statement disclosures.
In June 2009, the FASB issued an accounting standards update to the accounting and disclosure
requirements for transfers of financial assets. The guidance defines the term “participating
interest” to establish specific conditions for reporting a transfer of a portion of a financial
asset as a sale. If the transfer does not meet those conditions, a transferor should account for
the transfer as a sale only if it transfers an entire financial asset or a group of entire
financial assets and surrenders control over the entire transferred asset(s). The guidance requires
that a transferor recognize and initially measure at fair value all assets obtained (including a
transferor’s beneficial interest) and liabilities incurred as a result of a transfer of financial
assets accounted for as a sale. The guidance is effective as of the beginning of each reporting
entity’s first annual reporting period that begins after November 15, 2009, for interim periods
within that first annual reporting period, and for interim and annual reporting periods thereafter.
We do not expect that the guidance will have a material impact on our financial condition, results
of operations or financial statement disclosures.
Page 82