Attached files
| file | filename |
|---|---|
| EX-31.2 - EX-31.2 - HUDSON CITY BANCORP INC | d811364dex312.htm |
| EX-23.1 - EX-23.1 - HUDSON CITY BANCORP INC | d811364dex231.htm |
| EX-32.1 - EX-32.1 - HUDSON CITY BANCORP INC | d811364dex321.htm |
| EX-31.1 - EX-31.1 - HUDSON CITY BANCORP INC | d811364dex311.htm |
| EX-21.1 - EX-21.1 - HUDSON CITY BANCORP INC | d811364dex211.htm |
| EX-10.26 - EX-10.26 - HUDSON CITY BANCORP INC | d811364dex1026.htm |
| EXCEL - IDEA: XBRL DOCUMENT - HUDSON CITY BANCORP INC | Financial_Report.xls |
Table of Contents
UNITED STATES
SECURITIES AND EXCHANGE COMMISSION
Washington, D.C. 20549
FORM 10-K
(Mark One)
| x | Annual Report Pursuant to Section 13 or 15(d) of the Securities Exchange Act of 1934 |
For the fiscal year ended: December 31, 2014
| ¨ | Transition Report Pursuant to Section 13 or 15(d) of the Securities Exchange Act of 1934 |
For the transition period from to
Commission File Number: 0-26001
Hudson City Bancorp, Inc.
(Exact name of registrant as specified in its charter)
| Delaware | 22-3640393 | |
| (State or other jurisdiction of incorporation or organization) |
(I.R.S. Employer Identification No.) | |
| West 80 Century Road Paramus, New Jersey | 07652 | |
| (Address of Principal Executive Offices) | (Zip Code) | |
(201) 967-1900
(Registrant’s telephone number, including area code)
Securities registered pursuant to Section 12(b) of the Act: None
Securities registered pursuant to Section 12(g) of the Act:
Common Stock, $0.01 par value
(Title of Class)
Indicate by check mark if the registrant is a well-known seasoned issuer, as defined in Rule 405 of the Securities Act. Yes x No ¨
Indicate by check mark if the registrant is not required to file reports pursuant to Section 13 or Section 15(d) of the Act. Yes ¨ No x
Indicate by check mark whether the registrant (1) has filed all reports required to be filed by Section 13 or 15(d) of the Securities Exchange Act of 1934 during the preceding 12 months (or for such shorter period that the registrant was required to file such reports), and (2) has been subject to such filing requirements for the past 90 days. Yes x No ¨
Indicate by check mark whether the registrant has submitted electronically and posted on its corporate web site, if any, every Interactive Data File required to be submitted and posted pursuant to Rule 405 of Regulation S-T (§232.405 of this chapter) during the preceding 12 months (or for such shorter period that the registrant was required to submit and post such files). Yes x No ¨
Indicate by check mark if disclosure of delinquent filers pursuant to Item 405 of Regulation S-K is not contained herein, and will not be contained, to the best of the registrant’s knowledge, in definitive proxy or information statements incorporated by reference in Part III of this Form 10-K or any amendment to this Form 10-K. ¨
Indicate by check mark whether the registrant is a large accelerated filer, an accelerated filer, a non-accelerated filer or a smaller reporting company. See the definitions of “large accelerated filer”, “accelerated filer” and “smaller reporting company” in Rule 12b-2 of the Exchange Act. (Check one):
| Large Accelerated filer | x | Accelerated filer | ¨ | |||
| Non-accelerated filer | ¨ | Smaller reporting company | ¨ | |||
Indicate by check mark whether the registrant is a shell company (as defined in Rule 12b-2 of the Act). Yes ¨ No x
As of February 18, 2015, the registrant had 741,466,555 shares of common stock, $0.01 par value, issued and 528,934,665 shares outstanding. The aggregate market value of voting stock held by non-affiliates of the registrant as of June 30, 2014 was $4,635,705,602. This figure was based on the closing price by the NASDAQ Global Market for a share of the registrant’s common stock, which was $9.83 as reported by the NASDAQ Global Market on June 30, 2014.
Documents Incorporated by Reference:
1. Portions of the definitive Proxy Statement to be used in connection with the Annual Meeting of Shareholders or any amendments to this Form 10-K are incorporated by reference into Part III.
Table of Contents
Hudson City Bancorp, Inc.
Form 10-K
Table of Contents
PRIVATE SECURITIES LITIGATION REFORM ACT SAFE HARBOR STATEMENT
This Annual Report on Form 10-K contains certain “forward looking statements” within the meaning of the Private Securities Litigation Reform Act of 1995 which may be identified by the use of such words as “may,” “believe,” “expect,” “anticipate,” “should,” “plan,” “estimate,” “predict,” “continue,” and “potential” or the negative of these terms or other comparable terminology. Examples of forward-looking statements include, but are not limited to, estimates with respect to the financial condition, results of operations and business of Hudson City Bancorp, Inc. and Hudson City Bancorp, Inc.’s strategies, plans, objectives, expectations and intentions, and other statements contained in this Annual Report on Form 10-K that are not historical facts. These statements are not guarantees of future performance and are subject to risks, uncertainties and other factors (many of which are beyond our control) that could cause actual results to differ materially from future results expressed or implied by such forward-looking statements. These factors include, but are not limited to:
| • | the timing and occurrence or non-occurrence of events may be subject to circumstances beyond our control; |
| • | there may be increases in competitive pressure among financial institutions or from non-financial institutions; |
| • | changes in the interest rate environment may reduce interest margins or affect the value of our investments; |
| • | changes in deposit flows, loan demand or real estate values may adversely affect our business; |
| • | changes in accounting principles, policies or guidelines may cause our financial condition to be perceived differently; |
| • | general economic conditions, including unemployment rates, either nationally or locally in some or all of the areas in which we do business, or conditions in the securities markets or the banking industry may be less favorable than we currently anticipate; |
| • | legislative or regulatory changes including, without limitation, the provisions of the Dodd-Frank Wall Street Reform and Consumer Protection Act (“Reform Act”), and any actions regarding foreclosures may adversely affect our business; |
| • | enhanced regulatory scrutiny may adversely affect our business and increase our cost of operation; |
| • | applicable technological changes may be more difficult or expensive than we anticipate; |
| • | success or consummation of new business initiatives may be more difficult or expensive than we anticipate; |
| • | litigation or matters before regulatory agencies, whether currently existing or commencing in the future, may delay the occurrence or non-occurrence of events longer than we anticipate; |
| • | the risks associated with adverse changes to credit quality, including changes in the level of loan delinquencies and non-performing assets and charge-offs, the length of time our non-performing assets remain in our portfolio and changes in estimates of the adequacy of the allowance for loan losses; |
| • | difficulties associated with achieving or predicting expected future financial results; |
| • | our ability to restructure our balance sheet, diversify our funding sources and access the capital markets; |
| • | our ability to comply with the terms of the Memorandum of Understanding with the Board of Governors of the Federal Reserve System (the “FRB”); |
| • | our ability to pay dividends, repurchase our outstanding common stock or execute capital management strategies each of which requires the approval of the Office of the Comptroller of the Currency (the “OCC”) and the FRB; |
| • | the effects of changes in existing U.S. government or U.S. government sponsored mortgage programs; |
| • | the risk of an economic slowdown that would adversely affect credit quality and loan originations; |
| • | the potential impact on our operations and customers resulting from natural or man-made disasters, wars, acts of terrorism and cyberattacks; |
i
Table of Contents
| • | the actual results of the pending merger (the “Merger”) with Wilmington Trust Corporation (“WTC”), a wholly owned subsidiary of M&T Bank Corporation (“M&T”) could vary materially as a result of a number of factors, including the possibility that various closing conditions for the Merger may not be satisfied or waived, and our merger agreement with M&T could be terminated under certain circumstances; |
| • | the outcome of any judicial decision related to the settlement of existing class action lawsuits related to the Merger; |
| • | further delays in closing the Merger, including the possibility that the Merger may not be completed prior to the end of the extension period previously agreed to with M&T; and |
| • | difficulties and delays in the implementation of our Strategic Plan (as defined below) in the event the Merger is further delayed or is not completed. |
Our ability to predict results or the actual effects of our plans or strategies is inherently uncertain. As such, forward-looking statements can be affected by inaccurate assumptions we might make or by known or unknown risks and uncertainties. Consequently, no forward-looking statement can be guaranteed. Readers are cautioned not to place undue reliance on these forward-looking statements, which speak only as of the date of this filing. We do not intend to update any of the forward-looking statements after the date of this Form 10-K or to conform these statements to actual events.
As used in this Form 10-K, unless we specify otherwise, “Hudson City Bancorp,” and “Company,” refer to Hudson City Bancorp, Inc., a Delaware corporation. “Hudson City Savings” and “Bank” refer to Hudson City Savings Bank, a federal stock savings bank and the wholly-owned subsidiary of Hudson City Bancorp and “we,” “us,” “our” and “Hudson City” refer collectively to the Company and the Bank.
ii
Table of Contents
Hudson City Bancorp, Inc. Hudson City Bancorp is a Delaware corporation organized in 1999 and serves as the holding company of its only subsidiary, Hudson City Savings Bank. The principal asset of Hudson City Bancorp is its investment in Hudson City Savings Bank. As a savings and loan holding company, Hudson City Bancorp is subject to supervision and regulation by the Board of Governors of the Federal Reserve System (the “FRB”).
Hudson City Bancorp’s executive offices are located at West 80 Century Road, Paramus, New Jersey 07652 and our telephone number is (201) 967-1900.
On August 27, 2012, the Company entered into an Agreement and Plan of Merger (the “Merger Agreement”) with M&T and WTC. The Merger Agreement provides that, upon the terms and subject to the conditions set forth therein, Hudson City Bancorp will merge with and into WTC, with WTC continuing as the surviving entity.
On April 12, 2013, M&T and the Company announced that additional time would be required to obtain a regulatory determination on the applications necessary to complete the proposed Merger. On three occasions, Hudson City Bancorp and M&T have agreed to extend the date after which either party may elect to terminate the Merger Agreement, with the latest extension to April 30, 2015. Each extension was documented with an amendment to the Merger Agreement and the most recent amendment, Amendment No. 3, provides that the Company may terminate the Merger Agreement at any time if it reasonably determines that M&T is unlikely to be able to obtain the requisite regulatory approvals in time to permit the closing to occur on or prior to April 30, 2015. Amendment No. 3 and applicable provisions from the prior amendments, permit the Company to take certain interim actions without the prior approval of M&T, including with respect to the Bank’s conduct of business, implementation of its strategic plan, retention incentives and certain other matters with respect to Bank personnel, prior to the completion of the Merger. There can be no assurances that the Merger will be completed by April 30, 2015 or that the Company will not exercise its right to terminate the Merger Agreement in accordance with its terms.
Prior to the announcement of the Merger, the Company retained an outside consultant to assist management in developing a strategic plan (the “Strategic Plan”). The operational core of the Strategic Plan is the expansion of our loan and deposit product offerings over time to create more balanced sources of revenue and funding. We believe that the markets in which we operate provide significant opportunities for the Hudson City brand to capture market share in products and services that we have not actively pursued previously. The Strategic Plan includes initiatives such as:
| • | origination of residential mortgages for sale to the secondary mortgage market, |
| • | establishment of a commercial real estate lending unit, |
| • | the analysis of a balance sheet restructuring transaction, |
| • | establishment of a small business banking unit, |
| • | tactical deposit pricing, and |
| • | developing a more robust suite of consumer banking products. |
Prior to the execution of Amendment No.1, the implementation of the Strategic Plan was suspended pending completion of the Merger. When we announced the first extension of the Merger in April 2013, we charted a dual path for the Company. We continued to plan for the completion of the Merger, but we also refreshed the Strategic Plan prioritizing the matters that we could achieve during the pendency of the Merger such as secondary mortgage market operations and commercial real estate lending, and proceeded with planning for the implementation of those prioritized matters. Amendment No. 2 provided that the Company is permitted to
1
Table of Contents
proceed with the implementation of the Strategic Plan without any prior approval, consent or consultation with M&T, which provision remains in effect under Amendment No. 3. The Strategic Plan includes the implementation of our commercial real estate (“CRE”) lending initiative. During 2014, the Bank began to purchase CRE and multi-family mortgage loans and interests in such loans. The Bank purchased $86.6 million of such loans and interests in the fourth quarter of 2014. We expect to expand our CRE lending business by engaging in direct originations commencing in the second half of 2015. Many of the remaining initiatives in our Strategic Plan require significant lead time for full implementation and roll-out to our customers.
On March 30, 2012, the Bank entered into a Memorandum of Understanding with the OCC (the “Bank MOU”), which is substantially similar to and replaced the memorandum of understanding the Bank entered into with our former regulator, the Office of Thrift Supervision (the “OTS”), on June 24, 2011. In accordance with the Bank MOU, the Bank adopted and implemented enhanced operating policies and procedures that are intended to enable us to continue to: (a) reduce our level of interest rate risk, (b) reduce our funding concentration, (c) diversify our funding sources, (d) enhance our liquidity position, (e) monitor and manage loan modifications and (f) maintain our capital position in accordance with our existing capital plan. In addition, we developed the Strategic Plan for the Bank which establishes objectives for the Bank’s overall risk profile, earnings performance, growth and balance sheet mix and to enhance our enterprise risk management program. On February 26, 2015 the OCC terminated the Bank MOU.
The Company entered into a separate Memorandum of Understanding with the FRB (the “Company MOU”) on April 24, 2012, which is substantially similar to and replaced the memorandum of understanding the Company entered into with our former regulator, the OTS, on June 24, 2011. In accordance with the Company MOU, the Company must, among other things support the Bank’s compliance with the Bank MOU. The Company MOU also requires the Company to: (a) obtain approval from the FRB prior to receiving a capital distribution from the Bank or declaring a dividend to shareholders and (b) obtain approval from the FRB prior to repurchasing or redeeming any Company stock or incurring any debt with a maturity of greater than one year. In accordance with the Company MOU, the Company submitted a comprehensive capital plan and a comprehensive earnings plan to the FRB. While the Company believes it is in compliance in all material respects with the terms of the Company MOU, it will remain in effect until modified or terminated by the FRB.
Hudson City Savings. Hudson City Savings is a federally chartered stock savings bank subject to supervision and examination by the OCC. The Bank’s deposits are insured by the Federal Deposit Insurance Corporation (“FDIC”).
Hudson City Savings Bank has served its customers since 1868. We conduct our operations out of our corporate offices in Paramus in Bergen County, New Jersey and through 135 branches in the New York metropolitan area. We operate 97 branches located in 17 counties throughout the State of New Jersey. In New York State, we operate 10 branch offices in Westchester County, 12 branch offices in Suffolk County, 1 branch office each in Putnam and Rockland Counties and 5 branch offices in Richmond County (Staten Island). We also operate 9 branch offices in Fairfield County, Connecticut. We also open deposit accounts through our internet banking service.
We are a community and consumer-oriented retail savings bank offering traditional deposit products, residential real estate mortgage loans and consumer loans. In addition, we purchase residential mortgages, commercial real estate mortgages and interests in such loans and mortgage-backed securities and other securities issued by U.S. government-sponsored enterprises (“GSEs”) as well as other investments permitted by applicable laws and regulations. We currently retain substantially all of the loans we originate in our portfolio. As part of our Strategic Plan, beginning in the first quarter of 2016, we intend to originate loans for sale in the secondary market.
2
Table of Contents
Our revenues are derived principally from interest on our mortgage loans and mortgage-backed securities and interest and dividends on our investment securities. Our primary sources of funds are customer deposits, borrowings, scheduled amortization and prepayments of mortgage loans and mortgage-backed securities, maturities and calls of investment securities and funds provided by operations.
Available Information
Our periodic and current reports, proxy and information statements, and other information that we file with the Securities and Exchange Commission (the “SEC”), are available free of charge through our website, www.hcbk.com, as soon as reasonably practicable after such reports are filed with, or furnished to, the SEC. Unless specifically incorporated by reference, the information on our website is not part of this annual report. Such reports are also available on the SEC’s website at www.sec.gov, or at the SEC’s Public Reference Room at 100 F Street, NE, Washington, DC, 20549. Information may be obtained on the operation of the Public Reference Room by calling the SEC at 1-800-SEC-0330.
Market Area
Through our branch offices, we have operations in the New York metropolitan market area (which we define to include New York, New Jersey and Connecticut). Prior to 2010, we purchased first mortgage loans in states that are east of the Mississippi River and as far south as South Carolina. Loan purchase activity has declined significantly since 2010 and has been limited to our primary market area, which consists of New Jersey, New York and Connecticut. The decline in our loan purchase activity reflects our limited appetite for adding long-term fixed-rate mortgage loans to our portfolio in the current low market interest rate environment. Historically, our wholesale loan purchase program complemented our retail loan origination by enabling us to diversify our assets outside of our local market area.
The northern New Jersey market represents the greatest concentration of population, deposits and income in New Jersey. The combination of these counties represents more than half of the entire New Jersey population and more than half of New Jersey households. The northern New Jersey market also represents the greatest concentration of Hudson City Savings retail operations – both lending and deposit gathering – and based on its high level of economic activity, we believe that the northern New Jersey market provides significant opportunities for future growth. The New Jersey shore market represents a strong concentration of population and income, and is a popular resort and retirement market area, which provides healthy opportunities for deposit growth and residential lending. The southwestern New Jersey market consists of communities adjacent to the Philadelphia metropolitan area.
The New York counties of Richmond, Westchester, Suffolk, Rockland and Putnam as well as Fairfield County, Connecticut have similar demographic and economic characteristics to the northern New Jersey market area. Our entry into these counties, which started in 2004, has allowed us to expand our retail operations and geographic footprint.
We also open deposit accounts through our internet banking service which allows us to serve customers throughout the United States. As of December 31, 2014, we had $109.2 million of deposits that were opened through our internet banking service.
Our future growth opportunities will be influenced by the growth and stability of the regional economy, other demographic population trends and the competitive environment in the New York metropolitan area. During 2014 economic conditions improved at a moderate pace. The unemployment rate declined to 5.6% in December 2014 from 6.7% in 2013. Economic conditions in our primary market area continued to improve modestly during 2014 as evidenced by increased levels of home sale activity, higher real estate valuations and a decrease in the unemployment rate. Housing prices increased during 2014 as indicated by the S&P/Case-Shiller Home Price Indices. Approximately 84.8% of our mortgage loans are located in the New York metropolitan area. The
3
Table of Contents
Federal Housing Finance Agency (“FHFA”), an independent entity within the Department of Housing and Urban Development, publishes housing market data on a quarterly basis. According to the most recent data published by the FHFA, house prices in New Jersey have increased 1.95% from the third quarter of 2013. For New York house prices increased 1.55% and for Connecticut they decreased 1.27% during this same period. Additionally, according to the FHFA data, the states of Pennsylvania, Massachusetts, Virginia, Illinois and Maryland experienced increases in house prices of 1.73%, 4.69%, 0.92%, 3.56%, and 0.38%, respectively for those same periods. These eight states account for 96.3% of our total mortgage portfolio. We can give no assurance as to whether economic and housing conditions will continue to improve in the near future.
Competition
We face intense competition both in making loans and attracting deposits in the market areas we serve. New Jersey and the New York metropolitan area have a high concentration of financial institutions, many of which are branches of large money center banks and regional banks. Some of these competitors have greater resources than we do and may offer services that we do not provide such as trust services or investment services. Customers who seek “one-stop shopping” may be drawn to these institutions.
Our competition for loans comes principally from commercial banks, savings institutions, mortgage banking firms, credit unions, finance companies, insurance companies and brokerage firms. We have also faced increased competition for mortgage loans due to the unprecedented involvement of the GSEs in the mortgage market in recent years.
Our most direct competition for deposits comes from commercial banks, savings banks, savings and loan associations and credit unions. We face additional competition for deposits from short-term money market funds and other corporate and government securities funds and from brokerage firms and insurance companies.
Lending Activities
Loan Portfolio Composition. Our loan portfolio primarily consists of one- to four-family residential first mortgage loans, which represent 98.6% of total loans. The remaining loans in our portfolio include multi-family and commercial mortgage loans, construction loans and consumer loans, which primarily consist of fixed-rate second mortgage loans and home equity credit lines. Beginning in the fourth quarter of 2014, we began to diversify our loan portfolio through the purchase of commercial real estate loans and interests in such loans.
At December 31, 2014, we had total loans of $21.56 billion, of which $21.37 billion, or 99.1%, were first mortgage loans. Of the first mortgage loans outstanding at that date, 53.4% were fixed-rate mortgage loans and 46.6% were adjustable-rate mortgage (“ARM”) loans. At December 31, 2014, multi-family and commercial mortgage loans totaled $102.3 million, construction loans totaled $177,000, and consumer and other loans, primarily fixed-rate second mortgage loans and home equity credit lines, amounted to $194.2 million, or 0.9%, of total loans.
Our loans are subject to federal and state laws and regulations. The interest rates we charge on loans are affected principally by the demand for loans, the supply of money available for lending purposes and the interest rates offered by our competitors. These factors are, in turn, affected by general and local economic conditions, monetary policies of the federal government, including the FRB, legislative tax policies and governmental budgetary matters.
4
Table of Contents
The following table presents the composition of our loan portfolio in dollar amounts and in percentages of the total portfolio at the dates indicated:
| At December 31, | ||||||||||||||||||||||||||||||||||||||||
| 2014 | 2013 | 2012 | 2011 | 2010 | ||||||||||||||||||||||||||||||||||||
| Amount | Percent of Total |
Amount | Percent of Total |
Amount | Percent of Total |
Amount | Percent of Total |
Amount | Percent of Total |
|||||||||||||||||||||||||||||||
| (Dollars in thousands) | ||||||||||||||||||||||||||||||||||||||||
| First mortgage loans: |
||||||||||||||||||||||||||||||||||||||||
| One- to four-family |
$ | 20,620,173 | 95.62 | % | $ | 23,167,644 | 96.08 | % | $ | 26,119,764 | 96.41 | % | $ | 28,260,772 | 96.35 | % | $ | 30,049,398 | 97.17 | % | ||||||||||||||||||||
| FHA/VA |
648,070 | 3.01 | 704,532 | 2.92 | 687,172 | 2.54 | 734,781 | 2.51 | 499,724 | 1.62 | ||||||||||||||||||||||||||||||
| Multi-family and commercial |
102,323 | 0.47 | 25,671 | 0.11 | 32,259 | 0.12 | 39,634 | 0.14 | 48,067 | 0.16 | ||||||||||||||||||||||||||||||
| Construction |
177 | — | 294 | — | 4,669 | 0.02 | 4,929 | 0.02 | 9,081 | 0.03 | ||||||||||||||||||||||||||||||
|
|
|
|
|
|
|
|
|
|
|
|
|
|
|
|
|
|
|
|
|
|||||||||||||||||||||
| Total first mortgage loans |
21,370,743 | 99.10 | 23,898,141 | 99.11 | 26,843,864 | 99.09 | 29,040,116 | 99.02 | 30,606,270 | 98.98 | ||||||||||||||||||||||||||||||
|
|
|
|
|
|
|
|
|
|
|
|
|
|
|
|
|
|
|
|
|
|||||||||||||||||||||
| Consumer and other loans: |
||||||||||||||||||||||||||||||||||||||||
| Fixed-rate second mortgages |
72,309 | 0.34 | 86,079 | 0.36 | 106,239 | 0.39 | 131,597 | 0.45 | 160,896 | 0.52 | ||||||||||||||||||||||||||||||
| Home equity credit lines |
104,372 | 0.48 | 108,550 | 0.45 | 119,872 | 0.44 | 134,502 | 0.46 | 137,467 | 0.44 | ||||||||||||||||||||||||||||||
| Other |
17,550 | 0.08 | 20,059 | 0.08 | 20,904 | 0.08 | 21,130 | 0.07 | 19,264 | 0.06 | ||||||||||||||||||||||||||||||
|
|
|
|
|
|
|
|
|
|
|
|
|
|
|
|
|
|
|
|
|
|||||||||||||||||||||
| Total consumer and other loans |
194,231 | 0.90 | 214,688 | 0.89 | 247,015 | 0.91 | 287,229 | 0.98 | 317,627 | 1.02 | ||||||||||||||||||||||||||||||
|
|
|
|
|
|
|
|
|
|
|
|
|
|
|
|
|
|
|
|
|
|||||||||||||||||||||
| Total loans |
21,564,974 | 100.00 | % | 24,112,829 | 100.00 | % | 27,090,879 | 100.00 | % | 29,327,345 | 100.00 | % | 30,923,897 | 100.00 | % | |||||||||||||||||||||||||
|
|
|
|
|
|
|
|
|
|
|
|||||||||||||||||||||||||||||||
| Deferred loan costs |
99,155 | 105,480 | 97,534 | 83,805 | 86,633 | |||||||||||||||||||||||||||||||||||
| Allowance for loan losses |
(235,317 | ) | (276,097 | ) | (302,348 | ) | (273,791 | ) | (236,574 | ) | ||||||||||||||||||||||||||||||
|
|
|
|
|
|
|
|
|
|
|
|||||||||||||||||||||||||||||||
| Net Loans |
$ | 21,428,812 | $ | 23,942,212 | $ | 26,886,065 | $ | 29,137,359 | $ | 30,773,956 | ||||||||||||||||||||||||||||||
|
|
|
|
|
|
|
|
|
|
|
|||||||||||||||||||||||||||||||
5
Table of Contents
The following tables present the composition of our loan portfolio by credit quality indicator at the dates indicated:
| Credit Risk Profile based on Payment Activity | ||||||||||||||||||||||||||||||||
| (In thousands) | ||||||||||||||||||||||||||||||||
| One-to four- family first mortgage loans |
Other first Mortgages | Consumer and Other | Total Loans | |||||||||||||||||||||||||||||
| Amortizing | Interest-only | Multi-family and Commercial |
Construction | Fixed-rate second mortgages |
Home Equity credit lines |
Other | ||||||||||||||||||||||||||
| December 31, 2014 |
||||||||||||||||||||||||||||||||
| Performing |
$ | 17,652,318 | $ | 2,774,245 | $ | 100,780 | $ | — | $ | 71,056 | $ | 100,607 | $ | 13,955 | $ | 20,712,961 | ||||||||||||||||
| Non-performing |
741,901 | 99,779 | 1,543 | 177 | 1,253 | 3,765 | 3,595 | 852,013 | ||||||||||||||||||||||||
|
|
|
|
|
|
|
|
|
|
|
|
|
|
|
|
|
|||||||||||||||||
| Total |
$ | 18,394,219 | $ | 2,874,024 | $ | 102,323 | $ | 177 | $ | 72,309 | $ | 104,372 | $ | 17,550 | $ | 21,564,974 | ||||||||||||||||
|
|
|
|
|
|
|
|
|
|
|
|
|
|
|
|
|
|||||||||||||||||
| December 31, 2013 |
||||||||||||||||||||||||||||||||
| Performing |
$ | 19,319,959 | $ | 3,513,504 | $ | 22,482 | $ | — | $ | 84,667 | $ | 104,655 | $ | 18,318 | $ | 23,063,585 | ||||||||||||||||
| Non-performing |
903,485 | 135,228 | 3,189 | 294 | 1,412 | 3,895 | 1,741 | 1,049,244 | ||||||||||||||||||||||||
|
|
|
|
|
|
|
|
|
|
|
|
|
|
|
|
|
|||||||||||||||||
| Total |
$ | 20,223,444 | $ | 3,648,732 | $ | 25,671 | $ | 294 | $ | 86,079 | $ | 108,550 | $ | 20,059 | $ | 24,112,829 | ||||||||||||||||
|
|
|
|
|
|
|
|
|
|
|
|
|
|
|
|
|
|||||||||||||||||
| Credit Risk Profile by Internally Assigned Grade | ||||||||||||||||||||||||||||||||
| (In thousands) | ||||||||||||||||||||||||||||||||
| One-to four- family first mortgage loans |
Other first Mortgages | Consumer and Other | Total Loans | |||||||||||||||||||||||||||||
| Amortizing | Interest-only | Multi-family and Commercial |
Construction | Fixed-rate second mortgages |
Home Equity credit lines |
Other | ||||||||||||||||||||||||||
| December 31, 2014 |
||||||||||||||||||||||||||||||||
| Pass |
$ | 17,447,845 | $ | 2,744,846 | $ | 94,858 | $ | — | $ | 70,669 | $ | 97,905 | $ | 13,385 | $ | 20,469,508 | ||||||||||||||||
| Special mention |
89,166 | 10,926 | 1,180 | — | 71 | 252 | 118 | 101,713 | ||||||||||||||||||||||||
| Substandard |
857,208 | 118,252 | 6,285 | 177 | 1,569 | 6,215 | 4,047 | 993,753 | ||||||||||||||||||||||||
|
|
|
|
|
|
|
|
|
|
|
|
|
|
|
|
|
|||||||||||||||||
| Total |
$ | 18,394,219 | $ | 2,874,024 | $ | 102,323 | $ | 177 | $ | 72,309 | $ | 104,372 | $ | 17,550 | $ | 21,564,974 | ||||||||||||||||
|
|
|
|
|
|
|
|
|
|
|
|
|
|
|
|
|
|||||||||||||||||
| December 31, 2013 |
||||||||||||||||||||||||||||||||
| Pass |
$ | 19,218,917 | $ | 3,480,909 | $ | 15,281 | $ | — | $ | 84,233 | $ | 102,364 | $ | 17,157 | $ | 22,918,861 | ||||||||||||||||
| Special mention |
108,957 | 19,866 | 980 | — | 129 | 875 | 45 | 130,852 | ||||||||||||||||||||||||
| Substandard |
895,570 | 147,957 | 9,410 | 294 | 1,717 | 5,311 | 2,857 | 1,063,116 | ||||||||||||||||||||||||
|
|
|
|
|
|
|
|
|
|
|
|
|
|
|
|
|
|||||||||||||||||
| Total |
$ | 20,223,444 | $ | 3,648,732 | $ | 25,671 | $ | 294 | $ | 86,079 | $ | 108,550 | $ | 20,059 | $ | 24,112,829 | ||||||||||||||||
|
|
|
|
|
|
|
|
|
|
|
|
|
|
|
|
|
|||||||||||||||||
Loan classifications are defined as follows:
| • | Pass – These loans are protected by the current net worth and paying capacity of the obligor (or guarantors, if any) or by the fair value, less cost to acquire and sell, of any underlying collateral in a timely manner. |
| • | Special Mention – These loans have potential weaknesses that deserve management’s close attention. If left uncorrected, these potential weaknesses may result in deterioration of repayment prospects. |
| • | Substandard – These loans are inadequately protected by the current net worth and paying capacity of the obligor or by the collateral pledged, if any. Assets so classified must have a well-defined weakness, or weaknesses that jeopardize the liquidation of the debt. They are characterized by the distinct possibility that we will sustain some loss if the deficiencies are not corrected. |
| • | Doubtful – These loans have all the weaknesses inherent in a loan classified substandard with the added characteristic that the weaknesses make the full recovery of our principal balance highly questionable and improbable on the basis of currently known facts, conditions, and values. The likelihood of a loss on an asset or portion of an asset classified Doubtful is high. Its classification as Loss is not appropriate, however, because pending events are expected to materially affect the amount of loss. |
6
Table of Contents
| • | Loss – These loans are considered uncollectible and of such little value that a charge-off is warranted. This classification does not necessarily mean that an asset has no recovery or salvage value; but rather, there is much doubt about whether, how much, or when the recovery will occur. |
We evaluate the classification of our one-to four-family mortgage loans, consumer loans and other loans primarily on a pooled basis by delinquency. Loans that are past due 60 to 89 days are classified as special mention and loans that are past due 90 days or more, as well as impaired loans, are classified as substandard. We obtain updated valuations for one- to four- family mortgage loans by the time a loan becomes 180 days past due. If necessary, we charge-off an amount to reduce the carrying value of the loan to the value of the underlying property, less estimated selling costs. Since we record the charge-off when we receive the updated valuation, we typically do not have any residential first mortgages classified as doubtful or loss. We evaluate troubled debt restructurings individually, as well as multi-family, commercial and construction loans when they become 120 days past due and base our classification on the debt service capability of the underlying property as well as secondary sources of repayment such as the borrower’s and any guarantor’s ability and willingness to provide debt service. Residential mortgage loans that are classified as troubled debt restructurings are individually evaluated for impairment based on the present value of each loan’s expected future cash flows.
The following table presents the geographic distribution of loans in our portfolio at the dates indicated:
| At December 31, 2014 | At December 31, 2013 | |||||||
| Percentage of Loans by | Percentage of Loans by | |||||||
| State to Total loans | State to Total loans | |||||||
| New Jersey |
42.4 | % | 42.5 | % | ||||
| New York |
27.8 | 27.1 | ||||||
| Connecticut |
14.6 | 14.9 | ||||||
|
|
|
|
|
|||||
| Total New York metropolitan area |
84.8 | 84.5 | ||||||
|
|
|
|
|
|||||
| Pennsylvania |
4.8 | 4.9 | ||||||
| Massachusetts |
2.0 | 1.8 | ||||||
| Virginia |
1.6 | 1.8 | ||||||
| Illinois |
1.5 | 1.6 | ||||||
| Maryland |
1.6 | 1.7 | ||||||
| All others |
3.7 | 3.7 | ||||||
|
|
|
|
|
|||||
| Total outside the New York metropolitan area |
15.2 | 15.5 | ||||||
|
|
|
|
|
|||||
| 100.0 | % | 100.0 | % | |||||
|
|
|
|
|
|||||
7
Table of Contents
Loan Maturity. The following table presents the contractual maturity of our loans at December 31, 2014. The table does not include the effect of prepayments or scheduled principal amortization. Prepayments and scheduled principal amortization on first mortgage loans totaled $3.70 billion for 2014, $6.27 billion for 2013 and $7.03 billion for 2012.
| At December 31, 2014 | ||||||||||||||||||||
| One-to four- Family First Mortgages |
Multi-family and Commercial Mortgages |
Construction | Consumer and Other Loans |
Total | ||||||||||||||||
| (In thousands) | ||||||||||||||||||||
| Amounts Due: |
||||||||||||||||||||
| One year or less |
$ | 854 | 1,970 | 177 | 12,703 | $ | 15,704 | |||||||||||||
|
|
|
|
|
|
|
|
|
|
|
|||||||||||
| After one year: |
||||||||||||||||||||
| One to three years |
30,408 | 2,002 | — | 5,804 | 38,214 | |||||||||||||||
| Three to five years |
125,266 | 19,276 | — | 6,622 | 151,164 | |||||||||||||||
| Five to ten years |
408,030 | 71,634 | — | 29,140 | 508,804 | |||||||||||||||
| Ten to twenty years |
4,206,966 | 7,441 | — | 136,566 | 4,350,973 | |||||||||||||||
| Over twenty years |
16,496,719 | — | — | 3,396 | 16,500,115 | |||||||||||||||
|
|
|
|
|
|
|
|
|
|
|
|||||||||||
| Total due after one year |
21,267,389 | 100,353 | — | 181,528 | 21,549,270 | |||||||||||||||
|
|
|
|
|
|
|
|
|
|
|
|||||||||||
| Total loans |
$ | 21,268,243 | $ | 102,323 | $ | 177 | $ | 194,231 | 21,564,974 | |||||||||||
|
|
|
|
|
|
|
|
|
|||||||||||||
| Deferred loan costs |
99,155 | |||||||||||||||||||
| Allowance for loan losses |
(235,317 | ) | ||||||||||||||||||
|
|
|
|||||||||||||||||||
| Net loans |
$ | 21,428,812 | ||||||||||||||||||
|
|
|
|||||||||||||||||||
The following table presents, as of December 31, 2014, the dollar amounts of all fixed-rate and adjustable-rate loans that are contractually due after December 31, 2015:
| Due After December 31, 2015 | ||||||||||||
| Fixed | Adjustable | Total | ||||||||||
| (In thousands) | ||||||||||||
| One-to-four family first mortgage loans |
$ | 11,406,524 | $ | 9,860,865 | $ | 21,267,389 | ||||||
| Multi-family and commercial mortgages |
11,275 | 89,078 | 100,353 | |||||||||
| Consumer and other loans |
73,064 | 108,464 | 181,528 | |||||||||
|
|
|
|
|
|
|
|||||||
| Total loans due after one year |
$ | 11,490,863 | $ | 10,058,407 | $ | 21,549,270 | ||||||
|
|
|
|
|
|
|
|||||||
8
Table of Contents
The following table presents our loan originations, purchases, sales and principal payments for the periods indicated:
| For the Year Ended December 31, | ||||||||||||
| 2014 | 2013 | 2012 | ||||||||||
| (In thousands) | ||||||||||||
| Total loans: |
||||||||||||
| Balance outstanding at beginning of period |
$ | 24,112,829 | $ | 27,090,879 | $ | 29,327,345 | ||||||
|
|
|
|
|
|
|
|||||||
| Originations: |
||||||||||||
| First mortgage loans (1) |
1,098,166 | 3,443,460 | 4,976,263 | |||||||||
| Consumer and other loans |
46,974 | 52,719 | 58,907 | |||||||||
|
|
|
|
|
|
|
|||||||
| Total originations |
1,145,140 | 3,496,179 | 5,035,170 | |||||||||
|
|
|
|
|
|
|
|||||||
| Purchases: |
||||||||||||
| One- to four-family first mortgage loans |
167,139 | 96,892 | 28,742 | |||||||||
| Multi-family and commercial first mortgage loans |
86,577 | — | — | |||||||||
|
|
|
|
|
|
|
|||||||
| Total purchases |
253,716 | 96,892 | 28,742 | |||||||||
|
|
|
|
|
|
|
|||||||
| Less: |
||||||||||||
| Principal payments: |
||||||||||||
| First mortgage loans (1) |
(3,583,393 | ) | (6,273,486 | ) | (7,029,457 | ) | ||||||
| FHA loan sale |
(112,113 | ) | — | — | ||||||||
| Consumer and other loans |
(66,750 | ) | (84,493 | ) | (98,660 | ) | ||||||
|
|
|
|
|
|
|
|||||||
| Total principal payments |
(3,762,256 | ) | (6,357,979 | ) | (7,128,117 | ) | ||||||
|
|
|
|
|
|
|
|||||||
| Premium amortization and discount accretion, net |
(169 | ) | 1,483 | 2,626 | ||||||||
| Transfers to foreclosed real estate |
(123,625 | ) | (126,771 | ) | (87,787 | ) | ||||||
| Charge-offs: |
||||||||||||
| First mortgage loans (1) |
(59,978 | ) | (87,288 | ) | (86,636 | ) | ||||||
| Consumer and other loans |
(683 | ) | (566 | ) | (464 | ) | ||||||
|
|
|
|
|
|
|
|||||||
| Balance outstanding at end of period |
$ | 21,564,974 | $ | 24,112,829 | $ | 27,090,879 | ||||||
|
|
|
|
|
|
|
|||||||
| (1) | Includes Multi-family, Commercial and Construction loans |
Residential Mortgage Lending. Historically, our primary lending emphasis has been the origination and purchase of first mortgage loans secured by one- to four-family properties that serve as the primary or secondary residence of the owner. We do not offer loans secured by cooperative apartment units or interests therein. We currently originate and purchase substantially all of our one- to four-family first mortgage loans for retention in our portfolio. We specialize in residential mortgage loans with principal balances in excess of the Fannie Mae, single-family limit which, prior to 2008, was $417,000 (“non-conforming” or “jumbo” loans). Beginning in 2008, Fannie Mae instituted two sets of loan limits—a conforming loan limit at $417,000 and a “high-cost” loan limit at $729,750. On October 1, 2011, the “high-cost’ loan limit was reduced to $625,500.
Most of our retail loan originations are from licensed mortgage bankers or brokers, existing or past customers, members of our local communities or referrals from local real estate agents, attorneys and builders. Our extensive branch network is also a source of new loan generation. We also employ a staff of representatives who call on real estate professionals to disseminate information regarding our loan programs and take applications directly from their clients. These representatives are paid for each origination. Originated loans represent 80.3% of our one- to four- family first mortgage loans.
9
Table of Contents
We currently offer loans that generally conform to underwriting standards specified by Fannie Mae (“conforming loans”) and non-conforming loans. These loans may be fixed-rate one- to four-family mortgage loans or adjustable-rate one- to four-family mortgage loans with maturities of up to 30 years. The average size of our one- to four-family mortgage loans originated in 2014 was approximately $588,000. The overall average size of our one- to four-family first mortgage loans held in portfolio was approximately $387,000 and $413,000 at December 31, 2014 and 2013, respectively. With the exception of certain non-performing loans that were sold back to the financial institution that originally sold the loans to the Bank, we sold no loans in 2014, 2013 or 2012 and had no loans classified as held for sale at December 31, 2014.
Our originations of residential first mortgage loans amounted to $1.10 billion in 2014, $3.44 billion in 2013 and $4.98 billion in 2012. Included in these totals are refinancings of our existing first mortgage loans as follows:
| Percent of | ||||||||
| First Mortgage | ||||||||
| Amount | Loan Originations | |||||||
| (In thousands) | ||||||||
| 2014 |
$ | 167,384 | 14.5 | % | ||||
| 2013 |
$ | 850,997 | 23.7 | |||||
| 2012 |
$ | 1,334,841 | 26.7 | |||||
We offer a variety of adjustable-rate and fixed-rate one- to four-family mortgage loans with maximum loan to value (“LTV”) ratios that depend on the type of property and the size of loan involved. The LTV ratio is the loan amount divided by the appraised value of the property. The LTV ratio is a measure commonly used by financial institutions to determine exposure to risk. Loans on owner-occupied one- to four-family homes of up to $1.0 million are generally subject to a maximum LTV ratio of 80%. LTV ratios of 75% or less are generally required for one- to four-family loans in excess of $1.0 million and less than $1.5 million. Loans in excess of $1.5 million and less than $2.0 million are generally subject to a maximum LTV ratio of 70%. Loans in excess of $2.0 million and up to $2.5 million are generally subject to a maximum LTV ratio of 65%. Loans in excess of $2.5 million and up to $3.0 million are generally subject to a maximum LTV ratio of 60%. We typically do not originate mortgage loans in excess of $3.0 million.
We also offer a variety of ARM loans secured by one- to four-family residential properties with a fixed rate for initial terms of three years, five years, seven years or ten years. After the initial adjustment period, ARM loans adjust on an annual basis. These loans are originated in amounts generally up to $1.0 million. The ARM loans that we currently originate have a maximum 30-year amortization period and are generally subject to the LTV ratios described above. The interest rates on ARM loans fluctuate based upon a fixed spread above the monthly average yield on United States Treasury securities adjusted to a constant maturity of one year and generally are subject to a maximum increase or decrease of 2% per adjustment period and a limitation on the aggregate adjustment of 5% over the life of the loan. As a result of generally low market interest rates for ARM loans, the initial offered rates on these loans ranged from 2.625% to 4.000% while the current fully indexed rate was 3.000% at December 31, 2014. We originated $931.5 million of one- to four-family ARM loans in 2014. At December 31, 2014, 46.4% of our one- to four-family mortgage loans consisted of ARM loans.
The origination and retention of ARM loans helps reduce exposure to increases in interest rates. However, ARM loans can pose credit risks different from the risks inherent in fixed-rate loans, primarily because as interest rates rise, the underlying payments of the borrower may rise, which increases the potential for default. The marketability of the underlying property also may be adversely affected by higher interest rates. In order to minimize risks, we evaluate borrowers of ARM loans based on their ability to repay the loans at the higher of the initial interest rate or the fully indexed rate. On January 10, 2014, the Bank began to utilize the guidelines included in Appendix Q of the qualified mortgage regulation when qualifying ARM borrowers. We have not in the past, nor do we currently, originate ARM loans that provide for negative amortization of principal.
10
Table of Contents
Historically, our wholesale loan purchase program complemented our retail loan origination production by enabling us to diversify assets outside our local market area. At December 31, 2014, $4.11 billion, or 19.3%, of our one- to four-family first mortgage loans were purchased loans. Our loan purchase activity has significantly declined reflecting our limited appetite for adding long term fixed rate mortgage loans to our portfolio in the current low market interest rate environment. We expect that the amount of loan purchases will continue to be at reduced levels for the near future.
We have developed written standard operating guidelines relating to the purchase of these assets. These guidelines include an evaluation and approval process for the various sellers from whom we choose to buy whole loans, the acceptable types of whole loans and acceptable property locations. The purchase agreements, as established with each seller/servicer, contain parameters of the loan characteristics that can be included in each package. These parameters, such as maximum loan size and maximum weighted average LTV, generally conform to parameters utilized by us to originate mortgage loans. Loans are reviewed for compliance with the agreed upon parameters. Purchased loan packages are subject to internal due diligence procedures including review of a sampling of individual loan files. We generally perform full credit reviews of 10% to 20% of the mortgage loans in each package purchased. Our due diligence procedures include a review of the legal documents, including the note, the mortgage and the title policy, review of the credit file, evaluating debt service ratios, review of the appraisal and verifying LTV ratios and evaluating the completeness of the loan package. This review subjects the loan files in the sample to substantially the same underwriting standards used in our own loan origination process. We maintain custody of the legal documents including the original note.
We purchased first mortgage loans of $253.7 million in 2014, $96.9 million in 2013 and $28.7 million in 2012. The average size of our one-to four-family mortgage loans purchased during 2014 was approximately $215,000. During 2014, loan purchases included $86.6 million of CRE and multi-family mortgage loans. The remaining loans purchased in 2014 were loans guaranteed by the Federal Housing Administration (the “FHA”). Substantially all of the loans purchased in 2013 and 2012 were loans guaranteed by the FHA.
We also originate, and in the past have purchased, interest-only mortgage loans. These loans are designed for customers who desire flexible amortization schedules. These loans are originated as ARM loans with initial terms of five, seven or ten years with the interest-only portion of the payment based upon the initial loan term, or offered on a 30-year fixed-rate loan, with interest-only payments for the first 10 years of the obligation. At the end of the initial 5-, 7- or 10-year interest-only period the loan payment will adjust to include both principal and interest and will amortize over the remaining term so the loan will be repaid at the end of its original life. These loans are underwritten using fully amortizing payment amounts, more restrictive standards and generally are made with lower LTV limitations imposed to help minimize any potential credit risk. These loans may involve higher risks compared to standard loan products since there is the potential for higher payments once the interest rate resets and the principal begins to amortize and they rely on a stable or rising housing market to maintain an acceptable LTV ratio. However, we do not believe these programs will have a material adverse impact on our asset quality based on our underwriting criteria and the average LTV ratios on the loans originated in this program. During 2014, we originated $101.2 million of interest-only loans with an average LTV ratio of 58.9% based on the appraised value at the time of origination. The outstanding principal balance of interest-only loans in our portfolio was approximately $2.87 billion as of December 31, 2014. Non-performing interest-only loans amounted to $99.8 million, or 11.7%, of non-performing loans at December 31, 2014 as compared to non-performing interest-only loans of $135.2 million, or 12.9%, of non-performing loans at December 31, 2013. We have not in the past, nor do we currently, originate or purchase option ARM loans, where the borrower is given various payment options that could change payment flows to the Bank. For a description of guidance on nontraditional mortgage products, see “Regulation of Hudson City Savings Bank and Hudson City Bancorp.”
In addition to our full documentation loan program, prior to January 2014, we originated loans to certain eligible borrowers as reduced documentation loans. We discontinued our reduced documentation loan program in January 2014 in order to comply with the Consumer Financial Protection Bureau’s (the “CFPB”) new requirements to validate a borrower’s ability to repay and the corresponding safe harbor for loans that meet the requirements for a “qualified mortgage”. Loans that were eligible for reduced documentation processing were
11
Table of Contents
ARM loans, interest-only first mortgage loans and 10-, 15-, 20- and 30-year fixed-rate loans to owner-occupied primary and second home applicants. These loans were available in amounts up to 65% of the lower of the appraised value or purchase price of the property. Generally the maximum loan amount for reduced documentation loans was $750,000 and these loans were subject to higher interest rates than our full documentation loan products. We originated $156.2 million of reduced documentation loans in 2014, for applications received prior to discontinuing our reduced documentation program, as compared to $780.2 million in 2013. Reduced documentation loans represent 21.7% of our one- to four-family first mortgage loans at December 31, 2014. Included in our loan portfolio at December 31, 2014 are $3.99 billion of amortizing reduced documentation loans and $620.0 million of reduced documentation interest-only loans as compared to $4.27 billion and $826.5 million, respectively, at December 31, 2013. Non-performing loans at December 31, 2014 include $168.2 million of amortizing reduced documentation loans and $39.8 million of interest-only reduced documentation loans as compared to $182.9 million and $48.8 million, respectively, at December 31, 2013.
In January 2013, the Consumer Financial Protection Bureau (the “CFPB”) issued a series of final rules related to mortgage loan origination and mortgage loan servicing. Among other things, these final rules, which went into effect on January 10, 2014, prohibit creditors, such as Hudson City Savings, from extending mortgage loans without regard to the consumer’s ability to repay and establishes certain protections from liability for loans that meet the requirements of a “qualified mortgage.” As of January 10, 2014, we only originate loans that meet the requirements of a “qualified mortgage”, except we may continue to originate interest only loans subject to our compliance with the ability to repay provisions of the CFPB’s final rule. As a result, in January 2014 we discontinued our reduced documentation loan program in order to comply with the newly effective CFPB requirements to validate a borrower’s ability to repay and the corresponding safe harbor for qualified mortgages. Accordingly, our loan production volume decreased in 2014. See “Regulation of Hudson City Savings Bank and Hudson City Bancorp.”
We offer mortgage programs designed to address the credit needs of low and moderate-income home mortgage applicants and low and moderate-income home improvement loan applicants. We define low and moderate-income applicants as borrowers residing in low- and moderate-income census tracts or households with income not greater than 80% of the median income of the Metropolitan Statistical Area in the county where the subject property is located. Among the features of the low- and moderate-income home mortgage programs are reduced rates, reduced fees and closing costs, and generally less restrictive requirements for qualification compared with our traditional one- to four-family mortgage loans. For example, these programs have generally provided for loans with up to 80% LTV ratios and rates which are 25 basis points lower than our traditional mortgage loans. In 2014, we originated $1.4 million in mortgage loans under these programs.
Origination and Sale in the Secondary Market of Residential Mortgage Loans. In accordance with our Strategic Plan, we intend to begin to originate residential mortgage loans that conform to GSE guidelines for sale to the GSEs by the end of the first quarter of 2016. Initially, all loans sold to the GSEs will be serviced by a third party subservicing vendor, however, we intend to enhance our servicing function to allow us to service our sold portfolio in the future. As we originate, sell and service our sold loan portfolio, we would expect to have a mortgage servicing rights asset build up over time. We are currently in the process of hiring secondary mortgage market professionals, enhancing our existing servicing program, building out necessary systems and establishing processes and procedures for originating and selling residential mortgage loans to the GSEs.
Multi-family and Commercial Mortgage Loans. At December 31, 2014, $102.3 million, or 0.47%, of the total loan portfolio consisted of multi-family and commercial mortgage loans. Commercial mortgage loans are secured by office buildings and other commercial properties. Multi-family mortgage loans generally are secured by multi-family rental properties (including mixed-use buildings and walk-up apartments). The composition of these loans includes a legacy portfolio that is primarily loans that were acquired in the acquisition of Sound Federal Bancorp, Inc. in 2006 (the “Legacy Portfolio”) and loans originated in 2014 as part of the newly created commercial real estate lending program. During 2014 we hired commercial real estate
12
Table of Contents
professionals, built out necessary systems and established processes and procedures for originating, purchasing and monitoring commercial real estate loans. As part of our strategic initiative, we have begun to purchase CRE and multi-family loans and interests in such loans that are secured by mixed-used buildings, retail properties, apartments and office buildings. We expect to expand our CRE lending business by engaging in direct originations commencing in the second half of 2015.
The Legacy Portfolio has 50 loans totaling $19.7 million which are not strategic holdings or relationships. The remainder of the portfolio consists of 8 newly purchased loans and a loan syndication totaling $86.6 million. Although the new loans are all secured by multi-family rental properties, we anticipate that we will originate mortgage loans on office buildings, mixed-use buildings and retail properties in the future.
At December 31, 2014, the largest commercial mortgage loan was a loan participation in which our interest had a principal balance of $25.0 million and was secured by a multi-family rental property. This loan was a portion of an $82.0 million syndicated loan.
Loans secured by multi-family and commercial real estate generally are larger than one-to four-family residential loans and involve a greater degree of risk. Commercial mortgage loans can involve large loan balances to single borrowers or groups of related borrowers. Such loans depend to a large degree, on the results of operations and management of the properties or underlying businesses, and may be affected to a greater extent by adverse conditions in the real estate market or in the economy in general.
Consumer Loans. At December 31, 2014, consumer and other loans amounted to $194.2 million, or 0.90%, of our total loans and consisted primarily of fixed-rate second mortgage loans and home equity credit lines. Consumer loans generally have shorter terms to maturity, relative to our mortgage portfolio, which reduces our exposure to changes in interest rates. Consumer loans generally carry higher rates of interest than do one- to four-family residential mortgage loans. In addition, we believe that offering consumer loan products helps to expand and create stronger ties to our existing customer base by increasing the number of customer relationships and providing cross-marketing opportunities.
We offer fixed-rate second mortgage loans generally in amounts up to $250,000 secured by owner-occupied one- to four-family residences located in the State of New Jersey, and the portions of New York and Connecticut served by our first mortgage loan products, for terms of up to 20 years. At December 31, 2014 these loans totaled $72.3 million, or 0.34%, of total loans. The underwriting standards applicable to these loans generally are the same as one- to four-family first mortgage loans, except that the combined LTV ratio, including the balance of the first mortgage, generally cannot exceed 75% of the appraised value of the property at time of origination.
Our home equity credit line loans totaled $104.4 million, or 0.48%, of total loans at December 31, 2014. These loans are either fixed-rate or adjustable-rate loans secured by a first or second mortgage on owner-occupied one-to four-family residences located in our market area. The interest rates on adjustable-rate home equity credit lines are based on the “prime rate” as published in The Wall Street Journal (the “Index”) subject to certain interest rate limitations. Interest rates on home equity credit lines are adjusted monthly based upon changes in the Index. Minimum monthly principal payments on currently offered home equity lines of credit are based on 1/240th of the outstanding principal balance or $100, whichever is greater. The maximum credit line generally available is $250,000. The underwriting terms and procedures applicable to these loans are substantially the same as for our fixed-rate second mortgage loans.
Other loans totaled $17.5 million at December 31, 2014 and consisted of collateralized passbook loans, overdraft protection loans, unsecured personal loans, and secured and unsecured commercial lines of credit. We have not originated unsecured personal loans since 2005.
13
Table of Contents
Loan Approval Procedures and Authority. All residential mortgage loans up to $600,000 must be approved by two underwriting officers in the Mortgage Origination Department. Residential mortgage loans in excess of $600,000 up to $1.0 million in size require that one of the two officers signing off on the loan be a senior underwriting staff member assigned and approved by senior management in the Mortgage Origination area or any officer bearing the title of First Vice President-Mortgage Officer, Senior Vice President-Mortgage Officer, Executive Vice President-Lending, Chief Operating Officer or Chief Executive Officer prior to issuance of a commitment letter. Residential mortgage loans in excess of $1.0 million up to $3.0 million require that in addition to the standard underwriter approval, one of the officers signing off on the loan must be a senior underwriting staff member assigned and approved by senior management in the Mortgage Origination area and one additional officer signing off on the loan must bear the title of the First Vice President-Mortgage Officer, Senior Vice President-Mortgage Officer, Executive Vice President-Lending, Chief Operating Officer or Chief Executive Officer prior to issuance of a commitment letter. Residential mortgage loans in excess of $3.0 million require that in addition to the standard underwriter approval, two additional signatures are required with the officers bearing the title of Senior Vice President-Mortgage Officer, Executive Vice President-Lending, Chief Operating Officer or Chief Executive Officer prior to issuance of a commitment letter. Loan requests in excess of $5.0 million must be approved by at least two of the following senior officers, Executive Vice President-Lending, Chief Operating Officer or Chief Executive Officer and will be reported to the Board of Directors at the next regularly scheduled Board meeting. The maximum number of first mortgage loans outstanding at any one time per borrower (obligor on the note) shall not exceed three loans with only one loan being permitted for investment purposes. The aggregate of all residential loans, existing and/or committed to any one borrower, generally shall not exceed $5.0 million. Aggregate loan balances exceeding this limit must be approved by at least two of the following senior officers: Executive Vice President-Lending, Chief Operating Officer or Chief Executive Officer and will be reported to the Board of Directors at the next regularly scheduled Board meeting.
Historically, our primary lending emphasis has been the origination and purchase of residential first mortgage loans. During 2014, we began to purchase CRE loans and interests in such loans. All commercial real estate loans are independently underwritten to standards defined in our Commercial Real Estate Credit Policy. Prior to issuance of a commitment letter, all CRE loans must be approved by the Commercial Loan Committee comprised of senior officers, including the Company’s Chief Executive Officer, Chief Operating Officer and Chief Financial Officer. All commercial real estate lending activity is reported to the Board of Directors at their next regular meeting.
Home equity credit lines and fixed-rate second mortgage loans in principal amounts of $50,000 or less require approval by one of our designated Consumer Loan Department underwriters. Home equity credit lines and fixed-rate home equity loans in excess of $50,000, up to the $250,000 maximum, require approval by an underwriter and either our Consumer Loan Officer, Executive Vice President-Lending, Chief Executive Officer or Chief Operating Officer. Home equity credit lines and loans involving mortgage liens where the combined first and second mortgage principal balances exceed $750,000 require approval by an underwriter, our Consumer Loan Officer and either our Executive Vice President-Lending, Chief Executive Officer or Chief Operating Officer.
Upon receipt of a completed loan application from a prospective borrower, we order a credit report and we verify certain other information. If necessary, we obtain additional financial or credit-related information. We require an appraisal for all first mortgage loans. Appraisals may be performed by our in-house Appraisal Department or by licensed or certified third-party appraisal firms. Currently most appraisals are performed by third-party appraisers and are reviewed by our in-house Appraisal Department.
We require title insurance on all mortgage loans, except for home equity credit lines and fixed-rate second mortgage loans. For these loans, we require a property search detailing the current chain of title. We require borrowers to obtain hazard insurance and we require borrowers to obtain flood insurance prior to closing, if appropriate. We require most borrowers to advance funds on a monthly basis together with each payment of principal and interest to a mortgage escrow account from which we make disbursements for items such as real estate taxes, flood insurance and private mortgage insurance premiums, if required. Presently, we do not escrow for real estate taxes on properties located in the states of New York, Connecticut, Massachusetts and Pennsylvania.
14
Table of Contents
Asset Quality
One of our key operating objectives has been, and continues to be, to maintain a high level of asset quality. Through a variety of strategies we have been proactive in addressing problem loans and non-performing assets. Charge-offs, net of recoveries, amounted to $37.3 million in 2014 and $62.8 million in 2013. Economic conditions have improved at a moderate pace. The unemployment rate declined to 5.6% in December 2014 from 6.7% in 2013. Economic conditions in our primary market area continued to improve modestly during 2014 as evidenced by increased levels of home sale activity, higher real estate valuations and a decrease in the unemployment rate. We continue to closely monitor the local and national real estate markets and other factors related to risks inherent in our loan portfolio. We determined the provision for loan losses for 2014 based on our allowance for loan loss (“ALL”) methodology that considers a number of quantitative and qualitative factors, including the amount of non-performing loans, the loss experience of our non-performing loans, recent collateral valuations, conditions in the real estate and housing markets, current economic conditions, continued elevated levels of unemployment, and growth or shrinkage in the loan portfolio.
Historically, our primary lending emphasis has been the origination and purchase of one- to four-family first mortgage loans on residential properties and, to a lesser extent, second mortgage loans on one- to four-family residential properties. Our loan growth is primarily concentrated in one- to four-family mortgage loans with original LTV ratios of less than 80%. The average LTV ratio of our 2014 first mortgage loan originations and our total first mortgage loan portfolio were 61.3% and 55.8%, respectively, using the appraised value at the time of origination. The value of the property used as collateral for our loans is dependent upon local market conditions. As part of our estimation of the ALL, we monitor changes in the values of homes in each market using indices published by various organizations. Based on our analysis of the data for 2014, we concluded that home values in our primary lending markets increased during 2014 but remain lower than their peak levels reached in 2006 prior to the economic recession. Due to the decline of real estate values starting in 2006 and continuing through 2011, the LTV ratios based on appraisals obtained at time of origination do not necessarily indicate the extent to which we may incur a loss on any given loan that may go into foreclosure.
15
Table of Contents
The following table presents the geographic distribution of our loan portfolio as a percentage of total loans and of our non-performing loans as a percentage of total non-performing loans:
| At December 31, 2014 | At December 31, 2013 | |||||||||||||||
| Non-performing | Non-performing | |||||||||||||||
| Total loans | Loans | Total loans | Loans | |||||||||||||
| New Jersey |
42.4 | % | 42.6 | % | 42.5 | % | 44.2 | % | ||||||||
| New York |
27.8 | 27.8 | 27.1 | 24.1 | ||||||||||||
| Connecticut |
14.6 | 7.8 | 14.9 | 8.0 | ||||||||||||
|
|
|
|
|
|
|
|
|
|||||||||
| Total New York metropolitan area |
84.8 | 78.2 | 84.5 | 76.3 | ||||||||||||
|
|
|
|
|
|
|
|
|
|||||||||
| Pennsylvania |
4.8 | 1.5 | 4.9 | 2.4 | ||||||||||||
| Massachusetts |
2.0 | 1.8 | 1.8 | 1.6 | ||||||||||||
| Virginia |
1.6 | 1.9 | 1.8 | 2.3 | ||||||||||||
| Illinois |
1.5 | 4.7 | 1.6 | 4.8 | ||||||||||||
| Maryland |
1.6 | 5.2 | 1.7 | 4.7 | ||||||||||||
| All others |
3.7 | 6.7 | 3.7 | 7.9 | ||||||||||||
|
|
|
|
|
|
|
|
|
|||||||||
| Total outside New York metropolitan area |
15.2 | 21.8 | 15.5 | 23.7 | ||||||||||||
|
|
|
|
|
|
|
|
|
|||||||||
| 100.0 | % | 100.0 | % | 100.0 | % | 100.0 | % | |||||||||
|
|
|
|
|
|
|
|
|
|||||||||
Delinquent Loans and Foreclosed Assets. When a borrower fails to make required payments on a loan, we take a number of steps to induce the borrower to cure the delinquency and restore the loan to a current status. In the case of originated mortgage loans, our Mortgage Servicing Department is responsible for collection procedures from the 15th day up to the 119th day of delinquency. Specific procedures include a late charge notice being sent at the time a payment is over 15 days past due. Telephone contact is attempted on approximately the 20th day of the month to avoid a 30-day delinquency. A second written notice is sent at the time the payment becomes 30 days past due.
We send additional letters if no contact is established by approximately the 45th day of delinquency. On the 60th day of delinquency, we send another letter followed by continued telephone contact. Between the 30th and the 60th day of delinquency, if telephone contact has not been established, an independent contractor may be sent to make a physical inspection of the property. When contact is made with the borrower at any time prior to foreclosure, we attempt to obtain full payment, work out a repayment schedule, or discuss other loss mitigation options with the borrower in order to avoid foreclosure.
We send a foreclosure notice when a loan is over 90 days delinquent. The accrual of income on loans that are not guaranteed by a federal agency is generally discontinued when interest or principal payments are 90 days in arrears and any accrued but unpaid interest is reversed. We commence foreclosure proceedings if the loan is not brought current between the 120th and 150th day of delinquency unless specific limited circumstances warrant an exception. The collection procedures for mortgage loans guaranteed by federal agencies follow the collection guidelines outlined by those agencies.
We monitor delinquencies on our serviced loan portfolio from reports sent to us by the servicers. Once all past due reports are received, we examine the delinquencies and contact appropriate servicer personnel to determine the status of the loans. We also use these reports to prepare our own monthly reports for management review. These summaries break down, by servicer, total principal and interest due, length of delinquency, as well as accounts in foreclosure and bankruptcy. We monitor all accounts in foreclosure to confirm that the servicer has taken all proper steps to foreclose promptly if there is no other recourse.
The collection procedures for consumer and other loans include sending periodic late notices to a borrower once a loan is past due. We attempt to make direct contact with a borrower once a loan becomes 30 days past due. Supervisory personnel in our Consumer Loan Department review the delinquent loans and collection efforts on a regular basis. If collection activity is unsuccessful after 90 days, we may refer the matter to our legal counsel
16
Table of Contents
for further collection effort or charge-off the loan. Loans we deem to be uncollectible are proposed for charge-off. Charge-offs of consumer loans require the approval of our Consumer Loan Officer and either the Executive Vice President-Lending, our Chief Executive Officer or Chief Operating Officer.
Foreclosed real estate is property acquired through foreclosure or deed in lieu of foreclosure. Write-downs to fair value (net of estimated costs to sell) at the time of acquisition are charged to the ALL. After acquisition, foreclosed properties are held for sale and carried at the lower of fair value minus estimated cost to sell, or at cost. If a foreclosure action is commenced and the loan is not brought current, paid in full or refinanced before the foreclosure sale, the real property securing the loan is either sold at the foreclosure sale, or we or our servicer sells the property as soon thereafter as practicable.
Management continuously monitors the status of the loan portfolio and reports to the Board of Directors at each regular meeting. Our Asset Quality Committee (“AQC”) is responsible for monitoring our loan portfolio, delinquencies and foreclosed real estate. This committee includes members of senior management from the Loan Originations, Loan Servicing, Appraisal, Risk Management and Finance Departments.
The following table is a comparison of our delinquent loans by class as of the dates indicated:
| 30-59 Days | 60-89 Days | 90 Days or more | Total Past Due | Current Loans | Total Loans | > 90 Days accruing |
||||||||||||||||||||||||||||||||||||||||||||||||||
| No. of | Loan | No. of | Loan | No. of | Loan | No. of | Loan | No. of | Loan | No. of | Loan | No. of | Loan | |||||||||||||||||||||||||||||||||||||||||||
| Loans | Balance | Loans | Balance | Loans | Balance | Loans | Balance | Loans | Balance | Loans | Balance | Loans | Balance | |||||||||||||||||||||||||||||||||||||||||||
| At December 31, 2014 |
||||||||||||||||||||||||||||||||||||||||||||||||||||||||
| One- to four-family first mortgages: |
||||||||||||||||||||||||||||||||||||||||||||||||||||||||
| Amortizing |
821 | $ | 243,560 | 340 | $ | 111,420 | 2,294 | $ | 741,901 | 3,455 | $ | 1,096,881 | 47,254 | $ | 17,297,338 | 50,709 | $ | 18,394,219 | 175 | $ | 33,383 | |||||||||||||||||||||||||||||||||||
| Interest-only |
43 | 30,256 | 21 | 12,507 | 180 | 99,779 | 244 | 142,542 | 4,001 | 2,731,482 | 4,245 | 2,874,024 | — | — | ||||||||||||||||||||||||||||||||||||||||||
| Multi-family and commercial mortgages |
17 | 2,782 | 2 | 4,743 | 4 | 1,543 | 23 | 9,068 | 34 | 93,255 | 57 | 102,323 | — | — | ||||||||||||||||||||||||||||||||||||||||||
| Construction loans |
— | — | — | — | 1 | 177 | 1 | 177 | — | — | 1 | 177 | — | — | ||||||||||||||||||||||||||||||||||||||||||
| Consumer and other loans: |
||||||||||||||||||||||||||||||||||||||||||||||||||||||||
| Fixed-rate second mortgages |
7 | 272 | 5 | 71 | 31 | 1,253 | 43 | 1,596 | 2,303 | 70,713 | 2,346 | 72,309 | — | — | ||||||||||||||||||||||||||||||||||||||||||
| Home equity lines of credit |
6 | 1,077 | 3 | 252 | 29 | 3,765 | 38 | 5,094 | 2,566 | 99,278 | 2,604 | 104,372 | — | — | ||||||||||||||||||||||||||||||||||||||||||
| Other |
3 | 589 | 3 | 118 | 9 | 3,595 | 15 | 4,302 | 1,807 | 13,248 | 1,822 | 17,550 | — | — | ||||||||||||||||||||||||||||||||||||||||||
|
|
|
|
|
|
|
|
|
|
|
|
|
|
|
|
|
|
|
|
|
|
|
|
|
|
|
|
|
|||||||||||||||||||||||||||||
| Total |
897 | $ | 278,536 | 374 | $ | 129,111 | 2,548 | $ | 852,013 | 3,819 | $ | 1,259,660 | 57,965 | $ | 20,305,314 | 61,784 | $ | 21,564,974 | 175 | $ | 33,383 | |||||||||||||||||||||||||||||||||||
|
|
|
|
|
|
|
|
|
|
|
|
|
|
|
|
|
|
|
|
|
|
|
|
|
|
|
|
|
|||||||||||||||||||||||||||||
| Delinquent loans to total loans |
1.29 | % | 0.60 | % | 3.95 | % | ||||||||||||||||||||||||||||||||||||||||||||||||||
| 30-59 Days | 60-89 Days | 90 Days or more | Total Past Due | Current Loans | Total Loans | > 90 Days accruing |
||||||||||||||||||||||||||||||||||||||||||||||||||
| No. of | Loan | No. of | Loan | No. of | Loan | No. of | Loan | No. of | Loan | No. of | Loan | No. of | Loan | |||||||||||||||||||||||||||||||||||||||||||
| Loans | Balance | Loans | Balance | Loans | Balance | Loans | Balance | Loans | Balance | Loans | Balance | Loans | Balance | |||||||||||||||||||||||||||||||||||||||||||
| At December 31, 2013 |
||||||||||||||||||||||||||||||||||||||||||||||||||||||||
| One- to four-family first mortgages: |
||||||||||||||||||||||||||||||||||||||||||||||||||||||||
| Amortizing |
881 | $ | 274,303 | 400 | $ | 132,910 | 2,925 | $ | 903,485 | 4,206 | $ | 1,310,698 | 50,158 | $ | 18,912,746 | 54,364 | $ | 20,223,444 | 559 | $ | 132,844 | |||||||||||||||||||||||||||||||||||
| Interest-only |
51 | 34,277 | 29 | 21,283 | 235 | 135,228 | 315 | 190,788 | 4,984 | 3,457,944 | 5,299 | 3,648,732 | — | — | ||||||||||||||||||||||||||||||||||||||||||
| Multi-family and commercial mortgages |
4 | 1,384 | 1 | 5,983 | 4 | 3,189 | 9 | 10,556 | 54 | 15,115 | 63 | 25,671 | — | — | ||||||||||||||||||||||||||||||||||||||||||
| Construction loans |
— | — | — | — | 1 | 294 | 1 | 294 | — | — | 1 | 294 | — | — | ||||||||||||||||||||||||||||||||||||||||||
| Consumer and other loans: |
||||||||||||||||||||||||||||||||||||||||||||||||||||||||
| Fixed-rate second mortgages |
16 | 484 | 8 | 129 | 32 | 1,412 | 56 | 2,025 | 2,637 | 84,054 | 2,693 | 86,079 | — | — | ||||||||||||||||||||||||||||||||||||||||||
| Home equity lines of credit |
17 | 1,389 | 7 | 1,163 | 30 | 3,895 | 54 | 6,447 | 2,682 | 102,103 | 2,736 | 108,550 | — | — | ||||||||||||||||||||||||||||||||||||||||||
| Other |
3 | 58 | 3 | 45 | 6 | 1,741 | 12 | 1,844 | 1,878 | 18,215 | 1,890 | 20,059 | — | — | ||||||||||||||||||||||||||||||||||||||||||
|
|
|
|
|
|
|
|
|
|
|
|
|
|
|
|
|
|
|
|
|
|
|
|
|
|
|
|
|
|||||||||||||||||||||||||||||
| Total |
972 | $ | 311,895 | 448 | $ | 161,513 | 3,233 | $ | 1,049,244 | 4,653 | $ | 1,522,652 | 62,393 | $ | 22,590,177 | 67,046 | $ | 24,112,829 | 559 | $ | 132,844 | |||||||||||||||||||||||||||||||||||
|
|
|
|
|
|
|
|
|
|
|
|
|
|
|
|
|
|
|
|
|
|
|
|
|
|
|
|
|
|||||||||||||||||||||||||||||
| Delinquent loans to total loans |
1.29 | % | 0.67 | % | 4.35 | % | ||||||||||||||||||||||||||||||||||||||||||||||||||
| 30-59 Days | 60-89 Days | 90 Days or more | Total Past Due | Current Loans | Total Loans | > 90 Days accruing |
||||||||||||||||||||||||||||||||||||||||||||||||||
| No. of | Loan | No. of | Loan | No. of | Loan | No. of | Loan | No. of | Loan | No. of | Loan | No. of | Loan | |||||||||||||||||||||||||||||||||||||||||||
| Loans | Balance | Loans | Balance | Loans | Balance | Loans | Balance | Loans | Balance | Loans | Balance | Loans | Balance | |||||||||||||||||||||||||||||||||||||||||||
| At December 31, 2012 |
||||||||||||||||||||||||||||||||||||||||||||||||||||||||
| One- to four-family first mortgages: |
||||||||||||||||||||||||||||||||||||||||||||||||||||||||
| Amortizing |
959 | $ | 327,122 | 568 | $ | 206,033 | 3,046 | $ | 965,956 | 4,573 | $ | 1,499,111 | 54,972 | $ | 20,821,950 | 59,545 | $ | 22,321,061 | 525 | $ | 129,553 | |||||||||||||||||||||||||||||||||||
| Interest-only |
83 | 58,004 | 43 | 29,609 | 307 | 182,239 | 433 | 269,852 | 6,025 | 4,216,023 | 6,458 | 4,485,875 | — | — | ||||||||||||||||||||||||||||||||||||||||||
| Multi-family and commercial mortgages |
5 | 6,474 | 3 | 3,190 | 5 | 1,688 | 13 | 11,352 | 63 | 20,907 | 76 | 32,259 | — | — | ||||||||||||||||||||||||||||||||||||||||||
| Construction loans |
— | — | — | — | 3 | 4,669 | 3 | 4,669 | — | — | 3 | 4,669 | — | — | ||||||||||||||||||||||||||||||||||||||||||
| Consumer and other loans: |
||||||||||||||||||||||||||||||||||||||||||||||||||||||||
| Fixed-rate second mortgages |
14 | 587 | 5 | 68 | 39 | 1,665 | 58 | 2,320 | 3,189 | 103,919 | 3,247 | 106,239 | — | — | ||||||||||||||||||||||||||||||||||||||||||
| Home equity lines of credit |
17 | 1,592 | 4 | 379 | 28 | 3,996 | 49 | 5,967 | 2,879 | 113,905 | 2,928 | 119,872 | — | — | ||||||||||||||||||||||||||||||||||||||||||
| Other |
4 | 62 | — | — | 4 | 2,314 | 8 | 2,376 | 2,063 | 18,528 | 2,071 | 20,904 | — | — | ||||||||||||||||||||||||||||||||||||||||||
|
|
|
|
|
|
|
|
|
|
|
|
|
|
|
|
|
|
|
|
|
|
|
|
|
|
|
|
|
|||||||||||||||||||||||||||||
| Total |
1,082 | $ | 393,841 | 623 | $ | 239,279 | 3,432 | $ | 1,162,527 | 5,137 | $ | 1,795,647 | 69,191 | $ | 25,295,232 | 74,328 | $ | 27,090,879 | 525 | $ | 129,553 | |||||||||||||||||||||||||||||||||||
|
|
|
|
|
|
|
|
|
|
|
|
|
|
|
|
|
|
|
|
|
|
|
|
|
|
|
|
|
|||||||||||||||||||||||||||||
| Delinquent loans to total loans |
1.45 | % | 0.88 | % | 4.29 | % | ||||||||||||||||||||||||||||||||||||||||||||||||||
17
Table of Contents
During 2014, we sold a pool of $112.1 million of non-performing residential mortgage loans guaranteed by the FHA back to the financial institution that originally sold the loans to the Bank. The sale of the non-performing loan pool was in accordance with the repurchase right with respect to loans that become non-performing that the financial institution exercised pursuant to the terms of the original sale and servicing agreement between the Bank and the financial institution. As consideration for the sale of the non-performing loans, the Bank received from the financial institution an amount equal to 100% of the outstanding unpaid principal balance of the loans, plus all accrued and unpaid interest on the loans. The Bank may sell additional loans to the financial institution in the future, in the event the financial institution exercises its repurchase right with respect to any additional non-performing FHA loans.
We continue to closely monitor the local and national real estate markets and other factors related to risks inherent in our loan portfolio. Economic conditions in our primary market area continued to improve modestly during 2014 as evidenced by increased levels of home sale activity, higher real estate valuations and a decrease in the unemployment rate.
With the exception of first mortgage loans guaranteed by a federal agency, we stop accruing income on loans when interest or principal payments are 90 days in arrears or earlier when the timely collectability of such interest or principal is doubtful. We reverse any accrued, but unpaid interest on non-accrual loans that we previously credited to income. We recognize income in the period that we collect it or when the ultimate collectability of principal is no longer in doubt. We return a non-accrual loan to accrual status when factors indicating doubtful collection no longer exist.
The following table presents information regarding non-performing assets as of the dates indicated:
| At December 31, | ||||||||||||||||||||
| 2014 | 2013 | 2012 | 2011 | 2010 | ||||||||||||||||
| (Dollars in thousands) | ||||||||||||||||||||
| Non-accrual loans: |
||||||||||||||||||||
| One-to four family amortizing loans |
$ | 708,518 | $ | 770,641 | $ | 836,403 | $ | 700,429 | $ | 614,758 | ||||||||||
| One-to four family interest-only loans |
99,779 | 135,228 | 182,239 | 213,862 | 179,348 | |||||||||||||||
| Multi-family and commercial mortgages |
1,543 | 3,189 | 1,688 | 2,223 | 1,117 | |||||||||||||||
| Construction loans |
177 | 294 | 4,669 | 4,344 | 7,560 | |||||||||||||||
| Consumer and other loans |
8,613 | 7,048 | 7,975 | 4,353 | 4,320 | |||||||||||||||
|
|
|
|
|
|
|
|
|
|
|
|||||||||||
| Total non-accrual loans |
818,630 | 916,400 | 1,032,974 | 925,211 | 807,103 | |||||||||||||||
| Accruing loans delinquent 90 days or more |
33,383 | 132,844 | 129,553 | 97,476 | 64,156 | |||||||||||||||
|
|
|
|
|
|
|
|
|
|
|
|||||||||||
| Total non-performing loans |
852,013 | 1,049,244 | 1,162,527 | 1,022,687 | 871,259 | |||||||||||||||
| Foreclosed real estate, net |
79,952 | 70,436 | 47,322 | 40,619 | 45,693 | |||||||||||||||
|
|
|
|
|
|
|
|
|
|
|
|||||||||||
| Total non-performing assets |
$ | 931,965 | $ | 1,119,680 | $ | 1,209,849 | $ | 1,063,306 | $ | 916,952 | ||||||||||
|
|
|
|
|
|
|
|
|
|
|
|||||||||||
| Non-performing loans to total loans |
3.95 | % | 4.35 | % | 4.29 | % | 3.48 | % | 2.82 | % | ||||||||||
| Non-performing assets to total assets |
2.55 | 2.90 | 2.98 | 2.34 | 1.50 | |||||||||||||||
Loans that are past due 90 days or more and still accruing interest are loans that are insured by the FHA.
18
Table of Contents
Non-performing loans exclude troubled debt restructurings that are accruing and have been performing in accordance with the terms of their restructure agreement for at least six months. The following table presents information regarding loans modified in a troubled debt restructuring:
| December 31, | ||||||||||||||||||||
| 2014 | 2013 | 2012 | 2011 | 2010 | ||||||||||||||||
| (In thousands) | ||||||||||||||||||||
| Troubled debt restructurings: |
||||||||||||||||||||
| Current |
$ | 137,249 | $ | 108,413 | $ | 64,438 | $ | 43,042 | $ | 9,429 | ||||||||||
| 30-59 days |
20,344 | 19,931 | 28,988 | 7,359 | 1,616 | |||||||||||||||
| 60-89 days |
17,079 | 17,407 | 14,346 | 4,786 | — | |||||||||||||||
| 90 days or more |
157,744 | 176,797 | 107,320 | 11,354 | — | |||||||||||||||
|
|
|
|
|
|
|
|
|
|
|
|||||||||||
| Total troubled debt restructurings |
$ | 332,416 | $ | 322,548 | $ | 215,092 | $ | 66,541 | $ | 11,045 | ||||||||||
|
|
|
|
|
|
|
|
|
|
|
|||||||||||
The increases in troubled debt restructurings since 2010 were primarily due to an expansion of loan modification programs offered by the Bank pursuant to a Residential Mortgage Loss Mitigation Policy that became effective during the first quarter of 2012.
Loans that were modified in a troubled debt restructuring primarily represent loans that have been in a deferred principal payment plan for an extended period of time, generally in excess of six months, loans that have had past due amounts capitalized as part of the loan balance, loans that have a confirmed Chapter 13 bankruptcy status, borrowers’ loans that have been discharged in a Chapter 7 bankruptcy and other repayment plans. These loans are individually evaluated for impairment to determine if the carrying value of the loan is in excess of the fair value of the collateral or the present value of each loan’s expected future cash flows.
We discontinue accruing interest and reverse previously accrued but unpaid interest on troubled debt restructurings that are past due 90 days or more or if we believe we will not collect all amounts contractually due. Approximately $16.9 million of troubled debt restructurings that were previously accruing interest became 90 days or more past due during 2014 for which we discontinued accruing interest and reversed previously accrued, but unpaid interest.
Included in accruing loans delinquent 90 days or more are $33.4 million of FHA loans. We continue to accrue interest on these loans since they are insured by the FHA and we believe that we will collect substantially all amounts contractually due under the terms of the loan. At December 31, 2014, approximately 78.2% of our non-performing loans were in the New York metropolitan area and 21.8% were outside of the New York metropolitan area. At December 31, 2013, approximately 76.3% of our non-performing loans were in the New York metropolitan area and 23.7% were outside of the New York metropolitan area. Non-accrual first mortgage loans at December 31, 2014 included $99.8 million of interest-only loans and $208.0 million of reduced documentation loans ($39.8 million of which were also interest-only loans) with average LTV ratios of approximately 66.8% and 55.2%, respectively, based on appraised values at time of origination. Non-accrual first mortgage loans at December 31, 2013 included $135.2 million of interest-only loans and $231.7 million of reduced documentation loans with average LTV ratios of approximately 63.4% and 66.2%, respectively, based on appraised values at time of origination.
The total amount of interest income on non-accrual loans that would have been recognized if interest on all such loans had been recorded based upon original contract terms amounted to approximately $50.5 million. The total amount of interest income received on non-accrual loans amounted to approximately $1.0 million during 2014. We are not committed to lend additional funds to borrowers whose loans are in non-accrual status.
19
Table of Contents
Allowance for Loan Losses.
The following table presents the activity in our ALL at or for the years indicated:
| At or for the Year December 31, | ||||||||||||||||||||
| 2014 | 2013 | 2012 | 2011 | 2010 | ||||||||||||||||
| (Dollars in thousands) | ||||||||||||||||||||
| Balance at beginning of year |
$ | 276,097 | $ | 302,348 | $ | 273,791 | $ | 236,574 | $ | 140,074 | ||||||||||
|
|
|
|
|
|
|
|
|
|
|
|||||||||||
| Provision for loan losses |
(3,500 | ) | 36,500 | 95,000 | 120,000 | 195,000 | ||||||||||||||
| Charge-offs: |
||||||||||||||||||||
| First mortgage loans |
(59,978 | ) | (87,288 | ) | (86,636 | ) | (96,714 | ) | (110,669 | ) | ||||||||||
| Consumer and other loans |
(683 | ) | (566 | ) | (464 | ) | (382 | ) | (102 | ) | ||||||||||
|
|
|
|
|
|
|
|
|
|
|
|||||||||||
| Total charge-offs |
(60,661 | ) | (87,854 | ) | (87,100 | ) | (97,096 | ) | (110,771 | ) | ||||||||||
| Recoveries |
23,381 | 25,103 | 20,657 | 14,313 | 12,271 | |||||||||||||||
|
|
|
|
|
|
|
|
|
|
|
|||||||||||
| Net charge-offs |
(37,280 | ) | (62,751 | ) | (66,443 | ) | (82,783 | ) | (98,500 | ) | ||||||||||
|
|
|
|
|
|
|
|
|
|
|
|||||||||||
| Balance at end of year |
$ | 235,317 | $ | 276,097 | $ | 302,348 | $ | 273,791 | $ | 236,574 | ||||||||||
|
|
|
|
|
|
|
|
|
|
|
|||||||||||
| Allowance for loan losses to total loans |
1.09 | % | 1.15 | % | 1.12 | % | 0.93 | % | 0.77 | % | ||||||||||
| Allowance for loan losses to non-performing loans |
27.62 | 26.31 | 26.01 | 26.77 | 27.15 | |||||||||||||||
| Net charge-offs as a percentage of average loans |
0.16 | 0.24 | 0.24 | 0.28 | 0.31 | |||||||||||||||
The following table presents the activity in our ALL by portfolio segment:
| At December 31, 2014 | ||||||||||||||||||||
| One-to four- Family Mortgages |
Multi-family and Commercial Mortgages |
Construction | Consumer and Other Loans |
Total | ||||||||||||||||
| (In thousands) | ||||||||||||||||||||
| Balance at December 31, 2012 |
$ | 295,096 | $ | 1,937 | $ | 1,116 | $ | 4,199 | $ | 302,348 | ||||||||||
| Provision for loan losses |
38,380 | (1,132 | ) | (1,003 | ) | 255 | 36,500 | |||||||||||||
| Charge-offs |
(87,288 | ) | — | — | (566 | ) | (87,854 | ) | ||||||||||||
| Recoveries |
25,073 | — | — | 30 | 25,103 | |||||||||||||||
|
|
|
|
|
|
|
|
|
|
|
|||||||||||
| Net (charge-offs) recoveries |
(62,215 | ) | — | — | (536 | ) | (62,751 | ) | ||||||||||||
|
|
|
|
|
|
|
|
|
|
|
|||||||||||
| Balance at December 31, 2013 |
$ | 271,261 | $ | 805 | $ | 113 | $ | 3,918 | $ | 276,097 | ||||||||||
|
|
|
|
|
|
|
|
|
|
|
|||||||||||
| Provision for loan losses |
(5,867 | ) | 2,281 | 2 | 84 | (3,500 | ) | |||||||||||||
| Charge-offs |
(57,348 | ) | (2,515 | ) | (115 | ) | (683 | ) | (60,661 | ) | ||||||||||
| Recoveries |
22,816 | — | — | 565 | 23,381 | |||||||||||||||
|
|
|
|
|
|
|
|
|
|
|
|||||||||||
| Net (charge-offs) recoveries |
(34,532 | ) | (2,515 | ) | (115 | ) | (118 | ) | (37,280 | ) | ||||||||||
|
|
|
|
|
|
|
|
|
|
|
|||||||||||
| Balance at December 31, 2014 |
$ | 230,862 | $ | 571 | $ | — | $ | 3,884 | $ | 235,317 | ||||||||||
|
|
|
|
|
|
|
|
|
|
|
|||||||||||
| Loan portfolio: |
||||||||||||||||||||
| Balance at end of year |
||||||||||||||||||||
| Individually evaluated for impairment |
$ | 322,661 | $ | 5,651 | $ | 177 | $ | 4,314 | $ | 332,803 | ||||||||||
| Collectively evaluated for impairment |
20,945,582 | 96,672 | — | 189,917 | 21,232,171 | |||||||||||||||
| Allowance |
||||||||||||||||||||
| Individually evaluated for impairment |
$ | 20,413 | $ | 126 | $ | — | $ | 343 | $ | 20,882 | ||||||||||
| Collectively evaluated for impairment |
210,449 | 445 | — | 3,541 | 214,435 | |||||||||||||||
The ALL has been determined in accordance with U.S. generally accepted accounting principles (“U.S. GAAP”) and applicable regulatory requirements, which require us to maintain an adequate ALL. We are responsible for the timely and periodic determination of the amount of the allowance required. We believe that our ALL is adequate to cover specifically identifiable loan losses, as well as estimated losses inherent in our portfolio for which certain losses are probable but not specifically identifiable.
20
Table of Contents
The ALL amounted to $235.3 million and $276.1 million at December 31, 2014 and 2013, respectively. We recorded a net credit provision for loan losses during 2014 based on our ALL methodology that considers a number of quantitative and qualitative factors, including the amount of non-performing loans, our loss experience on non-performing loans, conditions in the real estate and housing markets, current economic conditions, particularly increasing levels of unemployment, and changes in the size of the loan portfolio. The net credit provision for loan losses and the decline in the ALL were primarily due to a decrease in non-performing loans and early stage delinquent loans. The decline in non-performing loans was primarily due to the sale of a pool of non-performing FHA loans as well as improving economic conditions, particularly in the housing and labor markets. The decline in the ALL also reflects improving home prices and economic conditions and a decrease in the size of the loan portfolio. See “Item 7 – Management’s Discussion and Analysis – Critical Accounting Policies – Allowance for Loan Losses.”
At December 31, 2014, first mortgage loans secured by one-to four-family properties accounted for 99.1% of total loans. Fixed-rate mortgage loans represent 53.4% of our first mortgage loans. Compared to adjustable-rate loans, fixed-rate loans possess less inherent credit risk since loan payments do not change in response to changes in interest rates. We do not originate or purchase option ARM loans or negative amortization loans.
Non-performing loans amounted to $852.0 million at December 31, 2014 as compared to $1.05 billion at December 31, 2013. Non-performing loans at December 31, 2014 included $841.7 million of one- to four-family first mortgage loans as compared to $1.04 billion at December 31, 2013. The ratio of non-performing loans to total loans was 3.95% at December 31, 2014 compared with 4.35% at December 31, 2013. Loans delinquent 60 to 89 days amounted to $129.1 million at December 31, 2014 as compared to $161.5 million at December 31, 2013. Foreclosed real estate amounted to $80.0 million at December 31, 2014 as compared to $70.4 million at December 31, 2013. As a result of our underwriting policies, our borrowers typically have a significant amount of equity, at the time of origination, in the underlying real estate that we use as collateral for our loans. Due to the steady deterioration of real estate values that began in 2006 and continued into the first half of 2012, the LTV ratios based on appraisals obtained at time of origination do not necessarily indicate the extent to which we may incur a loss on any given loan that may go into foreclosure. However, our lower average LTV ratios have helped to moderate our charge-offs as there has generally been adequate equity behind our first lien as of the foreclosure date to satisfy our loan.
At December 31, 2014, the ratio of the ALL to non-performing loans was 27.62% as compared to 26.31% at December 31, 2013. The ratio of the ALL to total loans was 1.09% at December 31, 2014 as compared to 1.15% at December 31, 2013. Changes in the ratio of the ALL to non-performing loans are not, absent other factors, an indication of the adequacy of the ALL since there is not necessarily a direct relationship between changes in various asset quality ratios and changes in the ALL and non-performing loans. In the current economic environment, a loan generally becomes non-performing when the borrower experiences financial difficulty. In many cases, the borrower also has a second mortgage or home equity loan on the property. In substantially all of these cases, we do not hold the second mortgage or home equity loan as this is not a business we have actively pursued.
We obtain updated collateral values by the time a loan becomes 180 days past due. If the estimated fair value of the collateral (less estimated selling costs) is less than the recorded investment in the loan, we charge-off an amount to reduce the loan to the fair value of the collateral less estimated selling costs. As a result, certain losses inherent in our non-performing loans are being recognized as charge-offs which may result in a lower ratio of the ALL to non-performing loans. Charge-offs, net of recoveries, amounted to $37.3 million for 2014 as compared to $62.8 million for 2013. Write-downs and net gains or losses on the sale of foreclosed real estate amounted to a net gain of $3.2 million for 2014 as compared to a net gain of $1.7 million for 2013. The results of our reappraisal process, our recent charge-off history and our loss experience related to the sale of foreclosed real estate are considered in the determination of the ALL. Our loss experience on the sale of foreclosed real estate was 18.3% for 2014 as compared to 18.0% for 2013.
21
Table of Contents
As part of our estimation of the ALL, we monitor changes in the values of homes in each market using indices published by various organizations including the FHFA and Case Shiller. Our AQC uses these indices and a stratification of our loan portfolio by state as part of its quarterly determination of the ALL. We do not apply different loss factors based on geographic locations since, at December 31, 2014, 84.8% of our loan portfolio and 78.2% of our non-performing loans are located in the New York metropolitan area. We believe that our process of obtaining updated collateral values by the time a loan becomes 180 days past due, and annually thereafter, identifies potential charge-offs more accurately than a house price index that is based on a wide geographic area and includes many different types of houses. However, we use house price indices to identify geographic trends in housing markets to determine if an overall adjustment to the ALL is required based on loans we have in those geographic areas and to determine if changes in the loss factors used in the ALL quantitative analysis are necessary. Our quantitative analysis of the ALL accounts for increases in non-performing loans by applying progressively higher risk factors to loans as they become more delinquent.
Due to the nature of our loan portfolio, our evaluation of the adequacy of our ALL is performed primarily on a “pooled” basis. Each quarter we prepare an analysis which categorizes the entire loan portfolio by certain risk characteristics such as loan type (fixed and variable one- to four-family, interest-only, reduced documentation, multi-family, commercial, construction, etc.), loan source (originated or purchased) and payment status (i.e., current or number of days delinquent). Loans with known losses are categorized separately. We assign estimated loss factors to the payment status categories on the basis of our assessment of the risk inherent in each loan type. These factors are periodically reviewed for appropriateness giving consideration to our loss experience, delinquency trends, portfolio growth and environmental factors such as the status of the regional economy and housing market, in order to ascertain that the loss factors cover probable and estimable losses inherent in the portfolio. We define our loss experience on non-performing loans as the ratio of the excess of the loan balance (including selling costs) over the updated collateral value to the principal balance of loans for which we have updated valuations. We obtain updated collateral values by the time a loan becomes 180 days past due and on an annual basis thereafter for as long as the loan remains non-performing. Based on our analysis, our loss experience on our non-performing one- to four-family first mortgage loans was approximately 12.1% during 2014 as compared to 13.6% in 2013 and 14.3% in 2012.
In addition to our loss experience, we also use environmental factors and qualitative analyses to determine the adequacy of our ALL. This analysis includes further evaluation of economic factors, such as trends in the unemployment rate, as well as a ratio analysis to evaluate the overall measurement of the ALL, a review of delinquency ratios, net charge-off ratios and the ratio of the ALL to both non-performing loans and total loans. The qualitative review is used to reassess the overall determination of the ALL and to ensure that directional changes in the ALL and the provision for loan losses are supported by relevant internal and external data. Based on our recent loss experience on non-performing loans and the sale of foreclosed real estate as well as our consideration of environmental factors, we changed certain loss factors used in our quantitative analysis of the ALL for our one- to four- family first mortgage loans during 2014. The recent adjustment to our loss factors did not have a material effect on the ultimate level of our ALL or on our provision for loan losses. If our future loss experience requires additional increases in our loss factors, this may result in increased levels of loan loss provisions.
We consider the average LTV ratio of our non-performing loans and our total portfolio in relation to the overall changes in house prices in our lending markets when determining the ALL. This provides us with a “macro” indication of the severity of potential losses that might be expected. Since substantially all our portfolio consists of first mortgage loans on residential properties, the LTV ratio is particularly important to us when a loan becomes non-performing. The weighted average LTV ratio in our one- to four-family mortgage loan portfolio at December 31, 2014 was approximately 55.8%, using appraised values at the time of origination. The average LTV ratio of our non-performing loans using appraised values at the time of origination was approximately
22
Table of Contents
67.6% at December 31, 2014. Based on the valuation indices, house prices have declined in the New York metropolitan area, where 78.2% of our non-performing loans were located at December 31, 2014, by approximately 18.7% from the peak of the market in 2006 through November 2014 and by 16.0% nationwide during that period. For the year ended December 31, 2014, home prices increased 1.5% in the New York metropolitan area and increased 4.3% nationwide. Changes in house values may affect our loss experience which may require that we change the loss factors used in our quantitative analysis of the ALL. There can be no assurance whether significant declines in house values may occur and result in higher loss experience and increased levels of charge-offs and loan loss provisions.
Due to the unprecedented level of foreclosures and the desire by many states to slow the foreclosure process, we continue to experience a time frame to repayment or foreclosure of up to 48 months from the initial non-performing period. These delays have impacted our level of non-performing loans as these loans take longer to migrate to real estate owned and ultimate disposition. In addition, the highly publicized foreclosure issues that have affected the nation’s largest mortgage loan servicers has resulted in greater court and state attorney general scrutiny. Our foreclosure process and the time to complete a foreclosure continue to be prolonged, especially in New York and New Jersey where 70.4% of our non-performing loans are located. However, since 2013, we have experienced an increased volume of completed foreclosures for loans that have been in the foreclosure process for over 48 months. If real estate prices do not continue to improve or begin to decline, this extended time may result in further charge-offs. In addition, current conditions in the housing market have made it more difficult for borrowers to sell homes to satisfy the mortgage and second lien holders and are less likely to repay our loan if the value of the property is not enough to satisfy their loan. We continue to closely monitor the property values underlying our non-performing loans during this timeframe and take appropriate charge-offs when the loan balances exceed the underlying estimated property values.
Foreclosed real estate amounted to $80.0 million at December 31, 2014 as compared to $70.4 million at December 31, 2013. During 2014, we transferred $123.6 million of loans to foreclosed real estate as compared to $126.8 million during 2013. Write-downs on foreclosed real estate and net gains or losses on the sale of foreclosed real estate amounted to a net gain of $3.2 million for the year ended December 31, 2014 as compared to a net gain of $1.7 million for 2013. We sold 241 properties during 2014 as compared to 207 properties during 2013. Holding costs associated with foreclosed real estate amounted to $18.6 million and $14.5 million for the years ended December 31, 2014 and 2013, respectively.
At December 31, 2014 and December 31, 2013, commercial and construction loans evaluated for impairment in accordance with Financial Accounting Standards Board (“FASB”) guidance amounted to $5.8 million and $8.7 million, respectively. Based on this evaluation, we established an ALL of $126,000 for commercial and construction loans classified as impaired at December 31, 2014 compared to $527,000 at December 31, 2013. Charge-offs related to these loans amounted to $2.5 million in 2014. There were no charge-offs related to these loans in 2013.
The markets in which we lend experienced significant declines in real estate values beginning in 2006 and continuing into 2012. House prices have continued to increase since the second half of 2012. We have taken these conditions into consideration in evaluating our ALL. Although we believe that we have established and maintained the ALL at adequate levels, additions may be necessary if future economic and other conditions differ substantially from the current operating environment. Increases in our loss experience on non-performing loans, the loss factors used in our quantitative analysis of the ALL and continued increases in overall loan delinquencies can have a significant impact on our need for increased levels of loan loss provisions in the future. No assurance can be given in any particular case that our LTV ratios will provide full protection in the event of borrower default. Although we use the best information available, the level of the ALL remains an estimate that is subject to significant judgment and short-term change. See “Item 7 – Management’s Discussion and Analysis – Critical Accounting Policies – Allowance for Loan Losses.”
23
Table of Contents
The following table presents our allocation of the ALL by loan category and the percentage of loans in each category to total loans at the dates indicated:
| At December 31, | ||||||||||||||||||||||||||||||||||||||||
| 2014 | 2013 | 2012 | 2011 | 2010 | ||||||||||||||||||||||||||||||||||||
| Amount | Percentage of Loans in Category to Total Loans |
Amount | Percentage of Loans in Category to Total Loans |
Amount | Percentage of Loans in Category to Total Loans |
Amount | Percentage of Loans in Category to Total Loans |
Amount | Percentage of Loans in Category to Total Loans |
|||||||||||||||||||||||||||||||
| (Dollars in thousands) | ||||||||||||||||||||||||||||||||||||||||
| First mortgage loans: |
||||||||||||||||||||||||||||||||||||||||
| One- to four-family |
$ | 230,862 | 98.62 | % | $ | 271,261 | 99.00 | % | $ | 295,096 | 98.95 | % | $ | 264,922 | 98.86 | % | $ | 227,224 | 98.79 | % | ||||||||||||||||||||
| Other first mortgages |
571 | 0.48 | 918 | 0.11 | 3,053 | 0.14 | 5,116 | 0.16 | 6,147 | 0.19 | ||||||||||||||||||||||||||||||
|
|
|
|
|
|
|
|
|
|
|
|
|
|
|
|
|
|
|
|
|
|||||||||||||||||||||
| Total first mortgage loans |
231,433 | 99.10 | 272,179 | 99.11 | 298,149 | 99.09 | 270,038 | 99.02 | 233,371 | 98.98 | ||||||||||||||||||||||||||||||
| Consumer and other loans |
3,884 | 0.90 | 3,918 | 0.89 | 4,199 | 0.91 | 3,753 | 0.98 | 3,203 | 1.02 | ||||||||||||||||||||||||||||||
|
|
|
|
|
|
|
|
|
|
|
|
|
|
|
|
|
|
|
|
|
|||||||||||||||||||||
| Total allowance for loan losses |
$ | 235,317 | 100.00 | % | $ | 276,097 | 100.00 | % | $ | 302,348 | 100.00 | % | $ | 273,791 | 100.00 | % | $ | 236,574 | 100.00 | % | ||||||||||||||||||||
|
|
|
|
|
|
|
|
|
|
|
|
|
|
|
|
|
|
|
|
|
|||||||||||||||||||||
Investment Activities
The Board of Directors reviews and approves our investment policy on an annual basis. The Chief Executive Officer, Chief Operating Officer, Chief Financial Officer, and other officers are authorized to purchase, sell, or loan securities. The Board of Directors reviews our investment activity on a quarterly basis.
Our investment policy is designed primarily to manage the interest rate sensitivity of our assets and liabilities, to generate a favorable return without incurring undue interest rate and credit risk, to complement our lending activities and to provide and maintain liquidity within established guidelines. In establishing our investment strategies, we consider our asset/liability position, asset concentrations, interest rate risk, credit risk, liquidity, market volatility and desired rate of return. We may invest in securities in accordance with the regulations of the OCC including U.S. Treasury obligations, federal agency securities, mortgage-backed securities, certain time deposits of insured banks and savings institutions, certain bankers’ acceptances, repurchase agreements, federal funds sold, and, subject to certain limits, corporate debt and equity securities, commercial paper and mutual funds. Our investment policy also provides that we will not engage in any practice that the Federal Financial Institutions Examination Council considers to be an unsuitable investment practice.
On December 10, 2013, the OCC, the FDIC, the FRB, the SEC and the Commodity Futures Trading Commission (“CFTC”) released final rules to implement Section 619 of the Reform Act, commonly known as the “Volcker Rule.” The Volcker Rule, among other things, prohibits banking entities from engaging in proprietary trading and from sponsoring, having an ownership interest in or having certain relationships with a hedge fund or private equity fund, subject to certain exemptions. Any such prohibited investments are required to be disposed of by July 21, 2016. At December 31, 2014, we were not engaged in any activities, nor did we have any ownership interests in any funds, that are prohibited under the Volcker Rule. See “Regulation of Hudson City Savings Bank and Hudson City Bancorp.”
We invest in mortgage-backed securities issued by Ginnie Mae, Fannie Mae and Freddie Mac, as well as other securities issued by GSEs and the U.S. Treasury. These securities account for substantially all of our securities. We do not purchase unrated or private label mortgage-backed securities. During 2014, we purchased $3.30 billion of U.S. Treasury securities with an average life of 1.2 years and which are used as collateral for our outstanding borrowings.
24
Table of Contents
At December 31, 2014, there were no debt securities past due or securities for which the Company currently believes it is not probable that it will collect all amounts due according to the contractual terms of the security.
We also have an investment in Federal Home Loan Bank of New York (“FHLB”) stock for $320.8 million at December 31, 2014. We have evaluated our investment in FHLB stock for impairment which includes a review of the financial statements and capital balances of FHLB. FHLB is in compliance with its regulatory capital to assets ratio and liquidity requirements. We have also considered the structure of the federal home loan bank system, which enables the regulator of the federal home loan banks to reallocate debt among the members, so each federal home loan bank member has a potential obligation to repay the consolidated obligations issued by other federal home loan bank members. The FHLB structure has received support from the U.S. Treasury, which established a lending facility designed to provide secured funding on an as needed basis to government-sponsored enterprises, such as the FHLB. As a result of our review of the FHLB and the federal home loan bank system, we have noted that there were no issues that would result in impairment in our investment.
We classify investments as held to maturity or available for sale at the date of purchase based on our assessment of our internal liquidity requirements. Held to maturity securities are reported at cost, adjusted for amortization of premium and accretion of discount. We have both the ability and positive intent to hold these securities to maturity. During 2014, we sold mortgage-backed securities that were classified as held-to-maturity with a carrying value of $262.0 million. Each of these securities had less than 15% of the purchased par amount remaining at the time of sale. Available for sale securities are reported at fair value. We currently have no securities classified as trading securities.
Investment Securities. At both December 31, 2014 and December 31, 2013, investment securities classified as held to maturity had a carrying value of $39.0 million, all of which were callable by the issuer. Investments classified as available for sale amounted to $3.61 billion at December 31, 2014 and $297.3 million at December 31, 2013. At December 31, 2014, the investment securities portfolio had a weighted-average rate of 0.40% and a fair value of approximately $3.65 billion. During 2014 we purchased $3.31 billion of investment securities substantially all of which were U.S. Treasury securities. During 2013 we purchased $298.0 million of investment securities all of which were issued by GSEs. During 2012, we purchased $407.8 million of investment grade corporate bond issues. We sold these corporate bonds in 2013 as we repositioned our portfolio in anticipation of an increase in market interest rates. There were no calls of investment securities during 2014. As of December 31, 2014, investment securities with an amortized cost of $3.50 billion were pledged as collateral for securities sold under agreements to repurchase. Also, at December 31, 2014, we had $320.8 million in FHLB stock. See “Regulation of Hudson City Savings Bank and Hudson City Bancorp.”
The following table presents our investment securities activity for the years indicated:
| For the Year Ended December 31, | ||||||||||||
| 2014 | 2013 | 2012 | ||||||||||
| (In thousands) | ||||||||||||
| Investment securities: |
||||||||||||
| Carrying value at beginning of year |
$ | 336,294 | $ | 467,068 | $ | 546,378 | ||||||
|
|
|
|
|
|
|
|||||||
| Purchases: |
||||||||||||
| Available for sale |
3,311,944 | 298,033 | 407,832 | |||||||||
| Calls: |
||||||||||||
| Held to maturity |
— | — | (500,000 | ) | ||||||||
| Sales: |
||||||||||||
| Available for sale |
— | (405,703 | ) | — | ||||||||
| Premium (amortization) and discount accretion, net |
63 | (491 | ) | (1,376 | ) | |||||||
| Change in unrealized gain or (loss) |
1,755 | (22,613 | ) | 14,234 | ||||||||
|
|
|
|
|
|
|
|||||||
| Net increase (decrease) in investment securities |
3,313,762 | (130,774 | ) | (79,310 | ) | |||||||
|
|
|
|
|
|
|
|||||||
| Carrying value at end of year |
$ | 3,650,056 | $ | 336,294 | $ | 467,068 | ||||||
|
|
|
|
|
|
|
|||||||
25
Table of Contents
Mortgage-backed Securities. All of our mortgage-backed securities are issued by Ginnie Mae, Fannie Mae or Freddie Mac. At December 31, 2014, mortgage-backed securities classified as held to maturity totaled $1.27 billion, or 3.5% of total assets, while $2.96 billion, or 8.1% of total assets, were classified as available for sale. At December 31, 2014, the mortgage-backed securities portfolio had a weighted-average rate of 2.13% and a fair value of approximately $4.32 billion. Of the mortgage-backed securities we held at December 31, 2014, $3.32 billion, or 78.4% of total mortgage-backed securities, had adjustable rates and $914.3 billion, or 21.6% of total mortgage-backed securities, had fixed rates. Our mortgage-backed securities portfolio includes real estate mortgage investment conduits (“REMICs”), which are securities derived by reallocating cash flows from mortgage pass-through securities or from pools of mortgage loans held by a trust. REMICs are a form of, and are often referred to as, collateralized mortgage obligations (“CMOs”). At December 31, 2014, we held $73.5 million of fixed-rate REMICs, which constituted 1.7% of our mortgage-backed securities portfolio. Mortgage-backed security purchases totaled $94.4 million during 2014 compared with $1.67 billion during 2013. At December 31, 2014, mortgage-backed securities with an amortized cost of $3.77 billion were used as collateral for securities sold under agreements to repurchase.
Mortgage-backed securities generally yield less than the underlying loans because of the cost of payment guarantees or credit enhancements that reduce credit risk. However, mortgage-backed securities are more liquid than individual mortgage loans and may be used to collateralize certain borrowings. In general, mortgage-backed securities issued or guaranteed by Ginnie Mae, Fannie Mae and Freddie Mac are weighted at no more than 20% for risk-based capital purposes, compared to the 50% risk-weighting assigned to most non-securitized residential mortgage loans.
While mortgage-backed securities are subject to a reduced credit risk as compared to whole loans, they remain subject to the risk of a fluctuating interest rate environment. Along with other factors, such as the geographic distribution of the underlying mortgage loans, changes in interest rates may alter the prepayment rate of those mortgage loans and affect both the prepayment rates and value of the mortgage-backed securities. At December 31, 2014, we did not own any principal-only, REMIC residuals, private label mortgage-backed securities or other higher risk securities such as those backed by sub-prime loans.
The Bank had two collateralized borrowings in the form of repurchase agreements totaling $100.0 million with Lehman Brothers, Inc. that were secured by mortgage-backed securities with an amortized cost of approximately $114.1 million. The trustee for the liquidation of Lehman Brothers, Inc. (the “Trustee”) notified the Bank in the fourth quarter of 2011 that it considered our claim to be a non-customer claim, which has a lower payment preference than a customer claim and that the value of such claim is approximately $13.9 million representing the excess of the fair value of the collateral over the $100.0 million repurchase price. At that time we established a reserve of $3.9 million against the receivable balance at December 31, 2011. On June 25, 2013, the Bankruptcy Court affirmed the Trustee’s determination that the repurchase agreements did not entitle the Bank to customer status and on February 26, 2014, the U.S. District Court upheld the Bankruptcy Court’s decision that our claim should be treated as a non-customer claim. As a result, we increased our reserve by $3.0 million to $6.9 million against the receivable balance during the first quarter of 2014. During the third quarter of 2014, the Bank received a partial payment on our non-customer claim of $2.4 million.
26
Table of Contents
The following table presents our mortgage-backed securities activity for the years indicated:
| For the Year Ended December 31, | ||||||||||||
| 2014 | 2013 | 2012 | ||||||||||
| (In thousands) | ||||||||||||
| Mortgage-backed securities: |
||||||||||||
| Carrying value at beginning of year |
$ | 8,952,019 | $ | 11,017,499 | $ | 13,285,913 | ||||||
|
|
|
|
|
|
|
|||||||
| Purchases: |
||||||||||||
| Available for sale |
94,422 | 1,671,343 | 1,473,244 | |||||||||
| Principal payments: |
||||||||||||
| Held to maturity |
(249,549 | ) | (877,505 | ) | (1,133,484 | ) | ||||||
| Available for sale |
(1,183,248 | ) | (2,337,327 | ) | (2,560,457 | ) | ||||||
| Sales: |
||||||||||||
| Held to maturity |
(262,022 | ) | (311,380 | ) | — | |||||||
| Available for sale |
(3,048,277 | ) | (4,820 | ) | — | |||||||
| Premium (amortization) and discount accretion, net |
(39,841 | ) | (78,473 | ) | (89,767 | ) | ||||||
| Change in unrealized gain or (loss) |
(28,063 | ) | (127,318 | ) | 42,050 | |||||||
|
|
|
|
|
|
|
|||||||
| Net decrease in mortgage-backed securities |
(4,716,578 | ) | (2,065,480 | ) | (2,268,414 | ) | ||||||
|
|
|
|
|
|
|
|||||||
| Carrying value at end of year |
$ | 4,235,441 | $ | 8,952,019 | $ | 11,017,499 | ||||||
|
|
|
|
|
|
|
|||||||
27
Table of Contents
The following table presents the composition of our money market investments, investment securities and mortgage-backed securities portfolios in dollar amount and in percentage of each investment type at the dates indicated. The table also presents the mortgage-backed securities portfolio by coupon type.
| At December 31, | ||||||||||||||||||||||||||||||||||||
| 2014 | 2013 | 2012 | ||||||||||||||||||||||||||||||||||
| Percent | Percent | Percent | ||||||||||||||||||||||||||||||||||
| Carrying | of | Fair | Carrying | of | Fair | Carrying | of | Fair | ||||||||||||||||||||||||||||
| Value | Total (1) | Value | Value | Total (1) | Value | Value | Total (1) | Value | ||||||||||||||||||||||||||||
| (Dollars in thousands) | ||||||||||||||||||||||||||||||||||||
| Money market investments: |
||||||||||||||||||||||||||||||||||||
| Federal funds sold and other overnight deposits |
$ | 6,163,082 | 100.00 | % | $ | 6,163,082 | $ | 4,190,809 | 100.00 | % | $ | 4,190,809 | $ | 656,926 | 100.00 | % | $ | 656,926 | ||||||||||||||||||
|
|
|
|
|
|
|
|
|
|
|
|
|
|
|
|
|
|
|
|||||||||||||||||||
| Investment securities: |
||||||||||||||||||||||||||||||||||||
| Held to maturity: |
||||||||||||||||||||||||||||||||||||
| United States government- sponsored enterprises |
$ | 39,011 | 1.07 | % | $ | 41,593 | $ | 39,011 | 11.60 | % | $ | 42,727 | $ | 39,011 | 8.35 | % | $ | 45,592 | ||||||||||||||||||
|
|
|
|
|
|
|
|
|
|
|
|
|
|
|
|
|
|
|
|||||||||||||||||||
| Total held to maturity |
39,011 | 1.07 | 41,593 | 39,011 | 11.60 | 42,727 | 39,011 | 8.35 | 45,592 | |||||||||||||||||||||||||||
|
|
|
|
|
|
|
|
|
|
|
|
|
|
|
|
|
|
|
|||||||||||||||||||
| Available for sale: |
||||||||||||||||||||||||||||||||||||
| United States government- sponsored enterprises |
3,593,649 | 98.45 | 3,593,649 | 290,194 | 86.29 | 290,194 | — | — | — | |||||||||||||||||||||||||||
| Corporate bonds |
— | — | — | — | — | — | 420,590 | 90.05 | 420,590 | |||||||||||||||||||||||||||
| Equity securities |
17,396 | 0.48 | 17,396 | 7,089 | 2.11 | 7,089 | 7,467 | 1.60 | 7,467 | |||||||||||||||||||||||||||
|
|
|
|
|
|
|
|
|
|
|
|
|
|
|
|
|
|
|
|||||||||||||||||||
| Total available for sale |
3,611,045 | 98.93 | 3,611,045 | 297,283 | 88.40 | 297,283 | 428,057 | 91.65 | 428,057 | |||||||||||||||||||||||||||
|
|
|
|
|
|
|
|
|
|
|
|
|
|
|
|
|
|
|
|||||||||||||||||||
| Total investment securities |
$ | 3,650,056 | 100.00 | % | $ | 3,652,638 | $ | 336,294 | 100.00 | % | $ | 340,010 | $ | 467,068 | 100.00 | % | $ | 473,649 | ||||||||||||||||||
|
|
|
|
|
|
|
|
|
|
|
|
|
|
|
|
|
|
|
|||||||||||||||||||
| Mortgage-backed securities: |
||||||||||||||||||||||||||||||||||||
| By issuer: |
||||||||||||||||||||||||||||||||||||
| Held to maturity: |
||||||||||||||||||||||||||||||||||||
| Pass-through certificates: |
||||||||||||||||||||||||||||||||||||
| GNMA |
$ | 54,301 | 1.28 | % | $ | 56,141 | $ | 63,070 | 0.70 | % | $ | 65,330 | $ | 73,546 | 0.67 | % | $ | 76,378 | ||||||||||||||||||
| FNMA |
278,953 | 6.59 | 299,161 | 402,848 | 4.50 | 427,950 | 856,840 | 7.78 | 918,252 | |||||||||||||||||||||||||||
| FHLMC |
865,364 | 20.43 | 923,461 | 1,123,029 | 12.55 | 1,189,844 | 1,619,119 | 14.69 | 1,722,010 | |||||||||||||||||||||||||||
| REMICS: |
||||||||||||||||||||||||||||||||||||
| FHLMC and FNMA |
73,519 | 1.74 | 77,397 | 195,517 | 2.18 | 205,699 | 427,252 | 3.88 | 455,852 | |||||||||||||||||||||||||||
|
|
|
|
|
|
|
|
|
|
|
|
|
|
|
|
|
|
|
|||||||||||||||||||
| Total held to maturity |
1,272,137 | 30.04 | 1,356,160 | 1,784,464 | 19.93 | 1,888,823 | 2,976,757 | 27.02 | 3,172,492 | |||||||||||||||||||||||||||
|
|
|
|
|
|
|
|
|
|
|
|
|
|
|
|
|
|
|
|||||||||||||||||||
| Available for sale: |
||||||||||||||||||||||||||||||||||||
| Pass-through certificates: |
||||||||||||||||||||||||||||||||||||
| GNMA |
653,408 | 15.42 | 653,408 | 804,883 | 8.99 | 804,883 | 1,033,641 | 9.38 | 1,033,641 | |||||||||||||||||||||||||||
| FNMA |
1,695,898 | 40.04 | 1,695,898 | 3,890,723 | 43.47 | 3,890,723 | 4,135,635 | 37.54 | 4,135,635 | |||||||||||||||||||||||||||
| FHLMC |
613,998 | 14.50 | 613,998 | 2,433,438 | 27.18 | 2,433,438 | 2,811,850 | 25.52 | 2,811,850 | |||||||||||||||||||||||||||
| REMICS: |
||||||||||||||||||||||||||||||||||||
| FHLMC and FNMA |
— | — | — | 38,511 | 0.43 | 38,511 | 59,616 | 0.54 | 59,616 | |||||||||||||||||||||||||||
|
|
|
|
|
|
|
|
|
|
|
|
|
|
|
|
|
|
|
|||||||||||||||||||
| Total available for sale |
2,963,304 | 69.96 | 2,963,304 | 7,167,555 | 80.07 | 7,167,555 | 8,040,742 | 72.98 | 8,040,742 | |||||||||||||||||||||||||||
|
|
|
|
|
|
|
|
|
|
|
|
|
|
|
|
|
|
|
|||||||||||||||||||
| Total mortgage-backed securities |
$ | 4,235,441 | 100.00 | % | $ | 4,319,464 | $ | 8,952,019 | 100.00 | % | $ | 9,056,378 | $ | 11,017,499 | 100.00 | % | $ | 11,213,234 | ||||||||||||||||||
|
|
|
|
|
|
|
|
|
|
|
|
|
|
|
|
|
|
|
|||||||||||||||||||
| By coupon type: |
||||||||||||||||||||||||||||||||||||
| Adjustable-rate |
$ | 3,321,189 | 78.41 | % | $ | 3,396,138 | $ | 7,401,916 | 82.68 | % | $ | 7,490,495 | $ | 9,475,416 | 86.00 | % | $ | 9,606,020 | ||||||||||||||||||
| Fixed-rate |
914,252 | 21.59 | 923,326 | 1,550,103 | 17.32 | 1,565,883 | 1,542,083 | 14.00 | 1,607,214 | |||||||||||||||||||||||||||
|
|
|
|
|
|
|
|
|
|
|
|
|
|
|
|
|
|
|
|||||||||||||||||||
| Total mortgage-backed securities |
$ | 4,235,441 | 100.00 | % | $ | 4,319,464 | $ | 8,952,019 | 100.00 | % | $ | 9,056,378 | $ | 11,017,499 | 100.00 | % | $ | 11,213,234 | ||||||||||||||||||
|
|
|
|
|
|
|
|
|
|
|
|
|
|
|
|
|
|
|
|||||||||||||||||||
| Total investment portfolio |
$ | 14,048,579 | $ | 14,135,184 | $ | 13,479,122 | $ | 13,587,197 | $ | 12,141,493 | $ | 12,343,809 | ||||||||||||||||||||||||
|
|
|
|
|
|
|
|
|
|
|
|
|
|||||||||||||||||||||||||
| (1) | Based on carrying value for each investment type. |
28
Table of Contents
Carrying Values, Rates and Maturities. The table below presents information regarding the carrying values, weighted average rates and contractual maturities of our money market investments, investment securities and mortgage-backed securities at December 31, 2014. Mortgage-backed securities are presented by issuer and by coupon type. The table does not include the effect of prepayments or scheduled principal amortization. Equity securities have been excluded from this table.
| At December 31, 2014 | ||||||||||||||||||||||||||||||||||||||||
| One Year or Less | More Than One Year to Five Years |
More Than Five Years to Ten Years |
More Than Ten Years | Total | ||||||||||||||||||||||||||||||||||||
| Weighted | Weighted | Weighted | Weighted | Weighted | ||||||||||||||||||||||||||||||||||||
| Carrying | Average | Carrying | Average | Carrying | Average | Carrying | Average | Carrying | Average | |||||||||||||||||||||||||||||||
| Value | Rate | Value | Rate | Value | Rate | Value | Rate | Value | Rate | |||||||||||||||||||||||||||||||
| (Dollars in thousands) | ||||||||||||||||||||||||||||||||||||||||
| Money market investments: |
||||||||||||||||||||||||||||||||||||||||
| Federal funds sold and other overnight deposits |
$ | 6,163,082 | 0.25 | % | $ | — | — | % | $ | — | — | % | $ | — | 0 | % | $ | 6,163,082 | 0.25 | % | ||||||||||||||||||||
|
|
|
|
|
|
|
|
|
|
|
|||||||||||||||||||||||||||||||
| Investment securities: |
||||||||||||||||||||||||||||||||||||||||
| Held to maturity: |
||||||||||||||||||||||||||||||||||||||||
| United States government-sponsored enterprises |
$ | — | — | % | $ | — | — | % | $ | — | — | % | $ | 39,011 | 5.00 | % | $ | 39,011 | 5.00 | % | ||||||||||||||||||||
|
|
|
|
|
|
|
|
|
|
|
|
|
|
|
|
|
|
|
|
|
|||||||||||||||||||||
| Total held to maturity |
— | — | — | — | — | — | 39,011 | 5.00 | 39,011 | 5.00 | ||||||||||||||||||||||||||||||
|
|
|
|
|
|
|
|
|
|
|
|
|
|
|
|
|
|
|
|
|
|||||||||||||||||||||
| Available for sale: |
||||||||||||||||||||||||||||||||||||||||
| United States government-sponsored enterprises |
300,152 | 0.26 | 3,293,497 | 0.36 | — | — | — | 3,593,649 | 0.35 | |||||||||||||||||||||||||||||||
|
|
|
|
|
|
|
|
|
|
|
|
|
|
|
|
|
|
|
|
|
|||||||||||||||||||||
| Total available for sale |
300,152 | 0.26 | 3,293,497 | 0.36 | — | — | 3,593,649 | 0.35 | ||||||||||||||||||||||||||||||||
|
|
|
|
|
|
|
|
|
|
|
|
|
|
|
|
|
|
|
|
|
|||||||||||||||||||||
| Total investment securities |
$ | 300,152 | 0.26 | % | $ | 3,293,497 | 0.36 | % | $ | — | — | % | $ | 39,011 | 5.00 | % | $ | 3,632,660 | 0.40 | % | ||||||||||||||||||||
|
|
|
|
|
|
|
|
|
|
|
|||||||||||||||||||||||||||||||
| Mortgage-backed securities: |
||||||||||||||||||||||||||||||||||||||||
| By issuer: |
||||||||||||||||||||||||||||||||||||||||
| Held to maturity: |
||||||||||||||||||||||||||||||||||||||||
| Pass-through certificates: |
||||||||||||||||||||||||||||||||||||||||
| GNMA |
$ | — | — | % | $ | 61 | 2.91 | % | $ | 23,676 | 1.61 | % | $ | 30,564 | 1.65 | % | $ | 54,301 | 1.63 | % | ||||||||||||||||||||
| FNMA |
22 | 8.60 | 1,361 | 5.93 | 7,524 | 4.78 | 270,046 | 2.47 | 278,953 | 2.55 | ||||||||||||||||||||||||||||||
| FHLMC |
— | — | 1,035 | 2.57 | 5,156 | 4.82 | 859,173 | 2.33 | 865,364 | 2.35 | ||||||||||||||||||||||||||||||
| REMICS: |
||||||||||||||||||||||||||||||||||||||||
| FHLMC and FNMA |
— | — | — | — | 989 | 4.87 | 72,530 | 4.50 | 73,519 | 4.50 | ||||||||||||||||||||||||||||||
|
|
|
|
|
|
|
|
|
|
|
|
|
|
|
|
|
|
|
|
|
|||||||||||||||||||||
| Total held to maturity |
22 | 8.60 | 2,457 | 4.44 | 37,345 | 2.78 | 1,232,313 | 2.47 | 1,272,137 | 2.48 | ||||||||||||||||||||||||||||||
|
|
|
|
|
|
|
|
|
|
|
|
|
|
|
|
|
|
|
|
|
|||||||||||||||||||||
| Available for sale: |
||||||||||||||||||||||||||||||||||||||||
| Pass-through certificates: |
||||||||||||||||||||||||||||||||||||||||
| GNMA |
— | — | — | — | — | — | 653,408 | 2.21 | 653,408 | 2.21 | ||||||||||||||||||||||||||||||
| FNMA |
— | — | — | — | 12,748 | 5.06 | 1,683,150 | 1.91 | 1,695,898 | 1.93 | ||||||||||||||||||||||||||||||
| FHLMC |
— | — | — | — | 9,093 | 4.94 | 604,905 | 1.83 | 613,998 | 1.88 | ||||||||||||||||||||||||||||||
|
|
|
|
|
|
|
|
|
|
|
|
|
|
|
|
|
|
|
|
|
|||||||||||||||||||||
| Total available for sale |
— | — | — | — | 21,841 | 5.01 | 2,941,463 | 1.96 | 2,963,304 | 1.98 | ||||||||||||||||||||||||||||||
|
|
|
|
|
|
|
|
|
|
|
|
|
|
|
|
|
|
|
|
|
|||||||||||||||||||||
| Total mortgage-backed securities |
$ | 22 | 8.60 | % | $ | 2,457 | 4.44 | % | $ | 59,186 | 3.60 | % | $ | 4,173,776 | 2.11 | % | $ | 4,235,441 | 2.13 | % | ||||||||||||||||||||
|
|
|
|
|
|
|
|
|
|
|
|||||||||||||||||||||||||||||||
| By coupon type: |
||||||||||||||||||||||||||||||||||||||||
| Adjustable-rate |
1 | 1.19 | 1,054 | 1.90 | 24,145 | 1.62 | 3,295,989 | 1.91 | 3,321,189 | 1.91 | ||||||||||||||||||||||||||||||
| Fixed-rate |
21 | 8.83 | 1,403 | 6.34 | 35,040 | 4.96 | 877,788 | 2.89 | 914,252 | 2.97 | ||||||||||||||||||||||||||||||
|
|
|
|
|
|
|
|
|
|
|
|
|
|
|
|
|
|
|
|
|
|||||||||||||||||||||
| Total mortgage-backed securities |
$ | 22 | 8.60 | % | $ | 2,457 | 4.44 | % | $ | 59,185 | 3.60 | % | $ | 4,173,777 | 2.11 | % | $ | 4,235,441 | 2.13 | % | ||||||||||||||||||||
|
|
|
|
|
|
|
|
|
|
|
|||||||||||||||||||||||||||||||
| Total |
$ | 6,463,256 | 0.25 | % | $ | 3,295,954 | 0.36 | % | $ | 59,185 | 3.60 | % | $ | 4,212,788 | 2.14 | % | $ | 14,031,183 | 0.86 | % | ||||||||||||||||||||
|
|
|
|
|
|
|
|
|
|
|
|||||||||||||||||||||||||||||||
29
Table of Contents
Sources of Funds
General. Our primary sources of funds are customer deposits, borrowings, scheduled amortization and prepayments of mortgage loans and mortgage-backed securities, maturities and calls of investment securities and funds provided by our operations. Retail deposits generated through our branch network and wholesale borrowings have been our primary means of funding our growth initiatives. During 2014, we maintained lower deposit rates to manage deposit reductions at a time when there were limited investment opportunities with attractive yields to reinvest the funds received from payment activity on mortgage-related assets. Market interest rates remained at historically low levels during 2014 and as a result, we continued to reduce the size of our balance sheet, a process that began in 2012. We intend to restrain any future growth until the yields available on mortgage-related assets and investment securities increase and allow for more profitable growth. We intend to fund such future growth primarily with customer deposits, using borrowed funds as a supplemental funding source if deposit growth decreases. See “Item 7—Management’s Discussion and Analysis of Financial Condition and Results of Operations—Liquidity and Capital Resources.”
Deposits. We offer a variety of deposit accounts having a range of interest rates and terms. We currently offer passbook and statement savings accounts, interest-bearing transaction accounts, checking accounts, money market accounts and time deposits. We also offer IRA accounts and qualified retirement plans.
Deposit flows are influenced significantly by general and local economic conditions, changes in prevailing market interest rates, pricing of deposits and competition. In determining our deposit rates, we consider local competition, U.S. Treasury securities offerings and the rates charged on other sources of funds. Our deposits are primarily obtained from market areas surrounding our branch offices. We also open deposit accounts through the internet for customers throughout the United States. We rely primarily on paying competitive rates, providing strong customer service and maintaining long-standing relationships with customers to attract and retain these deposits. We do not use brokers to obtain deposits. Our most direct competition for deposits comes from commercial banks, savings banks, savings and loan associations and credit unions. There are large money-center and regional financial institutions operating throughout our market area, and we also face strong competition from other community-based financial institutions.
Total deposits decreased $2.09 billion, or 9.7%, during 2014 due primarily to a decrease of $1.03 billion in our money market accounts, a decrease of $1.02 billion in our time deposit accounts, and a decrease of $92.5 million in our interest-bearing transaction accounts. The decrease in our money market accounts, time deposit accounts and interest-bearing transaction accounts is primarily due to maintaining lower deposit rates that allow us to manage deposit levels at a time when there are limited investment opportunities. These decreases were partially offset by an increase of $46.1 million in our savings accounts. Total core deposits (defined as non-time deposit accounts) represented approximately 41.2% of total deposits as of December 31, 2014 compared with 42.2% as of December 31, 2013. The aggregate balance in our time deposit accounts was $11.39 billion as of December 31, 2014 compared with $12.40 billion as of December 31, 2013. Time deposits with remaining maturities of less than one year amounted to $7.34 billion at December 31, 2014 compared with $7.49 billion at December 31, 2013.
30
Table of Contents
The following table presents our deposit activity for the years indicated:
| For the Year Ended December 31, | ||||||||||||
| 2014 | 2013 | 2012 | ||||||||||
| (Dollars in thousands) | ||||||||||||
| Total deposits at beginning of year |
$ | 21,472,329 | $ | 23,483,917 | $ | 25,507,760 | ||||||
| Net decrease in deposits |
(2,254,937 | ) | (2,193,979 | ) | (2,262,527 | ) | ||||||
| Interest credited |
159,152 | 182,391 | 238,684 | |||||||||
|
|
|
|
|
|
|
|||||||
| Total deposits at end of year |
$ | 19,376,544 | $ | 21,472,329 | $ | 23,483,917 | ||||||
|
|
|
|
|
|
|
|||||||
| Net decrease |
$ | (2,095,785 | ) | $ | (2,011,588 | ) | $ | (2,023,843 | ) | |||
|
|
|
|
|
|
|
|||||||
| Percent decrease |
(9.76 | )% | (8.57 | )% | (7.93 | )% | ||||||
At December 31, 2014, we had $4.77 billion in time deposits with balances of $100,000 and over maturing as follows:
| Maturity Period |
Amount | |||
| (In thousands) | ||||
| 3 months or less |
$ | 796,637 | ||
| Over 3 months through 6 months |
815,274 | |||
| Over 6 months through 12 months |
1,356,505 | |||
| Over 12 months |
1,797,311 | |||
|
|
|
|||
| Total |
$ | 4,765,727 | ||
|
|
|
|||
The following table presents the distribution of our deposit accounts at the dates indicated by dollar amount and percent of portfolio, and the weighted average nominal interest rate on each category of deposits.
| At December 31, | ||||||||||||||||||||||||||||||||||||
| 2014 | 2013 | 2012 | ||||||||||||||||||||||||||||||||||
| Weighted | Weighted | Weighted | ||||||||||||||||||||||||||||||||||
| Percent | average | Percent | average | Percent | average | |||||||||||||||||||||||||||||||
| of total | nominal | of total | nominal | of total | nominal | |||||||||||||||||||||||||||||||
| Amount | deposits | rate | Amount | deposits | rate | Amount | deposits | rate | ||||||||||||||||||||||||||||
| (Dollars in thousands) | ||||||||||||||||||||||||||||||||||||
| Savings |
$ | 1,055,298 | 5.45 | % | 0.15 | % | $ | 1,009,237 | 4.70 | % | 0.15 | % | $ | 948,194 | 4.04 | % | 0.25 | % | ||||||||||||||||||
| Interest-bearing demand |
2,116,447 | 10.92 | 0.24 | 2,208,985 | 10.29 | 0.24 | 2,300,145 | 9.79 | 0.33 | |||||||||||||||||||||||||||
| Money market |
4,154,310 | 21.44 | 0.20 | 5,188,632 | 24.16 | 0.20 | 6,634,308 | 28.25 | 0.35 | |||||||||||||||||||||||||||
| Noninterest-bearing demand |
665,100 | 3.43 | — | 661,221 | 3.08 | — | 649,925 | 2.77 | — | |||||||||||||||||||||||||||
|
|
|
|
|
|
|
|
|
|
|
|
|
|
|
|
|
|
|
|||||||||||||||||||
| Total |
7,991,155 | 41.24 | 0.19 | 9,068,075 | 42.23 | 0.19 | 10,532,572 | 44.85 | 0.32 | |||||||||||||||||||||||||||
|
|
|
|
|
|
|
|
|
|
|
|
|
|
|
|
|
|
|
|||||||||||||||||||
| Time deposits: |
||||||||||||||||||||||||||||||||||||
| Time deposits $100,000 and over |
4,765,727 | 24.60 | 1.25 | 5,117,193 | 23.83 | 1.29 | 5,171,558 | 22.02 | 1.38 | |||||||||||||||||||||||||||
| Time deposits less than $100,000 |
5,329,163 | 27.50 | 1.04 | 5,915,254 | 27.55 | 1.05 | 6,385,130 | 27.19 | 1.17 | |||||||||||||||||||||||||||
| Qualified retirement plans |
1,290,499 | 6.66 | 1.36 | 1,371,807 | 6.39 | 1.44 | 1,394,657 | 5.94 | 1.53 | |||||||||||||||||||||||||||
|
|
|
|
|
|
|
|
|
|
|
|
|
|
|
|
|
|
|
|||||||||||||||||||
| Total time deposits |
11,385,389 | 58.76 | 1.16 | 12,404,254 | 57.77 | 1.19 | 12,951,345 | 55.15 | 1.29 | |||||||||||||||||||||||||||
|
|
|
|
|
|
|
|
|
|
|
|
|
|
|
|
|
|
|
|||||||||||||||||||
| Total deposits |
$ | 19,376,544 | 100.00 | % | 0.76 | % | $ | 21,472,329 | 100.00 | % | 0.77 | % | $ | 23,483,917 | 100.00 | % | 0.85 | % | ||||||||||||||||||
|
|
|
|
|
|
|
|
|
|
|
|
|
|
|
|
|
|
|
|||||||||||||||||||
31
Table of Contents
The following table presents, by rate category, the amount of our time deposit accounts outstanding at the dates indicated.
| At December 31, | ||||||||||||
| 2014 | 2013 | 2012 | ||||||||||
| (In thousands) | ||||||||||||
| Amount | Amount | Amount | ||||||||||
| Time deposit accounts: |
||||||||||||
| 0.50% or less |
$ | 2,678,865 | $ | 2,792,287 | $ | 2,495,055 | ||||||
| 0.51% to 1.00% |
3,683,392 | 4,954,935 | 4,455,625 | |||||||||
| 1.01% to 1.50% |
2,649,670 | 1,682,361 | 2,591,004 | |||||||||
| 1.51% to 2.00% |
777,722 | 856,167 | 765,595 | |||||||||
| 2.01% to 2.50% |
719,999 | 808,720 | 1,054,713 | |||||||||
| 2.51% to 3.00% |
206,652 | 328,296 | 499,653 | |||||||||
| 3.01% and over |
669,089 | 981,488 | 1,089,700 | |||||||||
|
|
|
|
|
|
|
|||||||
| Total |
$ | 11,385,389 | $ | 12,404,254 | $ | 12,951,345 | ||||||
|
|
|
|
|
|
|
|||||||
The following table presents, by rate category, the remaining period to maturity of time deposit accounts outstanding as of December 31, 2014.
| Period to Maturity from December 31, 2014 | ||||||||||||||||||||||||||||
| Within | Over three | Over six | Over one | Over two | Over | |||||||||||||||||||||||
| three | to six | months to | to two | to three | three | |||||||||||||||||||||||
| months | months | one year | years | years | years | Total | ||||||||||||||||||||||
| (Dollars in thousands) | ||||||||||||||||||||||||||||
| Time deposit accounts: |
||||||||||||||||||||||||||||
| 0.50% or less |
$ | 1,433,988 | $ | 742,865 | $ | 501,579 | $ | 251 | $ | 100 | $ | 82 | $ | 2,678,865 | ||||||||||||||
| 0.51% to 1.00% |
331,063 | 845,861 | 1,693,890 | 812,285 | 43 | 250 | 3,683,392 | |||||||||||||||||||||
| 1.01% to 1.50% |
63,346 | 46,567 | 499,102 | 1,517,719 | 143,935 | 379,001 | 2,649,670 | |||||||||||||||||||||
| 1.51% to 2.00% |
38 | 38 | 17,854 | 206,333 | 416,179 | 137,280 | 777,722 | |||||||||||||||||||||
| 2.01% to 2.50% |
39,537 | 36,200 | 211,986 | 432,258 | 18 | — | 719,999 | |||||||||||||||||||||
| 2.51% to 3.00% |
— | 26,892 | 179,737 | 23 | — | — | 206,652 | |||||||||||||||||||||
| 3.01% and over |
280,696 | 387,414 | 967 | 12 | — | — | 669,089 | |||||||||||||||||||||
|
|
|
|
|
|
|
|
|
|
|
|
|
|
|
|||||||||||||||
| Total |
$ | 2,148,668 | $ | 2,085,837 | $ | 3,105,115 | $ | 2,968,881 | $ | 560,275 | $ | 516,613 | $ | 11,385,389 | ||||||||||||||
|
|
|
|
|
|
|
|
|
|
|
|
|
|
|
|||||||||||||||
| Weighted average rate |
0.83 | % | 1.16 | % | 1.12 | % | 1.33 | % | 1.55 | % | 1.46 | % | 1.16 | % | ||||||||||||||
Borrowings. We have entered into agreements with selected brokers and the FHLB to repurchase securities sold to these parties. These agreements are recorded as financing transactions as we have maintained effective control over the transferred securities. The dollar amount of the securities underlying the agreements continues to be carried in our securities portfolio. The obligations to repurchase the securities are reported as a liability in the consolidated statements of financial condition. The securities underlying the agreements are delivered to the party with whom each transaction is executed. They agree to resell to us the same securities at the maturity or put date of the agreement. We retain the right of substitution of the underlying securities throughout the terms of the agreements.
We have also obtained advances from the FHLB, which are generally secured by a blanket lien against our mortgage portfolio. Borrowings with the FHLB are generally limited to approximately twenty times the amount of FHLB stock owned.
32
Table of Contents
Borrowed funds at December 31 are summarized as follows:
| 2014 | 2013 | |||||||||||||||
| Weighted | Weighted | |||||||||||||||
| Average | Average | |||||||||||||||
| Principal | Rate | Principal | Rate | |||||||||||||
| (Dollars in thousands) | ||||||||||||||||
| Securities sold under agreements to repurchase: |
||||||||||||||||
| FHLB |
$ | — | — | % | $ | 800,000 | 4.53 | % | ||||||||
| Other brokers |
6,150,000 | 4.44 | 6,150,000 | 4.44 | ||||||||||||
|
|
|
|
|
|
|
|
|
|||||||||
| Total securities sold under agreements to repurchase |
6,150,000 | 4.44 | 6,950,000 | 4.45 | ||||||||||||
| Advances from the FHLB |
6,025,000 | 4.75 | 5,225,000 | 4.77 | ||||||||||||
|
|
|
|
|
|
|
|
|
|||||||||
| Total borrowed funds |
$ | 12,175,000 | 4.59 | % | $ | 12,175,000 | 4.59 | % | ||||||||
|
|
|
|
|
|||||||||||||
| Accrued interest payable |
$ | 64,080 | $ | 64,061 | ||||||||||||
The average balances of borrowings and the maximum amount outstanding at any month-end are as follows:
| At or for the Year Ended December 31, | ||||||||||||
| 2014 | 2013 | 2012 | ||||||||||
| (Dollars in thousands) | ||||||||||||
| Repurchase Agreements: |
||||||||||||
| Average balance outstanding during the year |
$ | 6,274,932 | $ | 6,950,000 | $ | 6,950,000 | ||||||
|
|
|
|
|
|
|
|||||||
| Maximum balance outstanding at any month-end during the year |
$ | 6,950,000 | $ | 6,950,000 | $ | 6,950,000 | ||||||
|
|
|
|
|
|
|
|||||||
| Weighted average rate during the period |
4.49 | % | 4.51 | % | 4.52 | % | ||||||
|
|
|
|
|
|
|
|||||||
| FHLB Advances: |
||||||||||||
| Average balance outstanding during the year |
$ | 5,900,068 | $ | 5,225,000 | $ | 6,623,094 | ||||||
|
|
|
|
|
|
|
|||||||
| Maximum balance outstanding at any month-end during the year |
$ | 6,025,000 | $ | 5,225,000 | $ | 7,875,000 | ||||||
|
|
|
|
|
|
|
|||||||
| Weighted average rate during the period |
4.82 | % | 4.84 | % | 4.02 | % | ||||||
|
|
|
|
|
|
|
|||||||
Since market interest rates have remained very low for an extended period of time, we have not had any lenders put borrowings back to us. At December 31, 2014, we had $3.33 billion of borrowed funds with a weighted average of 4.41% and with put dates within one year, all of which can be put back to the Company quarterly. If interest rates were to decrease, or remain consistent with current rates, we believe these borrowings would probably not be put back and our average cost of existing borrowings would not decrease even as market interest rates decrease. Conversely, if interest rates increase above the market interest rate for similar borrowings, we believe these borrowings would likely be put back at their next put date and our cost to replace these borrowings would increase. However, we believe, given current market conditions, that the likelihood that a significant portion of these borrowings would be put back will not increase substantially unless interest rates were to increase by at least 250 basis points from current levels.
We did not enter into any new repurchase agreements during 2014.
33
Table of Contents
The scheduled maturities and potential put dates of our borrowings as of December 31, 2014 are as follows:
| Borrowings by Scheduled | Borrowings by Earlier of Scheduled | |||||||||||||||
| Maturity Date | Maturity or Next Potential Put Date | |||||||||||||||
| Weighted | Weighted | |||||||||||||||
| Average | Average | |||||||||||||||
| Year |
Principal | Rate | Principal | Rate | ||||||||||||
| (Dollars in thousands) | ||||||||||||||||
| 2015 |
$ | 75,000 | 4.62 | % | $ | 3,400,000 | 4.42 | % | ||||||||
| 2016 |
3,925,000 | 4.92 | 3,925,000 | 4.92 | ||||||||||||
| 2017 |
2,475,000 | 4.39 | 200,000 | 4.04 | ||||||||||||
| 2018 |
700,000 | 3.65 | 500,000 | 3.54 | ||||||||||||
| 2019 |
1,725,000 | 4.62 | 1,325,000 | 4.69 | ||||||||||||
| 2020 |
3,275,000 | 4.53 | 2,825,000 | 4.52 | ||||||||||||
|
|
|
|
|
|
|
|
|
|||||||||
| Total |
$ | 12,175,000 | 4.59 | % | $ | 12,175,000 | 4.59 | % | ||||||||
|
|
|
|
|
|||||||||||||
The amortized cost and fair value of the underlying securities used as collateral for securities sold under agreements to repurchase are as follows:
| At December 31, | ||||||||||||
| 2014 | 2013 | 2012 | ||||||||||
| (In thousands) | ||||||||||||
| Amortized cost of collateral: |
||||||||||||
| United States government-sponsored enterprise securities |
$ | 3,501,025 | $ | 298,190 | $ | — | ||||||
| Mortgage-backed securities |
3,766,108 | 7,886,833 | 8,672,162 | |||||||||
|
|
|
|
|
|
|
|||||||
| Total amortized cost of collateral |
$ | 7,267,133 | $ | 8,185,023 | $ | 8,672,162 | ||||||
|
|
|
|
|
|
|
|||||||
| Fair value of collateral: |
||||||||||||
| United States government-sponsored enterprise securities |
$ | 3,496,659 | $ | 290,194 | $ | — | ||||||
| Mortgage-backed securities |
3,864,959 | 8,045,674 | 8,991,053 | |||||||||
|
|
|
|
|
|
|
|||||||
| Total fair value of collateral |
$ | 7,361,618 | $ | 8,335,868 | $ | 8,991,053 | ||||||
|
|
|
|
|
|
|
|||||||
Subsidiaries
Hudson City Savings has two wholly owned and consolidated subsidiaries: HudCiti Service Corporation and HC Value Broker Services, Inc. HudCiti Service Corporation, which qualifies as a New Jersey investment company, had two wholly owned and consolidated subsidiaries during 2014: Hudson City Preferred Funding Corporation and Sound REIT, Inc. Hudson City Preferred Funding and Sound REIT qualified as real estate investment trusts, pursuant to the Internal Revenue Code of 1986, as amended. Hudson City Preferred Funding is no longer active and a certificate of dissolution was filed for this entity on December 31, 2014. Sound REIT had $6.5 million of residential mortgage loans outstanding at December 31, 2014.
HC Value Broker Services, Inc., whose primary operating activity is the referral of insurance applications, formed a strategic alliance that jointly markets insurance products with Savings Bank Life Insurance of Massachusetts.
34
Table of Contents
Personnel
As of December 31, 2014, we had 1,438 full-time employees and 137 part-time employees. Employees are not represented by a collective bargaining unit and we consider our relationship with our employees to be good.
REGULATION OF HUDSON CITY SAVINGS BANK AND HUDSON CITY BANCORP
General
Hudson City Savings has been a federally chartered savings bank since January 1, 2004 when it converted from a New Jersey chartered savings bank. Its deposit accounts are insured up to applicable limits by the FDIC under the Deposit Insurance Fund (“DIF”). On July 21, 2010, President Obama signed into law the Reform Act. The Reform Act imposes new restrictions and extends the framework of regulatory oversight for financial institutions, including depository institutions. The Reform Act provides for a variety of new, substantive operational requirements that impact a large number of different areas of bank operations, risk management and capital management. In addition, the Reform Act changed the jurisdictions of existing bank regulatory agencies and in particular transferred the regulation of federal savings associations from the OTS to the OCC, effective July 21, 2011. Savings and loan holding companies are now regulated by the FRB. As a result, Hudson City Savings is now regulated, examined and supervised by the OCC and Hudson City Bancorp is now regulated, examined and supervised by the FRB.
Hudson City Savings must file reports with the OCC concerning its activities and financial condition, and must obtain regulatory approval from the OCC prior to entering into certain transactions, such as mergers with, or acquisitions of, other depository institutions. The OCC conducts periodic examinations to assess Hudson City Savings’ compliance with various regulatory requirements. The OCC has primary enforcement responsibility over Hudson City Savings and has substantial discretion to impose an enforcement action if Hudson City Savings fails to comply with applicable regulatory requirements, particularly with respect to its capital requirements. In addition, the FDIC has the authority to recommend to the OCC that enforcement action be taken with respect to Hudson City Savings and, if action is not taken by the OCC, the FDIC has the authority to take such action under certain circumstances.
We are also subject to supervision, examination and regulation by the Consumer Financial Protection Bureau (“CFPB”), which is authorized to supervise certain consumer financial services companies and insured depository institutions with more than $10 billion in total assets, such as Hudson City Savings, for consumer protection purposes. The CFPB has exclusive examination and primary enforcement authority with respect to compliance with federal consumer financial protection laws and regulations by institutions under its supervision and is authorized to conduct investigations to determine whether any person is, or has, engaged in conduct that violates such laws or regulations.
This regulation and supervision establishes a comprehensive framework of activities in which a federal savings bank can engage and is intended primarily for the protection of the DIF and depositors and other consumers. The regulatory structure also gives the regulatory authorities extensive discretion in connection with their supervisory and enforcement activities and examination policies, including policies with respect to the classification of assets and the establishment of adequate loan loss reserves for regulatory purposes. Any change in laws and regulations (including laws concerning taxes, banking, securities, accounting and insurance), whether by the FRB, OCC, FDIC, CFPB or another government agency, or through legislation, could have a material adverse impact on Hudson City Bancorp and Hudson City Savings and their operations.
35
Table of Contents
Certain of the regulatory requirements that are or will be applicable to Hudson City Bancorp and Hudson City Savings are described below. This description of statutes and regulations is not intended to be a complete explanation of such statutes and regulations and their effects on Hudson City Bancorp and Hudson City Savings and is qualified in its entirety by reference to the actual statutes and regulations.
Informal Regulatory Agreement — Memorandum of Understanding. On March 30, 2012, the Bank entered into the Bank MOU with the OCC, which is substantially similar to and replaced the memorandum of understanding the Bank entered into with our former regulator, the OTS, on June 24, 2011. In accordance with the Bank MOU, the Bank adopted and implemented enhanced operating policies and procedures that are intended to enable us to continue to (a) reduce our level of interest rate risk, (b) reduce our funding concentration, (c) diversify our funding sources, (d) enhance our liquidity position, (e) monitor and manage loan modifications and (f) maintain our capital position in accordance with our existing capital plan. In addition, we developed the Strategic Plan for the Bank which establishes objectives for the Bank’s overall risk profile, earnings performance, growth and balance sheet mix and to enhance our enterprise risk management program. On February 26, 2015 the OCC terminated the Bank MOU.
The Company entered into the Company MOU with the FRB on April 24, 2012, which is substantially similar to and replaced the memorandum of understanding the Company entered into with our former regulator, the OTS, on June 24, 2011. In accordance with the Company MOU, the Company must, among other things support the Bank’s compliance with the Bank MOU. The Company MOU also requires the Company to: (a) obtain approval from the FRB prior to receiving a capital distribution from the Bank or declaring a dividend to shareholders and (b) obtain approval from the FRB prior to repurchasing or redeeming any Company stock or incurring any debt with a maturity of greater than one year. In accordance with the Company MOU, the Company submitted a comprehensive capital plan and a comprehensive earnings plan to the FRB.
While the Company believes it is in compliance in all material respects with the Company MOU, it will remain in effect until modified or terminated by the FRB.
Federally Chartered Savings Bank Regulation
Activity Powers. Hudson City Savings derives its lending, investment and other activity powers primarily from the Home Owners’ Loan Act, as amended, commonly referred to as HOLA, and the regulations of the OCC thereunder. Under these laws and regulations, federal savings banks, including Hudson City Savings, generally may invest in real estate mortgages, consumer and commercial loans, certain types of debt securities and certain other assets.
These investment powers are subject to various limitations, including (1) a prohibition against the acquisition of any corporate debt security unless the debt securities may be sold with reasonable promptness at a price that corresponds reasonably to their fair value and such securities are investment grade, (2) a limit of 400% of an association’s capital on the aggregate amount of loans secured by non-residential real estate property, (3) a limit of 20% of an association’s assets on commercial loans, with the amount of commercial loans in excess of 10% of assets being limited to small business loans, (4) a limit of 35% of an association’s assets on the aggregate amount of consumer loans and acquisitions of certain debt securities, (5) a limit of 5% of assets on non-conforming loans (certain loans in excess of the specific limitations of HOLA), and (6) a limit of the greater of 5% of assets or an association’s capital on certain construction loans made for the purpose of financing what is or is expected to become residential property. Hudson City Savings may also establish service corporations that may engage in activities not otherwise permissible for Hudson City Savings, including certain real estate equity investments and securities and insurance brokerage activities.
Capital Requirements. Prior to January 1, 2015, the OCC capital regulations required federally chartered savings banks to meet three minimum capital ratios: a 1.5% tangible capital ratio, a 4.0% (3.0% if the savings bank received the highest rating on its most recent examination) leverage (core capital) ratio and an 8.0% total risk-based capital ratio. At December 31, 2014, Hudson City Savings exceeded each of its capital requirements with a tangible capital ratio of 11.74%, leverage ratio of 11.74% and a total risk-based capital ratio of 28.75%.
36
Table of Contents
Generally banks, bank holding companies and savings associations (collectively, banking organizations) are required to deduct certain assets from Tier 1 capital, and though a banking organization is permitted to net any associated deferred tax liability against some of such assets prior to making the deduction from Tier 1 capital, such netting generally is not permitted for goodwill and other intangible assets arising from a taxable business combination. In these cases, the full or gross carrying amount of the asset is deducted. However, banking organizations may reduce the amount of goodwill arising from a taxable business combination that they may deduct from Tier 1 capital by the amount of any deferred tax liability associated with that goodwill. We have no deferred tax liabilities associated with goodwill and, as a result, the full amount of our goodwill is deducted from Tier 1 capital. For banking organizations that elect to apply this rule, the amount of goodwill deducted from Tier 1 capital would reflect the maximum exposure to loss in the event that the entire amount of goodwill is impaired or derecognized for financial reporting purposes. A banking organization that reduces the amount of goodwill deducted from Tier 1 capital by the amount of the deferred tax liability is not permitted to net this deferred tax liability against deferred tax assets when determining regulatory capital limitations on deferred tax assets.
The following table sets forth information regarding Hudson City Savings’ actual capital amounts and ratios and the regulatory capital requirements applicable to Hudson City Savings at the dates indicated:
| OCC Requirements | ||||||||||||||||||||||||
| Minimum Capital | For Classification as | |||||||||||||||||||||||
| Bank Actual | Adequacy | Well-Capitalized | ||||||||||||||||||||||
| Amount | Ratio | Amount | Ratio | Amount | Ratio | |||||||||||||||||||
| (Dollars in thousands) | ||||||||||||||||||||||||
| December 31, 2014 |
||||||||||||||||||||||||
| Tangible capital |
$ | 4,262,696 | 11.74 | % | $ | 544,721 | 1.50 | % | n/a | n/a | ||||||||||||||
| Leverage (core) capital |
4,262,696 | 11.74 | 1,452,590 | 4.00 | $ | 1,815,737 | 5.00 | % | ||||||||||||||||
| Total-risk-based capital |
4,457,171 | 28.75 | 1,240,172 | 8.00 | 1,550,215 | 10.00 | ||||||||||||||||||
| December 31, 2013 |
||||||||||||||||||||||||
| Tangible capital |
$ | 4,145,444 | 10.82 | % | $ | 574,791 | 1.50 | % | n/a | n/a | ||||||||||||||
| Leverage (core) capital |
4,145,444 | 10.82 | 1,532,777 | 4.00 | $ | 1,915,971 | 5.00 | % | ||||||||||||||||
| Total-risk-based capital |
4,361,710 | 25.31 | 1,378,687 | 8.00 | 1,723,359 | 10.00 | ||||||||||||||||||
Pursuant to the Reform Act, the federal bank regulatory agencies (the “Agencies”) issued rules that subject many savings and loan holding companies, including Hudson City Bancorp, to consolidated capital requirements (the “Final Capital Rules”). The Final Capital Rules also revise the quantity and quality of required minimum risk-based and leverage capital requirements applicable to Hudson City Bancorp and Hudson City Savings, consistent with the Reform Act and the Basel III capital standards. The Final Capital Rules revise the quantity and quality of capital required by: (1) establishing a new minimum common equity Tier 1 ratio of 4.5% of risk-weighted assets; (2) raising the minimum Tier 1 capital ratio from 4.0% to 6.0% of risk-weighted assets; (3) maintaining the minimum total capital ratio of 8.0% of risk-weighted assets; and (4) maintaining a minimum Tier 1 capital to adjusted average consolidated assets, known as the leverage ratio, of 4.0%.
Furthermore, the Final Capital Rules add a requirement for a minimum common equity Tier 1 capital conservation buffer of 2.5% of risk-weighted assets, or the Conservation Buffer, to be applied to the common equity Tier 1 capital ratio, the Tier 1 capital ratio and the total capital ratio. Failure to maintain the Conservation Buffer will result in restrictions on capital distributions and certain discretionary cash bonus payments to
37
Table of Contents
executive officers. The required minimum Conservation Buffer will be phased in incrementally, starting at 0.625% on January 1, 2016 and increasing to 1.25% on January 1, 2017, 1.875% on January 1, 2018 and 2.5% on January 1, 2019. If a banking organization’s Conservation Buffer is less than the required minimum and its net income for the four calendar quarters preceding the applicable calendar quarter, net of any capital distributions and associated tax effects not already reflected in net income, or Eligible Retained Income, is negative, it would be prohibited from making capital distributions or certain discretionary cash bonus payments to executive officers. As a result, under the Final Capital Rules, should we fail to maintain the Conservation Buffer we would be subject to limits on, and in the event we have negative Eligible Retained Income for any four consecutive calendar quarters, we would be prohibited in, our ability to obtain capital distributions from Hudson City Savings. If we do not receive sufficient cash dividends from Hudson City Savings, then we may not have sufficient funds to pay dividends or repurchase our common stock.
Moreover, the Final Capital Rules revise existing and establish new risk weights for certain exposures, including, among other exposures, residential mortgage loans, commercial loans, which generally include commercial real estate loans, multi-family loans, past due loans and GSE exposures. Under the Final Capital Rules, residential mortgage loans guaranteed by the U.S. government or its agencies maintain their current risk-based capital treatment (a risk weight of 0% for those unconditionally guaranteed and a risk weight of 20% for those that are conditionally guaranteed). Residential mortgage loans secured by a first-lien on an owner-occupied or rented one-to four-family residential property that meet prudential underwriting standards, are not 90 days or more past due or carried on non-accrual status, and that are not restructured or modified have a risk weight of 50%. All other residential mortgage loans have a risk weight of 100%. Under the Final Capital Rules, pre-sold construction loans have a risk weight of 50%, unless the purchase contract is cancelled, in which case the risk weight is 100%. Multi-family mortgage loans have a risk weight of 50%. High-volatility commercial real estate exposures have a risk weight of 150%, preferred stock issued by a GSE has a risk weight of 100% and exposures to GSEs that are not equity exposures have a risk weight of 20%.
The new minimum regulatory capital ratios and changes to the calculation of risk-weighted assets (each as described above) under the Final Capital Rules became effective for Hudson City Bancorp and Hudson City Savings on January 1, 2015. The required minimum Conservation Buffer will be phased in incrementally, starting at 0.625% on January 1, 2016 and increasing to 1.25% on January 1, 2017, 1.875% on January 1, 2018 and 2.5% on January 1, 2019.
In assessing an institution’s capital adequacy, the OCC takes into consideration not only these numeric factors but qualitative factors as well, and has the authority to establish higher capital requirements for individual institutions where necessary. Hudson City Savings, as a matter of prudent management, targets as its goal the maintenance of capital ratios that exceed these minimum requirements and that are consistent with Hudson City Savings’ risk profile.
Stress Tests. The Reform Act requires national banks and federal savings associations with total consolidated assets of more than $10 billion to conduct annual stress tests. On October 9, 2012, the OCC published its final rules requiring annual capital-adequacy stress tests for national banks and federal savings associations with consolidated assets of more than $10 billion (the “Stress Test Rule”). Pursuant to the Stress Test Rule, Hudson City Savings must conduct annual stress tests using financial data as of September 30, report the results of the stress test to the OCC on or before March 31 and publicly disclose a summary of the results of its annual stress test between June 15 and June 30. The Stress Test Rule also requires each institution to establish and maintain a system of controls, oversight, and documentation, including policies and procedures, designed to ensure that the stress testing processes used by the institution are effective in meeting the requirements of the rule. In December 2014, the OCC amended the Stress Test Rule to shift the dates of the annual stress testing cycle (the “Amended Stress Test Rule”). In accordance with the Amended Stress Test Rule, for the stress test beginning January 1, 2016, Hudson City Savings must conduct its annual stress test using financial data as of December 31, report the results of the stress test to the OCC on or before July 31 and publicly disclose a summary of the results of its annual stress test between October 15 and October 31.
38
Table of Contents
During the first quarter of 2014, the Agencies issued final guidance outlining high-level principles for implementation of the stress tests required by the Reform Act and the Stress Test Rule (the “Stress Test Guidance”), which is applicable to all bank and savings and loan holding companies, national banks, state-member banks, state non-member banks, federal savings associations, and state chartered savings associations with more than $10 billion but less than $50 billion in total consolidated assets. The Stress Test Guidance discusses supervisory expectations for stress test practices under the Stress Test Rule. The Stress Test Guidance states that a company is expected to ensure that projected balance sheet and risk-weighted assets remain consistent with regulatory and accounting changes, are applied consistently across the company, and are consistent with the economic scenarios provided by the OCC for use in the stress test and the company’s past history of managing through different business environments. Furthermore, the Stress Test Guidance states that a company must consider the results of stress testing in the company’s capital planning, assessment of capital adequacy and risk management practices.
In addition, in May 2012, the Agencies adopted final supervisory guidance which outlines high-level principles for general stress testing practices, which is applicable to all banking organizations with more than $10 billion in total consolidated assets. The guidance provides an overview of how a banking organization should structure its stress testing activities and ensure they fit into overall risk management. The guidance outlines broad principles for a satisfactory stress testing framework and describes the manner in which stress testing should be employed as an integral component of risk management that is applicable at various levels of aggregation within a banking organization, as well as for contributing to capital and liquidity planning.
The Volcker Rule. In December 2013, the Agencies, the SEC and the CFTC adopted final rules implementing Section 619 of the Reform Act. Section 619 and the final implementing rules are, commonly known as the “Volcker Rule.” While Section 619 of the Reform Act provided that banking organizations were required to conform their activities and investments by July 21, 2014, in connection with issuing the final Volcker Rule, the FRB extended the conformance period until July 21, 2015. The FRB is permitted, by rule or order, to extend the conformance period for one year at a time, for a total of not more than 3 years. On December 18, 2014, the FRB issued an order (the “Extension Order”) that further extends until July 21, 2016 the conformance period under the Volcker Rule. The FRB stated in the Extension Order that it intends to exercise its authority again next year and grant the final one-year extension in order to permit banking organizations until July 21, 2017 to conform to the requirements of the Volcker Rule.
The Volcker Rule prohibits banking entities from acquiring and retaining an ownership interest in, sponsoring, or having certain relationships with a “covered fund.” The Volcker Rule generally treats as a covered fund any entity that would be an investment company under the Investment Company Act of 1940 (the “1940 Act”), but for the application of the exemptions from SEC registration set forth in Section 3(c)(1) (fewer than 100 beneficial owners) or Section 3(c)(7) (qualified purchasers) of the 1940 Act. In addition to prohibiting a banking entity from sponsoring or having an ownership interest in a covered fund, the Volker Rule also limits the term of relationships between banking entities and covered funds, and imposes new disclosure obligations for covered funds serviced by banking entities. The Volcker Rule also imposes corporate governance, compliance and control program, record keeping, regulatory reporting, training and audit requirements on banking entities. These requirements become more stringent and detailed based upon the size of the banking organization and scope and nature of its activities. Under the Volcker Rule, banking entities are also prohibited from engaging in proprietary trading.
The Company does not currently anticipate that the Volcker Rule will have a material effect on the operations of the Company and its subsidiaries, as the Company does not engage in proprietary trading, does not have any ownership interest in any funds that are not permitted under the Volcker Rule and does not engage in any other the activities prohibited by the Volcker Rule. As a depositary institution with over $ 10 billion in assets, we will need to adopt additional policies and systems to ensure compliance with the Volcker Rule. The costs of developing and implementing such policies and systems are not expected to be material.
39
Table of Contents
Interest Rate Risk. The Federal Deposit Insurance Corporation Improvement Act (“FDICIA”), required that the Agencies revise their risk-based capital standards to take into account interest rate risk, concentration of risk and the risks of non-traditional activities. The OCC regulations do not include a specific interest rate risk component of the risk based capital requirement. However, the OCC expects all federal savings associations to have an independent interest rate risk measurement process in place that measures both earnings and capital at risk, as described in the IRR Advisory and the 1996 IRR policy statement (each described below).
In June 1996, the Agencies adopted a Joint Agency Policy Statement on interest rate risk (the “1996 IRR policy statement”). The 1996 IRR policy statement provides guidance to examiners and bankers on sound practices for managing interest rate risk. The 1996 IRR policy statement also outlines fundamental elements of sound management that have been identified in prior regulatory guidance and discusses the importance of these elements in the context of managing interest rate risk. Specifically, the guidance emphasizes the need for active board of director and senior management oversight and a comprehensive risk management process that effectively identifies, measures and controls interest rate risk.
In January 2010, the Agencies released an Advisory on Interest Rate Risk Management (the “IRR Advisory”) to remind institutions of the supervisory expectations regarding sound practices for managing interest rate risk. While some degree of interest rate risk is inherent in the business of banking, the Agencies expect institutions to have sound risk management practices in place to measure, monitor and control interest rate risk exposures, and interest rate risk management should be an integral component of an institution’s risk management infrastructure. The Agencies expect all institutions to manage their interest rate risk exposures using processes and systems commensurate with their earnings and capital levels, complexity, business model, risk profile and scope of operations, and the IRR Advisory reiterates the importance of effective corporate governance, policies and procedures, risk measuring and monitoring systems, stress testing, and internal controls related to the interest rate risk exposures of institutions.
The IRR Advisory encourages institutions to use a variety of techniques to measure interest rate risk exposure, including simple maturity gap analysis, income measurement and valuation measurement for assessing the impact of changes in market rates, as well as simulation modeling to measure interest rate risk exposure. Institutions are encouraged to use the full complement of analytical capabilities of their interest rate risk simulation models. The IRR Advisory also reminds institutions that stress testing, which includes both scenario and sensitivity analysis, is an integral component of interest rate risk management. The IRR Advisory indicates that institutions should regularly assess interest rate risk exposures beyond typical industry conventions, including changes in rates of greater magnitude (e.g., up and down 300 and 400 basis points, as compared to up and down 200 basis points, which has been the general practice) across different tenors to reflect changing slopes and twists of the yield curve.
The IRR Advisory emphasizes that effective interest rate risk management not only involves the identification and measurement of interest rate risk, but also the appropriate actions to control this risk. The adequacy and effectiveness of an institution’s interest rate risk management process and the level of its interest rate risk exposure are critical factors in the Agencies’ evaluation of an institution’s sensitivity to changes in interest rates and capital adequacy.
Safety and Soundness Standards. Pursuant to the requirements of the FDICIA, as amended by the Riegle Community Development and Regulatory Improvement Act of 1994, the Agencies adopted guidelines establishing general standards relating to internal controls, information and internal audit systems, loan documentation, credit underwriting, interest rate exposure, asset growth, asset quality, earnings and compensation, fees and benefits. In general, the guidelines require, among other things, appropriate systems and practices to identify and manage the risks and exposures specified in the guidelines. The guidelines prohibit excessive compensation as an unsafe and unsound practice and describe compensation as excessive when the amounts paid are unreasonable or disproportionate to the services performed by an executive officer, employee, director, or principal shareholder.
40
Table of Contents
In addition, the OCC adopted regulations pursuant to FDICIA to require a savings bank that is given notice by the OCC that it is not satisfying any of such safety and soundness standards to submit a compliance plan to the OCC. If, after being so notified, a savings bank fails to submit an acceptable compliance plan or fails in any material respect to implement an accepted compliance plan, the OCC may issue an order directing corrective and other actions of the types to which a significantly undercapitalized institution is subject under the “prompt corrective action” provisions of FDICIA. If a savings bank fails to comply with such an order, the OCC may seek to enforce such an order in judicial proceedings and to impose civil monetary penalties.
Prompt Corrective Action. FDICIA established a system of prompt corrective action to resolve the problems of undercapitalized institutions. Under this system, the bank regulators are required to take certain, and authorized to take other, supervisory actions against undercapitalized institutions, based upon five categories of capitalization which FDICIA created: “well capitalized,” “adequately capitalized,” “undercapitalized,” “significantly undercapitalized” and “critically undercapitalized.” The severity of the action authorized or required to be taken under the prompt corrective action regulations increases as a bank’s capital decreases within the three undercapitalized categories. All banks are prohibited from paying dividends or other capital distributions or paying management fees to any controlling person if, following such distribution, the bank would be undercapitalized. The OCC is required to monitor closely the condition of an undercapitalized bank and to restrict the growth of its assets.
An undercapitalized bank is required to file a capital restoration plan with the OCC within 45 days of the date the bank receives notices that it is within any of the three undercapitalized categories, and the plan must be guaranteed by every parent holding company. The aggregate liability of a parent holding company is limited to the lesser of:
| 1. | an amount equal to five percent of the bank’s total assets at the time it became “undercapitalized”; and |
| 2. | the amount that is necessary (or would have been necessary) to bring the bank into compliance with all capital standards applicable with respect to such bank as of the time it fails to comply with the plan. |
If a bank fails to submit an acceptable plan, it is treated as if it were “significantly undercapitalized.” Banks that are significantly or critically undercapitalized are subject to a wider range of regulatory requirements and restrictions. Prior to January 1, 2015, under the OCC regulations, a federally chartered savings bank was considered well capitalized if its total risk-based capital ratio was 10.0% or greater and its Tier 1 risk-based capital ratio was 6.0% or greater, and its leverage ratio was 5.0% or greater, and it was not subject to any order or directive by the OCC to meet a specific capital level. As of December 31, 2014, Hudson City Savings met the applicable requirements to be considered “well capitalized”. Under the Final Capital Rules (described above), effective January 1, 2015, to be well capitalized, an insured depository institution must maintain a total risk-based capital ratio of 10.0% or greater, a Tier 1 risk-based capital ratio of 8.0% or greater, a common equity Tier 1 risk-based capital ratio of 6.5% or greater and a leverage capital ratio of 5.0% or greater and not be subject to any order or directive by the OCC to meet a specific capital level.
In addition to measures taken under the prompt corrective action provisions with respect to undercapitalized institutions, insured banks and their holding companies may be subject to potential enforcement actions by their regulators for unsafe and unsound practices in conducting their business or for violations of law or regulation, including the filing of a false or misleading regulatory report. Enforcement actions under this authority may include the issuance of cease and desist orders, the imposition of civil money penalties, the issuance of directives to increase capital, formal and informal agreements, or removal and prohibition orders against “institution-affiliated parties” (generally bank insiders). Further, the FRB may bring an enforcement action against a depository institution holding company either to address undercapitalization in the holding company or to require the holding company to take measures to remediate undercapitalization or other safety and soundness concerns in a depository institution subsidiary.
41
Table of Contents
Consumer Protection Laws.
Ability to Pay Rules. The CFPB adopted final rules in January 2013, referred to as the “Ability to Pay Rules,” that (i) prohibit creditors, such as Hudson City Savings, from extending mortgage loans without regard for the consumer’s ability to repay, (ii) specify the types of income and assets that may be considered in the ability-to-repay determination, the permissible sources for verification, and the required methods of calculating a loan’s monthly payments and (iii) establish certain protections from liability for loans that meet the requirements of a “Qualified Mortgage.” Previously, Regulation Z prohibited creditors from extending higher-priced mortgage loans without regard for the consumer’s ability to repay. The Ability to Pay Rules extend application of this requirement to all loans secured by dwellings, not just higher-priced mortgages.
As defined by the CFPB, a Qualified Mortgage is a mortgage that meets the following standards prohibiting or limiting certain high risk product and features:
| (1) | No excessive upfront points and fees—generally points and fees paid by the borrower must not exceed 3% of the total amount borrowed; |
| (2) | No toxic loan features—prohibited features are: interest only-loans, negative-amortization loans, terms beyond 30 years and balloon loans; and |
| (3) | Limited on debt-to-income ratios—borrowers’ total debt-to-income ratios must be no higher than 43%. |
In October 2014, the CFPB published a final rule that allows lenders to cure loans that do not meet the “points and fees” test under the Qualified Mortgage definition, but that otherwise satisfy the requirements of a Qualified Mortgage. Pursuant to the final rule, lenders will be able to “cure” loans for which the points and fees exceed the 3% cap for Qualified Mortgages by refunding the points and fees that exceed the 3% cap, with interest within 210 days after closing of the loan. The cure mechanism is available for loans closed on or after November 3, 2014 and before January 10, 2021.
Lenders that generate Qualified Mortgage loans will receive specific protections against borrower lawsuits that could result from failing to satisfy the Ability to Pay Rules. There are two levels of liability protections for Qualified Mortgages: the Safe Harbor protection and the Rebuttable Presumption protection. Safe Harbor Qualified Mortgages are lower-priced loans with interest rates closer to the prime rate, issued to borrowers with high credit scores. Borrowers suing lenders under Safe Harbor Qualified Mortgages are faced with overcoming the pre-determined legal conclusion that the lender has satisfied the Ability to Pay Rules. Rebuttable Presumption Qualified Mortgages are loans at higher prices that are granted to borrowers with lower credit scores. Lenders generating Rebuttable Presumption Qualified Mortgages receive the protection of a presumption that they have legally satisfied the Ability to Pay Rules while the borrower can rebut that presumption by proving that the lender did not consider the borrower’s living expenses after their mortgage and other debts. In addition, Qualified Mortgages are exempt from the new appraisal requirement rules described below under “Appraisal Rules.”
As a result of these final rules, beginning in January 2014, we only originate mortgage loans that meet the requirements of a “qualified mortgage” except we may continue to originate interest-only loans, subject to our compliance with the ability to repay provisions of the rule.
Mortgage Servicing Rules. The CFPB also issued final rules concerning mortgage servicing standards, referred to as the “Mortgage Servicing Rules,” which amend both Regulation X and Regulation Z. The Regulation X rule requires servicers to provide certain information to borrowers, to provide protections to such borrowers in connection with force-placed insurance, to establish policies and procedures to achieve certain delineated objectives, to correct errors asserted by borrowers, and to evaluate borrowers’ applications for available loss mitigation options. The Regulation Z rule requires creditors, assignees and servicers to provide interest rate adjustment notices for adjustable-rate mortgages, periodic statements for residential mortgage loans, prompt crediting of mortgage payments, and responses to requests for payoff amounts.
42
Table of Contents
In November 2014, the CFPB published proposed amendments to the Mortgage Servicing Rules, which would further amend both Regulation X and Regulation Z. The proposed rule would, among other things, require servicers to provide certain borrowers with foreclosure protections more than once over the life of the loan, expand consumer protections to surviving family members and other homeowners, require servicers to notify borrowers when loss mitigation applications are complete, clarify when a borrower becomes delinquent and provide more information to borrowers in bankruptcy.
Loan Originator Qualification and Compensation Rule. The CFPB also issued a final rule implementing requirements and restrictions imposed by the Reform Act concerning, among other things, qualifications of individual loan originators and the compensation practices with respect to such persons. The rule prohibits loan origination organizations from basing compensation for themselves or individual loan originators on any of the origination transaction’s terms or conditions and prohibits such persons from receiving compensation from another person in connection with the same transaction. The rule also imposes duties on loan originator organizations to ensure that their individual loan originators meet certain licensing or qualification standards and extends existing recordkeeping requirements.
Enforcement. The CFPB has exclusive examination and primary enforcement authority with respect to compliance with federal consumer financial protection laws and regulations by institutions under its supervision and is authorized, individually or jointly with the Agencies, to conduct investigations to determine whether any person is, or has, engaged in conduct that violates such laws or regulations. The CFPB may bring an administrative enforcement proceeding or civil action in Federal district court. In addition, in accordance with a memorandum of understanding entered into between the CFPB and the Department of Justice (“DOJ”), the two agencies have agreed to coordinate efforts related to enforcing the fair lending laws, which includes information sharing and conducting joint investigations. As an independent bureau within the FRB, the CFPB may impose requirements more severe than the previous bank regulatory agencies.
Insurance Activities. Hudson City Savings is generally permitted to engage in certain activities through its subsidiaries. However, the federal banking agencies have adopted regulations prohibiting depository institutions from conditioning the extension of credit to individuals upon either the purchase of an insurance product or annuity or an agreement by the consumer not to purchase an insurance product or annuity from an entity that is not affiliated with the depository institution. The regulations also require prior disclosure of this prohibition to potential insurance product or annuity customers.
Deposit Insurance. Hudson City Savings is a member of the DIF and pays its deposit insurance assessments to the DIF.
Under the Federal Deposit Insurance Act, as amended (“FDIA”), the FDIC may terminate the insurance of an institution’s deposits upon a finding that the institution has engaged in unsafe or unsound practices, is in an unsafe or unsound condition to continue operations or has violated any applicable law, regulation, rule, order or condition imposed by the FDIC. The management of Hudson City Savings does not know of any practice, condition or violation that might lead to termination of deposit insurance.
In determining the deposit insurance assessment to be paid by large insured depository institutions,
43
Table of Contents
generally defined as those with at least $10 billion in total assets, such as Hudson City Savings, the FDIC combines CAMELS ratings and financial measures into two scorecards to calculate assessment rates, one for most large insured depository institutions and another for highly complex insured depository institutions (which are generally those with more than $50 billion in total assets that are controlled by a parent company with more than $500 billion in total assets). Each scorecard has two components—a performance score and loss severity score, which are combined and converted to an initial assessment rate. The FDIC has the ability to adjust a large or highly complex insured depository institution’s total score by a maximum of 15 points, up or down, based upon significant risk factors that are not captured by the scorecard. Under the current assessment rate schedule, the initial base assessment rate for large and highly complex insured depository institutions ranges from five to 35 basis points, and the total base assessment rate, after applying the unsecured debt and brokered deposit adjustments, ranges from two and one-half to 45 basis points.
The FDIC also annually establishes a designated reserve ratio (“DRR”) of estimated insured deposits. The DRR will remain at 2.00% for 2015, which is the same ratio that has been in effect since January 1, 2011. The FDIC is authorized to change deposit insurance assessment rates as necessary, to maintain the DRR, without further notice-and-comment rulemaking, provided that: (i) no such adjustment can be greater than three basis points from one quarter to the next, (ii) adjustments cannot result in rates more than three basis points above or below the base rates and (iii) rates cannot be negative.
As a result of the failures of a number of banks and thrifts, during the financial crisis, there was a significant increase in the loss provisions of the DIF. This resulted in a decline in the DIF reserve ratio during 2008 below the then minimum DRR of 1.15%. As a result, the FDIC was required to establish a restoration plan to restore the reserve ratio to 1.15% within a period of eight years.
The Reform Act gave the FDIC much greater discretion to manage the DIF, including where to set the DRR. Among other things, the Reform Act (i) raises the minimum reserve, which the FDIC is required to set each year, to 1.35% (from the former minimum of 1.15%) and removed the upper limit on the reserve ratio (which was formerly capped at 1.5%); (ii) requires that the fund reserve ratio reach 1.35% by September 30, 2020; and (iii) requires that the FDIC offset the effect of requiring the reserve ratio to reach 1.35% on insured depository institutions with total consolidated assets of less than $10 billion, so that more of the cost of raising the reserve ratio will be borne by the institutions with more than $10 billion in assets, such as Hudson City Savings. In October 2010, the FDIC adopted a restoration plan to ensure that the DIF reserve ratio reaches 1.35% by September 30, 2020, as required by the Reform Act. The FDIC is expected to pursue further rulemaking regarding the method that will be used to reach the reserve ratio of 1.35% so that more of the cost of raising the reserve ratio to 1.35% will be borne by institutions with more than $10 billion in assets.
For 2014, Hudson City Savings had an assessment rate of approximately 13.83 basis points resulting in a deposit insurance assessment of $47.7 million. The deposit insurance assessment rates are in addition to the FICO payments. Total expense for 2014, including the FICO assessment, was $49.8 million.
The FDIC deposit insurance assessments are in addition to the assessments for payments on the bonds issued in the late 1980s by the Financing Corporation to recapitalize the now defunct Federal Savings and Loan Insurance Corporation. The Financing Corporation payments will continue until the bonds mature in 2017 through 2019. Our expense for these payments totaled $2.1 million in 2014.
Transactions with Affiliates of Hudson City Savings. Hudson City Savings is subject to the affiliate and insider transaction rules set forth in Sections 23A, 23B, 22(g) and 22(h) of the Federal Reserve Act (“FRA”), and Regulation W and Regulation O issued by the FRB. These provisions, among other things, prohibit or limit a savings bank from extending credit to, or entering into certain transactions with, its affiliates (which for Hudson City Savings would include Hudson City Bancorp) and principal shareholders, directors and executive officers. The OCC is authorized to impose additional restriction on transactions with affiliates if necessary to protect the safety and soundness of a savings institution.
44
Table of Contents
In addition, the FRB regulations include additional restrictions on savings banks under Section 11 of HOLA, including provisions prohibiting a savings bank from making a loan to an affiliate that is engaged in non-bank holding company activities and provisions prohibiting a savings association from purchasing or investing in securities issued by an affiliate that is not a subsidiary. FRB regulations also include certain specific exemptions from these prohibitions. The FRB and the OCC require each depository institution that is subject to Sections 23A and 23B of the FRA to implement policies and procedures to ensure compliance with Regulation W regarding transactions with affiliates.
Section 402 of the Sarbanes-Oxley Act of 2002 (“Sarbanes-Oxley”) prohibits the extension of personal loans to directors and executive officers of “issuers” (as defined in Sarbanes-Oxley). The prohibition, however, does not apply to mortgages advanced by an insured depository institution, such as Hudson City Savings, that are subject to the insider lending restrictions of Section 22(h) of the FRA.
The Reform Act imposes further restrictions on transactions with affiliates and extensions of credit to executive officers, director and principal shareholders, by, among other things, expanding covered transactions to include securities lending, repurchase agreement and derivatives activities with affiliates. These changes became effective on July 21, 2012.
Privacy Standards. Hudson City Savings is subject to OCC regulations implementing the privacy protection provisions of the Gramm-Leach-Bliley Act (“Gramm-Leach”). These regulations require Hudson City Savings to disclose its privacy policy, including identifying with whom it shares “non-public personal information,” to customers at the time of establishing the customer relationship and annually thereafter.
The regulations also require Hudson City Savings to provide its customers with initial and annual notices that accurately reflect its privacy policies and practices. In addition, Hudson City Savings is required to provide its customers with the ability to “opt-out” of having Hudson City Savings share their non-public personal information with unaffiliated third parties before they can disclose such information, subject to certain exceptions.
Hudson City Savings is subject to regulatory guidelines establishing standards for safeguarding customer information. These regulations implement certain provisions of Gramm-Leach. The guidelines describe the Agencies’ expectations for the creation, implementation and maintenance of an information security program, which would include administrative, technical and physical safeguards appropriate to the size and complexity of the institution and the nature and scope of its activities. The standards set forth in the guidelines are intended to ensure the security and confidentiality of customer records and information, protect against any anticipated threats or hazards to the security or integrity of such records and protect against unauthorized access to or use of such records or information that could result in substantial harm or inconvenience to any customer.
Community Reinvestment Act. Under the Community Reinvestment Act (“CRA”), as implemented by OCC regulations, any federally chartered savings bank, including Hudson City Savings, has a continuing and affirmative obligation consistent with its safe and sound operation to help meet the credit needs of its entire community, including low and moderate income neighborhoods. The CRA does not establish specific lending requirements or programs for financial institutions nor does it limit an institution’s discretion to develop the types of products and services that it believes are best suited to its particular community. The CRA requires the OCC, in connection with its examination of a federally chartered savings bank, to assess the depository institution’s record of meeting the credit needs of its community and to take such record into account in its evaluation of certain applications by such institution.
Current CRA regulations rate an institution based on its actual performance in meeting community needs. In particular, the evaluation system focuses on three tests:
| • | a lending test, to evaluate the institution’s record of making loans in its service areas; |
45
Table of Contents
| • | an investment test, to evaluate the institution’s record of investing in community development projects, affordable housing, and programs benefiting low or moderate income individuals and businesses; and |
| • | a service test, to evaluate the institution’s delivery of services through its branches, ATMs and other offices. |
The CRA also requires all institutions to make public disclosure of their CRA ratings. Hudson City Savings has received a “satisfactory” rating in its most recent CRA examination. The Agencies adopted regulations implementing the requirement under Gramm-Leach that insured depository institutions publicly disclose certain agreements that are in fulfillment of the CRA. Hudson City Savings has no such agreements in place at this time.
Loans to One Borrower. Under HOLA, savings banks are generally subject to the national bank limits on loans to one borrower. Generally, savings banks may not make a loan or extend credit to a single or related group of borrowers in excess of 15% of the institution’s unimpaired capital and unimpaired surplus. Additional amounts may be loaned, not in excess of 10% of unimpaired capital and unimpaired surplus, if such loans or extensions of credit are secured by readily-marketable collateral. Hudson City Savings is in compliance with applicable loans to one borrower limitations. At December 31, 2014, Hudson City Savings’ largest aggregate amount of loans to one borrower totaled $25.0 million and was secured by a multi-family rental property. This loan was a portion of an $82.0 million syndicated loan. The borrower has no affiliation with Hudson City Savings.
Interagency Guidance on Commercial Real Estate Lending. In December 2006, the Agencies published guidance entitled “Interagency Guidance on Concentrations in Commercial Real Estate Lending, Sound Risk Management Practices,” or the CRE Guidance, to address concentrations of commercial real estate loans in savings associations. The CRE Guidance reinforces and enhances the OCC’s existing regulations and guidelines for real estate lending and loan portfolio management, but does not establish specific commercial real estate lending limits.
In October 2009, the Agencies adopted a policy statement supporting prudent commercial real estate mortgage loan workouts, or the Policy Statement. The Policy Statement provides guidance for examiners, and for financial institutions that are working with commercial real estate mortgage loan borrowers who are experiencing diminished operating cash flows, depreciated collateral values, or prolonged delays in selling or renting commercial properties. The Policy Statement details risk-management practices for loan workouts that support prudent and pragmatic credit and business decision-making within the framework of financial accuracy, transparency, and timely loss recognition. Financial institutions that implement prudent loan workout arrangements after performing comprehensive reviews of borrowers’ financial conditions will not be subject to criticism for engaging in these efforts, even if the restructured loans have weaknesses that result in adverse credit classifications. In addition, performing loans, including those renewed or restructured on reasonable modified terms, made to creditworthy borrowers, will not be subject to adverse classification solely because the value of the underlying collateral declined. The Policy Statement reiterates existing guidance that examiners are expected to take a balanced approach in assessing institutions’ risk-management practices for loan workout activities.
We have evaluated the CRE Guidance and the Policy Statement to determine our compliance and, as necessary, modified our risk management practices, underwriting guidelines and consumer protection standards in connection with the implementation, during 2014, of our commercial real estate lending initiative. See “Lending Activities – Residential Mortgage Lending and Multi-family and Commercial Mortgage Loans” for a discussion of our loan product offerings and related underwriting standards and “Item 7—Management’s Discussion and Analysis—Asset Quality” for information regarding our loan portfolio composition.
46
Table of Contents
Interagency Guidance on Nontraditional Mortgage Product Risks. On October 4, 2006, the Agencies published the Interagency Guidance on Nontraditional Mortgage Product Risks (the “Guidance”). The Guidance describes sound practices for managing risk, as well as marketing, originating and servicing nontraditional mortgage products, which include, among other things, interest only loans. The Guidance sets forth supervisory expectations with respect to loan terms and underwriting standards, portfolio and risk management practices and consumer protection. For example, the Guidance indicates that originating interest only loans with reduced documentation is considered a layering of risk and that institutions are expected to demonstrate mitigating factors to support their underwriting decision and the borrower’s repayment capacity.
On June 29, 2007, the Agencies issued the “Statement on Subprime Mortgage Lending” (the “Statement”) to address the growing concerns facing the sub-prime mortgage market, particularly with respect to rapidly rising sub-prime default rates that may indicate borrowers do not have the ability to repay adjustable-rate sub-prime loans originated by financial institutions. In particular, the Agencies expressed concern in the Statement that current underwriting practices do not take into account that many subprime borrowers are not prepared for “payment shock” and that the current subprime lending practices compound risk for financial institutions. The Statement describes the prudent safety and soundness and consumer protection standards that financial institutions should follow to ensure borrowers obtain loans that they can afford to repay. The Statement also reinforces the April 17, 2007 Interagency Statement on Working with Mortgage Borrowers, in which the Agencies encouraged institutions to work constructively with residential borrowers who are financially unable or reasonably expected to be unable to meet their contractual payment obligations on their home loans.
Prior to January 10, 2014, we purchased and originated reduced documentation loans (including interest-only reduced documentation loans). However, as of January 10, 2014, we no longer purchase or originate such loans. In addition, we do not originate or purchase sub-prime loans, negative amortization loans or option ARM loans. During 2014 and 2013, originations of reduced documentation loans totaled $152.6 million and $780.2 million, respectively, of which all were one-to four-family loans. Included in our loan portfolio at December 31, 2014 are $3.99 billion of amortizing reduced documentation loans and $620.0 million of reduced documentation interest-only loans. See “Residential Mortgage Lending,” and “Item 7 – Management’s Discussion and Analysis – Asset Quality.”
We have evaluated the Guidance and the Statement to determine our compliance and, as necessary, modified our risk management practices, underwriting guidelines and consumer protection standards.
Appraisal Rules. In January 2013, pursuant to the Reform Act, the Agencies issued final rules on appraisal requirements for higher-priced mortgage loans which became effective in January 2014. For mortgage loans with an annual percentage rate the exceeds a certain threshold, the Bank must obtain an appraisal using a licensed or certified appraiser. The appraiser must prepare a written appraisal report based on a physical inspection of the interior of the property. The Bank must also then disclose to applicants information about the purpose of the appraisal and provide them with a free copy of the appraisal report. “Qualified mortgages” are exempt from these appraisal requirements.
Qualified Thrift Lender (“QTL”) Test. The HOLA requires savings associations to meet a Qualified Thrift Lender (the “QTL test”). Under the QTL test, a savings association is required to maintain at least 65% of its “portfolio assets” (total assets less (1) specified liquid assets up to 20% of total assets, (2) intangibles, including goodwill, and (3) the value of property used to conduct business) in certain “qualified thrift investments” (primarily residential mortgages and related investments, including certain mortgage-backed securities, credit card loans, student loans, and small business loans) on a monthly basis during at least 9 out of every 12 months. As of December 31, 2014, Hudson City Savings held 87.2% of its portfolio assets in qualified thrift investments and had more than 75% of its portfolio assets in qualified thrift investments for each of the 12 months ending December 31, 2014. Therefore, Hudson City Savings qualified under the QTL test.
47
Table of Contents
A savings association that fails the QTL test will immediately be prohibited from: (1) making any new investment or engaging in any new activity not permissible for a national bank, (2) paying dividends, unless such payment would be permissible for a national bank, is necessary to meet the obligations of a company that controls the savings association, and is specifically approved by the OCC and the FRB, and (3) establishing any new branch office in a location not permissible for a national bank in the association’s home state. A savings association that fails to meet the QTL test is deemed to have violated the HOLA and may be subject to OCC enforcement action. In addition, if the association does not requalify under the QTL test within three years after failing the test, the association would be prohibited from retaining any investment or engaging in any activity not permissible for a national bank.
Limitation on Capital Distributions. The OCC regulations impose limitations upon certain capital distributions by federal savings banks, such as certain cash dividends, payments to repurchase or otherwise acquire its shares, payments to shareholders of another institution in a cash out merger and other distributions charged against capital.
The OCC regulates all capital distributions by Hudson City Savings directly or indirectly to Hudson City Bancorp, including dividend payments. A federal savings association, such as Hudson City Savings, must file a notice or seek affirmative approval from the OCC at least 30 days prior to each proposed capital distribution. Whether an application is required is based on a number of factors including whether the institution qualifies for expedited treatment under the OCC rules and regulations or if the total amount of all capital distributions (including each proposed capital distribution) for the applicable calendar year exceeds net income for that year to date plus the retained net income for the preceding two years. Currently, Hudson City Savings must seek approval from the OCC for future capital distributions. In addition, as a subsidiary of a savings and loan holding company, Hudson City Savings must receive approval from the FRB before declaring a dividend.
During 2014, we were required to file applications with the OCC and the FRB for proposed capital distributions, all of which were approved. Hudson City Savings paid dividends to Hudson City Bancorp totaling $80.0 million in 2014.
Hudson City Savings may not pay dividends to Hudson City Bancorp if, after paying those dividends, it would fail to meet the required minimum levels under risk-based capital guidelines and the minimum leverage and tangible capital ratio requirements or if the dividend would violate a prohibition contained in any statute, regulation or agreement. Under the FDIA, an insured depository institution such as Hudson City Savings is prohibited from making capital distributions, including the payment of dividends, if, after making such distribution, the institution would become “undercapitalized” (as such term is used in the FDIA). Payment of dividends by Hudson City Savings also may be restricted at any time at the discretion of the OCC if it deems the payment to constitute an unsafe and unsound banking practice.
In addition, Hudson City Savings may not declare or pay cash dividends on or repurchase any of its shares of common stock if the effect thereof would cause shareholders’ equity to be reduced below the amounts required for the liquidation account which was established as a result of Hudson City Savings’ conversion to a stock holding company structure.
Liquidity. Hudson City Savings maintains sufficient liquidity to ensure its safe and sound operation, in accordance with OCC regulations.
Assessments. The OCC charges assessments to recover the cost of examining federal savings banks and their affiliates. We also pay semi-annual assessments for the holding company. We paid a total of $6.8 million in assessments for the year ended December 31, 2014.
Branching. Federally chartered savings banks may branch nationwide to the extent allowed by federal statute.
48
Table of Contents
Anti-Money Laundering and Customer Identification
Hudson City Savings is subject to the Uniting and Strengthening America by Providing Appropriate Tools Required to Intercept and Obstruct Terrorism Act of 2001 (“USA PATRIOT Act”), and its implementing regulations. The USA PATRIOT Act gives the federal government powers to address terrorist threats through enhanced domestic security measures, expanded surveillance powers, increased information sharing, and broadened anti-money laundering requirements. By way of amendments to the Bank Secrecy Act, Title III of the USA PATRIOT Act takes measures intended to encourage information sharing among bank regulatory agencies and law enforcement bodies. Further, certain provisions of Title III impose affirmative obligations on a broad range of financial institutions, including banks, thrifts, brokers, dealers, credit unions, money transfer agents and parties registered under the Commodity Exchange Act.
Title III of the USA PATRIOT Act and the implementing regulations impose the following requirements on financial institutions:
| • | Establishment of anti-money laundering programs. |
| • | Establishment of a program specifying procedures for obtaining identifying information from customers seeking to open new accounts, including verifying the identity of customers within a reasonable period of time. |
| • | Establishment of enhanced due diligence policies, procedures and controls designed to detect and report money-laundering. |
| • | Prohibitions on correspondent accounts for foreign shell banks and compliance with record keeping obligations with respect to correspondent accounts of foreign banks. |
| • | Bank regulators are directed to consider a holding company’s effectiveness in combating money laundering when ruling on Bank Holding Company Act and Bank Merger Act applications. |
Federal Home Loan Bank System
Hudson City Savings is a member of the Federal Home Loan Bank system, which consists of twelve regional Federal Home Loan Banks, each subject to supervision and regulation by the Federal Housing Finance Agency (“FHFA”). The Federal Home Loan Bank provides a central credit facility primarily for member thrift institutions as well as other entities involved in home mortgage lending. It is funded primarily from proceeds derived from the sale of consolidated obligations of Federal Home Loan Banks. It makes loans to members (i.e., advances) in accordance with policies and procedures, including collateral requirements, established by the respective boards of directors of the Federal Home Loan Banks. These policies and procedures are subject to the regulation and oversight of the FHFA. All long-term advances are required to provide funds for residential home financing. The FHFA has also established standards of community or investment service that members must meet to maintain access to such long-term advances.
Hudson City Savings, as a member of the FHLB, is currently required to acquire and hold shares of FHLB Class B stock. The Class B stock has a par value of $100 per share and is redeemable upon five years notice, subject to certain conditions. The Class B stock has two subclasses, one for membership stock purchase requirements and the other for activity-based stock purchase requirements. The minimum stock investment requirement in the FHLB Class B stock is the sum of the membership stock purchase requirement, determined on an annual basis at the end of each calendar year, and the activity-based stock purchase requirement, determined on a daily basis. For Hudson City Savings, the membership stock purchase requirement is 0.2% of the Mortgage-Related Assets, as defined by the FHLB, which consists principally of residential mortgage loans
49
Table of Contents
and mortgage-backed securities, including CMOs and REMICs, held by Hudson City Savings. The activity-based stock purchase requirement for Hudson City Savings is equal to the sum of: (1) 4.5% of outstanding borrowings from the FHLB; (2) 4.5% of the outstanding principal balance of Acquired Member Assets, as defined by the FHLB, and delivery commitments for Acquired Member Assets; (3) a specified dollar amount related to certain off-balance sheet items, which for Hudson City Savings is zero; and (4) a specified percentage ranging from 0 to 5% of the carrying value on the FHLB’s balance sheet of derivative contracts between the FHLB and Hudson City Savings, which for Hudson City Savings is also zero. The FHLB can adjust the specified percentages and dollar amount from time to time within the ranges established by the FHLB capital plan. At December 31, 2014, the amount of FHLB stock held by us satisfies the requirements of the FHLB capital plan.
Federal Reserve System
FRB regulations require federally chartered savings banks to maintain non-interest-earning cash reserves against their transaction accounts (primarily NOW and demand deposit accounts). A reserve of 3% is to be maintained against net transaction accounts between $14.5 million and $103.6 million (subject to adjustment by the FRB) plus a reserve of 10% (subject to adjustment by the FRB) against that portion of total transaction accounts in excess of $103.6 million. The first $14.5 million of otherwise reservable balances (subject to adjustment by the FRB) is exempt from the reserve requirements. Hudson City Savings is in compliance with the foregoing requirements. Because required reserves must be maintained in the form of either vault cash, a non-interest-bearing account at a Federal Reserve Bank or a pass-through account as defined by the FRB, the effect of this reserve requirement is to reduce Hudson City Savings’ interest-earning assets.
Pursuant to the Emergency Economic Stabilization Act of 2008, the Federal Reserve Banks pay interest on depository institutions’ required and excess reserve balances. The interest rate paid on required reserve balances is currently the average target federal funds rate over the reserve maintenance period. The rate on excess balances will be set equal to the lowest Federal Open Market Committee of the FRB target rate in effect during the reserve maintenance period.
Federal Savings and Loan Holding Company Regulation
Hudson City Bancorp is a unitary savings and loan holding company within the meaning of HOLA. As a result of the Reform Act, Hudson City Bancorp is now subject to regulation, examination, supervision and reporting requirements by the FRB. In addition, the FRB has enforcement authority over Hudson City Bancorp and its subsidiaries other than Hudson City Savings Bank. Among other things, this authority permits the FRB to restrict or prohibit activities that are determined to be a serious risk to the subsidiary savings bank.
Restrictions Applicable to New Savings and Loan Holding Companies. Gramm-Leach also restricts the powers of new unitary savings and loan holding companies. Under Gramm-Leach, all unitary savings and loan holding companies formed after May 4, 1999, such as Hudson City Bancorp, are limited to financially related activities permissible for bank holding companies, as defined under Gramm-Leach. Accordingly, Hudson City Bancorp’s activities are restricted to:
| • | furnishing or performing management services for the savings institution subsidiary of such holding company; |
| • | conducting an insurance agency or escrow business; |
50
Table of Contents
| • | holding, managing, or liquidating assets owned or acquired from the savings institution subsidiary of such holding company; |
| • | holding or managing properties used or occupied by the savings institution subsidiary of such holding company; |
| • | acting as trustee under a deed of trust; |
| • | any other activity (i) that the FRB, by regulation, has determined to be permissible for bank holding companies under Section 4(c) of the Bank Holding Company Act of 1956 (the “BHC Act”), unless the FRB, by regulation, prohibits or limits any such activity for savings and loan holding companies, or (ii) which multiple savings and loan holding companies were authorized by regulation to directly engage in on March 5, 1987; |
| • | purchasing, holding, or disposing of stock acquired in connection with a qualified stock issuance if the purchase of such stock by such holding company is approved by the FRB; and |
| • | any activity permissible for financial holding companies under section 4(k) of the BHC Act. |
Activities permissible for financial holding companies under section 4(k) of the BHC Act include:
| • | lending, exchanging, transferring, investing for others, or safeguarding money or securities; |
| • | insurance activities or providing and issuing annuities, and acting as principal, agent, or broker; |
| • | financial, investment, or economic advisory services; |
| • | issuing or selling instruments representing interests in pools of assets that a bank is permitted to hold directly; |
| • | underwriting, dealing in, or making a market in securities; |
| • | activities previously determined by the FRB to be closely related to banking; |
| • | activities that bank holding companies are permitted to engage in outside of the U.S.; and |
| • | portfolio investments made by an insurance company. |
In addition, Hudson City Bancorp cannot be acquired or acquire a company unless the acquirer or target, as applicable, is engaged solely in financial activities.
Restrictions Applicable to All Savings and Loan Holding Companies. Except under limited circumstances, Federal law prohibits a savings and loan holding company, including Hudson City Bancorp, directly or indirectly, from:
| • | acquiring control (as defined under HOLA) of another savings institution (or a holding company parent) without prior FRB approval; |
| • | acquiring, through merger, consolidation, or purchase of assets, another savings institution or a holding company thereof, or acquiring all or substantially all of the assets of such institution (or a holding company) without prior FRB approval; |
51
Table of Contents
| • | acquiring or retaining more than 5% of the voting shares of a non-subsidiary savings association, a non-subsidiary holding company, or a non-subsidiary company engaged in activities other than those permitted by the HOLA; or |
| • | acquiring or retaining control of a depository institution that is not federally insured. |
In evaluating applications by holding companies to acquire savings associations, the FRB must consider the financial and managerial resources and future prospects of the company and institution involved, the effect of the acquisition on the risk to the DIF, the convenience and needs of the community and competitive factors.
A savings and loan holding company may not acquire as a separate subsidiary an insured institution that has a principal office outside of the state where the principal office of its subsidiary institution is located, except:
| • | in the case of certain emergency acquisitions approved by the FDIC; |
| • | if such holding company controls a savings institution subsidiary that operated a home or branch office in such additional state as of March 5, 1987; or |
| • | if the laws of the state in which the savings institution to be acquired is located specifically authorize a savings institution chartered by that state to be acquired by a savings institution chartered by the state where the acquiring savings institution or savings and loan holding company is located or by a holding company that controls such a state chartered association. |
In general, a savings and loan holding company, with the prior approval of the FRB, may engage in all activities that bank holding companies may engage in under any regulation that the FRB has promulgated under Section 4(c) of the BHC Act. Prior approval from the FRB is not required, however, if: (1) the savings and loan holding company received a composite rating of “1” or “2” in its most recent examination, and it is not in troubled condition, and the holding company does not propose to commence the activity by an acquisition of a going concern, or (2) the activity is otherwise permissible under another provision of HOLA, for which prior notice to or approval from the FRB is not required.
Other Holding Company Restrictions. Pursuant to the terms of the Company MOU, we are required to seek approval from the FRB at least 30 days prior to declaring any future cash dividend. Each dividend request submitted to the FRB must evidence our compliance with applicable guidance regarding payment of dividends issued by the FRB. This process enables the FRB to comment on, object to or otherwise prohibit us from paying the proposed dividend. The supervisory guidance issued by the FRB states that we should either eliminate, defer or significantly reduce dividends if (i) our net income available to common shareholders over the past year is insufficient to fully fund a dividend, (ii) our prospective rate of earnings retention is not consistent with our capital needs and our overall current or prospective financial condition or (iii) we will not meet, or are in danger of not meeting, our minimum regulatory capital adequacy ratios.
In accordance with the Reform Act, the Agencies have established consolidated risk-based and leverage capital requirements for insured depository institutions, depository institution holding companies and systemically important nonbank financial companies. As discussed above, the Final Capital Rules, subject all federal savings associations and their FRB regulated holding companies, including Hudson City Savings and Hudson City Bancorp, to a new consolidated regulatory capital framework. As a result, effective January 1, 2015, we became subject to consolidated capital requirements which we have not been subject to previously. In addition, pursuant to the Reform Act, we are required to serve as a source of strength for Hudson City Savings.
52
Table of Contents
In October 2012, the FRB published two final rules that set forth the annual stress testing requirements for certain bank holding companies, state member banks, and savings and loan holding companies to take effect for such companies once subject to the Final Capital Rules. In October 2014, the FRB published a final rule that modified the 2012 rules. Pursuant to the stress test rules, as modified, on an annual basis we must conduct holding company stress tests in January using financial data as of December 31 of the prior year, report the results of the stress test to the FRB on or before July 31, 2016 and publicly disclose a summary of the results of its annual stress test between October 15 and October 31, 2016. Hudson City Bancorp became subject to the Final Capital Rules on January 1, 2015. Accordingly, we must conduct our first annual holding company stress test in January 2016, using financial data as of December 31, 2015, report the results to the FRB on or before July 31, 2016 and publicly disclose a summary of the results between October 15 and October 31, 2016.
Federal Securities Law
Hudson City Bancorp’s securities are registered with the SEC under the Securities Exchange Act of 1934, as amended. As such, Hudson City Bancorp is subject to the information, proxy solicitation, insider trading, and other requirements and restrictions of the Securities Exchange Act of 1934.
Delaware Corporation Law
Hudson City Bancorp is incorporated under the laws of the State of Delaware, and is therefore subject to regulation by the State of Delaware. In addition, the rights of Hudson City Bancorp’s shareholders are governed by the Delaware General Corporation Law.
TAXATION
Federal
General. The following discussion is intended only as a summary and does not purport to be a comprehensive description of the tax rules applicable to Hudson City Savings or Hudson City Bancorp. For federal income tax purposes, Hudson City Bancorp reports its income on the basis of a taxable year ending December 31, using the accrual method of accounting, and is generally subject to federal income taxation in the same manner as other corporations. Hudson City Savings and Hudson City Bancorp constitute an affiliated group of corporations and are therefore eligible to report their income on a consolidated basis. The Company’s tax returns are subject to audit by the Internal Revenue Service for the tax years 2010 through 2014.
Distributions. To the extent that Hudson City Savings makes “non-dividend distributions” to Shareholders, such distributions will be considered to result in distributions from Hudson City Savings’ unrecaptured tax bad debt reserve “base year reserve,” i.e., its reserve as of December 31, 1987, to the extent thereof and then from its supplemental reserve for losses on loans, and an amount based on the amount distributed will be included in Hudson City Savings’ taxable income. Non-dividend distributions include distributions in excess of Hudson City Savings’ current and accumulated earnings and profits, distributions in redemption of stock and distributions in partial or complete liquidation. However, dividends paid out of Hudson City Savings’ current or accumulated earnings and profits, as calculated for federal income tax purposes, will not constitute non-dividend distributions and, therefore, will not be included in Hudson City Savings’ income.
The amount of additional taxable income created from a non-dividend distribution is equal to the lesser of Hudson City Savings’ base year reserve and supplemental reserve for losses on loans or an amount that, when reduced by the tax attributable to the income, is equal to the amount of the distribution. Thus, in certain situations, approximately one and one-half times the non-dividend distribution would be included in gross income for federal income tax purposes, assuming a 35% federal corporate income tax rate. Hudson City Savings does not intend to pay dividends that would result in the recapture of any portion of its bad debt reserve.
53
Table of Contents
Corporate Alternative Minimum Tax. In addition to the regular corporate income tax, corporations generally are subject to an alternative minimum tax, or AMT, in an amount equal to 20% of alternative minimum taxable income, to the extent the AMT exceeds the corporation’s regular income tax. The AMT is available as a credit against future regular income tax. We do not expect to be subject to the AMT.
Elimination of Dividends; Dividends Received Deduction. Hudson City Bancorp may exclude from its income 100% of dividends received from Hudson City Savings because Hudson City Savings is a member of the affiliated group of corporations of which Hudson City Bancorp is the parent.
State
New Jersey State Taxation. Hudson City Savings files New Jersey Corporate Business income tax returns. Generally, the income of savings institutions in New Jersey, which is calculated based on federal taxable income, subject to certain adjustments, is subject to New Jersey tax at a rate of 9.00%. Savings institutions must also calculate, as part of their corporate tax return, an Alternative Minimum Assessment (“AMA”), which for Hudson City Savings is based on New Jersey gross receipts. Hudson City Savings must calculate its corporate business tax and the AMA, then pay the higher amount. In future years, if the corporate business tax is greater than the AMA paid in prior years, Hudson City Savings may apply the prepaid AMA against its corporate business taxes (up to 50% of the corporate business tax, subject to certain limitations). Hudson City Savings is not currently under audit with respect to its New Jersey income tax returns.
Hudson City Bancorp is required to file a New Jersey income tax return and will generally be subject to a state income tax at a 9.00% rate. However, if Hudson City Bancorp meets certain requirements, it may be eligible to elect to be taxed as a New Jersey Investment Company, which would allow it to be taxed at a rate of 3.60%. Further, investment companies are not subject to the AMA. If Hudson City Bancorp does not qualify as an investment company, it would be subject to taxation at the higher of the 9.00% corporate business rate on taxable income or the AMA.
Delaware State Taxation. As a Delaware holding company not earning income in Delaware, Hudson City Bancorp is exempt from Delaware corporate income tax but is required to file annual returns and pay annual fees and a franchise tax to the State of Delaware.
New York State Taxation. New York State imposes an annual franchise tax on banking corporations, based on net income allocable to New York State, at a rate of 7.1%. If, however, the application of an alternative minimum tax (based on taxable assets allocated to New York, “alternative” net income, or a flat minimum fee) results in a greater tax, an alternative minimum tax will be imposed. In addition, New York State imposes a tax surcharge of 17.0% of the New York State Franchise Tax, calculated using an annual franchise tax rate of 9.00% (which represents the 2000 annual franchise tax rate), allocable to business activities carried on in the Metropolitan Commuter Transportation District. These taxes apply to Hudson City Savings. During 2013, the State of New York completed an audit of the Bank’s tax returns for tax years 2006 through 2008.
On March 31, 2014, New York tax legislation was signed into law in connection with the approval of the New York State 2014-2015 budget went into effect on January 1, 2015. Portions of the new legislation will result in significant changes in the method of calculation of income taxes for banks and thrifts operating in New York State, including changes to (1) future period tax rates and (2) rules related to the sourcing of revenue. At this time, we expect the changes to the New York tax code will cause our effective tax rate to increase. The amount of such increase will depend on the amount of revenues that are sourced to New York State under the new legislation, which can be expected to fluctuate over time. The changes in the tax code had an immaterial effect on the carrying value of the Company’s net deferred tax asset at March 31, 2014 (the date the legislation was signed into law).
54
Table of Contents
Connecticut State Taxation. Connecticut imposes an income tax based on net income allocable to the State of Connecticut, at a rate of 7.5%.
New York City Taxation. Hudson City Savings is also subject to the New York City Financial Corporation Tax calculated, subject to a New York City income and expense allocation, on a similar basis as the New York State Franchise Tax. A significant portion of Hudson City Savings’ entire net income is derived from outside the New York City jurisdiction which has the effect of significantly reducing the New York City taxable income of Hudson City Savings. During 2014, the New York City Department of Finance completed an audit of the Bank’s tax returns for tax years 2010 and 2011.
The Merger Agreement may be terminated in accordance with its terms and the Merger may not be completed.
The Merger Agreement is subject to a number of conditions which must be fulfilled in order to complete the Merger. Those conditions include: approval of the Merger Agreement by Hudson City Bancorp stockholders, approval of the issuance of M&T Common Stock in connection with the Merger by M&T shareholders, receipt of requisite regulatory approvals, absence of orders prohibiting completion of the Merger, approval of the shares of M&T Common Stock to be issued to Hudson City stockholders for listing on the NYSE, the continued accuracy of the representations and warranties by both parties and the performance by both parties of their covenants and agreements, and the receipt by both parties of legal opinions from their respective tax counsels. Hudson City Bancorp stockholders have approved the Merger Agreement and M&T’s stockholders have approved the issuance of M&T Common Stock. However, if the remaining conditions to the closing of the Merger are not fulfilled, the Merger may not be completed.
On April 12, 2013, M&T and the Company announced that additional time would be required to obtain a regulatory determination on the applications necessary to complete the proposed Merger. On three occasions, Hudson City Bancorp and M&T have agreed to extend the date after which either party may elect to terminate the Merger Agreement, with the latest extension to April 30, 2015. Each extension was documented with an amendment to the Merger Agreement and the most recent amendment, Amendment No. 3, provides that the Company may terminate the Merger Agreement at any time if it reasonably determines that M&T is unlikely to be able to obtain the requisite regulatory approvals in time to permit the closing to occur on or prior to April 30, 2015. Amendment No. 3, and applicable provisions from the prior amendments, permit the Company to take certain interim actions without the prior approval of M&T, including with respect to our conduct of business, implementation of our strategic plan, retention incentives and certain other matters with respect to our personnel, prior to the completion of the Merger. There can be no assurances that the Merger will be completed by April 30, 2015 or that the Company will not exercise its right to terminate the Merger Agreement in accordance with its terms.
Termination of the Merger Agreement could negatively impact Hudson City.
If the Merger Agreement is terminated, Hudson City Bancorp’s business may be adversely impacted by not having pursued other beneficial opportunities due to the focus of management on the Merger.
As of December 31, 2014, goodwill and other intangible assets amounted to $152.5 million. We performed our annual goodwill impairment analysis as of June 30, 2014 and concluded that the implied fair value of goodwill of the Company exceeded the carrying value of goodwill. If the Merger Agreement is terminated, the market price of Hudson City Bancorp common stock might decline to the extent that the current market price reflects a market assumption that the Merger will be completed. In the event the market price of Hudson City Bancorp common stock does so decline, we may be required to recognize a goodwill impairment charge.
55
Table of Contents
In addition, if the Merger Agreement is terminated and Hudson City Bancorp’s board of directors seeks another merger or business combination, Hudson City Bancorp stockholders cannot be certain that Hudson City Bancorp will be able to find a party willing to offer equivalent or more attractive consideration than the consideration M&T has agreed to provide in the Merger.
Hudson City Bancorp stockholders who make elections to receive cash, stock or mixed consideration in the Merger will be unable to sell their shares in the market pending the Merger.
Hudson City Bancorp stockholders may elect to receive cash, stock or mixed consideration in the Merger by completing an election form that will be provided to stockholders. Elections will require that stockholders making the election turn in their Hudson City Bancorp stock certificates. This means that during the time between when the election is made and the date the Merger is completed, Hudson City Bancorp stockholders will be unable to sell their Hudson City Bancorp common stock. If the election forms are returned by Hudson City Bancorp stockholders and then the Merger is unexpectedly delayed, this period could extend for a significant period of time. Hudson City Bancorp stockholders can shorten the period during which they cannot sell their shares by delivering their election shortly before the election deadline. However, elections received after the election deadline will not be accepted or honored.
Hudson City will be subject to business uncertainties and contractual restrictions while the Merger is pending.
Uncertainty about the effect of the Merger on employees and customers may have an adverse effect on Hudson City. These uncertainties may impair Hudson City’s ability to attract, retain and motivate key personnel until the Merger is completed, and could cause customers and others that deal with Hudson City to seek to change existing business relationships with Hudson City. Retention of certain employees may be challenging during the pendency of the Merger, as certain employees may experience uncertainty about their future roles. If key employees depart because of issues relating to the uncertainty and difficulty of integration or a desire not to remain with the business, Hudson City’s business could be negatively impacted. In addition, the Merger Agreement still restricts Hudson City from making certain acquisitions and taking other specified actions until the Merger occurs without the consent of M&T. These restrictions may prevent Hudson City from pursuing attractive business opportunities that may arise prior to the completion of the Merger.
Successful implementation of our Strategic Plan may be difficult during the pendency of the Merger and we may not be able to fully execute on our new initiatives.
Hudson City has historically been a community and consumer oriented retail savings bank, offering traditional deposit products and focusing on one- to four-family residential mortgages. However, the recent economic downturn made it difficult for us to profitably grow our business in the same manner as in the past. Prior to the announcement of the Merger, we retained an outside consultant to assist management in developing the Strategic Plan. The operational core of the Strategic Plan is the expansion of our loan and deposit product offerings over time to create more balanced sources of revenue and funding and includes initiatives such as secondary mortgage market operations, commercial real estate lending, the introduction of small business banking products and developing a more robust suite of consumer banking products.
In the event the Merger is not completed, our future success will depend on our ability to effectively implement our Strategic Plan. There are risks and uncertainties associated with the implementation and execution of the Strategic Plan initiatives, including the investment of time and resources, the possibility that these initiatives will be unprofitable, and the risk of additional liabilities associated with these initiatives. In addition, our ability to successfully execute on these new initiatives will depend in part on our ability to attract and retain talented
56
Table of Contents
individuals, which may be difficult during the pendency of the Merger, to help manage these new operations. In addition, successful execution of the initiatives will require satisfactory market conditions that will allow us to profitably grow these new businesses. While we expect to incur start up expenses for our prioritized initiatives throughout 2015, we do not expect to realize revenues from these efforts until 2016. Our revenues and operating results may be adversely affected if we experience further delays or we are unable to successfully implement the strategic initiatives set forth in the Strategic Plan.
Future balance sheet restructuring would adversely affect our net income for the period in which we complete the restructuring.
As part of our Strategic Plan, we are continuing to explore ways to reduce our interest rate risk while strengthening our balance sheet, which may include a further restructuring of our balance sheet during 2015. The Company previously completed a series of restructuring transactions in 2011 that reduced higher-cost structured borrowings on the Company’s balance sheet. Management is currently considering a variety of different restructuring alternatives, including whether to restructure all or various portions of our borrowed funds and various alternatives for replacement funding. No decision has been made at this time regarding the timing, structure and scope of any restructuring transaction. Decisions regarding any restructuring transaction are dependent upon, among other things, market interest rates, overall economic conditions and the status of the Merger. In the event the Merger Agreement is terminated, we would expect to proceed soon thereafter to execute the restructuring transaction, if it has not been completed by that time. Similar to the 2011 restructuring transactions, we expect any restructuring to result in a decrease in the size of our balance sheet, a material charge to earnings and a decrease in our regulatory capital ratios, though we also expect an improvement in net interest margin and future earnings prospects.
New and future rulemaking and enforcement initiatives from the CFPB has had, and will continue to have, a material effect on our loan production and on our operations and operating costs.
The CFPB has the authority to implement and enforce a variety of existing consumer protection statutes and to issue new regulations and, with respect to institutions of our size, has exclusive examination and primary enforcement authority with respect to such laws and regulations and is authorized, individually or jointly with the Agencies, to conduct investigations to determine whether any person is, or has, engaged in conduct that violates such laws or regulations. In addition, in accordance with a memorandum of understanding entered into between the CFPB and DOJ, the two agencies have agreed to coordinate efforts related to enforcing the fair lending laws, which includes information sharing and conducting joint investigations.
As an independent bureau within the FRB, the CFPB may impose requirements more severe than the previous bank regulatory agencies. The CFPB has initiated enforcement actions against a variety of bank and non-bank market participants with respect to a number of consumer financial products and services that has resulted in those participants expending significant time, money and resources to adjust to the initiatives being pursued by the CFPB. These enforcement actions may serve as precedent for how the CFPB interprets and enforces consumer protection laws with respect to all supervised institutions, which may result in the imposition of higher standards of compliance with such laws.
Pursuant to the Reform Act, in January 2013, the CFPB issued a series of final rules related to mortgage loan origination and mortgage loan servicing. These final rules went into effect in January 2014 and prohibit creditors, such as Hudson City Savings Bank, from extending mortgage loans secured by a dwelling without regard for the consumer’s ability to repay and establishes certain protections from liability for loans that meet the requirements of a “qualified mortgage.” In addition, these rules add restrictions and requirements to mortgage origination and servicing practices and restrict the application of prepayment penalties and compensation practices relating to mortgage loan underwriting. Compliance with these rules required us to change our underwriting practices and in January 2014 we discontinued our reduced documentation loan program in order to comply with the newly effective CFPB requirements to validate a borrower’s ability to repay and the corresponding safe harbor for qualified mortgages. During 2013, 22% of our total loan production consisted of reduced documentation loans. As a result, these rules adversely affected the volume of mortgage loans that we originated in 2014 and will continue to do so in the future. In addition, these rules may subject the Bank to increased potential liability related to its residential loan origination activities.
57
Table of Contents
The CFPB is authorized, individually or jointly with the Agencies, to conduct investigations to determine whether any person is, or has, engaged in conduct that violates such laws or regulations. In addition, in accordance with a memorandum of understanding entered into between the CFPB and DOJ, the two agencies have agreed to coordinate efforts related to enforcing the fair lending laws, which includes information sharing and conducting joint investigations. As an independent bureau within the FRB, the CFPB may impose requirements more severe than the previous bank regulatory agencies. The CFPB has initiated enforcement actions against a variety of bank and non-bank market participants with respect to a number of consumer financial products and services that has resulted in those participants expending significant time, money and resources to adjust to the initiatives being pursued by the CFPB. In the event we become the subject of CFPB examination criticism or the target of a CFPB enforcement action we may need to spend considerable time, money and resources revising our operations to conform to the requirements of the CFPB.
Multi-family and commercial real estate lending may expose us to increased lending risks.
As part of our Strategic Plan, in 2014, we commenced the purchase of commercial real estate loans and interests in such loans. At December 31, 2014, our portfolio of multi-family and commercial real estate loans totaled $102.3 million. We intend to continue to build our commercial real estate lending portfolio, consistent with our Strategic Plan. Multi-family and commercial real estate mortgage loans generally involve a greater degree of credit risk than residential mortgage loans because they typically have larger balances than residential mortgage loans and other consumer loans and are more affected by adverse conditions in the economy. Additionally, such loans typically involve larger loan balances to single borrowers or groups of related borrowers compared to one- to four- family residential mortgage loans. Because payments on loans secured by multi-family properties and commercial real estate often depend upon the successful operation and management of the properties and the businesses which operate from within them, repayment of such loans may be affected by factors outside the borrower’s control, such as adverse conditions in the real estate market or the economy or changes in government regulation. In light of the planned future growth of these portfolios, we have implemented enhanced risk management policies, procedures and controls. Our failure to adequately implement enhanced risk management policies, procedures and controls could result in an increased rate of delinquencies, increased losses from these portfolios and adversely affect our ability to increase our multi-family and commercial real estate loan portfolio going forward.
To the extent we originate multi-family and commercial real estate mortgage loans in areas other than the New York metropolitan area, we could be subject to additional risks with respect to multi-family and commercial real estate mortgage lending in those areas since we have less direct oversight of the local market and the borrowers’ operations.
New lines of business or new products and services may subject us to additional risks. A failure to successfully manage these risks may have a material adverse effect on our business.
From time to time and in accordance with our Strategic Plan, we plan to implement new lines of business and offer new products and services within existing lines of business. There are substantial risks and uncertainties associated with these efforts. In developing and marketing new lines of business and/or new products and services, we will invest significant time and resources. Initial timetables for the introduction and development of new lines of business and/or new products or services may not be achieved and price and profitability targets may not prove feasible. External factors, such as compliance with regulations, competitive alternatives, and shifting market preferences, may also impact the successful implementation of a new line of business or a new product or service. Furthermore, any new line of business and/or new product or service could have a significant impact on the effectiveness of our system of internal controls. Failure to successfully manage these risks in the development and implementation of new lines of business or new products or services could have a material adverse effect on our business, results of operations and financial condition.
58
Table of Contents
Our net interest margin may contract further in the current interest rate environment and changes in interest rates could adversely affect our results of operations and financial condition.
The current protracted low interest rate environment has resulted in a continued trend of net interest margin compression. During this period of low market interest rates, elevated levels of prepayments and refinancings have resulted in a decrease in the yields earned on our interest-earning assets while our interest-bearing liabilities are repricing at a slower rate and include borrowings that are not expected to reprice in the near-term. In addition, we have maintained elevated levels of short-term liquid assets due primarily to the reinvestment of cash flows from repayments and sales of mortgage-related assets reflecting our low appetite for adding long term mortgage assets to our balance sheet in the current low interest rate environment. As a result, we experienced declines in net interest income in each quarter of 2014. We expect net interest income to continue to decline in the current environment.
The Federal Open Market Committee of the Board of Governors of the Federal Reserve System (the “FOMC”) noted that economic activity has improved in recent months. The FOMC noted that labor market indicators were mixed but on balance showed further improvement. However, the unemployment rate was little changed during the fourth quarter and a range of labor market indicators suggests that there remains significant underutilization of labor resources. Household spending appears to be rising moderately and business fixed investment is advancing, while the recovery in the housing sector slowed somewhat. The national unemployment rate decreased to 5.6% in December 2014 from 6.7% in December 2013 and from 5.9% in September 2014. The FOMC decided to maintain the overnight lending target rate at zero to 0.25% during the fourth quarter of 2014.
The FOMC is maintaining its existing policy of reinvesting principal payments from its holdings of agency debt and agency mortgage-backed securities in agency mortgage-backed securities and of rolling over maturing Treasury securities at auction. The FOMC believes this policy of keeping holdings of longer-term securities at sizable levels should help maintain accommodative financial conditions.
We expect that the actions of the FOMC will place additional downward pressure on our net interest margin as our interest-earning assets continue to re-price to lower levels, primarily as a result of elevated levels of prepayments, and as we continue to experience a lack of attractive reinvestment opportunities due to low market interest rates.
We are required to comply with the terms of the Company MOU that we have entered into with the FRB, and lack of compliance could result in additional regulatory enforcement actions.
The Company entered into the Company MOU with the FRB on April 24, 2012 which is substantially similar to and replaced the MOU the Company entered into with our former regulator, the OTS, on June 24, 2011. In accordance with the Company MOU, the Company is required to: (a) obtain written approval from the FRB prior to receiving a capital distribution from the Bank or declaring a dividend to
59
Table of Contents
shareholders and (b) obtain approval from the FRB prior to repurchasing or redeeming any Company stock or incurring any debt with a maturity of greater than one year. Under the Company MOU the Company was required to submit a comprehensive Capital Plan and a comprehensive Earnings Plan to the FRB. The Company MOU was entered into following the Bank’s entry into the Bank MOU. The Bank MOU was terminated by the OCC on February 26, 2015.
While the Company believes it is in compliance in all material respects with the terms of the Company MOU, a finding by the FRB that the Company failed to comply with the Company MOU could result in additional regulatory scrutiny, constraints on our business, or formal enforcement action. Any of those events could have a material adverse effect on our future operations, financial condition, growth or other aspects of our business.
As a result of the Reform Act and recent rulemaking, we will become subject to more stringent capital requirements.
Pursuant to the Reform Act, in July 2013, the Agencies adopted the Final Rules to update the Agencies’ general risk-based capital and leverage capital requirements to incorporate agreements reflected in Basel III as well as the requirements of the Reform Act. Among other things, the Final Capital Rules establish a new minimum common equity Tier 1 risk-based capital ratio of 4.5% and increase the minimum Tier 1 risk-based capital ratio from 4.0% to 6.0%. In addition, the Final Capital Rules add a requirement to maintain a minimum Conservation Buffer, composed of common equity Tier 1 capital, of 2.5% of risk-weighted assets and provide that the failure to maintain the Conservation Buffer will result in restrictions on capital distributions and discretionary cash bonus payments to executive officers. The Final Capital Rules also subjected many savings and loan holding companies, such as Hudson City Bancorp, to consolidated capital requirements. The Final Capital Rules are described in more detail in “Regulation of Hudson City Savings Bank and Hudson City Bancorp” above.
The new minimum regulatory capital ratios under the Final Capital Rules became effective for Hudson City Bancorp and Hudson City Savings on January 1, 2015. The failure to meet the established capital requirements could result in the Agencies placing limitations or conditions on our activities or restricting the commencement of new activities, and such failure could subject us to a variety of enforcement remedies available to the federal regulatory authorities, including limiting our ability to pay dividends; issuing a directive to increase our capital; and terminating our FDIC deposit insurance.
We are subject to regulatory requirements and limitations that may impact our ability to pay future dividends.
We are a unitary savings and loan association holding company regulated by the FRB and almost all of our operating assets are owned by Hudson City Savings Bank. We rely primarily on dividends from the Bank to pay cash dividends to our shareholders and to engage in share repurchase programs. The OCC regulates all capital distributions by the Bank directly or indirectly to us, including dividend payments. As the subsidiary of a savings and loan association holding company, the Bank must file a notice or seek affirmative approval from the OCC at least 30 days prior to each proposed capital distribution. Whether an application is required is based on a number of factors including whether the institution qualifies for expedited treatment under the OCC rules and regulations or if the total amount of all capital distributions (including each proposed capital distribution) for the applicable calendar year exceeds net income for that year to date plus the retained net income for the preceding two years. Currently, Hudson City Savings must seek approval from the OCC for future capital distributions. In addition, as the subsidiary of a savings and loan holding company, Hudson City Savings must also seek approval from the FRB before declaring a dividend.
In addition, the Bank may not pay dividends to us if, after paying those dividends, it would fail to meet the required minimum levels under risk-based capital guidelines and the minimum leverage and tangible capital ratio requirements or the OCC has notified the Bank that it is in need of more than normal supervision. Under the prompt corrective action provisions of the FDIA, an insured depository institution such as the Bank is prohibited from making a capital distribution, including the payment of dividends, if, after making such distribution, the institution would become “undercapitalized” (as such term is used in the FDIA). Payment of dividends
60
Table of Contents
by the Bank also may be restricted at any time at the discretion of the appropriate regulator if it deems the payment to constitute an unsafe or unsound banking practice. Accordingly, there can be no assurance that the Bank will be able to pay dividends at past levels, or at all, in the future.
In addition to regulatory restrictions on the payment of dividends, the Bank is subject to certain restrictions imposed by federal law on any extensions of credit it makes to its affiliates and on investments in stock or other securities of its affiliates. We are considered an affiliate of the Bank. These restrictions prevent affiliates of the Bank, including us, from borrowing from the Bank, unless various types of collateral secure the loans. Federal law limits the aggregate amount of loans to and investments in any single affiliate to 10% of the Bank’s capital stock and surplus and also limits the aggregate amount of loans to and investments in all affiliates to 20% of the Bank’s capital stock and surplus.
If we do not receive sufficient cash dividends or are unable to borrow from the Bank, then we may not have sufficient funds to pay dividends or repurchase our common stock.
Pursuant to the terms of the Company MOU, we are required to seek approval from the FRB at least 30 days prior to declaring any future cash dividend. Each dividend request submitted to the FRB must evidence our compliance with applicable guidance regarding payment of dividends issued by the FRB. This process will enable the FRB to comment on, object to or otherwise prohibit us from paying the proposed dividend. The supervisory guidance issued by the FRB states that we should either eliminate, defer or significantly reduce dividends if (i) our net income available to common shareholders over the past year is insufficient to fully fund a dividend, (ii) our prospective rate of earnings retention is not consistent with our capital needs and our overall current or prospective financial condition or (iii) we will not meet, or are in danger of not meeting, our minimum regulatory capital adequacy ratios.
The geographic concentration of our loan portfolio and lending activities makes us vulnerable to a downturn in the economy.
Originating loans secured by residential real estate is our primary business. Our financial results may be adversely affected by changes in prevailing economic conditions, either nationally or in our local New Jersey and metropolitan New York market areas, including the level of short-term and long-term interest rates, decreases in real estate values, adverse employment conditions, the monetary and fiscal policies of the federal and state government, the strength of the economy in the United States generally and in the Company’s market area in particular, and other significant external events. As a result of our lending practices, we have a concentration of loans secured by real property located primarily in New Jersey, New York and Connecticut. At December 31, 2014, approximately 98.6% of our total loans are residential first mortgage loans and approximately 84.8% of our total loans are in the New York metropolitan area.
The value of real estate used as collateral for our loans could result in higher loss experience on our non-performing loans. Adverse changes in the economy, particularly in employment conditions, may also have a negative effect on the ability of our borrowers to make timely repayments of their loans, which would have an adverse impact on our earnings. As a result of the concentration of loans in the New York metropolitan area, a downturn in the local economy could result in an increase in nonperforming loans, which would negatively affect the Company’s interest income and result in higher provisions for loan losses, which would hurt the Company’s earnings. If poor economic conditions result in decreased demand for real estate loans, our profits may decrease because our investment alternatives may earn less income for us than real estate loans.
61
Table of Contents
Non-performing assets take significant time to resolve and adversely affect the Company’s results of operations and financial condition.
Non-performing assets adversely affect the Company’s net earnings in various ways. The Company generally does not record interest income on non-performing loans or other real estate owned, thereby reducing its earnings, while its loan administration costs are higher for non-performing loans. When the Company takes collateral in foreclosures and similar proceedings, the Company is required to mark the related asset to the lower of the fair value of the collateral at the carrying amount of the loan, which may ultimately result in a loss. Until the recent recessionary cycle, it was our experience that as a non-performing loan approached foreclosure, the borrower sold the underlying property or, if there was a second mortgage or other subordinated lien, the subordinated lien holder would purchase the property to protect their interest thereby resulting in the full payment of principal and interest to Hudson City Savings. This process normally took approximately 12 months. However, due to the unprecedented level of foreclosures and the desire by many states to slow the foreclosure process, we are now experiencing a time frame to repayment or foreclosure of up to 48 months from the initial non-performing period. Given the delays in foreclosures in our market area, the level of our non-performing assets is expected to remain at elevated levels. At December 31, 2014 our non-performing loans amounted to $852.0 million or 3.95% of total loans as compared to $1.05 billion or 4.35% of total loans at December 31, 2013 and our charge-offs, net of recoveries, amounted to $37.3 million for 2014 as compared to $62.8 million in 2013. There can be no assurance that the Company will not experience future increases in non-performing assets.
We operate in a highly regulated industry, which limits the manner and scope of our business activities.
We are subject to extensive supervision, regulation and examination by the FRB, the OCC, the CFPB and the FDIC. As a result, we are limited in the manner in which we conduct our business, undertake new investments and activities and obtain financing. This regulatory structure is designed primarily for the protection of the deposit insurance funds and our depositors, as well as other consumers, and not to benefit our shareholders. This regulatory structure also gives the regulatory authorities extensive discretion in connection with their supervisory and enforcement activities and examination policies, including policies with respect to capital levels, the timing and amount of dividend payments, the classification of assets and the establishment of adequate loan loss reserves for regulatory purposes. In addition, we must comply with significant anti-money laundering and anti-terrorism laws, fair lending and consumer protection laws and the Community Reinvestment Act. As a result of the recent financial crisis which occurred in the banking and financial markets, the overall bank regulatory climate is now marked by caution, conservatism and a renewed focus on compliance and risk management.
Our failure to comply with applicable regulations, or the failure to develop, implement and comply with corrective action plans to address any identified areas of noncompliance, may result in the assessment of fines and penalties and the commencement of informal or formal regulatory enforcement actions against us. Other negative consequences also can result from such failure, including regulatory restrictions on our activities, reputational damage, restrictions on the ability of institutional investment managers to invest in our securities and increases in our costs of doing business. Increases in our costs of doing business may include increased salaries and benefits expenses associated with hiring additional employees, incurring fees and expenses for outside services, such as consulting and legal advice, and costs associated with enhancing, or acquiring systems and technological infrastructure to strengthen our regulatory compliance program. The occurrence of one or more of these events may have a material adverse effect on our business, financial condition or results of operations.
62
Table of Contents
The occurrence of any failure, breach, or interruption in service involving our systems or those of our service providers, including as a result of a cyberattack, could damage our reputation, cause losses, increase our expenses, and result in a loss of customers, an increase in regulatory scrutiny, or expose us to civil litigation and possibly financial liability, any of which could adversely impact our financial condition, results of operations, and the market price of our stock.
Communications and information systems are essential to the conduct of our business, as we use such systems to manage our customer relationships, our general ledger, our deposits and our loans. In the normal course of our business, we collect, process, retain and transmit (by email and other electronic means) sensitive and confidential information regarding our customers, employees and others. We also outsource certain aspects of our data processing to certain third party providers. In addition to confidential information regarding our customers, employees and others, we, and in some cases a third party, compile, process, transmit and store proprietary, non-public information concerning our business, operations, plans and strategies.
As a result, our business and operations depend on the secure processing, storage, and transmission of confidential and other information in our computer systems and networks and those of our third party service providers. Although we devote significant resources and management focus to ensuring the integrity of our systems through information security measures and business continuity programs, our facilities, computer systems, software, and networks, and those of our third party service providers, may be vulnerable to external or internal security breaches, acts of vandalism, unauthorized access, misuse, computer viruses or other malicious code and cyberattacks that could have a security impact. In addition, breaches of security may occur through intentional or unintentional acts by those having authorized or unauthorized access to our confidential or other information or the confidential or other information of our customers, clients or counterparties. While we regularly conduct security assessments on our third party service providers, there can be no assurance that their information security protocols are sufficient to withstand a cyberattack or other security breach.
Information security risks for financial institutions like us have increased recently in part because of new technologies, the use of the Internet and telecommunications technologies (including mobile devices) to conduct financial and other business transactions and the increased sophistication and activities of organized crime, perpetrators of fraud, hackers, terrorists and others. In addition to cyber-attacks or other security breaches involving the theft of sensitive and confidential information, hackers recently have engaged in attacks against large financial institutions, particularly denial of service attacks that are designed to disrupt key business services, such as customer-facing web sites. We are not able to anticipate or implement effective preventive measures against all security breaches of these types, especially because the techniques used change frequently and because attacks can originate from a wide variety of sources.
We use a variety of physical, procedural and technological safeguards to prevent or limit the impact of systems failures, interruptions and security breaches to protect confidential information from mishandling, misuse or loss, including detection and response mechanisms designed to contain and mitigate security incidents. However, there can be no assurance that such events will not occur or that they will be promptly detected and adequately addressed if they do and early detection of security breaches may be thwarted by sophisticated attacks and malware designed to avoid detection. If there is a failure in or breach of our computer systems or networks, or those of a third party service provider, the confidential and other information processed and stored in, and transmitted through, such computer systems and networks could potentially be jeopardized, or could otherwise cause interruptions or malfunctions in our operations or the operations of our customers, clients or counterparties.
The occurrence of any of the foregoing could subject us to litigation or regulatory scrutiny, cause us significant reputational damage or erode confidence in the security of our systems, products and services, cause us to lose customers or have greater difficulty in attracting new customers, have an adverse effect on the value of our common stock or subject us to financial losses that are either not insured or not fully covered by insurance, any of which could have a material adverse effect on our business, financial condition or results of operations.
63
Table of Contents
Furthermore, as information security risks and cyber threats continue to evolve, we may be required to expend significant additional resources to further enhance or modify our information security measures and/or to investigate and remediate any information security vulnerabilities or other exposures arising from operational and security risks.
Item 1B. Unresolved Staff Comments
None.
During 2014, we conducted our business through our two owned executive office buildings located in Paramus, New Jersey, our leased office space in Paramus, New Jersey, our leased operations center located in Glen Rock, New Jersey, and 135 branch offices. At December 31, 2014, we owned 37 of our locations and leased the remaining 98. Our lease arrangements are typically long-term arrangements with third parties that generally contain several options to renew at the expiration date of the lease.
For additional information regarding our lease obligations, see Note 7 of Notes to Consolidated Financial Statements in Item 8 “Financial Statements and Supplementary Data.”
Except as described below, we are not involved in any pending legal proceedings other than routine legal proceedings occurring in the ordinary course of business. We believe that these routine legal proceedings, in the aggregate, are immaterial to our financial condition and results of operations.
Since the announcement of the Merger, eighteen putative class action complaints have been filed in the Court of Chancery, Delaware against Hudson City Bancorp, its directors, M&T, and WTC challenging the Merger. Six putative class actions challenging the Merger have also been filed in the Superior Court for Bergen County, Chancery Division, of New Jersey (the “New Jersey Court”). The lawsuits generally allege, among other things, that the Hudson City Bancorp directors breached their fiduciary duties to Hudson City Bancorp’s public shareholders by approving the Merger at an unfair price, that the Merger was the product of a flawed sales process, and that Hudson City Bancorp and M&T filed a misleading and incomplete Form S-4 with the SEC in connection with the proposed transaction. All 24 lawsuits seek, among other things, to enjoin completion of the Merger and an award of costs and attorneys’ fees. Certain of the actions also seek an accounting of damages sustained as a result of the alleged breaches of fiduciary duty and punitive damages.
On April 12, 2013, the defendants entered into a memorandum of understanding (the “MOU”) with the plaintiffs regarding the settlement of all of the actions described above (collectively, the “Actions”).
Under the terms of the MOU, Hudson City Bancorp, M&T, the other named defendants, and all the plaintiffs have reached an agreement in principle to settle the Actions and release the defendants from all claims relating to the Merger, subject to approval of the New Jersey Court. Pursuant to the MOU, Hudson City Bancorp and M&T agreed to make available additional information to Hudson City Bancorp shareholders. The additional information was contained in a Supplement to the Joint Proxy Statement filed with the SEC as an exhibit to a Current Report on Form 8-K dated April 12, 2013. In addition, under the terms of the MOU, plaintiffs’ counsel also has reserved the right to seek an award of attorneys’ fees and expenses. If the New Jersey Court approves the settlement contemplated by the MOU, the Actions will be dismissed with prejudice. The settlement will not affect the Merger consideration to be paid to Hudson City Bancorp’s shareholders in connection with the proposed Merger. In the event the New Jersey Court approves an award of attorneys’ fees and expenses in connection with the settlement, such fees and expenses shall be paid by Hudson City Bancorp, its successor in interest, or its insurers.
64
Table of Contents
Hudson City Bancorp, M&T, and the other defendants deny all of the allegations in the Actions and believe the disclosures in the Joint Proxy Statement are adequate under the law. Nevertheless, Hudson City Bancorp, M&T, and the other defendants have agreed to settle the Actions in order to avoid the costs, disruption, and distraction of further litigation.
Item 4. Mine Safety Disclosures
Not applicable
Item 5. Market for Registrant’s Common Equity, Related Stockholder Matters and Issuer Purchases of Equity Securities
Hudson City Bancorp common stock is traded on the Nasdaq Global Select Market under the symbol “HCBK.” The table below shows the reported high and low sales prices of the common stock during the periods indicated.
| Sales Price | Dividend Information | |||||||||||||
| High | Low | Amount Per Share |
Date of Payment | |||||||||||
| 2013 |
||||||||||||||
| First quarter |
8.79 | 7.67 | 0.080 | February 28, 2013 | ||||||||||
| Second quarter |
9.20 | 7.89 | 0.040 | May 30, 2013 | ||||||||||
| Third quarter |
9.79 | 8.89 | 0.040 | August 30, 2013 | ||||||||||
| Fourth quarter |
9.50 | 8.85 | 0.040 | November 29, 2013 | ||||||||||
| 2014 |
||||||||||||||
| First quarter |
9.98 | 8.81 | 0.040 | March 3, 2014 | ||||||||||
| Second quarter |
10.16 | 9.44 | 0.040 | May 30, 2014 | ||||||||||
| Third quarter |
10.35 | 9.46 | 0.040 | August 29, 2014 | ||||||||||
| Fourth quarter |
10.30 | 8.53 | 0.040 | November 26, 2014 | ||||||||||
On January 28, 2015, the Board of Directors of Hudson City Bancorp declared a quarterly cash dividend of $0.04 per common share outstanding that is payable on March 2, 2015 to shareholders of record as of the close of business on February 13, 2015. The Board of Directors intends to review the payment of dividends quarterly and plans to continue to maintain a regular quarterly dividend in the future, dependent upon our earnings, financial condition and other relevant factors.
As the principal asset of Hudson City Bancorp, Hudson City Savings provides the principal source of funds for the payment of dividends by Hudson City Bancorp. Hudson City Savings is subject to certain restrictions that may limit its ability to pay dividends. See “Item 1 – Business—Regulation of Hudson City Savings Bank and Hudson City Bancorp – Federally Chartered Savings Bank Regulation – Limitation on Capital Distributions.”
65
Table of Contents
Pursuant to the terms of the Company MOU, we are required to seek approval from the FRB at least 30 days prior to declaring any future cash dividend. Each dividend request submitted to the FRB must evidence our compliance with applicable guidance regarding payment of dividends issued by the FRB. See “Item 7 – Management’s Discussion and Analysis – Liquidity and Capital Resources”; Note 15 of Notes to Consolidated Financial Statements in Item 8 “Financial Statements and Supplementary Data”; and “Item 1 – Business—Regulation of Hudson City Savings Bank and Hudson City Bancorp – Federal Savings and Loan Holding Company Regulation – Other Holding Company Restrictions.”
As of February 19, 2015, there were approximately 22,555 holders of record of Hudson City Bancorp common stock.
The following table reports information regarding repurchases of our common stock during each month of the fourth quarter of 2014 under the stock repurchase plans approved by our Board of Directors.
| Period |
Total Number of Shares Purchased |
Average Price Paid per Share |
Total Number of Shares Purchased as Part of Publicly Announced Plans or Programs |
Maximum Number of Shares that May Yet Be Purchased Under the Plans or Programs (1) |
||||||||||||
| October 1-October 31, 2014 |
— | — | — | 50,123,550 | ||||||||||||
| November 1-November 30, 2014 |
— | — | — | 50,123,550 | ||||||||||||
| December 1-December 31, 2014 |
— | — | — | 50,123,550 | ||||||||||||
|
|
|
|
|
|||||||||||||
| Total |
— | — | — | |||||||||||||
|
|
|
|
|
|||||||||||||
| (1) | On July 25, 2007, Hudson City Bancorp announced the adoption of its eighth Stock Repurchase Program, which authorized the repurchase of up to 51,400,000 shares of common stock. This program has no expiration date. |
66
Table of Contents
Performance Graph
Pursuant to the regulations of the SEC, the graph below compares the performance of Hudson City Bancorp, Inc. with that of the Standard and Poor’s 500 Stock Index, and for all thrift stocks as reported by SNL Securities L.C. from December 31, 2009 through December 31, 2014. The graph assumes the reinvestment of dividends in all additional shares of the same class of equity securities as those listed below. The index level for all series was set to 100.00 on December 31, 2009.
Hudson City Bancorp, Inc. Total Return Performance
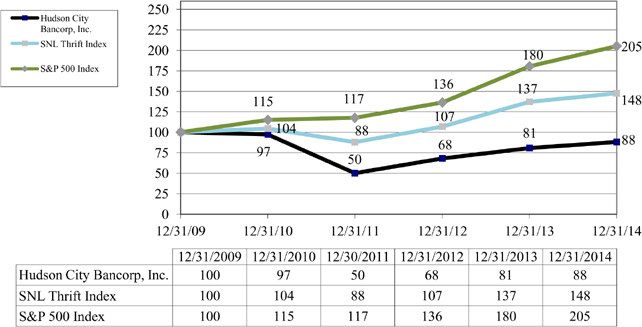
| * | Source: SNL Financial LC and Bloomberg Financial Database |
There can be no assurance that stock performance will continue in the future with the same or similar trends as those depicted in the graph above.
67
Table of Contents
Item 6. Selected Financial Data
Selected Consolidated Financial Information
The summary information presented below under “Selected Financial Condition Data,” “Selected Operating Data” and “Selected Financial Ratios and Other Data” at or for each of the years presented is derived in part from the audited consolidated financial statements of Hudson City Bancorp, Inc. The following information is only a summary and you should read it in conjunction with our audited consolidated financial statements in Item 8 of this document.
| At December 31, | ||||||||||||||||||||
| 2014 | 2013 | 2012 | 2011 | 2010 | ||||||||||||||||
| (In thousands) | ||||||||||||||||||||
| Selected Financial Condition Data: |
||||||||||||||||||||
| Total assets |
$ | 36,569,082 | $ | 38,607,354 | $ | 40,596,341 | $ | 45,355,885 | $ | 61,166,033 | ||||||||||
| Total loans |
21,564,974 | 24,112,829 | 27,090,879 | 29,327,345 | 30,923,897 | |||||||||||||||
| Federal Home Loan Bank of New York stock |
320,753 | 347,102 | 356,467 | 510,564 | 871,940 | |||||||||||||||
| Investment securities held to maturity |
39,011 | 39,011 | 39,011 | 539,011 | 3,939,006 | |||||||||||||||
| Investment securities available for sale |
3,611,045 | 297,283 | 428,057 | 7,368 | 89,795 | |||||||||||||||
| Mortgage-backed securities held to maturity |
1,272,137 | 1,784,464 | 2,976,757 | 4,115,523 | 5,914,372 | |||||||||||||||
| Mortgage-backed securities available for sale |
2,963,304 | 7,167,555 | 8,040,742 | 9,170,390 | 18,120,537 | |||||||||||||||
| Total cash and cash equivalents |
6,285,566 | 4,324,474 | 827,968 | 754,080 | 669,397 | |||||||||||||||
| Foreclosed real estate, net |
79,952 | 70,436 | 47,322 | 40,619 | 45,693 | |||||||||||||||
| Total deposits |
19,376,544 | 21,472,329 | 23,483,917 | 25,507,760 | 25,173,126 | |||||||||||||||
| Total borrowed funds |
12,175,000 | 12,175,000 | 12,175,000 | 15,075,000 | 29,675,000 | |||||||||||||||
| Total shareholders’ equity |
4,781,410 | 4,742,576 | 4,699,808 | 4,560,440 | 5,510,238 | |||||||||||||||
| For the Year Ended December 31, | ||||||||||||||||||||
| 2014 | 2013 | 2012 | 2011 | 2010 | ||||||||||||||||
| (In thousands) | ||||||||||||||||||||
| Selected Operating Data: |
||||||||||||||||||||
| Total interest and dividend income |
$ | 1,167,716 | $ | 1,361,181 | $ | 1,673,039 | $ | 2,167,637 | $ | 2,784,496 | ||||||||||
| Total interest expense |
725,579 | 748,668 | 819,116 | 1,186,703 | 1,593,669 | |||||||||||||||
|
|
|
|
|
|
|
|
|
|
|
|||||||||||
| Net interest income |
442,137 | 612,513 | 853,923 | 980,934 | 1,190,827 | |||||||||||||||
| Provision for loan losses |
(3,500 | ) | 36,500 | 95,000 | 120,000 | 195,000 | ||||||||||||||
|
|
|
|
|
|
|
|
|
|
|
|||||||||||
| Net interest income after provision for loan losses |
445,637 | 576,013 | 758,923 | 860,934 | 995,827 | |||||||||||||||
|
|
|
|
|
|
|
|
|
|
|
|||||||||||
| Non-interest income: |
||||||||||||||||||||
| Service charges and other income |
6,669 | 10,156 | 11,461 | 11,449 | 10,369 | |||||||||||||||
| Gains on securities transactions, net |
103,716 | 28,933 | — | 102,468 | 152,625 | |||||||||||||||
|
|
|
|
|
|
|
|
|
|
|
|||||||||||
| Total non-interest income |
110,385 | 39,089 | 11,461 | 113,917 | 162,994 | |||||||||||||||
|
|
|
|
|
|
|
|
|
|
|
|||||||||||
| Non-interest expense: |
||||||||||||||||||||
| Loss on extinguishment of debt |
— | — | — | 1,900,591 | — | |||||||||||||||
| Other non-interest expense |
293,029 | 309,837 | 356,602 | 329,569 | 266,388 | |||||||||||||||
|
|
|
|
|
|
|
|
|
|
|
|||||||||||
| Total non-interest expense |
293,029 | 309,837 | 356,602 | 2,230,160 | 266,388 | |||||||||||||||
|
|
|
|
|
|
|
|
|
|
|
|||||||||||
| Income (loss) before income tax expense (benefit) |
262,993 | 305,265 | 413,782 | (1,255,309 | ) | 892,433 | ||||||||||||||
| Income tax expense (benefit) |
105,028 | 120,049 | 164,639 | (519,320 | ) | 355,227 | ||||||||||||||
|
|
|
|
|
|
|
|
|
|
|
|||||||||||
| Net income (loss) |
$ | 157,965 | $ | 185,216 | $ | 249,143 | $ | (735,989 | ) | $ | 537,206 | |||||||||
|
|
|
|
|
|
|
|
|
|
|
|||||||||||
68
Table of Contents
Selected Consolidated Financial Information (continued)
(Dollars in thousands, except per share data)
| At or for the Year Ended December 31, | ||||||||||||||||||||
| 2014 | 2013 | 2012 | 2011 | 2010 | ||||||||||||||||
| Selected Financial Ratios and Other Data: |
||||||||||||||||||||
| Performance Ratios: |
||||||||||||||||||||
| Return on average assets |
0.42 | % | 0.47 | % | 0.58 | % | (1.38 | )% | 0.88 | % | ||||||||||
| Return on average stockholders’ equity |
3.28 | 3.91 | 5.35 | (14.72 | ) | 9.66 | ||||||||||||||
| Net interest rate spread (1) |
0.90 | 1.32 | 1.85 | 1.67 | 1.77 | |||||||||||||||
| Net interest margin (2) |
1.20 | 1.59 | 2.06 | 1.89 | 2.01 | |||||||||||||||
| Non-interest expense to average assets (5) |
0.78 | 0.78 | 0.83 | 0.62 | 0.44 | |||||||||||||||
| Efficiency ratio (3) |
52.37 | 47.44 | 40.50 | 32.68 | 19.68 | |||||||||||||||
| Average interest-earning assets to average interest-bearing liabilities |
1.15 | x | 1.13 | x | 1.11 | x | 1.09 | x | 1.09 | x | ||||||||||
| Share and Per Share Data: |
||||||||||||||||||||
| Basic earnings (loss) per share |
$ | 0.32 | $ | 0.37 | $ | 0.50 | $ | (1.49 | ) | $ | 1.09 | |||||||||
| Diluted earnings (loss) per share |
0.32 | 0.37 | 0.50 | (1.49 | ) | 1.09 | ||||||||||||||
| Cash dividends paid per common share |
0.16 | 0.20 | 0.32 | 0.39 | 0.60 | |||||||||||||||
| Dividend pay-out ratio |
50.00 | % | 54.05 | % | 64.00 | % | NM | 55.05 | % | |||||||||||
| Book value per share (4) |
$ | 9.57 | $ | 9.52 | $ | 9.46 | $ | 9.20 | $ | 11.16 | ||||||||||
| Tangible book value per share (4) |
9.27 | 9.21 | 9.15 | 8.89 | 10.85 | |||||||||||||||
| Weighted average number of common shares outstanding: |
||||||||||||||||||||
| Basic |
499,005,091 | 497,793,895 | 496,570,311 | 494,629,395 | 493,032,873 | |||||||||||||||
| Diluted |
500,153,365 | 498,070,797 | 496,604,809 | 494,629,395 | 494,314,390 | |||||||||||||||
| Capital Ratios: |
||||||||||||||||||||
| Average stockholders’ equity to average assets |
12.80 | % | 11.91 | % | 10.89 | % | 9.41 | % | 9.14 | % | ||||||||||
| Stockholders’ equity to assets |
13.08 | 12.28 | 11.58 | 10.05 | 9.01 | |||||||||||||||
| Regulatory Capital Ratios of Bank: |
||||||||||||||||||||
| Leverage capital |
11.74 | % | 10.82 | % | 10.09 | % | 8.83 | % | 7.95 | % | ||||||||||
| Total risk-based capital |
28.75 | 25.31 | 21.59 | 20.00 | 22.74 | |||||||||||||||
| Asset Quality Ratios: |
||||||||||||||||||||
| Non-performing loans to total loans |
3.95 | % | 4.35 | % | 4.29 | % | 3.48 | % | 2.82 | % | ||||||||||
| Non-performing assets to total assets |
2.55 | 2.90 | 2.98 | 2.34 | 1.50 | |||||||||||||||
| Allowance for loan losses to non-performing loans |
27.62 | 26.31 | 26.01 | 26.77 | 27.15 | |||||||||||||||
| Allowance for loan losses to total loans |
1.09 | 1.15 | 1.12 | 0.93 | 0.77 | |||||||||||||||
| Net charge-offs to average total loans |
0.16 | 0.25 | 0.24 | 0.28 | 0.31 | |||||||||||||||
| Branch and Deposit Data: |
||||||||||||||||||||
| Number of deposit accounts |
548,332 | 597,809 | 644,077 | 685,795 | 720,456 | |||||||||||||||
| Banking offices |
135 | 135 | 135 | 135 | 135 | |||||||||||||||
| Average deposits per branch (thousands) |
$ | 143,530 | $ | 159,055 | $ | 173,955 | $ | 188,946 | $ | 186,468 | ||||||||||
| (1) | Determined by subtracting the weighted average cost of average total interest-bearing liabilities from the weighted average yield on average total interest-earning assets. |
| (2) | Determined by dividing net interest income by average total interest-earning assets. |
| (3) | See calculation on page 70. |
| (4) | See calculation on page 70. |
| (5) | For 2011, non-interest expense excludes $1.90 billion of losses on the extinguishment of debt. |
NM - Not meaningful
69
Table of Contents
Calculation of Efficiency Ratio and Book Value Ratios
(Dollars in thousands, except per share data)
| At or for the Year Ended December 31, |
|
|||||||||||||||||||
| 2014 | 2013 | 2012 | 2011 | 2010 | ||||||||||||||||
| (Dollars in thousands, except per share data) | ||||||||||||||||||||
| Efficiency Ratio: |
||||||||||||||||||||
| Net interest income |
$ | 442,137 | $ | 612,513 | $ | 853,923 | $ | 980,934 | $ | 1,190,827 | ||||||||||
| Total non-interest income |
110,385 | 39,089 | 11,461 | 113,917 | 162,994 | |||||||||||||||
| Less net gains on securities transactions related to debt extinguishments |
— | — | — | (98,278 | ) | — | ||||||||||||||
|
|
|
|
|
|
|
|
|
|
|
|||||||||||
| Total operating income |
$ | 552,522 | $ | 651,602 | $ | 865,384 | $ | 996,573 | $ | 1,353,821 | ||||||||||
|
|
|
|
|
|
|
|
|
|
|
|||||||||||
| Total non-interest expense |
$ | 293,029 | $ | 309,837 | $ | 356,602 | $ | 2,230,160 | $ | 266,388 | ||||||||||
| Less: |
||||||||||||||||||||
| Merger related costs |
(671 | ) | (692 | ) | (6,127 | ) | ||||||||||||||
| Loss on extinguishment of debt |
— | — | — | (1,900,591 | ) | — | ||||||||||||||
| Valuation allowance related to Lehman Brothers, Inc. |
(3,000 | ) | — | — | (3,900 | ) | — | |||||||||||||
|
|
|
|
|
|
|
|
|
|
|
|||||||||||
| Total non-interest operating expense |
$ | 289,358 | $ | 309,145 | $ | 350,475 | $ | 325,669 | $ | 266,388 | ||||||||||
|
|
|
|
|
|
|
|
|
|
|
|||||||||||
| Efficiency ratio (1) |
52.37 | % | 47.44 | % | 40.50 | % | 32.68 | % | 19.68 | % | ||||||||||
| Book Value Calculations: |
||||||||||||||||||||
| Shareholders’ equity |
$ | 4,781,410 | $ | 4,742,576 | $ | 4,699,808 | $ | 4,560,440 | $ | 5,510,238 | ||||||||||
| Goodwill and other intangible assets |
(152,471 | ) | (153,218 | ) | (154,235 | ) | (155,217 | ) | (156,714 | ) | ||||||||||
|
|
|
|
|
|
|
|
|
|
|
|||||||||||
| Tangible shareholders’ equity |
$ | 4,628,939 | $ | 4,589,358 | $ | 4,545,573 | $ | 4,405,223 | $ | 5,353,524 | ||||||||||
|
|
|
|
|
|
|
|
|
|
|
|||||||||||
| Book Value Share Computation: |
||||||||||||||||||||
| Issued |
741,466,555 | 741,466,555 | 741,466,555 | 741,466,555 | 741,466,555 | |||||||||||||||
| Treasury shares |
(212,557,820 | ) | (213,047,385 | ) | (213,255,093 | ) | (213,895,059 | ) | (214,748,245 | ) | ||||||||||
|
|
|
|
|
|
|
|
|
|
|
|||||||||||
| Shares outstanding |
528,908,735 | 528,419,170 | 528,211,462 | 527,571,496 | 526,718,310 | |||||||||||||||
| Unallocated ESOP shares |
(28,865,539 | ) | (29,827,724 | ) | (30,789,909 | ) | (31,752,096 | ) | (32,714,280 | ) | ||||||||||
| Unvested RRP shares |
— | — | — | (6,000 | ) | (282,583 | ) | |||||||||||||
| Shares in trust |
(433,141 | ) | (426,103 | ) | (391,266 | ) | (269,325 | ) | (164,845 | ) | ||||||||||
|
|
|
|
|
|
|
|
|
|
|
|||||||||||
| Book value shares |
499,610,055 | 498,165,343 | 497,030,287 | 495,544,075 | 493,556,602 | |||||||||||||||
|
|
|
|
|
|
|
|
|
|
|
|||||||||||
| Book value per share |
$ | 9.57 | $ | 9.52 | $ | 9.46 | $ | 9.20 | $ | 11.16 | ||||||||||
| Tangible book value per share |
9.27 | 9.21 | 9.15 | 8.89 | 10.85 | |||||||||||||||
| (1) | Calculated by dividing total non-interest operating expense by total operating income. These measures are non-GAAP financial measures. We believe these measures, by excluding the transactions involved in our balance shet restructuring, provide a better measure of our non-interest income and expenses. |
70
Table of Contents
Item 7. Management’s Discussion and Analysis of Financial Condition and Results of Operations
This discussion and analysis should be read in conjunction with Hudson City Bancorp’s Consolidated Financial Statements and accompanying Notes to Consolidated Financial Statements in Item 8, and the other statistical data provided elsewhere in this document.
Executive Summary
During 2014, we continued to focus on our consumer-oriented business model through the origination of one- to four-family mortgage loans. We have traditionally funded this loan production with customer deposits and borrowings. Market interest rates remained at historically low levels during 2014 which provided limited opportunities for the reinvestment of repayments received on our mortgage-related assets. As a result, we continued to reduce the size of our balance sheet and we continue to carry an elevated level of short-term liquid assets. Federal funds and other overnight deposits amounted to $6.16 billion, or 16.9%, of total assets at December 31, 2014. In addition, we have $3.30 billion of U.S. Treasury securities that had a weighted-average life of 1.2 years at the time of purchase and an average yield of 0.29%. We believe that while carrying this level of short-term liquid assets adversely impacts our current earnings, it better positions our balance sheet for future strategic initiatives such as a balance sheet restructuring. Our assets decreased by 5.3% to $36.57 billion at December 31, 2014 from $38.61 billion at December 31, 2013, primarily due to elevated repayments of mortgage-related assets in this low interest rate environment. The delay in the execution of the balance sheet restructuring and our continuing to carry an excess liquidity position is primarily due to the delay in obtaining the requisite regulatory approvals for the Merger, though a variety of factors are involved in the decision regarding any such restructuring.
Our results of operations depend primarily on net interest income, which, in part, is a direct result of the market interest rate environment. Net interest income is the difference between the interest income we earn on our interest-earning assets, primarily mortgage loans, mortgage-backed securities and investment securities, and the interest we pay on our interest-bearing liabilities, primarily time deposits, interest-bearing transaction accounts and borrowed funds. Net interest income is affected by the shape of the market yield curve, the timing of the placement and repricing of interest-earning assets and interest-bearing liabilities on our balance sheet, the prepayment rate on our mortgage-related assets and the puts of our borrowings. Our results of operations may also be affected significantly by general and local economic and competitive conditions, particularly those with respect to changes in market interest rates, credit quality, government policies and actions of regulatory authorities. Our results are also affected by the market price of our stock, as the expense of our employee stock ownership plan is related to the current price of our common stock.
The Federal Open Market Committee of the Board of Governors of the Federal Reserve System (the “FOMC”) noted that economic activity has improved in recent months. The FOMC noted that labor market indicators were mixed but on balance showed further improvement. However, the unemployment rate was little changed during the fourth quarter and a range of labor market indicators suggests that there remains significant underutilization of labor resources. Household spending appears to be rising moderately and business fixed investment is advancing, while the recovery in the housing sector slowed somewhat. The national unemployment rate decreased to 5.6% in December 2014 from 6.7% in December 2013 and from 5.9% in September 2014. The FOMC decided to maintain the overnight lending target rate at zero to 0.25% during the fourth quarter of 2014.
The FOMC is maintaining its existing policy of reinvesting principal payments from its holdings of agency debt and agency mortgage-backed securities in agency mortgage-backed securities and of rolling over maturing Treasury securities at auction. The FOMC believes this policy of keeping holdings of longer-term securities at sizable levels should help maintain accommodative financial conditions.
71
Table of Contents
Net interest income decreased $170.4 million, or 27.8%, to $442.1 million for 2014 as compared to $612.5 million for 2013. Our net interest rate spread decreased 42 basis points to 0.90% for 2014 as compared to 1.32% for 2013. Our net interest margin decreased 39 basis points to 1.20% for 2014 as compared to 1.59% for 2013.
The decrease in our interest rate spread and net interest margin for 2014 was primarily due to repayments of higher yielding assets due to the low interest rate environment. The decrease is also due to an increase in the average balance of Federal funds and other overnight deposits and investment securities which yielded 0.25% and 0.64%, respectively during 2014.
Mortgage-related assets represented 80.8% of our average interest-earning assets during 2014. Market interest rates on mortgage-related assets remained at near-historic lows primarily due to the FRB’s program to purchase mortgage-backed securities to keep mortgage rates low and provide stimulus to the housing markets. Given the current market environment and our concerns about taking on additional interest rate risk, we expect to continue to reduce the size of our balance sheet in the near term.
During 2014, we sold a pool of $112.1 million of non-performing residential mortgage loans guaranteed by the FHA back to the financial institution that originally sold the loans to the Bank. The sale of the non-performing loan pool was in accordance with the repurchase right with respect to loans that become non-performing that the financial institution exercised pursuant to the terms of the original sale and servicing agreement between the Bank and the financial institution. As consideration for the sale of the non-performing loans, the Bank received from the financial institution an amount equal to 100% of the outstanding unpaid principal balance of the loans, plus all accrued and unpaid interest on the loans. The Bank may sell additional loans to the financial institution in the future, in the event the financial institution exercises its repurchase right with respect to any additional non-performing FHA loans.
We recorded a net credit provision of $3.5 million for 2014 as compared to a provision for loan losses of $36.5 million for 2013. The net credit provision for loan losses in 2014 was primarily due to a decrease in the amount of total delinquent loans, which was largely the result of the sale of the pool of non-performing FHA loans, along with improving home prices and economic conditions and a decrease in the size of the loan portfolio. Early stage loan delinquencies (defined as loans that are 30 to 89 days delinquent) decreased $65.8 million to $407.6 million at December 31, 2014 from $473.4 million at December 31, 2013. Non-performing loans, defined as non-accrual loans and accruing loans delinquent 90 days or more, amounted to $852.0 million at December 31, 2014 compared with $1.05 billion at December 31, 2013. The ratio of non-performing loans to total loans was 3.95% at December 31, 2014 compared with 4.35% at December 31, 2013. The decrease in this ratio was due to the decrease in non-performing loans, partially offset by a $2.55 billion decrease in total loans at December 31, 2014 as compared to December 31, 2013. Notwithstanding the decrease in non-performing loans, the foreclosure process and the time to complete a foreclosure, while improving, continues to be prolonged as we continue to experience a time frame to repayment or foreclosure of up to 48 months from the initial non-performing period, especially in New York and New Jersey where 70% of our non-performing loans are located at December 31, 2014. This protracted foreclosure process delays our ability to resolve non-performing loans through the sale of the underlying collateral and our ability to maximize any recoveries. However, since 2013, we have experienced an increased volume of completed foreclosures for loans that have been in the foreclosure process for over 48 months.
Total non-interest income was $110.4 million for 2014 as compared to $39.1 million for 2013. Included in non-interest income for the year 2014 were $103.7 million gains from the sale of $3.31 billion of mortgage backed securities. Gains on the sales of securities amounted to $28.9 million for the year ended December 31, 2013.
We sold these mortgage-backed securities during 2014 to take advantage of current market demand and prices.
72
Table of Contents
Total non-interest expense amounted to $293.0 million for the year ended December 31, 2014 as compared to $309.8 million for the year ended December 31, 2013. The primary reason for the decrease in total non-interest expense was a $23.7 million decrease in FDIC assessments. In addition, compensation and benefits decreased $3.4 million. These decreases were partially offset by a $9.5 million increase in other non-interest expense.
Net loans decreased $2.51 billion to $21.43 billion at December 31, 2014 from $23.94 billion at December 31, 2013. During 2014, our loan production (originations and purchases) amounted to $1.40 billion as compared to $3.59 billion for 2013. Loan production was offset by principal repayments of $3.84 billion in 2014, as compared to principal repayments of $6.38 billion in 2013. The decline in loan production in 2014 as compared to 2013 reflects our limited appetite for adding long-term fixed-rate mortgage loans to our portfolio in the current low market interest rate environment. The decrease in loan repayments was due primarily to reduced refinancing activity.
The Strategic Plan includes the implementation of our CRE lending initiative. During 2014, the Bank purchased CRE and multi-family loans and interests in such loans. The Bank purchased $86.6 million of such loans and interests in the fourth quarter of 2014. Many of the remaining initiatives in the Strategic Plan require significant lead time for full implementation and roll-out to our customers. We expect to expand our CRE lending business by engaging in direct originations commencing in the second half of 2015.
Total mortgage-backed securities decreased $4.71 billion to $4.24 billion at December 31, 2014 from $8.95 billion at December 31, 2013. The decrease was due primarily to securities sales of $3.31 billion and repayments of $1.43 billion of mortgage-backed securities during 2014. We sold mortgage-backed securities during 2014 to take advantage of current market demand and prices. The proceeds from the sales have been invested primarily in short-term liquid assets. While this further increases our levels of low-yielding liquid assets, we believe this positions our balance sheet for future strategic initiatives such as a balance sheet restructuring.
Total investment securities increased $3.31 billion to $3.65 billion at December 31, 2014 as compared to $336.3 million at December 31, 2013. The increase was due primarily to purchase of $3.30 billion of U.S. Treasury securities with an average life of 1.2 years which are used as collateral for our outstanding borrowings.
Total liabilities decreased $2.07 billion, or 6.1%, to $31.79 billion at December 31, 2014 from $33.86 billion at December 31, 2013. The decrease in total liabilities reflected a decrease in total deposits while total borrowed funds remained unchanged.
On August 27, 2012, the Company entered into the Merger Agreement with M&T and WTC, pursuant to which the Company will merge with and into WTC, with WTC continuing as the surviving entity. As part of the Merger, the Bank will merge with and into Manufacturers and Traders Trust Company.
Subject to the terms and conditions of the Merger Agreement, in the Merger, Hudson City Bancorp shareholders will have the right to receive with respect to each of their shares of common stock of the Company, at their election (but subject to proration and adjustment procedures), 0.08403 of a share of common stock, or cash having a value equal to the product of 0.08403 multiplied by the average closing price of the M&T common stock for the ten days immediately prior to the completion of the Merger. The Merger Agreement also provides that at the closing of the Merger, 40% of the outstanding shares of Hudson City common stock will be converted into the right to receive cash and the remainder of the outstanding shares of Hudson City common stock will be converted into the right to receive shares of M&T common stock.
On December 9, 2014, M&T and the Company announced that they entered into Amendment No. 3 to the Merger Agreement. Amendment No. 3 further extends the date after which either party may terminate the Merger Agreement if the Merger has not yet been completed from December 31, 2014 to April 30, 2015, and provides that the Company may terminate the Merger Agreement at any time if it reasonably determines that M&T is unlikely to be able to obtain the requisite regulatory approvals of the Merger to
73
Table of Contents
permit the closing to occur on or prior to April 30, 2015. While M&T and the Company extended the date after which either party may elect to terminate the Merger Agreement from December 31, 2014 to April 30, 2015, there can be no assurances that the Merger will be completed by that date or that the Company will not exercise its right to terminate the Merger Agreement in accordance with its terms.
During 2013 and 2014, the Bank was subject to the Bank MOU. In accordance with the Bank MOU, the Bank adopted and implemented enhanced operating policies and procedures that are intended to continue to (a) reduce our level of interest rate risk, (b) reduce our funding concentration, (c) diversify our funding sources, (d) enhance our liquidity position, (e) monitor and manage loan modifications and (f) maintain our capital position in accordance with our existing capital plan. In addition, we developed the Strategic Plan which establishes objectives for the Bank’s overall risk profile, earnings performance, growth and balance sheet mix and to enhance our enterprise risk management program. On February 26, 2015 the OCC terminated the Bank MOU.
The Company is currently subject to the Company MOU. In accordance with the Company MOU, the Company is required to: (a) obtain approval from the FRB prior to receiving a capital distribution from the Bank or declaring a dividend to shareholders and (b) obtain approval from the FRB prior to repurchasing or redeeming any Company stock or incurring any debt with a maturity of greater than one year. In accordance with the Company MOU, the Company submitted a comprehensive Capital Plan and a comprehensive Earnings Plan to the FRB.
While the Company believes it is in compliance in all material respects with the terms of the Company MOU it will remain in effect until modified or terminated by the FRB.
Comparison of Financial Condition at December 31, 2014 and December 31, 2013
Total assets decreased $2.04 billion, or 5.3%, to $36.57 billion at December 31, 2014 from $38.61 billion at December 31, 2013. The decrease in total assets reflected a $4.71 billion decrease in total mortgage-backed securities and a $2.51 billion decrease in net loans, partially offset by a $3.31 billion increase in investment securities and a $1.97 billion increase in cash and cash equivalents.
Total cash and cash equivalents increased $1.97 billion to $6.29 billion at December 31, 2014 as compared to $4.32 billion at December 31, 2013. This increase is primarily due to repayments on mortgage-related assets and the lack of attractive reinvestment opportunities in the current low interest rate environment as available short term reinvestment opportunities continue to carry low yields, and medium and longer term opportunities available to us carry significant duration risk at relatively low yields. We have maintained lower deposit rates to allow a reduction in our deposits, which helps us to manage our excess liquidity while we position our balance sheet for a possible restructuring. We have used a portion of our excess cash inflows to fund these deposit reductions.
Net loans decreased $2.51 billion to $21.43 billion at December 31, 2014 as compared to $23.94 billion at December 31, 2013. During 2014, we originated $1.15 billion and purchased $253.7 million of loans, compared to originations of $3.50 billion and purchases of $96.9 million for 2013. The originations and purchases of loans were offset by principal repayments of $3.84 billion in 2014, as compared to $6.38 billion for 2013. The decrease in loan repayments is due primarily to reduced refinancing activity.
74
Table of Contents
The decline in loan production in 2014 as compared to 2013 reflects our limited appetite for adding long-term fixed-rate mortgage loans to our portfolio in the current low market interest rate environment. In addition, loan production has been impacted by the new qualified mortgage regulations issued by the Consumer Financial Protection Bureau (the “CFPB”) in January 2014. Effective in January 2014, we discontinued our reduced documentation loan program in order to comply with the new requirements to validate a borrower’s ability to repay and the corresponding safe harbor for loans that meet the requirements for a “qualified mortgage.” During 2013, 22% of our total loan production consisted of reduced documentation loans to borrowers.
Our first mortgage loan production during 2014 was substantially all in one- to four-family mortgage loans. Approximately 81% of mortgage loan originations for 2014 were variable-rate loans as compared to approximately 75% for 2013. Pursuant to the Bank’s Strategic Plan, during 2014 the Bank began to purchase CRE and multi-family loans and interests in such loans. During 2014, the Bank purchased $86.6 million of such loans and interests. Fixed-rate mortgage loans accounted for 53.6% of our first mortgage loan portfolio at December 31, 2014 and 55.4% at December 31, 2013.
Our ALL amounted to $235.3 million at December 31, 2014 and $276.1 million at December 31, 2013. Non-performing loans amounted to $852.0 billion or 3.95% of total loans at December 31, 2014 as compared to $1.05 billion or 4.35% of total loans at December 31, 2013.
Total mortgage-backed securities decreased $4.71 billion to $4.24 billion at December 31, 2014 from $8.95 billion at December 31, 2013. The decrease was due primarily to securities sales of $3.31 billion and repayments of $1.43 billion of mortgage-backed securities during 2014. We sold mortgage-backed securities during 2014 to take advantage of current market demand and prices. The proceeds from the sales have been invested primarily in short-term liquid assets. While this further increases our levels of low-yielding liquid assets, we believe this positions our balance sheet for future strategic initiatives such as a balance sheet restructuring.
Total investment securities increased $3.31 billion to $3.65 billion at December 31, 2014 as compared to $336.3 million at December 31, 2013. The increase was due primarily to purchases of $3.30 billion of U.S. Treasury securities with an average life of 1.2 years which are used as collateral for our outstanding borrowings.
Total liabilities decreased $2.07 billion, or 6.1%, to $31.79 billion at December 31, 2014 from $33.86 billion at December 31, 2013. The decrease in total liabilities reflected a decrease in total deposits while total borrowed funds remained unchanged.
Total deposits decreased $2.09 billion, or 9.7%, to $19.38 billion at December 31, 2014 as compared to $21.47 billion at December 31, 2013. The decrease in total deposits reflected a $1.03 billion decrease in our money market accounts, a $1.02 billion decrease in our time deposit accounts, and a $92.5 million decrease in our interest-bearing transaction accounts, partially offset by an increase in savings accounts of $46.1 million. The decrease in our money market, time deposit accounts and interest-bearing transaction accounts was due to our decision to maintain lower deposit rates that allow us to manage deposit levels at a time when there are limited investment opportunities with attractive yields to reinvest the funds received from payment activity on mortgage-related assets. These decreases were partially offset by an increase of $46.1 million in our savings accounts. We had 135 branches at both December 31, 2014 and 2013.
Borrowings amounted to $12.18 billion at December 31, 2014 with an average cost of 4.59%. There is one borrowing scheduled to mature in the fourth quarter of 2015 for $75.0 million with an average cost of 4.62%.
At December 31, 2014, we had $3.33 billion of borrowed funds with put dates within one year, all of which can be put back to the Company quarterly. If interest rates were to decrease, or remain consistent with current rates, we believe these borrowings would probably not be put back and our average cost of existing borrowings would not decrease even as market interest rates decrease. Conversely, if interest rates increase above the market interest rate for similar borrowings, we believe these borrowings would likely be put back at their next put date and our cost to replace these borrowings would increase. However, we believe, given current market conditions, that the likelihood that a significant portion of these borrowings would be put back will not increase substantially unless interest rates were to increase by at least 250 basis points from current levels.
75
Table of Contents
Other liabilities increased $18.7 million to $236.1 million at December 31, 2014 from $217.4 million at December 31, 2013. The increase is due to an $18.7 million increase in accrued expenses. The increase in accrued expenses is due to an increase in postretirement benefit plan liabilities of $27.4 million and an increase of $2.0 million in accrued expenses related to REO. These increases were partially offset by decreases of $11.8 million in incentive plan accruals and $4.3 million in Federal deposit insurance accruals.
Total shareholders’ equity increased $38.8 million to $4.78 billion at December 31, 2014 as compared to $4.74 billion at December 31, 2013. The increase was primarily due to net income of $158.0 million for the year ended December 31, 2014, partially offset by cash dividends paid to common shareholders of $80.2 million and a change in accumulated other comprehensive loss of $56.7 million.
Accumulated other comprehensive loss amounted to $50.4 million at December 31, 2014 and included a $68.7 million after-tax accumulated other comprehensive loss related to the funded status of our employee benefit plans partially offset by a $18.3 million after-tax net unrealized gain on securities available for sale ($30.9 million pre-tax). Accumulated other comprehensive income amounted to $6.3 million at December 31, 2013 and included a $33.9 million after-tax net unrealized gain on securities available for sale ($57.2 million pre-tax) partially offset by a $27.6 million after-tax accumulated other comprehensive loss related to the funded status of our employee benefit plans. The increase in 2014 in the accumulated other comprehensive loss on our benefit plans was primarily due to a change in the mortality tables and a decrease in the discount rate. The Society of Actuaries published updated mortality tables in October 2014. These tables reflect recent improvements in longevity and also project future improvements in mortality, which resulted in an increase in our postretirement benefit obligations.
As of December 31, 2014, there remained 50,123,550 shares that may be purchased under our existing stock repurchase programs. We did not repurchase any shares of our common stock during 2014 pursuant to our repurchase programs. Pursuant to the Company MOU, any future share repurchases must be approved by the FRB. In addition, pursuant to the terms of the Merger Agreement, we may not repurchase shares of Hudson City Bancorp common stock without the consent of M&T. At December 31, 2014, our capital ratios were in excess of the applicable regulatory requirements to be considered well-capitalized. See “Liquidity and Capital Resources.”
At December 31, 2014, our shareholders’ equity to asset ratio was 13.08% compared with 12.28% at December 31, 2013. The ratio of average shareholders’ equity to average assets was 12.80% for the year ended December 31, 2014 as compared to 11.91% for the year ended December 31, 2013. Our book value per share, using the period-end number of outstanding shares, less purchased but unallocated employee stock ownership plan shares and less purchased but unvested recognition and retention plan shares, was $9.57 at December 31, 2014 and $9.52 at December 31, 2013. Our tangible book value per share, calculated by deducting goodwill and the core deposit intangible from shareholders’ equity, was $9.27 as of December 31, 2014 and $9.21 at December 31, 2013.
Analysis of Net Interest Income
Net interest income represents the difference between the interest income we earn on our interest-earning assets, such as mortgage loans, mortgage-backed securities and investment securities, and the expense we pay on interest-bearing liabilities, such as time deposits and borrowed funds. Net interest income depends on our volume of interest-earning assets and interest-bearing liabilities and the interest rates we earned or paid on them.
76
Table of Contents
Average Balance Sheet. The following table presents certain information regarding our financial condition and net interest income for 2014, 2013 and 2012. The table presents the average yield on interest-earning assets and the average cost of interest-bearing liabilities for the periods indicated. We derived the yields and costs by dividing income or expense by the average balance of interest-earning assets or interest-bearing liabilities, respectively, for the periods shown. We derived average balances from daily balances over the periods indicated. Interest income includes fees that we considered adjustments to yields. Yields on tax-exempt obligations were not computed on a tax equivalent basis. Non-accrual loans were included in the computation of average balances and therefore have a zero yield. The yields set forth below include the effect of deferred loan origination fees and costs, and purchase premiums and discounts that are amortized or accreted to interest income.
| For the Year Ended December 31, | ||||||||||||||||||||||||||||||||||||
| 2014 | 2013 | 2012 | ||||||||||||||||||||||||||||||||||
| Average Balance |
Interest | Average Yield/ Cost |
Average Balance |
Interest | Average Yield/ Cost |
Average Balance |
Interest | Average Yield/ Cost |
||||||||||||||||||||||||||||
| (Dollars in thousands) | ||||||||||||||||||||||||||||||||||||
| Assets: |
||||||||||||||||||||||||||||||||||||
| Interest-earning assets: |
||||||||||||||||||||||||||||||||||||
| First mortgage loans, net (1) |
$ | 22,627,987 | $ | 967,084 | 4.27 | % | $ | 24,923,290 | $ | 1,103,840 | 4.43 | % | $ | 27,677,039 | $ | 1,309,568 | 4.73 | % | ||||||||||||||||||
| Consumer and other loans |
205,260 | 8,884 | 4.33 | 228,704 | 10,088 | 4.41 | 270,188 | 12,887 | 4.77 | |||||||||||||||||||||||||||
| Federal funds sold |
5,204,403 | 13,178 | 0.25 | 2,931,355 | 7,425 | 0.25 | 591,092 | 1,443 | 0.24 | |||||||||||||||||||||||||||
| Mortgage-backed securities, at amortized cost |
7,082,030 | 155,821 | 2.20 | 9,792,478 | 216,490 | 2.21 | 12,034,383 | 314,035 | 2.61 | |||||||||||||||||||||||||||
| Federal Home Loan Bank stock |
333,076 | 14,234 | 4.27 | 349,591 | 14,689 | 4.20 | 425,561 | 23,470 | 5.52 | |||||||||||||||||||||||||||
| Investment securities, at amortized cost |
1,335,480 | 8,515 | 0.64 | 415,173 | 8,649 | 2.08 | 429,539 | 11,636 | 2.71 | |||||||||||||||||||||||||||
|
|
|
|
|
|
|
|
|
|
|
|
|
|||||||||||||||||||||||||
| Total interest-earning assets |
36,788,236 | 1,167,716 | 3.17 | 38,640,591 | 1,361,181 | 3.52 | 41,427,802 | 1,673,039 | 4.04 | |||||||||||||||||||||||||||
|
|
|
|
|
|
|
|||||||||||||||||||||||||||||||
| Noninterest-earning assets (2) |
885,898 | 1,077,827 | 1,506,828 | |||||||||||||||||||||||||||||||||
|
|
|
|
|
|
|
|||||||||||||||||||||||||||||||
| Total assets |
$ | 37,674,134 | $ | 39,718,418 | $ | 42,934,630 | ||||||||||||||||||||||||||||||
|
|
|
|
|
|
|
|||||||||||||||||||||||||||||||
| Liabilities and shareholders’ equity: |
||||||||||||||||||||||||||||||||||||
| Interest-bearing liabilities: |
||||||||||||||||||||||||||||||||||||
| Savings accounts |
$ | 1,040,756 | 1,564 | 0.15 | % | $ | 982,900 | 1,860 | 0.19 | % | $ | 908,903 | 2,761 | 0.30 | % | |||||||||||||||||||||
| Interest-bearing transaction accounts |
2,150,352 | 5,973 | 0.28 | 2,232,495 | 7,201 | 0.32 | 2,181,326 | 11,608 | 0.53 | |||||||||||||||||||||||||||
| Money market accounts |
4,662,785 | 9,247 | 0.20 | 5,895,550 | 15,027 | 0.25 | 7,529,380 | 35,059 | 0.47 | |||||||||||||||||||||||||||
| Time deposits |
11,957,971 | 142,368 | 1.19 | 12,796,643 | 158,303 | 1.24 | 13,223,809 | 189,256 | 1.43 | |||||||||||||||||||||||||||
|
|
|
|
|
|
|
|
|
|
|
|
|
|||||||||||||||||||||||||
| Total interest-bearing deposits |
19,811,864 | 159,152 | 0.80 | 21,907,588 | 182,391 | 0.83 | 23,843,418 | 238,684 | 1.00 | |||||||||||||||||||||||||||
| Repurchase agreements |
6,274,932 | 281,934 | 4.49 | 6,950,000 | 313,351 | 4.51 | 6,950,000 | 314,485 | 4.52 | |||||||||||||||||||||||||||
| FHLB advances |
5,900,068 | 284,493 | 4.82 | 5,225,000 | 252,926 | 4.84 | 6,623,094 | 265,947 | 4.02 | |||||||||||||||||||||||||||
|
|
|
|
|
|
|
|
|
|
|
|
|
|||||||||||||||||||||||||
| Total borrowed funds |
12,175,000 | 566,427 | 4.65 | 12,175,000 | 566,277 | 4.65 | 13,573,094 | 580,432 | 4.28 | |||||||||||||||||||||||||||
|
|
|
|
|
|
|
|
|
|
|
|
|
|||||||||||||||||||||||||
| Total interest-bearing liabilities |
31,986,864 | 725,579 | 2.27 | 34,082,588 | 748,668 | 2.20 | 37,416,512 | 819,116 | 2.19 | |||||||||||||||||||||||||||
|
|
|
|
|
|
|
|
|
|
|
|
|
|||||||||||||||||||||||||
| Noninterest-bearing liabilities: |
||||||||||||||||||||||||||||||||||||
| Noninterest-bearing deposits |
658,401 | 644,572 | 611,656 | |||||||||||||||||||||||||||||||||
| Other noninterest-bearing liabilities |
206,077 | 259,216 | 230,491 | |||||||||||||||||||||||||||||||||
|
|
|
|
|
|
|
|||||||||||||||||||||||||||||||
| Total noninterest-bearing liabilities |
864,478 | 903,788 | 842,147 | |||||||||||||||||||||||||||||||||
|
|
|
|
|
|
|
|||||||||||||||||||||||||||||||
| Total liabilities |
32,851,342 | 34,986,376 | 38,258,659 | |||||||||||||||||||||||||||||||||
| shareholders’ equity |
4,822,792 | 4,732,042 | 4,675,971 | |||||||||||||||||||||||||||||||||
|
|
|
|
|
|
|
|||||||||||||||||||||||||||||||
| Total liabilities and shareholders’ equity |
$ | 37,674,134 | $ | 39,718,418 | $ | 42,934,630 | ||||||||||||||||||||||||||||||
|
|
|
|
|
|
|
|||||||||||||||||||||||||||||||
| Net interest income |
$ | 442,137 | $ | 612,513 | $ | 853,923 | ||||||||||||||||||||||||||||||
|
|
|
|
|
|
|
|||||||||||||||||||||||||||||||
| Net interest rate spread (3) |
0.90 | 1.32 | 1.85 | |||||||||||||||||||||||||||||||||
| Net interest-earning assets |
$ | 4,801,372 | $ | 4,558,003 | $ | 4,011,290 | ||||||||||||||||||||||||||||||
|
|
|
|
|
|
|
|||||||||||||||||||||||||||||||
| Net interest margin (4) |
1.20 | % | 1.59 | % | 2.06 | % | ||||||||||||||||||||||||||||||
| Ratio of interest-earning assets to interest-bearing liabilities |
1.15 | 1.13 | 1.11x | |||||||||||||||||||||||||||||||||
| (1) | Amount is net of deferred loan costs and allowance for loan losses and includes non-performing loans. |
| (2) | Includes the average balance of principal receivable related to FHLMC mortgage-backed securities of $41.9 million, $97.8 million and $122.3 million for the years ended December 31, 2014, 2013 and 2012, respectively. |
| (3) | Determined by subtracting the weighted average cost of average total interest-bearing liabilities from the weighted average yield on average total interest-earning assets. |
| (4) | Determined by dividing net interest income by average total interest-earning assets. |
77
Table of Contents
Rate/Volume Analysis. The following table presents the extent to which the changes in interest rates and the changes in volume of our interest-earning assets and interest-bearing liabilities have affected our interest income and interest expense during the periods indicated. Information is provided in each category with respect to:
| • | changes attributable to changes in volume (changes in volume multiplied by prior rate); |
| • | changes attributable to changes in rate (changes in rate multiplied by prior volume); and |
| • | the net change. |
The changes attributable to the combined impact of volume and rate have been allocated proportionately to the changes due to volume and the changes due to rate.
| 2014 Compared to 2013 | 2013 Compared to 2012 | |||||||||||||||||||||||
| Increase (Decrease) Due To | Increase (Decrease) Due To | |||||||||||||||||||||||
| Volume | Rate | Net | Volume | Rate | Net | |||||||||||||||||||
| (In thousands) | ||||||||||||||||||||||||
| Interest-earning assets: |
||||||||||||||||||||||||
| First mortgage loans, net |
$ | (98,232 | ) | $ | (38,524 | ) | $ | (136,756 | ) | $ | (125,638 | ) | $ | (80,090 | ) | $ | (205,728 | ) | ||||||
| Consumer and other loans |
(1,023 | ) | (181 | ) | (1,204 | ) | (1,876 | ) | (923 | ) | (2,799 | ) | ||||||||||||
| Federal funds sold |
5,753 | — | 5,753 | 5,920 | 62 | 5,982 | ||||||||||||||||||
| Mortgage-backed securities |
(59,693 | ) | (976 | ) | (60,669 | ) | (53,517 | ) | (44,028 | ) | (97,545 | ) | ||||||||||||
| Federal Home Loan Bank stock |
(698 | ) | 243 | (455 | ) | (3,754 | ) | (5,027 | ) | (8,781 | ) | |||||||||||||
| Investment securities |
9,009 | (9,143 | ) | (134 | ) | (375 | ) | (2,612 | ) | (2,987 | ) | |||||||||||||
|
|
|
|
|
|
|
|
|
|
|
|
|
|||||||||||||
| Total |
(144,884 | ) | (48,581 | ) | (193,465 | ) | (179,240 | ) | (132,618 | ) | (311,858 | ) | ||||||||||||
|
|
|
|
|
|
|
|
|
|
|
|
|
|||||||||||||
| Interest-bearing liabilities: |
||||||||||||||||||||||||
| Savings accounts |
107 | (403 | ) | (296 | ) | 200 | (1,101 | ) | (901 | ) | ||||||||||||||
| Interest-bearing transaction accounts |
(279 | ) | (949 | ) | (1,228 | ) | 266 | (4,673 | ) | (4,407 | ) | |||||||||||||
| Money market accounts |
(2,954 | ) | (2,826 | ) | (5,780 | ) | (6,345 | ) | (13,687 | ) | (20,032 | ) | ||||||||||||
| Time deposits |
(9,866 | ) | (6,069 | ) | (15,935 | ) | (6,053 | ) | (24,900 | ) | (30,953 | ) | ||||||||||||
| Repurchase agreements |
(30,045 | ) | (1,372 | ) | (31,417 | ) | — | (1,134 | ) | (1,134 | ) | |||||||||||||
| FHLB advances |
32,614 | (1,047 | ) | 31,567 | (61,862 | ) | 48,841 | (13,021 | ) | |||||||||||||||
|
|
|
|
|
|
|
|
|
|
|
|
|
|||||||||||||
| Total |
(10,423 | ) | (12,666 | ) | (23,089 | ) | (73,794 | ) | 3,346 | (70,448 | ) | |||||||||||||
|
|
|
|
|
|
|
|
|
|
|
|
|
|||||||||||||
| Net change in net interest income |
$ | (134,461 | ) | $ | (35,915 | ) | $ | (170,376 | ) | $ | (105,446 | ) | $ | (135,964 | ) | $ | (241,410 | ) | ||||||
|
|
|
|
|
|
|
|
|
|
|
|
|
|||||||||||||
Comparison of Operating Results for the Years Ended December 31, 2014 and 2013
General. Net income was $158.0 million for 2014, a decrease of $27.2 million, or 14.7%, compared with net income of $185.2 million for 2013. Basic and diluted earnings per common share were both $0.32 for 2014 as compared to basic and diluted earnings per share of $0.37 for 2013. For 2014, our return on average shareholders’ equity was 3.28%, compared with 3.91% for 2013. Our return on average assets for 2014 was 0.42% as compared to 0.47% for 2013. The decreases in our returns on average assets and average shareholders’ equity was due primarily to the decrease in net income in 2014.
Interest and Dividend Income. Total interest and dividend income for the year ended December 31, 2014 decreased $193.5 million, or 14.2%, to $1.17 billion from $1.36 billion for the year ended December 31, 2013. The decrease in total interest and dividend income was primarily due to a decrease in the average balance of total-earning assets of $1.85 billion, or 4.8%, to $36.79 billion for 2014 from $38.64 billion for 2013. The decrease in total interest and dividend income was also due to a decrease of 35 basis points in the weighted-average yield on total interest-earning assets to 3.17% for 2014 from 3.52% for 2013. The decrease in the
78
Table of Contents
average balance of total interest-earning assets was due primarily to repayments of mortgage-related assets during 2014 as a result of the low interest rate environment and our decision not to reinvest in low-yielding, long-term assets. The decrease in the weighted-average yield of interest-earning assets was due to lower market interest rates earned on mortgage-related assets and a $2.27 billion increase in the average balance of Federal funds and other overnight deposits which had an average yield of 0.25% during the year ended December 31, 2014 and a $920.3 million increase in the average balance of investment securities with a weighted-average yield of 0.64% for the year ended December 31, 2014.
For the year ended December 31, 2014, interest on first mortgage loans decreased $136.8 million, or 12.4%, to $967.1 million from $1.10 billion for the year ended December 31, 2013. This was primarily due to a $2.29 billion decrease in the average balance of first mortgage loans to $22.63 billion for the year ended December 31, 2014 from $24.92 billion for the year ended December 31, 2013. The decrease in interest income on mortgage loans was also due to a 16 basis point decrease in the weighted-average yield to 4.27% for the year ended December 31, 2014 from 4.43% for the year ended December 31, 2013.
The decrease in the weighted-average yield earned on first mortgage loans during the year ended 2014 was due primarily to repayments of higher-yielding loans coupled with lower yields on new loan originations. Consequently, the average yield on our loan portfolio continued to decline during 2014. The decrease in the average balance of first mortgage loans was due to a decrease in our loan production reflecting our limited appetite for adding long-term mortgage loans to our portfolio in the current low interest rate environment and also the impact of the CFPB’s new ability to repay and qualified mortgage regulations, which went into effect in January 2014. During 2014, our loan production (originations and purchases) amounted to $1.40 billion as compared to $3.59 billion for the same period in 2013. Loan production was offset by principal repayments of $3.84 billion in 2014 as compared to principal repayments of $6.38 billion in 2013. See “Regulation of Hudson City Savings Bank and Hudson City Bancorp.”
Interest on consumer and other loans decreased $1.2 million to $8.9 million for the year ended December 31, 2014 from $10.1 million for the year ended December 31, 2013. The average balance of consumer and other loans decreased $23.4 million to $205.3 million for 2014 as compared to $228.7 million for 2013 and the weighted average yield earned decreased 8 basis points to 4.33% as compared to 4.41% for the same respective periods. The average balance of consumer loans decreased as consumer loans is not a business that we actively pursue. The decrease in the weighted-average yield is a result of current market interest rates.
Interest on mortgage-backed securities decreased $60.7 million to $155.8 million for the year ended December 31, 2014 from $216.5 million for the year ended December 31, 2013. This decrease was due primarily to a $2.71 billion decrease in the average balance of mortgage-backed securities to $7.08 billion for 2014 from $9.79 billion for 2013. The decrease was also due to a slight decrease in the weighted-average yield of mortgage-backed securities to 2.20% for year ended December 31, 2014 as compared to 2.21% for the year ended December 31, 2013.
The decrease in the average balance of mortgage-backed securities during the year ended December 31, 2014 was due to sales of mortgage-backed securities and principal repayments. During 2014, we sold $3.31 billion of mortgage-backed securities to realize gains that otherwise would decrease as market interest rates increase and as repayments reduce the outstanding principal balance on these securities.
For the year ended December 31, 2014, interest on investment securities decreased $134,000 to $8.5 million as compared to $8.6 million for the year ended December 31, 2013. This decrease was due to a decrease of 144 basis points in the weighted-average yield to 0.64% for 2014 from 2.08% for 2013. This decrease was partially offset by an increase of $920.3 million in the average balance of investment securities to $1.34 billion for 2014 as compared to $415.2 million for 2013.
79
Table of Contents
The increase in the average balance of investment securities during the year ended December 31, 2014 was due to the purchase of $3.30 billion of U.S. Treasury securities during 2014. We purchased these securities to be used as collateral for our borrowings, while our average balance of mortgage-backed securities was otherwise declining. The decrease in the weighted-average yield earned on investment securities during 2014 is due to the yield earned on these U.S. Treasury securities purchased which was 0.29%.
Dividends on FHLB stock decreased $455,000 or 3.1%, to $14.2 million for the year ended December 31, 2014 from $14.7 million for the year ended December 31, 2013. The decrease was primarily due to a $16.5 million decrease in the average balance of FHLB stock to $333.1 million for 2014 as compared to $349.6 million for 2013. This was partially offset by a 7 basis point increase in the average dividend yield earned to 4.27% for 2014 from 4.20% for 2013.
Interest on Federal funds sold and other overnight deposits amounted to $13.2 million for the year ended December 31, 2014 as compared to $7.4 million for the year ended December 31, 2013 due primarily to an increase in the average balance of Federal funds sold and other overnight deposits. The average balance of Federal funds sold and other overnight deposits amounted to $5.20 billion for 2014 as compared to $2.93 billion for 2013. The yield earned on Federal funds and other overnight deposits was 0.25% for both 2014 and 2013.
The increase in the average balance of Federal funds sold and other overnight deposits during 2014 was due primarily to repayments and sales of mortgage-related assets and our low appetite for adding long-term fixed-rate mortgage-related assets to our portfolio in the current low interest rate environment.
Interest Expense. Total interest expense for the year ended December 31, 2014 decreased $23.1 million, or 3.1%, to $725.6 million from $748.7 million for the year ended December 31, 2013. This decrease was primarily due to a $2.09 billion, or 6.1%, decrease in the average balance of total interest-bearing liabilities to $31.99 billion for the year ended December 31, 2014 compared with $34.08 billion for the year ended December 31, 2013. This was partially offset by an increase in the weighted-average cost of total interest-bearing liabilities to 2.27% for the year ended December 31, 2014 as compared to 2.20% for the year ended December 31, 2013. The decrease in the average balance of total interest-bearing liabilities was due entirely to a decrease in the average balance of total deposits.
The increase in the weighted-average cost of interest-bearing liabilities during the year ended December 31, 2014 was due to a decrease in the average balance of interest-bearing deposits, which have a lower weighted-average cost than our borrowed funds, the average balances of which remained unchanged. Interest-bearing deposits accounted for 62% of interest-bearing liabilities for the year ended December 31, 2014, as compared to 64% for the same period in 2013.
Interest expense on our time deposit accounts decreased $15.9 million to $142.4 million for the year ended December 31, 2014 from $158.3 million for the year ended December 31, 2013. The decrease was due to an $838.7 million decrease in the average balance of time deposit accounts to $11.96 billion for 2014 from $12.80 billion for 2013. This decrease was also due to a 5 basis point decrease in the weighted-average cost to 1.19% for 2014 compared with 1.24% for 2013 as maturing time deposits were renewed or replaced by new time deposits at lower rates. The decline in the average balance of our time deposit accounts reflects our decision to lower deposit rates to continue our balance sheet reduction.
Interest expense on money market accounts decreased $5.8 million to $9.2 million for the year ended December 31, 2014 as compared to $15.0 million for the year ended December 31, 2013. This decrease was also due to a decrease in the average balance of money market accounts of $1.24 billion to $4.66 billion for 2014 as compared to $5.90 billion for 2013. This decrease was also due to a decrease in the weighted-average cost of 5 basis points to 0.20% for 2014 compared with 0.25% for 2013.
80
Table of Contents
Interest expense on our interest-bearing transaction accounts decreased $1.2 million to $6.0 million for 2014 from $7.2 million for 2013. The decrease is due to a 4 basis point decrease in the weighted-average cost to 0.28%. The decrease was also the result of a decrease in the average balance of interest-bearing transaction accounts of $82.1 million to $2.15 billion for 2014 as compared to $2.23 billion for 2013.
The decrease in the weighted-average cost of deposits for 2014 reflected lower market interest rates and our decision to maintain lower deposit rates to continue our balance sheet reduction.
Interest expense on borrowed funds was substantially unchanged at $566.4 million for 2014 as compared to $566.3 million for 2013. The average cost of borrowed funds was 4.65% for both 2014 and 2013. The average balance of borrowings was unchanged for both comparative periods.
Net Interest Income. Net interest income decreased $170.4 million, or 27.8%, to $442.1 million for the year ended December 31, 2014 as compared to $612.5 million for the year ended December 31, 2013 reflecting the overall decrease in the average balance of interest-earning assets and interest-bearing liabilities, the continued low interest rate environment and a continued increase in the average balance of short-term liquid assets, including U.S. Treasury securities and Federal funds sold and other overnight deposits. Our interest rate spread decreased 42 basis points to 0.90% for 2014 as compared to 1.32% for 2013. Our net interest margin decreased 39 basis points to 1.20% for 2014 as compared to 1.59% for 2013.
The decreases in our interest rate spread and net interest margin during 2014 as compared to 2013 are primarily due to repayments of higher yielding assets due to the low interest rate environment. The decrease in the weighted average yield of interest-earning assets was due to lower market interest rates earned on mortgage-related assets. The decrease was also due to a $2.27 billion increase in the average balance of Federal funds sold and other overnight deposits to $5.20 billion with an average yield of 0.25% and an increase of $920.3 million in investment securities to $1.34 billion with a weighted-average yield of 0.64% during 2014 all of which caused our average yield on interest earning assets to decline while the average cost of interest bearing liabilities rose slightly. The continued compression of our net interest margin and the reduction in the size of our balance sheet are likely to result in a decline in our net interest income in future periods.
Provision for Loan Losses. We recorded a net credit provision for loan losses of $3.5 million for 2014 as compared to a provision for loan losses of $36.5 million for 2013. The ALL amounted to $235.3 million and $276.1 million at December 31, 2014 and 2013, respectively. The net credit provision for loan losses in 2014 was primarily due to a decrease in the amount of total delinquent loans, which was largely the result of the sale of the pool of non-performing FHA loans, along with improving home prices and economic conditions and a decrease in the size of the loan portfolio. See “Critical Accounting Policies – Allowance for Loan Losses.”
During 2014, we sold a pool of $112.1 million of non-performing residential mortgage loans guaranteed by the FHA back to the financial institution that originally sold the loans to the Bank. The sale of the non-performing loan pool was in accordance with the repurchase right with respect to loans that become non-performing that the financial institution exercised pursuant to the terms of the original sale and servicing agreement between the Bank and the financial institution. As consideration for the sale of the non-performing loans, the Bank received from the financial institution an amount equal to 100% of the outstanding unpaid principal balance of the loans, plus all accrued and unpaid interest on the loans. The Bank may sell additional loans to the financial institution in the future, in the event the financial institution exercises its repurchase right with respect to any additional non-performing FHA loans.
Our primary lending emphasis is the origination and purchase of one- to four-family first mortgage loans on residential properties and, to a lesser extent, second mortgage loans on one- to four-family residential properties. Our loan growth is primarily concentrated in one- to four-family mortgage loans with original LTV ratios of less than 80%. The average LTV ratio of our 2014 first mortgage loan originations and our total first mortgage loan portfolio were 61% and 56%, respectively, using the appraised value at the time of origination. The value of the property used as collateral for our loans is dependent upon local market conditions. As part of our
81
Table of Contents
estimation of the ALL, we monitor changes in the values of homes in each market using indices published by various organizations. Based on our analysis of the data for the fourth quarter of 2014, we concluded that home values in our primary lending markets have increased approximately 1.5% since the fourth quarter of 2013.
Economic conditions in our primary market area continued to improve modestly during 2014 as evidenced by increased levels of home sale activity, higher real estate valuations and a decrease in the unemployment rate. We continue to closely monitor the local and national real estate markets and other factors related to risks inherent in our loan portfolio.
Non-performing loans amounted to $852.0 million at December 31, 2014 as compared to $1.05 billion at December 31, 2013. Non-performing loans at December 31, 2014 included $841.7 million of one- to four-family first mortgage loans as compared to $1.04 billion at December 31, 2013. Had we not sold the pool of $112.1 million of non-performing residential mortgage during 2014 (and assuming no other repayment or resolutions of such loans occurred), non-performing loans at December 31, 2014 would have amounted to $964.1 million. The ratio of non-performing loans to total loans was 3.95% at December 31, 2014 compared to 4.35% at December 31, 2013. Loans delinquent 30 to 59 days amounted to $278.5 million at December 31, 2014 as compared to $311.9 million at December 31, 2013. Loans delinquent 60 to 89 days amounted to $129.1 million at December 31, 2014 as compared to $161.5 million at December 31, 2013. Accordingly, total early stage delinquencies (loans 30 to 89 days past due) decreased $65.8 million to $407.6 million at December 31, 2014 from $473.4 million at December 31, 2013. Foreclosed real estate amounted to $80.0 million at December 31, 2014 as compared to $70.4 million at December 31, 2013. As a result of our underwriting policies, our borrowers typically have a significant amount of equity, at the time of origination, in the underlying real estate that we use as collateral for our loans. Due to the ability of real estate values to fluctuate, the LTV ratios based on appraisals obtained at time of origination do not necessarily indicate the extent to which we may incur a loss on any given loan that may go into foreclosure.
At December 31, 2014, the ratio of the ALL to non-performing loans was 27.62% as compared to 26.31% at December 31, 2013. The ratio of the ALL to total loans was 1.09% at December 31, 2014 as compared to 1.15% at December 31, 2013. Changes in the ratio of the ALL to non-performing loans is not, absent other factors, an indication of the adequacy of the ALL since there is not necessarily a direct relationship between changes in various asset quality ratios and changes in the ALL, non-performing loans and losses we may incur on our loan portfolio. A loan generally becomes non-performing when the borrower experiences financial difficulty. In many cases, the borrower also has a second mortgage or home equity loan on the property. In substantially all of these cases, we do not hold the second mortgage or home equity loan as this is not a business we have actively pursued.
We obtain updated collateral values by the time a loan becomes 180 days past due and then annually thereafter. If the estimated fair value of the collateral (less estimated selling costs) is less than the recorded investment in the loan, we charge-off an amount to reduce the loan to the fair value of the collateral less estimated selling costs. As a result, certain losses inherent in our non-performing loans are being recognized as charge-offs which may result in a lower ratio of the ALL to non-performing loans. Charge-offs, net of recoveries, amounted to $37.3 million for 2014 as compared to $62.8 million for 2013. Write-downs and net gains or losses on the sale of foreclosed real estate amounted to a net gain of $3.2 million for 2014 as compared to a net gain of $1.7 million during 2013. The results of our reappraisal process, our recent charge-off history and our loss experience related to the sale of foreclosed real estate are considered in the determination of the ALL. Our loss experience on the sale of foreclosed real estate was 18% for 2014 as compared to 18% for 2013.
As part of our estimation of the ALL, we monitor changes in the values of homes in each market using indices published by various organizations including the FHFA and Case Shiller. Our AQC uses these indices and a stratification of our loan portfolio by state as part of its quarterly determination of the ALL. We do not apply different loss factors based on geographic locations since, at December 31, 2014, 84.8% of our loan portfolio and 78.2% of our non-performing loans were located in the New York metropolitan
82
Table of Contents
area. We generally obtain updated collateral values by the time a loan becomes 180 days past due and annually thereafter, which we believe identifies potential charge-offs more accurately than a house price index that is based on a wide geographic area and includes many different types of houses. However, we use house price indices to identify geographic trends in housing markets to determine if an overall adjustment to the ALL is required based on loans we have in those geographic areas and to determine if changes in the loss factors used in the ALL quantitative analysis are necessary. Our quantitative analysis of the ALL accounts for increases in non-performing loans by applying progressively higher risk factors to loans as they become more delinquent.
Due to the nature of our loan portfolio, our evaluation of the adequacy of our ALL is performed primarily on a “pooled” basis. Each quarter we prepare an analysis which categorizes the entire loan portfolio by certain risk characteristics such as loan type (fixed and variable one- to four-family, interest-only, reduced documentation, multi-family, commercial, construction, etc.), loan source (originated or purchased) and payment status (i.e., current or number of days delinquent). Loans with known losses are categorized separately. We assign estimated loss factors to the payment status categories on the basis of our assessment of the risk inherent in each loan type. These factors are periodically reviewed for appropriateness giving consideration to our loss experience, delinquency trends, portfolio growth and environmental factors such as the status of the regional economy and housing market, in order to ascertain that the loss factors cover probable and estimable losses inherent in the portfolio. We define our loss experience on non-performing loans as the ratio of the excess of the loan balance (including selling costs) over the updated collateral value to the principal balance of loans for which we have updated valuations. We obtain updated collateral values by the time a loan becomes 180 days past due and on an annual basis thereafter for as long as the loan remains non-performing. Based on our analysis, our loss experience on our non-performing one- to four-family first mortgage loans was approximately 12.1% during 2014 as compared to 13.6% during 2013. Our loss experience analysis excludes the effect of the sale of FHA loans.
In addition to our loss experience, we also use environmental factors and qualitative analyses to determine the adequacy of our ALL. This analysis includes further evaluation of economic factors, such as trends in the unemployment rate, as well as a ratio analysis to evaluate the overall measurement of the ALL, a review of delinquency ratios, net charge-off ratios and the ratio of the ALL to both non-performing loans and total loans. The qualitative review is used to reassess the overall determination of the ALL and to ensure that directional changes in the ALL and the provision for loan losses are supported by relevant internal and external data.
We consider the average LTV ratio of our non-performing loans and our total portfolio in relation to the overall changes in house prices in our lending markets when determining the ALL. This provides us with a “macro” indication of the severity of potential losses that might be expected. Since substantially all our portfolio consists of first mortgage loans on residential properties, the LTV ratio is particularly important to us when a loan becomes non-performing. The weighted average LTV ratio in our one- to four-family mortgage loan portfolio at December 31, 2014 was approximately 56%, using appraised values at the time of origination. The average LTV ratio of our non-performing loans was approximately 68% at December 31, 2014. Based on the valuation indices, house prices have declined in the New York metropolitan area, where 78% of our non-performing loans were located at December 31, 2014, by approximately 18.7% from the peak of the market in 2006 through November 2014 and by 16.0% nationwide during that period. During 2014, home prices increased 1.5% in the New York metropolitan area and increased 4.3% nationwide. Changes in house values may affect our loss experience which may require that we change the loss factors used in our quantitative analysis of the ALL. There can be no assurance whether significant further declines in house values may occur and result in higher loss experience and increased levels of charge-offs and loan loss provisions.
Net charge-offs amounted to $37.3 million for 2014 as compared to net charge-offs of $62.8 million for 2013. Net charge-offs as a percentage of average loans was 0.16% for 2014 as compared to 0.25% for 2013.
83
Table of Contents
Due to the unprecedented level of foreclosures and the desire by many states to slow the foreclosure process, we continue to experience a time frame to repayment or foreclosure of up to 48 months from the initial non-performing period. These delays have impacted our level of non-performing loans as these loans take longer to migrate to real estate owned and ultimate disposition. In addition, the highly publicized foreclosure issues that have affected the nation’s largest mortgage loan servicers has resulted in greater court and state attorney general scrutiny, and the time to complete a foreclosure continues to be prolonged as we continue to experience a time frame to repayment or foreclosure of up to 48 months from the initial non-performing period, especially in New York and New Jersey where 70.4% of our non-performing loans are located. However, since 2013, we have experienced an increased volume of completed foreclosures for loans that have been in the foreclosure process for over 48 months. If real estate prices do not continue to improve or begin to decline, this extended time may result in further charge-offs. In addition, current conditions in the housing market have made it more difficult for borrowers to sell homes to satisfy the mortgage and second lien holders and are less likely to repay our loan if the value of the property is not enough to satisfy their loan. We continue to closely monitor the property values underlying our non-performing loans during this timeframe and take appropriate charge-offs when the loan balances exceed the underlying property values.
Commercial and construction loans evaluated for impairment in accordance with Financial Accounting Standards Board (“FASB”) guidance amounted to $5.8 million and $8.7 million at December 31, 2014 and 2013, respectively. Based on this evaluation, we established an ALL of $126,000 for commercial and construction loans classified as impaired at December 31, 2014 compared to $527,000 at December 31, 2013. Charge-offs related to these loans amounted to $2.5 million in 2014. There were no charge-offs related to these loans in 2013.
Although we believe that we have established and maintained the ALL at adequate levels, additions may be necessary if future economic and other conditions differ substantially from the current operating environment. Changes in our loss experience on non-performing loans, the loss factors used in our quantitative analysis of the ALL and continued increases in overall loan delinquencies can have a significant impact on our need for increased levels of loan loss provisions in the future. Although we use the best information available, the level of the ALL remains an estimate that is subject to significant judgment and short-term change. See “Critical Accounting Policies.”
Non-Interest Income. Total non-interest income was $110.4 million for 2014 as compared to $39.1 million for 2013. Included in non-interest income for the year ended December 31, 2014 were $103.7 million in gains from the sale of $3.31 billion of mortgage-backed securities. Gains on the sales of securities amounted to $28.9 million for the year ended December 31, 2013.
Non-Interest Expense. Total non-interest expense amounted to $293.0 million for the year ended December 31, 2014 as compared to $309.8 million for the year ended December 31, 2013. This decrease was due primarily to a $23.7 million decrease in FDIC assessments and a $3.4 million decrease in compensation and employee benefit costs. These decreases were partially offset by a $9.5 million increase in other non-interest expense.
For the year ended December 31, 2014 Federal deposit insurance expense decreased $23.7 million, or 32.2%, to $49.8 million from $73.5 million for the year ended December 31, 2013. This decrease was due primarily to a reduction in the size of our balance sheet and a decrease in our assessment rate.
Compensation and employee benefit costs decreased $3.4 million to $129.3 million for the year ended December 31, 2014 as compared to $132.7 million for the year ended December 31, 2013. The decrease in compensation and employee benefit costs is primarily due to decreases of $6.1 million in compensation expense and $5.3 million in pension plan expense. The decrease in compensation expense is primarily due to a decrease in incentive plan expense during 2014. The decrease in pension plan expense was due to a change in the discount rate resulting in lower net periodic benefit cost during 2014. Net periodic benefit cost was $1.8 million for 2014 as compared to $7.1 million for 2013. The decreases were partially offset by increases of $4.1 million in medical
84
Table of Contents
plan expenses and $3.4 million in stock benefit plan expense. At December 31, 2014, we had 1,507 full-time equivalent employees as compared to 1,520 at December 31, 2013.
Other non-interest expense increased $9.5 million to $76.4 million for the year ended December 31, 2014 as compared to $66.9 million for 2013. This increase was due primarily to a $3.0 million increase in the valuation allowance related to the Lehman Brothers, Inc. liquidation, a $4.1 million increase in foreclosed real estate expense and a $3.9 million increase in professional fees. The increase in foreclosed real estate expense was due to an increase in the number of foreclosed properties owned by the Bank. These increases were partially offset by a $1.5 million increase in the net gain on the sale of foreclosed properties.
The increase in professional fees is due primarily to fees related to the use of consultants to assist the Company in preparing its capital stress tests and capital plan as well as the use of consultants to supplement staffing during the pendency of the Merger.
Included in other non-interest expense were net gains of $3.2 million resulting from foreclosed real estate transactions for the year ended December 31, 2014 as compared to a net gain of $1.7 million for the comparable period in 2013. We sold 241 properties during 2014 as compared to 207 properties for the same period in 2013. Expenses associated with foreclosed real estate were $18.6 million and $14.5 million for the years ended December 31, 2014 and 2013, respectively.
For the year ended December 31, 2014, our efficiency ratio was 52.37% compared with 47.44% for the year ended December 31, 2013. For the calculation of the efficiency ratio, see the “Calculation of Efficiency Ratio and Book Value Ratios” in Item 6 “Selected Financial Data.” Our ratio of non-interest expense to average total assets was 0.78% for both the year ended December 31, 2014 and 2013.
Income Taxes. Income tax expense amounted to $105.0 million for 2014 compared with income tax expense of $120.0 million for 2013. Our effective tax rate for 2014 was 39.94% compared with 39.33% for 2013.
On March 31, 2014, New York tax legislation was signed into law in connection with the approval of the New York State 2014-2015 budget that will generally become effective on January 1, 2015. Portions of the new legislation will result in significant changes in the method of calculation of income taxes for banks and thrifts operating in New York State, including changes to (1) future period tax rates and (2) rules related to the sourcing of revenue. At this time, we expect the changes to the New York tax code will cause our effective tax rate to increase. The amount of such increase will depend on the amount of revenues that are sourced to New York State under the new legislation, which can be expected to fluctuate over time. The changes in the tax code had an immaterial effect on the carrying value of the Company’s net deferred tax asset at March 31, 2014 (the date the legislation was signed into law).
Comparison of Operating Results for the Years Ended December 31, 2013 and 2012
General. Net income was $185.2 million for 2013, a decrease of $63.9 million, or 25.6%, compared with a net income of $249.1 million for 2012. Basic and diluted earnings per common share were both $0.37 for 2013 as compared to basic and diluted earnings per share of $0.50 for 2012. For 2013, our return on average shareholders’ equity was 3.91%, compared with 5.35% for 2012. Our return on average assets for 2013 was 0.47% as compared to 0.58% for 2012. The decrease in our return on average assets and equity was due primarily to the decrease in net income in 2013.
Interest and Dividend Income. Total interest and dividend income for the year ended December 31, 2013 decreased $311.9 million, or 18.6%, to $1.36 billion from $1.67 billion for the year ended December 31, 2012. The decrease in total interest and dividend income was primarily due to a $2.79 billion, or 6.7%, decrease in the average balance of total interest-earning assets to $38.64
85
Table of Contents
billion for the year ended December 31, 2013 from $41.43 billion for the year ended December 31, 2012. The decrease in total interest and dividend income was also due to a decrease of 52 basis points in the weighted-average yield on total interest-earning assets to 3.52% for 2013 from 4.04% for 2012.
For the year ended December 31, 2013, interest on first mortgage loans decreased $205.7 million, or 15.7%, to $1.10 billion from $1.31 billion for the year ended December 31, 2012. This was primarily due to a $2.76 billion decrease in the average balance of first mortgage loans to $24.92 billion for the year ended December 31, 2013 from $27.68 billion for the year ended December 31, 2012. The decrease in interest income on mortgage loans was also due to a 30 basis point decrease in the weighted-average yield to 4.43% for the year ended December 31, 2013 from 4.73% for the year ended December 31, 2012.
The decrease in the average yield earned on first mortgage loans during the year ended December 31, 2013 was due to the continued refinancing of mortgage loans with higher yields and the rates on mortgage loans originated and purchased during 2013 which were below the average yield on our portfolio, which reflected the continuation of low market rates. Consequently, the average yield on our loan portfolio continued to decline during 2013. Refinancing activity, which resulted in continued elevated levels of loan repayments, also caused the average balance of our first mortgage loans to decline for those same periods as our loan production decreased reflecting our low appetite for adding long-term fixed-rate mortgage loans in the current low interest rate environment.
Interest on consumer and other loans decreased $2.8 million to $10.1 million for 2013 from $12.9 million for 2012. The average balance of consumer and other loans decreased $41.5 million to $228.7 million for 2013 as compared to $270.2 million for 2012 and the average yield earned decreased 36 basis points to 4.41% as compared to 4.77% for the same respective periods. The average balance of consumer loans decreased as consumer loans is not a business that we actively pursue. The decrease in the weighted-average yield was a result of current market interest rates.
Interest on mortgage-backed securities decreased $97.5 million to $216.5 million for the year ended December 31, 2013 from $314.0 million for the year ended December 31, 2012. This decrease was due primarily to a $2.24 billion decrease in the average balance of mortgage-backed securities to $9.79 billion for 2013 from $12.03 billion for 2012. The decrease in interest income on mortgage-backed securities was also due to a 40 basis point decrease in the weighted-average yield to 2.21% for 2013 from 2.61% for 2012. The decrease in the average yield earned on mortgage-backed securities during 2013 was a result of principal repayments on securities that have higher yields than the existing portfolio as well as the re-pricing of variable rate mortgage-backed securities in this continued low interest rate environment. The decrease in the average balance of mortgage-backed securities during 2013 was due primarily to elevated levels of principal repayments in the current low interest rate environment.
For the year ended December 31, 2013, interest on investment securities decreased $3.0 million to $8.6 million from $11.6 million for the year ended December 31, 2012. This decrease was due to a 63 basis point decrease in the weighted-average yield to 2.08% for 2013 from 2.71% for 2012. The decrease in the average yield earned reflected the current market interest rates. This decrease was also due to a $14.3 million decrease in the average balance of investment securities to $415.2 million for 2013 from $429.5 million for 2012. The decrease in the average balance of investment securities was due to the sale of corporate bonds with an amortized cost of $405.7 million partially offset by the purchase of $298.0 million of GSE securities.
Dividends on FHLB stock decreased $8.8 million, or 37.4%, to $14.7 million for the year ended December 31, 2013 from $23.5 million for the year ended December 31, 2012. The decrease was primarily due to a 132 basis point decrease in the average dividend yield earned to 4.20% for 2013 from 5.52% for 2012. In addition, there was a $76.0 million decrease in the average balance of FHLB stock to $349.6 million for 2013 as compared to $425.6 million for 2012. As part of the membership requirements of the FHLB, we
86
Table of Contents
are required to hold a certain dollar amount of FHLB common stock based on our mortgage-related assets and borrowings from the FHLB. The decrease in the average balance of FHLB stock was due primarily to mandatory redemptions of stock due to a decrease in the amount of borrowings outstanding with the FHLB.
Interest on Federal funds sold and other overnight deposits amounted to $7.4 million for the year ended December 31, 2013 as compared to $1.4 million for the year ended December 31, 2012. The average balance of Federal funds sold and other overnight deposits amounted to $2.93 billion for 2013 as compared to $591.1 million for 2012. The yield earned on Federal funds and other overnight deposits was 0.25% for 2013 and 0.24% for 2012. The increase in the average balance of Federal funds sold and other overnight deposits for the year ended December 31, 2013 was due primarily to the elevated levels of repayments on mortgage-related assets and the lack of attractive reinvestment opportunities due to low market interest rates as available short term reinvestment opportunities continued to carry low yields, and medium and longer term opportunities were creating more significant duration risk at relatively low yields.
Interest Expense. Total interest expense for the year ended December 31, 2013 decreased $70.4 million, or 8.6%, to $748.7 million from $819.1 million for the year ended December 31, 2012. This decrease was primarily due to a $3.34 billion, or 8.9%, decrease in the average balance of total interest-bearing liabilities to $34.08 billion for the year ended December 31, 2013 compared with $37.42 billion for the year ended December 31, 2012. The weighted-average cost of total interest-bearing liabilities was 2.20% for the year ended December 31, 2013 as compared to 2.19% for the year ended December 31, 2012. The decrease in the average balance of total interest-bearing liabilities was due to a $1.93 billion decrease in the average balance of total deposits and a $1.39 billion decrease in the average balance of borrowings.
Interest expense on our time deposit accounts decreased $31.0 million to $158.3 million for 2013 from $189.3 million for 2012. The decrease in interest on time deposit accounts was due to a 19 basis point decrease in the weighted-average cost to 1.24% for 2013 compared with 1.43% for 2012 as maturing time deposits were renewed or replaced by new time deposits at lower rates. This decrease was also due to a $427.2 million decrease in the average balance of time deposit accounts to $12.80 billion for 2013 from $13.22 billion for 2012. The decline in the average balance of our time deposit accounts also reflected our decision to lower deposit rates to continue our balance sheet reduction.
Interest expense on money market accounts decreased $20.1 million to $15.0 million for 2013 as compared to $35.1 million for 2012. This decrease was due to a decrease in the weighted-average cost of 22 basis points to 0.25% for 2013 compared with 0.47% for 2012. This decrease was also due to a decrease in the average balance of money market accounts of $1.63 billion to $5.90 billion for 2013 as compared to $7.53 billion for 2012. Interest expense on our interest-bearing transaction accounts decreased $4.4 million to $7.2 million for 2013 from $11.6 million for 2012. The decrease was due to a 21 basis point decrease in the weighted-average cost to 0.32%, partially offset by a $51.2 million increase in the average balance to $2.23 billion for 2013 as compared to $2.18 billion for 2012.
The decrease in the average cost of deposits for 2013 reflected lower market interest rates and our decision to maintain lower deposit rates to continue our balance sheet reduction.
For the year ended December 31, 2013, interest expense on borrowed funds decreased $14.1 million to $566.3 million from $580.4 million for the year ended December 31, 2012. This decrease was due to a $1.39 billion decrease in the average balance of borrowed funds to $12.18 billion for 2013 from $13.57 billion for 2012. This decrease was partially offset by a 37 basis point increase in the weighted-average cost of borrowed funds to 4.65% for 2013 as compared to 4.28% for 2012. The decrease in the average balance of borrowings was due primarily to the maturity of $3.45 billion of borrowings during 2012, including $3.0 billion of short-term borrowings which were not replaced with new borrowings. These short-term borrowings had considerably lower interest rates than the remaining borrowings and, consequently, as the borrowings matured, the overall weighted average cost of the remaining borrowings increased.
87
Table of Contents
Borrowings amounted to $12.18 billion at December 31, 2013 with an average cost of 4.65%.
At December 31, 2013, we had $6.40 billion of borrowings with put dates within one year.
Net Interest Income. Net interest income decreased $241.4 million, or 28.3%, to $612.5 million for 2013 from $853.9 million for 2012. Our interest rate spread decreased 53 basis points to 1.32% for 2013 as compared to 1.85% for 2012. Our net interest margin decreased 47 basis points to 1.59% for 2013 as compared to 2.06% for 2012. The decrease in our interest rate spread and net interest margin for 2013 is primarily due to repayments of higher yielding assets due to the low interest rate environment and an increase in the average balance of Federal funds sold and other overnight deposits which yielded 0.25% during 2013.
Provision for Loan Losses. The provision for loan losses amounted to $36.5 million for 2013 as compared to $95.0 million for 2012. The ALL amounted to $276.1 million and $302.3 million at December 31, 2013 and 2012, respectively. The decrease in our provision for loan losses was due primarily to improving economic conditions, increasing home prices and unemployment rates, a decrease in the size of the loan portfolio, a decrease in net charge-offs and a decrease in the amount of total delinquent loans. We recorded our provision for loan losses during 2013 based on our ALL methodology that considers a number of quantitative and qualitative factors, including the amount of non-performing loans, the loss experience of our non-performing loans, recent collateral valuations, conditions in the real estate and housing markets, current economic conditions, particularly continued elevated levels of unemployment, and growth or shrinkage in the loan portfolio.
Our primary lending emphasis is the origination and purchase of one- to four-family first mortgage loans on residential properties and, to a lesser extent, second mortgage loans on one- to four-family residential properties. Our loan growth is primarily concentrated in one- to four-family mortgage loans with original LTV ratios of less than 80%. The average LTV ratio of our 2013 first mortgage loan originations and our total first mortgage loan portfolio were 58.4% and 58.9%, respectively, using the appraised value at the time of origination. The value of the property used as collateral for our loans is dependent upon local market conditions. As part of our estimation of the ALL, we monitor changes in the values of homes in each market using indices published by various organizations. Based on our analysis of the data for the fourth quarter of 2013, we concluded that home values in our primary lending markets have increased approximately 5% since the fourth quarter of 2012.
Economic conditions in our primary market area continued to improve modestly during 2013 as evidenced by increased levels of home sale activity, higher real estate valuations and a decrease in the unemployment rate which, while improving, remains at elevated levels.
Non-performing loans amounted to $1.05 billion at December 31, 2013 as compared to $1.16 billion at December 31, 2012. Non-performing loans at December 31, 2013 included $1.04 billion of one- to four-family first mortgage loans as compared to $1.15 billion at December 31, 2012. The ratio of non-performing loans to total loans was 4.35% at December 31, 2013 compared to 4.29% at December 31, 2012. Loans delinquent 30 to 59 days amounted to $311.9 million at December 31, 2013 as compared to $393.8 million at December 31, 2012. Loans delinquent 60 to 89 days amounted to $161.5 million at December 31, 2013 as compared to $239.3 million at December 31, 2012. Accordingly, total early stage delinquencies (loans 30 to 89 days past due) decreased $159.7 million to $473.4 million at December 31, 2013 from $633.1 million at December 31, 2012. Foreclosed real estate amounted to $70.4 million at December 31, 2013 as compared to $47.3 million at December 31, 2012. As a result of our underwriting policies, our borrowers typically have a significant amount of equity, at the time of origination, in the underlying real estate that we use as collateral for our loans. Due to the steady deterioration of real estate values in recent years, the LTV ratios based on appraisals obtained at time of origination do not necessarily indicate the extent to which we may incur a loss on any given loan that may go into foreclosure.
88
Table of Contents
At December 31, 2013, the ratio of the ALL to non-performing loans was 26.31% as compared to 26.01% at December 31, 2012. The ratio of the ALL to total loans was 1.15% at December 31, 2013 as compared to 1.12% at December 31, 2012. Changes in the ratio of the ALL to non-performing loans is not, absent other factors, an indication of the adequacy of the ALL since there is not necessarily a direct relationship between changes in various asset quality ratios and changes in the ALL, non-performing loans and losses we may incur on our loan portfolio. In the current economic environment, a loan generally becomes non-performing when the borrower experiences financial difficulty. In many cases, the borrower also has a second mortgage or home equity loan on the property. In substantially all of these cases, we do not hold the second mortgage or home equity loan as this is not a business we have actively pursued.
We obtain updated collateral values by the time a loan becomes 180 days past due. If the estimated fair value of the collateral (less estimated selling costs) is less than the recorded investment in the loan, we charge-off an amount to reduce the loan to the fair value of the collateral less estimated selling costs. As a result, certain losses inherent in our non-performing loans are being recognized as charge-offs which may result in a lower ratio of the ALL to non-performing loans. Charge-offs, net of recoveries, amounted to $62.8 million for 2013 as compared to $66.4 million for 2012. Write-downs and net gains or losses on the sale of foreclosed real estate amounted to a net gain of $1.7 million for 2013 as compared to a net loss of $1.9 million during 2012. The results of our reappraisal process, our recent charge-off history and our loss experience related to the sale of foreclosed real estate are considered in the determination of the ALL. Our loss experience on the sale of foreclosed real estate was 18% for 2013 as compared to 26% for 2012.
As part of our estimation of the ALL, we monitor changes in the values of homes in each market using indices published by various organizations including the FHFA and Case Shiller. Our AQC uses these indices and a stratification of our loan portfolio by state as part of its quarterly determination of the ALL. We do not apply different loss factors based on geographic locations since, at December 31, 2013, 84.5% of our loan portfolio and 76.3% of our non-performing loans were located in the New York metropolitan area. We generally obtain updated collateral values by the time a loan becomes 180 days past due and annually thereafter, which we believe identifies potential charge-offs more accurately than a house price index that is based on a wide geographic area and includes many different types of houses. However, we use house price indices to identify geographic trends in housing markets to determine if an overall adjustment to the ALL is required based on loans we have in those geographic areas and to determine if changes in the loss factors used in the ALL quantitative analysis are necessary. Our quantitative analysis of the ALL accounts for increases in non-performing loans by applying progressively higher risk factors to loans as they become more delinquent.
Due to the nature of our loan portfolio, our evaluation of the adequacy of our ALL is performed primarily on a “pooled” basis. Each quarter we prepare an analysis which categorizes the entire loan portfolio by certain risk characteristics such as loan type (fixed and variable one- to four-family, interest-only, reduced documentation, multi-family, commercial, construction, etc.), loan source (originated or purchased) and payment status (i.e., current or number of days delinquent). Loans with known losses are categorized separately. We assign estimated loss factors to the payment status categories on the basis of our assessment of the risk inherent in each loan type. These factors are periodically reviewed for appropriateness giving consideration to our loss experience, delinquency trends, portfolio growth and environmental factors such as the status of the regional economy and housing market, in order to ascertain that the loss factors cover probable and estimable losses inherent in the portfolio. We define our loss experience on non-performing loans as the ratio of the excess of the loan balance (including selling costs) over the updated collateral value to the principal balance of loans for which we have updated valuations. We obtain updated collateral values by the time a loan becomes 180 days past due and on an annual basis thereafter for as long as the loan remains non-performing. Based on our analysis, our loss experience on our non-performing one- to four-family first mortgage loans was approximately 13.6% during 2013 as compared to 14.3% during 2012.
89
Table of Contents
In addition to our loss experience, we also use environmental factors and qualitative analyses to determine the adequacy of our ALL. This analysis includes further evaluation of economic factors, such as trends in the unemployment rate, as well as a ratio analysis to evaluate the overall measurement of the ALL, a review of delinquency ratios, net charge-off ratios and the ratio of the ALL to both non-performing loans and total loans. The qualitative review is used to reassess the overall determination of the ALL and to ensure that directional changes in the ALL and the provision for loan losses are supported by relevant internal and external data. Based on our recent loss experience on non-performing loans and the sale of foreclosed real estate as well as our consideration of environmental factors, we changed certain loss factors used in our quantitative analysis of the ALL for our one- to four- family first mortgage loans during 2013. The recent adjustment to our loss factors did not have a material effect on the ultimate level of our ALL or on our provision for loan losses. If our future loss experience requires additional increases in our loss factors, this may result in increased levels of loan loss provisions.
We consider the average LTV ratio of our non-performing loans and our total portfolio in relation to the overall changes in house prices in our lending markets when determining the ALL. This provides us with a “macro” indication of the severity of potential losses that might be expected. Since substantially all our portfolio consists of first mortgage loans on residential properties, the LTV ratio is particularly important to us when a loan becomes non-performing. The weighted average LTV ratio in our one- to four-family mortgage loan portfolio at December 31, 2013 was approximately 58.9%, using appraised values at the time of origination. The average LTV ratio of our non-performing loans was approximately 75.2% at December 31, 2013. Based on the valuation indices, house prices have declined in the New York metropolitan area, where 76.3% of our non-performing loans were located at December 31, 2013, by approximately 21% from the peak of the market in 2006 through October 2013 and by 21% nationwide during that period. During 2013, home prices increased 5% in the New York metropolitan area and increased 14% nationwide. Changes in house values may affect our loss experience which may require that we change the loss factors used in our quantitative analysis of the ALL. There can be no assurance whether significant further declines in house values may occur and result in higher loss experience and increased levels of charge-offs and loan loss provisions.
Net charge-offs amounted to $62.8 million for 2013 as compared to net charge-offs of $66.4 million for 2012. Net charge-offs as a percentage of average loans was 0.25% for 2013 as compared to 0.24% for 2012. Our charge-offs on non-performing loans have historically been low due to the amount of underlying equity in the properties collateralizing our first mortgage loans. Until the recent recessionary cycle, it was our experience that as a non-performing loan approached foreclosure, the borrower sold the underlying property or, if there was a second mortgage or other subordinated lien, the subordinated lien holder would purchase the property to protect their interest thereby resulting in the full payment of principal and interest to Hudson City Savings.
Due to the unprecedented level of foreclosures and the desire by many states to slow the foreclosure process, we continued to experience a time frame to repayment or foreclosure of up to 48 months from the initial non-performing period. These delays impacted our level of non-performing loans as these loans take longer to migrate to real estate owned and ultimate disposition. In addition, the highly publicized foreclosure issues that have affected the nation’s largest mortgage loan servicers has resulted in greater court and state attorney general scrutiny, and the time to complete a foreclosure continues to be prolonged, especially in New York and New Jersey. However, since 2013, we have experienced an increased volume of completed foreclosures for loans that have been in the foreclosure process for over 48 months.
At December 31, 2013 and December 31, 2012, commercial and construction loans evaluated for impairment in accordance with Financial Accounting Standards Board (“FASB”) guidance amounted to $8.7 million and $13.4 million, respectively. Based on this evaluation, we established an ALL of $527,000 for loans classified as impaired at December 31, 2013 compared to $1.6 million at December 31, 2012. There were no charge-offs related to these loans in 2013 compared to $873,000 of charge-offs in 2012.
Non-Interest Income. Total non-interest income was $39.1 million for the year ended December 31, 2013 as compared to $11.5 million for the same period in 2012. Included in non-interest income for 2013 was a $7.2 million gain on the sale of corporate bonds with an amortized cost of $405.7 million and a $21.7 million gain on the sale of $316.2 million of mortgage-backed securities. The remainder of non-interest income for 2013 is primarily made up of service fees and charges on deposit and loan accounts. There were no securities sales for the year ended December 31, 2012.
90
Table of Contents
Non-Interest Expense. Total non-interest expense amounted to $309.8 million for the year ended December 31, 2013 as compared to $356.6 million for the year ended December 31, 2012. This decrease was due to a $50.2 million decrease in Federal deposit insurance expense and a $2.1 million decrease in other non-interest expense partially offset by a $3.1 million increase in compensation and benefits and a $2.5 million increase in net occupancy costs.
Compensation and employee benefit costs increased $3.1 million, or 2.4%, to $132.7 million for 2013 as compared to $129.6 million for 2012. The increase in compensation costs is primarily due to increases of $2.7 million in stock benefit plan expense and $655,000 in compensation costs. The increase in compensation costs was due to normal salary increases and payments related to employee departures offset by the decline in full-time equivalent employees. At December 31, 2013, we had 1,520 full-time equivalent employees as compared to 1,622 at December 31, 2012.
For the year ended December 31, 2013 Federal deposit insurance expense decreased $50.2 million, or 40.6%, to $73.5 million from $123.7 million for the year ended December 31, 2012. This decrease was due primarily to a reduction in the size of our balance sheet and a decrease in our assessment rate.
Included in other non-interest expense were write-downs on foreclosed real estate and net gains on the sale of foreclosed real estate which amounted to a net gain of $1.7 million for the year ended December 31, 2013 as compared to a net loss of $1.9 million for the comparable period in 2012. We sold 207 properties during 2013 as compared to 191 properties during 2012. Also included in other non-interest expense were holding costs associated with foreclosed real estate which amounted to $14.5 million and $8.3 million for the years ended December 31, 2013 and 2012, respectively.
For the year ended December 31, 2013, our efficiency ratio was 47.44% compared with 40.50% for the year ended December 31, 2012. The calculation of the efficiency ratio is on page 70. Our ratio of non-interest expense to average total assets for the year ended December 31, 2013 was 0.78% compared with 0.83% for the corresponding period in 2012.
Income Taxes. Income tax expense amounted to $120.0 million for 2013 compared with income tax expense of $164.6 million for 2012. Our effective tax rate for 2013 was 39.33% compared with 39.79% for 2012.
91
Table of Contents
Asset Quality
Credit Quality
Historically, our primary lending emphasis has been the origination and purchase of one- to four-family first mortgage loans on residential properties. Our lending market areas generally consist of those states that are east of the Mississippi River and as far south as South Carolina. Loans located outside of the New York metropolitan area are part of our loan purchase market area. Our loan purchase activity has declined significantly as sellers from whom we have historically purchased loans are either retaining these loans in their portfolios or selling them to the GSEs.
The following table presents the composition of our loan portfolio in dollar amounts and in percentages of the total portfolio at December 31:
| 2014 | 2013 | |||||||||||||||
| Percent | Percent | |||||||||||||||
| Amount | of Total | Amount | of Total | |||||||||||||
| (Dollars in thousands) | ||||||||||||||||
| First mortgage loans: |
||||||||||||||||
| One- to four-family: |
||||||||||||||||
| Amortizing |
$ | 17,746,149 | 82.29 | % | $ | 19,518,912 | 80.95 | % | ||||||||
| Interest-only |
2,874,024 | 13.33 | 3,648,732 | 15.13 | ||||||||||||
| FHA/VA |
648,070 | 3.01 | 704,532 | 2.92 | ||||||||||||
| Multi-family and commercial |
102,323 | 0.47 | 25,671 | 0.11 | ||||||||||||
| Construction |
177 | — | 294 | — | ||||||||||||
|
|
|
|
|
|
|
|
|
|||||||||
| Total first mortgage loans |
21,370,743 | 99.10 | 23,898,141 | 99.11 | ||||||||||||
|
|
|
|
|
|
|
|
|
|||||||||
| Consumer and other loans |
||||||||||||||||
| Fixed-rate second mortgages |
72,309 | 0.34 | 86,079 | 0.36 | ||||||||||||
| Home equity credit lines |
104,372 | 0.48 | 108,550 | 0.45 | ||||||||||||
| Other |
17,550 | 0.08 | 20,059 | 0.08 | ||||||||||||
|
|
|
|
|
|
|
|
|
|||||||||
| Total consumer and other loans |
194,231 | 0.90 | 214,688 | 0.89 | ||||||||||||
|
|
|
|
|
|
|
|
|
|||||||||
| Total loans |
21,564,974 | 100.00 | % | 24,112,829 | 100.00 | % | ||||||||||
|
|
|
|
|
|||||||||||||
| Deferred loan costs |
99,155 | 105,480 | ||||||||||||||
| Allowance for loan losses |
(235,317 | ) | (276,097 | ) | ||||||||||||
|
|
|
|
|
|||||||||||||
| Net loans |
$ | 21,428,812 | $ | 23,942,212 | ||||||||||||
|
|
|
|
|
|||||||||||||
Had we not sold the pool of $112.1 million of non-performing residential mortgage during 2014 (and assuming no other repayment or resolutions of such loans occurred), non-performing loans at December 31, 2014 would have amounted to $964.1 million.
At December 31, 2014, first mortgage loans secured by one-to four-family properties accounted for 98.6% of total loans. Fixed-rate mortgage loans represent 53.6% of our first mortgage loans. Compared to adjustable-rate loans, fixed-rate loans possess less inherent credit risk since loan payments do not change in response to changes in interest rates. In addition, we do not originate or purchase loans with payment options, negative amortization loans or sub-prime loans. We believe our loans, when made, were amply collateralized and otherwise conformed to our prime lending standards.
Included in our loan portfolio at December 31, 2014 are interest-only one-to four-family residential loans of approximately $2.87 billion, or 13.3%, of total loans as compared to $3.65 billion, or 15.1%, of total loans at December 31, 2013. These loans are originated as adjustable-rate mortgage loans with initial terms of five, seven or ten years with the interest-only portion of the payment based upon the initial loan term, or offered on a 30-year fixed-rate loan, with interest-only payments for the first 10 years of the loan. At the end of the initial 5-, 7- or 10-year interest-only period, the loan payment will adjust to include both principal and interest and will amortize over the remaining term so the loan will be repaid at the end of its original life.
92
Table of Contents
These loans are underwritten using the fully-amortizing payment amount. Non-performing interest-only loans amounted to $99.8 million, or 11.7%, of non-performing loans at December 31, 2014 as compared to non-performing interest-only loans of $135.2 million, or 12.9%, of non-performing loans at December 31, 2013.
In addition to our full documentation loan program, prior to January 2014, we originated loans to certain eligible borrowers as reduced documentation loans. We discontinued our reduced documentation loan program in January 2014 in order to comply with the CFPB’s new requirements to validate a borrower’s ability to repay and the corresponding safe harbor for loans that meet the requirements for a “qualified mortgage”. Loans that were eligible for reduced documentation processing were ARM loans, interest-only first mortgage loans and 10-, 15-, 20- and 30-year fixed-rate loans to owner-occupied primary and second home applicants. These loans were available in amounts up to 65% of the lower of the appraised value or purchase price of the property. Generally the maximum loan amount for reduced documentation loans was $750,000 and these loans were subject to higher interest rates than our full documentation loan products. Reduced documentation loans represent 22.4% of our one- to four-family first mortgage loans at December 31, 2014. Included in our loan portfolio at December 31, 2014 are $3.99 billion of amortizing reduced documentation loans and $620.0 million of reduced documentation interest-only loans as compared to $4.27 billion and $826.5 million, respectively, at December 31, 2013. Non-performing loans at December 31, 2014 include $168.2 million of amortizing reduced documentation loans and $39.8 million of interest-only reduced documentation loans as compared to $182.9 million and $48.8 million, respectively, at December 31, 2013. Beginning in January 2014, we only originate loans that meet the CFPB’s requirements under the ability to repay regulation or qualified mortgage rule, although we continue to originate interest only loans, subject to full compliance with the ability to repay provisions of the rule. See “Regulation of Hudson City Savings and Hudson City Bancorp.”
The following table presents the geographic distribution of our total loan portfolio, as well as the geographic distribution of our non-performing loans at December 31:
| 2014 | 2013 | |||||||||||||||
| Non-performing | Non-performing | |||||||||||||||
| Total loans | Loans | Total loans | Loans | |||||||||||||
| New Jersey |
42.4 | % | 42.6 | % | 42.5 | % | 44.2 | % | ||||||||
| New York |
27.8 | 27.8 | 27.1 | 24.1 | ||||||||||||
| Connecticut |
14.6 | 7.8 | 14.9 | 8.0 | ||||||||||||
|
|
|
|
|
|
|
|
|
|||||||||
| Total New York metropolitan area |
84.8 | 78.2 | 84.5 | 76.3 | ||||||||||||
|
|
|
|
|
|
|
|
|
|||||||||
| Pennsylvania |
4.8 | 1.5 | 4.9 | 2.4 | ||||||||||||
| Massachusetts |
2.0 | 1.8 | 1.8 | 1.6 | ||||||||||||
| Virginia |
1.6 | 1.9 | 1.8 | 2.3 | ||||||||||||
| Illinois |
1.5 | 4.7 | 1.6 | 4.8 | ||||||||||||
| Maryland |
1.6 | 5.2 | 1.7 | 4.7 | ||||||||||||
| All others |
3.7 | 6.7 | 3.7 | 7.9 | ||||||||||||
|
|
|
|
|
|
|
|
|
|||||||||
| Total outside New York metropolitan area |
15.2 | 21.8 | 15.5 | 23.7 | ||||||||||||
|
|
|
|
|
|
|
|
|
|||||||||
| 100.0 | % | 100.0 | % | 100.0 | % | 100.0 | % | |||||||||
|
|
|
|
|
|
|
|
|
|||||||||
93
Table of Contents
Non-Performing Assets
The following table presents information regarding non-performing assets at December 31:
| 2014 | 2013 | 2012 | 2011 | 2010 | ||||||||||||||||
| (Dollars in thousands) | ||||||||||||||||||||
| Non-accrual loans: |
||||||||||||||||||||
| One-to four family amortizing loans |
$ | 708,518 | $ | 770,641 | $ | 836,403 | $ | 700,429 | $ | 614,758 | ||||||||||
| One-to four family interest-only loans |
99,779 | 135,228 | 182,239 | 213,862 | 179,348 | |||||||||||||||
| Multi-family and commercial mortgages |
1,543 | 3,189 | 1,688 | 2,223 | 1,117 | |||||||||||||||
| Construction loans |
177 | 294 | 4,669 | 4,344 | 7,560 | |||||||||||||||
| Consumer and other loans |
8,613 | 7,048 | 7,975 | 4,353 | 4,320 | |||||||||||||||
|
|
|
|
|
|
|
|
|
|
|
|||||||||||
| Total non-accrual loans |
818,630 | 916,400 | 1,032,974 | 925,211 | 807,103 | |||||||||||||||
| Accruing loans delinquent 90 days or more |
33,383 | 132,844 | 129,553 | 97,476 | 64,156 | |||||||||||||||
|
|
|
|
|
|
|
|
|
|
|
|||||||||||
| Total non-performing loans |
852,013 | 1,049,244 | 1,162,527 | 1,022,687 | 871,259 | |||||||||||||||
| Foreclosed real estate, net |
79,952 | 70,436 | 47,322 | 40,619 | 45,693 | |||||||||||||||
|
|
|
|
|
|
|
|
|
|
|
|||||||||||
| Total non-performing assets |
$ | 931,965 | $ | 1,119,680 | $ | 1,209,849 | $ | 1,063,306 | $ | 916,952 | ||||||||||
|
|
|
|
|
|
|
|
|
|
|
|||||||||||
| Non-performing loans to total loans |
3.95 | % | 4.35 | % | 4.29 | % | 3.48 | % | 2.82 | % | ||||||||||
| Non-performing assets to total assets |
2.55 | 2.90 | 2.98 | 2.34 | 1.50 | |||||||||||||||
Loans that are past due 90 days or more and still accruing interest are loans that are insured by the FHA.
During 2014, we sold a pool of $112.1 million of non-performing residential mortgage loans guaranteed by the FHA back to the financial institution that originally sold the loans to the Bank. The sale of the non-performing loan pool was in accordance with the repurchase right with respect to loans that become non-performing that the financial institution exercised pursuant to the terms of the original sale and servicing agreement between the Bank and the financial institution. As consideration for the sale of the non-performing loans, the Bank received from the financial institution an amount equal to 100% of the outstanding unpaid principal balance of the loans, plus all accrued and unpaid interest on the loans. The Bank may sell additional loans to the financial institution in the future, in the event the financial institution exercises its repurchase right with respect to any additional non-performing FHA loans.
Non-performing loans exclude loans which have been restructured and are accruing and performing in accordance with the terms of their restructure agreement for at least six months. We discontinue accruing and reverse accrued, but unpaid interest on troubled debt restructurings that are past due 90 days or more or if we believe we will not collect all amounts contractually due. Approximately $16.9 million of troubled debt restructurings that were previously accruing interest became 90 days or more past due during 2014 for which we discontinued accruing and reversed accrued, but unpaid interest.
94
Table of Contents
The following table is a comparison of our delinquent loans at December 31:
| 30-59 Days | 60-89 Days | 90 Days or More | ||||||||||||||||||||||
| Number | Principal | Number | Principal | Number | Principal | |||||||||||||||||||
| of | Balance | of | Balance | of | Balance | |||||||||||||||||||
| Loans | of Loans | Loans | of Loans | Loans | of Loans | |||||||||||||||||||
| (Dollars in thousands) | ||||||||||||||||||||||||
| 2014 |
||||||||||||||||||||||||
| One- to four- family first mortgages: |
||||||||||||||||||||||||
| Amortizing |
650 | $ | 213,957 | 281 | $ | 100,618 | 2,119 | $ | 708,518 | |||||||||||||||
| Interest-only |
43 | 30,256 | 21 | 12,507 | 180 | 99,779 | ||||||||||||||||||
| FHA/VA first mortgages |
171 | 29,603 | 59 | 10,802 | 175 | 33,383 | ||||||||||||||||||
| Multi-family and commercial mortgages |
17 | 2,782 | 2 | 4,743 | 4 | 1,543 | ||||||||||||||||||
| Construction loans |
— | — | — | — | 1 | 177 | ||||||||||||||||||
| Consumer and other loans |
16 | 1,938 | 11 | 441 | 69 | 8,613 | ||||||||||||||||||
|
|
|
|
|
|
|
|
|
|
|
|
|
|||||||||||||
| Total |
897 | $ | 278,536 | 374 | $ | 129,111 | 2,548 | $ | 852,013 | |||||||||||||||
|
|
|
|
|
|
|
|
|
|
|
|
|
|||||||||||||
| Delinquent loans to total loans |
1.29 | % | 0.60 | % | 3.95 | % | ||||||||||||||||||
| 2013 |
||||||||||||||||||||||||
| One- to four- family first mortgages: |
||||||||||||||||||||||||
| Amortizing |
728 | $ | 246,435 | 327 | $ | 118,947 | 2,366 | $ | 770,641 | |||||||||||||||
| Interest-only |
51 | 34,277 | 29 | 21,283 | 235 | 135,228 | ||||||||||||||||||
| FHA/VA first mortgages |
153 | 27,868 | 73 | 13,963 | 559 | 132,844 | ||||||||||||||||||
| Multi-family and commercial mortgages |
4 | 1,384 | 1 | 5,983 | 4 | 3,189 | ||||||||||||||||||
| Construction loans |
— | — | — | — | 1 | 294 | ||||||||||||||||||
| Consumer and other loans |
36 | 1,931 | 18 | 1,337 | 68 | 7,048 | ||||||||||||||||||
|
|
|
|
|
|
|
|
|
|
|
|
|
|||||||||||||
| Total |
972 | $ | 311,895 | 448 | $ | 161,513 | 3,233 | $ | 1,049,244 | |||||||||||||||
|
|
|
|
|
|
|
|
|
|
|
|
|
|||||||||||||
| Delinquent loans to total loans |
1.29 | % | 0.67 | % | 4.35 | % | ||||||||||||||||||
Potential problem loans consist of early-stage delinquencies and troubled debt restructurings that are not included in non-accrual loans. Problem potential loans amounted to $544.9 million at December 31, 2014 as compared to $581.8 million at December 31, 2013. The following table presents information regarding loans modified in a troubled debt restructuring at December 31:
| 2014 | 2013 | |||||||
| (In thousands) | ||||||||
| Troubled debt restructurings: |
||||||||
| Current |
$ | 137,249 | $ | 108,413 | ||||
| 30-59 days |
20,344 | 19,931 | ||||||
| 60-89 days |
17,079 | 17,407 | ||||||
| 90 days or more |
157,744 | 176,797 | ||||||
|
|
|
|
|
|||||
| Total troubled debt restructurings |
$ | 332,416 | $ | 322,548 | ||||
|
|
|
|
|
|||||
Loans that were modified in a troubled debt restructuring primarily represent loans that have been in a deferred principal payment plan for an extended period of time, generally in excess of nine months, loans that have had past due amounts capitalized as part of the loan balance, loans that have a confirmed Chapter 13 bankruptcy status, borrowers’ loans that have been discharged in a Chapter 7 bankruptcy and other repayment plans. These loans are individually evaluated for impairment to determine if the carrying value of the loan is in excess of the fair value of the collateral or the present value of each loan’s expected future cash flows.
95
Table of Contents
The following table presents loan portfolio class modified as troubled debt restructurings during the years ended December 31, 2014 and 2013. The pre-restructuring and post-restructuring outstanding recorded investments disclosed in the table below represent the loan carrying amounts immediately prior to the restructuring and the carrying amounts at December 31:
| 2014 | 2013 | |||||||||||||||||||||||
| Pre-restructuring | Post- restructuring |
Pre-restructuring | Post- restructuring |
|||||||||||||||||||||
| Number | Outstanding | Outstanding | Number | Outstanding | Outstanding | |||||||||||||||||||
| of | Recorded | Recorded | of | Recorded | Recorded | |||||||||||||||||||
| Contracts | Investment | Investment | Contracts | Investment | Investment | |||||||||||||||||||
| (In thousands) | ||||||||||||||||||||||||
| Troubled debt restructurings: |
||||||||||||||||||||||||
| One-to-four family first mortgages: |
||||||||||||||||||||||||
| Amortizing |
980 | $ | 341,398 | $ | 291,404 | 933 | $ | 318,908 | $ | 281,481 | ||||||||||||||
| Interest-only |
59 | 35,025 | 31,257 | 55 | 35,226 | 31,564 | ||||||||||||||||||
| Multi-family and commercial mortgages |
3 | 8,650 | 5,441 | 2 | 7,029 | 7,029 | ||||||||||||||||||
| Consumer and other loans |
36 | 4,594 | 4,314 | 24 | 2,672 | 2,474 | ||||||||||||||||||
|
|
|
|
|
|
|
|
|
|
|
|
|
|||||||||||||
| Total |
1,078 | $ | 389,667 | $ | 332,416 | 1,014 | $ | 363,835 | $ | 322,548 | ||||||||||||||
|
|
|
|
|
|
|
|
|
|
|
|
|
|||||||||||||
Foreclosed real estate amounted to $80.0 million at December 31, 2014 as compared to $70.4 million at December 31, 2013. During 2014, we transferred $123.6 million of loans to foreclosed real estate as compared to $126.8 million during 2013. We sold 241 properties during 2014 as compared to 207 properties during 2013.Write-downs on foreclosed real estate and net gains or losses on the sale of foreclosed real estate amounted to a net gain of $3.2 million for the year ended December 31, 2014 as compared to a net gain of $1.7 million for the comparable period in 2013. Holding costs associated with foreclosed real estate amounted to $18.6 million and $14.5 million for the years ended December 31, 2014 and 2013, respectively.
As part of our Strategic Plan, we are continuing to explore ways to reduce our interest rate risk while strengthening our balance sheet, which includes the implementation of our CRE lending initiative. Under this initiative, during 2014, the Bank began to purchase CRE and multi-family mortgage loans and interests in such loans. The Bank purchased $86.6 million of such loans and interests in the fourth quarter of 2014. We expect to expand our CRE lending business by engaging in direct originations commencing in the second half of 2015.
96
Table of Contents
Allowance for Loan Losses
The following table presents the activity in our ALL at December 31:
| 2014 | 2013 | 2012 | ||||||||||
| (Dollars in thousands) | ||||||||||||
| Balance at beginning of period |
$ | 276,097 | $ | 302,348 | $ | 273,791 | ||||||
|
|
|
|
|
|
|
|||||||
| Provision for loan losses |
(3,500 | ) | 36,500 | 95,000 | ||||||||
| Charge-offs: |
||||||||||||
| First mortgage loans |
(59,978 | ) | (87,288 | ) | (86,636 | ) | ||||||
| Consumer and other loans |
(683 | ) | (566 | ) | (464 | ) | ||||||
|
|
|
|
|
|
|
|||||||
| Total charge-offs |
(60,661 | ) | (87,854 | ) | (87,100 | ) | ||||||
| Recoveries |
23,381 | 25,103 | 20,657 | |||||||||
|
|
|
|
|
|
|
|||||||
| Net charge-offs |
(37,280 | ) | (62,751 | ) | (66,443 | ) | ||||||
|
|
|
|
|
|
|
|||||||
| Balance at end of period |
$ | 235,317 | $ | 276,097 | $ | 302,348 | ||||||
|
|
|
|
|
|
|
|||||||
| Allowance for loan losses to total loans |
1.09 | % | 1.15 | % | 1.12 | % | ||||||
| Allowance for loan losses to non-performing loans |
27.62 | 26.31 | 26.01 | |||||||||
| Net charge-offs as a percentage of average loans |
0.16 | 0.24 | 0.24 | |||||||||
The following table presents our allocation of the ALL by loan category and the percentage of loans in each category to total loans at December 31:
| 2014 | 2013 | |||||||||||||||
| Amount | Percentage of Loans in Category to Total Loans |
Amount | Percentage of Loans in Category to Total Loans |
|||||||||||||
| (Dollars in thousands) | ||||||||||||||||
| First mortgage loans: |
||||||||||||||||
| One- to four-family |
$ | 230,862 | 98.62 | % | $ | 271,261 | 99.00 | % | ||||||||
| Other first mortgages |
571 | 0.48 | 918 | 0.11 | ||||||||||||
|
|
|
|
|
|
|
|
|
|||||||||
| Total first mortgage loans |
231,433 | 99.10 | 272,179 | 99.11 | ||||||||||||
| Consumer and other loans |
3,884 | 0.90 | 3,918 | 0.89 | ||||||||||||
|
|
|
|
|
|
|
|
|
|||||||||
| Total allowance for loan losses |
$ | 235,317 | 100.00 | % | $ | 276,097 | 100.00 | % | ||||||||
|
|
|
|
|
|
|
|
|
|||||||||
Liquidity and Capital Resources
The term “liquidity” refers to our ability to generate adequate amounts of cash to fund loan originations, loan and security purchases, deposit withdrawals, repayment of borrowings and operating expenses. Our primary sources of funds are deposits, borrowings, the proceeds from principal and interest payments on loans and mortgage-backed securities, the maturities and calls of investment securities and funds provided by our operations. Deposit flows, calls of investment securities and borrowed funds, and prepayments of loans and mortgage-backed securities are strongly influenced by interest rates, national and local economic conditions and competition in the marketplace. These factors reduce the predictability of the receipt of these sources of funds. Our membership in the FHLB provides us access to additional sources of borrowed funds. We also have the ability to access the capital markets, depending on market conditions.
Historically, our primary investing activities have been the origination and purchase of one-to four-family real estate loans and consumer and other loans, the purchase of mortgage-backed securities, and the purchase of investment securities. These activities are funded primarily by borrowings, deposit growth and the proceeds
97
Table of Contents
from principal and interest payments on loans, mortgage-backed securities and investment securities. Our loan production (originations and purchases) was $1.40 billion during 2014 as compared to $3.59 billion during 2013. Principal repayments on loans amounted to $3.84 billion for 2014 as compared to $6.38 billion for 2013. At December 31, 2014, commitments to originate and purchase mortgage loans amounted to $52.2 million and $140,000, respectively, as compared to $163.2 million and $140,000, respectively, at December 31, 2013.
Purchases of mortgage-backed securities during the year ended December 31, 2014 were $94.4 million as compared to $1.67 billion during 2013. Principal repayments on mortgage-backed securities amounted to $1.43 billion for 2014 as compared to $3.21 billion for 2013. Proceeds from sales of mortgage-backed securities during the year ended December 31, 2014 were $3.41 billion as compared to $337.9 million for the year ended December 31, 2013.
Purchases of investment securities amounted to $3.31 billion for 2014, as compared to $298.0 million for 2013. There were no calls of investment securities during 2014 and 2013.
At December 31, 2014, we had mortgage-backed securities and investment securities with an amortized cost of $7.27 billion that were used as collateral for securities sold under agreements to repurchase and at that date we had $587.4 million of unencumbered securities.
As part of the membership requirements of the FHLB, we are required to hold a certain dollar amount of FHLB common stock based on our mortgage-related assets and borrowings from the FHLB. During 2014, we had net redemptions of $26.3 million of FHLB common stock as compared to $9.4 million for 2013.
During 2014 total cash and cash equivalents increased $1.97 billion to $6.29 billion. This increase is primarily due to repayments on mortgage-related assets and the lack of attractive reinvestment opportunities in the current low interest rate environment as available short term reinvestment opportunities continue to carry low yields, and medium and longer term opportunities available to us carry significant duration risk at relatively low yields. We have maintained lower deposit rates, which helps us to manage our excess liquidity while we position our balance sheet for a possible restructuring. We have used a portion of our excess cash inflows to fund these deposit reductions. We believe that while carrying this level of cash and cash equivalents adversely impacts our current earnings, it better positions our balance sheet for future strategic initiatives such as a balance sheet restructuring. The delay in the execution of the balance sheet restructuring and our continuing to carry an excess liquidity position is primarily due to the delay in obtaining the requisite regulatory approvals for the Merger, though a variety of factors are involved in the decision regarding any such restructuring.
Our primary financing activities consist of gathering deposits, engaging in wholesale borrowings, repurchases of our common stock and the payment of dividends.
Total deposits decreased $2.10 billion during 2014 as compared to a decrease of $2.01 billion for 2013. Deposit flows are typically affected by the level of market interest rates, the interest rates and products offered by competitors, the volatility of equity markets, and other factors. We maintained our deposit rates at low levels during 2014 to continue our planned balance sheet reduction. At December 31, 2014, time deposits scheduled to mature within one year totaled $7.34 billion with an average cost of 1.04%. These time deposits are scheduled to mature as follows: $2.15 billion with an average cost of 0.83% in the first quarter of 2015, $2.09 billion with an average cost of 1.15% in the second quarter of 2015, $1.50 billion with an average cost of 1.16% in the third quarter of 2015 and $1.60 million with an average cost of 1.08% in the fourth quarter of 2015.
We have, in the past, primarily used wholesale borrowings to fund our investing activities. Structured putable borrowings amounted to $3.33 billion at December 31, 2014, all of which have put dates within one year and all of which can be put back to the Company quarterly. We anticipate that none of these borrowings will be put back assuming current market interest rates remain stable. We believe, given current market conditions, that the likelihood that a significant portion of these borrowings would be put back will not increase substantially unless
98
Table of Contents
interest rates were to increase by at least 250 basis points from current levels. Our remaining borrowings are fixed-rate, fixed maturity borrowings of $8.85 billion with a weighted-average rate of 4.66%. There is one borrowing scheduled to mature in the fourth quarter of 2015 for $75.0 million with an average cost of 4.62%.
As part of our Strategic Plan, we are continuing to explore ways to reduce our interest rate risk while strengthening our balance sheet, which may include a further restructuring of our balance sheet during 2015. The Company previously completed a series of restructuring transactions in 2011 that reduced higher-cost structured borrowings on the Company’s balance sheet. Management is continuing to consider a variety of different restructuring alternatives, including whether to restructure all or various portions of our borrowed funds and various alternatives for replacement funding. No decision has been made at this time regarding the timing, structure and scope of any restructuring transaction. Decisions regarding any restructuring transaction are dependent upon, among other things, market interest rates, overall economic conditions and the status of the Merger. We expect a restructuring to result in a net loss and reduction of shareholder equity, though we also expect an improvement in net interest margin and future earnings prospects. Any restructuring will focus on the prospects for long-term overall earnings stability and growth. Any restructuring will likely reduce our excess cash position, but will not adversely affect the liquidity we need to operate in a safe and sound manner.
At December 31, 2014 we had a concentration of borrowings with a single counterparty with $6.03 billion of borrowings with the FHLB. We do not believe this concentration creates a material liquidity risk to us.
Our liquidity management process is structured to meet our daily funding needs and cover both expected and unexpected deviations from normal daily operations. The primary tools we use for measuring and managing liquidity risk include cash flow projections, diversified funding sources, stress testing, a cushion of liquid assets, and a formal, well developed contingency funding plan.
Cash dividends paid during 2014 totaled $80.2 million as compared to $99.5 million for 2013. We did not purchase any of our common shares during the year ended December 31, 2014 pursuant to our repurchase programs. Pursuant to the Company MOU, any future share repurchases must be approved by the FRB. Pursuant to the Merger Agreement, we may not repurchase any shares without the consent of M&T. At December 31, 2014, there remained 50,123,550 shares available for purchase under existing stock repurchase programs.
The primary source of liquidity for Hudson City Bancorp, the holding company of Hudson City Savings, is capital distributions from Hudson City Savings. At December 31, 2014, Hudson City Bancorp had total cash and due from banks of $133.7 million. The primary use of these funds is the payment of dividends to our shareholders and, when appropriate as part of our capital management strategy, the repurchase of our outstanding common stock. Hudson City Bancorp’s ability to continue these activities is dependent upon capital distributions from Hudson City Savings. Applicable federal law, regulations and regulatory actions may limit the amount of capital distributions Hudson City Savings may make. Currently, Hudson City Savings must seek approval from the OCC and the FRB for future capital distributions.
In accordance with the Bank MOU, the Bank adopted and implemented enhanced operating policies and procedures that will enable us to continue to: (a) reduce our level of interest rate risk, (b) reduce our funding concentration, (c) diversify our funding sources, (d) enhance our liquidity position, (e) monitor and manage loan modifications and (f) maintain our capital position in accordance with our existing capital plan. In addition, we developed the Strategic Plan which establishes objectives for the Bank’s overall risk profile, earnings performance, growth and balance sheet mix and to enhance our enterprise risk management program. Prior to the execution of Amendment No. 1, the implementation of the Strategic Plan had been suspended pending the completion of the Merger. Since the execution of Amendment No. 1, we have updated the Strategic Plan, prioritizing certain matters that can be achieved during the pendency of the Merger. The Company is proceeding with implementation of the prioritized aspects of the updated Strategic Plan. On February 26, 2015 the OCC terminated the Bank MOU.
99
Table of Contents
In accordance with the Company MOU, the Company is required to: (a) obtain approval from the FRB prior to receiving a capital distribution from the Bank or declaring a dividend to shareholders and (b) obtain approval from the FRB prior to repurchasing or redeeming any Company stock or incurring any debt with a maturity date of greater than one year. In accordance with the Company MOU, the Company submitted a comprehensive Capital Plan and a comprehensive Earnings Plan to the FRB.
While the Company believes it is in compliance in all material respects with the terms of the Company MOU it will remain in effect until modified or terminated by the FRB.
At December 31, 2014, Hudson City Savings exceeded all regulatory capital requirements and is in compliance with our capital plan. Hudson City Savings’ tangible capital ratio, leverage (core) capital ratio and total risk-based capital ratio were 11.74%, 11.74% and 28.75%, respectively.
Pursuant to the Reform Act, the Agencies issued final rules that subject many savings and loan holding companies, including Hudson City Bancorp, to consolidated capital requirements. The rules also revise the quantity and quality of required minimum risk-based and leverage capital requirements applicable to Hudson City Bancorp and Hudson City Savings, consistent with the Reform Act and the Basel III capital standards. The final capital rules revise the quantity and quality of capital required by: (1) establishing a new minimum common equity Tier 1 ratio of 4.5% of risk-weighted assets; (2) raising the minimum Tier 1 capital ratio from 4.0% to 6.0% of risk-weighted assets; (3) maintaining the minimum total capital ratio of 8.0% of risk-weighted assets; and (4) maintaining a minimum Tier 1 capital to adjusted average consolidated assets, known as the leverage ratio, of 4.0%. The final capital rules also add a requirement for a minimum common equity Tier 1 capital conservation buffer of 2.5% of risk-weighted assets to be applied to the common equity Tier 1 capital ratio, the Tier 1 capital ratio and the total capital ratio. Failure to maintain this buffer will result in restrictions on capital distributions and certain discretionary cash bonus payments to executive officers. The new minimum regulatory capital ratios and changes to the calculation of risk-weighted assets went into effect for Hudson City Bancorp and Hudson City Savings on January 1, 2015. For additional information, see Part I, Item 1A, “Risk Factors” and “Regulation of Hudson City Savings Bank and Hudson City Bancorp.
Off-Balance Sheet Arrangements and Contractual Obligations
Hudson City Bancorp is a party to certain off-balance sheet arrangements, which occur in the normal course of our business, to meet the credit needs of our customers and the growth initiatives of the Bank. These arrangements are primarily commitments to originate and purchase mortgage loans, and to purchase mortgage-backed securities. We are also obligated under a number of non-cancelable operating leases.
100
Table of Contents
The following table summarizes contractual obligations of Hudson City by contractual payment period, as of December 31, 2014:
| Payments Due By Period | ||||||||||||||||||||
| Less Than | One Year to | Three Years to | More Than | |||||||||||||||||
| Contractual Obligation |
Total | One Year | Three Years | Five Years | Five Years | |||||||||||||||
| (In thousands) | ||||||||||||||||||||
| Mortgage loan originations |
$ | 52,273 | $ | 52,273 | $ | — | $ | — | $ | — | ||||||||||
| Mortgage loan purchases |
140 | 140 | — | — | — | |||||||||||||||
| Repayment of borrowed funds |
12,175,000 | 75,000 | 6,400,000 | 2,425,000 | 3,275,000 | |||||||||||||||
| Operating leases |
134,896 | 10,845 | 21,084 | 20,317 | 82,650 | |||||||||||||||
|
|
|
|
|
|
|
|
|
|
|
|||||||||||
| Total |
$ | 12,362,309 | $ | 138,258 | $ | 6,421,084 | $ | 2,445,317 | $ | 3,357,650 | ||||||||||
|
|
|
|
|
|
|
|
|
|
|
|||||||||||
Commitments to extend credit are agreements to lend money to a customer as long as there is no violation of any condition established in the contract. Commitments to fund first mortgage loans generally have fixed expiration dates of approximately 90 days and other termination clauses. Since some commitments are expected to expire without being drawn upon, the total commitment amounts do not necessarily represent future cash requirements. Hudson City Savings evaluates each customer’s credit-worthiness on a case-by-case basis. Additionally, we have available home equity, overdraft and commercial/construction lines of credit, which do not have fixed expiration dates, of approximately $175.7 million, $2.2 million, and $157,000. We are not obligated to advance further amounts on credit lines if the customer is delinquent, or otherwise in violation of the agreement. The commitments to purchase first mortgage loans and mortgage-backed securities had a normal period from trade date to settlement date of approximately 60 days.
Recent Accounting Pronouncements
In June 2014, the FASB issued ASU 2014-12, “Stock Compensation – Accounting for Share-Based Payments When the Terms of an Award Provide that a Performance Target Could Be Achieved after the Requisite Service Period”. The amendment applies to reporting entities that grant their employees share-based payments in which the terms of the award provide that a performance target can be achieved after the requisite service period. A reporting entity should apply existing guidance in ASC Topic 718 as it relates to awards with performance conditions that affect vesting to account for such awards. As such, the performance target should not be reflected in estimating the grant-date fair value of the award. Compensation cost should be recognized in the period in which it becomes probable that the performance target will be achieved and should represent the compensation cost attributable to the period(s) for which the requisite service has already been rendered. If the performance target becomes probable of being achieved before the end of the requisite service period, the remaining unrecognized compensation cost should be recognized prospectively over the remaining requisite service period. The total amount of compensation cost recognized during and after the requisite service period should reflect the number of awards that are expected to vest and should be adjusted to reflect those awards that ultimately vest. The requisite service period ends when the employee can cease rendering service and still be eligible to vest in the award if the performance target is achieved. As indicated in the definition of vest, the stated vesting period (which includes the period in which the performance target could be achieved) may differ from the requisite service period. The amendments in ASU 2014-12 are effective for public business entities for fiscal years, and interim periods within those fiscal years, beginning after December 15, 2014. Early adoption is permitted. This guidance is not expected to have a material impact on our financial condition or results of operations.
In June 2014, the FASB issued ASU 2014-11, “Transfers and Servicing – Repurchase-to-Maturity Transactions, Repurchase Financings, and Disclosures”. The amendments in this Update require that repurchase-to-maturity transactions be accounted for as secured borrowings consistent with the accounting for other repurchase
101
Table of Contents
agreements. In addition, the amendments require separate accounting for a transfer of a financial asset executed contemporaneously with a repurchase agreement with the same counterparty (a repurchase financing), which will result in secured borrowing accounting for the repurchase agreement. The amendments require an entity to disclose information about transfers accounted for as sales in transactions that are economically similar to repurchase agreements, in which the transferor retains substantially all of the exposure to the economic return on the transferred financial asset throughout the term of the transaction. In addition the amendments require disclosure of the types of collateral pledged in repurchase agreements, securities lending transactions, and repurchase-to-maturity transactions and the tenor of those transactions. The amendments in ASU 2014-11 are effective for public business entities for fiscal years, and interim periods within those fiscal years, beginning after December 15, 2014, and the disclosure for repurchase agreements, securities lending transactions, and repurchase-to-maturity transactions accounted for as secured borrowings is required to be presented for annual periods beginning after December 15, 2014, and for interim periods beginning after March 15, 2015. This guidance is not expected to have a material impact on our financial condition or results of operations.
In January 2014, the FASB issued ASU 2014-04, “Receivables – Troubled Debt Restructurings by Creditors (Subtopic 310-40) Reclassification of Residential Real Estate Collateralized Consumer Mortgage Loans upon Foreclosure,” and in August 2014 the FASB issued ASU 2014-14, “Receivables—Troubled Debt Restructurings by Creditors (Subtopic 310-40)—Classification of Certain Government-Guaranteed Mortgage Loans upon Foreclosure.” ASU 2014-04 applies to all creditors who obtain physical possession of residential real estate property collateralizing a consumer mortgage loan in satisfaction of a receivable. The amendments in ASU 2014-04 clarify when an in substance repossession or foreclosure occurs and requires disclosure of both (1) the amount of foreclosed residential real estate property held by a creditor and (2) the recorded investment in consumer mortgage loans collateralized by residential real estate property that are in the process of foreclosure according to local requirements of the applicable jurisdiction. ASU 2014-14 applies to creditors that hold government-guaranteed mortgage loans. The amendments in ASU 2014-14 require that a mortgage loan be derecognized and that a separate other receivable be recognized upon foreclosure if (1) the loan has a government guarantee that is not separable from the loan before foreclosure, (2) at the time of foreclosure, the creditor has the intent to convey the real estate property to the guarantor and make a claim on the guarantee, and the creditor has the ability to recover under that claim and (3) at the time of foreclosure, any amount of the claim that is determined on the basis of the fair value of the real estate is fixed. The amendments in ASU 2014-04 went into effect for public business entities for fiscal years, and interim periods within those fiscal years, beginning after December 15, 2014. Early adoption was permitted and entities could elect to adopt a modified retrospective transition method or a prospective transition method. This guidance is not expected to have a material impact on our financial condition or results of operations.
Impact of Inflation and Changing Prices
The Consolidated Financial Statements and accompanying Notes to Consolidated Financial Statements of Hudson City Bancorp have been prepared in accordance with U.S. GAAP. U.S. GAAP generally requires the measurement of financial position and operating results in terms of historical dollars without consideration for changes in the relative purchasing power of money over time due to inflation. The impact of inflation is reflected in the increased cost of our operations. Unlike industrial companies, our assets and liabilities are primarily monetary in nature. As a result, changes in market interest rates have a greater impact on performance than do the effects of inflation.
Critical Accounting Policies
We have identified the accounting policies below as critical to understanding our financial results. In addition, Note 2 to the Audited Consolidated Financial Statements contains a summary of our significant accounting policies. We believe our policies with respect to the methodology for our determination of the ALL, the measurement of stock-based compensation expense, the impairment of securities, the impairment of goodwill
102
Table of Contents
and the measurement of the funded status and cost of our pension and other post-retirement benefit plans involve a higher degree of complexity and require management to make difficult and subjective judgments which often require assumptions or estimates about highly uncertain matters. Changes in these judgments, assumptions or estimates could cause reported results to differ materially. These critical policies and their application are continually reviewed by management, and are periodically reviewed with the Audit Committee and our Board of Directors.
Allowance for Loan Losses
The ALL has been determined in accordance with U.S. generally accepted accounting principles, under which we are required to maintain an adequate ALL at December 31, 2014. We are responsible for the timely and periodic determination of the amount of the allowance required. We believe that our ALL is adequate to cover specifically identifiable loan losses, as well as estimated losses inherent in our portfolio for which certain losses are probable but not specifically identifiable.
Our primary lending emphasis has been the origination and purchase of one- to four-family first mortgage loans on residential properties and, to a lesser extent, second mortgage loans on one- to four-family residential properties resulting in a loan concentration in residential first mortgage loans at December 31, 2014. As a result of our lending practices, we also have a concentration of loans secured by real property located primarily in New Jersey, New York and Connecticut. At December 31, 2014, approximately 84.8% of our total loans are in the New York metropolitan area. Additionally, the states of Pennsylvania, Massachusetts, Virginia, Maryland and Illinois accounted for 4.8%, 2.0%, 1.6%, 1.6%, and 1.5%, respectively of total loans. The remaining 3.7% of the loan portfolio is secured by real estate primarily in the remainder of our lending markets. Based on the composition of our loan portfolio, we believe the primary risks inherent in our portfolio relate to the conditions in our lending market areas including economic conditions, unemployment levels, weak labor market conditions, rising interest rates and a decline in real estate market values. Any one or a combination of these adverse trends may adversely affect our loan portfolio resulting in increased delinquencies, non-performing assets, loan losses and future levels of loan loss provisions. We consider these trends in market conditions in determining the ALL.
Due to the nature of our loan portfolio, our evaluation of the adequacy of our ALL is performed primarily on a “pooled” basis. Each quarter we prepare an analysis which categorizes the entire loan portfolio by certain risk characteristics such as loan type (fixed and variable one- to four-family, interest-only, reduced documentation, multi-family, commercial, construction, etc.), loan source (originated or purchased) and payment status (i.e., current or number of days delinquent). Loans with known losses are categorized separately. We assign loss factors to the payment status categories on the basis of our assessment of the risk inherent in each loan type. These factors are periodically reviewed for appropriateness giving consideration to charge-off history, delinquency trends, portfolio growth and the status of the regional economy and housing market, in order to ascertain that the loss factors cover probable and estimable losses inherent in the portfolio. Based on our recent loss experience on non-performing loans and our consideration of environmental factors, we changed certain loss factors used in our quantitative analysis of the ALL for one- to four- family first mortgage loans during 2014. This adjustment in our loss factors did not have a material effect on the ultimate level of our ALL or on our provision for loan losses. We use this analysis, as a tool, together with principal balances and delinquency reports, to evaluate the adequacy of the ALL. Other key factors we consider in this process are current real estate market conditions in geographic areas where our loans are located, changes in the trend of non-performing loans, the results of our foreclosed property transactions, the current state of the local and national economy, changes in interest rates and loan portfolio growth. Any one or a combination of these adverse trends may adversely affect our loan portfolio resulting in increased delinquencies, loan losses and higher future levels of provisions.
103
Table of Contents
We maintain the ALL through provisions for loan losses that we charge to income. We charge losses on loans against the ALL when we believe the collection of loan principal is unlikely. We establish the provision for loan losses after considering the results of our review as described above. We apply this process and methodology in a consistent manner and we reassess and modify the estimation methods and assumptions used in response to changing conditions. Such changes, if any, are approved by our AQC each quarter.
Hudson City Savings defines the population of potential impaired loans to be all non-accrual construction, commercial real estate and multi-family loans as well as loans classified as troubled debt restructurings. Impaired loans are individually assessed to determine that the loan’s carrying value is not in excess of the fair value of the collateral or the present value of the loan’s expected future cash flows. Smaller balance homogeneous loans that are collectively evaluated for impairment, such as residential mortgage loans and consumer loans, are specifically excluded from the impaired loan analysis.
We believe that we have established and maintained the ALL at adequate levels. Additions may be necessary if future economic and other conditions differ substantially from the current operating environment. Although management uses the best information available, the level of the ALL remains an estimate that is subject to significant judgment and short-term change.
Stock-Based Compensation
We recognize the cost of employee services received in exchange for awards of equity instruments based on the grant-date fair value of such awards in accordance with ASC 718-10. We have made annual grants of performance-based stock options and stock unit awards that vest if certain financial performance measures are met. In accordance with ASC 718-10-30-6, we assess the probability of achieving these financial performance measures and recognize the cost of these performance-based grants if it is probable that the financial performance measures will be met. This probability assessment is subjective in nature and may change over the assessment period for the performance measures. We made grants of stock units in 2012 for which the sizes of the awards depend in part on market conditions based on the performance of our common stock. In accordance with ASC 718-10-30-15, we include the impact of these market conditions when estimating the grant date fair value of the awards. In accordance with ASC 718-10-55-61, we recognize compensation cost for these awards if service conditions are satisfied, even if the market condition is not satisfied.
We estimate the per share fair value of option grants and stock unit awards on the date of grant using the Black-Scholes option pricing model using assumptions for the expected dividend yield, expected stock price volatility, risk-free interest rate and expected option term. These assumptions are based on our analysis of our historical option exercise experience and our judgments regarding future option exercise experience and market conditions. These assumptions are subjective in nature, involve uncertainties and, therefore, cannot be determined with precision. The Black-Scholes option pricing model also contains certain inherent limitations when applied to options that are not traded on public markets.
The per share fair value of options and stock unit awards are highly sensitive to changes in assumptions. In general, the per share fair value of options will move in the same direction as changes in the expected stock price volatility, risk-free interest rate and expected option term, and in the opposite direction of changes in the expected dividend yield. For example, the per share fair value of these awards will generally increase as expected stock price volatility increases, risk-free interest rate increases, expected option term increases and expected dividend yield decreases. The use of different assumptions or different option pricing models could result in materially different per share fair values of options.
Pension and Other Post-retirement Benefit Assumptions
Non-contributory retirement and post-retirement defined benefit plans are maintained for certain employees, including retired employees hired on or before July 31, 2005 who have met other eligibility requirements of the plans. In accordance with ASC 715, Retirement Benefits, we: (a) recognize in the statement of financial condition an asset for a plan’s overfunded status or a liability for a plan’s underfunded status; (b) measure plan assets and obligations that determine the plan’s funded status as of the end of our fiscal year; and (c) recognize, in comprehensive income, changes in the funded status of our defined benefit post-retirement plan in the year in which the changes occur.
104
Table of Contents
We provide our actuary with certain rate assumptions used in measuring our benefit obligation. We monitor these rates in relation to the current market interest rate environment and update our actuarial analysis accordingly. The most significant of these is the discount rate used to calculate the period-end present value of the benefit obligations, and the expense to be included in the following year’s financial statements. A lower discount rate will result in a higher benefit obligation and expense, while a higher discount rate will result in a lower benefit obligation and expense. The discount rate assumption was determined based on a cash flow/yield curve model specific to our pension and post-retirement plans. We compare this rate to certain market indices, such as long-term treasury bonds, or the Moody’s bond indices, for reasonableness. For our pension plans, a discount rate of 3.85% was selected for the December 31, 2014 measurement date and the 2015 expense calculation.
For our pension plan, we also assumed an annual rate of salary increase of 3.50% for future periods. This rate is corresponding to actual salary increases experienced over prior years. We assumed a return on plan assets of 8.25% for future periods. We actuarially determine the return on plan assets based on actual plan experience over the previous ten years. The actual return on plan assets was 8.8% for 2014 and 14.7% for 2013. There can be no assurances with respect to actual return on plan assets in the future. We continually review and evaluate all actuarial assumptions affecting the pension plan, including assumed return on assets.
For our post-retirement benefit plan, a discount rate of 3.90% was used for the December 31, 2014 measurement date and for the 2015 expense calculation. The assumed health care cost trend rate used to measure the expected cost of other benefits for 2014 was 8.0%. The rate was assumed to decrease gradually to 4.50% for 2022 and remain at that level thereafter. Changes to the assumed health care cost trend rate are expected to have an immaterial impact as we capped our obligations to contribute to the premium cost of coverage to the post-retirement health benefit plan at the 2007 premium level.
Securities Impairment
Our available-for-sale securities portfolio is carried at estimated fair value with any unrealized gains and losses, net of taxes, reported as accumulated other comprehensive income/loss in shareholders’ equity. Debt securities which we have the positive intent and ability to hold to maturity are classified as held-to-maturity and are carried at amortized cost. The fair values for our securities are obtained from an independent nationally recognized pricing service. On a monthly basis, we assess the reasonableness of the fair values obtained by reference to a second independent nationally recognized pricing service.
Substantially all of our securities portfolio is comprised of mortgage-backed securities and debt securities issued by GSEs. The fair value of these securities is primarily impacted by changes in interest rates and prepayment speeds. We generally view changes in fair value caused by changes in interest rates as temporary, which is consistent with our experience.
Accounting guidance requires an entity to assess whether an other-than-temporary impairment exists for debt securities and the amount of the impairment to be recognized in earnings. As part of that assessment, the entity must determine its intent and ability to hold the security. If the entity intends to sell the debt security, an other-than-temporary impairment shall be considered to have occurred. In addition, an other-than-temporary impairment shall be considered to have occurred if it is more likely than not that it will be required to sell the security before recovery of its amortized cost.
105
Table of Contents
We conduct a periodic review and evaluation of the securities portfolio to determine if a decline in the fair value of any security below its cost basis is other-than-temporary. Our evaluation of other-than-temporary impairment considers the duration and severity of the impairment, our intent and ability to hold the securities, whether it is more likely than not that we will be required to sell the security before recovery of the amortized cost and our assessments of the reason for the decline in value and the likelihood of a near-term recovery. The unrealized losses on securities in our portfolio were due primarily to changes in market interest rates subsequent to purchase. As a result, the unrealized losses on our securities were not considered to be other-than-temporary and, accordingly, no impairment loss was recognized during 2014.
Impairment of Goodwill
Goodwill and intangible assets with indefinite useful lives are tested for impairment at least annually using a fair-value based two-step approach. Goodwill and other intangible assets amounted to $152.5 million at December 31, 2014 and were recorded as a result of Hudson City Bancorp’s acquisition of Sound Federal Bancorp, Inc. in 2006.
The first step (“Step 1”) used to identify potential impairment involves comparing each reporting unit’s estimated fair value to its carrying amount, including goodwill. As a community-oriented bank, substantially all of the Company’s operations involve the delivery of loan and deposit products to customers and these operations constitute the Company’s only segment for financial reporting purposes. If the estimated fair value of a reporting unit exceeds its carrying amount, goodwill is not considered to be impaired. If the carrying amount exceeds the estimated fair value, there is an indication of potential impairment and the second step (“Step 2”) is performed to measure the amount. Step 2 involves calculating an implied fair value of goodwill for each reporting unit for which impairment was indicated in Step 1. The implied fair value of goodwill is determined in a manner similar to the amount of goodwill calculated in a business combination by measuring the excess of the estimated fair value of the reporting unit, as determined in Step 1, over the aggregate estimated fair values of the individual assets, liabilities, and identifiable intangibles, as if the reporting unit was being acquired at the impairment test date. Subsequent reversal of goodwill impairment losses is not permitted.
We performed our annual goodwill impairment analysis as of June 30, 2014 and concluded that goodwill was not impaired. In addition, we do not believe that any events, circumstances or triggering events occurred since our annual impairment test which would have indicated that goodwill and other intangible assets required reassessment. Therefore, we did not recognize any impairment of goodwill or other intangible assets during 2014. The estimation of the fair value of the Company requires the use of estimates and assumptions that results in a greater degree of uncertainty. In addition, the estimated fair value of the Company is based on, among other things, the market price of our common stock as calculated per the terms of the Merger. As a result of the current volatility in market and economic conditions, these estimates and assumptions are subject to change in the near-term and may result in the impairment in future periods of some or all of the goodwill on our balance sheet.
Item 7A. Quantitative and Qualitative Disclosures About Market Risk
Management of Market Risk
General
As a financial institution, our primary component of market risk is interest rate volatility. Our net income is primarily based on net interest income, and fluctuations in interest rates will ultimately impact the level of both income and expense recorded on a large portion of our assets and liabilities. Fluctuations in interest rates will also affect the market value of our interest-earning assets and interest-bearing liabilities. Due to the nature of our operations, we are not subject to foreign currency exchange or commodity price risk. We do not own any trading assets. We did not engage in any hedging transactions that use derivative instruments (such as interest rate swaps and caps) during 2014 and did not have any such hedging transactions in place at December 31, 2014. Our loan and securities portfolios, which comprise 81% of our balance sheet, are subject to risks
106
Table of Contents
associated with the economy in the New York metropolitan area, the general economy of the United States and the recent pressure on housing prices. Our mortgage-related assets are also subject to pre-payment risk due to mortgage refinancing and housing turnover. We continually analyze our asset quality and believe our allowance for loan losses is adequate to cover known or potential losses.
Management of Interest Rate Risk
The primary objectives of our interest rate risk management strategy are to:
| • | evaluate the interest rate risk inherent in our balance sheet; |
| • | determine the appropriate level of interest rate risk given our business plan, the current economic environment and our capital and liquidity requirements; and |
| • | manage interest rate risk in a manner consistent with the approved guidelines and policies set by our Board of Directors. |
We seek to manage our asset/liability mix so as to lessen the impact that interest rate fluctuations may have on our earnings and capital. To achieve the objectives of managing interest rate risk, our Asset/Liability Committee meets regularly to discuss and monitor the market interest rate environment compared to interest rates that are offered on our products. This committee consists of the Chief Executive Officer, the President and Chief Operating Officer, the Chief Financial Officer, the Chief Risk Officer and other senior officers of the Company. The Asset/Liability Committee presents reports to the Enterprise Risk Management Committee at its regular meetings.
Our lending activities have emphasized one- to four-family fixed-rate first mortgage loans and purchasing variable-rate or hybrid mortgage-backed securities to complement our loan portfolio. The current prevailing interest rate environment and the desires of our customers have resulted in a demand for fixed-rate and longer-term hybrid adjustable-rate mortgage loans. Adjustable rate mortgage-related assets include those loans or securities with a contractual annual rate adjustment after an initial fixed-rate period of one to ten years. Mortgage-related interest earning assets may have an adverse impact on our earnings in a rising rate environment as fixed rate mortgages do not reset rates as the general level of interest rates rises and the rates earned on hybrid adjustable rate loans and securities do not reset to current market interest rates as fast as the interest rates paid on our interest-bearing deposits.
Hybrid adjustable-rate first mortgage loans constituted approximately 71% of mortgage loan production during 2014. In the aggregate, 52% of our mortgage-related assets are variable-rate or hybrid instruments. Our percentage of fixed-rate mortgage-related assets to total mortgage-related assets was 48% as of December 31, 2014 compared with 44% as of December 31, 2013. The increase in this ratio was primarily due to the sale of adjustable-rate mortgage backed securities. Overall, our percentage of fixed-rate interest-earning assets to total interest-earning assets was 44% at December 31, 2014 compared with 39% as of December 31, 2013.
The level of prepayment activity on our interest-sensitive assets impacts our net interest income. The timing of the principal payments on mortgage loans and mortgage-backed securities can be significantly impacted by changes in market interest rates and the associated effect on the prepayment rates of our mortgage-related assets. Mortgage prepayment rates vary due to a number of factors, including economic conditions, the availability of credit, seasonal factors, and demographic variables. However, the principal factor affecting prepayment rates are the prevailing interest rates on existing mortgage loans relative to refinancing opportunities. Generally, the level of prepayment activity directly affects the yield earned on those assets as the principal payments received on the interest-earning assets will be reinvested at the prevailing lower market interest rate. Prepayment rates are generally inversely related to the prevailing market interest rates. Accordingly, as market interest rates increase,
107
Table of Contents
prepayment rates tend to decrease. Prepayment rates on our mortgage-related assets remained at elevated levels throughout 2014. While the rate of prepayment has generally remained elevated, mortgage-related assets have diminished as re-investment opportunities during 2014 have been limited.
Our primary sources of funds have traditionally been deposits, consisting primarily of time deposits and interest-bearing demand accounts, and borrowings. Our deposits have substantially shorter terms to maturity than our mortgage loan portfolio and borrowed funds. The Bank currently has $7.33 billion of interest-bearing non-maturity deposits, and $7.33 billion of time deposits scheduled to mature within the next 12 months. Borrowings, advances from the FHLB and term repurchase agreements with major broker/dealers, are an additional principal source of funding. As of December 31, 2014, these borrowings totaled $12.18 billion, $3.33 billion of which are putable. Since market interest rates have remained very low for an extended period of time, we have not had any lenders put borrowings back to us. As a result, many of our quarterly putable borrowings have become putable within three months. Of the $3.33 billion quarterly putable borrowings, $3.13 billion with a weighted average rate of 4.45% could be put back to the Bank during the next three-month period. We believe, given current market conditions, that the likelihood that a significant portion of these borrowings would be put back to us will not increase substantially unless interest rates were to increase by at least 250 basis points from current levels. There are $8.85 billion of fixed-rate/fixed-maturity borrowings with a weighted average rate of 4.66%; $75.0 million of which are scheduled to mature in 2015.
As a result of our investment and financing decisions, the steeper and more positive the slope of the yield curve, the more favorable the environment is for our ability to generate net interest income. Our interest-bearing liabilities generally reflect movements in short-term rates, while our interest-earning assets, a majority of which have initial terms to maturity or repricing five years or more, generally reflect movements in intermediate- and long-term interest rates. A positive slope of the yield curve allows us to invest in interest-earning assets at a wider spread to the cost of interest-bearing liabilities. During 2014, a mixed economic environment and market reservations regarding the continued Federal Reserve accommodative policy has resulted in a flatter yield curve.
The FOMC noted that economic activity has improved in recent months. The FOMC noted that labor market indicators were mixed but on balance showed further improvement. However, the unemployment rate was little changed during the fourth quarter of 2014 and a range of labor market indicators suggests that there remains significant underutilization of labor resources. Household spending appears to be rising moderately and business fixed investment is advancing, while the recovery in the housing sector slowed somewhat. The national unemployment rate decreased to 5.6% in December 2014 from 6.7% in December 2013 and from 5.9% in September 2014. The FOMC decided to maintain the overnight lending target rate at zero to 0.25% during the fourth quarter of 2014.
The FOMC is maintaining its existing policy of reinvesting principal payments from its holdings of agency debt and agency mortgage-backed securities in agency mortgage-backed securities and of rolling over maturing Treasury securities at auction. The FOMC believes this policy of keeping holdings of longer-term securities at sizable levels should help maintain accommodative financial conditions.
With short-term market interest rates remaining at low levels during 2014, the current interest rate environment has allowed us to continue to re-price lower our short-term time and non-maturity deposits, thereby reducing our cost of deposits, and has also allowed us to price longer-term time deposits (2-5 year maturities) at lower rates and maintain the weighted-average remaining maturity on this portfolio. The yields on our primary investments of mortgage loans and mortgage-backed securities continued to move lower during the first nine months of 2014.
Interest Rate Risk Modeling
Simulation Model. We use our internal simulation models as our primary means to calculate and monitor the interest rate risk inherent in our portfolio. These models report changes to net interest income and the net present value of equity in different interest rate environments, assuming either an incremental or instantaneous and permanent parallel interest rate shock, as applicable, to all interest rate-sensitive assets and liabilities.
108
Table of Contents
During the first quarter of 2014, we implemented a new simulation model as part of our capital stress testing initiative. The new modeling system employs different methodologies and assumptions than our previous model, including a more appropriate treatment of the optionality inherent in our mortgage-related assets and our borrowed funds. In addition, the new model employs different prepayment methodologies that result in slower prepayment speeds for our mortgage-related assets. However, both models generally provide a similar outlook as to the prospective interest rate risk inherent in Hudson City’s balance sheet under various interest rate environments. Our net interest income and net present value of equity presentations below were derived from our new simulation model.
We assume maturing or called instruments are reinvested into like product, with the rate earned or paid reset to our currently offered rate for loans and deposits, or the current market rate for securities and borrowed funds. We have not reported the minus 200 or minus 250 basis point interest rate shock scenarios in either of our simulation model analyses, as we believe, given the current interest rate environment, these scenarios would be highly unlikely and the resulting information would not be meaningful.
Net Interest Income. As a primary means of managing interest rate risk, we monitor the impact of interest rate changes on our net interest income over the next twelve-month period. This model does not purport to provide estimates of net interest income over the next twelve-month period, but attempts to assess the impact of interest rate changes on our net interest income. The following table reports the changes to our net interest income over the next 12 months from December 31, 2014 assuming both incremental and instantaneous changes in interest rates for the given rate shock scenarios. The incremental interest rate changes occur over a 12 month period.
| Change in | Percent Change in Net Interest Income | |||||||
| Interest Rates |
Instantaneous Change | Incremental Change | ||||||
| (Basis points) |
||||||||
| 300 |
29.96 | % | 17.63 | % | ||||
| 200 |
25.03 | 13.06 | ||||||
| 100 |
15.47 | 7.30 | ||||||
| 50 |
8.47 | 3.08 | ||||||
| (50) |
(8.33 | ) | (5.22 | ) | ||||
| (100) |
(16.23 | ) | (7.16 | ) | ||||
Of note in the positive shock scenarios:
| • | Net interest income improves in all interest rate scenarios, due primarily to the elevated levels of liquidity on the balance sheet at December 31, 2014. The significant increase in the percentage change to net interest income as compared to December 31, 2013 reflects the increase of federal funds sold and other overnight deposits which amounted to $6.16 billion at December 31, 2014 as compared to $4.19 billion at December 31, 2013. These funds re-price immediately with changes in interest rates. |
Of note in the negative shock scenarios:
| • | In declining interest rate environments, net interest income decreases in both the incremental and instantaneous scenarios, with instantaneous rate moves proving more unfavorable. This results from both an acceleration of prepayments on the mortgage-related assets and the fact that our non-maturity and short term time deposits, already at low rates, cannot experience the full effect of rate scenarios of minus 50 and minus 100 basis points. |
109
Table of Contents
Net Present Value of Equity. We also monitor our interest rate risk by monitoring changes in the net present value of equity in the different rate environments. The net present value of equity is the difference between the estimated fair value of interest rate-sensitive assets and liabilities. The changes in the fair value of assets and liabilities due to changes in interest rates reflect the interest sensitivity of those assets and liabilities. Their values are derived from the characteristics of the asset or liability relative to the current interest rate environment. For example, in a rising interest rate environment, the fair value of a fixed-rate asset will decline, whereas the fair value of an adjustable-rate asset, depending on its repricing characteristics, may not decline. Increases in the fair value of assets relative to fair value of liabilities will increase the present value of equity whereas decreases in the market value of assets relative to that of liabilities will decrease the present value of equity. Conversely, should the fair value of liabilities outstrip that of assets, the net present value of equity declines.
The following table presents the estimated net present value of equity over a range of parallel interest rate change scenarios, as applicable, at December 31, 2014. The present value ratio shown in the table is the net present value of equity as a percent of the present value of total assets in each of the different rate environments. Our current policy sets a minimum ratio of the net present value of equity to the fair value of assets in the current interest rate environment (no rate shock) of 7.0% and a minimum present value ratio of 5.00% in the plus 300 basis point interest rate shock scenario.
| Change in Interest Rates |
Present Value Ratio |
Basis Point Change |
||||||
| (Basis points) |
||||||||
| 300 |
10.32 | % | (321 | ) | ||||
| 200 |
11.81 | (172 | ) | |||||
| 100 |
12.95 | (58 | ) | |||||
| 50 |
13.39 | (14 | ) | |||||
| 0 |
13.53 | — | ||||||
| (50) |
13.41 | (12 | ) | |||||
| (100) |
13.05 | (48 | ) | |||||
Of note in the positive shock scenarios:
| • | The net present value ratio decreases as interest rates increase. This is due to the fact that our assets are more sensitive to increases in interest rates than our liabilities. These sensitivity measures are referred to as duration; the duration of assets is greater than the duration of liabilities in the increasing rate scenarios. As such, the net present value of assets falls more than the net present value of liabilities in a rising interest rate environment. |
Of note in the negative shock scenarios:
| • | In interest rate decreases of 50 and 100 basis points, prepayments accelerate on our mortgage loans and mortgage-backed securities and the duration of these assets contracts to such an extent that the duration of liabilities exceeds the duration of assets. As a result, the net present value ratio decreases in these scenarios. |
110
Table of Contents
The methods we use in simulation modeling are inherently imprecise. This type of modeling requires that we make assumptions that may not reflect the manner in which actual yields and costs respond to changes in market interest rates. For example, we assume the composition of the interest rate-sensitive assets and liabilities will remain constant over the period being measured and that all interest rate shocks will be uniformly reflected across the yield curve, regardless of the duration to maturity or repricing. The analyses assume that we will take no action in response to the changes in interest rates. In addition, prepayment estimates and other assumptions within the model are subjective in nature, involve uncertainties, and, therefore, cannot be determined with precision. Accordingly, although the previous two tables may provide an estimate of our interest rate risk at a particular point in time, such measurements are not intended to and do not provide a precise forecast of the effect of changes in interest rates on our net interest income or present value of equity.
Gap Analysis. The matching of the re-pricing characteristics of assets and liabilities may be analyzed by examining the extent to which such assets and liabilities are “interest rate-sensitive” and by monitoring a financial institution’s interest rate sensitivity “gap.” An asset or liability is said to be “interest rate-sensitive” within a specific time period if it will mature or re-price within that time period. The interest rate sensitivity gap is defined as the difference between the amount of interest-earning assets maturing or re-pricing within a specific time period and the amount of interest-bearing liabilities maturing or re-pricing within that same time period.
A gap is considered negative when the amount of interest-bearing liabilities maturing or repricing within a specific time period exceeds the amount of interest-earning assets maturing or repricing within that same period. A gap is considered positive when the amount of interest-earning assets maturing or repricing within a specific time period exceeds the amount of interest-bearing liabilities maturing or repricing within that same time period. During a period of rising interest rates, a financial institution with a negative gap position would be expected, absent the effects of other factors, to experience a greater increase in the costs of its interest-bearing liabilities relative to the yields of its interest-earning assets and thus a decrease in the institution’s net interest income. An institution with a positive gap position would be expected, absent the effect of other factors, to experience the opposite result. Conversely, during a period of falling interest rates, a negative gap would tend to result in an increase in net interest income while a positive gap would tend to reduce net interest income.
111
Table of Contents
The following table presents the amounts of our interest-earning assets and interest-bearing liabilities outstanding at December 31, 2014, which we anticipate to reprice or mature in each of the future time periods shown. Except for prepayment or call activity and non-maturity deposit decay rates, we determined the amounts of assets and liabilities that reprice or mature during a particular period in accordance with the earlier of the term to rate reset or the contractual maturity of the asset or liability. Assumptions used for decay rates are based on the Bank’s experience with the particular deposit type. Prepayment speeds on our mortgage-related assets are based on recent experience. Callable investment securities and borrowed funds are reported at the anticipated call or put date, for those that are callable or putable within one year, or at their contractual maturity date or next interest rate step-up date, as applicable. We have reported no borrowings at their anticipated put date due to the low interest rate environment. We have excluded non-accrual mortgage loans of $810.0 million and non-accrual other loans of $8.6 million from the table.
| At December 31, 2014 | ||||||||||||||||||||||||||||
| More than | More than | |||||||||||||||||||||||||||
| More than | More than | two years | three years | |||||||||||||||||||||||||
| Six months | six months | one year to | to three | to five | More than | |||||||||||||||||||||||
| or less | to one year | two years | years | years | five years | Total | ||||||||||||||||||||||
| (Dollars in thousands) | ||||||||||||||||||||||||||||
| Interest-earning assets: |
||||||||||||||||||||||||||||
| First mortgage loans |
$ | 2,366,291 | $ | 2,152,223 | $ | 2,583,946 | $ | 2,663,221 | $ | 3,849,864 | $ | 6,945,181 | $ | 20,560,726 | ||||||||||||||
| Consumer and other loans |
93,961 | 2,248 | 5,626 | 13,911 | 5,228 | 64,644 | 185,618 | |||||||||||||||||||||
| Federal funds sold |
6,163,082 | — | — | — | — | — | 6,163,082 | |||||||||||||||||||||
| Mortgage-backed securities |
1,728,566 | 310,635 | 595,769 | 865,253 | 150,199 | 585,019 | 4,235,441 | |||||||||||||||||||||
| FHLB stock |
320,753 | — | — | — | — | — | 320,753 | |||||||||||||||||||||
| Investment securities |
17,396 | 300,152 | 2,998,485 | — | 295,012 | 39,011 | 3,650,056 | |||||||||||||||||||||
|
|
|
|
|
|
|
|
|
|
|
|
|
|
|
|||||||||||||||
| Total interest-earning assets |
10,690,049 | 2,765,258 | 6,183,826 | 3,542,385 | 4,300,303 | 7,633,855 | 35,115,676 | |||||||||||||||||||||
|
|
|
|
|
|
|
|
|
|
|
|
|
|
|
|||||||||||||||
| Interest-bearing liabilities: |
||||||||||||||||||||||||||||
| Savings accounts |
63,325 | 63,325 | 111,874 | 98,154 | 162,534 | 556,086 | 1,055,298 | |||||||||||||||||||||
| Interest-bearing demand accounts |
202,087 | 202,087 | 295,688 | 243,767 | 367,237 | 805,581 | 2,116,447 | |||||||||||||||||||||
| Money market accounts |
558,924 | 558,925 | 808,176 | 586,268 | 738,540 | 903,477 | 4,154,310 | |||||||||||||||||||||
| Time deposits |
4,234,505 | 3,105,115 | 2,968,881 | 560,275 | 516,613 | — | 11,385,389 | |||||||||||||||||||||
| Borrowed funds |
— | 75,000 | 3,925,000 | 2,475,000 | 2,425,000 | 3,275,000 | 12,175,000 | |||||||||||||||||||||
|
|
|
|
|
|
|
|
|
|
|
|
|
|
|
|||||||||||||||
| Total interest-bearing liabilities |
5,058,841 | 4,004,452 | 8,109,619 | 3,963,464 | 4,209,924 | 5,540,144 | 30,886,444 | |||||||||||||||||||||
|
|
|
|
|
|
|
|
|
|
|
|
|
|
|
|||||||||||||||
| Interest rate sensitivity gap |
$ | 5,631,208 | $ | (1,239,194 | ) | $ | (1,925,793 | ) | $ | (421,079 | ) | $ | 90,379 | $ | 2,093,711 | $ | 4,229,232 | |||||||||||
|
|
|
|
|
|
|
|
|
|
|
|
|
|
|
|||||||||||||||
| Cumulative interest rate sensitivity gap |
$ | 5,631,208 | $ | 4,392,014 | $ | 2,466,221 | $ | 2,045,142 | $ | 2,135,521 | $ | 4,229,232 | ||||||||||||||||
|
|
|
|
|
|
|
|
|
|
|
|
|
|||||||||||||||||
| Cumulative interest rate sensitivity gap as a percent of total assets |
15.40 | % | 12.01 | % | 6.74 | % | 5.59 | % | 5.84 | % | 11.57 | % | ||||||||||||||||
| Cumulative interest-earning assets as a percent of interest-bearing liabilities |
211.31 | % | 148.46 | % | 114.36 | % | 109.68 | % | 108.43 | % | 113.69 | % | ||||||||||||||||
Of note regarding the GAP analysis:
| • | we have $75.0 million of borrowings maturing in the next 12 months and an additional $3.93 billion maturing in the next 24 months; and |
| • | we expect that prepayment activity will decrease on our mortgage-related assets over the course of the next 12 months as interest rates have remained at relatively low levels. |
Of note in comparison to December 31, 2013:
| • | the cumulative one-year gap as a percent of total assets was positive 12.01% at December 31, 2014 vs. 6.65% at December 31, 2013 primarily due to an increase in the balance of federal funds sold and other overnight deposits to $6.16 billion at December 31, 2014 as compared to $4.19 billion at December 31, 2013. |
112
Table of Contents
| • | net loans decreased $3.19 billion to $20.75 billion at December 31, 2014 as compared to $23.94 billion at December 31, 2013. |
| • | mortgage-backed securities decreased $4.71 billion to $4.24 billion at December 31, 2014 as compared to $8.95 billion at December 31, 2013 while investment securities rose to $3.65 billion at December 31, 2014 from $336.3 million at December 31, 2013. |
| • | deposits declined by $2.10 billion during 2014. |
The methods used in the gap table are also inherently imprecise. For example, although certain assets and liabilities may have similar maturities or periods to repricing, they may react in different degrees to changes in market interest rates. Interest rates on certain types of assets and liabilities may fluctuate in advance of changes in market interest rates, while interest rates on other types may lag behind changes in market rates. Certain assets, such as adjustable-rate loans and mortgage-backed securities, have features that limit changes in interest rates on a short-term basis and over the life of the loan. If interest rates change, prepayment and early withdrawal levels would likely deviate from those assumed in calculating the table. Finally, the ability of borrowers to make payments on their adjustable-rate loans may decrease if interest rates increase.
113
Table of Contents
Item 8. Financial Statements and Supplementary Data
Report of Independent Registered Public Accounting Firm
The Board of Directors and Shareholders
Hudson City Bancorp, Inc.:
We have audited the accompanying consolidated statements of financial condition of Hudson City Bancorp, Inc. and subsidiary (the “Company”) as of December 31, 2014 and 2013, and the related consolidated statements of income, comprehensive income, changes in shareholders’ equity, and cash flows for each of the years in the three-year period ended December 31, 2014. These consolidated financial statements are the responsibility of the Company’s management. Our responsibility is to express an opinion on these consolidated financial statements based on our audits.
We conducted our audits in accordance with the standards of the Public Company Accounting Oversight Board (United States). Those standards require that we plan and perform the audit to obtain reasonable assurance about whether the financial statements are free of material misstatement. An audit includes examining, on a test basis, evidence supporting the amounts and disclosures in the financial statements. An audit also includes assessing the accounting principles used and significant estimates made by management, as well as evaluating the overall financial statement presentation. We believe that our audits provide a reasonable basis for our opinion.
In our opinion, the consolidated financial statements referred to above present fairly, in all material respects, the financial position of Hudson City Bancorp, Inc. and subsidiary as of December 31, 2014 and 2013, and the results of their operations and their cash flows for each of the years in the three-year period ended December 31, 2014, in conformity with U.S. generally accepted accounting principles.
We also have audited, in accordance with the standards of the Public Company Accounting Oversight Board (United States), the Company’s internal control over financial reporting as of December 31, 2014, based on criteria established in Internal Control—Integrated Framework (1992) issued by the Committee of Sponsoring Organizations of the Treadway Commission (COSO), and our report dated March 2, 2015 expressed an unqualified opinion on the effectiveness of the Company’s internal control over financial reporting.

New York, New York
March 2, 2015
114
Table of Contents
Report of Independent Registered Public Accounting Firm
The Board of Directors and Shareholders
Hudson City Bancorp, Inc.:
We have audited the internal control over financial reporting of Hudson City Bancorp, Inc. and subsidiary (the “Company”) as of December 31, 2014, based on criteria established in Internal Control - Integrated Framework (1992) issued by the Committee of Sponsoring Organizations of the Treadway Commission (COSO). The Company’s management is responsible for maintaining effective internal control over financial reporting and for its assessment of the effectiveness of internal control over financial reporting, included in the accompanying Management Report on Internal Control Over Financial Reporting. Our responsibility is to express an opinion on the Company’s internal control over financial reporting based on our audit.
We conducted our audit in accordance with the standards of the Public Company Accounting Oversight Board (United States). Those standards require that we plan and perform the audit to obtain reasonable assurance about whether effective internal control over financial reporting was maintained in all material respects. Our audit included obtaining an understanding of internal control over financial reporting, assessing the risk that a material weakness exists, and testing and evaluating the design and operating effectiveness of internal control based on the assessed risk. Our audit also included performing such other procedures as we considered necessary in the circumstances. We believe that our audit provides a reasonable basis for our opinion.
A company’s internal control over financial reporting is a process designed to provide reasonable assurance regarding the reliability of financial reporting and the preparation of financial statements for external purposes in accordance with generally accepted accounting principles. A company’s internal control over financial reporting includes those policies and procedures that (1) pertain to the maintenance of records that, in reasonable detail, accurately and fairly reflect the transactions and dispositions of the assets of the company; (2) provide reasonable assurance that transactions are recorded as necessary to permit preparation of financial statements in accordance with generally accepted accounting principles, and that receipts and expenditures of the company are being made only in accordance with authorizations of management and directors of the company; and (3) provide reasonable assurance regarding prevention or timely detection of unauthorized acquisition, use, or disposition of the company’s assets that could have a material effect on the financial statements.
Because of its inherent limitations, internal control over financial reporting may not prevent or detect misstatements. Also, projections of any evaluation of effectiveness to future periods are subject to the risk that controls may become inadequate because of changes in conditions, or that the degree of compliance with the policies or procedures may deteriorate.
In our opinion, Hudson City Bancorp, Inc. and subsidiary maintained, in all material respects, effective internal control over financial reporting as of December 31, 2014, based on criteria established in Internal Control - Integrated Framework (1992) issued by the Committee of Sponsoring Organizations of the Treadway Commission.
We also have audited, in accordance with the standards of the Public Company Accounting Oversight Board (United States), the consolidated statements of financial condition of the Company as of December 31, 2014 and 2013, and the related consolidated statements of income, comprehensive income, changes in shareholders’ equity, and cash flows for each of the years in the three-year period ended December 31, 2014, and our report dated March 2, 2015 expressed an unqualified opinion on those consolidated financial statements.
New York, New York
March 2, 2015
115
Table of Contents
Hudson City Bancorp, Inc. and Subsidiary
Consolidated Statements of Financial Condition
| December 31, | December 31, | |||||||
| 2014 | 2013 | |||||||
| (In thousands, except share and per share amounts) | ||||||||
| Assets: |
||||||||
| Cash and due from banks |
$ | 122,484 | $ | 133,665 | ||||
| Federal funds sold and other overnight deposits |
6,163,082 | 4,190,809 | ||||||
|
|
|
|
|
|||||
| Total cash and cash equivalents |
6,285,566 | 4,324,474 | ||||||
| Securities available for sale: |
||||||||
| Mortgage-backed securities |
2,963,304 | 7,167,555 | ||||||
| Investment securities |
3,611,045 | 297,283 | ||||||
| Securities held to maturity: |
||||||||
| Mortgage-backed securities (fair value of $1,356,160 and $1,888,823 at December 31, 2014 and 2013, respectively) |
1,272,137 | 1,784,464 | ||||||
| Investment securities (fair value of $41,593 and $42,727 at December 31, 2014 and 2013, respectively) |
39,011 | 39,011 | ||||||
|
|
|
|
|
|||||
| Total securities |
7,885,497 | 9,288,313 | ||||||
| Loans |
21,564,974 | 24,112,829 | ||||||
| Deferred loan costs |
99,155 | 105,480 | ||||||
| Allowance for loan losses |
(235,317 | ) | (276,097 | ) | ||||
|
|
|
|
|
|||||
| Net loans |
21,428,812 | 23,942,212 | ||||||
| Federal Home Loan Bank of New York stock |
320,753 | 347,102 | ||||||
| Foreclosed real estate, net |
79,952 | 70,436 | ||||||
| Accrued interest receivable |
31,665 | 52,887 | ||||||
| Banking premises and equipment, net |
56,633 | 65,353 | ||||||
| Goodwill |
152,109 | 152,109 | ||||||
| Other assets |
328,095 | 364,468 | ||||||
|
|
|
|
|
|||||
| Total Assets |
$ | 36,569,082 | $ | 38,607,354 | ||||
|
|
|
|
|
|||||
| Liabilities and Shareholders’ Equity: |
||||||||
| Deposits: |
||||||||
| Interest-bearing |
$ | 18,711,444 | $ | 20,811,108 | ||||
| Noninterest-bearing |
665,100 | 661,221 | ||||||
|
|
|
|
|
|||||
| Total deposits |
19,376,544 | 21,472,329 | ||||||
| Repurchase agreements |
6,150,000 | 6,950,000 | ||||||
| Federal Home Loan Bank of New York advances |
6,025,000 | 5,225,000 | ||||||
|
|
|
|
|
|||||
| Total borrowed funds |
12,175,000 | 12,175,000 | ||||||
| Accrued expenses and other liabilities |
236,128 | 217,449 | ||||||
|
|
|
|
|
|||||
| Total liabilities |
31,787,672 | 33,864,778 | ||||||
|
|
|
|
|
|||||
| Commitments and Contingencies (Notes 1, 7, 10 and 16) |
||||||||
| Common stock, $0.01 par value, 3,200,000,000 shares authorized; 741,466,555 shares issued; 528,908,735 and 528,419,170 shares outstanding at December 31, 2014 and 2013, respectively |
7,415 | 7,415 | ||||||
| Additional paid-in capital |
4,751,778 | 4,743,388 | ||||||
| Retained earnings |
1,961,531 | 1,883,754 | ||||||
| Treasury stock, at cost; 212,557,820 and 213,047,385 shares at December 31, 2014 and 2013, respectively |
(1,708,736 | ) | (1,712,107 | ) | ||||
| Unallocated common stock held by the employee stock ownership plan |
(180,204 | ) | (186,210 | ) | ||||
| Accumulated other comprehensive (loss) income, net of tax |
(50,374 | ) | 6,336 | |||||
|
|
|
|
|
|||||
| Total shareholders’ equity |
4,781,410 | 4,742,576 | ||||||
|
|
|
|
|
|||||
| Total Liabilities and Shareholders’ Equity |
$ | 36,569,082 | $ | 38,607,354 | ||||
|
|
|
|
|
|||||
See accompanying notes to consolidated financial statements.
116
Table of Contents
Hudson City Bancorp, Inc. and Subsidiary
Consolidated Statements of Income
| Year Ended December 31, | ||||||||||||
| 2014 | 2013 | 2012 | ||||||||||
| (In thousands, except per share data) | ||||||||||||
| Interest and Dividend Income: |
||||||||||||
| First mortgage loans |
$ | 967,084 | $ | 1,103,840 | $ | 1,309,568 | ||||||
| Consumer and other loans |
8,884 | 10,088 | 12,887 | |||||||||
| Mortgage-backed securities held to maturity |
39,708 | 75,695 | 127,861 | |||||||||
| Mortgage-backed securities available for sale |
116,113 | 140,795 | 186,174 | |||||||||
| Investment securities held to maturity |
2,340 | 2,341 | 3,488 | |||||||||
| Investment securities available for sale |
6,175 | 6,308 | 8,148 | |||||||||
| Dividends on Federal Home Loan Bank of New York stock |
14,234 | 14,689 | 23,470 | |||||||||
| Federal funds sold and other overnight deposits |
13,178 | 7,425 | 1,443 | |||||||||
|
|
|
|
|
|
|
|||||||
| Total interest and dividend income |
1,167,716 | 1,361,181 | 1,673,039 | |||||||||
|
|
|
|
|
|
|
|||||||
| Interest Expense: |
||||||||||||
| Deposits |
159,152 | 182,391 | 238,684 | |||||||||
| Borrowed funds |
566,427 | 566,277 | 580,432 | |||||||||
|
|
|
|
|
|
|
|||||||
| Total interest expense |
725,579 | 748,668 | 819,116 | |||||||||
|
|
|
|
|
|
|
|||||||
| Net interest income |
442,137 | 612,513 | 853,923 | |||||||||
| Provision for Loan Losses |
(3,500 | ) | 36,500 | 95,000 | ||||||||
|
|
|
|
|
|
|
|||||||
| Net interest income after provision for loan losses |
445,637 | 576,013 | 758,923 | |||||||||
|
|
|
|
|
|
|
|||||||
| Non-Interest Income: |
||||||||||||
| Service charges and other income |
6,669 | 10,156 | 11,461 | |||||||||
| Gains on securities transactions |
103,716 | 28,933 | — | |||||||||
|
|
|
|
|
|
|
|||||||
| Total non-interest income |
110,385 | 39,089 | 11,461 | |||||||||
|
|
|
|
|
|
|
|||||||
| Non-Interest Expense: |
||||||||||||
| Compensation and employee benefits |
129,330 | 132,733 | 129,644 | |||||||||
| Net occupancy expense |
37,421 | 36,790 | 34,270 | |||||||||
| Federal deposit insurance assessment |
49,835 | 73,463 | 123,695 | |||||||||
| Other expense |
76,443 | 66,851 | 68,993 | |||||||||
|
|
|
|
|
|
|
|||||||
| Total non-interest expense |
293,029 | 309,837 | 356,602 | |||||||||
|
|
|
|
|
|
|
|||||||
| Income before income tax expense |
262,993 | 305,265 | 413,782 | |||||||||
| Income Tax Expense |
105,028 | 120,049 | 164,639 | |||||||||
|
|
|
|
|
|
|
|||||||
| Net income |
$ | 157,965 | $ | 185,216 | $ | 249,143 | ||||||
|
|
|
|
|
|
|
|||||||
| Basic Earnings Per Share |
$ | 0.32 | $ | 0.37 | $ | 0.50 | ||||||
|
|
|
|
|
|
|
|||||||
| Diluted Earnings Per Share |
$ | 0.32 | $ | 0.37 | $ | 0.50 | ||||||
|
|
|
|
|
|
|
|||||||
See accompanying notes to consolidated financial statements.
117
Table of Contents
Hudson City Bancorp, Inc. and Subsidiary
Consolidated Statements of Comprehensive Income
| Year Ended December 31, | ||||||||||||
| 2014 | 2013 | 2012 | ||||||||||
| (In thousands) | ||||||||||||
| Net income |
$ | 157,965 | $ | 185,216 | $ | 249,143 | ||||||
| Other comprehensive income (loss), net of tax: |
||||||||||||
| Net unrealized gains (losses) on securities: |
||||||||||||
| Net unrealized gains (losses) on securities available for sale arising during the year, net of tax (expense) benefit of $(24,982) for 2014, $58,120 for 2013 and $(21,863) for 2012 |
36,314 | (84,158 | ) | 33,290 | ||||||||
| Reclassification adjustment for realized gains in net income, net of tax benefit of $35,729 for 2014, $3,126 for 2013 and $0 for 2012 |
(51,876 | ) | (4,527 | ) | — | |||||||
| Postretirement benefit pension plans: |
||||||||||||
| Net actuarial (loss) gain arising during period, net of tax benefit (expense) of $29,119 for 2014, $(14,962) for 2013 and $4,382 for 2012 |
(42,161 | ) | 21,662 | (6,346 | ) | |||||||
| Amortization of net loss arising during period, net of tax of expense $1,245 for 2014, $2,832 for 2013 and $2,823 for 2012 |
1,802 | 4,103 | 4,089 | |||||||||
| Amortization of prior service cost included in net periodic pension cost, net of tax benefit of $545 for 2014, $493 in 2013 and $493 for 2012 |
(789 | ) | (714 | ) | (714 | ) | ||||||
|
|
|
|
|
|
|
|||||||
| Other comprehensive (loss) income |
(56,710 | ) | (63,634 | ) | 30,319 | |||||||
|
|
|
|
|
|
|
|||||||
| Total comprehensive income |
$ | 101,255 | $ | 121,582 | $ | 279,462 | ||||||
|
|
|
|
|
|
|
|||||||
See accompanying notes to the consolidated financial statements.
118
Table of Contents
Hudson City Bancorp, Inc. and Subsidiary
Consolidated Statements of Changes in Shareholders’ Equity
| Year Ended December 31, | ||||||||||||
| 2014 | 2013 | 2012 | ||||||||||
| (In thousands, except per share amounts) | ||||||||||||
| Common Stock |
$ | 7,415 | $ | 7,415 | $ | 7,415 | ||||||
|
|
|
|
|
|
|
|||||||
| Additional paid-in capital: |
||||||||||||
| Balance at beginning of year |
4,743,388 | 4,730,105 | 4,720,890 | |||||||||
| Stock benefit plan expense |
11,126 | 10,489 | 7,924 | |||||||||
| Tax benefit from stock plans |
200 | 218 | 436 | |||||||||
| Allocation of ESOP stock |
3,299 | 2,576 | 835 | |||||||||
| Vesting of RRP stock |
— | — | 20 | |||||||||
| Vesting of deferred stock unit awards |
(6,235 | ) | — | — | ||||||||
|
|
|
|
|
|
|
|||||||
| Balance at end of year |
4,751,778 | 4,743,388 | 4,730,105 | |||||||||
|
|
|
|
|
|
|
|||||||
| Retained Earnings: |
||||||||||||
| Balance at beginning of year |
1,883,754 | 1,798,430 | 1,709,821 | |||||||||
| Net income |
157,965 | 185,216 | 249,143 | |||||||||
| Dividends paid on common stock ($0.16, $0.20, and $0.32 per share, respectively) |
(80,205 | ) | (99,511 | ) | (158,793 | ) | ||||||
| Exercise of stock options |
17 | (381 | ) | (1,741 | ) | |||||||
|
|
|
|
|
|
|
|||||||
| Balance at end of year |
1,961,531 | 1,883,754 | 1,798,430 | |||||||||
|
|
|
|
|
|
|
|||||||
| Treasury Stock: |
||||||||||||
| Balance at beginning of year |
(1,712,107 | ) | (1,713,895 | ) | (1,719,114 | ) | ||||||
| Purchase of common stock |
— | — | (427 | ) | ||||||||
| Purchase of vested stock awards surrendered for withholding taxes |
(2,960 | ) | — | — | ||||||||
| Exercise of stock options |
96 | 1,788 | 5,646 | |||||||||
| Vesting of deferred stock unit awards |
6,235 | — | — | |||||||||
|
|
|
|
|
|
|
|||||||
| Balance at end of year |
(1,708,736 | ) | (1,712,107 | ) | (1,713,895 | ) | ||||||
|
|
|
|
|
|
|
|||||||
| Unallocated common stock held by the ESOP: |
||||||||||||
| Balance at beginning of year |
(186,210 | ) | (192,217 | ) | (198,223 | ) | ||||||
| Allocation of ESOP stock |
6,006 | 6,007 | 6,006 | |||||||||
|
|
|
|
|
|
|
|||||||
| Balance at end of year |
(180,204 | ) | (186,210 | ) | (192,217 | ) | ||||||
|
|
|
|
|
|
|
|||||||
| Accumulated other comprehensive income (loss): |
||||||||||||
| Balance at beginning of year |
6,336 | 69,970 | 39,651 | |||||||||
| Other comprehensive (loss) income, net of tax |
(56,710 | ) | (63,634 | ) | 30,319 | |||||||
|
|
|
|
|
|
|
|||||||
| Balance at end of year |
(50,374 | ) | 6,336 | 69,970 | ||||||||
|
|
|
|
|
|
|
|||||||
| Total Shareholders’ Equity |
$ | 4,781,410 | $ | 4,742,576 | $ | 4,699,808 | ||||||
|
|
|
|
|
|
|
|||||||
See accompanying notes to the consolidated financial statements.
119
Table of Contents
Hudson City Bancorp, Inc. and Subsidiary
Consolidated Statements of Cash Flows
| Year Ended December 31, | ||||||||||||
| 2014 | 2013 | 2012 | ||||||||||
| (In thousands) | ||||||||||||
| Cash Flows from Operating Activities: |
||||||||||||
| Net income |
$ | 157,965 | $ | 185,216 | $ | 249,143 | ||||||
| Adjustments to reconcile net income to net cash provided by operating activities: |
||||||||||||
| Depreciation, accretion and amortization expense |
35,432 | 114,335 | 125,020 | |||||||||
| Provision for loan losses |
(3,500 | ) | 36,500 | 95,000 | ||||||||
| Gains on securities transactions, net |
(103,716 | ) | (28,933 | ) | — | |||||||
| Share-based compensation, including committed ESOP shares |
20,431 | 19,072 | 14,785 | |||||||||
| Deferred tax expense (benefit) |
20,707 | (3,417 | ) | 55,582 | ||||||||
| Decrease in accrued interest receivable |
21,222 | 34,188 | 42,013 | |||||||||
| (Increase) decrease in other assets |
(16,403 | ) | 404,086 | (33,222 | ) | |||||||
| Increase (decrease) in accrued expenses and other liabilities |
18,679 | (20,167 | ) | 24,931 | ||||||||
|
|
|
|
|
|
|
|||||||
| Net Cash Provided by Operating Activities |
150,817 | 740,880 | 573,252 | |||||||||
|
|
|
|
|
|
|
|||||||
| Cash Flows from Investing Activities: |
||||||||||||
| Originations of loans |
(1,145,140 | ) | (3,496,179 | ) | (5,035,170 | ) | ||||||
| Purchases of loans |
(253,716 | ) | (96,892 | ) | (28,742 | ) | ||||||
| Principal payments on loans |
3,732,005 | 6,381,717 | 7,131,786 | |||||||||
| FHA loan sale |
112,113 | — | — | |||||||||
| Principal collection of mortgage-backed securities held to maturity |
249,549 | 877,505 | 1,133,484 | |||||||||
| Proceeds from sales of mortgage-backed securities held to maturity |
278,133 | 332,660 | — | |||||||||
| Principal collection of mortgage-backed securities available for sale |
1,183,248 | 2,337,327 | 2,560,457 | |||||||||
| Proceeds from sales of mortgage-backed securities available for sale |
3,135,884 | 5,289 | — | |||||||||
| Purchases of mortgage-backed securities available for sale |
(94,422 | ) | (1,671,343 | ) | (1,473,244 | ) | ||||||
| Proceeds from maturities and calls of investment securities held to maturity |
— | — | 500,000 | |||||||||
| Proceeds from sales of investment securities available for sale |
— | 412,886 | — | |||||||||
| Purchases of investment securities available for sale |
(3,311,944 | ) | (298,033 | ) | (407,832 | ) | ||||||
| Purchases of Federal Home Loan Bank of New York stock |
— | — | (24,750 | ) | ||||||||
| Redemption of Federal Home Loan Bank of New York stock |
26,349 | 9,365 | 178,847 | |||||||||
| Purchases of premises and equipment, net |
(2,682 | ) | (973 | ) | (12,529 | ) | ||||||
| Net proceeds from sale of foreclosed real estate |
79,535 | 71,771 | 57,051 | |||||||||
|
|
|
|
|
|
|
|||||||
| Net Cash Provided by Investing Activities |
3,988,912 | 4,865,100 | 4,579,358 | |||||||||
|
|
|
|
|
|
|
|||||||
| Cash Flows from Financing Activities: |
||||||||||||
| Net decrease in deposits |
(2,095,785 | ) | (2,011,588 | ) | (2,023,843 | ) | ||||||
| Proceeds from borrowed funds |
— | — | 550,000 | |||||||||
| Principal payments on borrowed funds |
— | — | (3,450,000 | ) | ||||||||
| Dividends paid |
(80,205 | ) | (99,511 | ) | (158,793 | ) | ||||||
| Purchases of vested stock awards surrendered for witholding taxes |
(2,960 | ) | — | — | ||||||||
| Purchases of treasury stock |
— | — | (427 | ) | ||||||||
| Exercise of stock options |
113 | 1,407 | 3,905 | |||||||||
| Tax benefit from stock plans |
200 | 218 | 436 | |||||||||
|
|
|
|
|
|
|
|||||||
| Net Cash Used in Financing Activities |
(2,178,637 | ) | (2,109,474 | ) | (5,078,722 | ) | ||||||
|
|
|
|
|
|
|
|||||||
| Net Increase in Cash and Cash Equivalents |
1,961,092 | 3,496,506 | 73,888 | |||||||||
| Cash and Cash Equivalents at Beginning of Year |
4,324,474 | 827,968 | 754,080 | |||||||||
|
|
|
|
|
|
|
|||||||
| Cash and Cash Equivalents at End of Year |
$ | 6,285,566 | $ | 4,324,474 | $ | 827,968 | ||||||
|
|
|
|
|
|
|
|||||||
| Supplemental Disclosures of cash flow information: |
||||||||||||
| Interest paid |
$ | 726,553 | $ | 749,663 | $ | 822,493 | ||||||
|
|
|
|
|
|
|
|||||||
| Loans transferred to foreclosed real estate |
$ | 123,625 | $ | 126,771 | $ | 87,787 | ||||||
|
|
|
|
|
|
|
|||||||
| Income tax payments |
$ | 79,196 | $ | 106,440 | $ | 126,755 | ||||||
|
|
|
|
|
|
|
|||||||
| Income tax refunds |
$ | 460 | $ | 364,925 | $ | 5,294 | ||||||
|
|
|
|
|
|
|
|||||||
120
Table of Contents
Notes to Consolidated Financial Statements
1. Organization
Hudson City Bancorp, Inc. is a Delaware corporation and is the savings and loan holding company for Hudson City Savings Bank and its subsidiaries. As a savings and loan holding company, Hudson City Bancorp is subject to the supervision and examination of the FRB. Hudson City Savings is a federally chartered stock savings bank subject to supervision and examination by the OCC.
On August 27, 2012, the Company entered into the Merger Agreement with M&T and WTC. The Merger Agreement provides that, upon the terms and subject to the conditions set forth therein, the Company will merge with and into WTC, with WTC continuing as the surviving entity.
Subject to the terms and conditions of the Merger Agreement, in the Merger, Hudson City Bancorp shareholders will have the right to receive with respect to each of their shares of common stock of the Company, at their election (but subject to proration and adjustment procedures), 0.08403 of a share of common stock, or cash having a value equal to the product of 0.08403 multiplied by the average closing price of the M&T Common Stock for the ten days immediately prior to the completion of the Merger. The Merger Agreement also provides that at the closing of the Merger, 40% of the outstanding shares of Hudson City Bancorp common stock will be converted into the right to receive cash and the remainder of the outstanding shares of Hudson City Bancorp common stock will be converted into the right to receive shares of M&T Common Stock.
On April 12, 2013, M&T and the Company announced that additional time would be required to obtain a regulatory determination on the applications necessary to complete the proposed Merger. On three occasions, Hudson City Bancorp and M&T have agreed to extend the date after which either party may elect to terminate the Merger Agreement, with the latest extension to April 30, 2015. Each extension was documented with an amendment to the Merger Agreement and the most recent amendment, Amendment No. 3, provides that the Company may terminate the Merger Agreement at any time if it reasonably determines that M&T is unlikely to be able to obtain the requisite regulatory approvals in time to permit the closing to occur on or prior to April 30, 2015. Amendment No. 3, and applicable provisions from the prior amendments, permit the Company to take certain interim actions without the prior approval of M&T, including with respect to the Bank’s conduct of business, implementation of its strategic plan, retention incentives and certain other matters with respect to Bank personnel, prior to the completion of the Merger. There can be no assurances that the Merger will be completed by that date or that the Company will not exercise its right to terminate the Merger Agreement in accordance with its terms.
The Merger Agreement, as amended by Amendment No. 1, was approved by the shareholders of both Hudson City Bancorp and M&T. The Merger is subject to the receipt of regulatory approvals and the satisfaction of other customary closing conditions
On March 30, 2012, the Bank entered into a Memorandum of Understanding with the OCC (the “Bank MOU”), which is substantially similar to and replaced the MOU the Bank entered into with our former regulator, the Office of Thrift Supervision (the “OTS”), on June 24, 2011. In accordance with the Bank MOU, the Bank has adopted and has implemented enhanced operating policies and procedures, that are intended to enable us to continue to: (a) reduce our level of interest rate risk, (b) reduce our funding concentration, (c) diversify our funding sources, (d) enhance our liquidity position, (e) monitor and manage loan modifications and (f) maintain our capital position in accordance with our existing capital plan. In addition, we developed a written strategic plan (the “Strategic Plan”) for the Bank which establishes objectives for the Bank’s overall risk profile, earnings performance, growth and balance sheet mix and to enhance our enterprise risk management program. The Strategic Plan includes initiatives such as secondary mortgage market operations, commercial real estate lending, the introduction of small business banking products and developing a more robust suite of consumer banking products. These initiatives require significant lead time for full implementation and roll out to our customers. On February 26, 2015 the OCC terminated the Bank MOU.
121
Table of Contents
Notes to Consolidated Financial Statements
The Company entered into a separate Memorandum of Understanding with the FRB (the “Company MOU”) on April 24, 2012, which is substantially similar to and replaced the MOU the Company entered into with our former regulator, the OTS, on June 24, 2011. In accordance with the Company MOU, the Company must, among other things support the Bank’s compliance with the Bank MOU. The Company MOU also requires the Company to: (a) obtain approval from the FRB prior to receiving a capital distribution from the Bank or declaring a dividend to shareholders, and (b) obtain approval from the FRB prior to repurchasing or redeeming any Company stock or incurring any debt with a maturity of greater than one year. In accordance with the Company MOU, the Company submitted a comprehensive Capital Plan and a comprehensive Earnings Plan to the FRB. While the Company believes it is in compliance in all material respects with the Company MOU, it will remain in effect until modified or terminated by the FRB.
2. Summary of Significant Accounting Policies
Basis of Presentation
The following are the significant accounting and reporting policies applied by Hudson City Bancorp and its wholly-owned subsidiary, Hudson City Savings, in the preparation of the accompanying consolidated financial statements. The consolidated financial statements have been prepared in conformity with U.S. GAAP. All significant intercompany transactions and balances have been eliminated in consolidation. As used in these consolidated financial statements, “Hudson City” refers to Hudson City Bancorp, Inc. or Hudson City Bancorp, Inc. and its consolidated subsidiary, depending on the context. In preparing the consolidated financial statements, management is required to make estimates and assumptions that affect the reported amounts of assets and liabilities as of the date of the statements of financial condition and revenues and expenses for the period. Actual results could differ from these estimates.
The allowance for loan loss (“ALL”) is a material estimate that is particularly susceptible to near-term change. The current economic environment has increased the degree of uncertainty inherent in this material estimate. In addition, bank regulators, as an integral part of their supervisory function, periodically review our allowance for loan losses. These regulatory agencies have the ability to require us, as they can require all banks, to increase our provision for loan losses or to recognize further charge-offs based upon their judgments, which may be different from ours. Any increase in the allowance required by these regulatory agencies could adversely affect our financial condition and results of operations.
The goodwill impairment analysis depends on the use of estimates and assumptions which are highly sensitive to, among other things, market interest rates and are therefore subject to change in the near-term. Goodwill is tested for impairment at least annually and is considered impaired if the carrying value of goodwill exceeds its implied fair value. Similar to the calculation of goodwill in a business combination, the implied fair value of goodwill is determined by measuring the excess of the fair value of the reporting unit over the aggregate estimated fair values of individual assets, liabilities and identifiable intangibles as if the reporting unit was being acquired at the impairment test date. The estimation of the fair value of the Company is based on, among other things, the market price of our common stock. In addition, the fair value of the individual assets, liabilities and identifiable intangibles are determined using estimates and assumptions that are highly sensitive to market interest rates. These estimates and assumptions are subject to change in the near-term and may result in the impairment in future periods of some or all of the goodwill on our balance sheet.
122
Table of Contents
Notes to Consolidated Financial Statements
Cash and Cash Equivalents
For purposes of reporting cash flows, cash and cash equivalents includes cash on hand, amounts due from banks, federal funds sold and overnight deposits at the Federal Reserve Bank of New York. Generally, federal funds are sold for one-day periods. Cash reserves are required to be maintained on deposit with the Federal Reserve Bank of New York based on deposits. The amount of the required reserve amounted to $18.2 million and $20.3 million at December 31, 2014 and 2013, respectively.
Mortgage-Backed Securities
Mortgage-backed securities include U.S. government-sponsored enterprises (“GSEs”) and U.S. Government agency pass-through certificates, which represent participating interests in pools of long-term first mortgage loans originated and serviced by third-party issuers of the securities, and real estate mortgage investment conduits (“REMICs”), which are securities derived by reallocating cash flows from mortgage pass-through securities or from pools of mortgage loans held by a trust. REMICs are a form of, and are often referred to as, collateralized mortgage obligations.
Mortgage-backed securities are classified as either held to maturity or available for sale. For each of the years in, the three year period ended December 31, 2014, we did not maintain a trading portfolio. Mortgage-backed securities classified as held to maturity are stated at cost, adjusted for amortization of premiums and accretion of discounts. Hudson City has both the ability and the positive intent to hold these investment securities to maturity although we periodically sell held-to-maturity securities after the Company has collected at least 85% of the initial principal balance purchased.
Mortgage-backed securities available for sale are carried at fair value, with unrealized gains and losses, net of tax, reported as a component of other comprehensive income or loss, which is included in shareholders’ equity.
Amortization and accretion of premiums and discounts are reflected as an adjustment to interest income over the life of the security, adjusted for estimated prepayments, using the effective interest method. Realized gains and losses are recognized when securities are sold using the specific identification method. The estimated fair value of substantially all of these securities is determined by the use of market prices obtained from independent third-party pricing services. We assess the reasonableness of the fair values obtained by reference to a second independent nationally recognized pricing service. We conduct a periodic review and evaluation of the securities portfolio to determine if a decline in the fair value of any security below its cost basis is other-than-temporary. Our evaluation of other-than-temporary impairment considers the duration and severity of the unrealized loss, our intent to sell the security and whether it is more likely than not that we will be required to sell before full recovery of our investment or maturity. For mortgage-backed securities deemed to be other-than-temporarily impaired, the security is written down to a new cost basis with the estimated credit loss charged to income as a component of non-interest expense and the non-credit related impairment loss charged to other comprehensive income. See “Critical Accounting Policies – Securities Impairment”.
Investment Securities
Investment securities are classified as either held to maturity or available for sale. For each of the years in the three year period ended December 31, 2014, we did not maintain a trading portfolio. Investment securities classified as held to maturity are stated at cost, adjusted for amortization of premiums and accretion of discounts. Hudson City has both the ability and the positive intent to hold these investment securities to maturity.
Investment securities available for sale are carried at fair value, with unrealized gains and losses, net of tax, reported as a component of other comprehensive income or loss, which is included in shareholders’ equity.
123
Table of Contents
Notes to Consolidated Financial Statements
Amortization and accretion of premiums and discounts are reflected as an adjustment to interest income over the life of the security using the effective interest method. Realized gains and losses are recognized when securities are sold or called using the specific identification method. The estimated fair value of substantially all of these securities is determined by the use of quoted market prices obtained from independent third-party pricing services. We assess the reasonableness of the fair values obtained by reference to a second independent nationally recognized pricing service. We conduct a periodic review and evaluation of the securities portfolio to determine if a decline in the fair value of any security below its cost basis is other-than-temporary. Our evaluation of other-than-temporary impairment considers the duration and severity of the unrealized loss, our intent to sell the security and whether it is more likely than not that we will be required to sell before full recovery of our investment or maturity. For debt securities deemed to be other-than-temporarily impaired, the security is written down to a new cost basis with the estimated credit loss charged to income as a component of non-interest expense and the non-credit related impairment loss charged to other comprehensive income. For equity securities that are deemed to be other-than-temporarily impaired, the security is written down to a new cost basis and the resulting loss is charged to income as a component of non-interest expense. See “Critical Accounting Policies – Securities Impairment”.
Loans
Loans are stated at their principal amounts outstanding. Interest income on loans is accrued and credited to income as earned. Net loan origination fees and broker costs are deferred and amortized to interest income over the life of the loan using the effective interest method. Amortization and accretion of premiums and discounts is reflected as an adjustment to interest income over the life of the purchased loan using the effective interest method.
A loan is considered delinquent when we have not received a payment within 30 days of its contractual due date. The accrual of income on loans that are not guaranteed by a U.S. Government agency is generally discontinued when interest or principal payments are 90 days in arrears or when the timely collection of such income is doubtful. Loans on which the accrual of income has been discontinued are designated as non-accrual loans and outstanding interest previously credited to income is reversed. Interest income on non-accrual loans and impaired loans is recognized in the period collected unless the ultimate collection of principal is considered doubtful. A non-accrual loan is returned to accrual status when factors indicating doubtful collection no longer exist.
We will, in certain circumstances, modify loans for borrowers who are experiencing financial difficulty. If the terms of the modification include a concession, as defined by accounting guidance, the loan, as modified, is considered a trouble debt restructuring. Loans that were modified in a troubled debt restructuring primarily represent loans to borrowers whose loans have been discharged in a Chapter 7 bankruptcy, loans that have been in a deferred payment plan for an extended period of time, generally in excess of six months, loans that have had past due amounts capitalized as part of the loan balance, loans that have a confirmed Chapter 13 bankruptcy status and loans with other types of repayment plans. These loans are individually evaluated for impairment to determine if the carrying value of the loan is in excess of the fair value of the collateral, if the loan is collateral dependent, or the present value of each loan’s expected future cash flows, if the loan is cash flow dependent.
Hudson City Savings defines the population of potential impaired loans to be all non-accrual construction, commercial real estate and multi-family loans as well as loans classified as troubled debt restructurings. Impaired loans are individually assessed to determine that the loan’s carrying value is not in excess of the fair value of the collateral or the present value of the loan’s expected future cash flows. Smaller balance homogeneous loans that are collectively evaluated for impairment, such as residential mortgage loans and consumer loans, are specifically excluded from the impaired loan analysis unless they have been modified as a troubled debt restructuring.
124
Table of Contents
Notes to Consolidated Financial Statements
Allowance for Loan Losses
The ALL has been determined in accordance with U.S. generally accepted accounting principles (“U.S. GAAP”), under which we are required to maintain adequate allowances for loan losses. We are responsible for the timely and periodic determination of the amount of the allowance required. We believe that our ALL is adequate to cover specifically identifiable loan losses, as well as estimated losses inherent in our portfolio for which certain losses are probable but not specifically identifiable.
Due to the nature of our loan portfolio, our evaluation of the adequacy of our ALL is performed primarily on a “pooled” basis. Each quarter we prepare an analysis which categorizes the entire loan portfolio by certain risk characteristics such as loan type (fixed-rate and adjustable-rate one- to four-family mortgages, interest-only loans, reduced documentation loans, home equity, multi-family, commercial, construction, etc.), loan source (originated or purchased) and payment status (i.e., current or number of days delinquent). Loans with known losses are categorized separately. We assign loss factors to the payment status categories on the basis of our assessment of the risk inherent in each loan type. These factors are periodically reviewed for appropriateness giving consideration to charge-off history, delinquency trends, portfolio growth and the status of the regional economy and housing market, in order to ascertain that the loss factors cover probable and estimable losses inherent in the portfolio. Other key factors we consider in this process are current real estate market conditions in geographic areas where our loans are located, changes in the trend of non-performing loans, the results of our foreclosed property transactions, the current state of the local and national economy, changes in interest rates and loan portfolio growth. Any one or a combination of these adverse trends may adversely affect our loan portfolio resulting in increased delinquencies, loan losses and higher future levels of provisions.
We maintain the ALL through provisions for loan losses that we charge to income. We charge losses on loans against the ALL when we believe the collection of loan principal is unlikely. This is generally by the time a loan is 180 days delinquent and an updated appraisal reflects a shortfall in the collateral value as compared to the outstanding principal balance of a mortgage loan. We establish the provision for loan losses after considering the results of our review as described above. We apply this process and methodology in a consistent manner and we reassess and modify the estimation methods and assumptions used in response to changing conditions. Such changes, if any, are approved by our Asset Quality Committee (“AQC”) each quarter.
Federal Home Loan Bank of New York Stock
As a member of the Federal Home Loan Bank of New York (the “FHLB”), we are required to acquire and hold shares of FHLB Class B stock. Our holding requirement varies based on our activities, primarily our outstanding borrowings, with the FHLB. Our investment in FHLB stock is carried at cost. We conduct a periodic review and evaluation of our FHLB stock to determine if any impairment exists.
Foreclosed Real Estate
Foreclosed real estate is property acquired through foreclosure or deed in lieu of foreclosure. Write-downs to fair value (net of estimated cost to sell) at the time of acquisition are charged to the ALL. After acquisition, foreclosed properties are held for sale and carried at the lower of carrying value or fair value less estimated selling costs. Fair value is estimated through current appraisals, where practical, or an inspection and a comparison of the property securing the loan with similar properties in the area by either a licensed appraiser or real estate broker. Subsequent provisions for losses, which may result from the ongoing periodic valuations of these properties, are charged to income in the period in which they are identified. Carrying costs, such as maintenance and taxes, are charged to operating expenses as incurred.
125
Table of Contents
Notes to Consolidated Financial Statements
Banking Premises and Equipment
Land is carried at cost. Buildings, leasehold improvements and furniture, fixtures and equipment are carried at cost, less accumulated depreciation and leasehold amortization. Buildings are depreciated over their estimated useful lives using the straight-line method. Furniture, fixtures and equipment are depreciated over their estimated useful lives using the double declining balance method. Leasehold improvements are amortized over the shorter of their estimated useful lives or the term of the respective leases. The costs for major improvements and renovations are capitalized, while maintenance, repairs and minor improvements are charged to operating expenses as incurred. Gains and losses on dispositions are reflected currently as other non-interest income or expense.
Goodwill and Other Intangible Assets
Goodwill and intangible assets with indefinite useful lives are tested for impairment at least annually using a fair-value based two-step approach.
The first step (“Step 1”) used to identify potential impairment involves comparing each reporting unit’s estimated fair value to its carrying amount, including goodwill. As a community-oriented bank, substantially all of the Company’s operations involve the delivery of loan and deposit products to customers and these operations constitute the Company’s only segment for financial reporting purposes. If the estimated fair value of a reporting unit exceeds its carrying amount, goodwill is not considered to be impaired. If the carrying amount exceeds the estimated fair value, there is an indication of potential impairment and the second step (“Step 2”) is performed to measure the amount. Step 2 involves calculating an implied fair value of goodwill for each reporting unit for which impairment was indicated in Step 1. The implied fair value of goodwill is determined in a manner similar to the amount of goodwill calculated in a business combination by measuring the excess of the estimated fair value of the reporting unit, as determined in Step 1, over the aggregate estimated fair values of the individual assets, liabilities, and identifiable intangibles, as if the reporting unit was being acquired at the impairment test date. We also perform interim impairment reviews if certain triggering events occur which may indicate that the fair value of goodwill is less than the carrying value. Subsequent reversal of goodwill impairment losses is not permitted.
Income Taxes
We utilize the asset and liability method of accounting for income taxes. Under this method, deferred tax assets and liabilities are recognized for the future tax consequences attributable to differences between the financial statement carrying amounts of existing assets and liabilities and their respective tax bases.
Deferred tax assets and liabilities are measured using enacted tax rates expected to apply to taxable income in the years in which those temporary differences are expected to be recovered or settled. The effect on deferred tax assets and liabilities of a change in tax rates is recognized in income in the period that includes the enactment date. Certain tax benefits attributable to stock options and restricted stock are credited to additional paid-in capital. A valuation allowance is established when management is unable to conclude that it is more likely than not that it will realize deferred tax assets based on the nature and timing of these items. Tax positions taken, or expected to be taken, in a tax return and which meet recognition thresholds, are recognized in our financial statements based on measurement attributes prescribed in accounting guidance. Accruals of interest and penalties related to unrecognized tax benefits are recognized in income tax expense.
Employee Benefit Plans
Hudson City maintains certain noncontributory retirement and postretirement benefit plans, which cover employees hired prior to August 1, 2005 who have met the eligibility requirements of the plans. Certain health care and life insurance benefits are provided for retired employees. The expected cost of benefits provided for retired employees is actuarially determined and accrued ratably from the date of hire to the date the employee is fully eligible to receive the benefits.
126
Table of Contents
Notes to Consolidated Financial Statements
The accounting guidance related to retirement benefits requires an employer to: (a) recognize in its statement of financial position an asset for a plan’s overfunded status or a liability for a plan’s underfunded status; (b) measure a plan’s assets and its obligations that determine its funded status as of the end of the employer’s fiscal year; and (c) recognize, in comprehensive income, changes in the funded status of a defined benefit postretirement plan in the year in which the changes occur.
The Employee Stock Ownership Plan (the “ESOP”) is accounted for in accordance with FASB guidance related to employee stock ownership plans. The funds borrowed by the ESOP from Hudson City Bancorp to purchase Hudson City Bancorp common stock are being repaid from Hudson City Savings’ contributions and dividends paid on unallocated ESOP shares over a period of up to 40 years. Hudson City common stock not allocated to participants is recorded as a reduction of stockholders’ equity at cost. Compensation expense for the ESOP is based on the average market price of our stock during each quarter.
Stock-Based Compensation
Stock-based compensation expense is recognized over the period of requisite service based upon the grant-date fair value of those awards. Grants of performance-based stock options and stock unit awards vest if certain financial performance measures are met. We assess the probability of achieving these financial performance measures and recognize the cost of these performance-based grants if it is probable that the financial performance measures will be met.
Bank-Owned Life Insurance
Bank-owned life insurance (“BOLI”) is accounted for in accordance with FASB guidance related to Split-Dollar Life Insurance Agreements. The cash surrender value of BOLI is recorded on our consolidated statement of financial condition as an asset and the change in the cash surrender value is recorded as non-interest income. The amount by which any death benefits received exceeds a policy’s cash surrender value is recorded in non-interest income at the time of receipt. A liability is also recorded on our consolidated statement of financial condition for postretirement death benefits provided by the split-dollar endorsement policy. A corresponding expense is recorded in non-interest expense for the accrual of benefits over the period during which employees provide services to earn the benefits.
Borrowed Funds
Hudson City enters into sales of securities under agreements to repurchase with selected brokers and the FHLB. These agreements are recorded as financing transactions as Hudson City maintains effective control over the transferred securities. The dollar amount of the securities underlying the agreements continues to be carried in Hudson City’s securities portfolio. The obligations to repurchase the securities are reported as a liability in the consolidated statements of financial condition. The securities underlying the agreements are delivered to the party with whom each transaction is executed. They agree to resell to Hudson City the same securities at the maturity or call of the agreement. Hudson City retains the right of substitution of the underlying securities throughout the terms of the agreements.
Hudson City has also obtained advances from the FHLB, which are generally secured by a blanket lien against our mortgage loan portfolio. Total borrowings with the FHLB are generally limited by approximately 20 times the amount of FHLB stock owned or a percentage of the fair value of our mortgage portfolio, whichever is greater.
127
Table of Contents
Notes to Consolidated Financial Statements
Comprehensive Income
Comprehensive income is comprised of net income and other comprehensive income (loss). Other comprehensive income includes items such as changes in unrealized gains and losses on securities available for sale, net of tax and changes in the unrecognized prior service costs or credits of defined benefit pension and other postretirement plans, net of tax. Comprehensive income is presented in the consolidated statements of comprehensive income.
Segment Information
FASB guidance requires public companies to report certain financial information about significant revenue-producing segments of the business for which such information is available and utilized by the chief operating decision maker. As a community-oriented financial institution, substantially all of our operations involve the delivery of loan and deposit products to customers. Management makes operating decisions and assesses performance based on an ongoing review of these community banking operations, which constitute our only operating segment for financial reporting purposes.
Earnings per Share
Basic earnings per share is computed pursuant to the two class method by dividing net income available to common shareholders less dividends paid on participating securities by the weighted average number of shares outstanding for the period. Diluted earnings per share reflects the potential dilution that could occur if securities or other contracts to issue common stock (such as stock options or deferred stock units) were exercised or resulted in the issuance of common stock. These potentially dilutive shares would then be included in the weighted average number of shares outstanding for the period using the treasury stock method. Shares issued and shares reacquired during any period are weighted for the portion of the period that they were outstanding.
In computing both basic and diluted earnings per share, the weighted average number of common shares outstanding includes the ESOP shares previously allocated to participants and shares committed to be released for allocation to participants and shares issues for vested stock unit awards. ESOP and stock unit awards that have been purchased but have not been committed to be released are excluded from the computation of basic and diluted earnings per share.
3. Stock Repurchase Programs
Pursuant to our stock repurchase programs, shares of Hudson City Bancorp common stock may be purchased in the open market or through other privately negotiated transactions, depending on market conditions. The repurchased shares are held as treasury stock for general corporate use. In accordance with the terms of the Company MOU, future share repurchases must be approved by the FRB. In addition, pursuant to the terms of the Merger Agreement, we may not repurchase shares of Hudson City Bancorp common stock without the consent of M&T. We did not purchase any of our common shares pursuant to the repurchase programs during 2014, 2013 and 2012. Included in treasury stock are vested shares related to stock awards that were surrendered for withholding taxes. These shares are included in treasury stock purchases in the consolidated statements of cash flows and amounted to 297,351 shares for 2014. There were no shares surrendered for withholding taxes in 2013. As of December 31, 2014, there remained 50,123,550 shares that may be purchased under the existing stock repurchase programs.
128
Table of Contents
Notes to Consolidated Financial Statements
4. Mortgage-Backed Securities
The amortized cost and estimated fair value of mortgage-backed securities at December 31 are as follows:
| Gross | Gross | |||||||||||||||
| Amortized | Unrealized | Unrealized | Estimated | |||||||||||||
| Cost | Gains | Losses | Fair Value | |||||||||||||
| (In thousands) | ||||||||||||||||
| 2014 |
||||||||||||||||
| Held to Maturity: |
||||||||||||||||
| GNMA pass-through certificates |
$ | 54,301 | $ | 1,840 | $ | — | $ | 56,141 | ||||||||
| FNMA pass-through certificates |
278,953 | 20,209 | (1 | ) | 299,161 | |||||||||||
| FHLMC pass-through certificates |
865,364 | 58,097 | — | 923,461 | ||||||||||||
| FHLMC and FNMA—REMICs |
73,519 | 3,878 | — | 77,397 | ||||||||||||
|
|
|
|
|
|
|
|
|
|||||||||
| Total held to maturity |
$ | 1,272,137 | $ | 84,024 | $ | (1 | ) | $ | 1,356,160 | |||||||
|
|
|
|
|
|
|
|
|
|||||||||
| Available for Sale: |
||||||||||||||||
| GNMA pass-through certificates |
$ | 633,629 | $ | 20,056 | $ | (277 | ) | $ | 653,408 | |||||||
| FNMA pass-through certificates |
1,688,568 | 19,247 | (11,917 | ) | 1,695,898 | |||||||||||
| FHLMC pass-through certificates |
604,147 | 12,191 | (2,340 | ) | 613,998 | |||||||||||
|
|
|
|
|
|
|
|
|
|||||||||
| Total available for sale |
$ | 2,926,344 | $ | 51,494 | $ | (14,534 | ) | $ | 2,963,304 | |||||||
|
|
|
|
|
|
|
|
|
|||||||||
| 2013 |
||||||||||||||||
| Held to Maturity: |
||||||||||||||||
| GNMA pass-through certificates |
$ | 63,070 | $ | 2,260 | $ | — | $ | 65,330 | ||||||||
| FNMA pass-through certificates |
402,848 | 25,103 | (1 | ) | 427,950 | |||||||||||
| FHLMC pass-through certificates |
1,123,029 | 66,816 | (1 | ) | 1,189,844 | |||||||||||
| FHLMC and FNMA—REMICs |
195,517 | 10,182 | — | 205,699 | ||||||||||||
|
|
|
|
|
|
|
|
|
|||||||||
| Total held to maturity |
$ | 1,784,464 | $ | 104,361 | $ | (2 | ) | $ | 1,888,823 | |||||||
|
|
|
|
|
|
|
|
|
|||||||||
| Available for Sale: |
||||||||||||||||
| GNMA pass-through certificates |
$ | 788,504 | $ | 17,775 | $ | (1,396 | ) | $ | 804,883 | |||||||
| FNMA pass-through certificates |
3,879,723 | 50,800 | (39,800 | ) | 3,890,723 | |||||||||||
| FHLMC pass-through certificates |
2,396,085 | 46,300 | (8,947 | ) | 2,433,438 | |||||||||||
| FHLMC and FNMA—REMICs |
38,220 | 291 | — | 38,511 | ||||||||||||
|
|
|
|
|
|
|
|
|
|||||||||
| Total available for sale |
$ | 7,102,532 | $ | 115,166 | $ | (50,143 | ) | $ | 7,167,555 | |||||||
|
|
|
|
|
|
|
|
|
|||||||||
129
Table of Contents
Notes to Consolidated Financial Statements
The following tables summarize the fair values and unrealized losses of mortgage-backed securities with an unrealized loss at December 31, 2014 and 2013, segregated between securities that had been in a continuous unrealized loss position for less than twelve months or longer than twelve months at the respective dates.
| Less Than 12 Months | 12 Months or Longer | Total | ||||||||||||||||||||||
| Unrealized | Unrealized | Unrealized | ||||||||||||||||||||||
| Fair Value | Losses | Fair Value | Losses | Fair Value | Losses | |||||||||||||||||||
| (In thousands) | ||||||||||||||||||||||||
| 2014 |
||||||||||||||||||||||||
| Held to Maturity: |
||||||||||||||||||||||||
| FNMA pass-through certificates |
$ | — | $ | — | $ | 90 | $ | (1 | ) | $ | 90 | $ | (1 | ) | ||||||||||
|
|
|
|
|
|
|
|
|
|
|
|
|
|||||||||||||
| Total held to maturity |
— | — | 90 | (1 | ) | 90 | (1 | ) | ||||||||||||||||
|
|
|
|
|
|
|
|
|
|
|
|
|
|||||||||||||
| Available for Sale: |
||||||||||||||||||||||||
| GNMA pass-through certificates |
— | — | 11,251 | (277 | ) | 11,251 | (277 | ) | ||||||||||||||||
| FNMA pass-through certificates |
48,955 | (54 | ) | 664,779 | (11,863 | ) | 713,734 | (11,917 | ) | |||||||||||||||
| FHLMC pass-through certificates |
— | — | 151,889 | (2,340 | ) | 151,889 | (2,340 | ) | ||||||||||||||||
|
|
|
|
|
|
|
|
|
|
|
|
|
|||||||||||||
| Total available for sale |
48,955 | (54 | ) | 827,919 | (14,480 | ) | 876,874 | (14,534 | ) | |||||||||||||||
|
|
|
|
|
|
|
|
|
|
|
|
|
|||||||||||||
| Total |
$ | 48,955 | $ | (54 | ) | $ | 828,009 | $ | (14,481 | ) | $ | 876,964 | $ | (14,535 | ) | |||||||||
|
|
|
|
|
|
|
|
|
|
|
|
|
|||||||||||||
| 2013 |
||||||||||||||||||||||||
| Held to Maturity: |
||||||||||||||||||||||||
| FNMA pass-through certificates |
$ | — | — | $ | 65 | $ | (1 | ) | $ | 65 | $ | (1 | ) | |||||||||||
| FHLMC pass-through certificates |
166 | (1 | ) | — | — | 166 | (1 | ) | ||||||||||||||||
|
|
|
|
|
|
|
|
|
|
|
|
|
|||||||||||||
| Total held to maturity |
166 | (1 | ) | 65 | (1 | ) | 231 | (2 | ) | |||||||||||||||
|
|
|
|
|
|
|
|
|
|
|
|
|
|||||||||||||
| Available for Sale: |
||||||||||||||||||||||||
| GNMA pass-through certificates |
35,971 | (1,396 | ) | — | — | 35,971 | (1,396 | ) | ||||||||||||||||
| FNMA pass-through certificates |
1,478,488 | (39,800 | ) | — | — | 1,478,488 | (39,800 | ) | ||||||||||||||||
| FHLMC pass-through certificates |
434,059 | (8,947 | ) | — | — | 434,059 | (8,947 | ) | ||||||||||||||||
|
|
|
|
|
|
|
|
|
|
|
|
|
|||||||||||||
| Total available for sale |
1,948,518 | (50,143 | ) | — | — | 1,948,518 | (50,143 | ) | ||||||||||||||||
|
|
|
|
|
|
|
|
|
|
|
|
|
|||||||||||||
| Total |
$ | 1,948,684 | $ | (50,144 | ) | $ | 65 | $ | (1 | ) | $ | 1,948,749 | $ | (50,145 | ) | |||||||||
|
|
|
|
|
|
|
|
|
|
|
|
|
|||||||||||||
The unrealized losses were primarily due to the changes in market interest rates subsequent to purchase. At December 31, 2014, a total of 34 securities were in an unrealized loss position (79 at December 31, 2013). We did not consider these investments to be other-than-temporarily impaired at December 31, 2014 and December 31, 2013 since the decline in fair value is attributable to changes in interest rates and not credit quality. In addition, we do not intend to sell and do not believe that it is more likely than not that we will be required to sell these investments until there is a full recovery of the unrealized loss, which may be at maturity. As a result no impairment loss was recognized during the year ended December 31, 2014.
130
Table of Contents
Notes to Consolidated Financial Statements
The amortized cost and estimated fair value of mortgage-backed of our securities held-to-maturity and available-for-sale at December 31, 2014, by contractual maturity, are shown below. The table does not include the effect of prepayments or scheduled principal amortization. The expected maturity may differ from the contractual maturity because issuers may have the right to call or prepay obligations. Equity securities have been excluded from this table.
| Amortized | Estimated | |||||||
| Cost | Fair Value | |||||||
| (In thousands) | ||||||||
| Held to Maturity: |
||||||||
| Due in one year or less |
$ | 22 | $ | 22 | ||||
| Due after one year through five years |
2,457 | 2,546 | ||||||
| Due after five years through ten years |
37,345 | 39,424 | ||||||
| Due after ten years |
1,232,313 | 1,314,168 | ||||||
|
|
|
|
|
|||||
| Total held to maturity |
$ | 1,272,137 | $ | 1,356,160 | ||||
|
|
|
|
|
|||||
| Available for Sale: |
||||||||
| Due after five years through ten years |
$ | 19,751 | $ | 21,840 | ||||
| Due after ten years |
2,906,593 | 2,941,464 | ||||||
|
|
|
|
|
|||||
| Total available for sale |
$ | 2,926,344 | $ | 2,963,304 | ||||
|
|
|
|
|
|||||
Sales of mortgage-backed securities held-to-maturity amounted to $262.0 million for 2014 and $311.4 million for 2013, resulting in realized gains of $16.1 million and $21.3 million for the same respective periods. The sale of the held-to-maturity securities were made after the Company had collected at least 85% of the initial principal balance of each security.
Sales of mortgage-backed securities available-for-sale amounted to $3.05 billion during 2014 and $4.8 million in 2013. Realized gains on the sales of mortgage-backed securities available-for-sale amounted to $87.6 million and $470,000 during 2014 and 2013, respectively.
As of December 31, 2014, mortgage-backed securities with an amortized cost of $3.77 billion were pledged as collateral for securities sold under agreements to repurchase.
131
Table of Contents
Notes to Consolidated Financial Statements
5. Investment Securities
The amortized cost and estimated fair value of investment securities at December 31 are as follows:
| Gross | Gross | |||||||||||||||
| Amortized | Unrealized | Unrealized | Estimated | |||||||||||||
| Cost | Gains | Losses | Fair Value | |||||||||||||
| (In thousands) | ||||||||||||||||
| 2014 |
||||||||||||||||
| Held to Maturity: |
||||||||||||||||
| United States government-sponsored enterprises debt |
$ | 39,011 | $ | 2,582 | $ | — | $ | 41,593 | ||||||||
|
|
|
|
|
|
|
|
|
|||||||||
| Total held to maturity |
$ | 39,011 | $ | 2,582 | $ | — | $ | 41,593 | ||||||||
|
|
|
|
|
|
|
|
|
|||||||||
| Available for Sale: |
||||||||||||||||
| United States government-sponsored enterprises debt |
$ | 3,600,085 | $ | 72 | $ | (6,508 | ) | $ | 3,593,649 | |||||||
| Equity securities |
16,985 | 411 | — | 17,396 | ||||||||||||
|
|
|
|
|
|
|
|
|
|||||||||
| Total available for sale |
$ | 3,617,070 | $ | 483 | $ | (6,508 | ) | $ | 3,611,045 | |||||||
|
|
|
|
|
|
|
|
|
|||||||||
| 2013 |
||||||||||||||||
| Held to Maturity: |
||||||||||||||||
| United States government-sponsored enterprises debt |
$ | 39,011 | $ | 3,716 | $ | — | $ | 42,727 | ||||||||
|
|
|
|
|
|
|
|
|
|||||||||
| Total held to maturity |
$ | 39,011 | $ | 3,716 | $ | — | $ | 42,727 | ||||||||
|
|
|
|
|
|
|
|
|
|||||||||
| Available for Sale: |
||||||||||||||||
| United States government-sponsored enterprises debt |
$ | 298,190 | $ | — | $ | (7,996 | ) | $ | 290,194 | |||||||
| Equity securities |
6,873 | 216 | — | 7,089 | ||||||||||||
|
|
|
|
|
|
|
|
|
|||||||||
| Total available for sale |
$ | 305,063 | $ | 216 | $ | (7,996 | ) | $ | 297,283 | |||||||
|
|
|
|
|
|
|
|
|
|||||||||
The following tables summarize the fair values and unrealized losses of available-for-sale investment securities with an unrealized loss at December 31, 2014, segregated between securities that had been in a continuous unrealized loss position for less than twelve months or longer than twelve months at the respective dates. For the years ended December 31, 2014 and 2013, there were no unrealized losses on held-to-maturity investment securities.
| Less Than 12 Months | 12 Months or Longer | Total | ||||||||||||||||||||||
| Unrealized | Unrealized | Unrealized | ||||||||||||||||||||||
| Fair Value | Losses | Fair Value | Losses | Fair Value | Losses | |||||||||||||||||||
| (In thousands) | ||||||||||||||||||||||||
| 2014 |
||||||||||||||||||||||||
| Available for Sale: |
||||||||||||||||||||||||
| United States government-sponsored enterprises debt |
$ | 3,047,275 | $ | (3,342 | ) | $ | 196,674 | $ | (3,166 | ) | $ | 3,243,949 | $ | (6,508 | ) | |||||||||
|
|
|
|
|
|
|
|
|
|
|
|
|
|||||||||||||
| Total temporarily impaired securities available for sale |
3,047,275 | (3,342 | ) | 196,674 | (3,166 | ) | 3,243,949 | (6,508 | ) | |||||||||||||||
|
|
|
|
|
|
|
|
|
|
|
|
|
|||||||||||||
| Total |
$ | 3,047,275 | $ | (3,342 | ) | $ | 196,674 | $ | (3,166 | ) | $ | 3,243,949 | $ | (6,508 | ) | |||||||||
|
|
|
|
|
|
|
|
|
|
|
|
|
|||||||||||||
| 2013 |
||||||||||||||||||||||||
| Available for Sale: |
||||||||||||||||||||||||
| United States government-sponsored enterprises debt |
$ | 290,194 | $ | (7,996 | ) | $ | — | $ | — | $ | 290,194 | $ | (7,996 | ) | ||||||||||
|
|
|
|
|
|
|
|
|
|
|
|
|
|||||||||||||
| Total temporarily impaired securities available for sale |
290,194 | (7,996 | ) | 290,194 | (7,996 | ) | ||||||||||||||||||
|
|
|
|
|
|
|
|
|
|
|
|
|
|||||||||||||
| Total |
$ | 290,194 | $ | (7,996 | ) | $ | — | $ | — | $ | 290,194 | $ | (7,996 | ) | ||||||||||
|
|
|
|
|
|
|
|
|
|
|
|
|
|||||||||||||
At December 31, 2014, a total of 17 securities were in an unrealized loss position (3 at December 31, 2013). We did not consider these investments to be other-than-temporarily impaired at December 31, 2014 since the decline in market value is attributable to changes in interest rates and not credit quality. In addition, we do not
132
Table of Contents
Notes to Consolidated Financial Statements
intend to sell and do not believe that it is more likely than not that we will be required to sell these investments until there is a full recovery of the unrealized loss, which may be at maturity. As a result no impairment loss was recognized during the year ended December 31, 2014.
The amortized cost and estimated fair value of investment securities held to maturity and available for sale at December 31, 2014, by contractual maturity, are shown below. The expected maturity may differ from the contractual maturity because issuers may have the right to call or prepay obligations. Equity securities have been excluded from this table.
| Amortized | Estimated | |||||||
| Cost | Fair Value | |||||||
| (In thousands) | ||||||||
| Held to Maturity: |
||||||||
| Due after ten years |
$ | 39,011 | $ | 41,593 | ||||
|
|
|
|
|
|||||
| Total held to maturity |
$ | 39,011 | $ | 41,593 | ||||
|
|
|
|
|
|||||
| Available for Sale: |
||||||||
| Due in one year or less |
$ | 300,147 | $ | 300,152 | ||||
| Due after one year through five years |
$ | 3,299,938 | $ | 3,293,497 | ||||
|
|
|
|
|
|||||
| Total available for sale |
$ | 3,600,085 | $ | 3,593,649 | ||||
|
|
|
|
|
|||||
There were no sales of investment securities available-for-sale during 2014. In 2013 there were $405.7 million in sales of investment securities available for sale resulting in realized gains of $7.2 million. The carrying value of securities pledged as required security for deposits and for other purposes required by law amounted to $17.1 million and $22.4 million at December 31, 2014 and 2013, respectively.
As of December 31, 2014, investment securities with an amortized cost of $3.50 billion were pledged as collateral for securities sold under agreements to repurchase compared to $298.2 for December 31, 2013.
6. Loans and Allowance for Loan Losses
Loans at December 31 are summarized as follows:
| 2014 | 2013 | |||||||
| (In thousands) | ||||||||
| First mortgage loans: |
||||||||
| One- to four-family |
||||||||
| Amortizing |
$ | 17,746,149 | $ | 19,518,912 | ||||
| Interest-only |
2,874,024 | 3,648,732 | ||||||
| FHA/VA |
648,070 | 704,532 | ||||||
| Multi-family and commercial |
102,323 | 25,671 | ||||||
| Construction |
177 | 294 | ||||||
|
|
|
|
|
|||||
| Total first mortgage loans |
21,370,743 | 23,898,141 | ||||||
|
|
|
|
|
|||||
| Consumer and other loans: |
||||||||
| Fixed–rate second mortgages |
72,309 | 86,079 | ||||||
| Home equity credit lines |
104,372 | 108,550 | ||||||
| Other |
17,550 | 20,059 | ||||||
|
|
|
|
|
|||||
| Total consumer and other loans |
194,231 | 214,688 | ||||||
|
|
|
|
|
|||||
| Total loans |
$ | 21,564,974 | $ | 24,112,829 | ||||
|
|
|
|
|
|||||
133
Table of Contents
Notes to Consolidated Financial Statements
There were no loans held for sale at December 31, 2014 and 2013.
The following tables present the composition of our loan portfolio by credit quality indicator at December 31:
| Credit Risk Profile based on Payment Activity |
||||||||||||||||||||||||||||||||
| (In thousands) | ||||||||||||||||||||||||||||||||
| One-to four- family first mortgage loans |
Other first Mortgages |
Consumer and Other | Total Loans |
|||||||||||||||||||||||||||||
| Amortizing | Interest-only | Multi-family and Commercial |
Construction | Fixed-rate second mortgages |
Home Equity credit lines |
Other | ||||||||||||||||||||||||||
| 2014 |
||||||||||||||||||||||||||||||||
| Performing |
$ | 17,652,318 | $ | 2,774,245 | $ | 100,780 | $ | — | $ | 71,056 | $ | 100,607 | $ | 13,955 | $ | 20,712,961 | ||||||||||||||||
| Non-performing |
741,901 | 99,779 | 1,543 | 177 | 1,253 | 3,765 | 3,595 | 852,013 | ||||||||||||||||||||||||
|
|
|
|
|
|
|
|
|
|
|
|
|
|
|
|
|
|||||||||||||||||
| Total |
$ | 18,394,219 | $ | 2,874,024 | $ | 102,323 | $ | 177 | $ | 72,309 | $ | 104,372 | $ | 17,550 | $ | 21,564,974 | ||||||||||||||||
|
|
|
|
|
|
|
|
|
|
|
|
|
|
|
|
|
|||||||||||||||||
| 2013 |
||||||||||||||||||||||||||||||||
| Performing |
$ | 19,319,959 | $ | 3,513,504 | $ | 22,482 | $ | — | $ | 84,667 | $ | 104,655 | $ | 18,318 | $ | 23,063,585 | ||||||||||||||||
| Non-performing |
903,485 | 135,228 | 3,189 | 294 | 1,412 | 3,895 | 1,741 | 1,049,244 | ||||||||||||||||||||||||
|
|
|
|
|
|
|
|
|
|
|
|
|
|
|
|
|
|||||||||||||||||
| Total |
$ | 20,223,444 | $ | 3,648,732 | $ | 25,671 | $ | 294 | $ | 86,079 | $ | 108,550 | $ | 20,059 | $ | 24,112,829 | ||||||||||||||||
|
|
|
|
|
|
|
|
|
|
|
|
|
|
|
|
|
|||||||||||||||||
| Credit Risk Profile by Internally Assigned Grade |
||||||||||||||||||||||||||||||||
| (In thousands) | ||||||||||||||||||||||||||||||||
| One-to four- family first mortgage loans |
Other first Mortgages |
Consumer and Other | Total Loans |
|||||||||||||||||||||||||||||
| Amortizing | Interest-only | Multi-family and Commercial |
Construction | Fixed-rate second mortgages |
Home Equity credit lines |
Other | ||||||||||||||||||||||||||
| 2014 |
||||||||||||||||||||||||||||||||
| Pass |
$ | 17,447,845 | $ | 2,744,846 | $ | 94,858 | $ | — | $ | 70,669 | $ | 97,905 | $ | 13,385 | $ | 20,469,508 | ||||||||||||||||
| Special mention |
89,166 | 10,926 | 1,180 | — | 71 | 252 | 118 | 101,713 | ||||||||||||||||||||||||
| Substandard |
857,208 | 118,252 | 6,285 | 177 | 1,569 | 6,215 | 4,047 | 993,753 | ||||||||||||||||||||||||
|
|
|
|
|
|
|
|
|
|
|
|
|
|
|
|
|
|||||||||||||||||
| Total |
$ | 18,394,219 | $ | 2,874,024 | $ | 102,323 | $ | 177 | $ | 72,309 | $ | 104,372 | $ | 17,550 | $ | 21,564,974 | ||||||||||||||||
|
|
|
|
|
|
|
|
|
|
|
|
|
|
|
|
|
|||||||||||||||||
| 2013 |
||||||||||||||||||||||||||||||||
| Pass |
$ | 19,218,917 | $ | 3,480,909 | $ | 15,281 | $ | — | $ | 84,233 | $ | 102,364 | $ | 17,157 | $ | 22,918,861 | ||||||||||||||||
| Special mention |
108,957 | 19,866 | 980 | — | 129 | 875 | 45 | 130,852 | ||||||||||||||||||||||||
| Substandard |
895,570 | 147,957 | 9,410 | 294 | 1,717 | 5,311 | 2,857 | 1,063,116 | ||||||||||||||||||||||||
|
|
|
|
|
|
|
|
|
|
|
|
|
|
|
|
|
|||||||||||||||||
| Total |
$ | 20,223,444 | $ | 3,648,732 | $ | 25,671 | $ | 294 | $ | 86,079 | $ | 108,550 | $ | 20,059 | $ | 24,112,829 | ||||||||||||||||
|
|
|
|
|
|
|
|
|
|
|
|
|
|
|
|
|
|||||||||||||||||
Loan classifications are defined as follows:
| • | Pass – These loans are protected by the current net worth and paying capacity of the obligor (or guarantors, if any) or by the fair value, less cost to acquire and sell, of any underlying collateral in a timely manner. |
| • | Special Mention – These loans have potential weaknesses that deserve management’s close attention. If left uncorrected, these potential weaknesses may result in deterioration of repayment prospects. |
| • | Substandard – These loans are inadequately protected by the current net worth and paying capacity of the obligor or by the collateral pledged, if any. Assets so classified must have a well-defined weakness, or weaknesses that jeopardize the liquidation of the debt. They are characterized by the distinct possibility that we will sustain some loss if the deficiencies are not corrected. |
134
Table of Contents
Notes to Consolidated Financial Statements
| • | Doubtful – These loans have all the weaknesses inherent in a loan classified substandard with the added characteristic that the weaknesses make the full recovery of our principal balance highly questionable and improbable on the basis of currently known facts, conditions, and values. The likelihood of a loss on an asset or portion of an asset classified Doubtful is high. Its classification as Loss is not appropriate, however, because pending events are expected to materially affect the amount of loss. |
| • | Loss – These loans are considered uncollectible and of such little value that a charge-off is warranted. This classification does not necessarily mean that an asset has no recovery or salvage value; but rather, there is much doubt about whether, how much, or when the recovery will occur. |
We evaluate the classification of our one-to four-family mortgage loans, consumer loans and other loans primarily on a pooled basis by delinquency. Loans that are past due 60 to 89 days are classified as special mention and loans that are past due 90 days or more, as well as impaired loans, are classified as substandard. We obtain updated valuations for one- to four- family mortgage loans by the time a loan becomes 180 days past due. If necessary, we charge-off an amount to reduce the carrying value of the loan to the value of the underlying property, less estimated selling costs. Since we record the charge-off when we receive the updated valuation, we typically do not have any residential first mortgages classified as doubtful or loss. We evaluate troubled debt restructurings individually, as well as multi-family, commercial and construction loans when they become 120 days past due and base our classification on the debt service capability of the underlying property as well as secondary sources of repayment such as the borrower’s and any guarantor’s ability and willingness to provide debt service. Residential mortgage loans that are classified as troubled debt restructurings are individually evaluated for impairment based on the present value of each loan’s expected future cash flows.
Originating loans secured by residential real estate is our primary business. Our financial results may be adversely affected by changes in prevailing economic conditions, either nationally or in our local New Jersey and metropolitan New York market areas, including decreases in real estate values, adverse employment conditions, the monetary and fiscal policies of the federal and state government and other significant external events. As a result of our lending practices, we have a concentration of loans secured by real property located primarily in New Jersey, New York and Connecticut (the “New York metropolitan area”). At December 31, 2014 approximately 84.8% of our total loans are in the New York metropolitan area.
Included in our loan portfolio at December 31, 2014 and December 31, 2013 are $2.87 billion and $3.65 billion, respectively, of interest-only one-to four-family residential mortgage loans. These loans are originated as adjustable-rate mortgage (“ARM”) loans with initial terms of five, seven or ten years with the interest-only portion of the payment based upon the initial loan term, or offered on a 30-year fixed-rate loan with interest-only payments for the first 10 years of the obligation. At the end of the initial 5-, 7- or 10-year interest-only period, the loan payment will adjust to include both principal and interest and will amortize over the remaining term so the loan will be repaid at the end of its original life. We had $99.8 million and $135.2 million of non-performing interest-only one-to four-family residential mortgage loans at December 31, 2014 and December 31, 2013, respectively.
In addition to our full documentation loan program, prior to January 2014, we originated loans to certain eligible borrowers as reduced documentation loans. We discontinued our reduced documentation loan program in January 2014 in order to comply with the Consumer Financial Protection Bureau’s (the “CFPB”) new requirements to validate a borrower’s ability to repay and the corresponding safe harbor for loans that meet the requirements for a “qualified mortgage”. Loans that were eligible for reduced documentation processing were ARM loans, interest-only first mortgage loans and 10-, 15-, 20- and 30-year fixed-rate loans to owner-occupied primary and second home applicants. These loans were available in amounts up to 65% of the lower of the appraised value or purchase price of the property. Generally the maximum loan amount for reduced documentation loans was $750,000 and these loans were subject to higher interest rates than our full documentation loan products. Reduced documentation loans have an inherently higher level of risk compared to loans with full documentation. Reduced documentation loans represent 22.4% of our one- to four-family first mortgage loans at December 31, 2014. Included in our loan portfolio at December 31, 2014 are $3.99 billion of amortizing reduced documentation loans and $620.0 million of reduced documentation interest-only loans as
135
Table of Contents
Notes to Consolidated Financial Statements
compared to $4.27 billion and $826.5 million, respectively, at December 31, 2013. Non-performing loans at December 31, 2014 include $168.2 million of amortizing reduced documentation loans and $39.8 million of interest-only reduced documentation loans as compared to $182.9 million and $48.8 million, respectively, at December 31, 2013.
The following table is a comparison of our delinquent loans by class at December 31:
| 30-59 Days | 60-89 Days | 90 Days or more |
Total Past Due |
Current Loans |
Total Loans |
90 Days or more and accruing (1) |
||||||||||||||||||||||
| (In thousands) | ||||||||||||||||||||||||||||
| 2014 |
||||||||||||||||||||||||||||
| One- to four-family first mortgages: |
||||||||||||||||||||||||||||
| Amortizing |
$ | 243,560 | $ | 111,420 | $ | 741,901 | $ | 1,096,881 | $ | 17,297,338 | $ | 18,394,219 | $ | 33,383 | ||||||||||||||
| Interest-only |
30,256 | 12,507 | 99,779 | 142,542 | 2,731,482 | 2,874,024 | — | |||||||||||||||||||||
| Multi-family and commercial mortgages |
2,782 | 4,743 | 1,543 | 9,068 | 93,255 | 102,323 | — | |||||||||||||||||||||
| Construction loans |
— | — | 177 | 177 | — | 177 | — | |||||||||||||||||||||
| Consumer and other loans: |
||||||||||||||||||||||||||||
| Fixed-rate second mortgages |
272 | 71 | 1,253 | 1,596 | 70,713 | 72,309 | — | |||||||||||||||||||||
| Home equity lines of credit |
1,077 | 252 | 3,765 | 5,094 | 99,278 | 104,372 | — | |||||||||||||||||||||
| Other |
589 | 118 | 3,595 | 4,302 | 13,248 | 17,550 | — | |||||||||||||||||||||
|
|
|
|
|
|
|
|
|
|
|
|
|
|
|
|||||||||||||||
| Total |
$ | 278,536 | $ | 129,111 | $ | 852,013 | $ | 1,259,660 | $ | 20,305,314 | $ | 21,564,974 | $ | 33,383 | ||||||||||||||
|
|
|
|
|
|
|
|
|
|
|
|
|
|
|
|||||||||||||||
| 2013 |
||||||||||||||||||||||||||||
| One- to four-family first mortgages: |
||||||||||||||||||||||||||||
| Amortizing |
$ | 274,303 | $ | 132,910 | $ | 903,485 | $ | 1,310,698 | $ | 18,912,746 | $ | 20,223,444 | $ | 132,844 | ||||||||||||||
| Interest-only |
34,277 | 21,283 | 135,228 | 190,788 | 3,457,944 | 3,648,732 | — | |||||||||||||||||||||
| Multi-family and commercial mortgages |
1,384 | 5,983 | 3,189 | 10,556 | 15,115 | 25,671 | — | |||||||||||||||||||||
| Construction loans |
— | — | 294 | 294 | — | 294 | — | |||||||||||||||||||||
| Consumer and other loans: |
||||||||||||||||||||||||||||
| Fixed-rate second mortgages |
484 | 129 | 1,412 | 2,025 | 84,054 | 86,079 | — | |||||||||||||||||||||
| Home equity lines of credit |
1,389 | 1,163 | 3,895 | 6,447 | 102,103 | 108,550 | — | |||||||||||||||||||||
| Other |
58 | 45 | 1,741 | 1,844 | 18,215 | 20,059 | — | |||||||||||||||||||||
|
|
|
|
|
|
|
|
|
|
|
|
|
|
|
|||||||||||||||
| Total |
$ | 311,895 | $ | 161,513 | $ | 1,049,244 | $ | 1,522,652 | $ | 22,590,177 | $ | 24,112,829 | $ | 132,844 | ||||||||||||||
|
|
|
|
|
|
|
|
|
|
|
|
|
|
|
|||||||||||||||
| (1) | Loans that are past due 90 days or more and still accruing interest are loans that are guaranteed by the FHA. |
During 2014, we sold a pool of $112.1 million of non-performing residential mortgage loans guaranteed by the FHA back to the financial institution that originally sold the loans to the Bank. The sale of the non-performing loan pool was in accordance with the repurchase right with respect to loans that become non-performing that the financial institution exercised pursuant to the terms of the original sale and servicing agreement between the Bank and the financial institution. As consideration for the sale of the non-performing loans, the Bank received from the financial institution an amount equal to 100% of the outstanding unpaid principal balance of the loans, plus all accrued and unpaid interest on the loans. The Bank may sell additional loans to the financial institution in the future, in the event the financial institution exercises its repurchase right with respect to any additional non-performing FHA loans.
136
Table of Contents
Notes to Consolidated Financial Statements
The following table presents the geographic distribution of our loan portfolio as a percentage of total loans and of our non-performing loans as a percentage of total non-performing loans at December 31:
| 2014 | 2013 | |||||||||||||||
| Total loans | Non-performing Loans |
Total loans | Non-performing Loans |
|||||||||||||
| New Jersey |
42.4 | % | 42.6 | % | 42.5 | % | 44.2 | % | ||||||||
| New York |
27.8 | 27.8 | 27.1 | 24.1 | ||||||||||||
| Connecticut |
14.6 | 7.8 | 14.9 | 8.0 | ||||||||||||
|
|
|
|
|
|
|
|
|
|||||||||
| Total New York metropolitan area |
84.8 | 78.2 | 84.5 | 76.3 | ||||||||||||
|
|
|
|
|
|
|
|
|
|||||||||
| Pennsylvania |
4.8 | 1.5 | 4.9 | 2.4 | ||||||||||||
| Massachusetts |
2.0 | 1.8 | 1.8 | 1.6 | ||||||||||||
| Virginia |
1.6 | 1.9 | 1.8 | 2.3 | ||||||||||||
| Illinois |
1.5 | 4.7 | 1.6 | 4.8 | ||||||||||||
| Maryland |
1.6 | 5.2 | 1.7 | 4.7 | ||||||||||||
| All others |
3.7 | 6.7 | 3.7 | 7.9 | ||||||||||||
|
|
|
|
|
|
|
|
|
|||||||||
| Total outside New York metropolitan area |
15.2 | 21.8 | 15.5 | 23.7 | ||||||||||||
|
|
|
|
|
|
|
|
|
|||||||||
| 100.0 | % | 100.0 | % | 100.0 | % | 100.0 | % | |||||||||
|
|
|
|
|
|
|
|
|
|||||||||
The following is a summary of loans, by class, on which the accrual of income has been discontinued and loans that are contractually past due 90 days or more but have not been classified as non-accrual at December 31:
| 2014 | 2013 | |||||||
| (In thousands) | ||||||||
| Non-accrual loans: |
||||||||
| One-to four-family amortizing loans |
$ | 708,518 | $ | 770,641 | ||||
| One-to four-family interest-only loans |
99,779 | 135,228 | ||||||
| Multi-family and commercial mortgages |
1,543 | 3,189 | ||||||
| Construction loans |
177 | 294 | ||||||
| Fixed-rate second mortgages |
1,253 | 1,412 | ||||||
| Home equity lines of credit |
3,765 | 3,895 | ||||||
| Other loans |
3,595 | 1,741 | ||||||
|
|
|
|
|
|||||
| Total non-accrual loans |
818,630 | 916,400 | ||||||
| Accruing loans delinquent 90 days or more (1) |
33,383 | 132,844 | ||||||
|
|
|
|
|
|||||
| Total non-performing loans |
$ | 852,013 | $ | 1,049,244 | ||||
|
|
|
|
|
|||||
| (1) | Loans that are past due 90 days or more and still accruing interest are loans that are insured by the FHA. |
The total amount of interest income on non-accrual loans that would have been recognized if interest on all such loans had been recorded based upon original contract terms amounted to approximately $50.5 million for 2014 as compared to $58.4 million for 2013. Hudson City is not committed to lend additional funds to borrowers on non-accrual status.
137
Table of Contents
Notes to Consolidated Financial Statements
Non-performing loans exclude troubled debt restructurings that are accruing and have been performing in accordance with the terms of their restructure agreement for at least six months. The following table presents information regarding loans modified in a troubled debt restructuring at December 31:
| 2014 | 2013 | |||||||
| (In thousands) | ||||||||
| Troubled debt restructurings: |
||||||||
| Current |
$ | 137,249 | $ | 108,413 | ||||
| 30-59 days |
20,344 | 19,931 | ||||||
| 60-89 days |
17,079 | 17,407 | ||||||
| 90 days or more |
157,744 | 176,797 | ||||||
|
|
|
|
|
|||||
| Total troubled debt restructurings |
$ | 332,416 | $ | 322,548 | ||||
|
|
|
|
|
|||||
The following table presents loan portfolio class modified as troubled debt restructurings during the years ended December 31, 2014 and 2013. The pre-restructuring and post-restructuring outstanding recorded investments disclosed in the table below represent the loan carrying amounts immediately prior to the restructuring and the carrying amounts at December 31, 2014 and 2013, respectively:
| 2014 | 2013 | |||||||||||||||||||||||
| Pre-restructuring | Post-restructuring | Pre-restructuring | Post-restructuring | |||||||||||||||||||||
| Number | Outstanding | Outstanding | Number | Outstanding | Outstanding | |||||||||||||||||||
| of | Recorded | Recorded | of | Recorded | Recorded | |||||||||||||||||||
| Contracts | Investment | Investment | Contracts | Investment | Investment | |||||||||||||||||||
| (In thousands) | ||||||||||||||||||||||||
| Troubled debt restructurings: |
||||||||||||||||||||||||
| One-to-four family first mortgages: |
||||||||||||||||||||||||
| Amortizing |
980 | $ | 341,398 | $ | 291,404 | 933 | $ | 318,908 | $ | 281,481 | ||||||||||||||
| Interest-only |
59 | 35,025 | 31,257 | 55 | 35,226 | 31,564 | ||||||||||||||||||
| Multi-family and commercial mortgages |
3 | 8,650 | 5,441 | 2 | 7,029 | 7,029 | ||||||||||||||||||
| Consumer and other loans |
36 | 4,594 | 4,314 | 24 | 2,672 | 2,474 | ||||||||||||||||||
|
|
|
|
|
|
|
|
|
|
|
|
|
|||||||||||||
| Total |
1,078 | $ | 389,667 | $ | 332,416 | 1,014 | $ | 363,835 | $ | 322,548 | ||||||||||||||
|
|
|
|
|
|
|
|
|
|
|
|
|
|||||||||||||
138
Table of Contents
Notes to Consolidated Financial Statements
Loans individually evaluated for impairment include loans classified as troubled debt restructurings and non-performing multi-family, commercial and construction loans. The following table presents our loans individually evaluated for impairment by class at December 31:
| Recorded | Unpaid | Average | Interest | |||||||||||||||||
| Investment, | Principal | Related | Recorded | Income | ||||||||||||||||
| Net of Allowance | Balance | Allowance | Investment | Recognized | ||||||||||||||||
| (In thousands) | ||||||||||||||||||||
| 2014 |
||||||||||||||||||||
| One-to four-family amortizing loans |
$ | 291,404 | $ | 337,174 | $ | — | $ | 295,986 | $ | 7,496 | ||||||||||
| One-to four-family interest-only loans |
31,257 | 35,732 | — | 31,447 | 936 | |||||||||||||||
| Multi-family and commercial mortgages |
5,525 | 9,039 | 126 | 7,033 | 359 | |||||||||||||||
| Construction loans |
177 | 292 | — | 293 | — | |||||||||||||||
| Consumer and other loans |
3,971 | 4,314 | 343 | 4,367 | 109 | |||||||||||||||
|
|
|
|
|
|
|
|
|
|
|
|||||||||||
| Total |
$ | 332,334 | $ | 386,551 | $ | 469 | $ | 339,126 | $ | 8,900 | ||||||||||
|
|
|
|
|
|
|
|
|
|
|
|||||||||||
| 2013 |
||||||||||||||||||||
| One-to four-family amortizing loans |
$ | 281,481 | $ | 319,783 | $ | — | $ | 301,291 | $ | 7,013 | ||||||||||
| One-to four-family interest-only loans |
31,564 | 35,924 | — | 33,398 | 854 | |||||||||||||||
| Multi-family and commercial mortgages |
8,002 | 9,289 | 414 | 8,307 | 368 | |||||||||||||||
| Construction loans |
181 | 294 | 113 | 295 | — | |||||||||||||||
| Consumer and other loans |
2,411 | 2,474 | 63 | 2,575 | 108 | |||||||||||||||
|
|
|
|
|
|
|
|
|
|
|
|||||||||||
| Total |
$ | 323,639 | $ | 367,764 | $ | 590 | $ | 345,866 | $ | 8,343 | ||||||||||
|
|
|
|
|
|
|
|
|
|
|
|||||||||||
The following is an analysis of the ALL at December 31:
| 2014 | 2013 | 2012 | ||||||||||
| (In thousands) | ||||||||||||
| Balance at beginning of year |
$ | 276,097 | $ | 302,348 | $ | 273,791 | ||||||
|
|
|
|
|
|
|
|||||||
| Charge-offs |
(60,661 | ) | (87,854 | ) | (87,100 | ) | ||||||
| Recoveries |
23,381 | 25,103 | 20,657 | |||||||||
|
|
|
|
|
|
|
|||||||
| Net charge-offs |
(37,280 | ) | (62,751 | ) | (66,443 | ) | ||||||
|
|
|
|
|
|
|
|||||||
| Provision for loan losses |
(3,500 | ) | 36,500 | 95,000 | ||||||||
|
|
|
|
|
|
|
|||||||
| Balance at end of year |
$ | 235,317 | $ | 276,097 | $ | 302,348 | ||||||
|
|
|
|
|
|
|
|||||||
139
Table of Contents
Notes to Consolidated Financial Statements
The following table presents the activity in our ALL by portfolio segment at the year indicated.
| One-to four- Family Mortgages |
Multi- family and Commercial Mortgages |
Construction | Consumer and Other Loans |
Total | ||||||||||||||||
| (In thousands) | ||||||||||||||||||||
| Balance at December 31, 2012 |
$ | 295,096 | $ | 1,937 | $ | 1,116 | $ | 4,199 | $ | 302,348 | ||||||||||
|
|
|
|
|
|
|
|
|
|
|
|||||||||||
| Provision for loan losses |
38,380 | (1,132 | ) | (1,003 | ) | 255 | 36,500 | |||||||||||||
| Charge-offs |
(87,288 | ) | — | — | (566 | ) | (87,854 | ) | ||||||||||||
| Recoveries |
25,073 | — | — | 30 | 25,103 | |||||||||||||||
|
|
|
|
|
|
|
|
|
|
|
|||||||||||
| Net charge-offs |
(62,215 | ) | — | — | (536 | ) | (62,751 | ) | ||||||||||||
|
|
|
|
|
|
|
|
|
|
|
|||||||||||
| Balance at December 31, 2013 |
$ | 271,261 | $ | 805 | $ | 113 | $ | 3,918 | $ | 276,097 | ||||||||||
|
|
|
|
|
|
|
|
|
|
|
|||||||||||
| Provision for loan losses |
(5,867 | ) | 2,281 | 2 | 84 | (3,500 | ) | |||||||||||||
| Charge-offs |
(57,348 | ) | (2,515 | ) | (115 | ) | (683 | ) | (60,661 | ) | ||||||||||
| Recoveries |
22,816 | — | — | 565 | 23,381 | |||||||||||||||
|
|
|
|
|
|
|
|
|
|
|
|||||||||||
| Net charge-offs |
(34,532 | ) | (2,515 | ) | (115 | ) | (118 | ) | (37,280 | ) | ||||||||||
|
|
|
|
|
|
|
|
|
|
|
|||||||||||
| Balance at December 31, 2014 |
$ | 230,862 | $ | 571 | $ | — | $ | 3,884 | $ | 235,317 | ||||||||||
|
|
|
|
|
|
|
|
|
|
|
|||||||||||
| Loan portfolio: |
||||||||||||||||||||
| Balance at end of year |
||||||||||||||||||||
| Individually evaluated for impairment |
$ | 322,661 | $ | 5,651 | $ | 177 | $ | 4,314 | $ | 332,803 | ||||||||||
| Collectively evaluated for impairment |
20,945,582 | 96,672 | — | 189,917 | 21,232,171 | |||||||||||||||
| Allowance |
||||||||||||||||||||
| Individually evaluated for impairment |
$ | 20,413 | $ | 126 | $ | — | $ | 343 | $ | 20,882 | ||||||||||
| Collectively evaluated for impairment |
210,449 | 445 | — | 3,541 | 214,435 | |||||||||||||||
Historically, our primary lending emphasis has been the origination and purchase of one- to four-family first mortgage loans on residential properties and, to a lesser extent, second mortgage loans on one- to four-family residential properties resulting in a loan concentration in residential first mortgage loans at December 31, 2014. As a result of our lending practices, we also have a concentration of loans secured by real property located primarily in New Jersey, New York and Connecticut. As of December 31, 2014, approximately 84.8% of our total loans are in the New York metropolitan area. Additionally, the states of Pennsylvania, Massachusetts, Virginia, Illinois and Maryland, accounted for 4.8%, 2.0%, 1.6%, 1.5%, and 1.6%, respectively of total loans. The remaining 3.7% of the loan portfolio is secured by real estate primarily in the remainder of our lending markets. Based on the composition of our loan portfolio, we believe the primary risks inherent in our portfolio relate to the conditions in our lending market areas including economic conditions, unemployment levels, weak labor market conditions, rising interest rates and a decline in real estate market values. Any one or a combination of these adverse trends may adversely affect our loan portfolio resulting in increased delinquencies, non-performing assets, charge-offs and future levels of loan loss provisions. We consider these trends in market conditions in determining the ALL.
Due to the nature of our loan portfolio, our evaluation of the adequacy of our ALL is performed primarily on a “pooled” basis. Each quarter we prepare an analysis which categorizes the entire loan portfolio by certain risk characteristics such as loan type (fixed and variable one- to four-family, interest-only, reduced documentation, multi-family, commercial, construction, etc.), loan source (originated or purchased) and payment status (i.e., current or number of days delinquent). Loans with known losses are categorized separately. We assign estimated loss factors to the payment status categories on the basis of our assessment of the risk inherent in each loan type. These factors are periodically reviewed for appropriateness giving consideration to our loss experience, delinquency trends, portfolio growth and environmental factors such as the status of the regional economy and housing market, in order to ascertain that the loss factors cover probable and estimable losses inherent in the portfolio. We define our loss experience on non-performing loans as the ratio of the excess of the loan balance (including selling costs) over the updated collateral value to the principal balance of loans for
140
Table of Contents
Notes to Consolidated Financial Statements
which we have updated valuations. We obtain updated collateral values by the time a loan becomes 180 days past due and on an annual basis thereafter for as long as the loan remains non-performing. Based on our analysis, our loss experience on our non-performing one- to four-family first mortgage loans was approximately 12.1% during 2014 as compared to 13.6% during 2013.
One-to four-family mortgage loans that are individually evaluated for impairment consist primarily of troubled debt restructurings. If our evaluation indicates that the loan is impaired, we record a charge-off for the amount of the impairment. Loans that were individually evaluated for impairment, but would otherwise be evaluated on a pooled basis, are included in the collective evaluation if the individual evaluation indicated no impairment existed. This collective evaluation of one-to four-family mortgage loans that were also individually evaluated for impairment (but for which no impairment existed) resulted in an ALL of $20.4 million at December 31, 2014, which is intended to capture the risks that the net present value calculation did not account for such as changes in collateral, unemployment and other environmental factors.
The ultimate ability to collect the loan portfolio is subject to changes in the real estate market and future economic conditions. Economic conditions in our primary market area continued to improve modestly during 2014 as evidenced by increased levels of home sale activity, higher real estate valuations and a decrease in the unemployment rate which, while improving, remains elevated. We continue to closely monitor the local and national real estate markets and other factors related to risks inherent in our loan portfolio.
7. Banking Premises and Equipment, net
A summary of the net carrying value of banking premises and equipment at December 31 is as follows:
| 2014 | 2013 | |||||||
| (In thousands) | ||||||||
| Land |
$ | 5,806 | $ | 5,806 | ||||
| Buildings |
56,112 | 56,004 | ||||||
| Leasehold improvements |
47,042 | 46,947 | ||||||
| Furniture, fixtures and equipment |
105,927 | 103,933 | ||||||
|
|
|
|
|
|||||
| Total acquisition cost |
214,887 | 212,690 | ||||||
| Accumulated depreciation |
(158,254 | ) | (147,337 | ) | ||||
|
|
|
|
|
|||||
| Total banking premises and equipment, net |
$ | 56,633 | $ | 65,353 | ||||
|
|
|
|
|
|||||
Amounts charged to net occupancy expense for depreciation of banking premises and equipment and amortization of intangible assets amounted to $11.4 million, $10.5 million and $8.2 million in 2014, 2013 and 2012, respectively.
141
Table of Contents
Notes to Consolidated Financial Statements
Hudson City has entered into non-cancelable operating lease agreements with respect to banking premises and equipment. It is expected that many agreements will be renewed at expiration in the normal course of business. Future minimum rental commitments required under operating leases that have initial or remaining non-cancelable lease terms in excess of one year are as follows:
| Year |
Amount | |||
| (In thousands) | ||||
| 2015 |
$ | 10,845 | ||
| 2016 |
10,715 | |||
| 2017 |
10,369 | |||
| 2018 |
10,245 | |||
| 2019 |
10,071 | |||
| Thereafter |
82,651 | |||
|
|
|
|||
| Total |
$ | 134,896 | ||
|
|
|
|||
Net occupancy expense included gross rental expense for bank premises of $12.8 million, $12.7 million, and $12.5 million in 2014, 2013, and 2012, respectively, and rental income of $271,000, $330,000, and $342,000 for the same respective years.
8. Goodwill and Other Intangible Assets
Goodwill and other intangible assets amounted to $152.5 million and were recorded as a result of Hudson City Bancorp’s acquisition of Sound Federal Bancorp, Inc. in 2006.
The first step (“Step 1”) used to identify potential impairment involves comparing each reporting unit’s estimated fair value to its carrying amount, including goodwill. As a community-oriented bank, substantially all of the Company’s operations involve the delivery of loan and deposit products to customers and these operations constitute the Company’s only segment for financial reporting purposes. If the estimated fair value of a reporting unit exceeds its carrying amount, goodwill is not considered to be impaired. If the carrying amount exceeds the estimated fair value, there is an indication of potential impairment and the second step (“Step 2”) is performed to measure the amount. Step 2 involves calculating an implied fair value of goodwill for each reporting unit for which impairment was indicated in Step 1. The implied fair value of goodwill is determined in a manner similar to the amount of goodwill calculated in a business combination by measuring the excess of the estimated fair value of the reporting unit, as determined in Step 1, over the aggregate estimated fair values of the individual assets, liabilities, and identifiable intangibles, as if the reporting unit was being acquired at the impairment test date. We perform our goodwill impairment analysis annually and also perform interim impairment reviews if certain triggering events occur which may indicate that the fair value of goodwill is less than the carrying value. Subsequent reversal of goodwill impairment losses is not permitted.
We performed our annual goodwill impairment analysis as of June 30, 2014 and concluded that goodwill was not impaired. In addition, we do not believe that any events, circumstances or triggering events occurred since our annual impairment test which would have indicated that goodwill and other intangible assets required reassessment. Therefore, we did not recognize any impairment of goodwill or other intangible assets during 2014.
The estimation of the fair value of the Company requires the use of estimates and assumptions that results in a greater degree of uncertainty. In addition, the estimated fair value of the Company is based on, among other things, the market price of our common stock as calculated per the terms of the Merger. As a result of the current volatility in market and economic conditions, these estimates and assumptions are subject to change in the near-term and may result in the impairment in future periods of some or all of the goodwill on our balance sheet.
142
Table of Contents
Notes to Consolidated Financial Statements
9. Deposits
Deposits at December 31 are summarized as follows:
| 2014 | 2013 | |||||||||||||||||||||||
| Balance | Percent | Weighted Average Rate |
Balance | Percent | Weighted Average Rate |
|||||||||||||||||||
| (Dollars in thousands) | ||||||||||||||||||||||||
| Savings |
$ | 1,055,298 | 5.45 | % | 0.15 | % | $ | 1,009,237 | 4.70 | % | 0.15 | % | ||||||||||||
| Noninterest-bearing demand |
665,100 | 3.43 | — | 661,221 | 3.08 | — | ||||||||||||||||||
| Interest-bearing demand |
2,116,447 | 10.92 | 0.24 | 2,208,985 | 10.29 | 0.24 | ||||||||||||||||||
| Money market |
4,154,310 | 21.44 | 0.20 | 5,188,632 | 24.16 | 0.20 | ||||||||||||||||||
| Time deposits |
11,385,389 | 58.76 | 1.16 | 12,404,254 | 57.77 | 1.19 | ||||||||||||||||||
|
|
|
|
|
|
|
|
|
|
|
|
|
|||||||||||||
| Total deposits |
$ | 19,376,544 | 100.00 | % | 0.76 | % | $ | 21,472,329 | 100.00 | % | 0.77 | % | ||||||||||||
|
|
|
|
|
|
|
|
|
|||||||||||||||||
Time deposits of $100,000 or more amounted to $4.77 billion and $5.12 billion at December 31, 2014 and 2013, respectively. Interest expense on time deposits of $100,000 or more for the years ended December 31, 2014, 2013 and 2012 was $58.4 million, $65.2 million, and $72.5 million, respectively. Included in noninterest-bearing demand accounts are mortgage escrow deposits of $79.7 million and $85.8 million at December 31, 2014 and 2013, respectively.
Scheduled maturities of time deposits at December 31, 2014 are as follows:
| Year |
Amount | |||
| (In thousands) | ||||
| 2015 |
$ | 7,339,620 | ||
| 2016 |
2,968,881 | |||
| 2017 |
560,275 | |||
| 2018 |
348,268 | |||
| 2019 and thereafter |
168,345 | |||
|
|
|
|||
| Total |
$ | 11,385,389 | ||
|
|
|
|||
143
Table of Contents
Notes to Consolidated Financial Statements
10. Borrowed Funds
Borrowed funds at December 31 are summarized as follows:
| 2014 | 2013 | |||||||||||||||
| Weighted | Weighted | |||||||||||||||
| Average | Average | |||||||||||||||
| Principal | Rate | Principal | Rate | |||||||||||||
| (Dollars in thousands) | ||||||||||||||||
| Securities sold under agreements to repurchase: |
||||||||||||||||
| FHLB |
$ | — | — | % | $ | 800,000 | 4.53 | % | ||||||||
| Other brokers |
6,150,000 | 4.44 | 6,150,000 | 4.44 | ||||||||||||
|
|
|
|
|
|
|
|
|
|||||||||
| Total securities sold under agreements to repurchase |
6,150,000 | 4.44 | 6,950,000 | 4.45 | ||||||||||||
| Advances from the FHLB |
6,025,000 | 4.75 | 5,225,000 | 4.77 | ||||||||||||
|
|
|
|
|
|
|
|
|
|||||||||
| Total borrowed funds |
$ | 12,175,000 | 4.59 | % | $ | 12,175,000 | 4.59 | % | ||||||||
|
|
|
|
|
|||||||||||||
| Accrued interest payable |
$ | 64,080 | $ | 64,061 | ||||||||||||
The average balances of borrowings and the maximum amount outstanding at any month-end are as follows:
| At or for the Year Ended December 31, | ||||||||||||
| 2014 | 2013 | 2012 | ||||||||||
| (Dollars in thousands) | ||||||||||||
| Repurchase Agreements: |
||||||||||||
| Average balance outstanding during the year |
$ | 6,274,932 | $ | 6,950,000 | $ | 6,950,000 | ||||||
|
|
|
|
|
|
|
|||||||
| Maximum balance outstanding at any month-end during the year |
$ | 6,950,000 | $ | 6,950,000 | $ | 6,950,000 | ||||||
|
|
|
|
|
|
|
|||||||
| Weighted average rate during the period |
4.49 | % | 4.51 | % | 4.52 | % | ||||||
|
|
|
|
|
|
|
|||||||
| FHLB Advances: |
||||||||||||
| Average balance outstanding during the year |
$ | 5,900,068 | $ | 5,225,000 | $ | 6,623,094 | ||||||
|
|
|
|
|
|
|
|||||||
| Maximum balance outstanding at any month-end during the year |
$ | 6,025,000 | $ | 5,225,000 | $ | 7,875,000 | ||||||
|
|
|
|
|
|
|
|||||||
| Weighted average rate during the period |
4.82 | % | 4.84 | % | 4.02 | % | ||||||
144
Table of Contents
Notes to Consolidated Financial Statements
At December 31, 2014, approximately $3.33 billion of our borrowed funds may be put back to us at the discretion of the issuer after an initial no-put period. At that date, borrowed funds had scheduled maturities and potential put dates as follows:
| Borrowings by Scheduled | Borrowings by Earlier of Scheduled | |||||||||||||||
| Maturity Date | Maturity or Next Potential Put Date | |||||||||||||||
| Weighted | Weighted | |||||||||||||||
| Average | Average | |||||||||||||||
| Year |
Principal | Rate | Principal | Rate | ||||||||||||
| (Dollars in thousands) | ||||||||||||||||
| 2015 |
$ | 75,000 | 4.62 | % | $ | 3,400,000 | 4.42 | % | ||||||||
| 2016 |
3,925,000 | 4.92 | 3,925,000 | 4.92 | ||||||||||||
| 2017 |
2,475,000 | 4.39 | 200,000 | 4.04 | ||||||||||||
| 2018 |
700,000 | 3.65 | 500,000 | 3.54 | ||||||||||||
| 2019 |
1,725,000 | 4.62 | 1,325,000 | 4.69 | ||||||||||||
| 2020 |
3,275,000 | 4.53 | 2,825,000 | 4.52 | ||||||||||||
|
|
|
|
|
|
|
|
|
|||||||||
| Total |
$ | 12,175,000 | 4.59 | % | $ | 12,175,000 | 4.59 | % | ||||||||
|
|
|
|
|
|
|
|
|
|||||||||
The amortized cost and fair value of the underlying securities used as collateral for securities sold under agreements to repurchase, at December 31 are as follows:
| 2014 | 2013 | 2012 | ||||||||||
| (In thousands) | ||||||||||||
| Amortized cost of collateral: |
||||||||||||
| United States government-sponsored enterprise securities |
$ | 3,501,025 | $ | 298,190 | $ | — | ||||||
| Mortgage-backed securities |
3,766,108 | 7,886,833 | 8,672,162 | |||||||||
|
|
|
|
|
|
|
|||||||
| Total amortized cost of collateral |
$ | 7,267,133 | $ | 8,185,023 | $ | 8,672,162 | ||||||
|
|
|
|
|
|
|
|||||||
| Fair value of collateral: |
||||||||||||
| United States government-sponsored enterprise securities |
$ | 3,496,659 | $ | 290,194 | $ | — | ||||||
| Mortgage-backed securities |
3,864,959 | 8,045,674 | 8,991,053 | |||||||||
|
|
|
|
|
|
|
|||||||
| Total fair value of collateral |
$ | 7,361,618 | $ | 8,335,868 | $ | 8,991,053 | ||||||
|
|
|
|
|
|
|
|||||||
During 2014, we modified $800.0 million of FHLB repurchase agreements to be FHLB advances. This reduced our collateral requirements related to the repurchase agreements, which use securities as collateral. FHLB advances are secured by a blanket lien on our loan portfolio. The modification resulted in an increase of six basis points in the weighted average cost of the borrowings that were modified.
The Bank had two collateralized borrowings in the form of repurchase agreements totaling $100.0 million with Lehman Brothers, Inc. that were secured by mortgage-backed securities with an amortized cost of approximately $114.1 million. The trustee for the liquidation of Lehman Brothers, Inc. (the “Trustee”) notified the Bank in the fourth quarter of 2011 that it considered our claim to be a non-customer claim, which has a lower payment preference than a customer claim and that the value of such claim is approximately $13.9 million representing the excess of the fair value of the collateral over the $100.0 million repurchase price. At that time we established a reserve of $3.9 million against the receivable balance at December 31, 2011. On June 25, 2013, the Bankruptcy Court affirmed the Trustee’s determination that the repurchase agreements did not entitle the Bank to customer status and on
145
Table of Contents
Notes to Consolidated Financial Statements
February 26, 2014, the U.S. District Court upheld the Bankruptcy Court’s decision that our claim should be treated as a non-customer claim. As a result, we increased our reserve by $3.0 million to $6.9 million against the receivable balance during 2014. During the third quarter of 2014, the Bank received a partial payment on our non-customer claim of $2.4 million.
At December 31, 2014, we had unused lines of credit available from the FHLB, other than repurchase agreements, of up to $500.0 million. These lines of credit are renewed on an annual basis by the FHLB. Our advances from the FHLB are secured by our investment in FHLB stock and by a blanket security agreement on our loan portfolio. This agreement requires us to maintain as collateral certain qualifying assets (such as one- to-four family residential mortgage loans) with a fair value, as defined, at least equal to 110% of any outstanding advances.
11. Employee Benefit Plans
a) Retirement and Other Postretirement Benefits
Non-contributory retirement and postretirement plans are maintained to cover employees hired prior to August 1, 2005, including retired employees, who have met the eligibility requirements of the plans. Benefits under the qualified and non-qualified defined benefit retirement plans are based primarily on years of service and compensation. In 2005, participation in the non-contributory retirement plan was restricted to those employees hired on or before July 31, 2005. Employees hired on or after August 1, 2005 will not participate in the plan. Also in 2005, the plan for postretirement benefits, other than pensions, was changed to restrict participation to those employees hired on or before July 31, 2005, and placed a cap on the premium value of the non-contributory coverage provided at the 2007 premium rate, beginning in 2008, for those eligible employees who retire after December 31, 2005.
Funding of the qualified retirement plan is actuarially determined on an annual basis. It is our policy to fund the qualified retirement plan sufficiently to meet the minimum requirements set forth in the Employee Retirement Income Security Act of 1974. The non-qualified retirement plan, for certain executive officers, is unfunded and had a projected benefit obligation of $28.7 million at December 31, 2014 and $24.0 million at December 31, 2013. Certain health care and life insurance benefits are provided to eligible retired employees (“other benefits”). Participants generally become eligible for retiree health care and life insurance benefits after 10 years of service. The measurement date for year-end disclosure information is December 31 and the measurement date for net periodic benefit cost is January 1.
146
Table of Contents
Notes to Consolidated Financial Statements
The following table shows the change in benefit obligation, the change in plan assets, and the funded status for the retirement plans and other benefits at December 31:
| Retirement Plans | Other Benefits | |||||||||||||||
| 2014 | 2013 | 2014 | 2013 | |||||||||||||
| (In thousands) | ||||||||||||||||
| Change in Benefit Obligation: |
||||||||||||||||
| Benefit obligation at beginning of year |
$ | 195,138 | $ | 207,836 | $ | 48,476 | $ | 53,959 | ||||||||
| Service cost |
4,105 | 5,005 | 998 | 1,174 | ||||||||||||
| Interest cost |
9,199 | 8,495 | 2,240 | 2,074 | ||||||||||||
| Participant contributions |
— | — | 201 | 175 | ||||||||||||
| Actuarial loss (gain) |
58,344 | (19,999 | ) | 14,140 | (6,083 | ) | ||||||||||
| Benefits paid |
(7,128 | ) | (6,199 | ) | (3,828 | ) | (3,089 | ) | ||||||||
| Medicaid subsidy |
— | — | — | 266 | ||||||||||||
|
|
|
|
|
|
|
|
|
|||||||||
| Benefit obligation at end of year |
259,658 | 195,138 | 62,227 | 48,476 | ||||||||||||
|
|
|
|
|
|
|
|
|
|||||||||
| Change in Plan Assets: |
||||||||||||||||
| Fair value of plan assets at beginning of year |
178,244 | 160,245 | — | — | ||||||||||||
| Actual return on plan assets |
15,641 | 23,509 | — | — | ||||||||||||
| Employer contributions |
690 | 689 | 3,627 | 2,914 | ||||||||||||
| Participant contributions |
— | — | 201 | 175 | ||||||||||||
| Benefits paid |
(7,128 | ) | (6,199 | ) | (3,828 | ) | (3,089 | ) | ||||||||
|
|
|
|
|
|
|
|
|
|||||||||
| Fair value of plan assets at end of year |
187,447 | 178,244 | — | — | ||||||||||||
|
|
|
|
|
|
|
|
|
|||||||||
| Funded status |
$ | (72,211 | ) | $ | (16,894 | ) | $ | (62,227 | ) | $ | (48,476 | ) | ||||
|
|
|
|
|
|
|
|
|
|||||||||
Funded status amounts recognized in the consolidated statements of financial condition at December 31 consist of:
| Retirement Plans | Other Benefits | |||||||||||||||
| 2014 | 2013 | 2014 | 2013 | |||||||||||||
| (In thousands) | ||||||||||||||||
| Accrued expenses and other liabilities |
$ | 72,211 | $ | 16,894 | $ | 62,227 | $ | 48,476 | ||||||||
Pre-tax amounts recognized as components of total accumulated other comprehensive income at December 31 consist of:
| Retirement Plans | Other Benefits | |||||||||||||||
| 2014 | 2013 | 2014 | 2013 | |||||||||||||
| (In thousands) | ||||||||||||||||
| Net actuarial loss |
$ | 101,354 | $ | 46,484 | $ | 28,928 | $ | 15,565 | ||||||||
| Prior service cost (credit) |
607 | 838 | (14,645 | ) | (16,210 | ) | ||||||||||
|
|
|
|
|
|
|
|
|
|||||||||
| Total |
$ | 101,961 | $ | 47,322 | $ | 14,283 | $ | (645 | ) | |||||||
|
|
|
|
|
|
|
|
|
|||||||||
The Society of Actuaries published updated mortality tables in October 2014. These tables reflect recent improvements in longevity and also project future improvements in mortality. The discount rate used to determine our benefit obligation was also reduced to 3.85% for 2014 from 4.75% for 2013. As a result the changes to the mortality table and the discount rate, liabilities on our defined benefit retirement plans increased during 2014. The accumulated benefit obligation for all defined benefit retirement plans was $227.8 million and $172.6 million at December 31, 2014 and 2013, respectively.
147
Table of Contents
Notes to Consolidated Financial Statements
Net periodic benefit cost for the years ended December 31 included the following components:
| Retirement Plans | Other Benefits | |||||||||||||||||||||||
| 2014 | 2013 | 2012 | 2014 | 2013 | 2012 | |||||||||||||||||||
| (In thousands) | ||||||||||||||||||||||||
| Net periodic benefit cost: |
||||||||||||||||||||||||
| Service cost |
$ | 4,105 | $ | 5,005 | $ | 4,875 | $ | 998 | $ | 1,174 | $ | 1,113 | ||||||||||||
| Interest cost |
9,199 | 8,495 | 8,697 | 2,240 | 2,074 | 2,275 | ||||||||||||||||||
| Expected return on assets |
(14,435 | ) | (12,968 | ) | (12,017 | ) | — | — | — | |||||||||||||||
| Amortization of: |
||||||||||||||||||||||||
| Net actuarial loss |
2,270 | 5,775 | 5,759 | 777 | 1,160 | 1,153 | ||||||||||||||||||
| Prior service cost (credit) |
231 | 358 | 358 | (1,565 | ) | (1,565 | ) | (1,565 | ) | |||||||||||||||
|
|
|
|
|
|
|
|
|
|
|
|
|
|||||||||||||
| Net periodic benefit cost |
1,370 | 6,665 | 7,672 | 2,450 | 2,843 | 2,976 | ||||||||||||||||||
| Other changes in plan assets and benefit obligations recognized in other comprehensive income: |
||||||||||||||||||||||||
| Net actuarial loss (gain) |
57,140 | (30,540 | ) | 9,619 | 14,140 | (6,083 | ) | 1,110 | ||||||||||||||||
| Amortization of net actuarial loss |
(2,270 | ) | (5,775 | ) | (5,759 | ) | (777 | ) | (1,160 | ) | (1,153 | ) | ||||||||||||
| Amortization of prior service cost |
(231 | ) | (358 | ) | (358 | ) | 1,565 | 1,565 | 1,565 | |||||||||||||||
|
|
|
|
|
|
|
|
|
|
|
|
|
|||||||||||||
| Total recognized in other comprehensive income |
54,639 | (36,673 | ) | 3,502 | 14,928 | (5,678 | ) | 1,522 | ||||||||||||||||
|
|
|
|
|
|
|
|
|
|
|
|
|
|||||||||||||
| Total recognized in net periodic benefit cost and other comprehensive income |
$ | 56,009 | $ | (30,008 | ) | $ | 11,174 | $ | 17,378 | $ | (2,835 | ) | $ | 4,498 | ||||||||||
|
|
|
|
|
|
|
|
|
|
|
|
|
|||||||||||||
The estimated net actuarial loss and prior service cost for the defined benefit pension plans that will be amortized from accumulated other comprehensive income into net periodic benefit cost during 2015 are $7.0 million and $139,000 respectively. The estimated net actuarial loss and prior service credit for other defined benefit post-retirement plans that will be amortized from accumulated other comprehensive income into net periodic benefit cost during 2015 are $1.7 million and $1.6 million, respectively.
The following are the weighted average assumptions used to determine net periodic benefit cost for the years ended December 31:
| Retirement Plans | Other Benefits | |||||||||||||||||||||||
| 2014 | 2013 | 2012 | 2014 | 2013 | 2012 | |||||||||||||||||||
| Discount rate |
4.75 | % | 4.00 | % | 4.63 | % | 4.70 | % | 4.00 | % | 4.55 | % | ||||||||||||
| Expected return on assets |
8.25 | 8.25 | 8.25 | — | — | — | ||||||||||||||||||
| Rate of compensation increase |
3.50 | 3.50 | 4.00 | — | — | — | ||||||||||||||||||
The following are the weighted-average assumptions used to determine benefit obligations at December 31:
| Retirement Plans | Other Benefits | |||||||||||||||
| 2014 | 2013 | 2014 | 2013 | |||||||||||||
| Discount rate |
3.85 | % | 4.75 | % | 3.90 | % | 4.70 | % | ||||||||
| Rate of compensation increase |
3.50 | 3.50 | — | — | ||||||||||||
The overall expected return on assets assumption is based on the historical performance of the pension fund. The average return over the past ten years was determined for the market value of assets, which is the value used in the calculation of annual net periodic benefit cost.
148
Table of Contents
Notes to Consolidated Financial Statements
The assumed health care cost trend rate used to measure the expected cost of other benefits for 2014 was 8.00%. The rate was assumed to decrease gradually to 4.50% for 2022 and remain at that level thereafter.
A 1% change in the assumed health care cost trend rate would have the following effects on other benefits:
| 1% Increase | 1% Decrease | |||||||
| (In thousands) | ||||||||
| Effect on total service cost and interest cost |
$ | (96 | ) | $ | 116 | |||
| Effect on other benefit obligations |
(873 | ) | 1,345 | |||||
Funds in Hudson City’s qualified retirement plan are invested in a commingled asset allocation fund (the “Fund”) of a well-established asset management company and in Hudson City Bancorp, Inc. common stock. The purpose of the Fund is to provide a diversified portfolio of equities, fixed income instruments and cash. The plan trustee, in its absolute discretion, manages the Fund. The Fund is maintained with the objective of providing investment results that outperform a static mix of 55% equity, 35% bond and 10% cash, as well as the median manager of balanced funds. In order to achieve the Fund’s return objective, the Fund will combine fundamental analysis and a quantitative proprietary model to allocate and reallocate assets among the three broad investment categories of equities, money market instruments and other fixed income obligations. As market and economic conditions change, these ratios will be adjusted in moderate increments of about five percentage points. It is intended that the equity portion will represent approximately 40% to 70%, the bond portion approximately 25% to 55% and the money market portion 0% to 25%. Performance results are reviewed at least annually with the asset management company of the Fund.
Equity securities held by the Fund include Hudson City Bancorp common stock in the amount of $7.1 million (3.8% of total plan assets) as of December 31, 2014, and $6.6 million (3.7% of total plan assets) as of December 31, 2013. This stock was purchased at an aggregate cost of $6.0 million using a cash contribution made by Hudson City Savings in July 2003. Our plan may not purchase our common stock if, after the purchase, the fair value of our common stock held by the plan equals or exceeds 10% of the fair value of plan assets. We review with the plan administrator the rebalancing of plan assets if the fair value of our common stock held by the plan exceeds 20% of the fair value of the total plan assets.
149
Table of Contents
Notes to Consolidated Financial Statements
The following table presents the fair value of the retirement plan’s assets at the dates indicated by asset class:
| Fair Value Measurements at December 31, 2014 | ||||||||||||||||
| Quoted Prices in Active | Significant Other | Significant | ||||||||||||||
| Carrying | Markets for Identical | Observable Inputs | Unobservable | |||||||||||||
| Asset Class |
Value | Assets (Level 1) | (Level 2) | Inputs (Level 3) | ||||||||||||
| (In thousands) | ||||||||||||||||
| Cash |
7,206 | 7,206 | — | — | ||||||||||||
| Guaranteed deposit fund (a) |
11,440 | — | — | 11,440 | ||||||||||||
| Equity Securities (b) |
98,135 | 98,135 | — | — | ||||||||||||
| Fixed income securities (c) |
70,666 | — | 70,666 | — | ||||||||||||
|
|
|
|
|
|
|
|
|
|||||||||
| $ | 187,447 | $ | 105,341 | $ | 70,666 | $ | 11,440 | |||||||||
|
|
|
|
|
|
|
|
|
|||||||||
| Fair Value Measurements at December 31, 2013 | ||||||||||||||||
| Quoted Prices in Active | Significant Other | Significant | ||||||||||||||
| Carrying | Markets for Identical | Observable Inputs | Unobservable | |||||||||||||
| Asset Class |
Value | Assets (Level 1) | (Level 2) | Inputs (Level 3) | ||||||||||||
| (In thousands) | ||||||||||||||||
| Cash |
4,014 | 4,014 | — | — | ||||||||||||
| Guaranteed deposit fund (a) |
11,669 | — | — | 11,669 | ||||||||||||
| Equity Securities (b) |
94,648 | 94,648 | — | — | ||||||||||||
| Fixed income securities (c) |
67,913 | — | 67,913 | — | ||||||||||||
|
|
|
|
|
|
|
|
|
|||||||||
| $ | 178,244 | $ | 98,662 | $ | 67,913 | $ | 11,669 | |||||||||
|
|
|
|
|
|
|
|
|
|||||||||
| (a) | The Guaranteed Deposit Fund (the “Fund”) is an investment in the general account of the Prudential Retirement Insurance and Annuity Company and represents an insurance claim supported by all general account assets. The Fund’s assets are intermediate-term, high-grade fixed income securities consisting of commercial mortgages, private placement bonds, publicly-traded debt securities and asset-backed securities. |
| (b) | This class includes a mutual fund that invests primarily in stocks representative of the overall U.S. stock market. The objectives of this mutual fund is to outperform the U.S. stock markets. This class also includes $7.1 million and $6.6 million of Hudson City Bancorp, Inc. common stock at December 31, 2014 and 2013, respectively. |
| (c) | This class includes investments in U.S. Treasuries, MBSs issued by GSEs, investment-grade corporate bonds and sovereign debt. |
The following table presents a reconciliation of Level 3 assets measured at fair value at December 31:
| Fair Value Measurements Using | ||||||||
| Significant Unobservable Inputs (Level 3) | ||||||||
| (In thousands) | ||||||||
| Guaranteed Deposit Fund | ||||||||
| 2014 | 2013 | |||||||
| Beginning balance |
$ | 11,669 | $ | 11,819 | ||||
| Purchases, sales, issuances and settlements (net) |
(229 | ) | (150 | ) | ||||
|
|
|
|
|
|||||
| Ending balance |
$ | 11,440 | $ | 11,669 | ||||
|
|
|
|
|
|||||
We made contributions of $690,000 and $689,000 to our retirement plans during 2014 and 2013, respectively.
150
Table of Contents
Notes to Consolidated Financial Statements
The following benefit payments, which reflect expected future service, as appropriate, are expected to be paid under the current provisions of the plans.
| Retirement | Other | |||||||
| Year |
Plans | Benefits | ||||||
| (In thousands) | ||||||||
| 2015 |
$ | 8,543 | $ | 3,104 | ||||
| 2016 |
9,222 | 3,372 | ||||||
| 2017 |
9,766 | 3,538 | ||||||
| 2018 |
10,600 | 3,780 | ||||||
| 2019 |
11,305 | 3,897 | ||||||
| 2020 through 2024 |
65,251 | 21,275 | ||||||
b) Employee Stock Ownership Plan
The ESOP is a tax-qualified plan designed to invest primarily in Hudson City common stock that provides employees with the opportunity to receive an employer-funded retirement benefit based primarily on the value of Hudson City common stock. Employees are generally eligible to participate in the ESOP after one year of service providing they worked at least 1,000 hours during the plan year and attained age 21. Participants who do not have at least 1,000 hours of service during the plan year or are not employed on the last working day of a plan year are generally not eligible for an allocation of stock for such year. The ESOP was authorized to purchase 27,879,385 shares following our initial public offering and an additional 15,719,223 shares following our second-step conversion for a total of 43,598,608 shares of Hudson City common stock which were purchased at an average price of $5.69 per share with loans from Hudson City Bancorp.
The combined outstanding loan principal at December 31, 2014 was $217.7 million. Those shares purchased were pledged as collateral for the loan and are released from the pledge for allocation to participants as loan payments are made. The loan will be repaid and the shares purchased will be allocated to employees in equal installments of 962,185 shares per year over a forty-year period. The annual allocation of shares is based on the ratio of a participant’s eligible compensation, as defined in the ESOP document, as a percentage of total eligible compensation of all participants in the ESOP. Dividends on allocated and unallocated shares, to the extent that they exceed the scheduled principal and interest payments on the ESOP loan, are paid to participants in cash.
Through December 31, 2014, a total of 14,733,069 shares have been allocated or committed to be allocated to participants. Unallocated ESOP shares held in suspense totaled 28,865,539 at December 31, 2014 and had a fair value of $292.1 million. ESOP compensation expense for the years ended December 31, 2014, 2013 and 2012 was $9.3 million, $8.5 million, and $6.8 million, respectively.
The ESOP restoration plan is a non-qualified plan that provides supplemental benefits to certain executives who are prevented from receiving the full benefits contemplated by the employee stock ownership plan’s benefit formula. The supplemental cash payments consist of payments representing shares that cannot be allocated to participants under the ESOP due to the legal limitations imposed on tax-qualified plans and, in the case of participants who retire before the repayment in full of the ESOP’s loan, payments representing the shares that would have been allocated if employment had continued through the full term of the loan. We accrue for these benefits over the period during which employees provide services to earn these benefits. At December 31, 2014 and 2013, we had accrued $20.0 million and $19.8 million, respectively for the ESOP restoration plan. Compensation expense (benefit) related to this plan amounted to $241,000, $(1.8) million and $(2.3) million in 2014, 2013 and 2012, respectively.
151
Table of Contents
Notes to Consolidated Financial Statements
c) Stock Option Plans
Compensation expense for stock option grants is recognized based upon the grant-date fair value of those awards over the period of requisite service. The purpose of our stock-based compensation plans is to promote the growth and profitability of Hudson City Bancorp by providing directors, officers and employees with an equity interest in Hudson City Bancorp as an incentive to achieve corporate goals.
Each stock option granted entitles the holder to purchase one share of Hudson City’s common stock at an exercise price not less than the fair value of a share of common stock at the date of grant. Options granted generally vest over a five year period from the date of grant and will expire no later than 10 years following the grant date. Under the Hudson City stock option plans existing prior to 2006, 36,323,960 shares of Hudson City Bancorp, Inc. common stock have been reserved for issuance. Directors and employees have been granted 36,503,507 stock options, including 240,819 shares previously issued, but forfeited by plan participants prior to exercise.
In June 2006, our shareholders approved the Hudson City Bancorp, Inc. 2006 Stock Incentive Plan (the “SIP”) authorizing us to grant up to 30,000,000 shares of common stock. In July 2006, the Compensation Committee of the Board of Directors of Hudson City Bancorp (the “Committee”), authorized grants to each non-employee director, executive officers and other employees to purchase shares of the Company’s common stock, pursuant to the 2006 SIP. Grants of stock options made through December 31, 2010 pursuant to the 2006 SIP amounted to 23,120,000 options at an exercise price equal to the fair value of our common stock on the grant date, based on quoted market prices. Of these options, 6,067,500 have vesting periods ranging from one to five years and an expiration period of ten years. The remaining 17,052,500 shares have vesting periods ranging from two to three years if certain financial performance measures are met. The financial performance measures for each of these awards, other than the performance stock options granted in 2010 (“2010 grants”), were met so we recorded compensation expense for these awards accordingly. One of the two performance measures related to the 2010 option grants was not met so the Company recorded expense for only half of the 2010 option grants. The options that did not vest are included in forfeitures in the table below.
In April 2011, our shareholders approved the Hudson City Bancorp, Inc. Amended and Restated 2011 Stock Incentive Plan (the “2011 SIP”) authorizing us to grant up to 28,750,000 shares of common stock including 2,070,000 shares remaining under the 2006 SIP. During 2011, the Committee authorized stock option grants (the “2011 option grants”) pursuant to the 2011 SIP for 1,618,932 options at an exercise price equal to the fair value of our common stock on the grant date, based on quoted market prices. Of these options, 1,308,513 will vest between April 2014 and July 2014 if certain financial performance measures are met and employment continues through the vesting date (the “2011 Performance Options”). The remaining 310,419 options vested in April 2012. The 2011 option grants have an expiration period of ten years. The performance measures for the 2011 Performance Options have been met and we have recorded compensation expense for those grants accordingly. No stock options were granted during 2014, 2013 and 2012.
Compensation expense related to our outstanding stock options amounted to $282,000, $942,000 and $1.7 million for the years ended December 31, 2014, 2013 and 2012, respectively.
152
Table of Contents
Notes to Consolidated Financial Statements
A summary of the status of the granted, but unexercised stock options as of December 31, and changes during those years, is presented below:
| 2014 | 2013 | 2012 | ||||||||||||||||||||||
| Weighted | Weighted | Weighted | ||||||||||||||||||||||
| Number of | Average | Number of | Average | Number of | Average | |||||||||||||||||||
| Stock | Exercise | Stock | Exercise | Stock | Exercise | |||||||||||||||||||
| Options | Price | Options | Price | Options | Price | |||||||||||||||||||
| Outstanding at beginning of year |
25,402,955 | $ | 13.02 | 27,775,857 | $ | 12.97 | 28,825,986 | $ | 12.77 | |||||||||||||||
| Granted |
— | — | — | — | — | — | ||||||||||||||||||
| Exercised |
(11,900 | ) | 9.50 | (222,510 | ) | 6.32 | (702,545 | ) | 5.56 | |||||||||||||||
| Forfeited |
(3,031,599 | ) | 12.02 | (2,150,392 | ) | 12.99 | (347,584 | ) | 12.05 | |||||||||||||||
|
|
|
|
|
|
|
|
|
|
|
|
|
|||||||||||||
| Outstanding at end of year |
22,359,456 | $ | 13.16 | 25,402,955 | $ | 13.02 | 27,775,857 | $ | 12.97 | |||||||||||||||
|
|
|
|
|
|
|
|
|
|
|
|
|
|||||||||||||
Shares issued upon the exercise of stock options are issued from treasury stock. Hudson City has an adequate number of treasury shares available for sale for future stock option exercises. The total intrinsic value of the options exercised during 2014, 2013 and 2012 was $6,000, $530,000, and $1.1 million, respectively.
The following table summarizes information about our stock options outstanding at December 31, 2014:
| Options Outstanding | Options Exercisable | |||||||||||||||
| Weighted | ||||||||||||||||
| Average | Weighted | Weighted | ||||||||||||||
| Number | Remaining | Average | Number | Average | ||||||||||||
| Of Options | Contractual | Exercise | Of Options | Exercise | ||||||||||||
| Outstanding | Life | Price | Exercisable | Price | ||||||||||||
| 383,724 | 1 month | 11.17 | 383,724 | 11.17 | ||||||||||||
| 7,747,500 | 1.5 years | 12.76 | 7,747,500 | 12.76 | ||||||||||||
| 350,000 | 2 years | 13.35 | 350,000 | 13.35 | ||||||||||||
| 2,970,000 | 2 years | 13.78 | 2,970,000 | 13.78 | ||||||||||||
| 3,525,000 | 3 years | 15.69 | 3,525,000 | 15.69 | ||||||||||||
| 350,000 | 3 years | 18.84 | 350,000 | 18.84 | ||||||||||||
| 50,000 | 3 years | 12.00 | 50,000 | 12.00 | ||||||||||||
| 350,000 | 4 years | 12.81 | 350,000 | 12.81 | ||||||||||||
| 2,805,000 | 4 years | 12.03 | 2,805,000 | 12.03 | ||||||||||||
| 1,950,000 | 5 years | 13.12 | 1,950,000 | 13.12 | ||||||||||||
| 300,000 | 5 years | 13.47 | 300,000 | 13.47 | ||||||||||||
| 37,500 | 5.5 years | 12.10 | 37,500 | 12.10 | ||||||||||||
| 1,338,919 | 6 years | 9.50 | 1,338,919 | 9.50 | ||||||||||||
| 51,813 | 6 years | 8.33 | 51,813 | 8.33 | ||||||||||||
| 150,000 | 6 years | 9.77 | 150,000 | 9.77 | ||||||||||||
|
|
|
|
|
|
|
|
|
|||||||||
| 22,359,456 | $ | 13.16 | 22,359,456 | $ | 13.16 | |||||||||||
|
|
|
|
|
|
|
|
|
|||||||||
The total intrinsic value of the options outstanding was $976,000 as of December 31, 2014. At December 31, 2014, there were no unvested option awards and no unearned compensation costs related to stock option awards.
153
Table of Contents
Notes to Consolidated Financial Statements
d) Restricted Stock Plans
Hudson City Bancorp granted stock awards pursuant to the RRP established in January 2000 and the SIP established in January 2006. Expense for stock awards is recognized ratably over the vesting period based on the fair value of the common stock on the grant date. No stock awards have been granted pursuant to the 2011 SIP.
The RRP were authorized, in the aggregate, to purchase not more than 14,901,480 shares of common stock, and have purchased 14,887,855 shares on the open market at an average price of $2.91 per share. Generally, restricted stock grants are held in escrow for the benefit of the award recipient until vested. Awards outstanding generally vest in five annual installments commencing one year from the date of the award. As of December 31, 2014, common stock that had not been awarded under the RRP totaled 13,625 shares.
During 2009, the Committee granted performance-based stock awards (the “2009 stock awards”) pursuant to the 2006 SIP for 847,750 shares of our common stock. These shares were issued from treasury stock and were scheduled to vest in annual installments over a three-year period if certain performance measures were met and employment continued through the vesting date. These performance measures were met and we recorded compensation expense for the 2009 stock awards over the vesting period based on the fair value of the shares on the grant date which was $12.03. In addition to the 2009 stock awards, grants were made in 2010 (the “2010 stock awards”) pursuant to the 2006 SIP for 18,000 shares of our common stock. Expense for the 2010 stock awards is recognized over the vesting period of three years and is based on the fair value of the shares on the grant date which was $13.12. Total compensation expense for the restricted stock plans amounted to $79,000 for the year ended December 31, 2012.
A summary of the status of the granted, but unvested shares under the RRP and SIP Plan as of December 31, and changes during those years, is presented below:
| 2012 | ||||||||
| Weighted | ||||||||
| Average | ||||||||
| Number of | Grant Date | |||||||
| Shares | Fair Value | |||||||
| Outstanding at beginning of period |
294,584 | $ | 12.07 | |||||
| Granted |
— | — | ||||||
| Vested |
(288,584 | ) | 12.05 | |||||
| Forfeited |
(6,000 | ) | 13.12 | |||||
|
|
|
|
|
|||||
| Outstanding at end of period |
— | $ | — | |||||
|
|
|
|
|
|||||
The per share weighted-average vesting date fair value of the shares vested during 2012 was $6.83.
e) Stock Unit Awards
Hudson City Bancorp granted stock unit awards to a newly appointed member of the Board of Directors in July 2010. These awards were for a value of $250,000 which was converted to common stock equivalents (stock units) of 20,661 shares. These units vested over a three-year period upon continued service through the annual vesting dates and will be settled in shares of our common stock following the director’s departure from the Board of Directors.
154
Table of Contents
Notes to Consolidated Financial Statements
Stock unit awards were also made in 2011 (the “2011 stock unit awards”) pursuant to the 2011 SIP for a total value of $9.7 million, or stock units of 1,004,230 shares. 2011 stock unit awards to employees vested on continued service through the third anniversary of the awards, and our attainment of certain financial performance measures as certified by the Committee. A portion of these awards were settled in shares of our common stock upon vesting, and the remainder will be settled in shares of our common stock on the sixth anniversary of the awards. 2011 stock unit awards to directors vested on continued service through the first anniversary of the award, and are settled in shares of our common stock following the director’s departure from the Board of Directors.
Stock unit awards were made in 2012 (the “2012 stock unit awards”) pursuant to the 2011 SIP for a total of $12.7 million, or stock units of 1,768,681 shares. The 2012 stock unit awards to employees vest if service continues through the third anniversary of the awards and certain financial performance measures are met. The 2012 stock unit awards include stock units of 974,528 shares that will be settled, if vested, in shares of our common stock on the third and sixth anniversaries of the awards. The 2012 stock unit awards also included variable performance stock units (“VPUs”) of 718,826 shares which will be settled, if vested, in shares of our common stock on the third anniversary of the awards. Half of each VPU award is conditioned on the ranking of the total shareholder return of the Company’s common stock over the calendar years 2012 to 2014 against the total shareholder return of a peer group of 50 companies and the other half was conditioned on the Company’s attainment of return on tangible equity measures for the calendar year 2012. Based on the level of performance of each award, between 0% and 150% of the VPUs may vest. The market condition requirements are reflected in the grant date fair value of the award, and the compensation expense for the award will be recognized regardless of whether the market conditions are met. Based on performance through December 31, 2014, the Company has determined that no more than 128% of the VPUs subject to the total shareholder return condition may vest upon continued service through their vesting dates. Based on performance through December 31, 2012, the Company has determined that no more than 60.25% of the VPUs subject to the return on tangible equity condition may vest upon continued service through their vesting dates.
The fair value of the VPUs was estimated as of the date of grant using a Monte Carlo simulation model, which utilized multiple input variables that determine the probability of satisfying the market condition requirements applicable to each award as follows:
| 2012 | ||||
| VPUs | ||||
| HCBK closing price |
$ | 7.10 | ||
| Expected volatility |
35.28 | % | ||
| Risk-free interest rate |
0.39 | % | ||
| Remaining term (in years) |
2.68 | |||
| Fair value of VPUs granted |
$ | 7.44 | ||
The expected volatility assumption was calculated based on the weighting of our historical and rolling volatility for the expected term of the grants. The risk-free interest rate was determined by reference to the continuously compounded yield on Treasury obligations for the expected term.
The remaining 75,327 2012 stock unit awards, which were granted to outside directors, vested in April 2013 and will be settled upon resignation from the Board of Directors. Expense for the stock unit awards is recognized over their vesting period and is based on the fair value of our common stock on each stock unit grant date, based on quoted market prices.
155
Table of Contents
Notes to Consolidated Financial Statements
Stock unit awards were made in 2013 (the “2013 stock unit awards”) pursuant to the 2011 SIP for a total of $13.8 million, or stock units of 1,672,639 shares. The 2013 stock unit awards include 1,480,100 shares granted to employees in June 2013 that will be settled, if vested, in shares of our common stock on the third and sixth anniversaries of the awards. These awards vest in annual installments, subject to continued service through January 1, 2014, 2015 and 2016 and the attainment of certain financial performance measures. Attainment of these measures was certified by the Committee in 2014. The Committee specifically reserved its rights to reduce the number of shares covered by the 2013 stock unit awards to senior executives on or before certification of the performance goals if the Committee determined, in its discretion, that prevailing circumstances warrant such a reduction. The Committee exercised this discretion in the first quarter of 2014 resulting in the forfeiture of stock units representing 323,550 shares. The 2013 stock unit awards also include 138,800 shares which were granted in March 2013 that will be settled in shares of our common stock on each vesting date. These awards vest in annual installments, subject to continued service through March 19, 2014, 2015 and 2016. The remaining 53,739 2013 stock unit awards, which were granted to outside directors, vested on continued service through April 2014 and will be settled upon such director’s resignation from the Board of Directors. These awards will be settled, if vested, in shares of our common stock on the final vesting date.
Stock unit awards were made in March 2014 (the “2014 stock unit awards”) pursuant to the 2011 SIP for a total of $13.2 million, or stock units of 1,417,951 shares. The 2014 stock unit awards include 1,363,470 shares granted to employees in March 2014 that will be settled, if vested, in shares of our common stock on the third and sixth anniversaries of the awards. These awards vest in annual installments, subject to continued service through January 1, 2015, 2016 and 2017 and our achievement of certain financial performance measures. Attainment of these measures has been certified by the Committee in 2015. The remaining 53,851 stock unit awards, which were granted to outside directors, vest on continued service through March 2015 and will be settled upon such director’s resignation from the Board of Directors. These awards will be settled, if vested, in shares of our common stock on the final vesting date.
The fair values of the 2014 and 2013 stock unit awards was estimated on the date of grant using the Black-Scholes option-pricing model with the following weighted average assumptions:
| 2014 | 2013 | |||||||
| VPUs | VPUs | |||||||
| HCBK closing price |
$ | 9.43 | $ | 8.36 | ||||
| Expected volatility |
27.00 | % | 28.00 | % | ||||
| Risk-free interest rate |
0.92 | % | 0.72 | % | ||||
| Remaining term (in years) |
2.68 | 2.41 | ||||||
| Fair value of VPUs granted |
$ | 9.35 | $ | 8.21 | ||||
Expense attributable to the stock unit awards amounted to $10.8 million, $9.6 million and $6.1 million for the years ended December 31, 2014, 2013 and 2012, respectively.
156
Table of Contents
Notes to Consolidated Financial Statements
A summary of the status of the granted, but unvested shares under the SIP Plan as of December 31, and changes during those years, is presented below:
| Stock Unit Awards | ||||||||||||||||||||||||
| 2014 | 2013 | 2012 | ||||||||||||||||||||||
| Weighted | Weighted | Weighted | ||||||||||||||||||||||
| Average | Average | Average | ||||||||||||||||||||||
| Number of | Grant Date | Number of | Grant Date | Number of | Grant Date | |||||||||||||||||||
| Shares | Fair Value | Shares | Fair Value | Shares | Fair Value | |||||||||||||||||||
| Outstanding at beginning of period |
4,282,146 | $ | 8.16 | 2,764,372 | $ | 8.07 | 1,024,891 | $ | 9.75 | |||||||||||||||
| Granted |
1,417,591 | 9.35 | 1,672,639 | 8.21 | 1,768,681 | 7.13 | ||||||||||||||||||
| Vested |
(775,016 | ) | 9.31 | — | — | — | — | |||||||||||||||||
| Forfeited |
(840,623 | ) | 8.20 | (154,865 | ) | 7.13 | (29,200 | ) | 9.71 | |||||||||||||||
|
|
|
|
|
|
|
|
|
|
|
|
|
|||||||||||||
| Outstanding at end of period |
4,084,098 | $ | 8.34 | 4,282,146 | $ | 8.16 | 2,764,372 | $ | 8.07 | |||||||||||||||
|
|
|
|
|
|
|
|||||||||||||||||||
f) Incentive Plans
A tax-qualified profit sharing and savings plan is maintained based on Hudson City’s profitability. All employees are eligible after one year of employment and the attainment of age 21. Expense related to this plan was $1.0 million, $4.5 million, and $2.3 million in 2014, 2013 and 2012, respectively.
Certain incentive plans are maintained to recognize key executives who are able to make substantial contributions to the long-term success and financial strength of Hudson City. At the end of each performance period, the value of the award is determined in accordance with established criteria. Participants can elect cash payment or elect to defer the award until retirement. The expense related to these plans was $5.0 million, $10.1 million, and $10.2 million in 2014, 2013 and 2012, respectively.
12. Other Comprehensive Income (Loss)
The changes in accumulated other comprehensive income (loss) by component, net of tax, is as follows:
| Unrealized gains | ||||||||||||
| (losses) on securities | Postretirement | |||||||||||
| available for sale | Benefit Plans | Total | ||||||||||
| (In thousands) | ||||||||||||
| Balance at December 31, 2012 |
$ | 122,629 | $ | (52,659 | ) | $ | 69,970 | |||||
|
|
|
|
|
|
|
|||||||
| Other comprehensive income (loss) before reclassifications |
(84,158 | ) | 21,662 | (62,496 | ) | |||||||
| Amounts reclassified from accumulated other comprehensive (loss) income |
(4,527 | ) | 3,389 | (1,138 | ) | |||||||
|
|
|
|
|
|
|
|||||||
| Other comprehensive (loss) income |
(88,685 | ) | 25,051 | (63,634 | ) | |||||||
|
|
|
|
|
|
|
|||||||
| Balance at December 31, 2013 |
$ | 33,944 | $ | (27,608 | ) | $ | 6,336 | |||||
|
|
|
|
|
|
|
|||||||
| Balance at December 31, 2013 |
$ | 33,944 | $ | (27,608 | ) | $ | 6,336 | |||||
|
|
|
|
|
|
|
|||||||
| Other comprehensive income (loss) before reclassifications |
36,314 | (42,161 | ) | (5,847 | ) | |||||||
| Amounts reclassified from accumulated other comprehensive (loss) income |
(51,876 | ) | 1,013 | (50,863 | ) | |||||||
|
|
|
|
|
|
|
|||||||
| Other comprehensive (loss) income |
(15,562 | ) | (41,148 | ) | (56,710 | ) | ||||||
|
|
|
|
|
|
|
|||||||
| Balance at December 31, 2014 |
$ | 18,382 | $ | (68,756 | ) | $ | (50,374 | ) | ||||
|
|
|
|
|
|
|
|||||||
157
Table of Contents
Notes to Consolidated Financial Statements
The following table presents the reclassification adjustment out of accumulated other comprehensive income (loss) included in net income and the corresponding line item on the consolidated statements of operations for the years ended December 31:
| Details about Accumlated Other Comprehensive Income Components |
Amounts Reclassified from Accumulated Other Comprehensive Income |
Line Item in | ||||||||||||
| 2014 | 2013 | 2012 | ||||||||||||
| Securities available for sale: |
||||||||||||||
| Net realized gain on securities available for sale |
$ | (87,605 | ) | $ | (7,653 | ) | $ | — | Gain on securities transaction, net | |||||
| Income tax expense |
35,729 | 3,126 | — | Income tax expense | ||||||||||
|
|
|
|
|
|
|
|||||||||
| Net of income tax expense |
(51,876 | ) | (4,527 | ) | — | |||||||||
|
|
|
|
|
|
|
|||||||||
| Postretirement benefit pension plans: |
||||||||||||||
| Amortization of prior service cost |
(1,334 | ) | (1,207 | ) | (1,207 | ) | (a) | |||||||
| Amortization of net actuarial loss |
3,047 | 6,935 | 6,912 | (a) | ||||||||||
|
|
|
|
|
|
|
|||||||||
| Total before income tax expense |
1,713 | 5,728 | 5,705 | |||||||||||
| Income tax expense |
(700 | ) | (2,339 | ) | (2,330 | ) | Income tax expense | |||||||
|
|
|
|
|
|
|
|||||||||
| Net of income tax expense |
1,013 | 3,389 | 3,375 | |||||||||||
|
|
|
|
|
|
|
|||||||||
| Total reclassifications |
$ | (50,863 | ) | $ | (1,138 | ) | $ | 3,375 | ||||||
|
|
|
|
|
|
|
|||||||||
| (a) | These items are included in the computation of net periodic pension cost. See Employee Benefit Plans footnote for additional disclosure. |
13. Income Taxes
Income tax expense is summarized as follows for the years ended December 31:
| 2014 | 2013 | 2012 | ||||||||||
| (In thousands) | ||||||||||||
| Federal: |
||||||||||||
| Current |
$ | 77,173 | $ | 113,620 | $ | 108,900 | ||||||
| Deferred |
9,807 | (13,735 | ) | 27,619 | ||||||||
|
|
|
|
|
|
|
|||||||
| Total federal |
86,980 | 99,885 | 136,519 | |||||||||
|
|
|
|
|
|
|
|||||||
| State: |
||||||||||||
| Current |
7,148 | 3,012 | 157 | |||||||||
| Deferred |
10,900 | 17,152 | 27,963 | |||||||||
|
|
|
|
|
|
|
|||||||
| Total state |
18,048 | 20,164 | 28,120 | |||||||||
|
|
|
|
|
|
|
|||||||
| Total income tax expense |
105,028 | 120,049 | 164,639 | |||||||||
|
|
|
|
|
|
|
|||||||
Not included in the above table are deferred income tax benefit (expense) of $39.2 million, $43.9 million, and $(20.9) million for 2014, 2013 and 2012, respectively, which represent the deferred income taxes relating to the changes in accumulated other comprehensive income (loss).
158
Table of Contents
Notes to Consolidated Financial Statements
The amounts reported as income tax expense vary from the amounts that would be reported by applying the statutory federal income tax rate to income before income taxes due to the following:
| 2014 | 2013 | 2012 | ||||||||||
| (Dollars in thousands) | ||||||||||||
| Net income before income tax expense |
$ | 262,993 | $ | 305,265 | $ | 413,782 | ||||||
| Statutory income tax rate |
35 | % | 35 | % | 35 | % | ||||||
|
|
|
|
|
|
|
|||||||
| Computed expected income tax expense |
92,048 | 106,843 | 144,824 | |||||||||
| State income taxes, net of federal income tax expense |
11,731 | 13,107 | 18,278 | |||||||||
| ESOP fair market value adjustment |
1,154 | 902 | 292 | |||||||||
| Merger-related expenses |
235 | 242 | 2,125 | |||||||||
| Dividends on allocated ESOP shares |
(645 | ) | (677 | ) | (1,050 | ) | ||||||
| Other, net |
505 | (368 | ) | 170 | ||||||||
|
|
|
|
|
|
|
|||||||
| Income tax expense |
$ | 105,028 | $ | 120,049 | $ | 164,639 | ||||||
|
|
|
|
|
|
|
|||||||
The net deferred tax asset consists of the following at December 31:
| 2014 | 2013 | |||||||
| (In thousands) | ||||||||
| Deferred tax asset: |
||||||||
| Allowance for loan losses |
$ | 95,637 | $ | 111,900 | ||||
| State operating loss carryforward |
43,437 | 51,278 | ||||||
| Postretirement benefits |
67,370 | 39,054 | ||||||
| Non-qualified benefit plans |
54,306 | 56,238 | ||||||
| ESOP expense |
15,096 | 13,995 | ||||||
| Interest on non-accrual loans |
45,153 | 46,136 | ||||||
| Other |
18,063 | 21,848 | ||||||
|
|
|
|
|
|||||
| Total deferred tax assets |
339,062 | 340,449 | ||||||
|
|
|
|
|
|||||
| Deferred tax liabilities: |
||||||||
| Postretirement benefits |
19,939 | 19,916 | ||||||
| Net unrealized gain on securities available for sale |
12,637 | 23,384 | ||||||
| Other |
894 | 1,396 | ||||||
|
|
|
|
|
|||||
| Total deferred tax liabilities |
33,470 | 44,696 | ||||||
|
|
|
|
|
|||||
| Net deferred tax asset (included in other assets) |
$ | 305,592 | $ | 295,753 | ||||
|
|
|
|
|
|||||
The net deferred tax asset represents the anticipated federal and state tax benefits expected to be realized in future years upon the utilization of the underlying tax attributes comprising this balance. Federal deferred tax assets are recoverable due to the two year loss carryback period for federal purposes. During 2013, the Company received $364.9 million in tax refunds related to our net loss for 2011. State deferred tax assets, including the state net operating loss are dependent upon the Company’s taxable income in future periods. In management’s opinion, in view of Hudson City’s previous, current and projected future earnings trends, such net deferred tax asset will more likely than not be fully realized. Accordingly, no valuation allowance was deemed to be required at December 31, 2014 and 2013.
Current accounting guidance provides for the accounting for uncertainties in income taxes recognized in an enterprise’s financial statements. This guidance prescribes a recognition threshold and measurement attribute for the financial statement recognition and measurement of a tax position taken, or expected to be taken, in a tax return. Accrued estimated penalties and interest on unrecognized tax benefits were approximately $1.8 million at both December 31, 2014 and 2013. Estimated penalties and interest of $(1,000), $(798,000) and $234,000 are included in income tax expense at December 31, 2014, 2013, and 2012, respectively. The Company’s tax returns are subject to examination in the normal course by federal and state tax authorities for the years 2010 through 2014.
159
Table of Contents
Notes to Consolidated Financial Statements
A reconciliation of the beginning and ending amount of unrecognized tax benefits for the years ended December 31 is as follows:
| 2014 | 2013 | |||||||
| (In thousands) | ||||||||
| Balance at January 1 |
$ | 6,838 | $ | 6,880 | ||||
| Additions based on tax positions related to the current year |
566 | 244 | ||||||
| Reductions for tax positions of prior years |
(814 | ) | (286 | ) | ||||
|
|
|
|
|
|||||
| Balance at December 31 |
$ | 6,590 | $ | 6,838 | ||||
|
|
|
|
|
|||||
Retained earnings at December 31, 2014 included approximately $58.0 million for which no deferred income taxes have been provided. This amount represents the base year allocation of income to bad debt deduction for tax purposes. Under FASB guidance, this amount is treated as a permanent difference and deferred taxes are not recognized unless it appears that the amount will be reduced and result in taxable income in the foreseeable future. Events that would result in taxation of these reserves include failure to qualify as a bank for tax purposes or distributions in excess of Hudson City Savings’ current and accumulated earnings and profits, distributions in redemption of stock and distributions in partial or complete liquidation. The unrecognized deferred tax liability with respect to our base-year deduction amounted to $23.5 million at December 31, 2014 and 2013.
On March 31, 2014, New York tax legislation was signed into law in connection with the approval of the New York State 2014-2015 budget. The new legislation went into effect on January 1, 2015. Portions of the new legislation will result in significant changes in the method of calculation of income taxes for banks and thrifts operating in New York State, including changes to (1) future period tax rates and (2) rules related to the sourcing of revenue. At this time, we expect the changes to the New York tax code will cause our effective tax rate to increase. The amount of such increase will depend on the amount of revenues that are sourced to New York State under the new legislation, which can be expected to fluctuate over time. The changes in the tax code had an immaterial effect on the carrying value of the Company’s net deferred tax asset at March 31, 2014 (the date the legislation was signed into law).
14. Fair Value Measurements and Disclosures
a) Fair Value Measurements
We use fair value measurements to record fair value adjustments to certain assets and to determine fair value disclosures. We did not have any liabilities that were measured at fair value at December 31, 2014 and 2013. Our securities available-for-sale are recorded at fair value on a recurring basis. Additionally, from time to time, we may be required to record at fair value other assets or liabilities on a non-recurring basis, such as foreclosed real estate owned, certain impaired loans and goodwill. These non-recurring fair value adjustments generally involve the write-down of individual assets due to impairment losses.
In accordance with ASC Topic 820, Fair Value Measurements and Disclosures, we group our assets at fair value in three levels, based on the markets in which the assets are traded and the reliability of the assumptions used to determine fair value. These levels are:
| • | Level 1 – Valuation is based upon quoted prices for identical instruments traded in active markets. |
160
Table of Contents
Notes to Consolidated Financial Statements
| • | Level 2 – Valuation is based upon quoted prices for similar instruments in active markets, quoted prices for identical or similar instruments in markets that are not active and model-based valuation techniques for which all significant assumptions are observable in the market. |
| • | Level 3 – Valuation is generated from model-based techniques that use significant assumptions not observable in the market. These unobservable assumptions reflect our own estimates of assumptions that market participants would use in pricing the asset or liability. Valuation techniques include the use of option pricing models, discounted cash flow models and similar techniques. The results cannot be determined with precision and may not be realized in an actual sale or immediate settlement of the asset or liability. |
We base our fair values on the price that would be received to sell an asset in an orderly transaction between market participants at the measurement date. ASC Topic 820 requires us to maximize the use of observable inputs and minimize the use of unobservable inputs when measuring fair value.
Assets that we measure on a recurring basis are limited to our available-for-sale securities portfolio. Our available-for-sale portfolio is carried at estimated fair value with any unrealized gains and losses, net of taxes, reported as accumulated other comprehensive income or loss in shareholders’ equity. Substantially all of our available-for-sale portfolio consists of mortgage-backed securities and investment securities issued by GSEs. The fair values for substantially all of these securities are obtained monthly from an independent nationally recognized pricing service. On a monthly basis, we assess the reasonableness of the fair values obtained by reference to a second independent nationally recognized pricing service. Based on the nature of our securities, our independent pricing service provides us with prices which are categorized as Level 2 since quoted prices in active markets for identical assets are generally not available for the majority of securities in our portfolio. Various modeling techniques are used to determine pricing for our mortgage-backed securities, including option pricing and discounted cash flow models. The inputs to these models include benchmark yields, reported trades, broker/dealer quotes, issuer spreads, two-sided markets, benchmark securities, bids, offers and reference data. On an annual basis, we obtain the models, inputs and assumptions utilized by our pricing service and review them for reasonableness. We also own equity securities with a carrying value of $17.4 million and $7.1 million at December 31, 2014 and 2013, respectively, for which fair values are obtained from quoted market prices in active markets and, as such, are classified as Level 1.
The following table provides the level of valuation assumptions used to determine the carrying value of our assets measured at fair value on a recurring basis at December 31, 2014 and 2013.
| Fair Value at December 31, 2014 using | ||||||||||||||||
| Description |
Carrying Value |
Quoted Prices in Active Markets for Identical Assets (Level 1) |
Significant Other Observable Inputs (Level 2) |
Significant Unobservable Inputs (Level 3) |
||||||||||||
| (In thousands) | ||||||||||||||||
| Available for sale debt securities: |
||||||||||||||||
| Mortgage-backed securities |
$ | 2,963,304 | $ | — | $ | 2,963,304 | $ | — | ||||||||
| U.S. government-sponsored enterprises debt |
3,593,649 | — | 3,593,649 | — | ||||||||||||
|
|
|
|
|
|
|
|
|
|||||||||
| Total available for sale debt securities |
$ | 6,556,953 | $ | — | $ | 6,556,953 | $ | — | ||||||||
|
|
|
|
|
|
|
|
|
|||||||||
| Available for sale equity securities: |
||||||||||||||||
| Financial services industry |
$ | 17,396 | $ | 17,396 | $ | — | $ | — | ||||||||
|
|
|
|
|
|
|
|
|
|||||||||
| Total available for sale equity securities |
17,396 | 17,396 | — | — | ||||||||||||
|
|
|
|
|
|
|
|
|
|||||||||
| Total available for sale securities |
$ | 6,574,349 | $ | 17,396 | $ | 6,556,953 | $ | — | ||||||||
|
|
|
|
|
|
|
|
|
|||||||||
161
Table of Contents
Notes to Consolidated Financial Statements
| Fair Value at December 31, 2013 using | ||||||||||||||||
| Description |
Carrying Value |
Quoted Prices in Active Markets for Identical Assets (Level 1) |
Significant Other Observable Inputs (Level 2) |
Significant Unobservable Inputs (Level 3) |
||||||||||||
| (In thousands) | ||||||||||||||||
| Available for sale debt securities: |
||||||||||||||||
| Mortgage-backed securities |
$ | 7,167,555 | $ | — | $ | 7,167,555 | $ | — | ||||||||
| U.S. government-sponsored enterprises debt |
290,194 | — | 290,194 | — | ||||||||||||
|
|
|
|
|
|
|
|
|
|||||||||
| Total available for sale debt securities |
$ | 7,457,749 | $ | — | $ | 7,457,749 | $ | — | ||||||||
|
|
|
|
|
|
|
|
|
|||||||||
| Available for sale equity securities: |
||||||||||||||||
| Financial services industry |
$ | 7,089 | $ | 7,089 | $ | — | $ | — | ||||||||
|
|
|
|
|
|
|
|
|
|||||||||
| Total available for sale equity securities |
7,089 | 7,089 | — | — | ||||||||||||
|
|
|
|
|
|
|
|
|
|||||||||
| Total available for sale securities |
$ | 7,464,838 | $ | 7,089 | $ | 7,457,749 | $ | — | ||||||||
|
|
|
|
|
|
|
|
|
|||||||||
Assets that were measured at fair value on a non-recurring basis at December 31, 2014 and 2013 were limited to non-performing commercial and construction loans that are collateral dependent, troubled debt restructurings and foreclosed real estate. Loans evaluated for impairment in accordance with FASB guidance amounted to $332.8 million and $324.2 million at December 31, 2014 and 2013, respectively. Based on this evaluation, we established an ALL of $469,000 and $590,000 for those same respective periods. These impaired loans are individually assessed to determine that the loan’s carrying value is not in excess of the fair value of the collateral, less estimated selling costs or the present value of the loan’s expected future cash flows. Impaired loans for which the carrying value exceeded the fair value and which are recorded at fair value at December 31, 2014 and 2013 amounted to $156.2 million and $138.2 million, respectively. For impaired loans that are collateral dependent, fair value is estimated through current appraisals, where practical, or an inspection and a comparison of the property securing the loan with similar properties in the area by either a licensed appraiser or real estate broker and, as such, are classified as Level 3.
Foreclosed real estate represents real estate acquired as a result of foreclosure or by deed in lieu of foreclosure and is carried at the lower of cost or fair value less estimated selling costs. Fair value is estimated through current appraisals, where practical, or an inspection and a comparison of the property securing the loan with similar properties in the area by either a licensed appraiser or real estate broker and, as such, foreclosed real estate properties are classified as Level 3. Foreclosed real estate consisted of one-to four-family properties at December 31, 2014 and 2013 and amounted to $80.0 million and $70.4 million, respectively. Foreclosed real estate for which the carrying value exceeded fair value and which are recorded at fair value at December 31, 2014 and 2013 amounted to $22.1 million and $16.9 million, respectively.
162
Table of Contents
Notes to Consolidated Financial Statements
The following table provides the level of valuation assumptions used to determine the carrying value, included in the Consolidated Statements of Financial Condition, of our assets measured at fair value on a non-recurring basis at December 31, 2014 and December 31, 2013.
| Fair Value Measurements at December 31, 2014 using | ||||||||||||||||
| Description |
Quoted Prices in Active Markets for Identical Assets (Level 1) |
Significant Other Observable Inputs (Level 2) |
Significant Unobservable Inputs (Level 3) |
Total Gains (Losses) |
||||||||||||
| (In thousands) | ||||||||||||||||
| Impaired loans |
$ | — | $ | — | $ | 156,194 | $ | (6,415 | ) | |||||||
| Foreclosed real estate |
— | — | 22,116 | (5,770 | ) | |||||||||||
| Fair Value Measurements at December 31, 2013 using | ||||||||||||||||
| Description |
Quoted Prices in Active Markets for Identical Assets (Level 1) |
Significant Other Observable Inputs (Level 2) |
Significant Unobservable Inputs (Level 3) |
Total Gains (Losses) |
||||||||||||
| (In thousands) | ||||||||||||||||
| Impaired loans |
$ | — | $ | — | $ | 138,171 | $ | (3,100 | ) | |||||||
| Foreclosed real estate |
— | — | 16,867 | (5,370 | ) | |||||||||||
The following table presents quantitative information about Level 3 fair value measurements for financial instruments measured at fair value on a non-recurring basis at December 31, 2014.
| Description |
Fair Value |
Valuation Technique | Significant Unobservable Input |
Range (Weighted Average) | ||||
| (In thousands) | ||||||||
| Impaired loans |
$156,194 | Net Present Value | Discount rate | Varies | ||||
| Appraisal Value | Discount for costs to sell | 13.0% | ||||||
| Adjustment for differences between comparable sales. | Varies | |||||||
| Foreclosed real estate |
22,116 | Appraisal Value | Discount for costs to sell | 13.0% | ||||
| Adjustment for differences between comparable sales. |
Varies | |||||||
b) Fair Value Disclosures
The fair value of financial instruments represents the estimated amounts at which the asset or liability could be exchanged in a current transaction between willing parties, other than in a forced liquidation sale. These estimates are subjective in nature, involve uncertainties and matters of judgment and, therefore, cannot be determined with precision. Changes in assumptions could significantly affect the estimates. Further, certain tax implications related to the realization of the unrealized gains and losses could have a substantial impact on these fair value estimates and have not been incorporated into any of the estimates.
Cash and due from Banks
Carrying amounts of cash, due from banks and federal funds sold are considered to approximate fair value (Level 1).
163
Table of Contents
Notes to Consolidated Financial Statements
Securities held to maturity
The fair values for our securities held to maturity are obtained from an independent nationally recognized pricing service utilizing similar modeling techniques and assumptions as used for our securities available-for-sale which are measured at fair value on a recurring basis (Level 2).
FHLB Stock
The carrying value of FHLB stock equals cost. The fair value of FHLB stock is based on redemption at par value (Level 1).
Loans
The fair value of one- to four-family mortgages and home equity loans are generally estimated using the present value of expected future cash flows, assuming future prepayments and using market rates for new loans with comparable credit risk. Published pricing in the secondary and securitization markets was also utilized to assist in the fair value of the loan portfolio (Level 3). The valuation of our loan portfolio is consistent with accounting guidance but does not fully incorporate the exit price approach.
Deposits
For deposit liabilities payable on demand, the fair value is the carrying value at the reporting date (Level 1). For time deposits the fair value is estimated by discounting estimated future cash flows using currently offered rates (Level 2).
Borrowed Funds
The fair value of fixed-maturity borrowed funds is estimated by discounting estimated future cash flows using currently offered rates (Level 2). Structured borrowed funds are valued using an option valuation model which uses assumptions for anticipated calls of borrowings based on market interest rates and weighted-average life (Level 2).
Off-balance Sheet Financial Instruments
There is no material difference between the fair value and the carrying amounts recognized with respect to our off-balance sheet loan commitments (Level 3). The fair value of our loan commitments is immaterial to our financial condition.
Other important elements that are not deemed to be financial assets or liabilities and, therefore, not considered in these estimates include the value of Hudson City’s retail branch delivery system, its existing core deposit base and banking premises and equipment.
164
Table of Contents
Notes to Consolidated Financial Statements
The estimated fair value of Hudson City’s financial instruments is summarized as follows at December 31:
| Carrying | Estimated | Carrying | Estimated | |||||||||||||
| Amount | Fair Value | Amount | Fair Value | |||||||||||||
| (In thousands) | ||||||||||||||||
| Assets: | ||||||||||||||||
| Cash and due from banks |
$ | 122,484 | $ | 122,484 | $ | 133,665 | $ | 133,665 | ||||||||
| Federal funds sold and other overnight deposits |
6,163,082 | 6,163,082 | 4,190,809 | 4,190,809 | ||||||||||||
| Investment securities held to maturity |
39,011 | 41,593 | 39,011 | 42,727 | ||||||||||||
| Investment securities available for sale |
3,611,045 | 3,611,045 | 297,283 | 297,283 | ||||||||||||
| Federal Home Loan Bank of New York stock |
320,753 | 320,753 | 347,102 | 347,102 | ||||||||||||
| Mortgage-backed securities held to maturity |
1,272,137 | 1,356,160 | 1,784,464 | 1,888,823 | ||||||||||||
| Mortgage-backed securities available for sale |
2,963,304 | 2,963,304 | 7,167,555 | 7,167,555 | ||||||||||||
| Loans |
21,428,812 | 22,641,662 | 23,942,212 | 25,245,987 | ||||||||||||
| Liabilities: | ||||||||||||||||
| Deposits |
19,376,544 | 19,437,546 | 21,472,329 | 21,590,537 | ||||||||||||
| Borrowed funds |
12,175,000 | 13,525,813 | 12,175,000 | 13,621,332 | ||||||||||||
15. Regulatory Matters
Hudson City Savings is subject to comprehensive regulation, supervision and periodic examination by the OCC. Deposits at Hudson City Savings are insured up to the standard limits of coverage provided by the Deposit Insurance Fund (“DIF”) of the FDIC.
On March 30, 2012, the Bank entered into the Bank MOU with the OCC. The Company also entered into the Company MOU with the FRB on April 24, 2012. On February 26, 2015, the OCC terminated the Bank MOU. See Note 1 to the consolidated financial statements for a description of these regulatory agreements.
OCC regulations require federally chartered savings banks, such as Hudson City Savings, to maintain minimum capital ratios. At December 31, 2014, Hudson City Savings was in compliance with all applicable capital requirements.
The following table sets forth information regarding Hudson City Savings’ actual capital amounts and ratios and the regulatory capital requirements applicable to Hudson City Savings at the dates indicted:
| OCC Requirements | ||||||||||||||||||||||||
| Minimum Capital | For Classification as | |||||||||||||||||||||||
| Bank Actual | Adequacy | Well-Capitalized | ||||||||||||||||||||||
| Amount | Ratio | Amount | Ratio | Amount | Ratio | |||||||||||||||||||
| (Dollars in thousands) | ||||||||||||||||||||||||
| December 31, 2014 |
||||||||||||||||||||||||
| Tangible capital |
$ | 4,262,696 | 11.74 | % | $ | 544,721 | 1.50 | % | n/a | n/a | ||||||||||||||
| Leverage (core) capital |
4,262,696 | 11.74 | 1,452,590 | 4.00 | $ | 1,815,737 | 5.00 | % | ||||||||||||||||
| Total-risk-based capital |
4,457,171 | 28.75 | 1,240,172 | 8.00 | 1,550,215 | 10.00 | ||||||||||||||||||
| December 31, 2013 |
||||||||||||||||||||||||
| Tangible capital |
$ | 4,145,444 | 10.82 | % | $ | 574,791 | 1.50 | % | n/a | n/a | ||||||||||||||
| Leverage (core) capital |
4,145,444 | 10.82 | 1,532,777 | 4.00 | $ | 1,915,971 | 5.00 | % | ||||||||||||||||
| Total-risk-based capital |
4,361,710 | 25.31 | 1,378,687 | 8.00 | 1,723,359 | 10.00 | ||||||||||||||||||
165
Table of Contents
Notes to Consolidated Financial Statements
The OCC may take certain supervisory actions under the prompt corrective action regulations of the Federal Deposit Insurance Corporation Improvement Act with respect to an undercapitalized institution. Such actions could have a direct material effect on the institution’s financial statements. The regulations establish a framework for the classification of savings institutions into five categories: well-capitalized, adequately-capitalized, undercapitalized, significantly undercapitalized, and critically undercapitalized. On or prior to December 31, 2014, under the OCC regulations, generally, a federally chartered savings bank is treated as well capitalized if its total risk-based capital ratio is 10.0% or greater and its Tier 1 risk-based capital ratio is 6.0% or greater, and its leverage ratio is 5.0% or greater, and it is not subject to any order or directive by the OCC to meet a specific capital level. As of December 31, 2014, Hudson City Savings met the applicable requirements to be considered “well capitalized”.
The foregoing capital ratios are based in part on specific quantitative measures of assets, liabilities and certain off-balance sheet items as calculated under regulatory accounting practices. Capital amounts and classifications are also subject to qualitative judgments by the OCC about capital components, risk-weightings and other factors.
Pursuant to the Reform Act, the Agencies issued rules that subject many savings and loan holding companies, including Hudson City Bancorp, to consolidated capital requirements. The rules also revise the quantity and quality of required minimum risk-based and leverage capital requirements applicable to Hudson City Bancorp and Hudson City Savings, consistent with the Reform Act and the Basel III capital standards. In doing so, the new capital rules add a new common equity Tier 1 risk-based capital ratio of 4.5% and increase the minimum Tier 1 risk-based capital ratio from 4.0% to 6.0%. The new capital rules also add a requirement to maintain a minimum capital conservation buffer, or Conservation Buffer, of 2.50% of risk-weighted assets, which will be phased in over a four year period from January 1, 2016 to January 1, 2019, to be applied to the new common equity Tier 1 risk-based capital ratio, the Tier 1 risk-based capital ratio and the total risk-based capital ratio. The rules impose restrictions on capital distributions and certain discretionary cash bonus payments if the minimum Conservation Buffer is not met. The rules also revise the calculation of risk-weighted assets to enhance their risk sensitivity and phase out trust preferred securities and cumulative perpetual preferred stock as Tier 1 capital.
Pursuant to the new minimum capital rules, to be well capitalized, an insured depository institution must maintain a total risk-based capital ratio of 10.0% or more, a Tier 1 capital ratio of 8.0% or more, a common equity Tier 1 capital ratio of 6.5% or more and a leverage ratio of 5.0% or more.
The new minimum regulatory capital ratios and changes to the calculation of risk-weighted assets became effective for Hudson City Bancorp and Hudson City Savings on January 1, 2015. The required minimum Conservation Buffer will be phased in incrementally, starting at 0.625% on January 1, 2016 and increasing to 1.25% on January 1, 2017, 1.875% on January 1, 2018 and 2.5% on January 1, 2019.
The OCC regulates all capital distributions by Hudson City Savings directly or indirectly to Hudson City Bancorp, including dividend payments. Hudson City Savings may not pay dividends to Hudson City Bancorp if, after paying those dividends, it would fail to meet the required minimum levels under risk-based capital guidelines and the minimum leverage and tangible capital ratio requirements. A subsidiary of a savings and loan holding company, such as Hudson City Savings, must file a notice or seek affirmative approval from the OCC at least 30 days prior to each proposed capital distribution. Whether an application is required is based on a number of factors including whether the institution qualifies for expedited treatment under the OCC rules and regulations or if the total amount of all capital distributions (including each proposed capital distribution) for the applicable calendar year exceeds net income for that year to date plus the retained net income for the preceding two years. Currently, Hudson City Savings must seek approval from the OCC for future capital distributions. In addition, as the subsidiary of a savings and loan holding company, Hudson City Savings must also receive approval from the FRB before declaring a dividend.
166
Table of Contents
Notes to Consolidated Financial Statements
Upon completion of the second-step conversion, Hudson City Bancorp established a “liquidation account” in an amount equal to the total equity of Hudson City Savings as of the latest practicable date prior to the second-step conversion. The liquidation account was established to provide a limited priority claim to the assets of Hudson City Savings to “eligible account holders” and “supplemental eligible account holders”, as defined in the plan of conversion and reorganization, who continue to maintain deposits in Hudson City Savings after the second-step conversion. In the unlikely event of a complete liquidation of Hudson City Savings at a time when Hudson City Savings has a positive net worth, and only in such event, each eligible account holder and supplemental eligible account holder would be entitled to receive a liquidation distribution, prior to any payment to the stockholders of Hudson City Bancorp. In the unlikely event of a complete liquidation of Hudson City Savings and Hudson City Bancorp does not have sufficient assets (other than the stock of Hudson City Savings) to fund the obligation under the liquidation account, Hudson City Savings will fund the remaining obligation as if Hudson City Savings had established the liquidation account rather than Hudson City Bancorp. Any assets remaining after the liquidation rights of eligible account holders and supplemental eligible account holders are satisfied would be distributed to Hudson City Bancorp as the sole stockholder of Hudson City Savings.
16. Commitments and Contingencies
Hudson City Savings is a party to commitments to extend credit in the normal course of business to meet the financial needs of its customers and commitments to purchase loans and mortgage-backed securities to meet our growth initiatives. Commitments to extend credit are agreements to lend money to a customer as long as there is no violation of any condition established in the contract.
Commitments to fund first mortgage loans generally have fixed expiration dates or other termination clauses, whereas home equity lines of credit have no expiration date. Since some commitments are expected to expire without being drawn upon, the total commitment amounts do not necessarily represent future cash requirements. Hudson City Savings evaluates each customer’s credit-worthiness on a case-by-case basis.
At December 31, 2014, Hudson City Savings had variable- and fixed-rate first mortgage loan commitments to extend credit of approximately $44.9 million and $7.4 million, respectively; commitments to purchase fixed-rate first mortgage loans of $140,000; and unused home equity, overdraft and commercial/construction lines of credit of approximately $175.7 million, $2.2 million, and $157,000, respectively. At December 31, 2013, Hudson City Savings had variable- and fixed-rate first mortgage loan commitments to extend credit of approximately $127.0 million and $36.3 million, respectively; commitments to purchase fixed-rate first mortgage loans of $140,000; and unused home equity, overdraft and commercial/construction lines of credit of approximately $151.9 million, $1.6 million, and $2.3 million, respectively. These commitment amounts are not included in the accompanying financial statements. There is no exposure to credit loss in the event the other party to commitments to extend credit does not exercise its rights to borrow under the commitment.
Except as described below, we are not involved in any pending legal proceedings other than routine legal proceedings occurring in the ordinary course of business. We believe that these routine legal proceedings, in the aggregate, are immaterial to our financial condition and results of operations.
Since the announcement of the Merger, eighteen putative class action complaints have been filed in the Court of Chancery, Delaware against Hudson City Bancorp, its directors, M&T, and WTC challenging the Merger. Six putative class actions challenging the Merger have also been filed in the Superior Court for Bergen County, Chancery Division, of New Jersey (the “New Jersey Court”). The lawsuits generally allege, among other things, that the Hudson City Bancorp directors breached their fiduciary duties to Hudson City Bancorp’s public shareholders by approving the Merger at an unfair price, that the Merger was the product of a flawed sales
167
Table of Contents
Notes to Consolidated Financial Statements
process, and that Hudson City Bancorp and M&T filed a misleading and incomplete Form S-4 with the SEC in connection with the proposed transaction. All 24 lawsuits seek, among other things, to enjoin completion of the Merger and an award of costs and attorneys’ fees. Certain of the actions also seek an accounting of damages sustained as a result of the alleged breaches of fiduciary duty and punitive damages.
On April 12, 2013, the defendants entered into a memorandum of understanding (the “MOU”) with the plaintiffs regarding the settlement of all of the actions described above (collectively, the “Actions”).
Under the terms of the MOU, Hudson City Bancorp, M&T, the other named defendants, and all the plaintiffs have reached an agreement in principle to settle the Actions and release the defendants from all claims relating to the Merger, subject to approval of the New Jersey Court. Pursuant to the MOU, Hudson City Bancorp and M&T agreed to make available additional information to Hudson City Bancorp shareholders. The additional information was contained in a Supplement to the Joint Proxy Statement filed with the SEC as an exhibit to a Current Report on Form 8-K dated April 12, 2013. In addition, under the terms of the MOU, plaintiffs’ counsel also has reserved the right to seek an award of attorneys’ fees and expenses. If the New Jersey Court approves the settlement contemplated by the MOU, the Actions will be dismissed with prejudice. The settlement will not affect the Merger consideration to be paid to Hudson City Bancorp’s shareholders in connection with the proposed Merger. In the event the New Jersey Court approves an award of attorneys’ fees and expenses in connection with the settlement, such fees and expenses shall be paid by Hudson City Bancorp, its successor in interest, or its insurers.
Hudson City Bancorp, M&T, and the other defendants deny all of the allegations in the Actions and believe the disclosures in the Joint Proxy Statement are adequate under the law. Nevertheless, Hudson City Bancorp, M&T, and the other defendants have agreed to settle the Actions in order to avoid the costs, disruption, and distraction of further litigation.
17. Parent Company Only Financial Statements
Set forth below are the condensed financial statements for Hudson City Bancorp, Inc.:
Statements of Financial Condition
| December 31, 2014 | December 31, 2013 | |||||||
| (In thousands) | ||||||||
| Assets: |
||||||||
| Cash and due from subsidiary bank |
$ | 133,727 | $ | 134,040 | ||||
| Investment in subsidiary |
4,426,376 | 4,386,310 | ||||||
| ESOP loan receivable |
217,671 | 220,791 | ||||||
| Other assets |
3,636 | 1,435 | ||||||
|
|
|
|
|
|||||
| Total Assets |
$ | 4,781,410 | $ | 4,742,576 | ||||
|
|
|
|
|
|||||
| Shareholders’ Equity: |
||||||||
| Total shareholders’ equity |
4,781,410 | 4,742,576 | ||||||
|
|
|
|
|
|||||
| Total Liabilities and Shareholders’ Equity |
$ | 4,781,410 | $ | 4,742,576 | ||||
|
|
|
|
|
|||||
168
Table of Contents
Notes to Consolidated Financial Statements
Statements of Operations
| Year Ended December 31, | ||||||||||||
| 2014 | 2013 | 2012 | ||||||||||
| (In thousands) | ||||||||||||
| Income: |
||||||||||||
| Dividends received from subsidiary |
$ | 80,000 | $ | 100,000 | $ | 160,000 | ||||||
| Interest on ESOP loan receivable |
11,040 | 11,188 | 11,329 | |||||||||
| Interest on deposit with subsidiary |
202 | 251 | 352 | |||||||||
|
|
|
|
|
|
|
|||||||
| Total income |
91,242 | 111,439 | 171,681 | |||||||||
| Expenses |
1,343 | 3,088 | 7,279 | |||||||||
|
|
|
|
|
|
|
|||||||
| Income before income tax expense and equity in undistributed net income of subsidiary |
89,899 | 108,351 | 164,402 | |||||||||
| Income tax expense |
3,696 | 3,540 | 3,774 | |||||||||
|
|
|
|
|
|
|
|||||||
| Income before equity in undistributed net income of subsidiary |
86,203 | 104,811 | 160,628 | |||||||||
| Equity in undistributed net income of subsidiary |
71,762 | 80,405 | 88,515 | |||||||||
|
|
|
|
|
|
|
|||||||
| Net income |
$ | 157,965 | $ | 185,216 | $ | 249,143 | ||||||
|
|
|
|
|
|
|
|||||||
| Statements of Cash Flows | ||||||||||||
| Year Ended December 31, | ||||||||||||
| 2014 | 2013 | 2012 | ||||||||||
| (In thousands) | ||||||||||||
| Cash Flows from Operating Activities: |
||||||||||||
| Net income |
$ | 157,965 | $ | 185,216 | $ | 249,143 | ||||||
| Adjustments to reconcile net income to net cash provided by operating activities: |
||||||||||||
| Equity in undistributed net income |
(71,762 | ) | (80,405 | ) | (88,515 | ) | ||||||
| Increase in other assets |
(2,201 | ) | (1,435 | ) | — | |||||||
| (Decrease) increase in accrued expenses |
— | (4,061 | ) | 210 | ||||||||
|
|
|
|
|
|
|
|||||||
| Net Cash Provided by Operating Activities |
84,002 | 99,315 | 160,838 | |||||||||
|
|
|
|
|
|
|
|||||||
| Cash Flows from Investing Activities: |
||||||||||||
| Principal collected on ESOP loan |
3,120 | 2,972 | 2,830 | |||||||||
|
|
|
|
|
|
|
|||||||
| Net Cash Provided by Investing Activities |
3,120 | 2,972 | 2,830 | |||||||||
|
|
|
|
|
|
|
|||||||
| Cash Flows from Financing Activities: |
||||||||||||
| Purchases of treasury stock |
— | — | (427 | ) | ||||||||
| Purchases of vested stock awards surrendered for withholding taxes |
(2,960 | ) | — | — | ||||||||
| Exercise of stock options |
113 | 1,408 | 3,905 | |||||||||
| Cash dividends paid on unallocated ESOP shares and unvested deferred shared awards |
(4,383 | ) | (6,158 | ) | (10,161 | ) | ||||||
| Cash dividends paid |
(80,205 | ) | (99,511 | ) | (158,793 | ) | ||||||
|
|
|
|
|
|
|
|||||||
| Net Cash Used in Financing Activities |
(87,435 | ) | (104,261 | ) | (165,476 | ) | ||||||
|
|
|
|
|
|
|
|||||||
| Net Decrease in Cash Due from Bank |
(313 | ) | (1,974 | ) | (1,808 | ) | ||||||
| Cash Due from Bank at Beginning of Year |
134,040 | 136,014 | 137,822 | |||||||||
|
|
|
|
|
|
|
|||||||
| Cash Due from Bank at End of Year |
$ | 133,727 | $ | 134,040 | $ | 136,014 | ||||||
|
|
|
|
|
|
|
|||||||
169
Table of Contents
Notes to Consolidated Financial Statements
18. Selected Quarterly Financial Data (Unaudited)
The following tables are a summary of certain quarterly financial data for the years ended December 31, 2014 and 2013.
| 2014 Quarter Ended | ||||||||||||||||
| March 31 | June 30 | September 30 | December 31 | |||||||||||||
| (In thousands, except per share data) | ||||||||||||||||
| Interest and dividend income |
$ | 312,539 | $ | 299,205 | $ | 287,620 | $ | 268,352 | ||||||||
| Interest expense |
180,203 | 181,523 | 182,682 | 181,171 | ||||||||||||
|
|
|
|
|
|
|
|
|
|||||||||
| Net interest income |
132,336 | 117,682 | 104,938 | 87,181 | ||||||||||||
| Provision for loan losses |
— | — | (3,500 | ) | — | |||||||||||
|
|
|
|
|
|
|
|
|
|||||||||
| Net interest income after provision for loan losses |
132,336 | 117,682 | 108,438 | 87,181 | ||||||||||||
| Non-interest income |
17,758 | 21,184 | 23,938 | 47,505 | ||||||||||||
| Non-interest expense |
79,713 | 73,108 | 70,045 | 70,163 | ||||||||||||
|
|
|
|
|
|
|
|
|
|||||||||
| Income before income tax expense |
70,381 | 65,758 | 62,331 | 64,523 | ||||||||||||
| Income tax expense |
27,860 | 26,576 | 25,205 | 25,387 | ||||||||||||
|
|
|
|
|
|
|
|
|
|||||||||
| Net Income |
$ | 42,521 | $ | 39,182 | $ | 37,126 | $ | 39,136 | ||||||||
|
|
|
|
|
|
|
|
|
|||||||||
| Basic earnings per share |
$ | 0.09 | $ | 0.08 | $ | 0.07 | $ | 0.08 | ||||||||
|
|
|
|
|
|
|
|
|
|||||||||
| Diluted earnings per share |
$ | 0.09 | $ | 0.08 | $ | 0.07 | $ | 0.08 | ||||||||
|
|
|
|
|
|
|
|
|
|||||||||
| 2013 Quarter Ended | ||||||||||||||||
| March 31 | June 30 | September 30 | December 31 | |||||||||||||
| (In thousands, except per share data) | ||||||||||||||||
| Interest and dividend income |
$ | 366,065 | $ | 347,509 | $ | 326,298 | $ | 321,309 | ||||||||
| Interest expense |
188,682 | 187,656 | 186,885 | 185,445 | ||||||||||||
|
|
|
|
|
|
|
|
|
|||||||||
| Net interest income |
177,383 | 159,853 | 139,413 | 135,864 | ||||||||||||
| Provision for loan losses |
20,000 | 12,500 | 4,000 | — | ||||||||||||
|
|
|
|
|
|
|
|
|
|||||||||
| Net interest income after provision for loan losses |
157,383 | 147,353 | 135,413 | 135,864 | ||||||||||||
| Non-interest income |
2,533 | 9,588 | 13,456 | 13,512 | ||||||||||||
| Non-interest expense |
81,255 | 76,621 | 78,488 | 73,473 | ||||||||||||
|
|
|
|
|
|
|
|
|
|||||||||
| Income before income tax expense |
78,661 | 80,320 | 70,381 | 75,903 | ||||||||||||
| Income tax expense |
30,730 | 31,598 | 27,647 | 30,074 | ||||||||||||
|
|
|
|
|
|
|
|
|
|||||||||
| Net income |
$ | 47,931 | $ | 48,722 | $ | 42,734 | $ | 45,829 | ||||||||
|
|
|
|
|
|
|
|
|
|||||||||
| Basic earnings per share |
$ | 0.10 | $ | 0.10 | $ | 0.09 | $ | 0.09 | ||||||||
|
|
|
|
|
|
|
|
|
|||||||||
| Diluted earnings per share |
$ | 0.10 | $ | 0.10 | $ | 0.09 | $ | 0.09 | ||||||||
|
|
|
|
|
|
|
|
|
|||||||||
170
Table of Contents
Notes to Consolidated Financial Statements
19. Earnings Per Share
The following is a reconciliation of the numerators and denominators of the basic and diluted earnings per share computations.
| For the Year Ended December 31, | ||||||||||||
| 2014 | 2013 | 2012 | ||||||||||
| (In thousands, except per share data) | ||||||||||||
| Net income |
$ | 157,965 | $ | 185,216 | $ | 249,143 | ||||||
| Less: Income allocated to participating securities |
(390 | ) | — | — | ||||||||
|
|
|
|
|
|
|
|||||||
| Net income available to common shareholders |
$ | 157,575 | $ | 185,216 | $ | 249,143 | ||||||
|
|
|
|
|
|
|
|||||||
| Basic weighted average common shares outstanding |
499,005,091 | 497,793,895 | 496,570,311 | |||||||||
| Effect of dilutive common stock equivalents |
1,148,274 | 276,902 | 34,498 | |||||||||
|
|
|
|
|
|
|
|||||||
| Diluted weighted average common shares outstanding |
500,153,365 | 498,070,797 | 496,604,809 | |||||||||
|
|
|
|
|
|
|
|||||||
| Basic EPS |
$ | 0.32 | $ | 0.37 | $ | 0.50 | ||||||
| Diluted EPS |
$ | 0.32 | $ | 0.37 | $ | 0.50 | ||||||
Common stock equivalents exclude options to purchase 22,359,456 shares, 25,351,142 shares and 24,036,905 shares of the Company’s common stock which were outstanding for the years ended December 31, 2014, 2013 and 2012, respectively, as their inclusion would be anti-dilutive.
20. Recent Accounting Pronouncements
In June 2014, the FASB issued ASU 2014-12, “Stock Compensation – Accounting for Share-Based Payments When the Terms of an Award Provide that a Performance Target Could Be Achieved after the Requisite Service Period”. The amendment applies to reporting entities that grant their employees share-based payments in which the terms of the award provide that a performance target can be achieved after the requisite service period. A reporting entity should apply existing guidance in ASC Topic 718 as it relates to awards with performance conditions that affect vesting to account for such awards. As such, the performance target should not be reflected in estimating the grant-date fair value of the award. Compensation cost should be recognized in the period in which it becomes probable that the performance target will be achieved and should represent the compensation cost attributable to the period(s) for which the requisite service has already been rendered. If the performance target becomes probable of being achieved before the end of the requisite service period, the remaining unrecognized compensation cost should be recognized prospectively over the remaining requisite service period. The total amount of compensation cost recognized during and after the requisite service period should reflect the number of awards that are expected to vest and should be adjusted to reflect those awards that ultimately vest. The requisite service period ends when the employee can cease rendering service and still be eligible to vest in the award if the performance target is achieved. As indicated in the definition of vest, the stated vesting period (which includes the period in which the performance target could be achieved) may differ from the requisite service period. The amendments in ASU 2014-12 are effective for public business entities for fiscal years, and interim periods within those fiscal years, beginning after December 15, 2014. Early adoption is permitted. This guidance is not expected to have a material impact on our financial condition or results of operations.
171
Table of Contents
Notes to Consolidated Financial Statements
In June 2014, the FASB issued ASU 2014-11, “Transfers and Servicing – Repurchase-to-Maturity Transactions, Repurchase Financings, and Disclosures”. The amendments in this Update require that repurchase-to-maturity transactions be accounted for as secured borrowings consistent with the accounting for other repurchase agreements. In addition, the amendments require separate accounting for a transfer of a financial asset executed contemporaneously with a repurchase agreement with the same counterparty (a repurchase financing), which will result in secured borrowing accounting for the repurchase agreement. The amendments require an entity to disclose information about transfers accounted for as sales in transactions that are economically similar to repurchase agreements, in which the transferor retains substantially all of the exposure to the economic return on the transferred financial asset throughout the term of the transaction. In addition the amendments require disclosure of the types of collateral pledged in repurchase agreements, securities lending transactions, and repurchase-to-maturity transactions and the tenor of those transactions. The amendments in ASU 2014-11 are effective for public business entities for fiscal years, and interim periods within those fiscal years, beginning after December 15, 2014, and the disclosure for repurchase agreements, securities lending transactions, and repurchase-to-maturity transactions accounted for as secured borrowings is required to be presented for annual periods beginning after December 15, 2014, and for interim periods beginning after March 15, 2015. This guidance is not expected to have a material impact on our financial condition or results of operations.
In January 2014, the FASB issued ASU 2014-04, “Receivables – Troubled Debt Restructurings by Creditors (Subtopic 310-40) Reclassification of Residential Real Estate Collateralized Consumer Mortgage Loans upon Foreclosure,” and in August 2014 the FASB issued ASU 2014-14, “Receivables—Troubled Debt Restructurings by Creditors (Subtopic 310-40)—Classification of Certain Government-Guaranteed Mortgage Loans upon Foreclosure.” ASU 2014-04 applies to all creditors who obtain physical possession of residential real estate property collateralizing a consumer mortgage loan in satisfaction of a receivable. The amendments in ASU 2014-04 clarify when an in substance repossession or foreclosure occurs and requires disclosure of both (1) the amount of foreclosed residential real estate property held by a creditor and (2) the recorded investment in consumer mortgage loans collateralized by residential real estate property that are in the process of foreclosure according to local requirements of the applicable jurisdiction. ASU 2014-14 applies to creditors that hold government-guaranteed mortgage loans. The amendments in ASU 2014-14 require that a mortgage loan be derecognized and that a separate other receivable be recognized upon foreclosure if (1) the loan has a government guarantee that is not separable from the loan before foreclosure, (2) at the time of foreclosure, the creditor has the intent to convey the real estate property to the guarantor and make a claim on the guarantee, and the creditor has the ability to recover under that claim and (3) at the time of foreclosure, any amount of the claim that is determined on the basis of the fair value of the real estate is fixed. The amendments in ASU 2014-04 went into effect for public business entities for fiscal years, and interim periods within those fiscal years, beginning after December 15, 2014. Early adoption was permitted and entities could elect to adopt a modified retrospective transition method or a prospective transition method. This guidance is not expected to have a material impact on our financial condition or results of operations.
172
Table of Contents
Item 9. Changes in and Disagreements with Accountants on Accounting and Financial Disclosure
None.
Item 9A. Controls and Procedures
Evaluation of Disclosure Controls and Procedures
Denis J. Salamone, our Chairman and Chief Executive Officer and James C. Kranz, our Executive Vice President and Chief Financial Officer, conducted an evaluation of the effectiveness of our disclosure controls and procedures (as defined in Rule 13a-15(e) and 15d-15(e) under the Securities Exchange Act of 1934, as amended (the “Exchange Act”)) as of December 31, 2014. Based upon their evaluation, they each found that our disclosure controls and procedures were effective to ensure that information required to be disclosed in the reports that we file and submit under the Exchange Act is recorded, processed, summarized and reported as and when required and that such information is accumulated and communicated to our management as appropriate to allow timely decisions regarding required disclosures.
Changes in Internal Control Over Financial Reporting
There were no changes in our internal control over financial reporting that occurred during the fourth quarter of 2014 that have materially affected, or are reasonably likely to materially affect, our internal control over financial reporting.
Management Report on Internal Control Over Financial Reporting
The management of Hudson City Bancorp is responsible for establishing and maintaining adequate internal control over financial reporting. Hudson City’s internal control system is a process designed to provide reasonable assurance to the Company’s management and board of directors regarding the preparation and fair presentation of published financial statements.
Our internal control over financial reporting includes policies and procedures that pertain to the maintenance of records that, in reasonable detail, accurately and fairly reflect transactions and dispositions of assets; provide reasonable assurances that transactions are recorded as necessary to permit preparation of financial statements in accordance with U.S. generally accepted accounting principles, and that receipts and expenditures are being made only in accordance with authorizations of management and the directors of Hudson City; and provide reasonable assurance regarding prevention or timely detection of unauthorized acquisition, use or disposition of Hudson City’s assets that could have a material effect on our financial statements.
All internal control systems, no matter how well designed, have inherent limitations. Therefore, even those systems determined to be effective can provide only reasonable assurance with respect to financial statement preparation and presentation. Also, projections of any evaluation of effectiveness to future periods are subject to the risk that controls may become inadequate because of changes in conditions, or that the degree of compliance with the policies or procedures may deteriorate.
Hudson City’s management assessed the effectiveness of the company’s internal control over financial reporting as of December 31, 2014. In making this assessment, we used the criteria set forth by the Committee of Sponsoring Organizations of the Treadway Commission in Internal Control-Integrated Framework (1992). Based on our assessment we believe that, as of December 31, 2014, the Company’s internal control over financial reporting is effective based on those criteria and we identified no material weakness requiring corrective action with respect to those controls.
173
Table of Contents
Hudson City’s independent registered public accounting firm that audited the consolidated financial statements has issued an audit report on the effectiveness of the Company’s internal control over financial reporting as of December 31, 2014. This report appears on page 115.
None.
Item 10. Directors, Executive Officers and Corporate Governance
Information regarding directors, executive officers and the corporate governance of the Company is presented under the headings “Proposal 1—Election of Directors -General,” “-Who Our Directors Are,” “-Nominees for Election as Directors,” “-Continuing Directors,” “-Executive Officers,” “-Section 16(a) Beneficial Ownership Reporting Compliance,” and “Corporate Governance” in the Company’s definitive Proxy Statement for the 2015 Annual Meeting of Shareholders or will be included in an amendment or amendments to this Form 10-K and is incorporated herein by reference.
Audit Committee Financial Expert
Information regarding the audit committee of the Company’s Board of Directors, including information regarding the audit committee financial expert serving on the audit committee, is presented under the heading “Corporate Governance – Meetings of the Board of Directors and its Committees” in the Company’s definitive Proxy Statement for the 2015 Annual Meeting of Shareholders or will be included in an amendment or amendments to this Form 10-K and is incorporated herein by reference.
Code of Ethics
We have adopted a written code of ethics that applies to our principal executive officer and senior financial officers, which is available on our website at www.hcbk.com, and will be provided free of charge by contacting Susan Munhall, Investor Relations, at (201) 967-8290.
Item 11. Executive Compensation
Information regarding executive compensation is presented under the headings “Compensation Discussion and Analysis ,” “-Compensation of Executive Officers and Directors-,” “Corporate Governance – Compensation Committee Interlocks and Insider Participation” and “-Compensation Committee Report” in the Company’s definitive Proxy Statement for the 2015 Annual Meeting of Shareholders or will be included in an amendment or amendments to this Form 10-K and is incorporated herein by reference.
Item 12. Security Ownership of Certain Beneficial Owners and Management and Related Stockholder Matters
Information regarding security ownership of certain beneficial owners and management is presented under the heading “Security Ownership of Certain Beneficial Owners and Management” in the Company’s definitive Proxy Statement for the 2015 Annual Meeting of Shareholders and is incorporated herein by reference. Information regarding equity compensation plans is presented under the heading “Compensation of Executive Officers and Directors – Compensation Plans” in the Company’s definitive Proxy Statement for the 2015 Annual Meeting of Shareholders or will be included in an amendment or amendments to this Form 10-K and is incorporated herein by reference.
174
Table of Contents
Item 13. Certain Relationships and Related Transactions, and Director Independence
Information regarding certain relationships and related transactions, and director independence is presented under the heading “Certain Transactions with Members of our Board of Directors and Executive Officers” and “Corporate Governance” in the Company’s definitive Proxy Statement for the 2015 Annual Meeting of Shareholders or will be included in an amendment or amendments to this Form 10-K and is incorporated herein by reference.
Item 14. Principal Accounting Fees and Services
Information regarding principal accounting fees and services is presented under the heading “Proposal 2 – Ratification of Appointment of Independent Registered Public Accounting Firm” in Hudson City Bancorp’s definitive Proxy Statement for the 2015 Annual Meeting of Shareholders or will be included in an amendment or amendments to this Form 10-K and is incorporated herein by reference.
Item 15. Exhibits, Financial Statement Schedules
| (a) | List of Documents Filed as Part of this Annual Report on Form 10-K |
| (1) | The following consolidated financial statements are in Item 8 of this annual report: |
| • | Reports of Independent Registered Public Accounting Firm |
| • | Consolidated Statements of Financial Condition as of December 31, 2014 and 2013 |
| • | Consolidated Statements of Income for the years ended December 31, 2014, 2013 and 2012 |
| • | Consolidated Statements of Comprehensive Income for the years Ended December 31, 2014, 2013 and 2012 |
| • | Consolidated Statements of Changes in Shareholders’ Equity for the years ended December 31, 2014, 2013 and 2012 |
| • | Consolidated Statements of Cash Flows for the years ended December 31, 2014, 2013 and 2012 |
| • | Notes to Consolidated Financial Statements |
| (2) | Financial Statement Schedules have been omitted because they are not applicable or the required information is shown in the Consolidated Financial Statements or Notes. |
| (b) | Exhibits Required by Item 601 of Regulation S-K |
| EXHIBIT |
DESCRIPTION | |
| 2.1 | Amended and Restated Plan of Conversion and Reorganization of Hudson City, MHC, Hudson City Bancorp, Inc. and Hudson City Savings Bank (1) | |
| 2.2 | Agreement and Plan of Merger by and between Hudson City Bancorp, Inc. and Sound Federal Bancorp, Inc. (2) | |
| 2.3 | Agreement and Plan of Merger by and among M&T Bank Corporation, Hudson City Bancorp, Inc. and Wilmington Trust Corporation (22) | |
| 2.4 | Amendment No. 1 to the Agreement and Plan of Merger by and among M&T Bank Corporation, Hudson City Bancorp, Inc. and Wilmington Trust Corporation (25) | |
175
Table of Contents
| 2.5 | Amendment No. 2 to the Agreement and Plan of Merger by and among M&T Bank Corporation, Hudson City Bancorp, Inc. and Wilmington Trust Corporation (26) | |
| 2.6 | Amendment No. 3 to the Agreement and Plan of Merger by and among M&T Bank Corporation, Hudson City Bancorp, Inc. and Wilmington Trust Corporation (29) | |
| 3.1 | Amended and Restated Certificate of Incorporation of Hudson City Bancorp, Inc. (15) | |
| 3.2 | Amended and Restated Bylaws of Hudson City Bancorp, Inc. (4) | |
| 4.1 | Certificate of Incorporation of Hudson City Bancorp, Inc. (See Exhibit 3.1) | |
| 4.2 | Amended and Restated Bylaws of Hudson City Bancorp, Inc. (See Exhibit 3.2) | |
| 4.3 | Form of Stock Certificate of Hudson City Bancorp, Inc. (3) | |
| 10.1 | Employee Stock Ownership Plan of Hudson City Savings Bank (Incorporating amendments No. 1,2,3,4,5, 6 and 7) (17) | |
| 10.2A | Profit Incentive Bonus Plan of Hudson City Savings Bank Adoption Agreement No. 1 (5) | |
| 10.2B | Profit Incentive Bonus Plan of Hudson City Savings Bank (5) | |
| 10.3 | Form of Amended and Restated Two-Year Change in Control Agreement by and among Hudson City Savings Bank and Hudson City Bancorp, Inc. and certain officers (together with Schedule pursuant to Instruction 2 of Item 601 of Regulation S-K) (13) | |
| 10.4 | Severance Pay Plan of Hudson City Savings Bank (3) | |
| 10.5 | Hudson City Savings Bank Outside Directors Consultation Plan (3) | |
| 10.6 | Hudson City Bancorp, Inc. 2000 Stock Option Plan (6) | |
| 10.8 | Hudson City Bancorp, Inc. Denis J. Salamone Stock Option Plan (7) | |
| 10.9 | Hudson City Bancorp, Inc. 2005 Employment Inducement Stock Program with Ronald E. Butkovich (8) | |
| 10.10 | Hudson City Bancorp, Inc. 2005 Employment Inducement Stock Program with Christopher Nettleton (8) | |
| 10.11 | Amended and Restated Employment Agreement between Hudson City Bancorp, Inc. and Denis J. Salamone (13) | |
| 10.12 | Amended and Restated Employment Agreement between Hudson City Savings Bank and Denis J. Salamone (13) | |
| 10.13 | Executive Officer Annual Incentive Plan of Hudson City Savings Bank (12) | |
| 10.14 | Amended and Restated Loan Agreement by and between Employee Stock Ownership Plan Trust of Hudson City Savings Bank and Hudson City Bancorp, Inc. (9) | |
| 10.15 | Amended and Restated Promissory Note between Employee Stock Ownership Plan Trust and Hudson City Bancorp, Inc. (9) | |
| 10.16 | Amended and Restated Pledge Agreement by and between Employee Stock Ownership Plan Trust of Hudson City Savings Bank and Hudson City Bancorp, Inc. (9) | |
| 10.17 | Form of Amended and Restated Assignment between Employee Stock Ownership Plan Trust and Hudson City Bancorp, Inc. (9) | |
| 10.18 | Loan Agreement by and between Employee Stock Ownership Plan Trust of Hudson City Savings Bank and Hudson City Bancorp, Inc. (9) | |
| 10.19 | Promissory Note between Employee Stock Ownership Plan Trust and Hudson City Bancorp, Inc. (9) | |
| 10.20 | Pledge Agreement by and between Employee Stock Ownership Plan Trust of Hudson City Savings Bank and Hudson City Bancorp, Inc. (9) | |
| 10.21 | Form of Assignment between Employee Stock Ownership Plan Trust and Hudson City Bancorp, Inc. (9) | |
| 10.22 | Hudson City Bancorp, Inc. 2006 Stock Incentive Plan (10) | |
| 10.23 | Form of Hudson City Bancorp, Inc. 2006 Stock Incentive Plan Performance Stock Option Agreement (11) | |
| 10.24 | Form of Hudson City Bancorp, Inc. 2006 Stock Incentive Plan Retention Stock Option Agreement (11) | |
| 10.25 | Form of Hudson City Bancorp, Inc. 2006 Stock Incentive Plan Director Stock Option Agreement (11) | |
| 10.26 | Amended Benefit Maintenance Plan of Hudson City Savings Bank* | |
| 10.27 | Summary of Material Terms of Directed Charitable Contribution Program (11) | |
| 10.28 | Summary of Director Compensation (20) | |
| 10.29 | Directors’ Deferred Compensation Plan of Hudson City Bancorp, Inc. (13) | |
| 10.30 | Officers’ Deferred Compensation Plan of Hudson City Bancorp, Inc. (13) | |
| 10.31 | Form of Hudson City Bancorp, Inc. 2006 Stock Incentive Plan Performance-Based Restricted Stock Award Notice (14) | |
| 10.32 | Form of Hudson City Bancorp, Inc. 2006 Stock Incentive Plan Performance Stock Option Agreement (5) | |
| 10.33 | Form of Hudson City Bancorp, Inc. 2006 Stock Incentive Plan Retention Stock Option Agreement (5) | |
| 10.34 | Form of Hudson City Bancorp, Inc. 2006 Stock Incentive Plan Director Stock Option Agreement (5) | |
176
Table of Contents
| 10.35 | Form of Hudson City Bancorp, Inc. 2006 Stock Incentive Plan Restricted Stock Award Notice (16) | |
| 10.36 | Form of Hudson City Bancorp, Inc. 2006 Stock Incentive Plan Deferred Stock Unit Award Notice (16) | |
| 10.37 | Form of Hudson City Bancorp, Inc. 2006 Stock Incentive Plan Deferred Stock Unit Award Notice Employees (18) | |
| 10.38 | Form of Hudson City Bancorp, Inc. 2006 Stock Incentive Plan Deferred Stock Unit Award Notice Non-employee Directors (18) | |
| 10.39 | Hudson City Bancorp, Inc. Amended & Restated 2011 Stock Incentive Plan (19) | |
| 10.40 | Form of Hudson City Bancorp, Inc. Amended and Restated 2011 Stock Incentive Plan Variable Deferred Stock Unit Award Notice Employees (21) | |
| 10.41 | Letter Agreement with Denis J. Salamone dated December 24, 2012 (23) | |
| 10.42 | Form of Letter Agreement with Officer dated December 24, 2012 (23) | |
| 10.43 | Form of Hudson City Bancorp, Inc. Amended and Restated 2011 Stock Incentive Plan Deferred Stock Unit Award Notice for Employees (24) | |
| 10.44 | Form of Hudson City Bancorp, Inc. Amended and Restated 2011 Stock Incentive Plan Deferred Stock Unit award Notice for Employees (24) | |
| 10.45 | Letter Agreement with Denis J. Salamone dated October 21, 2014 (27) | |
| 10.46 | Form of Letter Agreement with Executive Vice President dated October 9, 2014 (together with Schedule pursuant to Instruction 2 of Item 601 of Regulation S-K) (27) | |
| 10.47 | Form of Letter Agreement with Senior Vice President dated October 9, 2014 (together with Schedule pursuant to Instruction 2 of Item 601 of Regulation S-K) (27) | |
| 10.48 | Employment Agreement between Hudson City Bancorp, Inc. and Anthony J. Fabiano (28) | |
| 10.49 | Employment Agreement between Hudson City Savings Bank and Anthony J. Fabiano (28) | |
| 10.50 | Letter Agreement with Ronald E. Hermance, Jr. dated December 24, 2012 (23) | |
| 10.51 | Amended and Restated Employment Agreement between Hudson City Bancorp, Inc. and Ronald E. Hermance, Jr. (13) | |
| 10.52 | Amended and Restated Employment Agreement between Hudson City Savings Bank and Ronald E. Hermance, Jr. (13) | |
| 21.1 | Subsidiaries of Hudson City Bancorp, Inc.* | |
| 23.1 | Consent of KPMG LLP * | |
| 31.1 | Certification of Chief Executive Officer* | |
| 31.2 | Certification of Chief Financial Officer* | |
| 32.1 | Statement Furnished Pursuant to Section 906 of the Sarbanes-Oxley Act of 2002, 18 U.S.C. Section 1350* | |
| 101 | The following information from the Company’s Annual Report on Form 10-K for the year ended December 31, 2014, filed with the Securities and Exchange Commission on March 2, 2015, has been formatted in eXtensible Business Reporting Language: (i) Consolidated Statements of Financial Condition at December 31, 2014 and 2013, (ii) Consolidated Statements of Income for the years ended December 31, 2014, 2013 and 2012, (iii) Consolidated Statements of Comprehensive Income for the years ended December 31, 2014, 2013 and 2012, (iv) Consolidated Statements of Changes in Shareholders’ Equity for the years ended December 31, 2014, 2013 and 2012, (v) Consolidated Statements of Cash Flows for the years ended December 31, 2014, 2013 and 2012 and (vi) Notes to the Consolidated Financial Statements. * | |
| (1) | Incorporated herein by reference to the Exhibits to the Registrant’s Registration Statement No. 333-122989 on Form S-3 filed with the Securities and Exchange Commission on February 25, 2005, as amended. |
| (2) | Incorporated herein by reference to the Exhibits to the Registrant’s Current Report on Form 8-K filed with the Securities and Exchange Commission on February 10, 2006. |
| (3) | Incorporated herein by reference to the Exhibits to the Registrant’s Registration Statement No. 333-74383 on Form S-1, filed with the Securities and Exchange Commission on March 15, 1999, as amended. |
| (4) | Incorporated herein by reference to the Registrant’s Current Report on Form 8-K filed with the Securities and Exchange Commission on March 19, 2012 and the Registrant’s Current Report on Form 8-K filed with the Securities and Exchange Commission on September 22, 2014. |
| (5) | Incorporated herein by reference to the Exhibits to the Registrant’s Quarterly Report on Form 10-Q for the quarter ended March 31, 2010 filed with the Securities and Exchange Commission on May 7, 2010. |
| (6) | Incorporated herein by reference to the Exhibits to the Registrant’s Registration Statement No. 333-95193 on Form S-8, filed with the Securities and Exchange Commission on January 21, 2000. |
| (7) | Incorporated herein by reference to the Exhibits to the Registrant’s Annual Report on Form 10-K for the fiscal year ended December 31, 2001 filed with the Securities and Exchange Commission on March 28, 2002. |
| (8) | Incorporated herein by reference to the Exhibits to the Registrant’s Registration Statement No. 333-114536 on Form S-8, filed with the Securities and Exchange Commission on April 16, 2004. |
| (9) | Incorporated herein by reference to the Exhibits to the Registrant’s Annual Report on Form 10-K for the fiscal year ended December 31, 2005 filed with the Securities and Exchange Commission on March 16, 2006. |
177
Table of Contents
| (10) | Incorporated herein by reference to the Registrant’s Proxy Statement filed with the Securities and Exchange Commission on April 28, 2006. |
| (11) | Incorporated herein by reference to the Exhibits to the Registrant’s Annual Report on Form 10-K for the fiscal year ended December 31, 2006 filed with the Securities and Exchange Commission on March 1, 2007. |
| (12) | Incorporated herein by reference to the Proxy Statement No. 000-26001 filed with the Securities and Exchange Commission on March 18, 2010. |
| (13) | Incorporated herein by reference to the Exhibits to the Registrant’s Annual Report on Form 10-K for the fiscal year ended December 31, 2008 filed with the Securities and Exchange Commission on February 27, 2009. |
| (14) | Incorporated herein by reference to the Exhibits to the Registrant’s Quarterly Report on Form 10-Q for the quarter ended March 31, 2009 filed with the Securities and Exchange Commission on May 8, 2009. |
| (15) | Incorporated herein by reference to the Exhibits to the Registrant’s Quarterly Report on Form 10-Q/A (Amendment No.1) for the quarter ended June 30, 2012 filed with the Securities and Exchange Commission on October 11, 2012. |
| (16) | Incorporated herein by reference to the Exhibits to the Registrant’s Annual Report on Form 10-K for the fiscal year ended December 31, 2010 filed with the Securities and Exchange Commission on March 1, 2011. |
| (17) | Incorporated herein by reference to the Exhibits to the Registrant’s Quarterly Report on Form 10-Q for the quarter ended March 31, 2011 filed with the Securities and Exchange Commission on May 9, 2011. |
| (18) | Incorporated herein by reference to the Exhibits to the Registrant’s Quarterly Report on Form 10-Q for the quarter ended June 30, 2011 filed with the Securities and Exchange Commission on August 5, 2011. |
| (19) | Incorporated herein by reference to the Registrant’s Proxy Statement filed with the Securities and Exchange Commission on March 17, 2011. |
| (20) | Incorporated herein by reference to the Exhibits to the Registrant’s Quarterly Report on Form 10-Q for the quarter ended March 31, 2012 filed with the Securities and Exchange Commission on May 10, 2012. |
| (21) | Incorporated herein by reference to the Exhibits to the Registrant’s Quarterly Report on Form 10-Q for the quarter ended September 30, 2012 filed with the Securities and Exchange Commission on November 9, 2012. |
| (22) | Incorporated herein by reference to the Exhibits to the Registrant’s Current Report on Form 8-K filed with the Securities and Exchange Commission on August 31, 2012. |
| (23) | Incorporated herein by reference to the Exhibits to the Registrant’s Annual Report on Form 10-K for the fiscal year ended December 31, 2012 filed with the Securities and Exchange Commission on February 28, 2013. |
| (24) | Incorporated herein by reference to the Exhibits to the Registrant’s Quarterly Report on Form 10-Q for the quarter ended September 30, 2013 filed with the Securities and Exchange Commission on November 8, 2013. |
| (25) | Incorporated herein by reference to the Exhibits to the Registrant’s Current Report on Form 8-K filed with the Securities and Exchange Commission on April 15, 2013. |
| (26) | Incorporated herein by reference to the Exhibits to the Registrant’s Current Report on Form 8-K filed with the Securities and Exchange Commission on December 17, 2013. |
| (27) | Incorporated herein by reference to the Exhibits to the Registrant’s Quarterly Report on Form 10-Q for the quarter ended September 30, 2014 filed with the Securities and Exchange Commission on November 7, 2014. |
| (28) | Incorporated herein by reference to the Exhibits to the Registrant’s Current Report on Form 8-K filed with the Securities and Exchange Commission on December 22, 2014. |
| (29) | Incorporated herein by reference to the Exhibits to the Registrant’s Current Report on Form 8-K filed with the Securities and Exchange Commission on December 9, 2014. |
| * | Filed herewith. |
178
Table of Contents
Pursuant to the requirements of Section 13 or 15(d) of the Securities Exchange Act of 1934, the registrant has duly caused this report to be signed on its behalf by the undersigned, thereunto duly authorized, in Paramus, New Jersey, on March 2, 2015.
| Hudson City Bancorp, Inc. |
||||||
| By: |
/s/ Denis J. Salamone | /s/ James C. Kranz | ||||
| Denis J. Salamone | James C. Kranz | |||||
| Chairman and Chief Executive Officer | Executive Vice President and Chief Financial Officer | |||||
| (Principal Executive Officer) | (Principal Financial Officer) | |||||
| /s/ Anthony J. Fabiano | ||||||
| Anthony J. Fabiano President and Chief Operating Officer |
||||||
| (Principal Accounting Officer) | ||||||
Pursuant to the requirements of the Securities Exchange Act of 1934, this report has been signed by the following persons on behalf of the registrant and in the capacities and on the dates indicated.
| NAME |
TITLE |
DATE | ||
| /s/ Denis J. Salamone |
Director, Chairman and Chief Executive Officer | March 2, 2015 | ||
| Denis J. Salamone |
(Principal Executive Officer) | |||
| /s/ Anthony J. Fabiano |
Director, President and Chief Operating Officer | March 2, 2015 | ||
| Anthony J. Fabiano |
||||
| /s/ Michael W. Azzara |
Director | March 2, 2015 | ||
| Michael W. Azzara |
||||
| /s/ William G. Bardel |
Director | March 2, 2015 | ||
| William G. Bardel |
||||
| /s/ Scott A. Belair |
Director | March 2, 2015 | ||
| Scott A. Belair |
||||
| /s/ Victoria H. Bruni |
Director | March 2, 2015 | ||
| Victoria H. Bruni |
||||
| /s/ Cornelius E. Golding |
Director | March 2, 2015 | ||
| Cornelius E. Golding |
||||
| /s/ Donald O. Quest |
Director | March 2, 2015 | ||
| Donald O. Quest |
||||
| /s/ Joseph G. Sponholz |
Director | March 2, 2015 | ||
| Joseph G. Sponholz |
||||
179