Attached files
| file | filename |
|---|---|
| EX-21.1 - EXHIBIT 21.1 - Cheniere Energy, Inc. | exhibit_21-1.htm |
| EX-31.2 - EXHIBIT 31.2 - Cheniere Energy, Inc. | exhibit_31-2.htm |
| EX-23.1 - EXHIBIT 23.1 - Cheniere Energy, Inc. | exhibit_23-1.htm |
| EX-32.1 - EXHIBIT 32.1 - Cheniere Energy, Inc. | exhibit_32-1.htm |
| EX-31.1 - EXHIBIT 31.1 - Cheniere Energy, Inc. | exhibit_31-1.htm |
| EX-32.2 - EXHIBIT 32.2 - Cheniere Energy, Inc. | exhibit_32-2.htm |
| EX-10.70 - EXHIBIT 10.70 - Cheniere Energy, Inc. | exhibit_10-70.htm |
UNITED
STATES
SECURITIES
AND EXCHANGE COMMISSION
Washington,
D.C. 20549
Form
10-K
|
x
|
ANNUAL REPORT PURSUANT TO SECTION
13 OR 15(D) OF THE SECURITIES EXCHANGE ACT OF
1934
|
For
the fiscal year ended December 31, 2009
OR
|
¨
|
TRANSITION
REPORT PURSUANT TO SECTION 13 OR 15(D) OF THE SECURITIES EXCHANGE ACT OF
1934
|
For
the transition period from
to
Commission
File No. 001-16383
CHENIERE
ENERGY, INC.
(Exact
name of registrant as specified in its charter)
|
Delaware
|
95-4352386
|
|
(State
or other jurisdiction of incorporation or organization)
|
(I.R.S.
Employer Identification No.)
|
|
700
Milam Street, Suite 800
|
|
|
Houston,
Texas
|
77002
|
|
(Address
of principal executive offices)
|
(Zip
code)
|
Registrant’s
telephone number, including area code: (713) 375-5000
Securities
registered pursuant to Section 12(b) of the Act:
|
Common
Stock, $ 0.003 par value
|
NYSE
Amex Equities
|
|
(Title
of Class)
|
(Name
of each exchange on which
registered)
|
Securities
registered pursuant to Section 12(g) of the Act: None
Indicate
by check mark if the registrant is a well-known seasoned issuer, as defined in
Rule 405 of the Securities Act. Yes ¨ No x
Indicate
by check mark if the registrant is not required to file reports pursuant to
Section 13 or Section 15(d) of the Exchange
Act. Yes No x
Indicate
by check mark whether the registrant (1) has filed all reports required to
be filed by Section 13 or 15(d) of the Securities Exchange Act of 1934
during the preceding 12 months (or for such shorter period that the registrant
was required to file such reports), and (2) has been subject to such filing
requirements for the past 90 days. Yes x No
Indicate by check mark
whether the registrant has submitted electronically and posted on its corporate
Web site, if any, every Interactive Data File required to be submitted and
posted pursuant to Rule 405 of Regulation S-T during the preceding 12 months (or
for such shorter period that the registrant was required to submit and post such
files). Yes ¨ No ¨
Indicate
by check mark if disclosure of delinquent filers pursuant to Item 405 of
Regulation S-K is not contained herein, and will not be contained, to the best
of the registrant’s knowledge, in definitive proxy or information statements
incorporated by reference in Part III of this Form 10-K or any amendment to this
Form 10-K.
Indicate
by check mark whether the registrant is a large accelerated filer, an
accelerated filer, a non-accelerated filer, or a smaller reporting company. See
the definitions of “large accelerated filer, “accelerated filer” and “smaller
reporting company” in Rule 12b-2 of the Exchange Act. (Check one):
|
Large accelerated filer ¨
|
Accelerated filer x
|
Non-accelerated filer ¨
|
Smaller reporting company ¨
|
|
(Do
not check if a smaller reporting company)
|
|||
Indicate
by check mark whether the registrant is a shell company (as defined in Rule
12b-2 of the Exchange Act). Yes ¨ No x
The
aggregate market value of the registrant’s Common Stock held by non-affiliates
of the registrant was approximately $158,000,000 as of June 30,
2009.
57,258,053
shares of the registrant’s Common Stock were outstanding as of February 17,
2010.
Documents
incorporated by reference: The definitive proxy statement for the registrant’s
Annual Meeting of Stockholders (to be filed within 120 days of the close of the
registrant’s fiscal year) is incorporated by reference into Part
III.
CHENIERE
ENERGY, INC.
Index to
Form 10-K
i
CAUTIONARY
STATEMENT
REGARDING
FORWARD-LOOKING STATEMENTS
This
annual report contains certain statements that are, or may be deemed to be,
“forward-looking statements” within the meaning of Section 27A of the
Securities Act of 1933, as amended (the “Securities Act”), and Section 21E
of the Securities Exchange Act of 1934, as amended (the “Exchange Act”). All
statements, other than statements of historical facts, included herein or
incorporated herein by reference are “forward-looking statements.” Included
among “forward-looking statements” are, among other things:
|
|
•
|
statements
relating to the construction and operation of each of our proposed
liquefied natural gas (“LNG”) receiving terminals or our proposed natural
gas pipelines, or expansions or extensions thereof, including statements
concerning the completion or expansion thereof by certain dates or at all,
the costs related thereto and certain characteristics, including amounts
of regasification and storage capacity, the number of storage tanks and
docks, pipeline deliverability and the number of pipeline
interconnections, if any;
|
|
|
•
|
statements
that we expect to receive an order from the Federal Energy Regulatory
Commission (“FERC”) authorizing us to construct and operate proposed LNG
receiving terminals or proposed pipelines by certain dates, or at
all;
|
|
|
•
|
statements
regarding future levels of domestic natural gas production, supply or
consumption; future levels of LNG imports into North America; sales of
natural gas in North America; and the transportation, other infrastructure
or prices related to natural gas, LNG or other energy sources or
hydrocarbon products;
|
|
|
•
|
statements
regarding any financing or refinancing or recapitalization transactions or
arrangements, or ability to enter into such transactions, whether on the
part of Cheniere or at the project
level;
|
|
|
•
|
statements
regarding any terminal use agreement (“TUA”) or other commercial
arrangements presently contracted, optioned, marketed or potential
arrangements to be performed substantially in the future, including any
cash distributions and revenues anticipated to be received and the
anticipated timing thereof, and statements regarding the amounts of total
LNG regasification or storage capacity that are, or may become, subject to
TUAs or other contracts;
|
|
|
•
|
statements
regarding counterparties to our TUAs, construction contracts and other
contracts;
|
|
|
•
|
statements
regarding any business strategy, any business plans or any other plans,
forecasts, projections or objectives, including potential revenues and
capital expenditures, any or all of which are subject to
change;
|
|
|
•
|
statements
regarding legislative, governmental, regulatory, administrative or other
public body actions, requirements, permits, investigations, proceedings or
decisions;
|
|
|
•
|
statements
regarding our LNG and natural gas marketing activities;
and
|
|
|
•
|
any
other statements that relate to non-historical or future
information.
|
These
forward-looking statements are often identified by the use of terms and phrases
such as “achieve,” “anticipate,” “believe,” “develop,” “estimate,” “expect,”
“forecast,” “plan,” “potential,” “project,” “propose,” “strategy” and similar
terms and phrases. Although we believe that the expectations reflected in these
forward-looking statements are reasonable, they do involve assumptions, risks
and uncertainties, and these expectations may prove to be incorrect. You should
not place undue reliance on these forward-looking statements, which speak only
as of the date of this annual report.
Our
actual results could differ materially from those anticipated in these
forward-looking statements as a result of a variety of factors, including those
discussed in “Risk Factors.” All forward-looking statements attributable to us
or persons acting on our behalf are expressly qualified in their entirety by
these risk factors. These forward-looking statements are made as of the date of
this annual report.
ii
DEFINITIONS
In this
annual report, unless the context otherwise requires:
|
|
•
|
Bcf means billion cubic
feet;
|
|
|
•
|
Bcf/d means billion
cubic feet per day;
|
|
|
•
|
EPC means engineering,
procurement and construction;
|
|
|
•
|
EPCM means engineering,
procurement, construction and
management;
|
|
|
•
|
LNG means liquefied
natural gas;
|
|
|
•
|
MMcf/d means million
cubic feet per day;
|
|
|
•
|
MMBtu means million
British thermal units; and
|
|
|
•
|
TUA means terminal use
agreement.
|
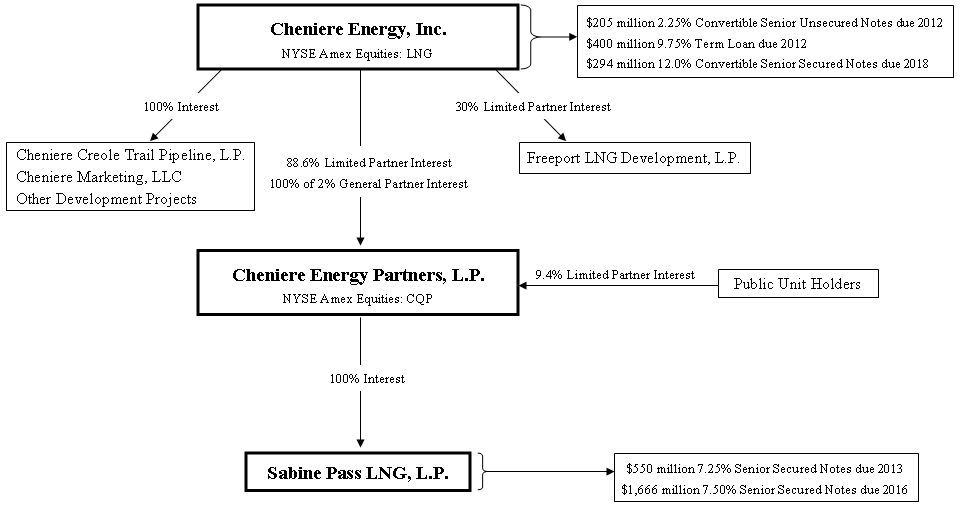
Cheniere
Energy, Inc. (NYSE Amex Equities: LNG), a Delaware corporation, is a
Houston-based energy company primarily engaged in LNG-related
businesses. We own and operate the Sabine Pass LNG receiving terminal
in Louisiana through our 90.6% ownership interest in and management agreements
with Cheniere Energy Partners, L.P. (“Cheniere Partners”) (NYSE Amex Equities:
CQP), which is a publicly traded partnership we created in 2007. We
also own and operate the Creole Trail Pipeline, which interconnects the Sabine
Pass LNG receiving terminal with downstream markets. One of our
subsidiaries, Cheniere Marketing, LLC (“Cheniere Marketing”), is marketing LNG
and natural gas and is developing a portfolio of contracts to monetize capacity
at the Sabine Pass LNG receiving terminal and the Creole Trail
Pipeline. We own 30% of the limited partnership interests of Freeport
LNG Development, L.P. (“Freeport LNG”), which operates the Freeport LNG
receiving terminal. We are also in various stages of developing other
LNG receiving terminal and pipeline related projects, which, among other things,
will require acceptable commercial arrangements before we make a final
investment decision. In addition, we are engaged to a limited extent
in oil and natural gas exploration and development activities in the Gulf of
Mexico. Unless the context requires otherwise, references to the
“Company”, “Cheniere”, “we”, “us” and “our” refer to Cheniere Energy, Inc. and
its subsidiaries, including our publicly traded subsidiary partnership, Cheniere
Partners.
LNG is
natural gas that, through a refrigeration process, has been reduced to a liquid
state, which represents approximately 1/600th of its gaseous volume. The
liquefaction of natural gas into LNG allows it to be shipped economically from
areas of the world where natural gas is abundant and inexpensive to produce to
other areas where natural gas demand and infrastructure exist to justify
economically the use of LNG. LNG is transported using oceangoing LNG vessels
specifically constructed for this purpose. LNG receiving terminals offload LNG
from LNG vessels, store the LNG prior to processing, heat the LNG to return it
to a gaseous state and deliver the resulting natural gas into pipelines for
transportation to market.
In
addition to safely maintaining the operations of the Sabine Pass LNG receiving
terminal and Creole Trail Pipeline, our primary business strategy is to monetize
the 2.0 Bcf/d of regasification capacity at the Sabine Pass LNG receiving
terminal held by Cheniere Marketing by entering into long-term TUAs, developing
a portfolio of long-term, short-term and spot LNG purchase agreements, and
entering into business relationships for the domestic marketing of natural gas
that is imported by Cheniere Marketing as LNG to the Sabine Pass LNG receiving
terminal. In addition, our long-term strategy is to develop and construct
additional LNG receiving terminals and natural gas pipelines and related
infrastructure when market and financial conditions are
favorable.
Our ability to
successfully execute our business strategies will be impacted by many factors,
including the balance of worldwide supply and demand for natural gas and LNG,
the relative prices for natural gas in North America and international markets,
the willingness of LNG producers and international LNG buyers to invest new
capital and secure access to North American natural gas markets on a long-term
basis, and access to capital to market our portfolio of natural gas and LNG and
to develop and construct future LNG receiving terminal, pipeline and other
infrastructure projects. We believe that North American natural gas prices
support long-term profitability for LNG production. Although we believe
that we will have sufficient cash on hand and cash generated from operations to
fund our operating expenses and other cash requirements until our long-term
debts first become due as early as August 2011 (as lenders of the 2008
Convertible Loans due in 2018 can require prepayment of the loans in August
2011, 2013, and 2015), if there is insufficient demand for our LNG
receiving terminal services, our ability to satisfy our long-term debts
thereafter will be
1
limited
absent a restructuring of our finances, which may include issuing new debt,
issuing equity securities, selling assets or a combination thereof. See
Item 1A, "Risk Factors."
In 2007,
we contributed the equity interests in the entity owning the Sabine Pass LNG
receiving terminal to Cheniere Partners and completed a public offering of
15,525,000 Cheniere Partners common units. As a result of the public offering,
our ownership interest in Cheniere Partners is approximately
90.6%. As of December 31, 2009, we held 135,383,831 subordinated
units, 10,891,357 common units and 3,302,045 general partner units of Cheniere
Partners. Although results are consolidated for financial reporting,
we and Cheniere Partners operate with independent capital structures. As such,
cash flow available to us from Cheniere Partners is primarily in the form of
cash distributions declared and paid to us on our limited and general partner
interests and management fees. We received cash distributions and management
fees from Cheniere Partners of $299.6 million, $19.4 million and $10.0 million
in the years ended December 31, 2009, 2008 and 2007. These cash distributions
from Cheniere Partners were primarily used by Cheniere Marketing to make its TUA
payments to the Sabine Pass LNG receiving terminal and to fund
operations.
The
following diagram depicts our ownership of Cheniere Partners; Sabine Pass LNG,
L.P., our majority owned subsidiary (“Sabine Pass”); Freeport LNG; Creole Trail
Pipeline, L.P.; and Cheniere Marketing as of December 31, 2009:
Business
Segments
Our
business activities are conducted by three operating segments for which we
provide information in our consolidated financial statements for the years ended
December 31, 2009, 2008 and 2007. These three segments are
our:
|
|
•
|
LNG
receiving terminal business;
|
|
|
•
|
natural
gas pipeline business; and
|
|
|
•
|
LNG
and natural gas marketing business.
|
For
information about our segments’ revenues, profits and losses and total assets,
see Item 8. Financial Statements and Supplementary Data—Note 25—“Business
Segment Information” of our Notes to Consolidated Financial
Statements.
2
We began
developing our LNG receiving terminal business in 1999 and were among the first
companies to secure sites and commence development of new LNG receiving
terminals in North America. We focused our development efforts on three LNG
receiving terminal projects: Sabine Pass LNG in western Cameron Parish,
Louisiana on the Sabine Pass Channel; Corpus Christi LNG near Corpus Christi,
Texas; and Creole Trail LNG at the mouth of the Calcasieu Channel in central
Cameron Parish, Louisiana. Our ownership interest in the Sabine Pass LNG
receiving terminal is held through Cheniere Partners, in which we hold an
approximate 90.6% interest. Cheniere Partners owns a 100% interest in Sabine
Pass, which during 2009 completed construction of and is currently operating the
Sabine Pass LNG receiving terminal. We currently own 100% interests in both the
Corpus Christi and Creole Trail LNG receiving terminal projects. In addition, we
own a 30% limited partner interest in a fourth LNG receiving terminal, Freeport
LNG, located on Quintana Island near Freeport, Texas.
Sabine
Pass LNG Receiving Terminal
We
have constructed and are operating the Sabine Pass LNG receiving terminal in
western Cameron Parish, Louisiana, on the Sabine Pass Channel. In 2003, we
formed Sabine Pass LNG to own, develop and operate the Sabine Pass LNG receiving
terminal. We have long-term leases for three tracts of land consisting of 853
acres in Cameron Parish, Louisiana for the project site. The Sabine Pass LNG
receiving terminal was designed, and permitted by the FERC, with a
regasification capacity of approximately 4.0 Bcf/d (with peak capacity of 4.3
Bcf/d) and aggregate LNG storage capacity of 16.9 Bcf. Construction at the
Sabine Pass LNG receiving terminal was substantially completed in the third
quarter of 2009. As of December 31, 2009, we had completed
construction and attained full operability of the Sabine Pass LNG receiving
terminal, and such was accomplished within our budget.
Customers
The
entire approximately 4.0 Bcf/d of regasification capacity at the Sabine Pass LNG
receiving terminal has been fully reserved under three long-term TUAs, under
which Sabine Pass LNG’s customers are required to pay fixed monthly fees,
whether or not they use the terminal. Capacity reservation fee TUA payments are
made by our third-party TUA customers as follows:
|
|
•
|
Total
Gas and Power North America, Inc. (formally known as Total LNG USA, Inc.)
(“Total”) has reserved approximately 1.0 Bcf/d of regasification capacity
and has agreed to make monthly capacity payments to Sabine Pass LNG
aggregating approximately $125 million per year for 20 years that
commenced April 1, 2009. Total, S.A. has guaranteed Total’s
obligations under its TUA up to $2.5 billion, subject to certain
exceptions; and
|
|
|
•
|
Chevron
U.S.A., Inc. (“Chevron”) has reserved approximately 1.0 Bcf/d of
regasification capacity and has agreed to make monthly capacity payments
to Sabine Pass LNG aggregating approximately $125 million per year for 20
years that commenced July 1, 2009. Chevron Corporation has guaranteed
Chevron’s obligations under its TUA up to 80% of the fees payable by
Chevron.
|
Our
wholly-owned subsidiary, Cheniere Marketing, has reserved the remaining 2.0
Bcf/d of regasification capacity, and is entitled to use any capacity not
utilized by Total and Chevron. Cheniere Marketing began making its TUA capacity
reservation fee payments in the fourth quarter of 2008. Cheniere
Marketing is required to make capacity payments aggregating approximately $250
million per year for the period from January 1, 2009 through at least
September 30, 2028. Cheniere has guaranteed Cheniere Marketing’s obligations
under its TUA.
Under
each of these TUAs, Sabine Pass LNG is also entitled to retain 2% of the LNG
delivered for the customer’s account, which Sabine Pass LNG will use primarily
as fuel for revaporization and self-generated power at the Sabine Pass LNG
receiving terminal.
Each of
Total and Chevron has paid us $20.0 million in nonrefundable advance capacity
reservation fees, which will be amortized over a 10-year period as a reduction
of each customer’s regasification capacity reservation fees payable under its
TUA.
Corpus
Christi LNG Receiving Terminal
We are
also developing the Corpus Christi LNG receiving terminal near Corpus Christi,
Texas. We formed Corpus Christi LNG, L.P. (“Corpus Christi LNG”) in May 2003 to
develop the terminal. The Corpus Christi LNG receiving terminal, if constructed,
would be located on 612 acres and was designed, and permitted by the FERC, with
a regasification capacity of approximately 2.6 Bcf/d, three LNG storage tanks
with an aggregate LNG storage capacity of approximately 10.1 Bcf and two
unloading docks capable of handling the largest LNG carriers currently being
operated or built. In December 2005, the FERC issued an order authorizing Corpus
Christi LNG to commence initial construction of the Corpus Christi LNG receiving
terminal, subject to satisfaction of certain
3
conditions
specified by the FERC. Preliminary site work has been completed. We will
contemplate making a final investment decision to complete construction of the
Corpus Christi LNG receiving terminal upon, among other things, achieving
acceptable commercial arrangements and entering into acceptable financing
arrangements.
Creole
Trail LNG Receiving Terminal
We are
also developing an LNG receiving terminal at the mouth of the Calcasieu Channel
in central Cameron Parish, Louisiana. We formed Creole Trail LNG, L.P. (“Creole
Trail LNG”) in December 2004 to develop the terminal. We have options to lease
tracts of land comprising 1,750 acres in Cameron Parish, Louisiana for the
project site. The Creole Trail LNG receiving terminal was designed, and
permitted by the FERC, with a regasification capacity of approximately 3.3
Bcf/d, four LNG storage tanks with an aggregate LNG storage capacity of
approximately 13.5 Bcf and two unloading docks capable of handling the largest
LNG carriers currently being operated or built. In June 2006, the FERC
authorized Creole Trail LNG to site, construct and operate the Creole Trail LNG
receiving terminal. We will contemplate making a final investment decision to
commence construction of the Creole Trail LNG receiving terminal upon, among
other things, achieving acceptable commercial arrangements and entering into
acceptable financing arrangements.
Other
LNG Receiving Terminal Sites
We
continue to evaluate, and may develop, additional sites that we believe may be
commercially desirable locations for LNG receiving terminals.
Other
LNG Receiving Terminal Interests—Freeport LNG
We own a
30% limited partner interest in Freeport LNG Development, L.P. (“Freeport LNG”),
which has constructed an LNG receiving facility on Quintana Island near
Freeport, Texas. The first phase of the project includes regasification capacity
of 1.55 Bcf/d (with peak capacity of 1.75 Bcf/d), one dock, two LNG storage
tanks with an aggregate LNG storage capacity of 6.7 Bcf, and a 9.6-mile, 42-inch
diameter pipeline through which natural gas is transported to customer
redelivery points at Stratton Ridge, Texas. A proposed second phase, which has
received FERC approval, would include additional regasification capacity of up
to 1.15 Bcf/d (with peak capacity of 1.75 Bcf/d), a second dock, and a third LNG
storage tank. Freeport LNG is also currently constructing 7.5 Bcf of underground
salt cavern storage at Stratton Ridge which is expected to be completed and
integrated with the LNG receiving terminal operations in the first quarter of
2011.
Freeport
LNG has entered into TUAs with three customers: The Dow Chemical Company for
approximately 500 MMcf/d of regasification capacity; ConocoPhillips Company for
approximately 900 MMcf/d of regasification capacity; and MC Global Gas
Corporation, a wholly owned subsidiary of Mitsubishi Corporation, for
approximately 150 MMcf/d of regasification capacity. In June 2008, Freeport LNG
achieved commercial operability, and it began receiving TUA payments from its
customers in the second half of 2008.
In the
years ended December 31, 2009 and 2008, Freeport LNG distributed $15.3 million
and $4.8 million to us, respectively.
LNG
Receiving Terminal Competition
New
supplies to meet North America’s natural gas demand could be developed from a
combination of the following sources:
|
|
•
|
existing
producing regions in the United States, Canada and
Mexico;
|
|
|
•
|
frontier
regions in Alaska, northern Canada and offshore
deepwater;
|
|
|
•
|
areas
currently restricted from exploration and development due to public
policies, such as areas in the Rocky Mountains and offshore Atlantic,
Pacific and Gulf of Mexico coasts;
and
|
|
|
•
|
imported
LNG.
|
In
addition, demand for energy currently met by natural gas could alternatively be
met by other energy forms such as coal, hydroelectric, oil, wind, solar and
nuclear energy. LNG will face competition from each of these energy
sources.
We
compete with other companies to construct LNG receiving terminals in
economically desirable locations. According to the FERC, as of December 17,
2009, there were twelve existing LNG receiving terminals in North America, two
of which are offshore facilities for receiving natural gas regasified from LNG
onboard specialized LNG vessels, as well as other new LNG receiving terminals or
expansions approved or proposed to be constructed. To the extent that we may
desire to sell regasification capacity in our
4
LNG
receiving terminals, we will compete with other third-party LNG receiving
terminals or existing terminals having uncommitted capacity.
In
addition, in connection with our efforts to obtain LNG to exploit our retained
capacity at the Sabine Pass LNG receiving terminal, we must compete in the world
LNG market to purchase and transport cargoes of LNG.
LNG
Receiving Terminal Governmental Regulation
Our LNG
receiving terminal operations are subject to extensive regulation under federal,
state and local statutes, rules, regulations and laws. These laws require that
we engage in consultations with appropriate federal and state agencies and that
we obtain and maintain applicable permits and other authorizations before
commencement of construction and operation of LNG receiving terminals. This
regulatory burden increases the cost of constructing and operating the LNG
receiving terminals, and failure to comply with such laws could result in
substantial penalties. Through construction, commissioning and operations, we
have been in substantial compliance with all regulations discussed
herein.
FERC
In order
to site and construct our proposed LNG receiving terminals, we must receive and
are required to maintain authorization from the FERC under Section 3 of the
Natural Gas Act of 1938 (“NGA”). In addition, orders from the FERC authorizing
construction of an LNG receiving terminal are typically subject to specified
conditions that must be satisfied throughout the construction, commissioning and
operation of terminals. Throughout the life of our LNG receiving terminals, they
will be subject to regular reporting requirements to the FERC and the U.S.
Department of Transportation regarding the operation and maintenance of the
facilities.
In 2005,
the Energy Policy Act of 2005 (“EPAct”) was signed into law. The EPAct gave the
FERC exclusive authority to approve or deny an application for the siting,
construction, expansion or operation of an LNG receiving terminal. The EPAct
amended the NGA to prohibit market manipulation. The EPAct increased
civil and criminal penalties for any violations of the NGA, the Natural Gas
Policy Act of 1978 (“NGPA”) and any rules, regulations or orders of the FERC up
to $1.0 million per day per violation. In accordance with the EPAct, the FERC
issued a final rule making it unlawful for any entity, in connection with the
purchase or sale of natural gas or transportation service subject to the FERC’s
jurisdiction, to defraud, make an untrue statement or omit a material fact or
engage in any practice, act or course of business that operates or would operate
as a fraud.
Other
Federal Governmental Permits, Approvals and Consultations
In
addition to the FERC authorization under Section 3 of the NGA, our
construction and operation of LNG receiving terminals are also subject to
additional federal permits, approvals and consultations required by other
federal agencies, including: Advisory Counsel on Historic Preservation, U.S.
Army Corps of Engineers, U.S. Department of Commerce, National Marine Fisheries
Services, U.S. Department of the Interior, U.S. Fish and Wildlife Service, U.S.
Environmental Protection Agency (“EPA”) and U.S. Department of Homeland
Security.
Our LNG
receiving terminals are also subject to U.S. Department of Transportation siting
requirements and regulations of the U.S. Coast Guard relating to facility
security. Moreover, our LNG receiving terminals are also subject to local and
state laws, rules, and regulations.
LNG
Receiving Terminal Environmental Regulation
Our LNG
receiving terminal operations are subject to various federal, state and local
laws and regulations relating to the protection of the environment. These
environmental laws and regulations may impose substantial penalties for
noncompliance and substantial liabilities for pollution. Many of these laws and
regulations restrict or prohibit the types, quantities and concentration of
substances that can be released into the environment and can lead to substantial
liabilities for non-compliance or releases. Failure to comply with these laws
and regulations may also result in substantial civil and criminal fines and
penalties.
Comprehensive
Environmental Response, Compensation and Liability Act (CERCLA)
CERCLA,
also known as the “Superfund” law, imposes liability, without regard to fault,
on certain classes of persons who are considered to be responsible for the spill
or release of a hazardous substance into the environment. Potentially liable
persons include the owner or operator of the site where the release occurred and
persons who disposed or arranged for the disposal of hazardous substances at the
site. Under CERCLA, responsible persons may be subject to joint and several
liability. Although CERCLA currently
5
excludes
petroleum, natural gas, natural gas liquids and LNG from its definition of
“hazardous substances,” this exemption may be limited or modified by the U.S.
Congress in the future.
Clean
Air Act (CAA)
Our LNG
receiving terminal operations are subject to the federal CAA and comparable
state and local laws. We may be required to incur certain capital expenditures
over the next several years for air pollution control equipment in connection
with maintaining or obtaining permits and approvals addressing other air
emission-related issues. We do not believe, however, that our operations will be
materially and adversely affected by any such requirements.
The U.S.
Supreme Court has ruled that the EPA has authority under existing legislation to
regulate carbon dioxide and other heat-trapping gases in mobile source
emissions. Mandatory reporting requirements were promulgated by the EPA and
finalized on October 30, 2009. This rule requires mandatory reporting
for greenhouse gases from stationary fuel combustion sources. An
additional section would have required reporting for all fugitive emissions
throughout LNG receiving terminals and would have impacted our reporting
requirements; however, this section was deferred in the final rule. In addition,
Congress has considered proposed legislation directed at reducing “greenhouse
gas emissions.” It is not possible at this time to predict how future
regulations or legislation may address greenhouse gas emissions and impact our
business. However, future regulations and laws could result in increased
compliance costs or additional operating restrictions, and could have a material
adverse effect on our business, financial position, results of operations and
cash flows.
Coastal
Zone Management Act (CZMA)
Our LNG
receiving terminals are subject to the requirements of the CZMA throughout the
construction of facilities located within the coastal zone. The CZMA
is administered by the states (in Louisiana by the Department of Natural
Resources, in Texas, by the Railroad Commission and the General Land
Office). This program is implemented in coordination with the
Department of the Army construction permitting process to ensure that impacts to
coastal areas are consistent with the intent of the CZMA to manage the coastal
areas.
Clean
Water Act (CWA)
Our LNG
receiving terminal operations are also subject to the federal CWA and analogous
state and local laws. Pursuant to certain requirements of the CWA, the EPA has
adopted regulations concerning discharges of wastewater and storm water runoff.
This program requires covered facilities to obtain individual permits,
participate in a group permit or seek coverage under an EPA general
permit.
Resource
Conservation and Recovery Act (RCRA)
The
federal RCRA and comparable state statutes govern the disposal of “hazardous
wastes.” In the event any hazardous wastes are generated in connection with our
LNG receiving terminal operations, we are subject to regulatory requirements
affecting the handling, transportation, treatment, storage and disposal of such
wastes.
Endangered
Species Act
Our LNG
receiving terminal operations and planned construction activities may also be
restricted by requirements under the Endangered Species Act, which seeks to
ensure that human activities neither jeopardize endangered or threatened animal,
fish and plant species nor destroy or modify their critical
habitats.
National
Historic Preservation Act (NHPA)
Our LNG
receiving terminal construction activities are subject to requirements under
Section 106 of NHPA. The NHPA requires projects to take into account
the effects of their actions on historic properties. These programs are
administered by the State Historic Preservation Officer (SHPO). Any
areas where ground disturbance will occur are required to be reviewed by the
affected SHPOs.
We formed
Cheniere Pipeline Company, a wholly-owned subsidiary, to develop natural gas
pipelines to provide access to North American natural gas markets for customers
of our Sabine Pass and proposed Corpus Christi and Creole Trail LNG receiving
terminals. We are also developing other pipeline projects not primarily related
to our LNG receiving terminals. Our pipeline systems
6
developed
in conjunction with our LNG receiving terminals will interconnect with multiple
interstate pipelines, providing a means of delivering revaporized natural gas
from our LNG receiving terminals to various North American natural gas markets.
Our other projects are market-focused, seeking to connect natural gas supplies
to growing markets. Our ultimate decisions regarding new pipeline connections to
our facilities will depend upon future events, including, in particular,
customer preferences and general market demand for natural gas from a particular
LNG receiving terminal.
Creole
Trail Pipeline
The
153-mile Creole Trail Pipeline is being constructed in two phases. Phase 1,
which is currently in-service and operating, consists of 94 miles of natural gas
pipeline connecting the Sabine Pass LNG receiving terminal to numerous
interconnection points with existing interstate and intrastate natural gas
pipelines in southwest Louisiana. Phase 2, once constructed, will consist of
approximately 59 miles of natural gas pipeline running from the terminus of
Phase 1 east to a terminus near Rayne, Louisiana with interconnections to
additional existing interstate natural gas pipelines.
Phase 1
of the Creole Trail Pipeline commenced construction in the second quarter of
2007 and was placed into service, in segments, between April and June 2008. In
conjunction with the pipeline, six delivery meter stations were commissioned,
which provide access to eight major interstate and intrastate natural gas
pipeline systems. The total cost to construct Phase 1 of the Creole Trail
Pipeline was approximately $549 million, before financing costs.
We will
contemplate making a final investment decision to construct Phase 2 of the
Creole Trail Pipeline upon, among other things, achieving acceptable commercial
arrangements and entering into acceptable financing arrangements.
Customers
Cheniere
Marketing and other third parties have entered into interruptible transportation
agreements with Creole Trail Pipeline. Firm transportation capacity of 2.0 Bcf/d
is available to all qualified shippers, including customers with whom we enter
into TUAs for our LNG receiving terminal capacity and who may also desire to
enter into agreements for transportation on the Creole Trail
Pipeline.
Corpus
Christi Pipeline
We formed
Cheniere Corpus Christi Pipeline, L.P., a wholly-owned subsidiary, to develop a
24-mile, 48-inch interstate natural gas pipeline that is designed to transport
2.6 Bcf/d of regasified LNG, from the Corpus Christi LNG receiving terminal
northwesterly along a corridor that will allow for interconnection points with
various interstate and intrastate natural gas transmission pipelines. The FERC
issued an order in April 2005 authorizing us to construct, own and operate the
Corpus Christi Pipeline, subject to specified conditions that must be satisfied.
We will contemplate making an investment decision to commence construction of
the Corpus Christi Pipeline upon, among other things, achieving acceptable
commercial arrangements and entering into acceptable financing arrangements to
build the Corpus Christi LNG receiving terminal.
Other
Pipelines
We
continue to evaluate, and may develop, additional pipelines that we believe may
be commercially desirable based on customer preferences and general market
demand for natural gas. Currently, we are evaluating the following pipeline
projects:
Cheniere
Southern Trail Pipeline
The
Cheniere Southern Trail Pipeline project would interconnect with multiple
takeaway pipelines from LNG receiving terminals in southwestern Louisiana and a
LNG receiving terminal being developed in Mississippi. The Cheniere Southern
Trail Pipeline may also interconnect with multiple onshore pipelines serving
conventional basins in the Gulf of Mexico and with new developments transporting
natural gas from the unconventional shale plays in Texas, Louisiana and
Arkansas. The Cheniere Southern Trail Pipeline could supply Florida with natural
gas needed to supply the growth that we anticipate in natural gas-fired
generation capacity in the state over the next ten to fifteen years. This
pipeline would provide LNG suppliers with access to new natural gas markets,
while providing alternative access to conventional gas supplies and improving
natural gas supply security for Florida and the remainder of the Southeastern
U.S.
As
currently contemplated, the Cheniere Southern Trail Pipeline would involve the
construction of approximately 350 miles of up to 42-inch diameter pipeline that
is currently estimated to cost approximately $1.5 billion, before financing
costs. Our cost estimate is subject to change due to such items as cost
overruns, change orders, delays in construction, increased component and
material costs, escalation of labor costs and increased spending to maintain our
construction schedule. We will contemplate making a final investment decision to
commence construction of the Cheniere Southern Trail Pipeline upon, among other
things, entering into
7
acceptable
commercial arrangements, applying for and receiving FERC authorization to
construct and operate the pipeline and obtaining adequate financing to construct
the Cheniere Southern Trail Pipeline.
Frontera
Pipeline
In
September 2007, we entered into an equity purchase agreement with Tidelands
Oil & Gas Corporation and acquired an 80% interest in Frontera
Pipeline, LLC (“Frontera”), an entity which owns 100% of Sonora Pipeline, LLC
and Terranova Energia. In October 2008, we acquired the remaining 20% interest
in Frontera from Tidelands. Frontera, through Sonora and Terranova, is
developing the Burgos Hub Project, which is a proposed integrated pipeline
project traversing the United States and Mexico border, and the potential
construction of a related underground natural gas storage facility in Mexico.
The aggregate cost to construct the project is currently estimated to be
approximately $700 million to $800 million, before financing costs. Our cost
estimate is subject to change due to such items as cost overruns, change orders,
delays in construction, increased component and material costs, escalation of
labor costs and increased spending to maintain our construction schedule. We
will contemplate making a final investment decision in the Burgos Hub Project
upon, among other things, receiving all required authorizations to construct and
operate the pipeline and storage facility, arranging appropriate financing and
entering into acceptable commercial arrangements for the pipeline and storage
facility.
Natural
Gas Pipeline Competition
Our
existing and proposed pipelines will compete with intrastate and other
interstate pipelines throughout the Gulf Coast region. The principal elements of
competition among pipelines are rates, terms of service, access to supply and
flexibility and reliability of service. In addition, the FERC’s continuing
efforts to increase competition in the natural gas industry are increasing the
natural gas transportation options of a pipeline’s traditional
customers.
Our
pipelines will face competition from other interstate and/or intrastate
pipelines that connect with our LNG receiving terminals. In particular, our
Creole Trail Pipeline competes with the Kinder Morgan Louisiana Pipeline owned
by Kinder Morgan Energy Partners, L.P. (“Kinder Morgan”). Kinder Morgan has
built a 3.2 Bcf/d take-away pipeline system from the Sabine Pass LNG receiving
terminal. Total and Chevron have both signed agreements with Kinder Morgan
securing 100% of the initial capacity on the Kinder Morgan Louisiana Pipeline
for 20 years.
Natural
Gas Pipeline Governmental Regulation
Interstate
Natural Gas Pipelines
Under the
NGA, the FERC is granted authority to approve, and if necessary, set “just and
reasonable rates” for the transmission or sale of natural gas in interstate
commerce. In addition, under the NGA, we are not permitted to unduly
discriminate or grant undue preference as to our rates or the terms and
conditions of service. The FERC has the authority to grant
certificates allowing construction and operation of facilities used in
interstate gas transmission and authorizing the provision of services. Under the
NGA, the FERC’s jurisdiction generally extends to the transportation of natural
gas in interstate commerce, to the sale in interstate commerce of natural gas
for resale for ultimate public consumption for domestic, commercial, industrial,
or any other use, and to natural-gas companies engaged in such transportation or
sale. However, the FERC’s jurisdiction does not extend to the production,
gathering, or local distribution of natural gas.
In
general, the FERC’s authority to regulate interstate natural gas pipelines and
the services that they provide includes:
|
|
•
|
rates
and charges for natural gas transportation and related
services;
|
|
|
•
|
the
certification and construction of new
facilities;
|
|
|
•
|
the
extension and abandonment of services and
facilities;
|
|
|
•
|
the
maintenance of accounts and
records;
|
|
|
•
|
the
acquisition and disposition of
facilities;
|
|
|
•
|
the
initiation and discontinuation of services;
and
|
|
|
•
|
various
other matters.
|
Failure
to comply with the NGA can result in the imposition of administrative, civil and
criminal remedies, including civil and criminal penalties which were recently
increased under the EPAct.
8
In
November 2003, the FERC issued a series of orders adopting revised Standards of
Conduct (Order No. 2004) that apply uniformly to interstate natural gas
pipelines. These Standards of Conduct were designed to govern relationships
between the pipeline and any energy affiliate, rather than governing conduct
between the pipeline and its marketing affiliate. However, in 2006, Order
No. 2004, as applied to natural gas pipelines, was vacated by a federal
court, and the FERC issued an interim rule to address the relationship between
natural gas pipelines and marketing affiliates. In October 2008, the FERC
replaced the interim Standards of Conduct with Order 717 to be effective
January 30, 2009. We have established the required policies and procedures
to comply with the Standards of Conduct, and are subject to audit by the FERC to
review compliance, policies and our training programs.
Our
pipelines that interconnect with our LNG receiving terminals are interstate
natural gas pipelines. We are required to obtain authorization from the FERC
pursuant to Section 7 of the NGA to construct and operate these pipelines.
The rates that we charge are subject to the FERC’s regulation under
Section 4 of the NGA. Our interstate pipelines also are subject to the
FERC’s open access requirements and the FERC’s Standards of Conduct. The FERC’s
exercise of jurisdiction over interstate natural gas pipelines is substantially
broader than its exercise of jurisdiction over LNG receiving
terminals.
Natural
Gas Pipeline Safety
Louisiana
and Texas administer federal pipeline safety standards under the Natural Gas
Pipeline Safety Act of 1968, as amended (“NGPSA”), which requires certain
pipelines to comply with safety standards in constructing and operating the
pipelines and subjects the pipelines to regular inspections. Failure to comply
with the NGPSA may result in the imposition of administrative, civil and
criminal remedies.
The
Pipeline Safety Improvement Act of 2002 (“PSIA”), which is administered by the
U.S. Department of Transportation Office of Pipeline Safety, governs the areas
of testing, education, training and communication. The PSIA requires pipeline
companies to perform extensive integrity tests on natural gas transmission
pipelines that exist in high population density areas designated as “high
consequence areas.” Pipeline companies are required to perform the integrity
tests on a seven-year cycle. The risk ratings are based on numerous factors,
including the population density in the geographic regions served by a
particular pipeline, as well as the age and condition of the pipeline and its
protective coating. Testing consists of hydrostatic testing, internal electronic
testing, or direct assessment of the piping. In addition to the pipeline
integrity tests, pipeline companies must implement a qualification program to
make certain that employees are properly trained. In December 2003, the U.S.
Department of Transportation issued a final rule requiring pipeline operators to
develop integrity management programs for gas transportation pipelines. The
final rule requires pipeline operators to perform ongoing assessments of
pipeline integrity; identify and characterize applicable threats to pipeline
segments that could impact a high consequence area; improve data collection,
integration and analysis; repair and remediate the pipeline, as necessary; and
implement preventive and mitigation actions. This rule incorporates the
requirements of the PSIA.
In 2009,
the U.S. Department of Transportation issued a final rule (known as “Control
Room Management Rule”) requiring pipeline operators to institute certain control
room procedures that address human factors and alarm management. Prior to
start-up of the pipeline, Cheniere developed written Control Room Operating
Procedures consistent with the then-proposed rule. We are reviewing the manual
to assure full compliance with the final rule. We are required to develop
the procedures by August 1, 2011 and to implement the procedures by February 1,
2012.
Energy
Policy Act of 2005
The EPAct
and the FERC’s policies promulgated thereunder contain numerous provisions
relevant to the natural gas industry and to interstate pipelines. See “—LNG
Receiving Terminal Governmental Regulation.”
Natural
Gas Pipeline Environmental Regulation
Our
natural gas pipeline business is subject to the same federal, state and local
laws and regulations relating to the protection of the environment that are
applicable to our LNG receiving terminals. See “—LNG Receiving Terminal
Environmental Regulation” above.
Our
wholly-owned subsidiary, Cheniere Marketing, is engaged in the LNG and natural
gas marketing business and is seeking to monetize the 2.0 Bcf/d of
regasification capacity at the Sabine Pass LNG receiving terminal which is its
principal asset. Cheniere Marketing is seeking to enter into
long-term TUAs; develop a portfolio of long-term, short-term, and spot LNG
purchase agreements; and enter into business relationships for the domestic
marketing of natural gas that is imported by Cheniere Marketing as LNG to the
Sabine Pass LNG receiving terminal.
9
In 2009,
Cheniere Marketing began purchasing, transporting and unloading commercial LNG
cargos into the Sabine Pass LNG receiving terminal and has used certain hedging
strategies to maximize margins on these cargos. In addition, Cheniere
Marketing has continued to enter into various business relationships to
facilitate importing commercial LNG cargos.
LNG
and Natural Gas Marketing Competition
Our LNG
purchase efforts compete for supplies of LNG with:
|
|
•
|
large,
multinational and national companies with longer operating histories, more
development experience, greater name recognition, larger staffs and
substantially greater financial, technical and marketing
resources;
|
|
|
•
|
oil
and gas producers who sell or control LNG derived from their international
oil and gas properties; and
|
|
|
•
|
purchasers
located in other countries, in which prevailing market prices can be
substantially different than those in the
U.S.
|
Our
natural gas marketing efforts compete for sales of natural gas with a variety of
competitors including:
|
|
•
|
major
integrated marketers who have large amounts of capital to support their
marketing operations and offer a full-range of services and market
numerous products other than natural
gas;
|
|
|
•
|
producer
marketers who sell their own natural gas production or the production of
their affiliated natural gas production
company;
|
|
|
•
|
small
geographically focused marketers who focus on marketing natural gas for
the geographic area in which their affiliated distributor operates;
and
|
|
|
•
|
aggregators
who gather small volumes of natural gas from various sources, combine them
and sell the larger volumes for more favorable prices and terms than would
be possible selling the smaller volumes
separately.
|
LNG
and Natural Gas Marketing Governmental Regulation
In 1992
and 1993, the FERC concluded that sellers of short-term or long-term natural gas
supplies would not have market power over the sale for resale of natural gas.
The FERC established light-handed regulation over sales for resale of natural
gas and adopted regulations granting blanket certificates to allow entities
selling natural gas to make interstate sales for resale at negotiated rates. In
2003, the FERC amended the blanket marketing certificates to require that all
sellers adhere to a code of conduct with respect to natural gas sales. The code
of conduct addresses such matters as natural gas withholding, manipulation of
market prices, communication of accurate information and record
retention.
The EPAct
contains provisions intended to prohibit the manipulation of the natural gas
markets and is applicable to our LNG and natural gas marketing business as well.
See “—LNG Receiving Terminal Business Governmental Regulations.”
The
prices at which we will sell natural gas are not regulated, insofar as the
interstate market is concerned and, for the most part, are not subject to state
regulation. We are permitted to make sales of natural gas for resale in
interstate commerce pursuant to a blanket marketing certificate automatically
granted by the FERC. Our sales of natural gas will be affected by the
availability, terms and cost of pipeline transportation. As noted above, under
“—Natural Gas Pipeline Business—Natural Gas Pipeline Governmental Regulation,”
the price and terms of access to pipeline transportation are subject to
extensive federal and state regulation.
Our focus
is primarily on the development and operation of LNG-related
businesses. However, our prior business focus was on oil and gas
exploration, development and exploitation, and we have retained certain oil and
gas interests in the form of working interests, overriding royalty interests (a
share of the hydrocarbons produced from an oil and gas property, free of the
expense of production) and back-in working interests (whereby we retain a
reversion right to a working interest in a well at payout but bear none of the
cost of drilling the initial well). At December 31, 2009, we had interests
in 13 active wells, including 3 working interests and 13 overriding royalty
interests. Three wells have both a working and overriding royalty
interest. There are no plugging and abandonment costs expected in
2010. As a result of the lack of materiality to our consolidated financial
statements taken as a whole, our oil and gas exploration, development and
exploitation activities have been excluded as a separately disclosed operating
segment.
10
Our
assets are generally held by or under our operating subsidiaries. We conduct
most of our operations through these subsidiaries, including our operations
relating to the development and operation of our LNG receiving terminal
business, the development and operation of our pipeline business and our
marketing business.
We had
196 full-time employees at February 17, 2010, including 98 employees who
directly supported Sabine Pass LNG’s operations. We consider our
current employee relations to be favorable.
Our
principal executive offices are located at 700 Milam Street, Suite 800, Houston,
Texas 77002, and our telephone number is (713) 375-5000. Our internet
address is http://www.cheniere.com. We provide public access to our annual
reports on Form 10-K, quarterly reports on Form 10-Q, current reports on Form
8-K, and amendments to these reports as soon as reasonably practicable after we
electronically file those materials with, or furnish those materials to, the
Securities and Exchange Commission (“SEC”) under the Exchange Act. These reports
may be accessed free of charge through our internet website. We make our website
content available for informational purposes only. The website should not be
relied upon for investment purposes, nor is it incorporated by reference into
this Form 10-K.
We will
also make available to any stockholder, without charge, copies of our Annual
Report on Form 10-K as filed with the SEC. For copies of this, or any other
filing, please contact: Cheniere Energy, Inc., Investor Relations Department,
700 Milam Street, Suite 800, Houston, Texas 77002 or call (713) 562-5000. In
addition, the public may read and copy any materials we file with the SEC at the
SEC’s Public Reference Room at 100 F Street, N.E., Room 1580, Washington, DC
20549. The public may obtain information on the operation of the Public
Reference Room by calling the SEC at 1-800-SEC-0330. The SEC maintains an
internet site (www.sec.gov) that contains reports, proxy and information
statements and other information regarding issuers, like us, that file
electronically with the SEC.
11
The
following are some of the important factors that could affect our financial
performance or could cause actual results to differ materially from estimates
contained in our forward-looking statements. We may encounter risks in addition
to those described below. Additional risks and uncertainties not currently known
to us, or that we currently deem to be immaterial, may also impair or adversely
affect our business, results of operation, financial condition, liquidity and
prospects.
The risk
factors in this report are grouped into the following categories:
|
|
•
|
Risks
Relating to Our Financial Matters;
|
|
|
•
|
Risks
Relating to Our LNG Receiving Terminal
Business;
|
|
|
•
|
Risks
Relating to Our Natural Gas Pipeline
Business;
|
|
|
•
|
Risks
Relating to Our LNG and Natural Gas Marketing
Business;
|
|
|
•
|
Risks
Relating to Our LNG Businesses in General;
and
|
|
|
•
|
Risks
Relating to Our Business in
General.
|
Our
existing level of cash resources, negative operating cash flow, and debt could
cause us to have inadequate liquidity and could materially and adversely affect
our business, financial condition and prospects
As of
December 31, 2009, we had $88.4 million of cash and cash equivalents and
$221.2 million of restricted cash and cash equivalents and we had $3.1 billion
of total debt outstanding on a consolidated basis (before debt discounts). Our
ability to generate positive cash flow and achieve profitability, so as to
enhance our liquidity position in the future and be able to repay or refinance
our debt, is subject to a number of risks, including those discussed in these
Risk Factors.
We
have a significant amount of debt which we may be unable to repay, refinance, or
extend on commercially reasonable terms or at all, which could materially and
adversely affect our business, financial condition and prospects.
As of
December 31, 2009, we had $3.1 billion of total consolidated indebtedness
(before debt discounts). Approximately $250 million of our debt plus
accrued interest, which is accruing at our option in lieu of cash interest
payments at a rate of 12% per year, will mature at the election of the
lenders on August 15, 2011, our earliest potential debt maturity
date. We do not currently have financial resources, and may not be able to
access external financial resources, sufficient to enable us to repay our
earliest maturing debt or our subsequently maturing debt. If we are unable
to refinance, extend or otherwise satisfy our earliest maturing debt,
we may seek to reorganize under the protection of available reorganization
statutes, and may make such a determination at a time prior to our earliest
potential debt maturity date.
Even
if we are able to repay, refinance, or extend our debt, the terms required may
adversely affect our business.
In order
to obtain many types of financing, we may have to accept terms that are
disadvantageous to us or that may have an adverse impact on our current or
future business, operations or financial condition. For example:
|
|
•
|
borrowings,
debt issuances, or extensions of debt maturities may subject us to certain
restrictive covenants, including covenants restricting our ability to
raise additional capital or cross-defaults to our other
indebtedness;
|
|
|
•
|
borrowings
or debt issuances at the project level may subject the project entity to
restrictive covenants, including covenants restricting its ability to make
distributions to us or limiting our ability to sell our interests in such
entity;
|
|
|
•
|
offerings
of our equity securities could cause substantial dilution for holders of
our common stock and Series B Preferred
Stock;
|
|
|
•
|
additional
sales of interests in our projects would reduce our interest in future
revenues; and
|
|
|
•
|
the
prepayment of terminal use fees by, or a business development loan from,
prospective customers would reduce future revenues once an LNG receiving
terminal commence operations.
|
12
Our
substantial indebtedness could adversely affect our ability to operate our
business and prevent us from satisfying or refinancing our debt
obligations.
Our
substantial indebtedness could have important adverse consequences,
including:
|
|
•
|
limiting
our ability to attract customers;
|
|
|
•
|
limiting
our ability to compete with other companies that are not as highly
leveraged;
|
|
|
•
|
limiting
our flexibility in and ability to plan for or react to changing market
conditions in our industry and to economic downturns, and making us more
vulnerable than our less leveraged competitors to an industry or economic
downturn;
|
|
|
•
|
limiting
our ability to use operating cash flow in other areas of our business
because we must dedicate a substantial portion of these funds to service
debt, including indebtedness that we may incur in the
future;
|
|
|
•
|
limiting
our ability to obtain additional financing to fund our capital
expenditures, working capital, acquisitions, debt service requirements or
liquidity needs for general business or other purposes;
and
|
|
|
•
|
resulting
in a material adverse effect on our business, results of operations and
financial condition if we are unable to service or refinance our
indebtedness or obtain additional financing, as
needed.
|
Our
substantial indebtedness and the restrictive covenants contained in our debt
agreements may not allow us the flexibility that we need to operate our business
in an effective and efficient manner and may prevent us from taking advantage of
strategic and financial opportunities that would benefit our
business.
If we are
unsuccessful in operating our business due to our substantial indebtedness or
other factors, we may be unable to repay, refinance, or extend our indebtedness
on commercially reasonable terms or at all.
We
have not been profitable historically, and we have not had positive operating
cash flow. Our ability to achieve profitability and generate positive operating
cash flow in the future is subject to significant uncertainty.
We had
net losses of $161.5 million and $373.0 million (as adjusted) for the years
ended December 31, 2009 and 2008, respectively. Additionally, our net cash
flow used in operating activities was $97.9 million and $142.1 million for the
years ended December 31, 2009 and 2008, respectively. In the future,
we may incur operating losses and experience negative operating cash
flow. We may not be able to reduce costs, increase revenues, or
reduce our debt service obligations sufficient to maintain our cash resources
which could cause us to have inadequate liquidity to continue our
business.
Our
ability to generate needed amounts of cash is substantially dependent upon our
TUAs with two third-party Sabine Pass LNG customers, and we will be materially
and adversely affected if either customer fails to perform its TUA obligations
for any reason.
Our
future results and liquidity are dependent upon performance by Chevron and
Total, each of which has entered into a TUA with Sabine Pass LNG and agreed to
pay us approximately $125 million annually. We are dependent on each customer’s
continued willingness and ability to perform its obligations under its TUA. We
are also exposed to the credit risk of the guarantors of these customers’
obligations under their respective TUAs in the event that we must seek recourse
under a guaranty. If any customer fails to perform its obligations under its
TUA, our business, results of operations, financial condition and prospects
could be materially and adversely affected, even if we were ultimately
successful in seeking damages from that customer or its guarantor for a breach
of the TUA.
Each
customer’s TUA for capacity at the Sabine Pass LNG receiving terminal is subject
to termination under certain circumstances.
The
long-term TUAs with each of Total and Chevron contain various termination
rights. For example, each customer may terminate its TUA if the Sabine Pass LNG
receiving terminal experiences a force majeure delay for
longer than 18 months, fails to redeliver a specified amount of natural gas in
accordance with the customer’s redelivery nominations or fails to accept and
unload a specified number of the customer’s proposed LNG cargoes. We may not be
able to replace these TUAs on desirable terms, or at all, if they are
terminated.
Our
ability to generate needed amounts of cash is also substantially dependent upon
our ability to commercially exploit the capacity at the Sabine Pass LNG terminal
that we have reserved for our own account
Our
ability to generate positive operating cash flow and achieve profitability in
the future is also significantly dependent upon our ability to commercially
exploit the TUA capacity that our wholly owned subsidiary, Cheniere Marketing,
LLC (“Cheniere
13
Marketing”),
has reserved at the Sabine Pass LNG receiving terminal. As discussed below under
“—Risks Relating to Our LNG and Natural Gas Marketing Business—We may not be
able to commercially exploit the capacity we have reserved at the Sabine Pass
LNG receiving terminal”, there are significant risks attendant to Cheniere
Marketing’s future ability to generate operating cash flow. Failure by Cheniere
Marketing to succeed in commercially exploiting its reserved TUA capacity at the
Sabine Pass LNG receiving terminal could materially and adversely affect our
business, results of operations, financial condition and prospects.
Operation
of the Sabine Pass LNG receiving terminal, and other LNG receiving terminals
that we may construct, involves significant risks.
The
Sabine Pass LNG receiving terminal faces operational risks, including the
following:
|
|
•
|
performing
below expected levels of
efficiency;
|
|
|
•
|
breakdown
or failures of equipment or
systems;
|
|
|
•
|
operational
errors by vessel or tug operators or
others;
|
|
|
•
|
operational
errors by us or any contracted facility operator or
others;
|
|
|
•
|
labor
disputes; and
|
|
|
•
|
weather-related
interruptions of operations.
|
To
maintain the cryogenic readiness of the Sabine Pass LNG receiving terminal or to
commission and test our proposed LNG receiving terminals, we may need to
purchase and process LNG. The cost of such LNG may exceed our estimates, and we
may not be able to acquire it at an affordable price or at all. Furthermore,
even if we are able to acquire LNG, we may not be able to resell the regasified
LNG for a profit or at all.
LNG
storage tanks and other equipment at our LNG receiving terminals must be
maintained in a state of cryogenic readiness for conducting operations and to
provide services under our TUAs. Our failure to obtain LNG, LNG vessels, or
both, on economical terms, or our inability to finance the purchase of LNG,
could provide our TUA customers with the opportunity to interrupt or terminate
their payment under their respective TUAs. Any of these occurrences could have a
material adverse effect on our business, results of operations, financial
condition and prospects.
Risks
associated with acquiring LNG include the following:
|
|
•
|
we
may be unable to enter into contracts for the purchase of the LNG, and may
be unable to obtain vessels to deliver such LNG, on terms reasonably
acceptable to us or at all;
|
|
|
•
|
we
may bear the commodity price risk associated with purchasing the LNG,
holding it in inventory for a period of time and selling the regasified
LNG; and
|
|
|
•
|
we
may be unable to obtain financing for the purchase and shipment of the LNG
on terms that are reasonably acceptable to us or at
all.
|
For our
proposed LNG receiving terminals, LNG storage tanks and other equipment must
undergo a commissioning and testing process before commencement of operations.
The commissioning process requires a substantial quantity of LNG as well as
access to adequate LNG vessels to deliver the LNG. We usually include in our
construction cost estimates amounts to cover our estimated net costs of
acquiring the LNG necessary to complete the commissioning and testing process at
our LNG receiving terminals. Our actual cost to obtain LNG necessary for the
commissioning and testing process could exceed our estimates, and the overrun
could be significant.
We
may be required to purchase natural gas to provide fuel at the Sabine Pass LNG
receiving terminal, which would increase operating costs and could have a
material adverse effect on our results of operations.
Sabine Pass LNG’s
three TUAs provide for an in-kind deduction of 2% of the LNG delivered to the
Sabine Pass LNG receiving terminal, which we use primarily as fuel for
revaporization and self-generated power and to cover natural gas unavoidably
lost at the facility. There is a risk that this 2% in-kind deduction will be
insufficient for these needs and that we will have to purchase additional
natural gas from third parties. We will bear the cost and risk of changing
prices for any such fuel.
14
Hurricanes
or other disasters could adversely affect us.
In August
and September of 2005, Hurricanes Katrina and Rita damaged coastal and inland
areas located in Texas, Louisiana, Mississippi and Alabama. Construction at the
Sabine Pass LNG receiving terminal site was temporarily suspended in connection
with Hurricane Katrina, as a precautionary measure. Approximately three weeks
after the occurrence of Hurricane Katrina, the terminal site was again secured
and evacuated in anticipation of Hurricane Rita, the eye of which made landfall
to the east of the site. As a result of these 2005 storms and related matters,
the Sabine Pass LNG receiving terminal experienced construction delays and
increased costs. In September 2008, Hurricane Ike struck the Texas and
Louisiana coast, and we experienced damage at the Sabine Pass LNG receiving
terminal.
Future
storms and related storm activity and collateral effects, or other disasters
such as explosions, fires, floods or accidents, could result in damage to, or
interruption of operations at, the Sabine Pass LNG receiving terminal or related
infrastructure, as well as delays or cost increases in construction of our
proposed LNG receiving terminals. If there are changes in the global
climate, storm frequency and intensity may increase; should it result in rising
seas, our coastal operations would be impaired.
Failure
to obtain and maintain approvals and permits from governmental and regulatory
agencies with respect to the development and operation of our LNG receiving
terminals could impede operations and construction and could have a material
adverse effect on us.
The
design, construction and operation of our LNG receiving terminals is a highly
regulated activity. The FERC’s approval under Section 3 of the NGA, as well
as several other material governmental and regulatory approvals and permits, are
required in order to construct and operate an LNG receiving terminal. Although
we have obtained all of the necessary authorizations to construct and operate
the Sabine Pass LNG receiving terminal, such authorizations are subject to
ongoing conditions imposed by regulatory agencies, and additional approval and
permit requirements may be imposed. Failure to obtain and maintain any of these
approvals and permits could have a material adverse effect on our business,
results of operations, financial condition and prospects.
We
may not be able to enter into satisfactory TUAs with third-party customers for
regasification capacity at our proposed LNG receiving terminals, as has been our
historical practice. We may change our business strategy regarding how and when
we market LNG receiving terminal capacity.
Our
current business strategy calls for us to enter into long-term TUAs for a
portion of the regasification capacity at our proposed LNG receiving terminals,
including a commitment to pay capacity reservation fees. The portion of our
total regasification capacity that we plan to commit under such long-term TUAs
has changed in the past and may change in the future for various reasons,
including responding to market factors or perceived opportunities that we
believe may be available to us. Our ability to obtain financing for a proposed
LNG receiving facility may be contingent on our ability to enter into commercial
agreements in advance of the commencement of construction. To date, we have not
entered into any third-party agreements for either of our proposed LNG receiving
terminals, and we may experience difficulty attracting additional
customers.
We may
also change our business strategy due to our inability to enter into agreements
with additional customers or based on our views regarding future prices, demand
and supply of natural gas and regasification capacity. If our efforts to market
LNG receiving terminal and related pipeline capacity are not successful, our
business, results of operations, financial condition and prospects could be
materially and adversely affected.
Our
existing and proposed pipelines will be dependent upon a few potential
customers, and our pipeline business could be materially and adversely affected
if we lost any one of those customers.
We do not
currently have any third-party, firm transportation customers for our existing
or proposed pipelines. Failure to obtain any third-party, firm transportation
customers could have a material adverse impact on our business.
Our
natural gas pipelines, including their FERC gas tariffs, are subject to FERC
regulation.
Our FERC
tariffs contain pro forma transportation agreements, which must be filed and
approved by FERC. Before we enter into a transportation agreement with a shipper
that contains a term that materially deviates from our tariff, we must seek FERC
approval. The FERC may approve the material deviation in the transportation
agreement; however, in that case, the materially deviating terms must be made
available to our other similarly-situated customers. If we fail to seek FERC
approval of a transportation agreement that materially deviates from our tariff,
or if FERC audits our contracts and finds deviations that appear to be unduly
discriminatory, FERC could conduct a formal enforcement investigation, resulting
in serious penalties and/or onerous ongoing
15
compliance
obligations.
Should we
fail to comply with all applicable FERC-administered statutes, rules,
regulations and orders, we could be subject to substantial penalties and fines.
Under the Energy Policy Act of 2005, the FERC has civil penalty authority under
the NGA to impose penalties for current violations of up to $1.0 million per day
for each violation.
The FERC
could change its current ratemaking policies, and those changes could have
adverse effects on our proposed pipelines.
Pipeline
safety integrity programs and repairs may impose significant costs and
liabilities on us.
The
Federal Office of Pipeline Safety has issued a final rule requiring pipeline
operators to develop integrity management programs to comprehensively evaluate
certain areas along their pipelines and to take additional measures to protect
pipeline segments located in what the rule refers to as “high consequence areas”
where a leak or rupture could potentially do the most harm. The final rule
requires operators to:
|
|
•
|
perform
ongoing assessments of pipeline
integrity;
|
|
|
•
|
identify
and characterize applicable threats to pipeline segments that could impact
a high consequence area;
|
|
|
•
|
improve
data collection, integration and
analysis;
|
|
|
•
|
repair
and remediate the pipeline as necessary;
and
|
|
|
•
|
implement
preventive and mitigating actions.
|
We are
required to maintain pipeline integrity testing programs that are intended to
assess pipeline integrity. The rule, or an increase in public expectations for
pipeline safety, may require additional reporting and more frequent inspection
or testing of our pipeline facilities. Any repair, remediation, preventative or
mitigating actions may require significant capital and operating expenditures.
Should we fail to comply with the Office of Pipeline Safety’s rules and related
regulations and orders, we could be subject to penalties and fines.
Any
reduction in the capacity of, or the allocations to, interconnecting,
third-party pipelines could cause a reduction of volumes transported in our
pipelines, which would adversely affect our revenues and cash flow.
We will
be dependent upon third-party pipelines and other facilities to provide delivery
options to and from our pipelines. If any pipeline connection were to become
unavailable for volumes of natural gas due to repairs, damage to the facility,
lack of capacity or any other reason, our ability to continue shipping natural
gas to end markets could be restricted, thereby reducing our revenues. Any
permanent interruption at any key pipeline interconnect which caused a material
reduction in volumes transported on our pipelines could have a material adverse
effect on our business, results of operations and financial
condition.
Failure
to obtain and maintain approvals and permits from governmental and regulatory
agencies with respect to the development and operation of our natural gas
pipelines would have a detrimental effect on us and our pipeline
projects.
The
design, construction and operation of natural gas pipelines and the
transportation of natural gas are all highly regulated activities. FERC approval
under Section 7 of the NGA, as well as several other material state
governmental and regulatory approvals and permits, are required in order to
construct and operate a pipeline. We must also obtain several other material
governmental and regulatory approvals and permits in order to construct and
operate pipelines, including several under the Clean Air Act and the Clean Water
Act from the U.S. Army Corps of Engineers and the Louisiana Department of
Environmental Quality. We have no control over the timing of the review and
approval process nor can we predict the outcome of the process. We do not know
whether or when any such approvals or permits can be obtained, or whether or not
any third parties will attempt to interfere with our ability to obtain and
maintain such permits or approvals. If we are unable to obtain and maintain the
necessary approvals and permits, we may not be able to recover our investment in
the projects. Failure to obtain and maintain any of these approvals and permits
could have a material adverse effect on our business, results of operations,
financial condition and prospects.
Our
pipeline business could be materially and adversely affected if we lose the
right to situate our pipelines on property owned by third parties.
We do not
own the land on which our pipelines are situated, and we are subject to the
possibility of increased costs to retain necessary land use rights. If we were
to lose these rights or be required to relocate our pipelines, our business
could be materially and adversely affected.
16
We
may be unable to commercially exploit the capacity at the Sabine Pass LNG
terminal that we have reserved for our own account.
The
success of our LNG and natural gas marketing business will be significantly
dependent upon our ability to commercially exploit the TUA capacity that
Cheniere Marketing has reserved at the Sabine Pass LNG receiving terminal. That,
in turn, is subject to substantial risks, including the following:
|
|
•
|
Cheniere
Marketing does not have unconditional agreements or arrangements for any
supplies of LNG, or for the utilization of capacity that it has contracted
for under its TUA with us and may not be able to obtain such agreements or
arrangements on economical terms, or at
all;
|
|
|
•
|
Cheniere
Marketing does not have unconditional commitments from customers for the
purchase of the natural gas it proposes to sell from our LNG receiving
terminal, and it may not be able to obtain commitments or other
arrangements on economical terms, or at
all;
|
|
|
•
|
in
order to arrange for supplies of LNG, and for transportation, storage and
sales of natural gas, Cheniere Marketing will require significant credit
support and funding, which we may not be able to obtain on terms that are
acceptable to us, or at all; and
|
|
|
•
|
even
if Cheniere Marketing is able to arrange for and finance supplies and
transportation of LNG to the Sabine Pass LNG receiving terminal, and for
transportation, storage and sales of natural gas to customers, it may
experience negative cash flows and adverse liquidity effects due to
fluctuations in supply, demand and price for LNG, for transportation of
LNG, for natural gas and for storage and transportation of natural
gas.
|
Cheniere
Marketing’s business plan may be limited by access to capital and its lack of a
credit rating. In addition, Cheniere Energy, Inc. has a non-investment grade
corporate rating of CCC+ from Standard and Poor’s, which limits our ability to
enhance the creditworthiness of Cheniere Marketing. These factors create
financial obstacles and exacerbate the risk that Cheniere Marketing will not be
able to enter into commercial arrangements with third parties to commercially
exploit all of its capacity at the Sabine Pass LNG receiving terminal on
commercially advantageous terms or at all.
In
pursuing each aspect of our plan to commercially exploit Cheniere Marketing’s
TUA capacity at the Sabine Pass LNG receiving terminal, we will encounter
competition, including competition from major energy companies and other
competitors with significantly greater resources.
Any or
all of these factors, as well as risk factors described elsewhere and other risk
factors that we may not be able to anticipate, control or mitigate, could have a
material adverse effect on our ability to commercially exploit Cheniere
Marketing’s TUA capacity at the Sabine Pass LNG receiving terminal, which in
turn could materially and adversely affect our business, results of operations,
financial condition, prospects and liquidity.
We
have not yet fully commercialized our LNG receiving capacity at the Sabine Pass
LNG receiving terminal
We
continue to develop our LNG and natural gas marketing business. The
ability of our LNG and natural gas marketing business to utilize all of our 2.0
Bcf/d of LNG regasification capacity at the Sabine Pass LNG receiving terminal
will depend upon whether we can successfully enter into TUAs for some or all of
our reserved capacity, enter into term LNG purchase agreements from our reserved
capacity, or purchase spot cargoes. We may encounter many expenses, delays,
problems and difficulties that we have not anticipated and for which we have not
planned in developing and operating our LNG and natural gas marketing
business.
Our
use of hedging arrangements may adversely affect our future results of
operations or liquidity.
To reduce
our exposure to fluctuations in the price, volume, and timing risk associated
with the marketing of LNG and natural gas, we use futures, swaps and option
contracts traded or cleared on the Intercontinental Exchange (ICE) and NYMEX, or
over-the-counter options and swaps with other natural gas merchants and
financial institutions. Hedging arrangements would expose us to risk of
financial loss in some circumstances, including when:
|
|
•
|
expected
supply is less than the amount
hedged;
|
|
|
•
|
the
counterparty to the hedging contract defaults on its contractual
obligations; or
|
|
|
•
|
there
is a change in the expected differential between the underlying price in
the hedging agreement and actual prices
received.
|
17
Our
hedging arrangements may also limit the benefit that we would receive from
increases in the prices for natural gas. The use of derivatives also may require
the posting of cash collateral with counterparties, which can impact working
capital when commodity prices change.
The
limited capital resources and credit available to our LNG and natural gas
marketing business limit our ability to develop that business.
We have
limited the amount of capital available to our LNG and natural gas marketing
business. The business also currently has limited access to third-party sources
of financing. Other investment-grade marketing companies have greater financial
resources than we do. Our LNG and natural gas marketing business continues to
develop and implement its business strategy and may not generate sufficient
revenues and cash flows to cover the significant fixed costs of the
business.
Our
exposure to the performance and credit risks of counterparties under agreements
may adversely affect our results of operations, liquidity and access to
financing.
Our LNG
and natural gas marketing business involves our entering into various purchase
and sale, hedging, and other transactions with numerous third parties (commonly
referred to as “counterparties”). In such arrangements, we are exposed to the
performance and credit risks of our counterparties, including the risk that one
or more counterparties fails to perform its obligation to make deliveries of
commodities and/or to make payments. These risks may increase during periods of
commodity price volatility. Defaults by suppliers and other counterparties may
adversely affect our results of operations, liquidity and access to
financing.
Failure
of imported LNG to be a competitive source of energy for North American markets
could materially and adversely affect our business, financial condition, results
of operations and prospects.
The
success of our LNG receiving terminal business, our natural gas pipeline
business and our LNG and natural gas marketing business (collectively, our “LNG
businesses”), is primarily dependent upon LNG being a competitive source of
energy in North America.
In North
America, due mainly to a historically abundant supply of natural gas, imported
LNG has not historically been a major energy source. Our business plan is based,
in part, on the belief that LNG can be produced internationally and delivered to
North America at a lower cost than the cost to produce some domestic supplies of
natural gas, or other alternative energy sources. Through the use of improved
exploration technologies, additional sources of natural gas may be discovered in
North America, which could further increase the available supply of natural gas
and could result in natural gas being available at a lower cost than imported
LNG. In addition to natural gas, LNG also competes in North America with other
sources of energy, including coal, oil, nuclear, hydroelectric, wind and solar
energy.
Other
continents have a longer history of importing LNG and, due to their geographic
proximity to LNG producers and limited pipeline access to natural gas supplies,
may be willing and able to pay more for LNG, thereby reducing or eliminating the
supply of LNG available in North American markets. Current and futures prices
for natural gas in markets that compete with North America have been higher than
prices for natural gas in North America, which has adversely affected the volume
of LNG imports into North America. If LNG deliveries to North America continue
to be constrained due to stronger demand from these competing markets, our
ability and the ability of existing and prospective third-party TUA customers to
import LNG into North America on a profitable basis may be adversely
affected.
Political
instability in foreign countries that have supplies of natural gas, or strained
relations between such countries and the U.S., may also impede the willingness
or ability of LNG suppliers and merchants in such countries to export LNG to the
U.S. Furthermore, some foreign suppliers of LNG may have economic or other
reasons to direct their LNG to non-U.S. markets or to competitors’ LNG receiving
terminals in the U.S.
As a
result of these and other factors, LNG may not be a competitive source of energy
in North America. The failure of LNG to be a competitive supply alternative to
domestic natural gas, oil and other alternative energy sources could adversely
affect our ability to enter into additional TUAs with customers and could also
impede the ability to import LNG into North America on a commercial basis of us
and our TUA customers, which could inhibit our growth and cause us operating
losses. Any significant impediment to the ability to import LNG into the United
States generally or to our LNG receiving terminals specifically could have a
material adverse effect on us, on our third-party LNG receiving terminal
customers, and on our LNG businesses, results of operations, financial condition
and prospects.
18
Decreases
in the demand for and price of natural gas could lead to reduced development of
LNG projects worldwide, which could adversely affect our LNG businesses and the
performance of our TUA customers, and could have a material adverse effect on
our business, results of operations, financial condition, liquidity and
prospects.
The
development of domestic LNG receiving terminals and LNG projects generally is
based on assumptions about the future price of natural gas and the availability
of imported LNG. Natural gas prices have been, and are likely to continue to be,
volatile and subject to wide fluctuations in response to one or more of the
following factors:
|
|
•
|
relatively
minor changes in the supply of, and demand for, natural gas in relevant
markets;
|
|
|
•
|
political
conditions in international natural gas producing
regions;
|
|
|
•
|
the
extent of domestic production and importation of natural gas in relevant
markets;
|
|
|
•
|
the
level of demand for LNG and natural gas in relevant markets, including the
effects of economic downturns or
upturns;
|
|
|
•
|
weather
conditions;
|
|
|
•
|
the
competitive position of natural gas as a source of energy compared with
other energy sources; and
|
|
|
•
|
the
effect of government regulation on the production, transportation and sale
of natural gas.
|
Adverse
trends or developments affecting any of these factors could result in decreases
in the price of natural gas, leading to reduced development of LNG projects
worldwide. Such reductions could adversely affect our LNG businesses and the
performance of our TUA customers, and could have a material adverse effect on
our business, results of operations, financial condition, liquidity and
prospects.
Cyclical
or other changes in the demand for LNG regasification capacity may adversely
affect our LNG businesses and the performance of our TUA customers, and could
reduce our operating revenues and may cause us operating losses.
The
economics of our LNG businesses could be subject to cyclical swings, reflecting
alternating periods of under-supply and over-supply of LNG importation capacity
and available natural gas, principally due to the combined impact of several
factors, including:
|
|
•
|
additions
to competitive regasification capacity in North America, Europe, Asia and
other markets, which could divert LNG from our existing and proposed LNG
receiving terminals;
|
|
|
•
|
insufficient
LNG liquefaction capacity
worldwide;
|
|
|
•
|
insufficient
LNG tanker capacity;
|
|
|
•
|
reduced
demand and lower prices for natural
gas;
|
|
|
•
|
increased
natural gas production deliverable by pipelines, which could suppress
demand for LNG;
|
|
|
•
|
cost
improvements that allow competitors to offer LNG regasification services
at reduced prices;
|
|
|
•
|
changes
in supplies of, and prices for, alternative energy sources such as coal,
oil, nuclear, hydroelectric, wind and solar energy, which may reduce the
demand for natural gas;
|
|
|
•
|
changes
in regulatory, tax or other governmental policies regarding imported LNG,
natural gas or alternative energy sources, which may reduce the demand for
imported LNG and/or natural gas;
|
|
|
•
|
adverse
relative demand for LNG in North America compared to other markets, which
may decrease LNG imports into North America;
and
|
|
|
•
|
cyclical
trends in general business and economic conditions that cause changes in
the demand for natural gas.
|
These
factors could materially and adversely affect our ability, and the ability of
current and prospective TUA customers, to procure supplies of LNG to be imported
into North America and to procure customers for regasified LNG at economical
prices, or at all.
Our
LNG businesses face competition, including competing LNG receiving terminals and
related pipelines from competitors with far greater resources.
Many
competing companies have secured access to, or are pursuing development or
acquisition of, LNG import infrastructure to serve the U.S. natural gas market.
Some industry analysts have predicted substantial excess LNG receiving capacity
in North America for at least several years based on terminals currently in
operation or under construction. Competitors faced by our LNG businesses in the
U.S. include major energy corporations (e.g., BG Group plc, BP plc, Chevron
Corporation, ConocoPhillips and Dow Chemical). In
19
addition,
other competitors have developed or reopened additional LNG receiving terminals
in Europe, Asia and other markets, which also compete with our existing and
proposed LNG facilities. Almost all of these competitors have longer operating
histories, more development experience, greater name recognition, larger staffs
and substantially greater financial, technical and marketing resources and
access to LNG supply than we do. The superior resources that these competitors
have available for deployment could allow them to compete successfully against
our LNG businesses, which could have a material adverse effect on our business,
results of operations, financial condition, liquidity and
prospects.
Insufficient
development of additional LNG liquefaction capacity worldwide could adversely
affect our LNG businesses and the performance of our TUA customers, and could
have a material adverse effect on our business, results of operations, financial
condition, liquidity and prospects.
Commercial
development of an LNG liquefaction facility takes a number of years and requires
substantial capital investment. Many factors could negatively affect continued
development of LNG liquefaction facilities, including:
|
|
•
|
increased
construction costs;
|
|
|
•
|
economic
downturns, increases in interest rates or other events that may affect the
availability of sufficient financing for LNG projects on commercially
reasonable terms;
|
|
|
•
|
decreases
in the price of LNG and natural gas, which might decrease the expected
returns relating to investments in LNG
projects;
|
|
|
•
|
the
inability of project owners or operators to obtain governmental approvals
to construct or operate LNG
facilities;
|
|
|
•
|
political
unrest in exporting countries or local community resistance in such
countries to the siting of LNG facilities due to safety, environmental or
security concerns; and
|
|
|
•
|
any
significant explosion, spill or similar incident involving an LNG
liquefaction facility or LNG
carrier.
|
There
may be shortages of LNG vessels worldwide, which could adversely affect our LNG
businesses and the performance of our TUA customers, and could have a material
adverse effect on our business, results of operations, financial condition,
liquidity and prospects.
The
construction and delivery of LNG vessels require significant capital and long
construction lead times, and the availability of the vessels could be delayed to
the detriment of our LNG businesses and our TUA customers because
of:
|
|
•
|
an
inadequate number of shipyards constructing LNG vessels and a backlog of
orders at these shipyards;
|
|
|
•
|
political
or economic disturbances in the countries where the vessels are being
constructed;
|
|
|
•
|
changes
in governmental regulations or maritime self-regulatory
organizations;
|
|
|
•
|
work
stoppages or other labor disturbances at the
shipyards;
|
|
|
•
|
bankruptcy
or other financial crisis of
shipbuilders;
|
|
|
•
|
quality
or engineering problems;
|
|
|
•
|
weather
interference or a catastrophic event, such as a major earthquake, tsunami
or fire; and
|
|
|
•
|
shortages
of or delays in the receipt of necessary construction
materials.
|
Terrorist
attacks or military campaigns may adversely impact our LNG
businesses.
A
terrorist incident involving an LNG facility or LNG carrier may result in delays
in, or cancellation of, construction of new LNG facilities, including our LNG
receiving terminals and related natural gas pipelines, which would increase our
costs and decrease our cash flows. A terrorist incident may also result in
temporary or permanent closure of existing LNG facilities, which could increase
our costs and decrease our cash flows, depending on the duration of the closure.
Operations at our LNG facilities could also become subject to increased
governmental scrutiny that may result in additional security measures at a
significant incremental cost to us. In addition, the threat of terrorism and the
impact of military campaigns may lead to continued volatility in prices for
natural gas that could adversely affect our LNG businesses.
20
Our
initiatives to pursue downstream and upstream opportunities as part of our
overall energy business strategy may not be successful and, even if successful,
could expose us to greater and unanticipated risks.
We may
not be successful in our efforts to pursue any or all of our downstream
opportunities such as natural gas pipeline development or natural gas marketing,
or in our efforts to pursue any or all of our upstream opportunities such as
securing foreign LNG supply arrangements. If we are successful in pursuing one
or more of these downstream or upstream opportunities, we will likely incur
greater risks than we expect to incur in our LNG businesses, and some of those
risks we will not be able to anticipate.
We
are subject to significant operating hazards and uninsured risks, one or more of
which may create significant liabilities and losses for us.
The
construction and operation of our LNG receiving terminals and pipelines are
subject to inherent risks associated with these types of operations, including
explosions, pollution, release of toxic substances, fires, hurricanes and
adverse weather conditions, and other hazards, each of which could result in
significant delays in commencement or interruptions of operations and/or in
damage to or destruction of our facilities or damage to persons and property. In
addition, our operations and the facilities and vessels of third parties on
which our operations are dependent face possible risks associated with acts of
aggression or terrorism.
We do
not, nor do we intend to, maintain insurance against all of these risks and
losses. We may not be able to maintain desired or required insurance in the
future at rates that we consider reasonable. The occurrence of a significant
event not fully insured or indemnified against could have a material adverse
effect on our business, results of operations, financial condition, liquidity
and prospects.
Existing
and future environmental and similar laws and regulations could result in
increased compliance costs or additional operating costs and
restrictions.
Our
business is and will be subject to extensive federal, state and local laws and
regulations that control, among other things, discharges to air and water; the
handling, storage and disposal of hazardous chemicals, hazardous waste, and
petroleum products; and remediation associated with the release of hazardous
substances. Many of these laws and regulations, such as the CAA, the Oil
Pollution Act, the CWA, and the RCRA, and analogous state laws and regulations,
restrict or prohibit the types, quantities and concentration of substances that
can be released into the environment in connection with the construction and
operation of our LNG receiving terminals and pipelines and require us to
maintain permits and provide governmental authorities with access to our
facilities for inspection and reports related to our compliance. Violation of
these laws and regulations could lead to substantial fines and penalties or to
capital expenditures related to pollution control equipment that could have a
material adverse effect on our business, results of operations, financial
condition, liquidity and prospects. CERCLA and similar state laws impose
liability, without regard to fault or the lawfulness of the original conduct,
for the release of certain types or quantities of hazardous substances into the
environment. As the owner and operator of an LNG receiving terminal and
pipeline, we could be liable for the costs of cleaning up hazardous substances
released into the environment and for damage to natural resources.
There are
numerous regulatory approaches currently in effect or being considered to
address greenhouse gases, including possible future U.S. treaty commitments, new
federal or state legislation that may impose a carbon emissions tax or establish
a cap-and-trade program, and regulation by the EPA. For example, the adoption of
frequently proposed legislation implementing a carbon tax on energy sources that
emit carbon dioxide into the atmosphere may have a material adverse effect on
the ability of our customers (i) to import LNG, if imposed on them as
importers of potential emission sources, or (ii) to sell regasified LNG, if
imposed on them or their customers as natural gas suppliers or consumers. In
addition, as we consume retainage gas at the Sabine Pass LNG receiving terminal,
this carbon tax may also be imposed on us directly.
There have also been proposals for a mandatory cap and trade
program to reduce greenhouse gas emissions. In June 2009, the U.S. House of
Representatives passed a comprehensive climate change and energy bill, the
American Clean Energy and Security Act, and the U.S. Senate is considering
similar legislation that would, among other things, impose a nationwide cap on
greenhouse gas emissions and require major sources to obtain “allowances” to
meet that cap. In September 2009, the EPA promulgated a rule requiring certain
emitters of greenhouse gases to monitor and report their greenhouse gas
emissions to the EPA. In addition, in response to the 2007 U.S. Supreme Court
ruling in Massachusetts v. EPA that the EPA has authority to regulate carbon
dioxide emissions under the Clean Air Act, the EPA has issued and is considering
several additional proposals, including one that would require best available
control technology for greenhouse gas emissions whenever certain stationary
sources are built or significantly modified. In addition, two U.S. federal
appeals courts have reinstated lawsuits permitting individuals, state attorneys
general and others to pursue claims against major utility, coal, oil and
chemical companies on the basis that those companies have created a public
nuisance due to their emissions of carbon dioxide. Climate change initiatives
and other efforts to reduce greenhouse gas emissions like
21
those
described above or otherwise may require additional controls on the operation of
our LNG receiving terminals and increased costs to implement and maintain such
controls.
Other
future legislation and regulations, such as those relating to the transportation
and security of LNG imported to the Sabine Pass LNG receiving terminal through
the Sabine Pass Channel, could cause additional expenditures, restrictions and
delays in our business and to our proposed construction, the extent of which
cannot be predicted and which may require us to limit substantially, delay or
cease operations in some circumstances. Revised, reinterpreted or additional
laws and regulations that result in increased compliance costs or additional
operating costs and restrictions could have a material adverse effect on our
business, results of operations, financial condition, liquidity and
prospects.
We
may experience increased labor costs, and the unavailability of skilled workers
or our failure to attract and retain key personnel could adversely affect
us.
We are
dependent upon the available labor pool of skilled employees. We compete with
other energy companies and other employers to attract and retain qualified
personnel with the technical skills and experience required to construct and
operate our LNG receiving terminals and pipelines and to provide our customers
with the highest quality service. A shortage in the labor pool of skilled
workers or other general inflationary pressures or changes in applicable laws
and regulations could make it more difficult for us to attract and retain
personnel and could require an increase in the wage and benefits packages that
we offer, thereby increasing our operating costs. For example, in the aftermaths
of Hurricanes Katrina and Rita, Bechtel and certain subcontractors temporarily
experienced a shortage of available skilled labor necessary to meet the
requirements of the Sabine Pass LNG receiving terminal construction plan. As a
result, we agreed to change orders with Bechtel concerning additional activities
and expenditures to mitigate the hurricanes’ effects on the construction of the
Sabine Pass LNG receiving terminal. Any increase in our operating costs could
materially and adversely affect our business, results of operations, financial
condition and prospects.
We depend
on our executive officers for various activities. We do not maintain key person
life insurance policies on any of our personnel. Although we have arrangements
relating to compensation and benefits with certain of our executive officers, we
do not have any employment contracts or other agreements with key personnel
binding them to provide services for any particular term. The loss of the
services of any of these individuals could seriously harm us.
Our
lack of diversification could have an adverse effect on our financial condition
and results of operations.
Substantially
all of our anticipated revenue in 2010 will be dependent upon one facility, the
Sabine Pass LNG receiving terminal and related pipeline located in southern
Louisiana. Due to our lack of asset and geographic diversification, an adverse
development at the Sabine Pass LNG receiving terminal or pipeline, or in the LNG
industry, would have a significantly greater impact on our financial condition
and results of operations than if we maintained more diverse assets and
operating areas.
We
may engage in operations or make substantial commitments and investments outside
the United States, which would expose us to political, governmental and economic
instability and foreign currency exchange rate fluctuations.
Conducting
operations or making commitments and investments outside of the United States
will cause us to be affected by economic, political and governmental conditions
in the countries where we engage in business. Any disruption caused by these
factors could harm our business. Risks associated with operations, commitments
and investments outside of the United States include risks of:
|
|
•
|
currency
fluctuations;
|
|
|
•
|
war;
|
|
|
•
|
expropriation
or nationalization of assets;
|
|
|
•
|
renegotiation
or nullification of existing
contracts;
|
|
|
•
|
changing
political conditions;
|
|
|
•
|
changing
laws and policies affecting trade, taxation and
investment;
|
|
|
•
|
multiple
taxation due to different tax structures;
and
|
|
|
•
|
the
general hazards associated with the assertion of sovereignty over certain
areas in which operations are
conducted.
|
Because
our reporting currency is the United States dollar, any of our operations
conducted outside the United States would face additional risks of fluctuating
currency values and exchange rates, hard currency shortages and controls on
currency exchange. We would be subject to the impact of foreign currency
fluctuations and exchange rate changes on our reporting for results from those
operations in our consolidated financial statements.
22
Some
of our economic value is derived from our ownership of a minority interest in an
entity over which we exercise no day-to-day control.
We own a
30% limited partner interest in Freeport LNG. Some of our value is attributable
to this investment. In this report, we may use the words “our,” “we” or “us” in
describing this investment or its assets and operations; however, we do not
exercise control over Freeport LNG. The management team of Freeport LNG could
make business decisions without our consent that could impair the economic value
of our investment in Freeport LNG. Any such diminution in the value of our
investment could have an adverse impact on our business, results of operations,
financial condition and prospects.
We
may incur impairments to goodwill or long-lived assets.
We review
our long-lived assets, including goodwill and other intangible assets, for
impairment annually in the fourth quarter or whenever events or changes in
circumstances indicate that the carrying amount of these assets may not be
recoverable. Significant negative industry or economic trends, including a
significant decline in the market price of our common stock, reduced estimates
of future cash flows for our business segments or disruptions to our business
could lead to an impairment charge of our long-lived assets, including goodwill
and other intangible assets. Our valuation methodology for assessing impairment
requires management to make judgments and assumptions based on historical
experience and to rely heavily on projections of future operating performance.
Projections of future operating results and cash flows may vary significantly
from results. In addition, if our analysis results in an impairment to our
goodwill, we may be required to record a charge to earnings in our consolidated
financial statements during a period in which such impairment is determined to
exist, which may negatively impact our results of operations.
We
may have to take actions that are disruptive to our business strategy to avoid
registration under the Investment Company Act of 1940.
The
Investment Company Act of 1940, or Investment Company Act, requires registration
for companies that are engaged primarily in the business of investing,
reinvesting, owning, holding or trading in securities. Registration as an
investment company would subject us to restrictions that are inconsistent with
our fundamental business strategy.
A company
may be deemed to be an investment company if it owns investment securities with
a value exceeding 40% of the value of its total assets (excluding government
securities and cash items) on an unconsolidated basis, unless an exemption or
safe harbor applies. Securities issued by companies other than majority-owned
subsidiaries are generally counted as investment securities for purposes of the
Investment Company Act. We own a minority equity interest in Freeport LNG, which
could be counted as an investment security. We generally plan to invest our
liquid assets in commercial paper or other assets that may be considered
investment securities in order to achieve higher yields from our available funds
than investments in government securities and money market or similar cash
investments would provide.
We
believe that significantly less than 40% of our assets consist of investment
securities. However, if in the future the value of our investment assets,
including our interests in companies that we do not control, were to increase
relative to the value of our controlled subsidiaries, we might be required to
invest some portion of our liquid assets in government securities or cash items
that yield lower returns than our proposed investments, or, in the alternative,
we might be required to divest some of our non-controlled business interests, or
take other action, in order to avoid being classified as an investment
company.
ITEM 1B. UNRESOLVED
STAFF COMMENTS
None.
We may in
the future be involved as a party to various legal proceedings, which are
incidental to the ordinary course of business. We regularly analyze current
information and, as necessary, provide accruals for probable liabilities on the
eventual disposition of these matters. In the opinion of management, as of
December 31, 2009, there were no threatened or pending legal matters that
would have a material impact on our consolidated results of operations,
financial position or cash flows.
None.
23
ITEM 5.
MARKET FOR REGISTRANT’S COMMON
EQUITY, RELATED STOCKHOLDER MATTERS AND ISSUER PURCHASES OF EQUITY
SECURITIES
Our
common stock has traded on the NYSE Amex Equities under the symbol LNG since
March 24, 2003. The table below presents the high and low daily closing
sales prices of the common stock, as reported by the NYSE Amex Equities, for
each quarter during 2008 and 2009.
|
High
|
Low
|
|||||||
|
Three
Months Ended
|
||||||||
|
March
31, 2008
|
$ | 32.68 | $ | 19.80 | ||||
|
June
30, 2008
|
20.66 | 4.37 | ||||||
|
September
30, 2008
|
4.98 | 2.13 | ||||||
|
December
31, 2008
|
4.47 | 0.95 | ||||||
|
Three
Months Ended
|
||||||||
|
March
31, 2009
|
$ | 4.98 | $ | 3.01 | ||||
|
June
30, 2009
|
5.19 | 2.71 | ||||||
|
September
30, 2009
|
3.47 | 2.50 | ||||||
|
December
31, 2009
|
2.95 | 1.80 | ||||||
As of
February 17, 2010, we had 57,258,053 million shares of common stock
outstanding held by approximately 339 record owners.
We have
never paid a cash dividend on our common stock. We currently intend to retain
earnings to finance the growth and development of our business and do not
anticipate paying any cash dividends on the common stock in the foreseeable
future. Any future change in our dividend policy will be made at the discretion
of our board of directors in light of our financial condition, capital
requirements, earnings, prospects and any restrictions under any financing
agreements, as well as other factors the board of directors deems
relevant.
Issuer
Purchases of Equity Securities
During
the twelve months ended December 31, 2009, we purchased 428,728 shares of
restricted stock at an average cash price of $2.33 per share related to
restricted stock vested during 2009 that was returned to the Company by
employees to cover taxes.
24
Total
Stockholder Return
The
following graph compares the cumulative total stockholder return on our common
stock against the S&P Oil and Gas Exploration and Production Index, and the
Russell 2000 Index for the five years ending December 31, 2009. The graph
was constructed on the assumption that $100 was invested in our common stock,
the S&P Oil and Gas Exploration and Production Index and the Russell 2000
Index on December 31, 2004 and that any dividends were fully
reinvested.
|
Company
/ Index
|
2005
|
2006
|
2007
|
2008
|
2009
|
|||||||||||||||
|
Cheniere
Energy, Inc.
|
$ | 117 | $ | 91 | $ | 102 | $ | 9 | $ | 8 | ||||||||||
|
Russell
2000 Index
|
$ | 105 | $ | 124 | $ | 122 | $ | 81 | $ | 103 | ||||||||||
|
S&P
Oil & Gas Exploration & Production
|
$ | 166 | $ | 174 | $ | 252 | $ | 165 | $ | 234 | ||||||||||
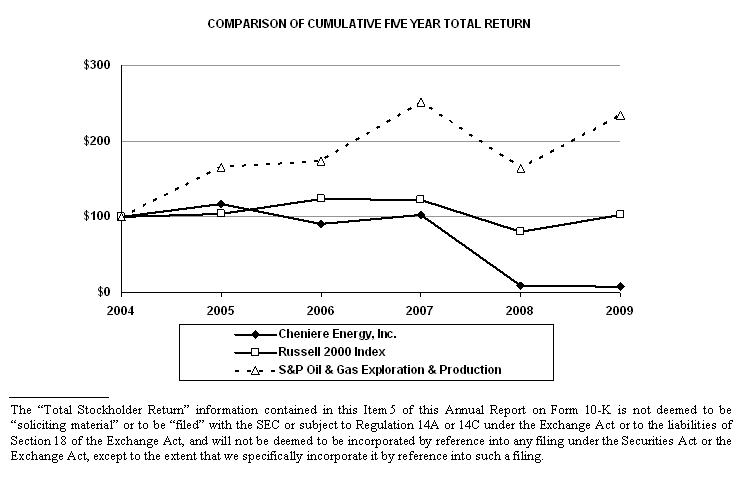
25
Selected
financial data set forth below are derived from our audited Consolidated
Financial Statements for the periods indicated. The financial data should be
read in conjunction with Management’s Discussion and Analysis of Financial
Condition and Results of Operations and our Consolidated Financial Statements
and Notes thereto included elsewhere in this report.
|
Year
Ended December 31,
|
||||||||||||||||||||
|
(in
thousands, except per share data)
|
||||||||||||||||||||
|
2009
|
2008
|
2007
|
2006
|
2005(6)
|
||||||||||||||||
|
(as
adjusted)
|
(as
adjusted)
|
(as
adjusted)
|
(as
adjusted)
|
|||||||||||||||||
|
Revenues
|
$ | 181,126 | $ | 7,144 | $ | 647 | $ | 2,371 | $ | 3,005 | ||||||||||
|
LNG
terminal and pipeline development expenses
|
223 | 10,556 | 34,656 | 12,099 | 22,020 | |||||||||||||||
|
LNG
terminal and pipeline operating expenses
|
36,857 | 14,522 | — | — | — | |||||||||||||||
|
Exploration
costs
|
— | 128 | 1,116 | 3,138 | 2,839 | |||||||||||||||
|
Depreciation,
depletion and amortization
|
54,229 | 24,346 | 6,393 | 3,131 | 1,325 | |||||||||||||||
|
General
and administrative expenses (1)
|
65,830 | 122,678 | 122,046 | 58,012 | 29,145 | |||||||||||||||
|
Restructuring
charges (2)
|
20 | 78,704 | — | — | — | |||||||||||||||
|
Income
(loss) from operations
|
23,496 | (244,188 | ) | (163,940 | ) | (75,874 | ) | (52,561 | ) | |||||||||||
|
Loss
from equity method investments
|
— | (4,800 | ) | (191 | ) | — | (1,031 | ) | ||||||||||||
|
Gain
on sale of investment in unconsolidated affiliate (3)
|
— | — | — | — | 20,206 | |||||||||||||||
|
Gain
(loss) on early extinguishment of debt (4)
|
45,363 | (10,691 | ) | — | (43,159 | ) | — | |||||||||||||
|
Derivative
gain (loss) (5)
|
5,277 | 4,652 | — | (20,070 | ) | 837 | ||||||||||||||
|
Interest
expense, net
|
(243,295 | ) | (147,136 | ) | (119,360 | ) | (67,252 | ) | (22,490 | ) | ||||||||||
|
Interest
income
|
1,405 | 20,337 | 82,635 | 49,087 | 17,520 | |||||||||||||||
|
Non-controlling
interest
|
6,165 | 8,777 | 3,425 | — | 97 | |||||||||||||||
|
Net
loss
|
(161,490 | ) | (372,959 | ) | (196,580 | ) | (159,137 | ) | (34,655 | ) | ||||||||||
|
Net
loss per share (basic and diluted) (6)
|
$ | (3.13 | ) | $ | (7.87 | ) | $ | (3.89 | ) | $ | (2.92 | ) | $ | (0.65 | ) | |||||
|
Weighted
average shares outstanding (basic and diluted) (6)
|
51,598 | 47,365 | 50,537 | 54,423 | 53,097 | |||||||||||||||
|
December
31,
|
||||||||||||||||||||
|
2009
|
2008
|
2007
|
2006
|
2005(6)
|
||||||||||||||||
|
(as
adjusted)
|
(as
adjusted)
|
(as
adjusted)
|
(as
adjusted)
|
|||||||||||||||||
|
Cash
and cash equivalents
|
$ | 88,372 | $ | 102,192 | $ | 296,530 | $ | 462,963 | $ | 692,592 | ||||||||||
|
Restricted
cash and cash equivalents (current)
|
138,309 | 301,550 | 228,085 | 176,827 | 161,561 | |||||||||||||||
|
Working
capital
|
220,063 | 350,459 | 427,511 | 588,034 | 810,141 | |||||||||||||||
|
Non-current
restricted cash and cash equivalents
|
82,892 | 138,483 | 478,225 | 1,071,722 | 16,500 | |||||||||||||||
|
Non-current
restricted U.S. Treasury securities
|
— | 20,829 | 63,923 | — | — | |||||||||||||||
|
Property,
plant and equipment, net
|
2,216,855 | 2,170,158 | 1,645,112 | 748,818 | 280,106 | |||||||||||||||
|
Debt
issuances costs, net
|
47,043 | 55,688 | 41,449 | 38,422 | 39,317 | |||||||||||||||
|
Goodwill
|
76,819 | 76,844 | 76,844 | 76,844 | 76,844 | |||||||||||||||
|
Total
assets
|
2,732,622 | 2,920,082 | 2,959,743 | 2,601,365 | 1,286,456 | |||||||||||||||
|
Long-term
debt, net of discount
|
2,692,740 | 2,750,308 | 2,657,579 | 2,242,209 | 788,857 | |||||||||||||||
|
Long-term
debt—related parties, net of discount
|
349,135 | 332,054 | — | — | — | |||||||||||||||
|
Long-term
deferred revenue
|
33,500 | 37,500 | 40,000 | 41,000 | 41,000 | |||||||||||||||
|
Total
liabilities
|
3,164,749 | 3,194,136 | 2,879,317 | 2,346,450 | 892,963 | |||||||||||||||
|
Total
stockholders’ equity (deficit)
|
$ | (649,732 | ) | $ | (524,216 | ) | $ | (205,249 | ) | $ | 254,915 | $ | 393,493 | |||||||
|
(1)
|
General
and administrative expenses include $19.2 million, $55.0 million, $56.6
million, $20.2 million and $3.6 million share-based compensation expense
recognized in the years ended December 31, 2009, 2008, 2007, 2006 and
2005, respectively.
|
|
(2)
|
In
the second quarter of 2008, we announced a cost savings program in
connection with the downsizing of our natural gas marketing business
activities, the nearing completion of significant construction activities
for both the Sabine Pass LNG receiving terminal and Creole Trail Pipeline
and the seeking of alternative arrangements for our time charter interest
in two LNG vessels (See Note 4—“Restructuring Charges”) of our Notes to
Consolidated Financial Statements).
|
|
(3)
|
In
2005, our investment in Gryphon Exploration Company was sold to Woodside
Energy (USA), generating net cash proceeds and a gain to Cheniere of $20.2
million.
|
|
(4)
|
Amount
in 2009 relates to gains on the termination of $120.4 million of our
Convertible Senior Unsecured Notes. Amount in 2008 relates to
losses on the termination of the $95.0 million bridge loan in August 2008.
Amounts in 2006 primarily relate to losses on the termination of a Sabine
Pass LNG credit facility and term loan in November 2006. See Note
19—“Long-Term Debt and Long-Term Debt—Related Parties” of our Notes to
Consolidated Financial Statements.
|
26
|
(5)
|
Amounts
in 2006 primarily relate to losses on the termination of hedge
transactions related to the termination of a Sabine Pass LNG credit
facility and term loan in November
2006.
|
|
(6)
|
Net
loss per share and weighted average shares outstanding have been restated
to reflect a two-for-one stock split that occurred on April 22,
2005.
|
|
(7)
|
Amounts
reported for the years ended December 31, 2005 have been adjusted to
reflect the change in our method of accounting for investments in oil and
gas properties from the full cost method to the successful efforts
method.
|
|
|
|
ITEM 7.
MANAGEMENT’S DISCUSSION AND
ANALYSIS OF FINANCIAL CONDITION AND RESULTS OF OPERATION
Introduction
The
following discussion and analysis presents management’s view of our business,
financial condition and overall performance and should be read in conjunction
with our consolidated financial statements and the accompanying notes in
Item 8, “Financial Statements and Supplementary Data.” This information is
intended to provide investors with an understanding of our past performance,
current financial condition and outlook for the future. Our discussion and
analysis include the following subjects:
|
|
•
|
Overview
of Business
|
|
|
•
|
Overview
of Significant 2009 Events
|
|
|
•
|
Liquidity
and Capital Resources
|
|
|
•
|
Contractual
Obligations
|
|
|
•
|
Results
of Operations
|
|
|
•
|
Off-Balance
Sheet Arrangements
|
|
|
•
|
Inflation
and Changing Prices
|
|
|
•
|
Summary
of Critical Accounting Policies and
Estimates
|
|
|
•
|
Recent
Accounting Standards
|
We own
and operate the Sabine Pass LNG receiving terminal in Louisiana through our
90.6% ownership interest in and management agreements with Cheniere Energy
Partners, L.P. (“Cheniere Partners”), which is a publicly traded partnership we
created in 2007. We also own and operate the Creole Trail Pipeline,
which interconnects the Sabine Pass LNG receiving terminal with downstream
markets. One of our subsidiaries, Cheniere Marketing, LLC (“Cheniere
Marketing”), is marketing liquefied natural gas (“LNG”) and natural gas and is
developing a portfolio of contracts to monetize capacity at the Sabine Pass LNG
receiving terminal and the Creole Trail Pipeline. We own 30% of the
limited partnership interests of Freeport LNG Development, L.P. (“Freeport
LNG”), which operates the Freeport LNG receiving terminal. We are
also in various stages of developing other LNG receiving terminal and pipeline
related projects, which, among other things, will require commercial
justification before we make a final investment decision. In
addition, we are engaged to a limited extent in oil and natural gas exploration
and development activities in the Gulf of Mexico.
LNG
Receiving Terminal Business
We have
focused our LNG receiving terminal development efforts on the following three
projects: the Sabine Pass LNG receiving terminal in western Cameron Parish,
Louisiana on the Sabine Pass Channel; the Corpus Christi LNG receiving terminal
near Corpus Christi, Texas; and the Creole Trail LNG receiving terminal at the
mouth of the Calcasieu Channel in central Cameron Parish, Louisiana. In
addition, we own a 30% interest in Freeport LNG, which has constructed an LNG
receiving terminal located on Quintana Island near Freeport, Texas.
Our
ownership interest in the Sabine Pass LNG receiving terminal is held through
Cheniere Partners. Cheniere Partners owns a 100% interest in Sabine Pass LNG,
L.P. (“Sabine Pass LNG”), which has constructed the Sabine Pass LNG receiving
terminal. We currently own 100% interests in the proposed Corpus Christi and
Creole Trail LNG receiving terminals. The three LNG receiving terminals under
development by us have an aggregate designed regasification capacity of
approximately 10.1 Bcf/d, subject to expansion.
Construction of the Sabine Pass LNG receiving terminal commenced
in March 2005, and we achieved commercial operability in September 2008 with
initial sendout capacity of approximately 2.6 Bcf/d and storage capacity of
approximately 10.1 Bcf. We
27
achieved
full operability of the Sabine Pass LNG receiving terminal with a total sendout
capacity of approximately 4.0 Bcf/d and total storage capacity of approximately
16.9 Bcf during the third quarter of 2009. Sabine Pass LNG has entered into
long-term terminal use agreements (“TUAs”) with Total Gas and Power North
America, Inc. (formerly known as Total LNG USA, Inc.) (“Total”), Chevron U.S.A.,
Inc. (“Chevron”) and Cheniere Marketing for the entire 4.0 Bcf/d of
regasification capacity that is now available at the Sabine Pass LNG receiving
terminal upon completion of construction.
We will
contemplate making final investment decisions to construct the Corpus Christi
LNG receiving terminal and Creole Trail LNG receiving terminal upon, among other
things, entering into acceptable commercial and financing
arrangements.
Natural Gas
Pipeline Business
We are
developing natural gas pipelines to provide access to North American natural gas
markets from our LNG receiving terminals, and to serve growing natural gas
markets with diverse new sources of natural gas supplies. We have focused our
natural gas pipeline development efforts on the following three projects: the
Creole Trail Pipeline originating at the Sabine Pass LNG receiving terminal to
points of interconnection with multiple interstate and intrastate natural gas
pipelines throughout southern Louisiana; the Corpus Christi Pipeline originating
at the Corpus Christi LNG receiving terminal to points of interconnection with
interstate and intrastate natural gas pipelines in South Texas; and the Cheniere
Southern Trail Pipeline originating in southern Louisiana to a point of
interconnection with the Florida Gas Transmission Pipeline in western Florida.
We have also purchased a 100% interest in the Frontera Pipeline project, a
combined transportation and storage project designed to serve industrial and
power generation customers in northeastern Mexico (the “Burgos Hub
Project”).
As of
December 31, 2009, Phase 1 of the Creole Trail Pipeline, consisting of 94
miles of natural gas pipeline, had been constructed and placed into commercial
operation. In conjunction with Phase 1 of the Creole Trail Pipeline, six
delivery meter stations were commissioned providing access to eight major
interstate and intrastate natural gas pipeline systems.
If we
decide to complete construction of the Corpus Christi LNG receiving terminal, we
intend to develop the Corpus Christi Pipeline when, among other things, we have
entered into acceptable commercial and acceptable financing
arrangements. The Cheniere Southern Trail Pipeline will be developed
once we have entered into acceptable commercial and acceptable financing
arrangements. We will contemplate making a final investment decision
in the Burgos Hub Project upon, among other things, receiving all required
authorizations to construct and operate the pipeline and storage facility, and
entering into acceptable commercial and acceptable financing
arrangements.
LNG
and Natural Gas Marketing Business
Our LNG
and natural gas marketing business segment is focused on producing long-term,
recurring cash flow utilizing its reserved 2.0 Bcf/d of regasification capacity
at the Sabine Pass LNG receiving terminal. Our strategy is to remain
engaged in the LNG spot market as opportunities arise, and to maintain
relationships with key suppliers and market participants that we believe are
candidates for entering into long-term LNG cargo sales and/or the purchase of
TUA capacity currently reserved by Cheniere Marketing.
To help
achieve these goals, we have entered into domestic marketing agreements with
various counterparties for the sale of LNG. These agreements provide a framework
under which Cheniere Marketing may offer to sell to a counterparty all or a
portion of the LNG from each LNG cargo it acquires on delivery to the Sabine
Pass LNG receiving terminal, and under which the counterparty will utilize a
portion of Cheniere Marketing’s TUA capacity for storage and regasification
services related to the portion of the LNG cargo that the counterparty
purchases.
Oil
and Natural Gas Exploration, Development and Exploitation
Activities
Although
our focus is primarily on the development of LNG-related businesses, we continue
to be involved to a limited extent in oil and gas exploration, development and
exploitation activities in the shallow waters of the Gulf of Mexico. This
business has historically required, and will continue to require, an
insignificant amount of cash to fund its operations.
Overview of
Significant 2009 Events
Our
significant accomplishments during 2009, some of which may also impact future
years, include the following:
|
|
•
|
we
completed construction and achieved full operability of the Sabine Pass
LNG receiving terminal with approximately 4.0 Bcf/d of total sendout
capacity and five LNG storage tanks with approximately 16.9 Bcf of
aggregate storage capacity;
|
28
|
|
•
|
Sabine
Pass LNG received capacity reservation fee payments from Cheniere
Marketing, our wholly owned subsidiary, Total and Chevron and successfully
unloaded and processed LNG for each
customer;
|
|
|
•
|
Cheniere
Marketing successfully purchased, transported and unloaded commercial LNG
cargos into the Sabine Pass LNG receiving terminal and sold resultant
natural gas;
|
|
|
•
|
we
reduced debt by exchanging $120.4 million aggregate principal amount of
our 2¼% Convertible Senior Unsecured Notes due 2012 (“Convertible Senior
Unsecured Notes”) for a combination of $30.0 million cash and cash
equivalents and 4.0 million shares of our common stock, reducing our
principal amount due in 2012 to $204.6 million, at December 31, 2009;
and
|
|
|
•
|
we
began receiving limited partner distributions from Freeport
LNG.
|
Although
results are consolidated for financial reporting, Cheniere, Sabine Pass LNG and
Cheniere Partners operate with independent capital
structures. See “Items 1 and 2. Business and
Properties—Corporate Structure.”. Since the inception of both Sabine
Pass LNG and Cheniere Partners, the cash needs of each entity have been met with
a combination of borrowings, issuance of units and operating cash
flows. We expect the cash needs for Sabine Pass LNG and Cheniere
Partners over the next 12 months will be met through operating cash
flows. With respect to Cheniere, we have historically satisfied cash
needs by utilizing existing unrestricted cash, management fees from Sabine Pass
LNG and Cheniere Partners, distributions from our investment in Cheniere
Partners, distributions from our 30% investment in Freeport LNG and operating
cash flows from our pipeline and LNG and natural gas marketing
businesses. Below is a table that presents unrestricted and
restricted cash for each portion of our capital structure as of December 31,
2009:
|
(in
thousands)
|
Sabine
Pass
LNG, L.P.
|
Cheniere
Energy
Partners,
L.P.
|
Other
Cheniere Energy, Inc.
|
Consolidated
Cheniere Energy,
Inc.
|
||||||||||||
|
Cash
and cash equivalents
|
$
|
—
|
$
|
—
|
$
|
88,372
|
$
|
88,372
|
||||||||
|
Restricted
cash and cash equivalents
|
213,537
|
130
|
7,534
|
221,201
|
||||||||||||
|
Total
|
$
|
213,537
|
$
|
130
|
$
|
95,906
|
$
|
309,573
|
||||||||
As of
December 31, 2009, we had unrestricted cash and cash equivalents of $88.4
million that was available to Cheniere (excluding Cheniere Partners and Sabine
Pass LNG). In addition, we had restricted cash and cash equivalents of $221.2
million, which were designated for the following purposes: $117.4 million for
Sabine Pass LNG’s working capital; $96.1 million for interest payments related
to the Senior Notes described below; and $7.7 million for other restricted
purposes. In addition, as of December 31, 2009, we expected to
receive in 2010 approximately $50 million as a result of monetizing our LNG
inventory and approximately $9 million from margin accounts held by Cheniere
Marketing (see discussion regarding LNG and natural gas marketing business
below).
We
believe that we have sufficient cash, other working capital and cash generated
from our operations (excluding the sources and uses of capital by Sabine
Pass LNG and Cheniere Partners) to fund Cheniere’s operating expenses and
other cash requirements until at least the
earliest date when principal payments may be required on our
existing indebtedness, which is August 2011. Before such time, we will need
to restructure our finances and improve our capital structure, which may be
accomplished by entering into long-term TUAs or LNG purchase agreements,
refinancing our existing indebtedness, issuing equity or other securities,
selling assets or a combination of the foregoing.
Our
ability to enhance near-term liquidity and improve our capital structure is
dependent on numerous factors, including the availability of credit, the balance
of worldwide and domestic supply and demand for natural gas and LNG, and the
relative prices for natural gas in North America and international
markets. As further described in “Item 1A. Risk Factors” we face
numerous financial, market and operational risks in connection with improving
our liquidity situation, many of which are beyond our control.
LNG
Receiving Terminal Business
Cheniere
Partners
Our
ownership interest in the Sabine Pass LNG receiving terminal is held through
Cheniere Partners. In 2007, Cheniere Partners completed a public offering.
As a result of this public offering, our combined general partner and limited
partner ownership interests in Cheniere Partners was reduced to approximately
90.6% (we hold 135,383,831 subordinated units, 10,891,357 common units and
3,302,045 general partner units of Cheniere Partners). Cheniere Partners owns a
100% interest in Sabine Pass LNG, which is operating the Sabine Pass LNG
receiving terminal.
29
For each
calendar year, Cheniere Partners is expected to make annual distributions of
$1.70 per unit on all outstanding common units, subordinated units and general
partner units. We anticipate receiving $18.5 million per year out of the
total $44.9 million of annual common unit distributions. We anticipate
receiving $235.8 million per year from distributions on the subordinated and
general partner units, of which we own 100%, so long as we, through Cheniere
Marketing, make TUA payments to Sabine Pass LNG.
Cheniere
Partners relies on the receipt of operating revenues from Sabine Pass LNG’s TUAs
to fund quarterly cash distributions to us and other unitholders. Sabine
Pass LNG is not permitted under the Sabine Pass Indenture to make cash
distributions to Cheniere Partners if it does not satisfy a fixed charge
coverage ratio test of 2:1, calculated as required in the Sabine Pass Indenture,
as well as other conditions. If the coverage test is not met, we may not
receive distributions. The fixed charge coverage ratio test was met for the
periods through December 31, 2009, and distributions in the amount of $295.7
million have been made during the year ended 2009, from Sabine Pass LNG to
Cheniere Partners. Cheniere Partners utilized the cash received from Sabine Pass
LNG to pay expenses and make distributions. Cheniere Partners has
made distributions of $280.7 million in the aggregate to us and its other
unitholders during the year ended 2009.
A
distribution reserve account was established from proceeds of Cheniere Partners’
initial public offering to pay distributions to the common unitholders and
general partner to the extent unrestricted cash was not sufficient. Sabine
Pass LNG began making distributions from unrestricted cash in February
2009. In August 2009, $34.9 million of remaining funds in the
distribution reserve account was distributed by Cheniere Partners to us pursuant
to the terms of the Cheniere Partners partnership agreement. These distributed
funds were included as unrestricted cash and cash equivalents on the December
31, 2009 Consolidated Balance Sheet.
We also
expect to receive approximately $19 million of annual management and service
fees from Sabine Pass LNG and Cheniere Partners pursuant to existing
agreements.
Sabine
Pass LNG Receiving Terminal
Construction
at the Sabine Pass LNG receiving terminal was substantially completed in the
third quarter of 2009. As of December 31, 2009, we had completed
construction and attained full operability of the Sabine Pass LNG receiving
terminal (with approximately 4.0 Bcf/d of total sendout capacity and five LNG
storage tanks with approximately 16.9 Bcf of aggregate storage capacity), and
such was accomplished within our budget.
The
entire approximately 4.0 Bcf/d of regasification capacity at the Sabine Pass LNG
receiving terminal has been fully reserved under three long-term TUAs, under
which Sabine Pass LNG’s customers are required to pay fixed monthly fees,
whether or not they use the terminal. Capacity reservation fee TUA payments are
made by our third-party TUA customers as follows:
|
|
•
|
Total
Gas and Power North America, Inc. (formerly known as Total LNG USA, Inc.)
(“Total”) has reserved approximately 1.0 Bcf/d of regasification capacity
and has agreed to make monthly capacity payments to Sabine Pass LNG
aggregating approximately $125 million per year for 20 years that
commenced April 1, 2009. Total, S.A. has guaranteed Total’s
obligations under its TUA up to $2.5 billion, subject to certain
exceptions; and
|
|
|
•
|
Chevron
U.S.A., Inc. (“Chevron”) has reserved approximately 1.0 Bcf/d of
regasification capacity and has agreed to make monthly capacity payments
to Sabine Pass LNG aggregating approximately $125 million per year for 20
years that commenced July 1, 2009. Chevron Corporation has guaranteed
Chevron’s obligations under its TUA up to 80% of the fees payable by
Chevron.
|
In
addition, our wholly-owned subsidiary, Cheniere Marketing, has reserved the
remaining 2.0 Bcf/d of regasification capacity and is entitled to use any
capacity not utilized by Total and Chevron. Cheniere Marketing began making its
TUA capacity reservation fee payments in the fourth quarter of
2008. Cheniere Marketing is required to make capacity payments
aggregating approximately $250 million per year for the period from January 1,
2009 through at least September 30, 2028. Cheniere has guaranteed Cheniere
Marketing’s obligations under its TUA.
Under
each of these TUAs, Sabine Pass LNG is entitled to retain 2% of the LNG
delivered for the customer’s account, which Sabine Pass LNG will use primarily
as fuel for revaporization and self-generated power at the Sabine Pass LNG
receiving terminal.
Each of
Total and Chevron previously paid us $20.0 million in nonrefundable advance
capacity reservation fees, which are being amortized over a 10-year period as a
reduction of each customer’s regasification capacity reservation fees payable
under its respective TUA.
Other
LNG Receiving Terminals
We have a
30% limited partner interest in Freeport LNG. In the year ended December 31,
2009, Freeport LNG made aggregate
30
distributions
to us of $15.3 million. We expect to continue receiving distributions from
Freeport LNG as they are approved by the board of directors of Freeport LNG’s
general partner.
We will
contemplate making final investment decisions to construct our Corpus Christi
and Creole Trail LNG receiving terminal projects upon, among other things,
entering into acceptable commercial and financing arrangements for the
applicable project. We do not expect to spend significant funds on these
projects in the near-term.
Natural
Gas Pipeline Business
As of
December 31, 2009, Phase 1 of the Creole Trail Pipeline, consisting of 94 miles
of natural gas pipeline, had been constructed and placed into commercial
operations. As discussed above, we believe that we have sufficient cash and
other working capital to operate Phase 1 of our Creole Trail Pipeline
until at least the earliest date when principal payments may be
required on our existing indebtedness, which is August 2011.
We will
contemplate making a final investment decision to construct Phase 2 of the
Creole Trail Pipeline, the Corpus Christi Pipeline, the Cheniere Southern Trail
Pipeline and the Burgos Hub Project upon, among other things, receiving all
required authorizations to construct and operate the applicable pipeline (and
storage facility in the case of Burgos Hub), to the extent not already obtained,
and entering into acceptable commercial and financing arrangements for the
applicable project. We do not expect to spend significant funds on these
projects in the near-term.
LNG
and Natural Gas Marketing Business
During
the twelve months ended December 31, 2009, Cheniere Marketing successfully
purchased, transported, and unloaded LNG at the Sabine Pass LNG receiving
terminal on a spot basis and entered into derivative contracts to hedge the cash
flows from the future sales of this LNG inventory.
The
accounting treatment for LNG inventory differs from the treatment for derivative
positions such that the economics of Cheniere Marketing’s activities are not
transparent in the consolidated financial statements until all LNG inventory is
sold and derivative positions are settled. Our LNG inventory is recorded as an
asset at cost and is subject to lower of cost or market (“LCM”) adjustments at
the end of each reporting period. The LCM adjustment market price is
based on period-end natural gas spot prices, and any gain or loss from a LCM
adjustment is recorded in our earnings at the end of each period. Revenue and
cost of goods sold are not recognized in our earnings until the regasified LNG
is sold. Our unrealized derivatives positions at the end of each period extend
into the future to hedge the cash flow from future sales of our LNG inventory.
These positions are measured at fair value, and we record the gains and losses
from the change in their fair value currently in earnings. Thus, earnings from
changes in the fair value of our derivatives may not be offset by losses from
LCM adjustments to our LNG inventory because the LCM adjustments that may be
made to LNG inventory are based on period-end spot prices that are different
from the time periods of the prices used to fair value our derivatives. Any
losses from changes in the fair value of our derivatives will not be offset by
gains until the regasified LNG is actually sold.
Management
evaluates the performance of its LNG and natural gas marketing business
activities differently than the measure calculated and presented in accordance
with GAAP in our Consolidated Statement of Operations. Management
calculates an Adjusted LNG and natural gas revenue non-GAAP measure to assess
the performance of the LNG and natural gas marketing business activities during
each period. As our LNG and natural gas marketing business has
entered into natural gas swaps that hedge the cash flows from the future sale of
LNG inventory, management believes that the presentation of the Adjusted LNG and
natural gas revenue non-GAAP measure provides a meaningful indicator of the
performance of our LNG and natural gas marketing business activities during the
stated period.
31
The table
below shows (in thousands) the differences between the components of both the
LNG and natural gas marketing revenue GAAP measure (presented in our
Consolidated Statement of Operations) and the Adjusted LNG and natural gas
revenue non-GAAP measure:
|
For
the Year Ended December 31, 2009
|
||||||||||
|
LNG
and natural gas marketing revenue
(GAAP
measure)
|
Adjusted
LNG and natural gas marketing revenue
(Non-GAAP
measure)
|
Difference
|
||||||||
|
Physical
natural gas sales
|
$
|
6,146
|
$
|
6,146
|
$
|
—
|
||||
|
Cost
of LNG
|
(3,850
|
)
|
(38,218
|
)
|
34,368
|
(a)
|
||||
|
Realized
natural gas derivative gain
|
9,635
|
9,635
|
—
|
|||||||
|
Unrealized
gas derivative loss
|
(1,029
|
)
|
(1,029
|
)
|
—
|
|||||
|
Inventory
lower-of-cost-or-market adjustments
|
(3,323
|
)
|
—
|
(3,323
|
)
|
(b)
|
||||
|
Future
inventory value
|
—
|
41,261
|
(41,261
|
)
|
(c)
|
|||||
|
Other
energy trading activities
|
508
|
722
|
(214
|
)
|
||||||
|
LNG
and natural gas revenue
|
$
|
8,087
|
$
|
18,517
|
$
|
(10,430
|
)
|
|||
|
(a)
|
The
cost of LNG GAAP measure takes into consideration only the cost of LNG
that was regasified and sold during the year ended December 31, 2009,
using the weighed average cost method for LNG inventory. The
cost of LNG non-GAAP measure takes into consideration the cost for all of
the LNG purchased during the year ended December 31,
2009.
|
|
(b)
|
The
inventory LCM adjustments GAAP measure represents the inventory
write-downs that were recorded during the year ended December 31, 2009, as
required by GAAP codification.
|
|
(c)
|
The
future inventory value non-GAAP measure represents the inventory fair
value at December 31, 2009, based on published forward natural gas price
curve prices corresponding to the future months when the regasified LNG is
planned to be sold.
|
Based on
the LNG and natural gas marketing positions executed during the year ended and
in place at December 31, 2009, we expect that future LNG and natural gas
marketing revenue GAAP measures will recognize a gain of $10.4
million. However, even with our cash flow hedges in place, a change
in the future inventory value may occur to the extent our hedges are not
perfectly effective or we change our regasification
schedule. Although a change in the future inventory value may occur,
we believe that the Adjusted LNG and natural gas marketing revenue non-GAAP
measure is a meaningful indicator of performance of our LNG and natural gas
marketing business activities during a stated period.
Corporate
and Other Activities
We are
required to maintain corporate general and administrative functions to serve our
business activities described above. As discussed above, we believe that we
will have sufficient cash and cash equivalents to fund these functions until our
debt begins to mature in August 2011.
Although
our focus is primarily on the development of LNG-related businesses, we continue
to be involved to a limited extent in oil and gas exploration, development and
exploration activities in the shallow waters of the Gulf of Mexico. We do
not anticipate significant cash expenditures related to these activities and
expect our cash inflows from oil and natural gas production to decrease as
reserves are produced.
32
Sources
and Uses of Cash
The
following table summarizes (in thousands) the sources and uses of our cash and
cash equivalents for the years ended December 31, 2009, 2008 and 2007. The table
presents capital expenditures on a cash basis; therefore, these amounts differ
from the amounts of capital expenditures, including accruals, that are referred
to elsewhere in this report. Additional discussion of these items follows the
table.
|
2009
|
2008
|
2007
|
||||||||||
|
Sources
of cash and cash equivalents
|
(as
adjusted)
|
(as
adjusted)
|
||||||||||
|
Use
of restricted cash and cash equivalents
|
$ | 241,101 | $ | 465,323 | $ | 527,043 | ||||||
|
Distribution
from limited partnership investment in Freeport LNG
|
15,300 | — | — | |||||||||
|
Proceeds
from debt issuance
|
— | 239,965 | 400,000 | |||||||||
|
Proceeds
from debt issuance—related parties
|
— | 250,000 | — | |||||||||
|
Use
of restricted U.S. Treasury securities
|
— | 16,702 | — | |||||||||
|
Sale
of common stock
|
— | 472 | 3,158 | |||||||||
|
Proceeds
from sale of common units in partnership
|
— | — | 203,946 | |||||||||
|
Proceeds
from issuance of common units to non-controlling owners in
partnership
|
— | — | 98,442 | |||||||||
|
Other
|
— | — | 1,048 | |||||||||
|
Total
sources of cash and cash equivalents
|
256,401 | 972,462 | 1,233,637 | |||||||||
|
Uses
of cash and cash equivalents
|
||||||||||||
|
LNG
receiving terminal and pipeline construction-in-process,
net
|
(112,317 | ) | (583,871 | ) | (788,517 | ) | ||||||
|
Operating
cash flow
|
(97,857 | ) | (142,145 | ) | (84,291 | ) | ||||||
|
Repayment
of debt
|
(30,030 | ) | (95,000 | ) | — | |||||||
|
Distributions
to non-controlling interest
|
(26,392 | ) | (26,393 | ) | (13,631 | ) | ||||||
|
Purchase
of treasury shares
|
(999 | ) | (4,902 | ) | (325,101 | ) | ||||||
|
Purchases
of intangible and fixed assets, net of sales
|
(522 | ) | (2,889 | ) | (41,684 | ) | ||||||
|
Debt
issuance cost
|
(121 | ) | (34,504 | ) | (9,787 | ) | ||||||
|
Investment
in restricted cash and cash equivalents
|
— | (248,767 | ) | — | ||||||||
|
Advances
under long-term contracts, net of transfers to
construction-in-process
|
— | (14,032 | ) | (38,617 | ) | |||||||
|
Purchases
of LNG for commissioning, net of amounts transferred to LNG receiving
terminal construction-in-process
|
— | (9,923 | ) | — | ||||||||
|
Investment
in U.S. Treasury securities
|
— | — | (98,442 | ) | ||||||||
|
Other
|
(1,983 | ) | (4,374 | ) | — | |||||||
|
Total
uses of cash and cash equivalents
|
(270,221 | ) | (1,166,800 | ) | (1,400,070 | ) | ||||||
|
Net
decrease in cash and cash equivalents
|
(13,820 | ) | (194,338 | ) | (166,433 | ) | ||||||
|
Cash
and cash equivalents—beginning of year
|
102,192 | 296,530 | 462,963 | |||||||||
|
Cash
and cash equivalents—end of year
|
$ | 88,372 | $ | 102,192 | $ | 296,530 | ||||||
Use of restricted cash and cash
equivalents
In 2009,
2008 and 2007, the $241.1 million, $465.3 million and $527.0 million,
respectively, of restricted cash and cash equivalents were used primarily to pay
for scheduled interest payments and construction activities at the Sabine Pass
LNG receiving terminal. Under the Sabine Pass Indenture, a portion of
the proceeds from the Senior Notes was initially required to be used for
scheduled interest payments through May 2009 and to fund the cost to complete
construction of the Sabine Pass LNG receiving terminal. Due to these
restrictions imposed by the Sabine Pass Indenture, the proceeds from the Senior
Notes are not presented as cash and cash equivalents. When proceeds
from the Senior Notes that have been designated as restricted cash and cash
equivalents are used, they are presented as a source of cash and cash
equivalents. The decreased use of restricted cash and cash
equivalents in 2008 and 2009 primarily resulted from completing construction of
the initial sendout capacity of approximately 2.6 Bcf/d and storage capacity of
approximately 10.1 Bcf at the Sabine Pass LNG receiving terminal in September
2008. The use of restricted cash and cash equivalents in 2009
primarily resulted from obtaining access to the restricted cash and cash
equivalents in the TUA reserve account. Our use compared to 2008
resulted from substantially completing construction of the Sabine Pass LNG
receiving terminal during the third quarter of 2009.
Proceeds
from debt issuance and proceeds from debt issuance—related parties
Our
proceeds from the issuance of debt and from the issuance of debt—related parties
were zero, $490.0 million and $400.0 million in 2009, 2008 and 2007,
respectively. During 2008, we received $95.0 million from borrowings under the
$95.0 million bridge loan, $250.0 million from borrowings under the 2008
Convertible Loans (considered related party), and $145.0 million, net of
33
discount,
from the additional issuance of the 2016 Notes (a portion of which is considered
related party borrowings). During 2007, we received $400.0 million from
borrowings under the 2007 Term Loan, which was used primarily to repurchase
shares of our common stock under the call option acquired in the issuer call
spread purchased by us in connection with the issuance of the Convertible Senior
Unsecured Notes.
Investment
In and Use of Restricted U.S. Treasury securities
As
described in the “—Proceeds from issuance of common units in partnership” below,
we received $98.4 million in 2007 to purchase U.S. Treasury securities to fund a
distribution reserve for the payments of initial quarterly distributions until
Cheniere Partners was able to sustain funding of distributions to its
unitholders from unrestricted cash. In 2008, $16.7 million of U.S.
Treasury securities were used to fund the distribution reserve.
Proceeds
from sale of common units to non-controlling owners in partnership
In
connection with the Cheniere Partners Offering in 2007, we sold to the public a
portion of the Cheniere Partners common units held by us through a subsidiary,
realizing net proceeds of $203.9 million, which included $39.4 million of net
proceeds realized once the underwriters exercised their option to purchase an
additional 2,025,000 common units from us. These net proceeds are being used for
corporate and general purposes.
Proceeds
from issuance of common units in partnership
In
connection with the Cheniere Partners Offering in 2007, Cheniere Partners
received $98.4 million in net proceeds for the issuance of common units to the
public. In 2007, Cheniere Partners used all of the net proceeds to purchase U.S.
Treasury securities to fund a distribution reserve for payment of initial
quarterly distributions of $0.425 per common unit, as well as related quarterly
distributions to its general partner through the quarterly distributions until
Cheniere Partners was able to sustain funding of distributions to its
unitholders from unrestricted cash in August 2009.
LNG
receiving terminal and pipeline construction-in-process, net
Capital
expenditures for our LNG receiving terminals and pipeline projects were $112.3
million, $583.9 million and $788.5 million in 2009, 2008 and 2007,
respectively. Our capital expenditures decreased in 2009 as a result
of the substantial completion of the construction of the Sabine Pass LNG
receiving terminal in September 2009. Our capital expenditures decreased in 2008
as a result of the winding down and completion of the construction of the
initial phases of the Sabine Pass LNG receiving terminal and the Creole Trail
Pipeline.
Investment
in restricted cash and cash equivalents
Investment
in restricted cash and cash equivalents was zero, $248.8 million and zero in
2009, 2008, and 2007, respectively. Investments in restricted cash and cash
equivalents are cash and cash equivalents that have been legally restricted to
be used for a specific purpose. During 2008, we received $250.0 million from
borrowings under the 2008 Convertible Loans and $145.0 million, net of discount,
from the additional issuance of the 2016 Notes. Proceeds received from these
borrowings were used to fund reserve accounts of $248.8 million, which we
classified as restricted cash and cash equivalents.
Operating
cash flow
Net cash
used in operations was $97.9 million, $142.1 million and $84.3 million in 2009,
2008 and 2007, respectively. Net cash used in operations in 2007 through 2009
related primarily to the continued development and construction of the Sabine
Pass LNG receiving terminal and related activities, including increased employee
support costs. In 2009, we received capacity reservation fee payments
from Total and Chevron of approximately $158 million.
Repayment
of debt
During
the second quarter of 2009, we reduced long-term debt by exchanging a
combination of $30.0 million cash and cash equivalents and 4.0 million common
shares for $120.4 million aggregate principal amount of our Convertible Senior
Unsecured Notes. In 2008, we repaid borrowings under the $95.0
million bridge loan with a portion of the proceeds obtained from the 2008
Convertible Loans.
34
Debt
issuance costs
Our debt
issuance costs were $0.1 million, $34.5 million and $9.8 million in 2009, 2008
and 2007, respectively. The debt issuance costs in 2008 related to the
additional issuance of 2016 Notes, the 2008 Convertible Loans and the $95.0
million bridge loan. The debt issuance costs in 2007 were primarily related to
the 2007 Term Loan.
Distributions
to non-controlling interest
During
2009, 2008 and 2007, Cheniere Partners distributed $26.4 million, $26.4 million
and $13.6 million, respectively, to its non-affiliated common
unitholders.
Advances
under long-term contracts, net of transfer to
construction-in-process
We have
entered into certain contracts and purchase agreements related to the
construction of the Sabine Pass LNG receiving terminal that require us to make
payments to fund costs that will be incurred or equipment that will be received
in the future. Advances made under long-term contracts on purchase commitments
are carried at face value and transferred to property, plant, and equipment as
the costs are incurred or equipment is received. Advances under
long-term contracts were zero, $14.0 million and $38.6 million at December 31,
2009, 2008 and 2007, respectively. The decrease in 2009 compared to 2008
resulted from substantial completion of the construction of the Sabine Pass LNG
receiving terminal in September 2009. During 2009, the Sabine Pass LNG receiving
terminal received equipment that it had previously advanced payment for under
long-term contracts. The decrease in 2008 compared to 2007 was a
result of Sabine Pass LNG nearing the completion of the construction of the
initial sendout capacity of approximately 2.6 Bcf/d and storage capacity of
approximately 10.1 Bcf at the Sabine Pass LNG receiving terminal. During 2008,
the Sabine Pass LNG receiving terminal received equipment that it had previously
advanced payment for under long-term contracts.
Purchase
of treasury shares
Concurrent
with the issuance of the Convertible Senior Unsecured Notes, we also entered
into hedge transactions in the form of an issuer call spread. During 2007, we
exercised the call spread and purchased 9.2 million shares of our common
stock for an aggregate purchase price of $325.0 million.
Purchases
of intangible and fixed assets, net of sales
Purchases
of fixed assets were $0.5 million, $2.9 million and $41.7 million in 2009, 2008
and 2007, respectively. The decrease in 2009 and 2008 primarily
resulted from a decrease in the purchase of intangible and fixed assets due to
the winding down of construction activities at the Sabine Pass LNG receiving
terminal and Creole Trail Pipeline.
Debt
Agreements
The
following table (in thousands) and the explanatory paragraphs following the
table summarize our various debt agreements as of December 31,
2009.
|
Sabine
Pass
LNG, L.P.
|
Cheniere
Energy
Partners,
L.P.
|
Other
Cheniere Energy, Inc.
|
Consolidated
Cheniere Energy,
Inc.
|
|||||||||||||
|
Long-term
debt (including related parties)
|
||||||||||||||||
|
Senior
Notes (including related parties)
|
$ | 2,215,500 | $ | — | $ | — | $ | 2,215,500 | ||||||||
|
2007
Term Loan
|
— | — | 400,000 | 400,000 | ||||||||||||
|
2008
Convertible Loans (including related parties)
|
— | — | 293,714 | 293,714 | ||||||||||||
|
Convertible
Senior Unsecured Notes
|
— | — | 204,630 | 204,630 | ||||||||||||
|
Total
long-term debt
|
2,215,500 | — | 898,344 | 3,113,844 | ||||||||||||
|
Debt
discount (including related parties)
|
||||||||||||||||
|
Senior
Notes (including related parties) (1)
|
(32,471 | ) | — | — | (32,471 | ) | ||||||||||
|
Convertible
Senior Unsecured Notes (2)
|
— | — | (39,498 | ) | (39,498 | ) | ||||||||||
|
Total
debt discount
|
(32,471 | ) | (39,498 | ) | (71,969 | ) | ||||||||||
|
Long-term
debt (including related parties), net of discount
|
$ | 2,183,029 | $ | — | $ | 858,846 | $ | 3,041,875 | ||||||||
|
|
(1)
|
In
September 2008, Sabine Pass LNG issued an additional $183.5 million, par
value, of 2016 Notes. The net proceeds from the additional
issuance of the 2016 Notes were $145.0 million. The difference
between the par value and the net
|
35
|
|
|
proceeds
is the debt discount, which will be amortized through the maturity of the
2016 Notes.
|
|
|
(2)
|
Effective
as of January 1, 2009, we are required to record a debt discount on our
Convertible Senior Unsecured Notes. The unamortized discount
will be amortized through the maturity of the Convertible Senior Unsecured
Notes.
|
Convertible
Senior Unsecured Notes
In July
2005, we consummated a private offering of $325.0 million aggregate principal
amount of Convertible Senior Unsecured Notes to qualified institutional buyers
pursuant to Rule 144A under the Securities Act of 1933, as amended (the
“Securities Act”). The notes bear interest at a rate of 2¼% per year.
Interest on the notes is payable semi-annually in arrears on February 1 and
August 1 of each year. The notes are convertible at any time into our
common stock under certain circumstances at an initial conversion rate of
28.2326 per $1,000 principal amount of the notes, which is equal to a
conversion price of approximately $35.42 per share. As of December 31, 2009, no
holders had elected to convert their notes. We may redeem some or all of the
notes on or before August 1, 2012, for cash equal to 100% of the principal
plus any accrued and unpaid interest if in the previous 10 trading days the
volume-weighted average price of our common stock exceeds $53.13, subject to
adjustment, for at least five consecutive trading days. In the event of such
redemption, we will make an additional payment equal to the present value of all
remaining scheduled interest payments through August 1, 2012, discounted at
the U.S. Treasury securities rate plus 50 basis points. The indenture governing
the notes contains customary reporting requirements.
As
discussed in Note 19—“Long-term Debt and Long-term Debt—Related Parties” of our
Notes to Consolidated Financial Statements, we adopted on January 1, 2009 an
accounting standard that requires issuers of certain convertible debt
instruments to separately account for the liability component and the equity
component represented by the embedded conversion option in a manner that will
reflect that entity’s nonconvertible debt borrowing rate when interest costs are
recognized in subsequent periods. The fair value of the embedded
conversion option at the date of issuance of the Convertible Senior Unsecured
Notes was determined to be $134.0 million and has been recorded as a debt
discount to the Convertible Senior Unsecured Notes, with a corresponding
adjustment to Additional Paid-in Capital. At December 31, 2009, the
unamortized debt discount to the Convertible Senior Unsecured Notes was $39.5
million.
During
the second quarter of 2009, we reduced debt by exchanging $120.4 million
aggregate principal amount of our Convertible Senior Unsecured Notes for a
combination of $30.0 million cash and cash equivalents and 4.0 million common
shares, reducing our principal amount due in 2012 to $204.6 million, at December
31, 2009. As a result of the exchange, we recognized a gain of $45.4 million
that we have reported as gain on early extinguishment of debt in our
Consolidated Statements of Operations for the year ended December 31,
2009.
Sabine
Pass LNG Senior Notes
Sabine
Pass LNG has issued an aggregate principal amount of $2,215.5 million of Senior
Notes consisting of $550.0 million of 7¼% Senior Secured Notes due 2013 and
$1,665.5 million of 7½% Senior Secured Notes due 2016. Interest on the Senior
Notes is payable semi-annually in arrears on May 30 and November 30 of
each year. The Senior Notes are secured on a first-priority basis by a security
interest in all of Sabine Pass LNG’s equity interests and substantially all of
its operating assets. Under the Sabine Pass Indenture governing the Senior
Notes, except for permitted tax distributions, Sabine Pass LNG may not make
distributions until certain conditions are satisfied: there must be on deposit
in an interest payment account an amount equal to one-sixth of the semi-annual
interest payment multiplied by the number of elapsed months since the last
semi-annual interest payment, and there must be on deposit in a permanent debt
service reserve fund an amount equal to one semi-annual interest payment of
approximately $82 million. Distributions are permitted only after satisfying the
foregoing funding requirements, a fixed charge coverage ratio test of 2:1 and
other conditions specified in the Sabine Pass Indenture.
2007
Term Loan
In
May 2007, Cheniere Subsidiary Holdings, LLC, a wholly-owned subsidiary of
Cheniere, entered into a $400.0 million credit agreement (“2007 Term Loan”).
Borrowings under the 2007 Term Loan generally bear interest at a fixed rate of
9¾% per annum. Interest is calculated on the unpaid principal amount of the
2007 Term Loan outstanding and is payable quarterly in arrears on March 31,
June 30, September 30 and December 31 of each year. The 2007 Term Loan
will mature on May 31, 2012. The 2007 Term Loan is secured by a pledge of
our 135,383,831 subordinated units in Cheniere Partners and our equity interests
in the entities that own our 30% interest in Freeport LNG.
2008
Convertible Loans
In August
2008, we entered into a credit agreement pursuant to which we obtained $250.0
million in convertible term loans (“2008 Convertible Loans”). The 2008
Convertible Loans will mature in 2018, but the lenders can require prepayment of
the loans for
36
thirty
days following August 15, 2011, 2013 and 2015, and upon a change of
control. The 2008 Convertible Loans bear interest at a fixed rate of
12% per annum, except during the occurrence of an event of default during
which time the rate of interest will be 14% per annum. Interest is due
semi-annually on the last business day of January and July. At our option, until
August 15, 2011, accrued interest may be added to the principal on each
semi-annual interest date. The aggregate amount of all accrued interest to
August 15, 2011 will be payable on the maturity date. The 2008 Convertible
Loans are secured by Cheniere’s rights and fees payable under management
services agreements with Sabine Pass LNG and Cheniere Partners, by Cheniere’s
common units in Cheniere Partners, by the equity and non-real property assets of
Cheniere’s pipeline entities, by the equity of various other subsidiaries and
certain other assets and subsidiary guarantees. The principal amount of $250.0
million may be exchanged for newly-created Series B Convertible Preferred Stock,
par value $0.0001 per share (“Series B Preferred Stock”), with voting rights
limited to the equivalent of 10,125,000 shares of common stock. The exchange
ratio is one share of Series B Preferred Stock for each $5,000 of
outstanding borrowings, subject to adjustment. The exchange ratio will be
adjusted in the event we make certain distributions of cash, shares or property
on our shares of common stock. The aggregate Series B Preferred Stock is
exchangeable into 50 million shares of common stock at a price of $5.00 per
share pursuant to a broadly syndicated offering. We are required to file a
registration statement to register the Series B Preferred Stock upon demand by
the majority of the holders of the Series B Preferred Stock. Such holders also
have the right to demand registration of the shares of common stock into which
the Series B Preferred Stock is convertible. No portion of any accrued interest
is eligible for conversion into Series B Preferred Stock. We placed $135.0
million of the borrowings under the 2008 Convertible Loans into a TUA reserve
account to pay the reservation fee and operating fee as defined under Cheniere
Marketing’s TUA. We utilized $95.0 million of the borrowings under the 2008
Convertible Loans to repay a $95.0 million bridge loan. The remaining borrowings
were utilized to pay for interest on the $95.0 million bridge loan, to pay
expenses incurred in connection with the issuance of the 2008 Convertible Loans
and consideration of other strategic alternatives, and to fund working capital
and general corporate needs of Cheniere and its subsidiaries.
As long
as the 2008 Convertible Loans are exchangeable for shares of Series B Preferred
Stock or shares of Series B Preferred Stock remain outstanding, the holders of a
majority of the 2008 Convertible Loans and Series B Preferred Stock, acting
together, shall have the right to nominate two individuals to the Company’s
Board of Directors, and together with the Board of Directors, a third nominee,
who shall be an independent director. In addition, one of the lenders
is Scorpion Capital Partners LP (“Scorpion”), an affiliate of one of the
Company’s directors. As of December 31, 2009 and 2008, $293.7 million
and $261.4 million, were outstanding under the 2008 Convertible Loans and were
included on Long-term Debt—Related Party on our Consolidated Balance Sheets,
respectively.
Issuances
of Common Stock
During
2009, no shares of our common stock were issued pursuant to the exercise of
stock options. During 2009, we issued 886 shares of non-vested
restricted stock to new and existing employees. We also issued 4.0
million shares of our common stock as part of the consideration used to
repurchase a portion of the Convertible Senior Unsecured Notes during the second
quarter of 2009.
During
2009 and 2008, we raised zero and $0.5 million, respectively, net of offering
costs, from the exercise of stock options and the exchange or exercise of
warrants.
During
2008, a total of 145,000 shares of our common stock were issued pursuant to the
exercise of stock options, resulting in net cash proceeds of $0.5 million. In
addition, in January 2008, 480,000 shares having three-year graded vesting
were issued to our employees in the form of non-vested stock awards and 537,000
shares were issued to our executive officers in the form of vested stock awards
related to our performance in 2007. In May 2008 and June 2008, as a part of the
short-term and long-term retention plans approved by the Compensation Committee,
374,000 shares vesting on December 1, 2008 and 1,525,000 shares having a
three-year graded vesting beginning December 31, 2008 were issued to our
employees and a consultant in the form of non-vested stock awards. In December
2008, 1,703,000 shares of non-vested stock having a three-year graded vesting
were issued to employees as an incentive award. During 2008, an additional
272,000 shares having a one-year graded vesting were issued to our directors and
26,000 shares of non-vested stock having three- or four-year graded vestings
were issued to employees.
37
We are
committed to make cash payments in the future pursuant to certain of our
contracts. The following table summarizes certain contractual obligations in
place as of December 31, 2009 (in thousands).
|
Payments
Due for Years Ended December 31,
|
||||||||||||||||||||
|
Total
|
2010
|
2011- 2012 | 2013- 2014 |
Thereafter
|
||||||||||||||||
|
Long-term
debt (excluding interest) (1)
|
$ | 3,174,821 | $ | — | $ | 959,321 | $ | 550,000 | $ | 1,665,500 | ||||||||||
|
Operating
lease obligations (2)(3)
|
326,521 | 13,853 | 28,208 | 28,028 | 256,432 | |||||||||||||||
|
Construction
and purchase obligations (4)
|
7,408 | 7,408 | — | — | — | |||||||||||||||
|
Other
obligations (5)
|
20,707 | 3,781 | 7,114 | 4,906 | 4,906 | |||||||||||||||
|
Total
|
$ | 3,529,457 | $ | 25,042 | $ | 994,643 | $ | 582,934 | $ | 1,926,838 | ||||||||||
|
(1)
|
Based
on the total debt balance, scheduled maturities and interest rates in
effect at December 31, 2009, our cash payments for interest would be
$208.4 million in 2010, $208.4 million in 2011, $183.7 million in 2012,
$161.5 million in 2013, $124.9 million in 2014 and $239.5 million for the
remaining years for a total of $1,126.4 million. See “Note
19—Long-Term Debt and Long-Term Debt—Related Parties” of our Notes to
Consolidated Financial Statements.
|
|
(2)
|
A
discussion of these obligations can be found at Note 8—“Leases” of our
Notes to Consolidated Financial
Statements.
|
|
(3)
|
Minimum
lease payments have not been reduced by a minimum sublease rental of $98.9
million due in the future under noncancelable subleases. A discussion of
these sublease rental payments can be found at Note 8—“Leases” of our
Notes to Consolidated Financial
Statements
|
|
(4)
|
A
discussion of these obligations can be found at Note 24—“Commitments and
Contingencies” of our Notes to Consolidated Financial
Statements.
|
|
(5)
|
Includes
obligations for cooperative endeavor agreements, LNG receiving terminal
security services, telecommunication services and software
licensing.
|
In
addition, in the ordinary course of business, we maintain letters of credit and
have certain cash and cash equivalents restricted in support of certain
performance obligations of our subsidiaries. Restricted cash and cash
equivalents totaled approximately $221.2 million at December 31, 2009. For
more information, see Note 7—“Restricted Cash and Cash Equivalents and U.S.
Treasury Securities” of our Notes to Consolidated Financial
Statements.
Overall
Operations
2009
vs. 2008
Our
consolidated net loss was $161.5 million, or $3.13 per share (basic and
diluted), in 2009 compared to a net loss of $373.0 million, or $7.87 per share
(basic and diluted), in 2008. The decrease in the loss was primarily due to
increased LNG receiving terminal revenues as a result of the Sabine Pass LNG
receiving terminal starting commercial operations during 2009, decreased LNG
receiving terminal and pipeline development expense, decreased general and
administrative expenses, decreased restructuring charges and the gain from early
extinguishment of debt, which were partially offset by increased LNG receiving
terminal and pipeline operating expenses, increased depreciation, depletion and
amortization expense (“DD&A”), decreased interest income and increased
interest expense, net.
A
significant portion of our loss was attributable to the recognition of non-cash,
share-based payments recognized in the consolidated financial statements based
on fair value at the date of grant. As a result of our issuance of non-cash,
share-based payments to employees, we recorded $19.2 million (12% of net loss)
and $55.0 million (15% of net loss) of non-cash compensation expense in 2009 and
2008, respectively. In addition, we recognized one-time items in 2009 of $45.4
million for a gain on early extinguishment of debt. In 2008, we
recognized one-time items of $78.7 million for restructuring charges and $10.7
million for loss on early extinguishment of debt. Not including the impact of
these one-time charges in 2009 and 2008 and the impact of non-cash expense in
2009 and 2008, our net loss would have been $187.7 million, or $3.64 net loss
per common share (basic and diluted) and $228.6 million, or $4.83 net loss per
common share (basic and diluted), respectively.
38
2008
vs. 2007
Our
consolidated net loss was $373.0 million, or $7.87 per share (basic and
diluted), in 2009 compared to a net loss of $196.6 million, or $3.89 per share
(basic and diluted), in 2007. The increase in the loss was primarily due to
restructuring charges, decreased interest income, increased interest expense,
net, increased depreciation, depletion and amortization expense (“DD&A”),
increased LNG receiving terminal and pipeline operating and maintenance expense
and increased loss on early extinguishment of debt, which were partially offset
by decreased LNG receiving terminal and pipeline development
expense.
A
significant portion of our loss was attributable to the recognition of non-cash,
share-based payments recognized in the consolidated financial statements based
on fair value at the date of grant. As a result of our issuance of non-cash,
share-based payments to employees, we recorded $55.0 million (15% of net loss)
and $56.6 million (29% on net loss) of non-cash compensation expense in 2008 and
2007, respectively. In addition, we recognized one-time charges of $78.7 million
for restructuring charges and $10.7 million for loss on early extinguishment of
debt. Not including the impact of these one-time charges in 2008 and the impact
of non-cash expense in 2008, our net loss would have been $228.6 million, or
$4.83 net loss per common share (basic and diluted).
LNG
Receiving Terminal Revenue
As a
result of the completion of the Sabine Pass LNG receiving terminal in 2009, the
capacity reservation fee TUA payments began on April 1, 2009 and July 1, 2009
for Total and Chevron, respectively. In addition to the TUA capacity
reservation fee, we recognized $9.3 million of other revenue primarily related
to revenues earned from fees charged to customers using our tug boats associated
with the Sabine Pass LNG receiving terminal.
LNG
and Natural Gas Marketing Revenue
Operating
results from marketing and trading activities are presented on a net basis on
our Consolidated Statement of Operations. Marketing and trading revenues
represent the margin earned on the purchase and transportation costs of LNG and
subsequent sales of natural gas to third parties. Our marketing and trading
revenues also include pretax derivative gains/losses and inventory
lower-of-cost-or-market adjustments, if any. See table below (in
thousands) for itemized comparison of each major type of energy trading and risk
management activity:
|
Years
Ended December 31,
|
||||||||||||
|
2009
|
2008
|
2007
|
||||||||||
|
Physical
natural gas sales, net of costs
|
$ | 2,296 | $ | 943 | $ | 52 | ||||||
|
Inventory
lower-of-cost-or-market write-downs
|
(3,323 | ) | — | — | ||||||||
|
Gain
(loss) from derivatives
|
8,606 | (1,435 | ) | (4,391 | ) | |||||||
|
Other
energy trading activities
|
508 | 3,406 | (390 | ) | ||||||||
|
Total
LNG and Natural Gas Marketing Revenue
|
$ | 8,087 | $ | 2,914 | $ | (4,729 | ) | |||||
2009
vs. 2008
LNG and
natural gas marketing revenues increased $5.2 million, from $2.9 million in 2008
to a $8.1 million in 2009. The $8.1 million in 2009 primarily resulted from $8.6
million in derivative gains and $2.3 million of net revenue from physical sales
of regasified LNG, which was offset by a $3.3 million inventory
write-down. The increase in natural gas marketing and trading revenue
is primarily a result of the different marketing and trading activities we were
engaged in during 2009 compared to 2008. Prior to the downsizing of
our natural gas marketing business in April 2008, we had entered into various
commercial transactions that were unwound, terminated or assigned in 2008. The
$2.9 million gain in 2008 primarily resulted from revenue from short-term TUA
option transactions. During 2009, we began purchasing, transporting
and unloading commercial LNG cargos into the Sabine Pass LNG receiving terminal
and used certain hedging strategies to maximize margins on these
cargos.
2008
vs. 2007
LNG and
natural gas marketing revenues increased $7.6 million, from a $4.7 million loss
in 2007 to a $2.9 million gain in 2008. The $2.9 million gain in 2008 primarily
resulted from revenue from short-term TUA option transactions, which was
partially offset by losses on our derivative positions entered into prior to our
corporate restructuring in April 2008.
39
LNG
Receiving Terminal and Pipeline Development Expense
Our LNG
receiving terminal and pipeline development expenses include primarily
professional costs associated with front-end engineering and design work,
obtaining orders from the FERC authorizing construction of our facilities and
other required permitting for our planned LNG receiving terminals and natural
gas pipelines.
2009
vs. 2008
LNG
receiving terminal and pipeline development expenses decreased $10.3 million in
2009 compared to 2008. The decrease resulted from less development activities at
the Sabine Pass LNG receiving terminal than in 2008. The 2009 costs
primarily related to continued site maintenance costs incurred on the Corpus
Christi and Creole Trail LNG receiving terminals.
2008
vs. 2007
LNG
receiving terminal and pipeline development expenses decreased $24.1 million in
2008 compared to 2007. These development expenses decreased in 2008 as a result
of the achievement of commercial operability of the initial phase of the Sabine
Pass LNG receiving terminal and Phase 1 of the Creole Trail Pipeline and the
resulting shift from development activities in 2007 to operating activities in
2008.
LNG
Receiving Terminal and Pipeline Operating Expense
Our LNG
receiving terminal and pipeline operating expenses include costs incurred to
operate the Sabine Pass LNG receiving terminal and the Creole Trail
Pipeline.
2009
vs. 2008
Operating
and maintenance expense increased $22.4 million, from $14.5 million in 2008 to
$36.9 million in 2009. This $22.4 million increase primarily resulted from the
achievement of commercial operability of the initial 2.6 Bcf/d of sendout
capacity and 10.1 Bcf of storage capacity of the Sabine Pass LNG receiving
terminal in the third quarter of 2008 and the substantial completion of
construction and achievement of full operability of the Sabine Pass LNG
receiving terminal with approximately 4.0 Bcf/d of total sendout capacity and
five LNG storage tanks with approximately 16.9 Bcf of aggregate storage capacity
in the third quarter of 2009.
2008
vs. 2007
Operating
and maintenance expense increased $14.5 million, from zero in 2007 to $14.5
million in 2008. This $14.5 million increase primarily resulted from the initial
2.6 Bcf/d of regassification capacity and the 10.1 Bcf of storage capacity
achieving commercial operability in September 2008 and also included costs to
repair damage caused by Hurricane Ike.
Depreciation,
Depletion and Amortization (“DD&A”)
2009
vs. 2008
DD&A
increased $29.9 million, from $24.3 million in 2008 to $54.2 million in 2009.
This increase is primarily related to beginning deprecation on the costs
associated with the initial 2.6 Bcf/d of sendout capacity and 10.1 Bcf of
storage capacity of the Sabine Pass LNG receiving terminal that was placed into
service in the third quarter of 2008. In addition, depreciation expense
increased in 2009 as a result of the substantial completion of construction and
achievement of full operability of the Sabine Pass LNG receiving terminal with
approximately 4.0 Bcf/d of total sendout capacity and five LNG storage tanks
with approximately 16.9 Bcf of aggregate storage capacity in the third quarter
of 2009.
2008
vs. 2007
DD&A
increased $18.0 million in 2008 compared to 2007. This increase resulted from
our having begun depreciating the Sabine Pass LNG receiving terminal’s initial
2.6 Bcf/d of regassification capacity and 10.1 Bcf of storage capacity and the
Creole Trail Pipeline when they achieved commercial operability in the third and
second quarter of 2008, respectively.
40
General
and Administrative Expense (“G&A”)
Our
G&A expenses include costs that are incurred directly related to operating
the Sabine Pass LNG receiving terminal and Creole Trail Pipeline.
2009
vs. 2008
The $56.8
million reduction in G&A expense from 2008 to 2009 primarily resulted from a
reduction in salaries and benefits incurred in 2009 associated with our 2008
cost savings program and the allocation of salaries and benefits to operating
costs as a result of the achievement of commercial operability of the Sabine
Pass LNG receiving terminal in September 2008.
Restructuring
Charges
During
2009 and 2008, we incurred less than $0.1 million and $78.7 million of
restructuring charges, respectively, resulting from our cost savings program in
connection with downsizing our natural gas marketing business activities,
nearing completion of significant construction activities for both the Sabine
Pass LNG receiving terminal and Creole Trail Pipeline and seeking alternative
arrangements for our time charter interests in two LNG vessels (See Note
2—“Summary of Significant Accounting Policies” of our Notes to Consolidated
Financial Statements).
Gain/(Loss)
on Early Extinguishment of Debt
2009
vs. 2008
Gain/(Loss)
on early extinguishment of debt increased $56.1 million, from a $10.7 million
loss in 2008 to a $45.4 million gain in 2009. During the second quarter of 2009,
we reduced debt by exchanging $120.4 million aggregate principal amount of our
Convertible Senior Unsecured Notes for a combination of $30.0 million cash and
cash equivalents and 4.0 million common shares, reducing our principal amount
due in 2012 to $204.6 million. As a result of the exchange, we recognized a gain
of $45.4 million that was reported as a gain on early extinguishment of
debt.
2008
vs. 2007
Gain/(Loss)
on early extinguishment of debt decreased $10.7 million in 2008 compared to
2007. The decrease resulted from recognizing all unamortized debt issuance costs
associated with the $95 million bridge loan that was repaid in full using a
portion of the borrowings under the 2008 Convertible Loans during the third
quarter of 2008.
Interest
Income
2009
vs. 2008
Interest
income decreased $18.9 million in 2009 compared to 2008, because of the lower
average invested cash balances resulting from the use of cash to pay
construction costs and interest payments, as well as lower interest
rates.
2008
vs. 2007
Interest
income decreased $62.3 million in 2008 compared to 2007, because of the lower
average invested cash balances resulting from the use of cash to pay
construction costs and interest payments, as well as lower interest
rates.
Interest
Expense, net
2009
vs. 2008
Interest
expense, net of amounts capitalized, increased $96.2 million, from $147.1
million in 2008 to $243.3 million in 2009. The increase in interest expense was
caused by additional debt issuances during the third quarter of 2008 and a
decrease in capitalized interest as a result of placing in service the initial
phase of the Sabine Pass LNG receiving terminal and Creole Trail Pipeline in the
third quarter of 2008 and second quarter of 2008, respectively.
41
2008
vs. 2007
Interest
expense, net of amounts capitalized, increased $27.8 million in 2008 compared to
2007. The increase was caused by the additional borrowing under the $95.0
million bridge loan, the 2008 Convertible Loans and the issuance of $183.5
million of additional 2016 Notes during the third quarter of 2008.
As of
December 31, 2009, we had no “off-balance sheet arrangements” that may have
a current or future material affect on our consolidated financial position or
results of operations.
During
2009, 2008 and 2007, inflation and changing commodity prices have had an impact
on our oil and gas revenues but have not significantly impacted our results of
operations.
The
selection and application of accounting policies is an important process that
has developed as our business activities have evolved and as the accounting
rules have developed. Accounting rules generally do not involve a selection
among alternatives but involve an implementation and interpretation of existing
rules, and the use of judgment, to apply the accounting rules to the specific
set of circumstances existing in our business. In preparing our consolidated
financial statements in conformity with GAAP, we endeavor to comply properly
with all applicable rules on or before their adoption, and we believe that the
proper implementation and consistent application of the accounting rules are
critical. However, not all situations are specifically addressed in the
accounting literature. In these cases, we must use our best judgment to adopt a
policy for accounting for these situations. We accomplish this by analogizing to
similar situations and the accounting guidance governing them.
Accounting
for LNG Activities
Generally,
we begin capitalizing the costs of our LNG receiving terminals and related
pipelines once the individual project meets the following criteria:
(i) regulatory approval has been received, (ii) financing for the
project is available and (iii) management has committed to commence
construction. Prior to meeting these criteria, most of the costs associated with
a project are expensed as incurred. These costs primarily include professional
fees associated with front-end engineering and design work, costs of securing
necessary regulatory approvals, and other preliminary investigation and
development activities related to our LNG receiving terminals and related
pipelines.
Generally,
costs that are capitalized prior to a project meeting the criteria otherwise
necessary for capitalization include: land and lease option costs that are
capitalized as property, plant and equipment and certain permits that are
capitalized as intangible LNG assets. The costs of lease options are amortized
over the life of the lease once obtained. If no lease is obtained, the costs are
expensed.
We
capitalize interest and other related debt costs during the construction period
of our LNG receiving terminal. Upon commencement of operations, capitalized
interest, as a component of the total cost, will be amortized over the estimated
useful life of the asset.
Revenue
Recognition
LNG
regasification capacity reservation fees are recognized as revenue over the term
of the respective TUAs. Advance capacity reservation fees are initially deferred
and amortized over a 10-year period as a reduction of a customer’s
regasification capacity reservation fees payable under its TUA. The
retained 2% of LNG delivered for each customer’s account at the Sabine Pass LNG
receiving terminal is recognized as revenues as Sabine Pass LNG performs the
services set forth in each customer’s TUA.
Use
of Estimates
The
preparation of consolidated financial statements in conformity with accounting
principles generally accepted in the United States of America requires
management to make certain estimates and assumptions that affect the amounts
reported in the consolidated financial statements and the accompanying notes.
Actual results could differ from the estimates and assumptions
used.
42
Estimates
used in the assessment of impairment of our long-lived assets, including
goodwill, are the most significant of our estimates. There are
numerous uncertainties inherent in estimating future cash flows of assets or
business segments. The accuracy of any cash flow estimate is a
function of judgment used in determining the amount of cash flows
generated. As a result, cash flows may be different from the cash
flows that we use to assess impairment of our assets. Management
reviews its estimates of cash flows on an ongoing basis using historical
experience and other factors, including the current economic and commodity price
environment. Significant negative industry or economic trends,
including a significant decline in the market price of our common stock, reduced
estimates of future cash flows for our business segments or disruptions to our
business could lead to an impairment charge of our long-lived assets, including
goodwill and other intangible assets. Our valuation methodology for assessing
impairment requires management to make judgments and assumptions based on
historical experience and to rely heavily on projections of future operating
performance. Projections of future operating results and cash flows may vary
significantly from results. In addition, if our analysis results in an
impairment of our long-lived assets, including goodwill, we may be required to
record a charge to earnings in our consolidated financial statements during a
period in which such impairment is determined to exist, which may negatively
impact our results of operations.
Other
items subject to estimates and assumptions include asset retirement obligations,
valuation allowances for net deferred tax assets, valuations of derivative
instruments, valuations of noncash compensation and collectability of accounts
receivable and other assets.
As future
events and their effects cannot be determined accurately, actual results could
differ significantly from our estimates.
LNG
and Natural Gas Marketing
We have
determined that our LNG and natural gas marketing business activities are energy
trading and risk management activities for trading purposes and have elected to
present these activities on a net basis on our Consolidated Statement of
Operations. Marketing and trading revenues represent the margin
earned on the purchase and transportation of LNG purchases and subsequent sales
of natural gas to third parties. These energy trading and risk management
activities include, but are not limited to: purchase of LNG and natural gas,
transportation contracts, and derivatives. Below is a brief
description of our accounting treatment of each type of energy trading and risk
management activity and how we account for it:
Purchase
of LNG and natural gas
The
purchase value of LNG or natural gas inventory is recorded as an asset on our
Consolidated Balance Sheet at the cost to acquire the product. Our inventory is
subject to LCM adjustment each quarter. Recoveries of losses
resulting from interim period LCM adjustments are made due to market price
recoveries on the same inventory in the same fiscal year and are recognized as
gains in later interim periods with such gains not exceeding previously
recognized losses. Any adjustment to our inventory is recorded on a
net basis as LNG and natural gas marketing revenue on our Consolidated Statement
of Operations.
Transportation
contracts
We enter
into transportation contracts with respect to the transport of LNG or natural
gas to a specific location for storage or sale. Transportation costs
that are incurred during the purchase of LNG or natural gas are capitalized as
part of the acquisition costs of the product. Transportation costs
incurred to sell LNG or natural gas are recorded on a net basis as LNG and
natural gas marketing revenue on our Consolidated Statement of
Operations.
Derivatives
We use
derivative instruments from time to time to hedge the cash flow variability of
our commodity trading activities. We have disclosed certain
information regarding these derivative positions, including the fair value of
our derivative positions, in Note 20—“Financial Instruments” of our Notes to
Consolidated Financial Statements. We record changes in the fair
value of our derivative positions in our LNG and natural gas marketing revenue
on our Consolidated Statement of Operations based on the value for which the
derivative instrument could be exchanged between willing parties. To
date, all of our derivative positions fair value determinations have been made
by management using quoted prices in active markets for identical
instruments. The ultimate fair value of our derivative instruments is
uncertain, and we believe that it is possible that a change in the estimated
fair value will occur in the near future as commodity prices
change.
Regulated
Natural Gas Pipelines
Our
developing natural gas pipeline business is subject to the jurisdiction of the
FERC in accordance with the Natural Gas Act of 1938 and the Natural Gas Policy
Act of 1978. The economic effects of regulation can result in a regulated
company recording as assets those costs that have been or are expected to be
approved for recovery from customers, or recording as liabilities those amounts
43
that are
expected to be required to be returned to customers, in a rate-setting process
in a period different from the period in which the amounts would be recorded by
an unregulated enterprise. Accordingly, we record assets and liabilities that
result from the regulated rate-making process that may not be recorded under
GAAP for non-regulated entities. We continually assess whether regulatory assets
are probable of future recovery by considering factors such as applicable
regulatory changes and recent rate orders applicable to other regulated
entities. Based on this continual assessment, we believe the existing regulatory
assets are probable of recovery. These regulatory assets and liabilities are
primarily classified in the Consolidated Balance Sheets as Other Assets and
Other Liabilities. We periodically evaluate their applicability under GAAP, and
consider factors such as regulatory changes and the effect of competition. If
cost-based regulation ends or competition increases, we may have to reduce our
asset balances to reflect a market basis less than cost and write-off the
associated regulatory assets and liabilities.
Items
that may influence our assessment are:
|
|
•
|
inability
to recover cost increases due to rate caps and rate case
moratoriums;
|
|
|
•
|
inability
to recover capitalized costs, including an adequate return on those costs
through the rate-making process and the FERC
proceedings;
|
|
|
•
|
excess
capacity;
|
|
|
•
|
increased
competition and discounting in the markets we serve;
and
|
|
|
•
|
impacts
of ongoing regulatory initiatives in the natural gas
industry.
|
Natural
gas pipeline costs include amounts capitalized as an Allowance for Funds Used
During Construction (“AFUDC”). The rates used in the calculation of AFUDC are
determined in accordance with guidelines established by the FERC. AFUDC
represents the cost of debt and equity funds used to finance our natural gas
pipeline additions during construction. AFUDC is capitalized as a part of the
cost of our natural gas pipelines. Under regulatory rate practices, we generally
are permitted to recover AFUDC, and a fair return thereon, through our rate base
after our natural gas pipelines are placed in service.
Cash
Flow Hedges
We have
used, and may in the future use, derivative instruments to limit our exposure to
variability in expected future cash flows. Cash flow hedge transactions hedge
the exposure to variability in expected future cash flows. In the case of cash
flow hedges, the hedged item (the underlying risk) is generally unrecognized
(i.e., not recorded on the consolidated balance sheet prior to settlement), and
any changes in the fair value, therefore, will not be recorded within earnings.
Conceptually, if a cash flow hedge is effective, this means that a variable,
such as a movement in interest rates, has been effectively fixed so that any
fluctuations will have no net result on either cash flows or earnings.
Therefore, if the changes in fair value of the hedged item are not recorded in
earnings, then the changes in fair value of the hedging instrument (the
derivative) must also be excluded from the income statement or else a one-sided
net impact on earnings will be reported, despite the fact that the establishment
of the effective hedge results in no net economic impact. To prevent such a
scenario from occurring, U.S. GAAP requires that the fair value of a derivative
instrument designated as a cash flow hedge to be recorded as an asset or
liability on the balance sheet, but with the offset reported as part of other
comprehensive income, to the extent that the hedge is effective. We assess, both
at the inception of each hedge and on an on-going basis, whether the derivatives
that are used in our hedging transactions are highly effective in offsetting
changes in cash flows of the hedged items. On an on-going basis, we monitor the
actual dollar offset of the hedges’ market values compared to hypothetical cash
flow hedges. Any ineffective portion of the cash flow hedges will be reflected
in earnings. Ineffectiveness is the amount of gains or losses from derivative
instruments that are not offset by corresponding and opposite gains or losses on
the expected future transaction.
Goodwill
Goodwill
represents the excess of cost over fair value of the assets of businesses
acquired. It is evaluated annually for impairment by first comparing our
management’s estimate of the fair value of a reporting unit with its carrying
value, including goodwill. If the carrying value of the reporting unit exceeds
its fair value, a computation of the implied fair value of the goodwill is
compared with its related carrying value. If the carrying value of the reporting
unit goodwill exceeds the implied fair value of that goodwill, an impairment
loss is recognized in the amount of the excess. We had goodwill of approximately
$76.8 million at December 31, 2009 and 2008, attributable to our LNG
receiving terminal segment.
We
perform an annual goodwill impairment review in the fourth quarter of each year,
although we may perform a goodwill impairment review more frequently whenever
events or circumstances indicate that the carrying value may not be recoverable.
As discussed above regarding our use of estimates, our judgments and assumptions
are inherent in our management’s estimate of future cash flows used to determine
the estimate of the reporting unit’s fair value. The use of alternate judgments
and/or assumptions could result in the recognition of different levels of
impairment charges in the consolidated financial statements.
44
Share-Based
Compensation Expense
We
recognize compensation expense for all share-based payments granted after
January 1, 2006 and prior to, but not yet vested as of, January 1,
2006, using the Black-Scholes-Merton option valuation model. We recognize
share-based compensation net of an estimated forfeiture rate and only recognize
compensation cost for those shares expected to vest on a straight-line basis
over the requisite service period of the award.
Determining
the appropriate fair value model and calculating the fair value of share-based
payment awards requires the use of highly subjective assumptions, including the
expected life of the share-based payment awards and stock price volatility. We
believe that implied volatility, calculated based on traded options of our
common stock, combined with historical volatility is an appropriate indicator of
expected volatility and future stock price trends. Therefore, the expected
volatility for the year ended December 31, 2009 used in our fair value
model was based on a combination of implied and historical volatilities. The
assumptions used in calculating the fair value of share-based payment awards
represent our best estimates, but these estimates involve inherent uncertainties
and the application of management judgment. As a result, if factors change and
we use different assumptions, our share-based compensation expense could be
materially different in the future. In addition, we are required to estimate the
expected forfeiture rate and only recognize expense for those shares expected to
vest. If our actual forfeiture rate is materially different from our estimate,
future share-based compensation expense could be significantly different from
what we have recorded in the current period (See Note 22—“Share-Based
Compensation” of our Notes to Consolidated Financial Statements).
Recent
Accounting Standards
In April
2009, the Financial Accounting Standards Board (“FASB”) issued a staff position
providing additional guidance on factors to consider in estimating fair value
when there has been a significant decrease in market activity for a financial
asset. The guidance was effective for interim and annual periods ending after
June 15, 2009. The implementation of this standard did not have a material
impact on our financial position, results of operations or cash
flow.
In April
2009, the FASB issued a staff position requiring fair value disclosures in both
interim as well as annual financial statements in order to provide more timely
information about the effects of current market conditions on financial
instruments. The guidance is effective for interim and annual periods ending
after June 15, 2009. The implementation of this standard did not have a material
impact on our financial position, results of operations or cash
flow.
In May
2009, the FASB issued new requirements for reporting subsequent events. These
requirements set forth the period after the balance sheet date during which
management of a reporting entity should evaluate events or transactions that may
occur for potential recognition or disclosure in the financial statements, the
circumstances under which an entity should recognize events or transactions
occurring after the balance sheet date in its financial statements, and
disclosures that an entity should make about events or transactions that
occurred after the balance sheet date. Disclosure of the date through which an
entity has evaluated subsequent events and the basis for that date is also
required. This disclosure should alert all users of financial statements that an
entity has not evaluated subsequent events after the date set forth in the
financial statements being presented. The Company started adhering to these
requirements in the second quarter of 2009.
In June
2009, the FASB issued an amendment to the accounting and disclosure requirements
for the consolidation of variable interest entities. The guidance affects the
overall consolidation analysis and requires enhanced disclosures on involvement
with variable interest entities. The guidance is effective for fiscal years
beginning after November 15, 2009. We do not expect the adoption of this
amendment to have a material impact on our financial position, results of
operations or cash flow.
In June
2009, the FASB issued SFAS No. 168, FASB Accounting Standards
Codification and the Hierarchy of Generally Accepted Accounting
Principles. SFAS No. 168 establishes the FASB Accounting Standards
Codification (the “Codification”) as the single source of authoritative GAAP
recognized by the FASB to be applied by nongovernmental entities. Rules and
interpretive releases of the SEC under authority of federal securities laws are
also sources of authoritative GAAP for SEC registrants. SFAS No. 168 and the
Codification are effective for financial statements issued for interim and
annual periods ending after September 15, 2009. As of July 1, 2009, the
Codification supersedes all existing non-SEC accounting and reporting standards.
We adopted this statement for the period ended September 30, 2009. The adoption
of this statement did not have an impact on our financial position, results of
operations or cash flow.
45
ITEM 7A.
QUANTITATIVE AND QUALITATIVE
DISCLOSURES ABOUT MARKET RISK
Cash
Investments
We have
cash investments that we manage based on internal investment guidelines that
emphasize liquidity and preservation of capital. Such cash investments are
stated at historical cost, which approximates fair market value on our
consolidated balance sheet.
Marketing
and Trading Commodity Price Risk
Through
Cheniere Marketing, from time to time we will enter into natural gas and foreign
currency derivatives to hedge the exposure of future cash flows associated with
the LNG that we hold. We use value at risk (“VaR”) and other
methodologies for market risk measurement and control purposes. The
VaR is calculated using the Monte Carlo simulation method. At December 31, 2009
and 2008, the one-day VaR with a 95% confidence interval on our derivative
positions was less than $0.1 million, respectively.
Our
derivative positions as of December 31, 2009 primarily consisted of
exchange cleared NYMEX natural gas swaps entered into to hedge the exposure to
variability in expected future cash flows related to the sale of commercial LNG
and excess LNG purchased for commissioning at the Sabine Pass LNG receiving
terminal. As of December 31, 2009, we had entered into a total of 7,465,000
MMBtu of NYMEX natural gas swaps through January 2011 for which we will receive
fixed prices of $4.903 to $7.151 per MMBtu. At December 31, 2009, the value
of the derivatives was a liability of $0.9 million.
46
INDEX
TO CONSOLIDATED FINANCIAL STATEMENTS
CHENIERE
ENERGY, INC. AND SUBSIDIARIES
47
Management’s
Report on Internal Control Over Financial Reporting
As
management, we are responsible for establishing and maintaining adequate
internal control over financial reporting for Cheniere Energy, Inc. and its
subsidiaries (“Cheniere”). In order to evaluate the effectiveness of internal
control over financial reporting, as required by Section 404 of the
Sarbanes-Oxley Act of 2002, we have conducted an assessment, including testing
using the criteria in Internal
Control—Integrated Framework issued by the Committee of Sponsoring
Organizations of the Treadway Commission (COSO). Cheniere’s system of internal
control over financial reporting is designed to provide reasonable assurance
regarding the reliability of financial reporting and the preparation of
financial statements for external purposes in accordance with accounting
principles generally accepted in the United States of America. Because of its
inherent limitations, internal control over financial reporting may not prevent
or detect misstatements and, even when determined to be effective, can only
provide reasonable assurance with respect to financial statement preparation and
presentation.
Based on
our assessment, we have concluded that Cheniere maintained effective internal
control over financial reporting as of December 31, 2009, based on criteria
in Internal Control—Integrated
Framework issued by the COSO.
Cheniere’s
independent auditors, Ernst & Young LLP, have issued an audit report on
Cheniere’s internal control over financial reporting
Management’s
Certifications
The
certifications of Cheniere’s Chief Executive Officer and Chief Financial Officer
required by the Sarbanes-Oxley Act of 2002 have been included as Exhibits 31 and
32 in Cheniere’s Form 10-K.
CHENIERE
ENERGY, INC.
|
By:
|
/s/
CHARIF SOUKI
|
By:
|
/s/
Meg A. Gentle
|
|
|
Charif
Souki
Chief
Executive Officer and President
|
Meg
A. Gentle
Senior
Vice President
and
Chief Financial Officer
|
48
The Board
of Directors and Stockholders of
Cheniere
Energy, Inc.
We have
audited the accompanying consolidated balance sheets of Cheniere Energy, Inc.
and subsidiaries as of December 31, 2009 and 2008, and the related
consolidated statements of operations, stockholders’ (deficit) equity, and cash
flows for each of the three years in the period ended December 31, 2009.
Our audits also included the financial statement schedule listed in the Index at
Item 15(a). These financial statements and schedule are the responsibility of
the Company’s management. Our responsibility is to express an opinion on these
financial statements and schedule based on our audits.
We
conducted our audits in accordance with the standards of the Public Company
Accounting Oversight Board (United States). Those standards require that we plan
and perform the audit to obtain reasonable assurance about whether the financial
statements are free of material misstatement. An audit includes examining, on a
test basis, evidence supporting the amounts and disclosures in the financial
statements. An audit also includes assessing the accounting principles used and
significant estimates made by management, as well as evaluating the overall
financial statement presentation. We believe that our audits provide a
reasonable basis for our opinion.
In our
opinion, the financial statements referred to above present fairly, in all
material respects, the consolidated financial position of Cheniere Energy, Inc.
and subsidiaries at December 31, 2009 and 2008, and the consolidated
results of their operations and their cash flows for each of the three years in
the period ended December 31, 2009, in conformity with U.S. generally
accepted accounting principles. Also, in our opinion, the related financial
statement schedule, when considered in relation to the basic financial
statements taken as a whole, presents fairly in all material respects the
information set forth therein.
As
described in Note 2 of the consolidated financial statements, on January 1,
2009, Cheniere Energy, Inc. adopted an accounting standard requiring issuers of
certain convertible debt instruments to separately account for the liability
component and the equity component represented by the embedded conversion
option. Also on January 1, 2009, Cheniere Energy, Inc. adopted an
accounting standard on accounting and reporting for non-controlling
interest. Both accounting standards were adopted on a
retrospective basis resulting in revision of the December 31, 2008 balance
sheet.
We also
have audited, in accordance with the standards of the Public Company Accounting
Oversight Board (United States), Cheniere Energy, Inc.’s internal control over
financial reporting as of December 31, 2009, based on criteria established
in Internal Control-Integrated Framework issued by the Committee of Sponsoring
Organizations of the Treadway Commission, and our report dated February 25,
2010 expressed an unqualified opinion thereon.
|
/s/ ERNST
& YOUNG LLP
|
|
ERNST &
YOUNG LLP
|
Houston,
Texas
February 25,
2010
49
REPORT
OF INDEPENDENT REGISTERED PUBLIC ACCOUNTING FIRM
The Board
of Directors and Stockholders of
Cheniere
Energy, Inc.
We have
audited Cheniere Energy, Inc. and subsidiaries’ internal control over financial
reporting as of December 31, 2009, based on criteria established in Internal
Control—Integrated Framework issued by the Committee of Sponsoring Organizations
of the Treadway Commission (the COSO criteria). Cheniere Energy, Inc. and
subsidiaries’ management is responsible for maintaining effective internal
control over financial reporting, and for its assessment of the effectiveness of
internal control over financial reporting included in the accompanying
Management’s Report on Internal Control Over Financial Reporting. Our
responsibility is to express an opinion on the company’s internal control over
financial reporting based on our audit.
We
conducted our audit in accordance with the standards of the Public Company
Accounting Oversight Board (United States). Those standards require that we plan
and perform the audit to obtain reasonable assurance about whether effective
internal control over financial reporting was maintained in all material
respects. Our audit included obtaining an understanding of internal control over
financial reporting, assessing the risk that a material weakness exists, testing
and evaluating the design and operating effectiveness of internal control based
on the assessed risk, and performing such other procedures as we considered
necessary in the circumstances. We believe that our audit provides a reasonable
basis for our opinion.
A
company’s internal control over financial reporting is a process designed to
provide reasonable assurance regarding the reliability of financial reporting
and the preparation of financial statements for external purposes in accordance
with generally accepted accounting principles. A company’s internal control over
financial reporting includes those policies and procedures that (1) pertain to
the maintenance of records that, in reasonable detail, accurately and fairly
reflect the transactions and dispositions of the assets of the company; (2)
provide reasonable assurance that transactions are recorded as necessary to
permit preparation of financial statements in accordance with generally accepted
accounting principles, and that receipts and expenditures of the company are
being made only in accordance with authorizations of management and directors of
the company; and (3) provide reasonable assurance regarding prevention or timely
detection of unauthorized acquisition, use or disposition of the company’s
assets that could have a material effect on the financial
statements.
Because
of its inherent limitations, internal control over financial reporting may not
prevent or detect misstatements. Also, projections of any evaluation of
effectiveness to future periods are subject to the risk that controls may become
inadequate because of changes in conditions, or that the degree of compliance
with the policies or procedures may deteriorate.
In our
opinion, Cheniere Energy, Inc. and subsidiaries maintained, in all material
respects, effective internal control over financial reporting as of December 31,
2009, based on the COSO criteria.
We also
have audited, in accordance with the standards of the Public Company Accounting
Oversight Board (United States), the consolidated balance sheets of Cheniere
Energy, Inc. and subsidiaries as of December 31, 2009 and 2008, and the
related consolidated statements of operations, stockholders’ (deficit) equity,
and cash flows for each of the three years in the period ended December 31,
2009 and our reported dated 25, February 2010 expressed an unqualified opinion
thereon.
|
/s/ ERNST
& YOUNG LLP
|
|
ERNST &
YOUNG LLP
|
Houston, Texas
February 25, 2010
50
CHENIERE
ENERGY, INC. AND SUBSIDIARIES
(in
thousands, except share data)
|
December
31,
|
||||||||
|
2009
|
2008
|
|||||||
|
ASSETS
|
(as
adjusted)
|
|||||||
|
CURRENT
ASSETS
|
||||||||
|
Cash
and cash equivalents
|
$ | 88,372 | $ | 102,192 | ||||
|
Restricted
cash and cash equivalents
|
138,309 | 301,550 | ||||||
|
Accounts
and interest receivable
|
9,899 | 3,630 | ||||||
|
LNG
inventory
|
32,602 | — | ||||||
|
Prepaid
expenses and other
|
17,093 | 9,220 | ||||||
|
Total
current assets
|
286,275 | 416,592 | ||||||
|
NON-CURRENT
RESTRICTED CASH AND CASH EQUIVALENTS
|
82,892 | 138,483 | ||||||
|
NON-CURRENT
RESTRICTED U.S. TREASURY SECURITIES
|
— | 20,829 | ||||||
|
PROPERTY,
PLANT AND EQUIPMENT, NET
|
2,216,855 | 2,170,158 | ||||||
|
DEBT
ISSUANCE COSTS, NET
|
47,043 | 55,688 | ||||||
|
GOODWILL
|
76,819 | 76,844 | ||||||
|
INTANGIBLE
LNG ASSETS
|
6,088 | 6,106 | ||||||
|
LNG
HELD FOR COMMISSIONING
|
— | 9,923 | ||||||
|
ADVANCES
UNDER LONG-TERM CONTRACTS
|
1,021 | 10,705 | ||||||
|
OTHER
|
15,629 | 14,754 | ||||||
|
Total
assets
|
$ | 2,732,622 | $ | 2,920,082 | ||||
|
LIABILITIES
AND STOCKHOLDERS’ DEFICIT
|
||||||||
|
CURRENT
LIABILITIES
|
||||||||
|
Accounts
payable
|
$ | 426 | $ | 1,220 | ||||
|
Accrued
liabilities
|
38,425 | 61,883 | ||||||
|
Deferred
revenue
|
26,456 | 2,500 | ||||||
|
Other
|
905 | 530 | ||||||
|
Total
current liabilities
|
66,212 | 66,133 | ||||||
|
LONG-TERM
DEBT, NET OF DISCOUNT
|
2,692,740 | 2,750,308 | ||||||
|
LONG-TERM
DEBT—RELATED PARTIES
|
349,135 | 332,054 | ||||||
|
DEFERRED
REVENUE
|
33,500 | 37,500 | ||||||
|
OTHER
NON-CURRENT LIABILITIES
|
23,162 | 8,141 | ||||||
|
COMMITMENTS
AND CONTINGENCIES
|
— | — | ||||||
|
STOCKHOLDERS’
DEFICIT
|
||||||||
|
Preferred
stock, $.0001 par value, 5,000,000 shares authorized, none
issued
|
— | — | ||||||
|
Common
stock, $.003 par value
|
||||||||
|
Authorized:
240,000,000 and 120,000,000 shares at December 31, 2009 and
2008
|
||||||||
|
Issued
and outstanding: 56,651,000 and 52,297,000 shares at December 31,
2009 and 2008, respectively
|
170 | 157 | ||||||
|
Treasury
stock: 697,000 and 179,000 shares at December 31, 2009 and 2008,
respectively, at cost
|
(1,494 | ) | (496 | ) | ||||
|
Additional
paid-in-capital
|
336,971 | 300,033 | ||||||
|
Accumulated
deficit
|
(985,246 | ) | (823,756 | ) | ||||
|
Accumulated
other comprehensive loss
|
(133 | ) | (154 | ) | ||||
|
Total
stockholders’ deficit
|
(649,732 | ) | (524,216 | ) | ||||
|
NON-CONTROLLING
INTEREST
|
217,605 | 250,162 | ||||||
|
Total
deficit
|
(432,127 | ) | (274,054 | ) | ||||
|
Total
liabilities and deficit
|
$ | 2,732,622 | $ | 2,920,082 | ||||
The
accompanying notes are an integral part of these consolidated financial
statements.
51
CHENIERE
ENERGY, INC. AND SUBSIDIARIES
(in
thousands, except per share data)
|
Year
Ended December 31,
|
||||||||||||
|
2009
|
2008
|
2007
|
||||||||||
|
(as
adjusted)
|
(as
adjusted)
|
|||||||||||
|
Revenues
|
||||||||||||
|
LNG
receiving terminal revenue
|
$ | 170,071 | $ | — | $ | — | ||||||
|
Oil
and gas sales
|
2,866 | 4,215 | 5,376 | |||||||||
|
Marketing
and trading gain (loss)
|
8,087 | 2,914 | (4,729 | ) | ||||||||
|
Pipeline
revenue
|
102 | 15 | — | |||||||||
|
Total
revenues
|
181,126 | 7,144 | 647 | |||||||||
|
Operating
costs and expenses
|
||||||||||||
|
LNG
receiving terminal and pipeline development expense
|
223 | 10,556 | 34,656 | |||||||||
|
LNG
receiving terminal and pipeline operating expense
|
36,857 | 14,522 | — | |||||||||
|
Exploration
costs
|
— | 128 | 1,116 | |||||||||
|
Oil
and gas production costs
|
471 | 398 | 358 | |||||||||
|
Impairment
of fixed assets
|
— | — | 18 | |||||||||
|
Depreciation,
depletion and amortization
|
54,229 | 24,346 | 6,393 | |||||||||
|
General
and administrative expenses
|
65,830 | 122,678 | 122,046 | |||||||||
|
Restructuring
charges
|
20 | 78,704 | — | |||||||||
|
Total
operating costs and expenses
|
157,630 | 251,332 | 164,587 | |||||||||
|
Income
(loss) from operations
|
23,496 | (244,188 | ) | (163,940 | ) | |||||||
|
Loss
from equity method investments
|
— | (4,800 | ) | (191 | ) | |||||||
|
Gain/(loss)
on early extinguishment of debt
|
45,363 | (10,691 | ) | — | ||||||||
|
Derivative
gain
|
5,277 | 4,652 | — | |||||||||
|
Interest
expense, net
|
(243,295 | ) | (147,136 | ) | (119,360 | ) | ||||||
|
Interest
income
|
1,405 | 20,337 | 82,635 | |||||||||
|
Other
income
|
99 | 90 | 851 | |||||||||
|
Loss
before income taxes and non-controlling interest
|
(167,655 | ) | (381,736 | ) | (200,005 | ) | ||||||
|
Income
tax provision
|
— | — | — | |||||||||
|
Loss
before non-controlling interest
|
(167,655 | ) | (381,736 | ) | (200,205 | ) | ||||||
|
Non-controlling
interest
|
6,165 | 8,777 | 3,425 | |||||||||
|
Net
loss
|
$ | (161,490 | ) | $ | (372,959 | ) | $ | (196,580 | ) | |||
|
Net
loss per common share—basic and diluted
|
$ | (3.13 | ) | $ | (7.87 | ) | $ | (3.89 | ) | |||
|
Weighted
average number of common shares outstanding—basic and
diluted
|
51,598 | 47,365 | 50,537 | |||||||||
The
accompanying notes are an integral part of these consolidated financial
statements.
52
CHENIERE
ENERGY, INC. AND SUBSIDIARIES
(in
thousands)
|
Accumulated
|
||||||||||||||||||||||||||
|
Additional
|
Other
|
Non-
|
Total
|
|||||||||||||||||||||||
|
Common
Stock
|
Treasury
Stock
|
Paid-in
|
Accumulated
|
Comprehensive
|
controlling
|
Equity
|
||||||||||||||||||||
|
Shares
|
Amount
|
Shares
|
Amount
|
Capital
|
Deficit
|
Loss
|
Interest
|
(Deficit)
|
||||||||||||||||||
|
Balance—December
31, 2006
|
55,213
|
$
|
166
|
—
|
$
|
—
|
$
|
390,256
|
$
|
(247,141
|
)
|
$
|
(34
|
)
|
$
|
—
|
$
|
143,247
|
||||||||
|
Cumulative
effect of accounting change
|
—
|
—
|
—
|
—
|
118,744
|
(7,076
|
)
|
111,668
|
||||||||||||||||||
|
Balance—December
31, 2006 (as adjusted)
|
55,213
|
166
|
—
|
—
|
509,000
|
(254,217
|
)
|
(34
|
)
|
—
|
254,915
|
|||||||||||||||
|
Issuances
of stock
|
688
|
2
|
—
|
—
|
3,155
|
—
|
—
|
—
|
3,157
|
|||||||||||||||||
|
Issuances
of restricted stock
|
1,029
|
2
|
—
|
—
|
(2
|
)
|
—
|
—
|
—
|
—
|
||||||||||||||||
|
Forfeitures
of restricted stock
|
(20
|
)
|
—
|
20
|
—
|
—
|
—
|
—
|
—
|
—
|
||||||||||||||||
|
Stock-based
compensation
|
—
|
—
|
—
|
—
|
58,331
|
—
|
—
|
—
|
58,331
|
|||||||||||||||||
|
Treasury
stock acquired
|
(9,179
|
)
|
(27
|
)
|
9,179
|
(325,101
|
)
|
27
|
—
|
—
|
—
|
(325,101
|
)
|
|||||||||||||
|
Treasury
stock retired
|
—
|
—
|
(7
|
)
|
62
|
(62
|
)
|
—
|
—
|
—
|
—
|
|||||||||||||||
|
Comprehensive
loss: Foreign currency translation
|
—
|
—
|
—
|
—
|
—
|
—
|
29
|
—
|
29
|
|||||||||||||||||
|
Net
proceeds from non-controlling interest
|
—
|
—
|
—
|
—
|
—
|
—
|
—
|
302,731
|
302,731
|
|||||||||||||||||
|
Loss
attributable to non-controlling interest
|
—
|
—
|
—
|
—
|
—
|
—
|
—
|
(3,425
|
)
|
(3,425
|
)
|
|||||||||||||||
|
Distribution
to non-controlling interest
|
—
|
—
|
—
|
—
|
—
|
—
|
—
|
(13,631
|
)
|
(13,631
|
)
|
|||||||||||||||
|
Net
loss (as adjusted)
|
—
|
—
|
—
|
—
|
—
|
(196,580
|
)
|
—
|
—
|
(196,580
|
)
|
|||||||||||||||
|
Balance—December
31, 2007
|
47,731
|
143
|
9,192
|
(325,039
|
)
|
570,449
|
(450,797
|
)
|
(5
|
)
|
285,675
|
80,426
|
||||||||||||||
|
Issuances
of stock
|
145
|
—
|
—
|
—
|
472
|
—
|
—
|
—
|
472
|
|||||||||||||||||
|
Issuances
of restricted stock
|
4,910
|
15
|
—
|
—
|
(15
|
)
|
—
|
—
|
—
|
—
|
||||||||||||||||
|
Forfeitures
of restricted stock
|
(172
|
)
|
—
|
172
|
—
|
—
|
—
|
—
|
—
|
—
|
||||||||||||||||
|
Stock-based
compensation
|
—
|
—
|
—
|
—
|
58,571
|
—
|
—
|
—
|
58,571
|
|||||||||||||||||
|
Treasury
stock acquired
|
(317
|
)
|
(1
|
)
|
317
|
(4,901
|
)
|
—
|
—
|
—
|
—
|
(4,902
|
)
|
|||||||||||||
|
Treasury
stock retired
|
—
|
—
|
(9,502
|
)
|
329,444
|
(329,444
|
)
|
—
|
—
|
—
|
—
|
|||||||||||||||
|
Comprehensive
gain (loss): Foreign currency translation
|
—
|
—
|
—
|
—
|
—
|
—
|
(149
|
)
|
—
|
(149
|
)
|
|||||||||||||||
|
Loss
attributable to non-controlling interest
|
—
|
—
|
—
|
—
|
—
|
—
|
—
|
(9,120
|
)
|
(9,120
|
)
|
|||||||||||||||
|
Distribution
to non-controlling interest
|
—
|
—
|
—
|
—
|
—
|
—
|
—
|
(26,393
|
)
|
(26,393
|
)
|
|||||||||||||||
|
Net
loss (as adjusted)
|
—
|
—
|
—
|
—
|
—
|
(372,959
|
)
|
—
|
—
|
(372,959
|
)
|
|||||||||||||||
|
Balance—December
31, 2008
|
52,297
|
157
|
179
|
(496
|
)
|
300,033
|
(823,756
|
)
|
(154
|
)
|
250,162
|
(274,054
|
)
|
|||||||||||||
|
Issuances
of stock
|
3,985
|
12
|
—
|
—
|
16,212
|
—
|
—
|
—
|
16,224
|
|||||||||||||||||
|
Issuances
of restricted stock
|
886
|
3
|
—
|
—
|
(3
|
)
|
—
|
—
|
—
|
—
|
||||||||||||||||
|
Forfeitures
of restricted stock
|
(89
|
)
|
—
|
89
|
—
|
—
|
—
|
—
|
—
|
—
|
||||||||||||||||
|
Stock-based
compensation
|
—
|
—
|
—
|
—
|
20,728
|
—
|
—
|
—
|
20,728
|
|||||||||||||||||
|
Treasury
stock acquired
|
(428
|
)
|
(2
|
)
|
429
|
(998
|
)
|
1
|
—
|
—
|
—
|
(999
|
)
|
|||||||||||||
|
Comprehensive
loss: Foreign currency translation
|
—
|
—
|
—
|
—
|
—
|
—
|
21
|
—
|
21
|
|||||||||||||||||
|
Loss
attributable to non-controlling interest
|
—
|
—
|
—
|
—
|
—
|
—
|
—
|
(6,165
|
)
|
(6,165
|
)
|
|||||||||||||||
|
Distribution
to non-controlling interest
|
—
|
—
|
—
|
—
|
—
|
—
|
—
|
(26,392
|
)
|
(26,392
|
)
|
|||||||||||||||
|
Net
loss
|
—
|
—
|
—
|
—
|
—
|
(161,490
|
)
|
—
|
—
|
(161,490
|
)
|
|||||||||||||||
|
Balance—December
31, 2009
|
56,651
|
$
|
170
|
697
|
$
|
(1,494
|
)
|
$
|
336,971
|
$
|
(985,246
|
)
|
$
|
(133
|
)
|
$
|
217,605
|
$
|
(432,127
|
)
|
||||||
The
accompanying notes are an integral part of these consolidated financial
statements.
53
CHENIERE
ENERGY, INC. AND SUBSIDIARIES
(in
thousands)
|
Year Ended December
31,
|
||||||||||||
|
2009
|
2008
|
2007
|
||||||||||
|
CASH
FLOWS FROM OPERATING ACTIVITIES:
|
(as
adjusted)
|
(as
adjusted)
|
||||||||||
|
Net
loss
|
$ | (161,490 | ) | $ | (372,959 | ) | $ | (196,580 | ) | |||
|
Adjustments
to reconcile net loss to net cash used in operating
activities:
|
||||||||||||
|
Depreciation,
depletion and amortization
|
54,229 | 24,346 | 6,393 | |||||||||
|
(Gain)/loss
on early extinguishment of debt
|
(45,363 | ) | 10,716 | — | ||||||||
|
Non-cash
interest expense on 2008 Convertible Loans
|
32,321 | 11,393 | — | |||||||||
|
Amortization
of debt issuance and discount costs
|
27,549 | 26,435 | 21,123 | |||||||||
|
Non-cash
compensation
|
19,204 | 55,030 | 56,638 | |||||||||
|
Non-cash
inventory write-downs
|
3,516 | — | — | |||||||||
|
Non-controlling
interest
|
(6,165 | ) | (8,777 | ) | (3,425 | ) | ||||||
|
Restricted
interest income on restricted cash and cash equivalents
|
(2,794 | ) | (18,495 | ) | (53,327 | ) | ||||||
|
Use
of restricted cash and cash equivalents
|
1,353 | 94,610 | 103,043 | |||||||||
|
Non-cash
restructuring charges
|
415 | 17,669 | — | |||||||||
|
Other
|
2,232 | (3,311 | ) | 1,015 | ||||||||
|
Changes
in operating assets and liabilities:
|
||||||||||||
|
Accounts
and interest receivable
|
(1,343 | ) | 45,157 | (41,654 | ) | |||||||
|
Accounts
payable and accrued liabilities
|
253 | (42,066 | ) | 42,007 | ||||||||
|
LNG
inventory
|
(32,628 | ) | — | — | ||||||||
|
Deferred
revenue
|
19,956 | — | — | |||||||||
|
Prepaid
expenses and other
|
(9,102 | ) | 18,107 | (19,524 | ) | |||||||
|
NET
CASH USED IN OPERATING ACTIVITIES
|
(97,857 | ) | (142,145 | ) | (84,291 | ) | ||||||
|
CASH
FLOWS FROM INVESTING ACTIVITIES:
|
||||||||||||
|
LNG
terminal and pipeline construction-in-process, net
|
(112,317 | ) | (583,871 | ) | (788,517 | ) | ||||||
|
Use
of restricted cash and cash equivalents
|
110,399 | 465,323 | 526,318 | |||||||||
|
Distributions
from limited partnership investment
|
15,300 | — | — | |||||||||
|
Purchases
of intangible and fixed assets, net of sales
|
(522 | ) | (2,889 | ) | (41,684 | ) | ||||||
|
Oil
and gas property, net of sales
|
(474 | ) | (564 | ) | 17 | |||||||
|
Use
of (investment in) restricted U.S. Treasury securities
|
— | 16,702 | (98,442 | ) | ||||||||
|
Purchases
of LNG commissioning, net of amounts transferred to LNG terminal
construction-in-process
|
— | (9,923 | ) | — | ||||||||
|
Advances
under long-term contracts, net of transfers to
construction-in-process
|
— | (14,032 | ) | (38,617 | ) | |||||||
|
Other
|
(402 | ) | (3,808 | ) | 1,031 | |||||||
|
NET
CASH PROVIDED BY (USED IN) INVESTING ACTIVITIES
|
11,984 | (133,062 | ) | (439,894 | ) | |||||||
|
CASH
FLOWS FROM FINANCING ACTIVITIES:
|
||||||||||||
|
Use
of (investment in) restricted cash and cash equivalents
|
130,702 | (248,767 | ) | 725 | ||||||||
|
Repayment
of debt
|
(30,030 | ) | (95,000 | ) | — | |||||||
|
Distributions
to non-controlling interest
|
(26,392 | ) | (26,393 | ) | (13,631 | ) | ||||||
|
Purchase
of treasury shares
|
(999 | ) | (4,902 | ) | (325,101 | ) | ||||||
|
Debt
issuance cost
|
(121 | ) | (34,504 | ) | (9,787 | ) | ||||||
|
Proceeds
from debt issuance
|
— | 239,965 | — | |||||||||
|
Proceeds
from debt issuance—related parties
|
— | 250,000 | — | |||||||||
|
Proceeds
from sale of common units in partnership
|
— | — | 203,946 | |||||||||
|
Proceeds
from issuance of common units to non-controlling owners in
partnership
|
— | — | 98,442 | |||||||||
|
Proceeds
from 2007 term loan
|
— | — | 400,000 | |||||||||
|
Other
|
(1,107 | ) | 470 | 3,158 | ||||||||
|
NET
CASH PROVIDED BY FINANCING ACTIVITIES
|
72,053 | 80,869 | 357,752 | |||||||||
|
NET
DECREASE IN CASH AND CASH EQUIVALENTS
|
(13,820 | ) | (194,338 | ) | (166,433 | ) | ||||||
|
CASH
AND CASH EQUIVALENTS—BEGINNING OF PERIOD
|
102,192 | 296,530 | 462,963 | |||||||||
|
CASH
AND CASH EQUIVALENTS—END OF PERIOD
|
$ | 88,372 | $ | 102,192 | $ | 296,530 | ||||||
The
accompanying notes are an integral part of these consolidated financial
statements.
54
CHENIERE
ENERGY, INC. AND SUBSIDIARIES
NOTE
1—ORGANIZATION AND NATURE OF OPERATIONS
Cheniere
Energy, Inc., a Delaware corporation, is a Houston-based energy company
primarily engaged in LNG-related businesses. We own and operate the
Sabine Pass LNG receiving terminal in Louisiana through our 90.6% ownership
interest in and management agreements with Cheniere Energy Partners, L.P.
(“Cheniere Partners”), which is a publicly traded partnership we created in
2007. We also own and operate the Creole Trail Pipeline, which
interconnects the Sabine Pass LNG receiving terminal with downstream
markets. One of our subsidiaries, Cheniere Marketing, LLC (“Cheniere
Marketing”), is marketing LNG and natural gas and is developing a portfolio of
long-term and short-term contracts to monetize capacity at the Sabine Pass LNG
receiving terminal and the Creole Trail Pipeline. We own 30% of the
limited partnership interests of Freeport LNG Development, L.P. (“Freeport
LNG”), which operates the Freeport LNG receiving terminal. We are
also in various stages of developing other LNG receiving terminal and pipeline
related projects, which, among other things, will require commercial
justification before we make a final investment decision. In
addition, we are engaged to a limited extent in oil and natural gas exploration
and development activities in the Gulf of Mexico. Unless the context
requires otherwise, references to the “Company”, “Cheniere”, “we”, “us” and
“our” refer to Cheniere Energy, Inc. and its subsidiaries, including our
publicly traded subsidiary partnership, Cheniere Partners.
We have
evaluated subsequent events through February 25, 2010.
NOTE
2—SUMMARY OF SIGNIFICANT ACCOUNTING POLICIES
Basis
of Presentation
Our
Consolidated Financial Statements were prepared in accordance with accounting
principles generally accepted in the United States of America. The consolidated
financial statements include the accounts of Cheniere Energy, Inc. and its
majority-owned subsidiaries. We also hold ownership interests in entities that
are accounted for under the equity method of accounting. All significant
intercompany accounts and transactions have been eliminated in
consolidation.
Certain
reclassifications have been made to conform prior period information to the
current presentation. The reclassifications had no effect on our
overall consolidated financial position, results of operations or cash
flows.
Liquidity
As of
December 31, 2009, we had unrestricted cash and cash equivalents of $88.4
million that was available to Cheniere (excluding Cheniere Partners and Sabine
Pass LNG). In addition, we had restricted cash and cash equivalents of $221.2
million, which were designated for the following purposes: $117.4 million for
Sabine Pass LNG’s working capital; $96.1 million for interest payments related
to the Senior Notes described below; and $7.7 million for other restricted
purposes. We believe that we have sufficient cash, other working
capital and cash generated from our operations to fund our operating
expenses and other cash requirements until at least the
earliest date when principal payments may be required on our
existing indebtedness, which is August 2011. Before such time, we will need
to restructure our finances and improve our capital structure, which may be
accomplished by entering into long-term TUAs or LNG purchase agreements,
refinancing our existing indebtedness, issuing equity or other securities,
selling assets or a combination of the foregoing.
Our
ability to enhance near-term liquidity and improve our capital structure is
dependent on numerous factors, including the availability of credit, the balance
of worldwide and domestic supply and demand for natural gas and LNG, and the
relative prices for natural gas in North America and international
markets. We face numerous financial, market and operational risks in
connection with improving our liquidity situation, many of which are beyond our
control.
55
CHENIERE
ENERGY, INC. AND SUBSIDIARIES
NOTES
TO CONSOLIDATED FINANCIAL STATEMENTS—Continued
Recent
Accounting Developments
Effective
January 1, 2009, we adopted an accounting standard that requires the
presentation of non-controlling interests (previously shown as minority
interest) as a component of equity on our Consolidated Balance Sheets and
Consolidated Statement of Equity (Deficit). The adoption of this accounting
standard did not have any other material impact on our financial position,
results of operations or cash flow.
Effective
January 1, 2009, we adopted an accounting standard that requires issuers of
certain convertible debt instruments to separately account for the liability
component and the equity component represented by the embedded conversion option
in a manner that will reflect that entity’s nonconvertible debt borrowing rate
when interest cost is recognized in subsequent periods. Upon settlement, the
entity shall allocate consideration transferred and transaction costs incurred
to the extinguishment of the liability component and the reacquisition of the
equity component. We adopted this accounting standard January 1, 2009 and
applied it retrospectively to all periods presented.
Our 2¼%
Convertible Senior Unsecured Notes due 2012 (“Convertible Senior Unsecured
Notes”) are impacted by this change. The fair value of the embedded
conversion option at the date of issuance was determined to be $134.0 million
and has been recorded as a debt discount to the Convertible Senior Unsecured
Notes, with a corresponding adjustment to Additional Paid-in
Capital. This debt discount is being amortized over the term of the
underlying Convertible Senior Unsecured Notes.
As a
result of the adoption, adjustments have been made to the consolidated financial
statements of prior periods. The following table summarizes the incremental
effect of the adoption on our Consolidated Statements of Operations and
per-share amounts for the years ended December 31, 2008 and 2007 (in thousands,
except per share amounts):
|
Year
Ended
December
31, 2008
|
Years
Ended
December
31, 2007
|
|||||||||||||||||||||||
|
Prior
to
adoption
|
Effect
of
adoption
|
As
adjusted
|
Prior
to
adoption
|
Effect
of
adoption
|
As
adjusted
|
|||||||||||||||||||
|
Increase:
|
||||||||||||||||||||||||
|
Interest
expense, net
|
$
|
(130,648
|
)
|
$
|
(16,488
|
)
|
$
|
(147,136
|
)
|
$
|
(104,557
|
)
|
$
|
(14,803
|
)
|
$
|
(119,360
|
)
|
||||||
|
Net
loss
|
(356,471
|
)
|
(16,488
|
)
|
(372,959
|
)
|
(181,777
|
)
|
(14,803
|
)
|
(196,580
|
)
|
||||||||||||
|
Basic
and diluted net loss per share
|
$
|
(7.53
|
)
|
$
|
(0.34
|
)
|
$
|
(7.87
|
)
|
$
|
(3.60
|
)
|
$
|
(0.29
|
)
|
$
|
(3.89
|
)
|
||||||
The
incremental effect of the adoption on our Consolidated Balance Sheet as of
December 31, 2008 is presented as follows (in thousands):
|
December
31, 2008
|
||||||||||||
|
Prior
to
adoption
|
Effect
of
adoption
|
As
adjusted
|
||||||||||
|
Increase/(decrease):
|
||||||||||||
|
Debt
issuance costs
|
$
|
57,676
|
$
|
(1,988
|
)
|
$
|
55,688
|
|||||
|
Long-term
debt, net of discount
|
2,832,673
|
(82,365
|
)
|
2,750,308
|
||||||||
|
Additional
paid-in capital
|
181,289
|
118,744
|
300,033
|
|||||||||
|
Accumulated
deficit
|
(785,389
|
)
|
(38,367
|
)
|
(823,756
|
)
|
||||||
Debt
issuance costs decreased $2.0 million, representing the cumulative adjustment
caused by a portion of debt issuance costs being reclassified to additional
paid-in capital.
The
cumulative effect of the change in accounting principles was a net loss of $7.1
million, recorded as an adjustment to our accumulated deficit as of January 1,
2007, from the retrospective increase in interest expense through December 31,
2006.
Accounting
for LNG Activities
Generally,
we begin capitalizing the costs of our LNG receiving terminals and related
pipelines once the individual project meets the following criteria:
(i) regulatory approval has been received, (ii) financing for the
project is available and (iii) management has committed to commence
construction. Prior to meeting these criteria, most of the costs associated with
a project are expensed as incurred. These costs primarily include professional
fees associated with front-end engineering and design work, costs of securing
56
CHENIERE
ENERGY, INC. AND SUBSIDIARIES
NOTES
TO CONSOLIDATED FINANCIAL STATEMENTS—Continued
necessary
regulatory approvals, and other preliminary investigation and development
activities related to our LNG receiving terminals and related
pipelines.
Generally,
costs that are capitalized prior to a project meeting the criteria otherwise
necessary for capitalization include: land and lease option costs that are
capitalized as property, plant and equipment and certain permits that are
capitalized as intangible LNG assets. The costs of lease options are amortized
over the life of the lease once obtained. If no lease is obtained, the costs are
expensed.
We
capitalize interest and other related debt costs during the construction period
of our LNG receiving terminals. Upon commencement of operations, capitalized
interest, as a component of the total cost, will be amortized over the estimated
useful life of the asset.
Revenue
Recognition
The
Sabine Pass LNG receiving terminal LNG regasification capacity reservation fees
are recognized as revenue over the term of the respective terminal use agreement
(“TUA”). Advance payments of capacity reservation fees are initially deferred
and recognized as revenue and are being amortized over a 10-year period as a
reduction of each customer’s regasification capacity reservation fees payable
under its TUA. The retained 2% of LNG delivered for each customer’s account at
the Sabine Pass LNG receiving terminal is recognized as revenues as Sabine Pass
LNG performs the services set forth in each customer’s TUA.
Revenues
from the sale of oil and gas production are recognized upon passage of title,
net of royalty interests. When sales volumes differ from our entitled share, an
underproduced or overproduced imbalance occurs. To the extent an overproduced
imbalance exceeds our share of the remaining estimated proved natural gas
reserves for a given property, we record a liability. At December 31, 2009
and 2008, we had no gas imbalances.
LNG
and Natural Gas Marketing
We have
determined that our LNG and natural gas marketing business activities are energy
trading and risk management activities for trading purposes and have elected to
present these activities on a net basis on our Consolidated Statement of
Operations. Marketing and trading revenues represent the margin
earned on the purchase and transportation of LNG purchases and subsequent sales
of natural gas to third parties. These energy trading and risk management
activities include, but are not limited to: purchase of LNG and natural gas,
transportation contracts, and derivatives. Below is a brief
description of our accounting treatment of each type of energy trading and risk
management activity and how we account for it:
Purchase
of LNG and natural gas
The
purchase value of LNG or natural gas inventory is recorded as an asset on our
Consolidated Balance Sheet at the cost to acquire the product. Our inventory is
subject to lower-of-cost-or-market adjustment each
quarter. Recoveries of losses resulting from interim period LCM
adjustments are made due to market price recoveries on the same inventory in the
same fiscal year and are recognized as gains in later interim periods with such
gains not exceeding previously recognized losses. Any adjustment to
our inventory is recorded on a net basis as LNG and natural gas marketing
revenue on our Consolidated Statement of Operations.
Transportation
contracts
We enter
into transportation contracts with respect to the transport of LNG or natural
gas to a specific location for storage or sale. Transportation costs
that are incurred during the purchase of LNG or natural gas are capitalized as
part of the acquisition costs of the product. Transportation costs
incurred to sell LNG or natural gas are recorded on a net basis as LNG and
natural gas marketing revenue on our Consolidated Statement of
Operations.
Derivatives
We use
derivative instruments from time to time to hedge the cash flow variability of
our commodity trading activities. We have disclosed certain
information regarding these derivative positions, including the fair value of
our derivative positions, in Note 20—“Financial Instruments” of our Notes to
Consolidated Financial Statements. We record changes in the fair
value of our derivative positions in our LNG and natural gas marketing revenue
on our Consolidated Statement of Operations based on the value for which the
derivative instrument could be exchanged between willing parties. To
date, all of our derivative positions fair value determinations have been made
by management using quoted prices in active markets for identical
instruments. The ultimate fair
57
CHENIERE
ENERGY, INC. AND SUBSIDIARIES
NOTES
TO CONSOLIDATED FINANCIAL STATEMENTS—Continued
value of
our derivative instruments is uncertain, and we believe that it is possible that
a change in the estimated fair value will occur in the near future as commodity
prices change.
Regulated
Natural Gas Pipelines
Our
developing natural gas pipeline business is subject to the jurisdiction of the
FERC in accordance with the Natural Gas Act of 1938 and the Natural Gas Policy
Act of 1978. The economic effects of regulation can result in a regulated
company recording as assets those costs that have been or are expected to be
approved for recovery from customers, or recording as liabilities those amounts
that are expected to be required to be returned to customers, in a rate-setting
process in a period different from the period in which the amounts would be
recorded by an unregulated enterprise. Accordingly, we record assets and
liabilities that result from the regulated rate-making process that may not be
recorded under GAAP for non-regulated entities. We continually assess whether
regulatory assets are probable of future recovery by considering factors such as
applicable regulatory changes and recent rate orders applicable to other
regulated entities. Based on this continual assessment, we believe the existing
regulatory assets are probable of recovery. These regulatory assets and
liabilities are primarily classified in the Consolidated Balance Sheets as Other
Assets and Other Liabilities. We periodically evaluate their applicability under
GAAP, and consider factors such as regulatory changes and the effect of
competition. If cost-based regulation ends or competition increases, we may have
to reduce our asset balances to reflect a market basis less than cost and
write-off the associated regulatory assets and liabilities.
Items
that may influence our assessment are:
|
|
•
|
inability
to recover cost increases due to rate caps and rate case
moratoriums;
|
|
|
•
|
inability
to recover capitalized costs, including an adequate return on those costs
through the rate-making process and the FERC
proceedings;
|
|
|
•
|
excess
capacity;
|
|
|
•
|
increased
competition and discounting in the markets we serve;
and
|
|
|
•
|
impacts
of ongoing regulatory initiatives in the natural gas
industry.
|
Natural
gas pipeline costs include amounts capitalized as an Allowance for Funds Used
During Construction (“AFUDC”). The rates used in the calculation of AFUDC are
determined in accordance with guidelines established by the FERC. AFUDC
represents the cost of debt and equity funds used to finance our natural gas
pipeline additions during construction. AFUDC is capitalized as a part of the
cost of our natural gas pipelines. Under regulatory rate practices, we generally
are permitted to recover AFUDC, and a fair return thereon, through our rate base
after our natural gas pipelines are placed in service.
Property,
Plant and Equipment
Property,
plant and equipment are recorded at cost. Expenditures for construction
activities, major renewals and betterments are capitalized, while expenditures
for maintenance and repairs and general and administrative activities are
charged to expense as incurred. Interest costs incurred on debt obtained for the
construction of property, plant and equipment are capitalized as
construction-in-process over the construction period or related debt term,
whichever is shorter. We began depreciating equipment and facilities associated
with the initial 2.6 Bcf/d of sendout capacity and 10.1 Bcf of storage capacity
of the Sabine Pass LNG receiving terminal when they were ready for use in the
third quarter of 2008. We began depreciating equipment and facilities associated
with the remaining 1.4 Bcf/d of sendout capacity and 6.8 Bcf of storage capacity
of the Sabine Pass LNG receiving terminal when they were ready for use in the
third quarter of 2009. The Sabine Pass LNG receiving terminal is depreciated
using the straight-line depreciation method applied to groups of LNG receiving
terminal assets with varying useful lives. The identifiable components of the
Sabine Pass LNG receiving terminal with similar estimated useful lives have a
depreciable range between 15 and 50 years. Depreciation of computer and office
equipment, computer software, leasehold improvements and vehicles is computed
using the straight-line method over the estimated useful lives of the assets,
which range from two to ten years. Upon retirement or other disposition of
property, plant and equipment, the cost and related accumulated depreciation are
removed from the account, and the resulting gains or losses are recorded in
operations.
Management
reviews property, plant and equipment for impairment periodically and whenever
events or changes in circumstances have indicated that the carrying amount of
property, plant and equipment might not be recoverable. We have recorded no
significant impairments related to fixed assets for 2009, 2008 or
2007.
58
CHENIERE
ENERGY, INC. AND SUBSIDIARIES
NOTES
TO CONSOLIDATED FINANCIAL STATEMENTS—Continued
Income
Taxes
Provisions
for income taxes are based on taxes payable or refundable for the current year
and deferred taxes on temporary differences between the tax basis of assets and
liabilities and their reported amounts in the consolidated financial statements.
Deferred tax assets and liabilities are included in the consolidated financial
statements at currently enacted income tax rates applicable to the period in
which the deferred tax assets and liabilities are expected to be realized or
settled. As changes in tax laws or rates are enacted, deferred tax assets and
liabilities are adjusted through the current period’s provision for income
taxes. A valuation allowance is provided for deferred tax assets if it is more
likely than not that such asset will not be realizable.
Cash
Flow Hedges
We have
used, and may in the future use, derivative instruments to limit our exposure to
variability in expected future cash flows. Cash flow hedge transactions hedge
the exposure to variability in expected future cash flows. In the case of cash
flow hedges, the hedged item (the underlying risk) is generally unrecognized
(i.e., not recorded on the consolidated balance sheet prior to settlement), and
any changes in the fair value, therefore, will not be recorded within earnings.
Conceptually, if a cash flow hedge is effective, this means that a variable,
such as a movement in interest rates, has been effectively fixed so that any
fluctuations will have no net result on either cash flows or earnings.
Therefore, if the changes in fair value of the hedged item are not recorded in
earnings, then the changes in fair value of the hedging instrument (the
derivative) must also be excluded from the income statement or else a one-sided
net impact on earnings will be reported, despite the fact that the establishment
of the effective hedge results in no net economic impact. To prevent such a
scenario from occurring, U.S. GAAP requires that the fair value of a derivative
instrument designated as a cash flow hedge be recorded as an asset or liability
on the balance sheet, but with the offset reported as part of other
comprehensive income, to the extent that the hedge is effective. We assess, both
at the inception of each hedge and on an on-going basis, whether the derivatives
that are used in our hedging transactions are highly effective in offsetting
changes in cash flows of the hedged items. On an on-going basis, we monitor the
actual dollar offset of the hedges’ market values compared to hypothetical cash
flow hedges. Any ineffective portion of the cash flow hedges will be reflected
in earnings. Ineffectiveness is the amount of gains or losses from derivative
instruments that are not offset by corresponding and opposite gains or losses on
the expected future transaction.
Use
of Estimates
The
preparation of consolidated financial statements in conformity with accounting
principles generally accepted in the United States of America requires
management to make certain estimates and assumptions that affect the amounts
reported in the consolidated financial statements and the accompanying notes.
Actual results could differ from the estimates and assumptions
used.
Estimates
used in the assessment of impairment of our long-lived assets, including
goodwill, are the most significant of our estimates. There are
numerous uncertainties inherent in estimating future cash flows of assets or
business segments. The accuracy of any cash flow estimate is a
function of judgment used in determining the amount of cash flows
generated. As a result, cash flows may be different from the cash
flows that we use to assess impairment of our assets. Management
reviews its estimates of cash flows on an ongoing basis using historical
experience and other factors, including the current economic and commodity price
environment. Significant negative industry or economic trends,
including a significant decline in the market price of our common stock, reduced
estimates of future cash flows for our business segments or disruptions to our
business could lead to an impairment charge of our long-lived assets, including
goodwill and other intangible assets. Our valuation methodology for assessing
impairment requires management to make judgments and assumptions based on
historical experience and to rely heavily on projections of future operating
performance. Projections of future operating results and cash flows may vary
significantly from results. In addition, if our analysis results in an
impairment of our long-lived assets, including goodwill, we may be required to
record a charge to earnings in our consolidated financial statements during a
period in which such impairment is determined to exist, which may negatively
impact our results of operations.
Other
items subject to estimates and assumptions include asset retirement obligations,
valuation allowances for net deferred tax assets, valuation of derivative
instruments, valuations of noncash compensation and collectability of accounts
receivable and other assets.
As future
events and their effects cannot be determined accurately, actual results could
differ significantly from our estimates.
59
CHENIERE
ENERGY, INC. AND SUBSIDIARIES
NOTES
TO CONSOLIDATED FINANCIAL STATEMENTS—Continued
Cash
Equivalents
We
classify all investments with original maturities of three months or less as
cash equivalents. Our investments are primarily in commercial paper and are made
in accordance with corporate policy, which, among other things, stipulates
minimum acceptable credit ratings of commercial paper issuers.
Fair
Value of Financial Instruments
The
carrying amounts of cash and cash equivalents, restricted cash and cash
equivalents, restricted certificates of deposit, accounts receivable, and
accounts payable approximate fair value because of the short maturity of those
instruments. We use available market data and valuation methodologies to
estimate the fair value of debt.
Concentration
of Credit Risk
Financial
instruments that potentially subject us to a concentration of credit risk
consist principally of cash and cash equivalents and restricted cash. We
maintain cash balances at financial institutions, which may at times be in
excess of federally insured levels. We have not incurred losses related to these
balances to date.
We have
entered into certain long-term TUAs with unaffiliated third parties for
regasification capacity at our Sabine Pass LNG receiving terminal. We are
dependent on the respective counterparties’ creditworthiness and their
willingness to perform under their respective TUAs. We have mitigated this
credit risk by securing TUAs for a significant portion of our regasification
capacity with creditworthy third-party customers with a minimum
Standard & Poor’s rating of AA.
Goodwill
Goodwill
represents the excess of cost over fair value of the assets of businesses
acquired. It is evaluated annually for impairment by first comparing our
management’s estimate of the fair value of a reporting unit with its carrying
value, including goodwill. If the carrying value of the reporting unit exceeds
its fair value, a computation of the implied fair value of the goodwill is
compared with its related carrying value. If the carrying value of the reporting
unit’s goodwill exceeds the implied fair value of that goodwill, an impairment
loss is recognized in the amount of the excess. We had goodwill of approximately
$76.8 million at December 31, 2009 and 2088, attributable to our LNG
receiving terminal segment.
We
perform an annual goodwill impairment review in the fourth quarter of each year,
although we may perform a goodwill impairment review more frequently whenever
events or circumstances indicate that the carrying value may not be recoverable.
As discussed above regarding our use of estimates, our judgments and assumptions
are inherent in our management’s estimate of future cash flows used to determine
the estimate of the reporting unit’s fair value. The use of alternate judgments
and/or assumptions could result in the recognition of different levels of
impairment charges in the consolidated financial statements.
Debt
Issuance Costs
Debt
issuance costs consist primarily of arrangement fees, professional fees, legal
fees and printing costs. These costs are capitalized and are being amortized to
interest expense over the term of the related debt facility.
Share-Based
Compensation Expense
We
recognize compensation expense for all share-based payments granted after
January 1, 2006 and prior to, but not yet vested as of, January 1,
2006, using the Black-Scholes-Merton option valuation model. We recognize
share-based compensation net of an estimated forfeiture rate and only recognize
compensation cost for those shares expected to vest on a straight-line basis
over the requisite service period of the award.
Determining
the appropriate fair value model and calculating the fair value of share-based
payment awards requires the use of highly subjective assumptions, including the
expected life of the share-based payment awards and stock price volatility. We
believe that implied volatility, calculated based on traded options of our
common stock, combined with historical volatility is an appropriate indicator of
expected volatility and future stock price trends. Therefore, the expected
volatility for the year ended December 31, 2009 used in our fair value
model was based on a combination of implied and historical volatilities. The
assumptions used in calculating the
60
CHENIERE
ENERGY, INC. AND SUBSIDIARIES
NOTES
TO CONSOLIDATED FINANCIAL STATEMENTS—Continued
fair
value of share-based payment awards represent our best estimates, but these
estimates involve inherent uncertainties and the application of management
judgment. As a result, if factors change and we use different assumptions, our
share-based compensation expense could be materially different in the future. In
addition, we are required to estimate the expected forfeiture rate and only
recognize expense for those shares expected to vest. If our actual forfeiture
rate is materially different from our estimate, future share-based compensation
expense could be significantly different from what we have recorded in the
current period (See Note 22—“Share-Based Compensation” of our Notes to
Consolidated Financial Statements).
Net
Loss Per Share
Net loss
per share (“EPS”) is computed in accordance with US GAAP. Basic EPS excludes
dilution and is computed by dividing net income (loss) by the weighted average
number of common shares outstanding during the period. Diluted EPS reflects
potential dilution and is computed by dividing net income by the weighted
average number of common shares outstanding during the period increased by the
number of additional common shares that would have been outstanding if the
potential common shares had been issued. Basic and diluted EPS for all periods
presented are the same since the effect of our options, warrants and unvested
stock is anti-dilutive to our net loss per share. Stock options, warrants and
unvested stock representing securities that could potentially dilute basic EPS
in the future that were not included in the diluted computation because they
would have been anti-dilutive for the years 2009, 2008 and 2007, were
$9.0 million, $4.9 million and $5.8 million, respectively. In
addition, common shares of 59.2 million on a weighted average basis,
issuable upon conversion of the 2008 Convertible Loans and the Convertible
Senior Unsecured Notes (described in Note 19—“Long-Term Debt and Long-Term
Debt—Related Parties”), were not included in the computation of diluted net loss
per share for 2009, 2008 and 2007, because the computation of diluted net loss
per share utilizing the “if-converted” method would be anti-dilutive. No
adjustments were made to reported net loss in the computation of
EPS.
Asset
Retirement Obligations
We
recognize asset retirement obligations (“AROs”) for legal obligations associated
with the retirement of long-lived assets that result from the acquisition,
construction, development and/or normal use of the asset and for conditional
AROs in which the timing or method of settlement are conditional on a future
event that may or may not be within our control. The fair value of a liability
for an ARO is recognized in the period in which it is incurred, if a reasonable
estimate of fair value can be made. The fair value of the liability is added to
the carrying amount of the associated asset. This additional carrying amount is
depreciated over the estimated useful life of the asset. Our recognition of
asset retirement obligations is described below:
Natural
Gas Pipeline
Currently,
the Creole Trail natural gas pipeline is our only constructed and operating
natural gas pipeline. We believe that it is not feasible to predict when the
natural gas transportation services provided by the Creole Trail natural gas
pipeline will no longer be utilized. In addition, our right-of-way agreements
associated with the Creole Trail natural gas pipeline have no stipulated
termination dates. Therefore, we have concluded that due to advanced technology
associated with current natural gas pipelines and our intent to operate the
Creole Trail natural gas pipeline as long as supply and demand for natural gas
exists in the United States, we have not recorded an ARO associated with the
Creole Trail natural gas pipeline.
LNG
Receiving Terminal
Currently,
the Sabine Pass LNG receiving terminal is our only constructed and operating LNG
receiving terminal. Based on the real property lease agreement at the Sabine
Pass LNG receiving terminal, at the expiration of the term of the lease we are
required to surrender the LNG receiving terminal in good working order and
repair, with normal wear and tear and casualty expected. Our property lease
agreement at the Sabine Pass LNG receiving terminal has a term of up to 90 years
including renewal options. Due to the language in the real property lease
agreement, we have determined that the cost to surrender the LNG receiving
terminal in the required condition will be minimal, and therefore have not
recorded an ARO associated with the Sabine Pass LNG receiving
terminal.
61
CHENIERE
ENERGY, INC. AND SUBSIDIARIES
NOTES
TO CONSOLIDATED FINANCIAL STATEMENTS—Continued
Recent
Accounting Standards Not Yet Adopted
In June
2009, the FASB issued an amendment to the accounting and disclosure requirements
for the consolidation of variable interest entities. The guidance affects the
overall consolidation analysis and requires enhanced disclosures on involvement
with variable interest entities. The guidance is effective for fiscal years
beginning after November 15, 2009. We do not expect the adoption of this
amendment to have a material impact on our financial position, results of
operations or cash flow.
NOTE
3—INITIAL PUBLIC OFFERING OF CHENIERE ENERGY PARTNERS, L.P.
On
March 26, 2007, Cheniere Partners and Cheniere LNG Holdings, LLC
(“Holdings”), our wholly-owned subsidiary, completed an initial public offering
of 13,500,000 Cheniere Partners common units (the “Cheniere Partners Offering”).
Cheniere Partners is a Delaware limited partnership formed by us to develop, own
and operate the Sabine Pass LNG receiving terminal. Upon the closing of the
Cheniere Partners Offering, the following transactions occurred:
|
|
•
|
Holdings
contributed its ownership interests in the entities that directly or
indirectly own the Sabine Pass LNG receiving terminal to Cheniere Energy
Investments, LLC, a wholly-owned subsidiary of Cheniere
Partners;
|
|
|
•
|
Cheniere
Partners issued 21,362,193 common units, 135,383,831 subordinated units,
3,302,045 general partner units (representing a 2% general partner
interest) and certain general partner incentive distribution rights to
wholly-owned subsidiaries of
Cheniere;
|
|
|
•
|
Cheniere
Partners issued 5,054,164 common units to the public and received net
proceeds of $98.4 million; and
|
|
|
•
|
Holdings
initially sold 8,445,836 common units to the public and received net
proceeds of $164.5 million, after which Cheniere and the public owned
89.8% and 8.2% limited partner interests in Cheniere Partners,
respectively. Holdings also granted the underwriters an option to purchase
an additional 2,025,000 of its Cheniere Partners common units to cover
over-allotments in connection with the Cheniere Partners
Offering.
|
As of
December 31, 2009, our combined general partner and limited partner
ownership interest in Cheniere Partners was approximately 90.6%. As of such
date, we held 135,383,831 subordinated units, 10,891,357 common units and
3,302,045 general partner units of Cheniere Partners.
The
portion of the common units held by the public is presented as a non-controlling
interest on our Consolidated Balance Sheet. Losses attributable to the
non-controlling interest are presented separately on our Consolidated Statement
of Operations based upon the non-controlling interest’s share of Cheniere
Partners’ losses calculated in accordance with Cheniere Partners’ partnership
agreement.
NOTE
4—RESTRUCTURING CHARGES
In the
second quarter of 2008, we announced a cost savings program in connection with
the downsizing of our natural gas marketing business activities, the nearing
completion of significant construction activities for both the Sabine Pass LNG
receiving terminal and Creole Trail Pipeline and the seeking of alternative
arrangements for our time charter interest in two LNG vessels. In connection
with this program, we recognized $78.7 million in restructuring charges in 2008
and have presented the financial impact as restructuring charges on the
Consolidated Statements of Operations.
62
CHENIERE
ENERGY, INC. AND SUBSIDIARIES
NOTES
TO CONSOLIDATED FINANCIAL STATEMENTS—Continued
Below is
a reconciliation of the total restructuring charges expected to be recognized
and charged to expense over the restructuring period to the amount of expected
restructuring charges at December 31, 2009 (in thousands):
|
Severance
Costs
|
Facility
Costs
|
Marketing
Costs
|
Total
|
|||||||||||||
|
Estimated
restructuring charges (at inception of program)
|
$ | 12,400 | $ | — | $ | 69,400 | $ | 81,800 | ||||||||
|
Adjustment
to estimated restructuring charges as of
December 31, 2008
|
(6,071 | ) | 2,583 | 1,292 | (2,196 | ) | ||||||||||
|
Restructuring charges recognized as of December 31, 2008
|
(5,429 | ) | (2,583 | ) | (70,692 | ) | (78,704 | ) | ||||||||
|
Estimated restructuring charges as of December 31,
2008
|
900 | — | — | 900 | ||||||||||||
|
Adjustment to estimated restructuring charges as of
December 31, 2009
|
(880 | ) | — | — | (880 | ) | ||||||||||
|
Restructuring charges recognized as of December 31, 2009
|
(20 | ) | — | — | (20 | ) | ||||||||||
|
Estimated restructuring charges as of December 31,
2009
|
$ | — | $ | — | $ | — | $ | — | ||||||||
NOTE
5—NON-CONTROLLING INTEREST
We have
consolidated certain joint ventures and partnerships because we have a
controlling interest in these ventures. Therefore, the entities’ financial
statements are consolidated in our consolidated financial statements and the
entities’ other equity is recorded as a non-controlling interest. The following
table sets forth the components of our non-controlling interest balance
attributable to third-party investors’ interest (in thousands):
|
Net
proceeds from Cheniere Partners’ issuance of common units
(1)
|
$
|
98,442
|
|
|
Net
proceeds from Holdings’ sale of Cheniere Partners common units
(2)
|
203,946
|
||
|
Distributions
to Cheniere Partners’ non-controlling interest
|
(66,415
|
)
|
|
|
Non-controlling
interest share of loss of Cheniere Partners
|
(18,368
|
)
|
|
|
Non-controlling
interest at December 31, 2009
|
$
|
217,605
|
|
(1)
|
In
March and April 2007, we and Cheniere Energy Partners, L.P. (“Cheniere
Partners”) completed a public offering of 15,525,000 Cheniere Partners
common units (“Cheniere Partners Offering”). Through the Cheniere Partners
Offering, Cheniere Partners received $98.4 million in net proceeds from
the issuance of its common units to the public. Prior to January 1, 2009,
a company was able to elect an accounting policy of recording a gain or
loss on the sale of common equity of a subsidiary equal to the amount of
proceeds received in excess of the carrying value of the parent’s
investment. Effective January 1, 2009, the sale of common equity of a
subsidiary will be accounted for as an equity
transaction.
|
|
(2)
|
In
conjunction with the Cheniere Partners Offering, Holdings sold a portion
of the Cheniere Partners common units held by it to the public, realizing
proceeds net of offering costs of $203.9 million, which included $39.4
million of net proceeds realized once the underwriters exercised their
option to purchase an additional 2,025,000 common units from Holdings. Due
to the subordinated distribution rights on our subordinated units, we have
recorded those proceeds as a non-controlling
interest.
|
NOTE
6—TREASURY STOCK
During
the second half of 2007, we purchased 9.2 million shares of our common
stock through the exercise of call options acquired in the issuer call spread
purchased by us in connection with the issuance of the Convertible Senior
Unsecured Notes (See Note 19—“Long-Term Debt and Long-Term Debt—Related
Parties”). These purchases completed the acquisition of our common stock under
the call option, bringing our total stock purchased under the issuer call spread
to 9.2 million shares with an aggregate purchase price of approximately
$325.0 million. These shares were held as treasury stock at December 31,
2007. During 2008, we retired 9.5 million shares of treasury
stock.
NOTE
7—RESTRICTED CASH AND CASH EQUIVALENTS AND U.S. TREASURY SECURITIES
Restricted
cash and cash equivalents and U.S. Treasury securities are comprised of cash
that has been contractually restricted as to usage or withdrawal, as
follows:
63
CHENIERE
ENERGY, INC. AND SUBSIDIARIES
NOTES
TO CONSOLIDATED FINANCIAL STATEMENTS—Continued
Sabine
Pass LNG Receiving Terminal Construction Reserve
In
November 2006, Sabine Pass LNG, L.P. (“Sabine Pass LNG”) issued an aggregate
principal amount of $2,032.0 million of Senior Secured Notes consisting of
$550.0 million of 7¼% Senior Secured Notes due 2013 (the “2013 Notes”) and
$1,482.0 million of 7½% Senior Secured Notes due 2016 (the “2016 Notes” and
collectively with the 2013 Notes, the “Senior Notes”). In September 2008, Sabine
Pass LNG issued an additional $183.5 million, before discount, of 2016 Notes
whose terms were identical to the previously outstanding 2016 Notes. The
additional issuance and the previously outstanding 2016 Notes are treated as a
single series of notes under the indenture governing the Senior Notes (“Sabine
Pass Indenture”) (See Note 19—“Long-Term Debt and Long-Term Debt—Related
Parties”). Under the terms and conditions of the Senior Notes, Sabine Pass LNG
was required to fund a cash reserve account for approximately $987 million to
pay the remaining costs to complete construction of the Sabine Pass LNG
receiving terminal. The cash accounts are controlled by a collateral trustee,
and therefore, are shown as restricted cash and cash equivalents on our
Consolidated Balance Sheets. As of December 31, 2009, the Sabine Pass LNG
receiving terminal construction reserve account balance was zero. As
of December 31, 2008, the Sabine Pass LNG receiving terminal construction
reserve account balance was $71.1 million, of which $27.4 million of the
construction reserve account related to accrued construction costs that had been
classified as part of current restricted cash and cash equivalents, and $43.7
million of the construction reserve account related to remaining construction
costs had been classified as a non-current asset on our Consolidated Balance
Sheets.
Senior
Notes Debt Service Reserve
As
described above, Sabine Pass LNG consummated private offerings of an aggregate
principal amount of $2,215.5 million of Senior Notes (See Note 19—“Long-Term
Debt and Long-Term Debt—Related Parties”). Under the Sabine Pass Indenture
governing the Senior Notes, except for permitted tax distributions, Sabine Pass
LNG may not make distributions until certain conditions are satisfied: there
must be on deposit in an interest payment account an amount equal to one-sixth
of the semi-annual interest payment multiplied by the number of elapsed months
since the last semi-annual interest payment, and there must be on deposit in a
permanent debt service reserve fund an amount equal to one semi-annual interest
payment of approximately $82.4 million. Distributions are permitted only after
satisfying the foregoing funding requirements, a fixed charge coverage ratio
test of 2:1 and other conditions specified in the Sabine Pass Indenture. As of
December 31, 2009 and 2008, we classified $13.7 million as current
restricted cash and cash equivalents for the payment of interest due within
twelve months. As of December 31, 2009 and 2008, we classified the
permanent debt service reserve fund of $82.4 million as non-current restricted
cash and cash equivalents. These cash accounts are controlled by a collateral
trustee, and therefore, are shown as restricted cash and cash equivalents on our
Consolidated Balance Sheets.
Cheniere
Partners Distribution Reserve
At the
closing of the Cheniere Partners Offering, Cheniere Partners funded a
distribution reserve of $98.4 million, which was invested in U.S. Treasury
securities (See Note 5—“Non-Controlling Interest”). The distribution reserve,
including interest earned thereon, was available to be used to pay quarterly
distributions of $0.425 per common unit for all common units, as well as related
distributions to Cheniere Partners’ general partner, through the distribution
made in respect of the quarter ended June 30, 2009. The U.S. Treasury
securities were acquired at a discount from their maturity values equal to an
average of approximately 4.87% per year.
As
provided under the Cheniere Partners partnership agreement, any amount remaining
in the distribution reserve was to be distributed to us. Cheniere Partners
received sufficient cash from Sabine Pass LNG to make distributions to all of
its unitholders without withdrawing certain funds from the distribution reserve
account. Cheniere Partners therefore distributed $34.9 million to us from the
distribution reserve account in August 2009.
As of
December 31, 2009 and 2008, we classified $0.1 million and zero as current
restricted cash and cash equivalents that may be utilized to pay quarterly
distributions. As of December 31, 2009 and 2008, we classified zero and
$12.0 million as non-current restricted cash that may be utilized to pay
quarterly distributions, respectively. In addition, as of December 31, 2009
and 2008, we classified zero and $20.8 million as non-current restricted U.S.
Treasury securities on our Consolidated Balance Sheets that may be utilized to
pay quarterly distributions, as these securities had original maturities greater
than three months.
TUA
Reserve
Under the
terms and conditions of the 2008 Convertible Loans described below in Note
19—“Long-Term Debt and Long-Term Debt—Related Parties”, we were required to fund
a reserve account with $135.0 million to pay obligations of Cheniere Marketing
under its Terminal Use Agreement (“TUA”) with Sabine Pass LNG and as additional
collateral for the 2008 Convertible Loans. We
64
CHENIERE
ENERGY, INC. AND SUBSIDIARIES
NOTES
TO CONSOLIDATED FINANCIAL STATEMENTS—Continued
continue
to fund this account using quarterly distributions received from distributions
on Cheniere’s common, subordinated and general partner units in Cheniere
Partners. The cash account is controlled by a collateral trustee, and therefore,
is shown as restricted cash and cash equivalents on our Consolidated Balance
Sheets. In June 2009, through an amendment of the 2008 Convertible Loans, we
moved $65.2 million out of the TUA reserve account into an unrestricted cash and
cash equivalent account. In addition, we made Cheniere Marketing’s December 2009
TUA payment in the amount of $62.7 million to Sabine Pass LNG from this account,
leaving the balance of the TUA reserve account at zero as of December 31, 2009.
As of December 31, 2008, we classified $62.8 million as part of current
restricted cash and cash equivalents on our Consolidated Balance Sheets because
these funds were held by Sabine Pass LNG.
Other
Restricted Cash and Cash Equivalents
As of
December 31, 2009 and 2008, $124.4 million and $197.7 million,
respectively, of cash and cash equivalents was primarily related to cash and
cash equivalents held by Sabine Pass LNG and Cheniere Partners that is
considered restricted to Cheniere. In addition, due to various other
contractual restrictions, $0.5 million had been classified as non-current
restricted cash and cash equivalents on our Consolidated Balance Sheets,
respectively.
NOTE
8—LEASES
Future
Annual Minimum Lease Payments
Future
annual minimum lease payments, excluding inflationary adjustments, are as
follows (in thousands):
|
Years
Ending December 31,
|
Operating
Leases
(2) (3)
|
|
|
2010
|
$
|
13,853
|
|
2011
|
13,936
|
|
|
2012
|
14,272
|
|
|
2013
|
14,724
|
|
|
2014
|
13,304
|
|
|
Thereafter
(1)(2)
|
256,432
|
|
|
Total
|
$
|
326,521
|
|
(1)
|
Includes
certain lease option renewals as they were reasonably assured.
|
|
(2)
|
Future
annual minimum lease payments do not include $86.4 million of future
sublease payments we will receive from our two third-party TUA customers
that effectively offsets two-thirds of our lease payment obligation, as
discussed below. Future annual minimum lease payments also do
not include $4.8 million expected to be recovered through sublease
agreements for our Texas Avenue office lease in Houston, Texas, and $7.7
million expected to be recovered for our Pennzoil office
lease.
|
|
(3)
|
Lease
payments for our tug boat lease represent third-party tug boat lease
payment obligations and do not take into account the payments we receive
from our third-party TUA customers that effectively offset two-thirds of
our lease payment obligation, as discussed
below.
|
Tug
Boat Agreements
Sabine
Pass Tug Services, LLC (“Tug Services”), our wholly owned subsidiary, entered
into a Marine Services Agreement (the “Tug Agreement”) for the use of tug boats
and marine services for the Sabine Pass LNG receiving terminal. The term of the
Tug Agreement commenced in January 2008 for a period of 10 years, with an option
to renew two additional, consecutive terms of five years each. In accordance
with accounting literature on how to determine whether an arrangement contains a
lease, we have determined that the Tug Agreement contains a lease for the tugs
specified in the Tug Agreement. In addition, we have concluded that the tug boat
lease contained in the Tug Agreement is an operating lease, and as such, the
equipment component of the Tug Agreement will be charged to expense over the
term of the Tug Agreement as it becomes payable.
65
CHENIERE
ENERGY, INC. AND SUBSIDIARIES
NOTES
TO CONSOLIDATED FINANCIAL STATEMENTS—Continued
In the
second quarter of 2009, Tug Services entered into a Tug Sharing Agreement with
Sabine Pass LNG’s three TUA customers to provide their LNG cargo vessels with
tug boat and marine services at the Sabine Pass LNG receiving terminal and
effectively offset the cost of the tug boat lease. The Tug Sharing Agreement
provides for each of our customers to pay Tug Services an annual service
fee.
LNG
Site Leases
Our
obligations under LNG site options are renewable on an annual or semiannual
basis. We may terminate our obligations at any time by electing not to renew or
by exercising the options.
In
January 2005, we exercised our options and entered into three land leases for
the site of the Sabine Pass LNG receiving terminal. The leases have an initial
term of 30 years, with options to renew for six 10-year extensions with similar
terms as the initial term. In February 2005, two of the three leases were
amended, thereby increasing the total acreage under lease to 853 acres and
increasing the annual lease payments to $1.5 million. The annual lease payments
will be adjusted for inflation based on a consumer price index, as defined in
the lease agreements, every five years. We recognized $1.5 million of site lease
expense on our Consolidated Statement of Operations in each of 2009
and 2008.
NOTE
9—ADVANCES UNDER LONG-TERM CONTRACTS
We
entered into certain engineering, procurement and construction (“EPC”) contracts
and purchase agreements related to the construction of the Sabine Pass LNG
receiving terminal that require us to make payments to fund costs that will be
incurred or equipment that will be received in the future. Advances made under
long-term contracts on purchase commitments are carried at face value and
transferred to property, plant and equipment as the costs are incurred or
equipment is received. As of December 31, 2009 and 2008, our advances
under long-term contracts were $1.0 million and $10.7 million,
respectively.
NOTE
10—LNG HELD FOR COMMISSIONING
LNG
purchased for commissioning activities is recorded at cost and classified as a
non-current asset on our Consolidated Balance Sheets as LNG held for
commissioning. As the LNG held for commissioning is used to cool down
the LNG receiving terminal and establish LNG heel in the LNG receiving terminal,
we capitalize the portion used. The LNG used in the commissioning
process is capitalized net of amounts received from the sale of natural
gas.
As of
September 30, 2009, commissioning activities and construction of the Sabine Pass
LNG receiving terminal were substantially complete; therefore, we no longer
needed the remaining LNG held for commissioning. We had 1,115,000 MMBtu of LNG
Held for Commissioning remaining at September 30, 2009 which was reclassified to
current assets as $3.5 million of LNG inventory, representing the market value
of LNG inventory that we have retained for operations.
At
December 31, 2008, we had $9.9 million recorded as LNG held for commissioning on
our Consolidated Balance Sheets.
NOTE
11—LNG INVENTORY
LNG
inventory is recorded at cost and is subject to the lower of cost or market
adjustments at the end of each period. Inventory cost is determined
using the average cost method. Recoveries of losses resulting from interim
period LCM adjustments are made due to market price recoveries on the same
inventory in the same fiscal year and are recognized as gains in later interim
periods with such gains not exceeding previously recognized
losses. As of December 31, 2009, we had 7,778,000 MMBtu of LNG
inventory recorded at $32.6 million on our Consolidated Balance
Sheet. As of December 31, 2008, we had no LNG inventory on our
Consolidated Balance Sheet. We purchased 9,127,000 MMBtu of LNG
inventory during the year ended December 31, 2009. In addition, we
reclassified 1,115,000 MMBtu of LNG held for commissioning to LNG inventory in
September 2009 as described in Note 10—“LNG Held for
Commissioning.” We have entered into natural gas swaps and forward
foreign exchange contracts to hedge the exposure to variability in expected
future cash flows related to the sale of the majority of our LNG inventory (see
Note 20—“Financial Instruments”). During the year ended December 31,
2009, we incurred losses of $3.3 million related to lower of cost or market
adjustments that are presented net within Marketing and trading revenue in our
Consolidated Statement of Operations.
66
CHENIERE
ENERGY, INC. AND SUBSIDIARIES
NOTES
TO CONSOLIDATED FINANCIAL STATEMENTS—Continued
NOTE
12—PROPERTY, PLANT AND EQUIPMENT
Property, plant and equipment consists
of LNG terminal and natural gas pipeline costs, LNG site and related costs,
investments in oil and gas properties, and fixed assets, as follows (in
thousands):
|
December
31,
|
||||||||
|
2009
|
2008
|
|||||||
|
LNG
TERMINAL COSTS
|
||||||||
|
LNG
receiving terminal
|
$ | 1,637,542 | $ | 927,298 | ||||
|
LNG
receiving terminal construction-in-process
|
37,120 | 643,340 | ||||||
|
LNG
site and related costs, net
|
2,994 | 2,579 | ||||||
|
Accumulated
depreciation
|
(40,200 | ) | (7,813 | ) | ||||
|
Total
LNG receiving terminal costs
|
$ | 1,637,456 | $ | 1,565,404 | ||||
|
NATURAL
GAS PIPELINE COSTS
|
||||||||
|
Natural
gas pipeline
|
$ | 564,213 | $ | 562,893 | ||||
|
Natural
gas pipeline construction-in-process
|
1,995 | 7,937 | ||||||
|
Pipeline
right-of-ways
|
18,455 | 18,221 | ||||||
|
Accumulated
depreciation
|
(23,004 | ) | (8,454 | ) | ||||
|
Total
natural gas pipeline costs
|
$ | 561,659 | $ | 580,597 | ||||
|
OIL
AND GAS PROPERTIES, successful efforts method
|
||||||||
|
Proved
|
$ | 3,565 | $ | 3,439 | ||||
|
Accumulated
depreciation, depletion and amortization
|
(1,787 | ) | (1,043 | ) | ||||
|
Total
oil and gas properties, net
|
$ | 1,778 | $ | 2,396 | ||||
|
FIXED
ASSETS
|
||||||||
|
Computers
and office equipment
|
$ | 5,799 | $ | 5,693 | ||||
|
Furniture
and fixtures
|
5,291 | 5,315 | ||||||
|
Computer
software
|
12,284 | 12,128 | ||||||
|
Leasehold
improvements
|
9,258 | 9,208 | ||||||
|
Other
|
1,488 | 1,254 | ||||||
|
Accumulated
depreciation
|
(18,158 | ) | (11,837 | ) | ||||
|
Total
fixed assets, net
|
$ | 15,962 | $ | 21,761 | ||||
|
PROPERTY,
PLANT AND EQUIPMENT, NET
|
$ | 2,216,855 | $ | 2,170,158 | ||||
LNG
Terminal Costs
As of
December 31, 2009, the Sabine Pass LNG receiving terminal had been placed into
service, and all costs associated with the construction of the Sabine Pass LNG
receiving terminal are presented in the table above as LNG receiving
terminal. For 2009 and 2008, we capitalized $26.1 million and $80.7
million of interest expense related to the construction of the Sabine Pass LNG
receiving terminal, respectively.
We began
depreciating equipment and facilities associated with the initial 2.6 Bcf/d of
sendout capacity and 10.1 Bcf of storage capacity of the Sabine Pass LNG
receiving terminal when they were ready for use in the third quarter of 2008. We
began depreciating equipment and facilities associated with the remaining 1.4
Bcf/d of sendout capacity and 6.8 Bcf of storage capacity of the Sabine Pass LNG
receiving terminal when they were ready for use in the third quarter of 2009.
The Sabine Pass LNG receiving terminal is depreciated using the straight-line
depreciation method applied to groups of LNG receiving terminal assets with
varying useful lives. The identifiable components of the Sabine Pass LNG
receiving terminal with similar estimated useful lives have a depreciable range
between 15 and 50 years, as follows:
|
Components
|
Useful
life
(yrs)
|
||
|
LNG
storage tanks
|
50
|
||
|
Marine
berth, electrical, facility and roads
|
35
|
||
|
Regasification
processing equipment (recondensers, vaporization, and
vents)
|
30
|
||
|
Sendout
pumps
|
20
|
||
|
Other
|
15-30
|
67
CHENIERE
ENERGY, INC. AND SUBSIDIARIES
NOTES
TO CONSOLIDATED FINANCIAL STATEMENTS—Continued
In March
2006, our Corpus Christi LNG receiving terminal satisfied the criteria for
capitalization. Accordingly, costs associated with the initial site
work for the Corpus Christi LNG receiving terminal have been
capitalized. As of December 31, 2009, $34.0 million of costs
associated with the initial site work for the Corpus Christi LNG receiving
terminal were capitalized as LNG receiving terminal construction-in-process
(including capitalized interest related to this construction project for the
years ended December 31, 2009 and 2008, of zero and $0.6 million,
respectively). As noted in Note 2—“Summary of Significant Accounting
Policies,” management reviews property, plant and equipment for impairment
periodically and whenever events or changes in circumstances have indicated that
the carrying amount of property, plant and equipment might not be
recoverable. At December 31, 2009, management determined that the
$34.0 million of costs capitalized were more likely than not recoverable in the
future. Management’s assessment is based on certain estimates and
assumptions used to determine if impairment is warranted. If the
estimates and assumptions used are determined to be different in the future, the
amount capitalized may be subject to impairment.
Natural
Gas Pipeline Costs
Our
natural gas pipeline business is subject to the jurisdiction of the Federal
Energy Regulatory Commission (“FERC”) in accordance with the Natural Gas Act of
1938 and the Natural Gas Policy Act of 1978. The economic effects of regulation
can result in a regulated company recording as assets those costs that have been
or are expected to be approved for recovery from customers, or recording as
liabilities those amounts that are expected to be required to be returned to
customers, in a rate-setting process in a period different from the period in
which the amounts would be recorded by an unregulated enterprise. Accordingly,
we record assets and liabilities that result from the regulated rate-making
process that may not be recorded under GAAP for non-regulated entities. We
continually assess whether regulatory assets are probable of future recovery by
considering factors such as applicable regulatory changes and recent rate orders
applicable to other regulated entities. Based on this continual assessment, we
believe the existing regulatory assets are probable of recovery. These
regulatory assets and liabilities are primarily classified in the Consolidated
Balance Sheets as Other Assets and Other Liabilities. We periodically evaluate
their applicability under GAAP, and consider factors such as regulatory changes
and the effect of competition. If cost-based regulation ends or competition
increases, we may have to reduce our asset balances to reflect a market basis
less than cost and write-off the associated regulatory assets and
liabilities.
For the
years ended December 31, 2009 and 2008, we capitalized zero and $17.0 million,
respectively, of Allowance for Funds Used During Construction (“AFUDC”) to our
natural gas pipeline projects.
Fixed
Assets
Our fixed
assets are recorded at cost and are depreciated on a straight-line method based
on estimated lives of the individual assets or groups of assets. Depreciation
expense related to our property, plant and equipment totaled $54.2 million,
$24.3 million and $5.7 million for the years ended December 31, 2009, 2008
and 2007, respectively.
NOTE
13—DEBT ISSUANCE COSTS
We have
incurred debt issuance costs in connection with our long-term debt. These costs
are capitalized and are being amortized over the term of the related debt. As of
December 31, 2009, we had capitalized $47 million of costs directly
associated with the arrangement of debt financing, net of accumulated
amortization, as follows (in thousands):
|
Long-term Debt
|
Debt
Issuance
Costs
|
Amortization
Period
|
Accumulated
Amortization
|
Net
Costs
|
|||||||||
|
2013
Senior Notes
|
$ | 9,353 |
7 years
|
$ | (3,993 | ) | $ | 5,360 | |||||
|
2016
Senior Notes
|
30,057 |
10 years
|
(8,465 | ) | 21,592 | ||||||||
|
2007
Term Loan
|
8,450 |
5 years
|
(4,364 | ) | 4,086 | ||||||||
|
2008
Convertible Loans
|
16,942 |
10
years
|
(2,295 | ) | 14,647 | ||||||||
|
Convertible
Senior Unsecured Notes
|
6,613 |
7
years
|
(5,315 | ) | 1,298 | ||||||||
|
Marketing
Credit Facility
|
60 |
1
year
|
— | 60 | |||||||||
| $ | 71,475 | $ | (24,432 | ) | $ | 47,043 | |||||||
Scheduled
amortization of these debt issuance costs for the next five years is estimated
to be $40.5 million.
68
CHENIERE
ENERGY, INC. AND SUBSIDIARIES
NOTES
TO CONSOLIDATED FINANCIAL STATEMENTS—Continued
NOTE
14—INVESTMENT IN LIMITED PARTNERSHIP
We
account for our 30% limited partnership investment in Freeport LNG using the
equity method of accounting. As of December 31, 2009 and 2008, we had
unrecorded cumulative suspended losses of $10.9 million and $27.2 million,
respectively, related to our investment in Freeport LNG, as the basis in this
investment had been reduced to zero.
During
2009, Freeport LNG distributed $15.3 million to us.
In March
2008 and May 2008, we received cash call notices from Freeport LNG requesting
that we provide further financial support due to higher than expected
commissioning and performance testing costs. During 2008, we funded the cash
calls and recorded $4.8 million of additional suspended losses in Freeport LNG.
In addition, Freeport LNG distributed $4.8 million to us in October
2008.
The
financial position of Freeport LNG at December 31, 2009 and December 31,
2008 and the results of Freeport LNG’s operations for the years ended December
31, 2009 and 2008 are summarized as follows (in thousands):
|
December
31,
|
||||||||
|
2009
|
2008
|
|||||||
|
Current
assets
|
$ | 113,387 | $ | 72,834 | ||||
|
Property,
plant and equipment, net
|
861,386 | 887,388 | ||||||
|
Construction-in-process
|
71,544 | 62,768 | ||||||
|
Other
assets
|
37,596 | 31,608 | ||||||
|
Total
assets
|
$ | 1,083,913 | $ | 1,054,598 | ||||
|
Current
liabilities
|
$ | 86,677 | $ | 61,317 | ||||
|
Notes
payable, net of current maturities
|
1,089,494 | 1,090,086 | ||||||
|
Deferred
revenue and other deferred credits
|
16,563 | 15,401 | ||||||
|
Partners’
capital
|
(108,821 | ) | (112,206 | ) | ||||
|
Total
liabilities and partners’ capital
|
$ | 1,083,913 | $ | 1,054,598 | ||||
|
Year
ended December 31,
|
||||||||||||
|
2009
|
2008
|
2007
|
||||||||||
|
Revenue
|
$ | 229,522 | $ | 116,359 | $ | — | ||||||
|
Income
(loss) from continuing operations
|
134,468 | (7,890 | ) | (16,677 | ) | |||||||
|
Net
income (loss)
|
54,385 | (40,730 | ) | (22,542 | ) | |||||||
|
Cheniere’s
30% share of income (loss) from equity method investment
(1)
|
$ | 16,316 | $ | (12,219 | ) | $ | (6,763 | ) | ||||
|
(1)
|
During
2009, 2008 and 2007, we did not record $16.3 million, $12.2 million and
$6.8 million of the net income (losses) for such periods, respectively, as
the basis in this investment had been reduced to zero and because we did
not guarantee any obligations and had not been committed to provide any
further financial support since December 2005, other than $4.8 million in
cash calls which we received and funded in
2008.
|
NOTE
15—GOODWILL
In
February 2005, we acquired the non-controlling interest in Corpus Christi LNG,
L.P. (“Corpus Christi LNG”), through the acquisition of BPU LNG, Inc. (“BPU”),
in exchange for 2 million restricted shares of our common stock. BPU held
as its sole asset the 33.3% limited partner interest in Corpus Christi LNG. As a
result of this transaction, we own 100% of the limited partner interests in
Corpus Christi LNG. This transaction was accounted for using the purchase method
of accounting and was valued at $77.2 million, including direct transaction
costs. Of this amount, $76.8 million has been recorded as goodwill. The goodwill
is the difference between the deemed value of the shares conveyed and the
historical carrying value of the non-controlling interest under GAAP plus direct
transaction costs. For the calculation of federal income taxes, none of this
goodwill amount will be deductible.
We performed annual goodwill impairment reviews in the fourth
quarters of 2009 and 2008. These impairment reviews consisted of comparing the
carrying value, including goodwill, of the reporting unit under review to the
estimated fair value of the reporting unit. Had the carrying value exceeded the
estimated fair value of the reporting unit, an impairment of the reporting unit
would have been recognized, resulting in an impairment charge to earnings. A
reporting unit is defined as a business segment or
69
CHENIERE
ENERGY, INC. AND SUBSIDIARIES
NOTES
TO CONSOLIDATED FINANCIAL STATEMENTS—Continued
component
of a business segment that has similar economic characteristics. For our
impairment reviews, we have designated our LNG receiving terminal business as
the reporting unit under review due to similar economic characteristics. Our
reviews indicated that no impairment of goodwill was necessary.
NOTE
16—DERIVATIVE INSTRUMENTS
Interest
Rate Derivative Instruments
In
connection with the closing of the original Sabine Pass credit facility in
February 2005 (the “Sabine Pass Credit Facility”), we entered into swap
agreements (“Sabine Swaps”). Under the terms of the Sabine Swaps, we were able
to hedge against rising interest rates, to a certain extent, with respect to
drawings under the Sabine Pass Credit Facility, up to a maximum amount of $700.0
million. The Sabine Swaps had the effect of fixing the LIBOR component of the
interest rate payable under the Sabine Pass Credit Facility with respect to
hedged drawings under the Sabine Pass Credit Facility up to a maximum of $700.0
million at 4.49% from July 25, 2005 through March 25, 2009 and at
4.98% from March 26, 2009 through March 25, 2012. The final
termination date of the Sabine Swaps was March 25, 2012.
The
Sabine Pass Credit Facility was amended and restated in July 2006, increasing
the amount available to Sabine Pass LNG from $822.0 million to $1.5 billion. In
connection with the closing of the amended Sabine Pass Credit Facility in July
2006, we entered into additional interest rate swap agreements (the “Amended
Sabine Swaps” and collectively with the Sabine Swaps, the “Swaps”). The Swaps
had the combined effect of fixing the LIBOR component of the interest rate
payable on borrowings up to a maximum of $1.25 billion at a blended rate of
5.26% from July 25, 2006 through July 1, 2015.
In
connection with the closing of a $600.0 million term loan (the “Term Loan”) on
August 31, 2005, Holdings entered into interest rate swap agreements (“Term
Loan Swaps”) to hedge against rising interest rates. Under the terms of the Term
Loan Swaps, Holdings hedged an initial notional amount of $600.0 million. The
notional amount declined in accordance with anticipated principal payments under
the Term Loan. The Term Loan Swaps had the effect of fixing the LIBOR rate
component of the interest rate payable under the Term Loan at 3.75% from
August 31, 2005 to September 27, 2007, at 3.98% from
September 28, 2007 to September 27, 2008, and at 5.98% from
September 28, 2008 to September 30, 2010. The final termination
date of the Term Loan Swaps was September 30, 2010.
In
conjunction with the termination of the amended Sabine Pass Credit Facility and
the Term Loan in November 2006, we terminated the Swaps and the Term Loan Swaps,
and recognized a loss of $20.1 million. In accordance with EITF 00-9, Classification of a Gain or Loss
from a Hedge of Debt That Is Extinguished, the loss recognized as the
result of early termination of the Swaps and the Term Loan Swaps is presented on
our Consolidated Statement of Operations as a derivative loss.
Accounting
for Hedges
We are
required to record derivatives on our balance sheet as either an asset or
liability measured at their fair value, unless exempted from derivative
treatment under the normal purchase and normal sale exception. Changes in the
fair value of derivatives are recognized currently in earnings unless specific
hedge criteria are met. These criteria require that the derivative is determined
to be effective as a hedge and that it is formally documented and designated as
a hedge.
We
determined that the Swaps and the Term Loan Swaps qualified as cash flow hedges
and designated them as such. We assessed both at the inception of each of the
Swaps and the Term Loan Swaps and on an on-going basis, whether the Swaps and
the Term Loan Swaps that were used in our hedging transactions were highly
effective in offsetting changes in cash flows of the hedged items. At inception,
we determined the hedging relationship of the Swaps and the Term Loan Swaps and
the underlying debt to be highly effective. On an on-going basis, we monitored
the actual dollar offset of the market values of the Swaps and the Term Loan
Swaps compared to hypothetical cash flow hedges. Any ineffective portion of the
cash flow hedges was reflected in earnings. We continued to assess the hedge
effectiveness of the Swaps and the Term Loan Swaps on a quarterly basis until
they were terminated in November 2006. Ineffectiveness is the amount of gains or
losses from derivative instruments which are not offset by corresponding and
opposite gains or losses on the expected future transaction.
The effective portion
of the gain or loss on a derivative instrument designated and qualifying as a
cash flow hedging instrument is reported as a component of accumulated other
comprehensive income (“AOCI”) and be reclassified into earnings in the same
period during which the hedged forecasted transaction affects earnings. In our
case, the impact on earnings was a reduction of interest expense of zero for
2009, 2008 and 2007, respectively. The ineffective portion of the gain or loss
on the derivative instruments, if any,
70
CHENIERE
ENERGY, INC. AND SUBSIDIARIES
NOTES
TO CONSOLIDATED FINANCIAL STATEMENTS—Continued
must
be recognized currently in earnings. If the forecasted transaction is no longer
probable of occurring, the associated gain or loss recorded in AOCI is
recognized currently in earnings. For 2009 and 2008, we recognized a net
derivative gain of $5.3 million and $4.7 million, respectively.
NOTE
17—ACCRUED LIABILITIES
As of
December 31, 2009 and 2008, accrued liabilities consisted of the following
(in thousands):
|
December
31,
|
||||||||
|
2009
|
2008
|
|||||||
|
Accrued
interest expense and related fees
|
$ | 16,179 | $ | 17,305 | ||||
|
Payroll
|
11,118 | 8,717 | ||||||
|
LNG
terminal construction costs
|
10,335 | 26,768 | ||||||
|
Pipeline
construction costs
|
22 | 5,102 | ||||||
|
Other
accrued liabilities
|
771 | 3,991 | ||||||
|
Accrued
liabilities
|
$ | 38,425 | $ | 61,883 | ||||
NOTE
18—DEFERRED REVENUE
As of
December 31, 2009 and 2008, we had recorded $26.5 million and $2.5 million,
respectively, as current deferred revenue and $33.5 million and $37.5 million,
respectively, as non-current deferred revenue related to advance capacity
reservation fee payments.
In
November 2004, Total Gas and Power North America, Inc. (formerly known as Total
LNG USA, Inc.) (“Total”) paid Sabine Pass LNG a nonrefundable advance capacity
reservation fee of $10.0 million in connection with the reservation of
approximately 1.0 Bcf/d of LNG regasification capacity at the Sabine Pass LNG
receiving terminal. An additional advance capacity reservation fee payment of
$10.0 million was paid by Total to Sabine Pass LNG in April 2005. The advance
capacity reservation fee payments are being amortized as a reduction of Total’s
regasification capacity fee under its TUA over a 10-year period beginning with
the commencement of its TUA on April 1, 2009. As a result, we recorded the
advance capacity reservation fee payments that Sabine Pass LNG received,
although non-refundable, as deferred revenue to be amortized to income over the
corresponding 10-year period.
In
November 2004, Sabine Pass LNG entered into a TUA to provide Chevron U.S.A.,
Inc. (“Chevron”) with approximately 0.7 Bcf/d of LNG regasification capacity at
the Sabine Pass LNG receiving terminal. In December 2005, Chevron exercised its
option to increase its reserved capacity by approximately 0.3 Bcf/d to
approximately 1.0 Bcf/d, making advance capacity reservation fee payments to
Sabine Pass LNG totaling $20.0 million. The advance capacity reservation fee
payments are being amortized as a reduction of Chevron’s regasification capacity
reservation fee under its TUA over a 10-year period beginning with the
commencement of its TUA on July 1, 2009. As a result, we recorded the advance
capacity reservation fee payments that Sabine Pass LNG received, although
non-refundable, as deferred revenue to be amortized to income over the
corresponding 10-year period.
71
CHENIERE
ENERGY, INC. AND SUBSIDIARIES
NOTES
TO CONSOLIDATED FINANCIAL STATEMENTS—Continued
NOTE
19—LONG-TERM DEBT AND LONG-TERM DEBT—RELATED PARTIES
As of
December 31, 2009 and 2008, our long-term debt consisted of the following
(in thousands):
|
December
31,
|
||||||||
|
2009
|
2008
|
|||||||
|
(as
adjusted)
|
||||||||
|
Long-term
debt (including related parties):
|
||||||||
|
Senior
Notes (including related parties)
|
$ | 2,215,500 | $ | 2,215,500 | ||||
|
2007
Term Loan
|
400,000 | 400,000 | ||||||
|
2008
Convertible Loans (including related parties)
|
293,714 | 261,393 | ||||||
|
Convertible
Senior Unsecured Notes
|
204,630 | 325,000 | ||||||
|
Total
long-term debt
|
3,113,844 | 3,201,893 | ||||||
|
Debt
discount:
|
||||||||
|
Senior
Notes (including related parties)
|
(32,471 | ) | (37,166 | ) | ||||
|
Convertible
Senior Unsecured Notes
|
(39,498 | ) | (82,365 | ) | ||||
|
Total
debt discount
|
(71,969 | ) | (119,531 | ) | ||||
|
Long-term
debt (including related parties), net of discount
|
$ | 3,041,875 | $ | 3,082,362 | ||||
Below is
a schedule of future principal payments that we are obligated to make on our
outstanding long-term debt at December 31, 2009 (in
thousands):
|
Payments
Due for the Years Ended December 31,
|
|||||||||||||||
|
Total
|
2010
|
2011
to 2012
|
2013
to 2014
|
Thereafter
|
|||||||||||
|
Long-term
debt (including related parties):
|
|||||||||||||||
|
Senior
Notes
|
$
|
2,215,500
|
$
|
—
|
$
|
—
|
$
|
550,000
|
$
|
1,665,500
|
|||||
|
2007
Term Loan
|
400,000
|
—
|
400,000
|
—
|
—
|
||||||||||
|
2008
Convertible Loans
|
354,691
|
—
|
354,691
|
—
|
—
|
||||||||||
|
Convertible
Senior Unsecured Notes
|
204,630
|
—
|
204,630
|
—
|
—
|
||||||||||
|
Total
long-term debt (including related parties)
|
$
|
3,174,821
|
$
|
—
|
$
|
959,321
|
$
|
550,000
|
$
|
1,665,500
|
|||||
Sabine
Pass LNG Senior Notes
In
November 2006, Sabine Pass LNG issued an aggregate principal amount of $2,032.0
million of Senior Notes, consisting of $550.0 million of the 2013 Notes and
$1,482.0 million of the 2016 Notes. In September 2008, Sabine Pass LNG issued an
additional $183.5 million, before discount, of 2016 Notes whose terms were
identical to the previously outstanding 2016 Notes. The net
proceeds received from the additional issuance of the 2016 Notes were
$145.0 million. One of the lenders making a portion of the loans evidenced by
the additional 2016 Notes was GSO Capital Partners, L.P. (“GSO”), an affiliate
of two members of Cheniere’s board of directors. GSO, a related party, did not
receive any fees in connection with the additional issuance of 2016 Notes. The
additional issuance and the previously outstanding 2016 Notes are treated as a
single series of notes under the Sabine Pass Indenture. Sabine Pass LNG placed
$100.0 million of the $145.0 million of net proceeds from the additional
issuance of the 2016 Notes into a construction account to pay construction
expenses of cost overruns related to the construction, cool down, commissioning
and completion of the Sabine Pass LNG receiving terminal. In addition, Sabine
Pass LNG placed $40.8 million of the remaining net proceeds into an account in
accordance with the cash waterfall requirements of the security deposit
agreement that Sabine Pass LNG entered into in connection with the Senior Notes,
which are used by Sabine Pass LNG for working capital and other general business
purposes.
Interest
on the Senior Notes is payable semi-annually in arrears on May 30 and
November 30 of each year. The Senior Notes are secured on a first-priority
basis by a security interest in all of Sabine Pass LNG’s equity interests and
substantially all of its operating assets. Under the Sabine Pass Indenture,
except for permitted tax distributions, Sabine Pass LNG may not make
distributions until certain conditions are satisfied: there must be on deposit
in an interest payment account an amount equal to one-sixth of the semi-annual
interest payment multiplied by the number of elapsed months since the last
semi-annual interest payment, and there must be on deposit in a
permanent debt service reserve fund an amount equal to one semi-annual interest
payment of approximately $82.4 million. Distributions are permitted only after
satisfying the foregoing funding requirements, a fixed charge coverage ratio
test of 2:1 and other conditions specified in the Sabine Pass Indenture. During
the years ended December 31, 2009 and 2008, Sabine Pass LNG made distributions
of $295.7 million and zero, respectively, after satisfying all the applicable
conditions in the Sabine Pass Indenture.
72
CHENIERE
ENERGY, INC. AND SUBSIDIARIES
NOTES
TO CONSOLIDATED FINANCIAL STATEMENTS—Continued
As of
December 31, 2009 and 2008, we classified $72.9 million and $70.7 million,
respectively, as part of Long-Term Debt—Related Party on our Consolidated
Balance Sheets because related parties held these portions of this
debt.
Convertible
Senior Unsecured Notes
In July
2005, we consummated a private offering of $325.0 million aggregate principal
amount of Convertible Senior Unsecured Notes to qualified institutional buyers
pursuant to Rule 144A under the Securities Act of 1933, as amended (“Securities
Act”). The notes bear interest at a rate of 2¼% per year. The notes are
convertible at any time into our common stock under certain circumstances at an
initial conversion rate of 28.2326 shares per $1,000 principal amount of
the notes, which is equal to a conversion price of approximately $35.42 per
share. As of December 31, 2009, no holders had elected to convert their notes at
the conversion rate.
We may
redeem some or all of the notes on or before August 1, 2012, for cash equal
to 100% of the principal plus any accrued and unpaid interest if in the previous
10 trading days the volume-weighted average price of our common stock exceeds
$53.13, subject to adjustment, for at least five consecutive trading days. In
the event of such redemption, we will make an additional payment equal to the
present value of all remaining scheduled interest payments through
August 1, 2012, discounted at the U.S. Treasury securities rate plus 50
basis points. The indenture governing the notes contains customary reporting
requirements.
As
discussed in Note 2—“Summary of Significant Accounting Policies”, we adopted on
January 1, 2009 an accounting standard that requires issuers of certain
convertible debt instruments to separately account for the liability component
and the equity component represented by the embedded conversion option in a
manner that will reflect that entity’s nonconvertible debt borrowing rate when
interest cost is recognized in subsequent periods. The following
table summarizes the liability component of the Convertible Senior Unsecured
Notes (in thousands):
|
December
31,
2009
|
December
31,
2008
|
|||||||
|
(As
adjusted)
|
||||||||
|
Principal
amount
|
$
|
204,630
|
$
|
325,000
|
||||
|
Unamortized
discount
|
(39,498
|
)
|
(82,365
|
)
|
||||
|
Net
carry amount
|
$
|
165,132
|
$
|
242,635
|
||||
The
unamortized discount is being amortized through the August 2012 maturity of the
Convertible Senior Unsecured Notes. Interest expense for the
Convertible Senior Unsecured Notes, including the debt discount amortization for
the year ended December 31, 2009 and 2008 was $21.3 million and $25.2 million,
respectively. The effective interest rate as of December 31, 2009 was
10.9% for the Convertible Senior Unsecured Notes.
During
the second quarter of 2009, we reduced debt by exchanging $120.4 million
aggregate principal amount of our Convertible Senior Unsecured Notes for a
combination of $30.0 million cash and cash equivalents and 4.0 million shares of
common stock, reducing our principal amount due in 2012 to $204.6 million at
December 31, 2009. As a result of the exchange, we recognized a gain of $45.4
million that we have reported as gain on early extinguishment of debt in our
Consolidated Statements of Operations for the year ended December 31,
2009.
2007
Term Loan
In
May 2007, Cheniere Subsidiary Holdings, LLC (“Cheniere Subsidiary”), a
wholly-owned subsidiary of Cheniere, entered into a $400.0 million credit
agreement (“2007 Term Loan”). Borrowings under the 2007 Term Loan generally bear
interest at a fixed rate of 9¾% per annum. Interest is calculated on the
unpaid principal amount of the 2007 Term Loan outstanding and is payable
quarterly in arrears on March 31, June 30, September 30 and
December 31 of each year. The 2007 Term Loan will mature on May 31,
2012. The 2007 Term Loan is secured by a pledge of our 135,383,831 subordinated
units in Cheniere Partners and our equity interests in the entities that own our
30% interest in Freeport LNG.
2008
Convertible Loans
In August
2008, we entered into a credit agreement pursuant to which we obtained $250.0
million in convertible term loans (“2008 Convertible Loans”). The 2008
Convertible Loans will mature in 2018, but the lenders can require prepayment of
the loan for 30 days following August 15, 2011, 2013 and 2015, and upon a
change of control. The 2008 Convertible Loans bear interest at a fixed
73
CHENIERE
ENERGY, INC. AND SUBSIDIARIES
NOTES
TO CONSOLIDATED FINANCIAL STATEMENTS—Continued
rate of
12% per annum, except during the occurrence of an event of default during
which time the rate of interest will be 14% per annum. Interest is due
semi-annually on the last business day of January and July. At our option, until
August 15, 2011, accrued interest may be added to the principal on each
semi-annual interest date. The aggregate amount of all accrued interest to
August 15, 2011 will be payable upon the maturity date. The 2008
Convertible Loans are secured by Cheniere’s rights and fees payable under
management services agreements with Sabine Pass LNG and Cheniere Partners, by
Cheniere’s common units in Cheniere Partners, by the equity and non-real
property assets of Cheniere’s pipeline entities, by the equity of various other
subsidiaries and certain other assets and subsidiary guarantees. The principal
amount of $250.0 million may be exchanged for newly-created Series B Convertible
Preferred Stock, par value $0.0001 per share (“Series B Preferred Stock”), with
voting rights limited to the equivalent of 10,125,000 shares of common stock.
The exchange ratio is one share of Series B Preferred Stock for each $5,000
of outstanding borrowings, subject to adjustment. The aggregate preferred stock
is exchangeable into 50 million shares of common stock at a price of $5.00
per share pursuant to a broadly syndicated offering. No portion of any accrued
interest is eligible for conversion into Series B Preferred Stock. We placed
$135.0 million of the borrowings under the 2008 Convertible Loans into a TUA
reserve account to pay a reservation fee and operating fee under Cheniere
Marketing’s TUA. We utilized $95.0 million of the borrowings under the 2008
Convertible Loans to repay a $95.0 million bridge loan. The remaining borrowings
were utilized to pay for interest on the $95.0 million bridge loan, to pay
expenses incurred in connection with the issuance of the 2008 Convertible Loans
and consideration of other strategic alternatives and to fund working capital
and general corporate needs of Cheniere and its subsidiaries.
As long
as the 2008 Convertible Loans are exchangeable for shares of Series B Preferred
Stock or shares of Series B Preferred Stock remain outstanding, the holders of a
majority of the 2008 Convertible Loans and Series B Preferred Stock, acting
together, shall have the right to nominate two individuals to the Company’s
Board of Directors, and together with the Board of Directors, a third nominee,
who shall be an independent director. In addition, one of the lenders
is Scorpion Capital Partners LP (“Scorpion”), an affiliate of one of the
Company’s directors. As of December 31, 2009 and 2008, $276.2 million
and $261.4 million, respectively, were outstanding under the 2008 Convertible
Loans and were included in Long-term Debt—Related Party on our Consolidated
Balance Sheets.
NOTE
20—FINANCIAL INSTRUMENTS
We
entered into financial derivatives to hedge the exposure to variability in
expected future cash flows and currency fluctuations attributable to the future
sale of natural gas from our LNG commissioning cargoes (“LNG commissioning cargo
derivatives”) and for the future sale of natural gas that is purchased by
Cheniere Marketing (“commercial LNG derivatives”). Commercial LNG is recorded at
cost as LNG inventory on our Consolidated Balance Sheets and is subject to the
lower of cost or market adjustments at the end of each period. Prior to
September 30, 2009, the net cost of our LNG commissioning cargoes (LNG
commissioning cargo purchase price less natural gas sales proceeds) was
capitalized on our Consolidated Balance Sheets as it directly related to the LNG
receiving terminal construction and was incurred to place the LNG receiving
terminal in usable condition. However, changes in the fair value of
our commercial LNG and LNG commissioning cargoes derivatives are reported in
earnings because they do not meet the criteria to be designated as a hedging
instrument that is required to qualify for cash flow hedge
accounting.
Effective
January 1, 2008, we adopted accounting standards that establish a framework
for measuring fair value and expanded disclosures about fair value measurements,
which permitted entities to choose to measure many financial instruments and
certain other items at fair value. We elected not to measure any
additional financial assets or liabilities at fair value, other than those which
were recorded at fair value prior to adoption.
The
estimated fair value of financial instruments is the amount at which the
instrument could be exchanged currently between willing parties. The fair value
of our commodity futures contracts are based on inputs that are quoted prices in
active markets for identical assets or liabilities, resulting in Level 1
categorization of such measurements. The following table (in thousands) sets
forth, by level within the fair value hierarchy, the fair value of our financial
assets and liabilities at December 31, 2009:
|
Quoted Prices in
Active Markets for
Identical
Instruments
(Level
1)
|
Significant
Other
Observable
Inputs
(Level
2)
|
Significant
Unobservable
Inputs
(Level
3)
|
Total
Carrying
Value
|
|||||||||||||
|
Derivatives
liability
|
$
|
905
|
—
|
—
|
$
|
905
|
||||||||||
Derivatives
liability reflects the fair value of natural gas swaps entered into to hedge the
cash flows from the sale of LNG inventory.
74
CHENIERE
ENERGY, INC. AND SUBSIDIARIES
NOTES
TO CONSOLIDATED FINANCIAL STATEMENTS—Continued
The
estimated fair value of financial instruments, including those financial
instruments for which the fair value option was not elected are set forth in the
table below. The carrying amounts reported on our Consolidated Balance Sheets
for cash and cash equivalents, restricted cash and cash equivalents, accounts
receivable, interest receivables, and accounts payable approximate fair value
due to their short-term nature.
Financial
Instruments (in thousands):
|
December
31, 2009
|
December
31, 2008
|
|||||||||||||||
|
Carrying
Amount
|
Estimated
Fair
Value
|
Carrying
Amount
|
Estimated
Fair
Value
|
|||||||||||||
|
(As
adjusted)
|
(As
adjusted)
|
|||||||||||||||
|
2013
Notes (1)
|
$
|
550,000
|
$
|
503,250
|
$
|
550,000
|
$
|
412,500
|
||||||||
|
2016
Notes, net of discount (1)
|
1,633,029
|
1,371,744
|
1,628,334
|
1,204,967
|
||||||||||||
|
Convertible
Senior Unsecured Notes, net of discount (2)
|
165,132
|
95,777
|
242,635
|
37,608
|
||||||||||||
|
2007
Term Loan (3)
|
400,000
|
384,640
|
400,000
|
242,447
|
||||||||||||
|
2008
Convertible Loans (3)
|
293,714
|
299,001
|
261,393
|
119,491
|
||||||||||||
|
Restricted
U.S. Treasury securities (4)
|
—
|
—
|
20,829
|
22,901
|
||||||||||||
|
|
(1)
|
The
fair value of the Senior Notes, net of discount, is based on quotations
obtained from broker-dealers who made markets in these and similar
instruments as of December 31, 2009 and 2008, as
applicable.
|
|
|
(2)
|
The
fair value of our Convertible Senior Unsecured Notes is based on the
closing trading prices on December 31, 2009 and 2008, as
applicable.
|
|
|
(3)
|
The
2007 Term Loan and 2008 Convertible Loans are closely held by few holders
and purchases and sales are infrequent and are conducted on a bilateral
basis without price discovery by us. These loans are not rated
and have unique covenants and collateral packages such that comparisons to
other instruments would be imprecise. Moreover, the 2008 Convertible Loans
are convertible into shares of Cheniere common stock. Nonetheless, we have
provided an estimate of the fair value of these loans as of December 31,
2009 and 2008 based on an index of the yield to maturity of CCC rated debt
of other companies in the energy
sector.
|
|
(4)
|
The
fair value of our restricted U.S. Treasury securities is based on
quotations obtained from broker-dealers who made markets in these and
similar instruments as of December 31, 2008 and 2009, as
applicable.
|
NOTE
21—INCOME TAXES
Income
tax (provision) benefit included in our reported net loss consisted of the
following (in thousands):
|
Year
Ended December 31,
|
||||||||||||
| 2009 | 2008 | 2007 | ||||||||||
|
Current
federal income tax expense
|
$ | — | $ | — | $ | — | ||||||
|
Deferred
federal income tax (provision) benefit
|
— | — | — | |||||||||
|
Total
income tax (provision) benefit
|
$ | — | $ | — | $ | — | ||||||
From our inception,
we have reported net operating losses (“NOLs”) for both financial reporting
purposes and for federal, international and state income tax reporting purposes.
Accordingly, we are not presently a taxpayer and have not recorded a net
liability for federal, international or state income taxes in any of the years
included in the accompanying consolidated financial statements.
75
CHENIERE
ENERGY, INC. AND SUBSIDIARIES
NOTES
TO CONSOLIDATED FINANCIAL STATEMENTS—Continued
The
reconciliation of the federal statutory income tax rate to our effective income
tax rate is as follows:
|
Year
Ended December 31,
|
||||||||||||
|
2009
|
2008
|
2007
|
||||||||||
|
U.S.
statutory tax rate
|
35.0
|
%
|
35.0
|
%
|
35.0
|
%
|
||||||
|
Deferred
tax asset valuation reserve
|
(42.6
|
)
|
%
|
(39.1
|
)
|
%
|
(38.4
|
)
|
%
|
|||
|
State
tax benefit
|
7.1
|
|
%
|
3.7
|
%
|
3.8
|
%
|
|||||
| All other | 0.5 | % | 0.4 | % | (0.4 | ) | % | |||||
|
Effective
tax rate as reported
|
—
|
%
|
—
|
%
|
—
|
%
|
||||||
Significant components of our deferred
tax assets and liabilities at December 31, 2009 and 2008 are as follows (in
thousands):
|
Year
Ended December 31,
|
||||||||
|
2009
|
2008
|
|||||||
|
Deferred
tax assets
|
(As
Adjusted) (1)
|
|||||||
|
Net
operating loss carryforward (2)
|
$ | 265,717 | $ | 184,588 | ||||
|
Investment
in limited partnership
|
53,056 | 81,429 | ||||||
|
Stock
award compensation expense
|
35,835 | 31,317 | ||||||
|
Start-up
costs and construction-in-process associated with LNG, pipeline and
marketing activities
|
8,861 | 8,861 | ||||||
|
Oil
and gas properties and fixed assets
|
2,382 | 2,500 | ||||||
|
Other
|
12,208 | — | ||||||
|
Total
deferred tax assets
|
$ | 378,059 | $ | 308,695 | ||||
|
Deferred
tax liabilities
|
||||||||
|
Pipeline
tax depreciation
|
$ | (23,286 | ) | $ | (2,478 | ) | ||
|
Other
|
(15,420 | ) | (32,827 | ) | ||||
|
Total
deferred tax liabilities
|
$ | (38,706 | ) | $ | (35,305 | ) | ||
|
Net
deferred tax assets
|
$ | 339,353 | $ | 273,390 | ||||
|
Less:
tax asset valuation allowance (3)
|
(339,353 | ) | (273,390 | ) | ||||
| $ | — | $ | — | |||||
|
|
(1)
|
We
have made certain changes in the classification and presentation of
certain gross deferred tax assets and liabilities which had a
corresponding change in the valuation allowance. The net deferred tax
assets and liabilities have not
changed.
|
|
|
(2)
|
The
December 31, 2009 NOL carryforward is composed of approximately $229
million federal NOL carryforward and approximately $37 million state NOL
carryforward. If the NOL carryforward is not utilized it will begin to
expire between 2011 and 2029.
|
|
|
(3)
|
A
valuation allowance equal to our net deferred tax asset balance has been
established due to the uncertainty of realizing the tax benefits related
to our NOL carryforward and other deferred tax assets. The change in the
deferred tax asset valuation allowance was $66.0 million and $117.4
million for the years ended December 31, 2009 and 2008, respectively.
The change in the 2009 valuation allowance from 2008 includes a $2.8
million decrease for expiring, cancelled, and exercised options that were
formerly offset by a full valuation
allowance.
|
76
CHENIERE
ENERGY, INC. AND SUBSIDIARIES
NOTES
TO CONSOLIDATED FINANCIAL STATEMENTS—Continued
Changes
in the balance of unrecognized tax benefits excluding tax, interest and
penalties are as follows (in thousands):
|
Balance
as January 1, 2009
|
$ | 22,187 | ||
|
Reductions
for tax positions of prior years
|
(310 | ) | ||
|
Balance
at December 31, 2009
|
$ | 21,877 |
At
December 31, 2009, we had $21.9 million of unrecognized federal income tax
benefits that pertain to tax positions taken in the prior years for which there
is uncertainty as to the timing of the corresponding tax deductions, but
which the ultimate deductibility is highly certain. The timing of the
corresponding tax deductions will not affect our annual reported effective
income tax rate in any of the prior, current or future financial reporting
periods, but could result in the acceleration of tax payments for a prior
reporting period. Adjustments to our federal taxable income in prior tax
reporting periods would largely be offset by our available NOL carryforward, and
therefore, the potential underpayment of tax, interest and penalties have not
been accrued with respect to this liability. It is not likely that
the amount of our unrecognized tax benefits will decrease significantly within
the next twelve months.
Internal
Revenue Code (“I.R.C.”) Section 382 imposes additional limitations on a
corporation’s ability to utilize its NOL carryforwards in the tax years
following an “ownership change”. For this purpose, an ownership
change results from stock transactions that increase the ownership of certain
existing and new stockholders in the corporation by more than 50 percentage
points during the previous three year testing period. The minimum
annual NOL utilization limitation amount is determined by multiplying the
company’s market capitalization value on the ownership change date by the
applicable federal interest rate. The amount of the limitation may,
under certain circumstances, be increased to reflect both recognized and deemed
recognized built-in gains that occur, or are deemed to occur, during the
five-year period immediately following the ownership change. Several
ownership changes in our stock have occurred between 1998 and 2007 that
subjected our NOL carryforwards that existed in those years to the annual NOL
utilization limitations provided for in Section 382. However, the annual
NOL utilization limitations applicable to these ownership changes have not had a
material impact on our ability to utilize the NOL carryforwards generated in
prior years.
During
the fourth quarter of 2008, largely due to the increased level of trading
activity in our shares, we experienced an ownership change within Section 382
that will subject approximately $600 million of our existing tax NOL
carryforwards to the annual NOL utilization limitations. The
applicable Section 382 limitation may affect our ability to fully utilize our
existing tax NOL carryforwards. Our ability to fully utilize our
existing tax NOL carryforwards is dependent on increasing the recognition of
built-in gains in the five-year period following the above-referenced ownership
change.
NOTE
22—SHARE-BASED COMPENSATION
We have
granted options to purchase common stock to employees, consultants and outside
directors under the Cheniere Energy, Inc. Amended and Restated 1997 Stock Option
Plan (“1997 Plan”) and the Cheniere Energy, Inc. Amended and Restated
2003 Stock Incentive Plan (“2003 Plan”). We recognize our share-based
payments to employees in the consolidated financial statements based on their
fair values at the date of grant. The calculated fair value is recognized as
expense (net of any capitalization) over the requisite service period, net of
estimated forfeitures, using the straight-line method.
For the
years ended December 31, 2009, 2008 and 2007, the total share-based
compensation expense recognized in our net loss (net of capitalization) was
$19.2 million, $55.0 million and $56.6 million, respectively. The
effect of a change in estimated forfeitures is recognized through a cumulative
adjustment included in share-based compensation cost in the period of change in
estimate. We consider many factors when estimating expected forfeitures,
including types of awards, employee class and historical experience. For the
years ended December 31, 2009, 2008 and 2007, the cumulative adjustment
recognized in our compensation expense was $1.0 million, $14.5 million, and $4.8
million respectively. For the years ended December 31, 2009, 2008 and 2007,
the total share-based compensation cost capitalized as part of the cost of
capital assets was $1.1 million, $2.4 million and $1.7 million,
respectively.
The total
unrecognized compensation cost at December 31, 2009 relating to non-vested
share-based compensation arrangements granted under the 1997 Plan and 2003 Plan,
before any capitalization, was $24.9 million. That cost is expected to be
recognized over 3.75 years, with a weighted average period of 0.92
years.
Tax deductions are
generally available to us in an amount equal to the share-based compensation
income included in the taxable income of our employees, to the extent our
corporate-level tax deductions are not otherwise limited by Section 162(m)
of the IRC. As previously discussed in Note 21—“Income Taxes”, tax benefits
associated with share-based payments to employees may not be recognized unless
or until the corresponding tax deductions have reduced current taxes payable. As
a result of our cumulative NOL
77
CHENIERE
ENERGY, INC. AND SUBSIDIARIES
NOTES
TO CONSOLIDATED FINANCIAL STATEMENTS—Continued
carryovers
and resulting valuation allowance, the tax benefits associated with deductions
related to share-based payments to employees will not be recognized for
financial reporting purposes until such time as all existing and future NOLs
have been utilized.
We
received total proceeds from the exercise of stock options of zero, $0.5 million
and $3.2 million in the years ended December 31, 2009, 2008 and 2007,
respectively.
Phantom
Stock
On
February 25, 2009, the Compensation Committee made phantom stock grants of
5,545,000 shares pursuant to our 2003 Plan to all Cheniere executives,
designated employees and one consultant. On June 12, 2009, the Compensation
Committee made additional phantom stock grants of 800,000 shares to our Chief
Executive Officer pursuant to the approval from our stockholders to increase the
maximum number of shares granted to any one individual under our 2003 Plan
during a calendar year from 1.0 million shares to 3.0 million shares. The shares
were awarded under a time based plan and a performance based plan. The time
based plan includes 1,565,000 shares and provides for a three-year graded
vesting schedule. One-third of the compensation, or 522,000 shares, vested on
December 15, 2009. The remaining two-thirds will vest equally
on December 15, 2010 and 2011. The performance based plan includes
4,780,000 shares and divides each grant into three equal parts providing
incentive compensation based on separate vesting terms. Vested shares of phantom
stock will be settled in cash or in shares of common stock, as determined by the
Compensation Committee. In June 2009, we obtained approval from our shareholders
to increase the number of shares of common stock available for issuance under
our 2003 Plan from 11.0 million common shares to 21.0 million common shares,
which provided the required number of common shares needed to satisfy vested
phantom stock. We transferred the fair valued compensation liability
associated with these phantom grants into additional paid-in
capital. Using a Monte Carlo simulation, fair values were calculated
as of June 12, 2009 for the time and performance based plans. For the
year ended December 31, 2009, a total of $5.9 million was recognized as
compensation expense relating to time and performance based phantom stock
grants. We will account for these phantom grants similar to restricted stock as
we intend to settle and historically have settled these types of instruments
with common shares. The total unrecognized compensation cost at
December 31, 2009 relating to non-vested phantom stock, before any
capitalization, was $13.7 million and is expected to be recognized over 2.0
years, with a weighted average period of 1.12 years.
In May
2007, the Company established the 2007 Incentive Compensation Plan (“2007 Plan”)
and the 2008-2010 Incentive Compensation Plan (“2008-2010 Plan”) covering
executive officers and other key employees for the performance periods of 2007
through 2010. A total of 537,000 and 1,794,000 shares of phantom stock were
granted under the 2007 Plan and 2008-2010 Plans, respectively, payable in shares
of our common stock upon achievement of stock price hurdles established by the
plans. In January 2008, 537,000 of shares of our common stock were issued as the
stock price hurdle for the 2007 Plan was achieved. During the fourth quarter of
2008, certain executives and key employees forfeited 1,041,000 shares of their
2008—2010 phantom shares with no concurrent consideration. In connection with
the forfeitures of the phantom shares, a total of $5.1 million of unrecognized
compensation cost was recognized. Subsequently, on February 19,
2009, the Compensation Committee of our Board of Directors (the “Compensation
Committee”) cancelled the 2008–2010 Phantom Incentive Compensation Plan (the
“Incentive Plan”).
Stock
Options
We
estimate the fair value of stock options at the date of grant using a
Black-Scholes valuation model. The risk-free rate is based on the U.S. Treasury
securities yield curve in effect at the time of grant. The expected term
(estimated period of time outstanding) of stock options granted is based on the
“simplified” method of estimating the expected term for “plain vanilla” stock
options, and varies based on the vesting period and contractual term of the
stock option. Expected volatility for stock options granted is based on an
equally weighted average of the implied volatility of exchange traded stock
options on our common stock expiring more than one year from the measurement
date, and historical volatility of our common stock for a period equal to the
stock option’s expected life. We have not declared dividends on our common
stock. We did not issue any options to purchase shares of our common stock
during year ended December 31, 2009.
During the fourth
quarter of 2008, certain executives and key employees forfeited 2,000,000 shares
of their out-of-the-money option retention grants with no concurrent
consideration. These options were granted during 2005 and 2006 to
executives and key employees as a future incentive for employment. The retention
grants included vesting periods beginning in 2009 through 2012 as well as
exercise prices ranging from $36.25 to $90.00. In connection with the
cancellation of the phantom shares, a total of $19.6 million of unrecognized
compensation expense was recorded.
78
CHENIERE
ENERGY, INC. AND SUBSIDIARIES
NOTES
TO CONSOLIDATED FINANCIAL STATEMENTS—Continued
During
2007, we issued options to purchase 20,000 shares of our common stock under the
2003 Plan to employees as hiring incentives, having an exercise price equal to
the stock price on the date of grant, graded vesting over four years, and a
10-year contractual life.
The table
below provides a summary of option activity under the combined plans as of
December 31, 2009:
|
Options
|
Weighted
Average Exercise Price
|
Weighted
Average Remaining Contractual Term
|
Aggregate
Intrinsic Value
|
||||||||
|
(in thousands)
|
(in thousands)
|
||||||||||
|
Outstanding
at January 1, 2009
|
1,206
|
$
|
28.96
|
||||||||
|
Granted
|
—
|
—
|
|||||||||
|
Exercised
|
—
|
—
|
|||||||||
|
Forfeited
or Expired
|
(323
|
)
|
36.07
|
||||||||
|
Outstanding
at December 31, 2009
|
883
|
$
|
26.36
|
4.94
|
$
|
—
|
|||||
|
Exercisable
at December 31, 2009
|
860
|
$
|
26.00
|
4.90
|
$
|
—
|
|||||
The
weighted average grant-date fair value of options granted during the years ended
December 31, 2009, 2008 and 2007 was zero, zero and $19.44, respectively.
The total intrinsic value of options exercised during the years ended
December 31, 2009, 2008 and 2007 was zero, $1.0 million and $19.3
million, respectively.
Stock
and Non-Vested Stock
We have
granted stock and non-vested (restricted) stock to employees, executive
officers, outside directors and consultants under the 2003 Plan. Grants of
non-vested stock are accounted for on an intrinsic value basis. The amortization
of the calculated value of non-vested stock grants is accounted for as a charge
to compensation and an increase in additional paid-in-capital over the requisite
service period.
For the
years ended December 31, 2009, 2008 and 2007, we issued 522,000 shares, 537,000
shares and zero, respectively, of performance vested stock awards to our
executives and certain officers.
For the
years ended December 31, 2009, 2008 and 2007, we issued 325,000 shares,
4,379,000 shares and 1,061,000 shares, respectively, of non-vested stock awards
to our employees, executives, directors and a consultant as performance,
retention, service and new hire awards. A majority of the awards were
issued with a one, three or four-year graded vesting period. A
certain group of 2007 retention grants received a vesting schedule of 50% on
December 1, 2008, 30% on December 1, 2009 and 20% on June 1, 2010.
On
May 25, 2007, the Compensation Committee of our Board of Directors approved
a bonus plan covering substantially all employees not otherwise included in the
2007 Plan. This plan provided covered employees the ability to earn bonuses
based on the achievement of established annual performance goals as well as a
stock price appreciation goal. The fair value of the grants was recalculated at
each balance sheet date until the total number of restricted shares was granted
in January 2008. Because of the existence of the stock price appreciation goal,
which was a market condition, the restricted stock was not eligible for
amortization under the straight-line method, and each vesting tranche is being
amortized separately.
The table
below provides a summary of the status of our non-vested shares under the 2003
Plan as of December 31, 2009 (in thousands except for per share
information):
|
Non
Vested
Shares
|
Weighted
Average
Grant
Date
Fair Value
Per
Share
|
|||||||
|
Non-vested
at January 1, 2009
|
3,724 | $ | 3.46 | |||||
|
Granted
|
847 |
—
|
||||||
|
Vested
|
(2,176 | ) | 3.07 | |||||
|
Forfeited
|
(88 | ) | 4.48 | |||||
|
Non-vested
at December 31, 2009
|
2,307 | $ | 2.52 | |||||
The
weighted average grant-date fair values of non-vested stock granted during the
years ended December 31, 2009, 2008 and
79
CHENIERE
ENERGY, INC. AND SUBSIDIARIES
NOTES
TO CONSOLIDATED FINANCIAL STATEMENTS—Continued
2007
were zero, $9.40 and $31.99, respectively. The total grant-date fair values of
shares vested during the years ended December 31, 2009, 2008 and 2007
were $5.4 million, $6.8 million and $7.8 million, respectively.
Share-based
Plan Descriptions and Information
Our 1997
Plan provides for the issuance of stock options to purchase up to
5.0 million shares of our common stock, all of which have been granted.
Non-qualified stock options were granted to employees, contract service
providers and outside directors.
In June
2009, we obtained approval from our stockholders to increase the number of
shares of common stock available for issuance under our 2003 Plan from 11.0
million shares to 21.0 million shares. These awards may be in the form of
non-qualified stock options, incentive stock options, purchased stock,
restricted (non-vested) stock, bonus (unrestricted) stock, stock appreciation
rights, phantom stock and other share-based performance awards deemed by the
Compensation Committee to be consistent with the purposes of the 2003 Plan. To
date, the only awards made by the Compensation Committee have been in the form
of non-qualified stock options, restricted stock, restricted stock units and
phantom shares.
401(k)
Plan
In 2005,
we established a defined contribution pension plan (“401(k) Plan”). The 401(k)
Plan allows eligible employees to contribute up to 100% of their compensation up
to the IRS maximum. We match each employee’s salary deferrals (contributions) up
to six percent of compensation and may make additional contributions at our
discretion. Effective January 1, 2007, employees are immediately vested in
the contributions made by us. Our contributions to the 401(k) Plan were $1.4
million, $2.3 million and $1.8 million for the years ended December 31,
2009, 2008, and 2007, respectively. We have made no discretionary contributions
to the 401(k) Plan to date.
NOTE
23—COMPREHENSIVE LOSS
The
following table is a reconciliation of our net loss to our comprehensive loss
for the periods shown (in thousands):
|
Years
Ended December 31,
|
||||||||||||
|
2009
|
2008
|
2007
|
||||||||||
|
(as
adjusted)
|
(as
adjusted)
|
|||||||||||
|
Net
loss
|
$ | (161,490 | ) | $ | (372,959 | ) | $ | (196,580 | ) | |||
|
Other
comprehensive (loss) income item:
|
||||||||||||
|
Foreign
currency translation
|
21 | (149 | ) | 29 | ||||||||
|
Comprehensive
loss
|
$ | (161,469 | ) | $ | (373,108 | ) | $ | (196,551 | ) | |||
NOTE
24—COMMITMENTS AND CONTINGENCIES
LNG
Terminal Commitments and Contingencies
Obligations
under LNG TUAs
Sabine
Pass LNG has entered into third-party TUAs with Total and Chevron to provide
berthing for LNG vessels and for the unloading, storage and regasification of
LNG at the Sabine Pass LNG receiving terminal.
Freeport
LNG
Under the
limited partnership agreement of Freeport LNG, development expenses of the
Freeport LNG project and other Freeport LNG cash needs generally are to be
funded out of Freeport LNG’s own cash flows, borrowings or other sources, and,
up to a pre-agreed total amount, with capital contributions by the limited
partners. We do not anticipate that any capital calls will be made upon the
limited partners of Freeport LNG in the foreseeable future. Capital calls may be
made upon us and the other limited partners in Freeport LNG and in the event of
each such future capital call, we will have the option either to contribute the
requested capital or to decline to contribute. If we decline to contribute, the
other limited partners could elect to make our contribution and receive back
twice the amount contributed on our behalf, without interest, before any
Freeport LNG cash flows are otherwise distributed to us. We currently expect to
evaluate Freeport LNG capital calls on a case-by-case basis and to fund
additional capital contributions that we elect to make using cash on hand or
funds raised through the issuance of Cheniere equity or debt securities or other
Cheniere borrowings.
80
CHENIERE
ENERGY, INC. AND SUBSIDIARIES
NOTES
TO CONSOLIDATED FINANCIAL STATEMENTS—Continued
Under a
settlement agreement dated as of June 14, 2001, we agreed to pay a royalty,
which we refer to as the Crest Royalty. This Crest Royalty is calculated based
on the volume of natural gas processed through covered LNG facilities. The
Freeport LNG and Sabine Pass LNG receiving terminals are covered
facilities. Freeport LNG has assumed the obligation to pay the Crest
Royalty for natural gas processed at Freeport LNG’s receiving
terminal. The Crest Royalty is subject to a maximum of approximately
$11.0 million per production year at throughput of approximately 1.0 Bcf/d and a
minimum of $2.0 million. The first production year began in April
2009.
In March
2008 and May 2008, we received cash call notices from Freeport LNG requesting
that we provide further financial support due to higher than expected
commissioning and performance testing costs. During 2008, we funded the cash
calls and recorded $4.8 million of additional losses in Freeport LNG. In
addition, Freeport LNG distributed $4.8 million to us in October
2008.
LNG
Terminal EPC Agreements
In July
2006, Sabine Pass LNG entered into an engineering, procurement, construction and
management (“EPCM”) agreement with Bechtel Corporation (“Bechtel”) for
engineering, procurement, construction and management of construction services
in connection with our 1.4 Bcf/d expansion at the Sabine Pass LNG receiving
terminal. Under the initial terms of the EPCM agreement, Bechtel was paid on a
cost reimbursable basis, plus a fixed fee in the initial amount of $18.5
million. A discretionary bonus was paid to Bechtel at Sabine Pass LNG’s sole
discretion upon completion of the expansion. As of December 31, 2009, we
were committed to make cash payments of approximately $2.6 million in the future
pursuant to this contract.
In July
2006, Sabine Pass LNG entered into an EPC LNG Tank Contract with Diamond LNG LLC
(“Diamond”) and Zachry Construction Corporation (“Zachry” and collectively with
Diamond, the “Tank Contractor”) for the construction of two LNG storage tanks in
connection with the 1.4 Bcf/d expansion. Milestone payments for work incurred,
minus a 5% retainage were made upon final completion.
Restricted
Net Assets
At
December 31, 2009, our restricted net assets of consolidated subsidiaries
were approximately ($477) million.
Other
Commitments
In the
ordinary course of business, we have issued surety bonds related to our offshore
oil and gas operations and entered into certain multi-year licensing and service
agreements, none of which are considered material to our financial
position.
Legal
Proceedings
We may in
the future be involved as a party to various legal proceedings, which are
incidental to the ordinary course of business. We regularly analyze current
information and, as necessary, provide accruals for probable liabilities on the
eventual disposition of these matters. In the opinion of management, as of
December 31, 2009, there were no threatened or pending legal matters that
would have a material impact on our consolidated results of operations,
financial position or cash flows.
NOTE
25—BUSINESS SEGMENT INFORMATION
We have
three operating business segments: LNG receiving terminal business, natural gas
pipeline business and LNG and natural gas marketing business. These operating
segments reflect lines of business for which separate financial information is
produced internally and are subject to evaluation by our chief operating
decision makers in deciding how to allocate resources.
Our LNG
receiving terminal business segment consists of the operational Sabine Pass LNG
receiving terminal, approximately 90.6% owned (at December 31, 2009) in western
Cameron Parish, Louisiana on the Sabine Pass Channel and two other LNG receiving
terminals that are in various stages of development at the following locations:
Corpus Christi LNG, 100% owned, near Corpus Christi, Texas; and Creole Trail
LNG, 100% owned, at the mouth of the Calcasieu Channel in central Cameron
Parish, Louisiana. In addition, we own a 30% limited partner interest in a
fourth project, Freeport LNG, located on Quintana Island near Freeport,
Texas.
Our
natural gas pipeline business segment consists of the Creole Trail Pipeline,
consisting of 94 miles of natural gas pipeline
81
CHENIERE
ENERGY, INC. AND SUBSIDIARIES
NOTES
TO CONSOLIDATED FINANCIAL STATEMENTS—Continued
connecting
the Sabine Pass LNG receiving terminal to numerous interconnections points with
existing interstate natural gas pipelines in southwest Louisiana, and other
natural gas pipelines in various stages of development to provide access to
North American natural gas markets.
Our LNG
and natural gas marketing business segment is seeking to develop a portfolio of
long-term, short-term, and spot LNG purchase agreements and focuses on entering
into business relationships for the domestic marketing of natural gas that is
imported by Cheniere Marketing as LNG to the Sabine Pass LNG receiving
terminal.
The
following table summarizes revenues, net income (loss) from operations and total
assets for each of our operating segments (in thousands):
|
Segments
|
||||||||||||||||||||
|
LNG
Receiving Terminal
|
Natural
Gas
Pipeline
|
LNG
& Natural Gas Marketing
|
Corporate
and Other (1)
|
Total
Consolidation
|
||||||||||||||||
|
As
of or for the Year Ended December 31, 2009
|
||||||||||||||||||||
|
Revenues
|
$ | 170,071 | $ | 102 | $ | 8,087 | $ | 2,866 | $ | 181,126 | ||||||||||
|
Intersegment
revenues (losses) (2) (3) (4) (5)
|
252,928 | 932 | (249,196 | ) | (4,664 | ) | — | |||||||||||||
|
Depreciation,
depletion and amortization
|
33,203 | 14,731 | 1,505 | 4,790 | 54,229 | |||||||||||||||
|
Non-cash
compensation
|
1,300 | 583 | 5,661 | 11,652 | 19,196 | |||||||||||||||
|
Income
(loss) from operations
|
333,710 | (21,453 | ) | (260,514 | ) | (28,247 | ) | 23,496 | ||||||||||||
|
Interest
expense, net
|
(157,057 | ) | (44,912 | ) | — | (41,326 | ) | (243,295 | ) | |||||||||||
|
Interest
income
|
1,056 | 4 | 202 | 143 | 1,405 | |||||||||||||||
|
Goodwill
|
76,819 | — | — | — | 76,819 | |||||||||||||||
|
Total
assets
|
2,013,618 | 569,626 | 147,164 | 2,214 | 2,732,622 | |||||||||||||||
|
Expenditures
for additions to long-lived assets
|
$ | 106,628 | $ | (4,376 | ) | $ | 1,081 | $ | (539 | ) | $ | 102,794 | ||||||||
|
As
of or for the Year Ended December 31, 2008 (as
adjusted)
|
||||||||||||||||||||
|
Revenues
|
$ | — | $ | 15 | $ | 2,914 | $ | 4,215 | $ | 7,144 | ||||||||||
|
Intersegment
revenues (losses) (2) (3) (4) (5)
|
15,000 | 1,010 | (15,000 | ) | (1,010 | ) | — | |||||||||||||
|
Depreciation,
depletion and amortization
|
8,337 | 8,398 | 1,599 | 6,012 | 24,346 | |||||||||||||||
|
Non-cash
compensation
|
3,500 | 833 | 11,629 | 39,068 | 55,030 | |||||||||||||||
|
Loss
from operations
|
(26,111 | ) | (14,846 | ) | (109,880 | ) | (93,351 | ) | (244,188 | ) | ||||||||||
|
Interest
expense, net
|
(74,825 | ) | (22,674 | ) | (2,057 | ) | (47,580 | ) | (147,136 | ) | ||||||||||
|
Interest
income
|
14,619 | — | 1,624 | 4,094 | 20,337 | |||||||||||||||
|
Goodwill
|
76,844 | — | — | — | 76,844 | |||||||||||||||
|
Total
assets
|
2,191,671 | 590,995 | 136,138 | 1,278 | 2,920,082 | |||||||||||||||
|
Expenditures
for additions to long-lived assets
|
$ | 401,751 | $ | 148,132 | $ | 527 | $ | 2,375 | $ | 552,785 | ||||||||||
|
As
of or for the Year Ended December 31, 2007 (as
adjusted)
|
||||||||||||||||||||
|
Revenues
|
$ | — | $ | — | $ | (4,729 | ) | $ | 5,376 | $ | 647 | |||||||||
|
Depreciation,
depletion and amortization
|
235 | — | 891 | 5,267 | 6,393 | |||||||||||||||
|
Non-cash
compensation
|
4,937 | 2,019 | 13,617 | 37,758 | 58,331 | |||||||||||||||
|
Loss
from operations
|
(37,390 | ) | (4,835 | ) | (39,356 | ) | (82,359 | ) | (163,940 | ) | ||||||||||
|
Interest
expense, net
|
(69,419 | ) | (4 | ) | (502 | ) | (49,435 | ) | (119,360 | ) | ||||||||||
|
Interest
income
|
52,273 | — | 2,476 | 27,886 | 82,635 | |||||||||||||||
|
Goodwill
|
76,844 | — | — | — | 76,844 | |||||||||||||||
|
Total
assets
|
2,041,894 | 443,421 | 157,601 | 316,827 | 2,959,743 | |||||||||||||||
|
Expenditures
for additions to long-lived assets
|
$ | 488,373 | $ | 393,159 | $ | 5,294 | $ | 13,141 | $ | 899,967 | ||||||||||
|
(1)
|
Includes
corporate activities, oil and gas exploration, development and
exploitation activities and certain intercompany eliminations. Our oil and
gas exploration, development and exploitation operating activities have
been included in the corporate and other column due to the lack of a
material impact that these activities have on our consolidated financial
statements. Prior periods were restated to include oil and gas
exploration, development and exploitation activities within corporate and
other.
|
|
(2)
|
Intersegment
revenues related to our LNG receiving terminal segment are primarily from
TUA capacity reservation fee revenues of $250.2 million and $15.0 million
and tug revenues that were received from our LNG and natural gas marketing
segment for
|
82
CHENIERE
ENERGY, INC. AND SUBSIDIARIES
NOTES
TO CONSOLIDATED FINANCIAL STATEMENTS—Continued
|
|
the
years ended December 31, 2009 and 2008, respectively. These LNG receiving
terminal segment intersegment revenues are eliminated with intersegment
expenses in our Consolidated Statement of Operations.
|
|
(3)
|
Intersegment
revenues related to our natural gas pipeline segment are primarily from
transportation fees charged by our natural gas pipeline segment to our LNG
receiving terminal and LNG and natural gas marketing segments to transport
natural gas that was regasified at the Sabine Pass LNG receiving
terminal. These natural gas pipeline segment intersegment
revenues are eliminated with intersegment expenses in our Consolidated
Statement of Operations.
|
|
(4)
|
Intersegment
losses related to our LNG and natural gas marketing segment are primarily
from TUA capacity reservation fee expenses of $250.2 million and $15.0
million and tug costs that were incurred from our LNG receiving terminal
segment for the years ended December 31, 2009 and 2008, respectively. The
costs of the LNG and natural gas marketing segment TUA capacity
reservation fee expenses are classified as marketing trading gain (loss)
as it is considered a capacity contract related to our energy trading and
risk management activities. These LNG and natural gas marketing segment
intersegment revenues are eliminated with intersegment expenses in our
Consolidated Statement of
Operations.
|
|
(5)
|
Intersegment
losses related to corporate and other are from various transactions
between our LNG receiving terminal, natural gas pipeline and LNG and
natural gas marketing segments in which revenue recorded by one operating
segment is eliminated with a non-revenue line item (i.e. operating expense
or is capitalized) by the other operating
segment.
|
NOTE
26—SUPPLEMENTAL CASH FLOW INFORMATION AND DISCLOSURES OF NON-CASH
TRANSACTIONS
The following table provides
supplemental disclosure of cash flow information (in
thousands):
|
Year
Ended December 31,
|
||||||||||||
|
2009
|
2008
|
2007
|
||||||||||
|
Cash
paid during the year for interest, net of amounts
capitalized
|
$ | 90,702 | $ | 110,695 | $ | 106,640 | ||||||
|
Construction-in-process
and debt issuance additions funded with accrued
liabilities
|
3,424 | 28,448 | 112,824 | |||||||||
During
2007, 688,249 shares of common stock were issued in satisfaction of cashless
exercises of options to purchase 731,670 shares of common stock.
83
CHENIERE
ENERGY, INC. AND SUBSIDIARIES
SUMMARIZED
QUARTERLY FINANCIAL DATA
(unaudited)
Quarterly
Financial Data—(in thousands, except per share amounts)
|
First
Quarter
|
Second
Quarter
|
Third
Quarter
|
Fourth
Quarter
|
|||||||||||||
|
Year
ended December 31, 2009:
|
||||||||||||||||
|
Revenues
|
$ | 1,235 | $ | 37,959 | $ | 56,332 | $ | 85,600 | ||||||||
|
Income
(loss) from operations
|
(37,398 | ) | 323 | 18,254 | 42,317 | |||||||||||
|
Net
loss
|
(82,742 | ) | (13,051 | ) | (42,497 | ) | (23,200 | ) | ||||||||
|
Net
loss per share—basic and diluted
|
$ | (1.70 | ) | $ | (0.25 | ) | $ | (0.80 | ) | $ | (0.44 | ) | ||||
|
Year
ended December 31, 2008:
|
||||||||||||||||
|
Revenues
|
$ | 1,477 | $ | 914 | $ | 4,100 | $ | 653 | ||||||||
|
Loss
from operations
|
(38,365 | ) | (103,467 | ) | (39,145 | ) | (63,211 | ) | ||||||||
|
Net
loss (as
adjusted)
|
(53,693 | ) | (136,543 | ) | (71,619 | ) | (111,104 | ) | ||||||||
|
Net
loss per share—basic and diluted (as
adjusted)
|
$ | (1.14 | ) | $ | (2.90 | ) | $ | (1.51 | ) | $ | (2.32 | ) | ||||
84
None.
Evaluation
of Disclosure Controls and Procedures
Based on
their evaluation as of the end of the fiscal year ended December 31, 2009, our
principal executive officer and principal financial officer have concluded that
our disclosure controls and procedures (as defined in Rules 13a-15(e) and
15d-15(e) under the Exchange Act) are effective to ensure that information
required to be disclosed in reports that we file or submit under the Exchange
Act are (i) accumulated and communicated to our management, including our
principal executive officer and principal financial officer, as appropriate, to
allow timely decisions regarding required disclosure and (ii) recorded,
processed, summarized and reported within the time periods specified in the
SEC’s rules and forms.
During
the most recent fiscal quarter, there have been no changes in our internal
control over financial reporting that have materially affected, or are
reasonably likely to materially affect, our internal control over financial
reporting.
Management’s
Report on Internal Control Over Financial Reporting
Our
Management Report on Internal Control Over Financial Reporting is included in
the Consolidated Financial Statements on page 48 and is incorporated herein
by reference.
None.
Pursuant
to paragraph 3 of General Instruction G to Form 10-K, the information required
by Items 10 through 14 of Part III of this Report is incorporated by reference
from Cheniere’s definitive proxy statement, which is to be filed pursuant to
Regulation 14A within 120 days after the end of Cheniere’s fiscal year ended
December 31, 2009.
|
(a)
|
Financial
Statements, Schedules and Exhibits
|
|
(1)
|
Financial
Statements—Cheniere Energy, Inc. and
Subsidiaries:
|
|
(2)
|
Financial
Statement Schedules:
|
85
(3) Exhibits:
|
Exhibit
No.
|
Description
|
|
2.1*
|
Settlement
and Purchase Agreement, dated and effective as of June 14, 2001 by and
between the Company, CXY Corporation, Crest Energy, L.L.C., Crest
Investment Company and Freeport LNG Terminal, LLC, and two related letter
agreements each dated February 27, 2003. (Incorporated by reference
to Exhibit 10.36 to Cheniere Energy Partner, L.P.’s Registration Statement
on Form S-1 (SEC File No. 333-139572), filed on January 25,
2007)
|
|
2.2*
|
Agreement
and Plan of Merger, dated February 8, 2005, by and among Cheniere LNG,
Inc., Cheniere Acquisition, LLC, BPU Associates, LLC and BPU LNG, Inc.
(Incorporated by reference to Exhibit 2.1 to the Company’s Current Report
on Form 8-K (SEC File No. 001-16383), filed on February 8,
2005)
|
|
3.1*
|
Restated
Certificate of Incorporation of the Company. (Incorporated by reference to
Exhibit 3.1 to the Company’s Quarterly Report on Form 10-Q for the fiscal
quarter ended June 30, 2004 (SEC File No. 001-16383), filed on August 10,
2004)
|
|
3.2*
|
Certificate
of Amendment of Restated Certificate of Incorporation of the Company.
(Incorporated by reference to Exhibit 3.1 to the Company’s Current Report
on Form 8-K (SEC File No. 001-16383), filed on February 8,
2005)
|
|
3.3*
|
Certificate
of Amendment of Restated Certificate of Incorporation of the Company.
(Incorporated by reference to Exhibit 4.3 to the Company’s Registration
Statement on Form S-8 (SEC File No. 333-160017), filed on June 16,
2009)
|
|
3.4*
|
Amended
and Restated By-laws of the Company. (Incorporated by reference to Exhibit
4.3 to the Company’s Registration Statement on Form S-8 (SEC File No.
333-112379), filed on January 30, 2004)
|
|
3.5*
|
Amendment
No. 1 to Amended and Restated By-laws of the Company. (Incorporated by
reference to Exhibit 3.1 to the Company’s Quarterly Report on Form 10-Q
(SEC File No. 001-16383), filed on May 6, 2005)
|
|
3.6*
|
Amendment
No. 2, dated September 6, 2007, to the Amended and Restated By-Laws of
Cheniere Energy, Inc. (Incorporated by reference to Exhibit 3.1 to the
Company’s Current Report on Form 8-K (SEC File No. 001-16383), filed
on September 12, 2007)
|
|
4.1*
|
Specimen
Common Stock Certificate of the Company. (Incorporated by reference to
Exhibit 4.1 to the Company’s Registration Statement on Form S-1 (SEC File
No. 333-10905), filed on August 27, 1996)
|
|
4.2*
|
Certificate
of Designation of Series A Junior Participating Preferred Stock.
(Incorporated by reference to Exhibit 3.1 to the Company’s Current Report
on Form 8-K (SEC File No. 001 16383), filed on October 14,
2004)
|
|
4.3*
|
Rights
Agreement by and between the Company and U.S. Stock Transfer Corp., as
Rights Agent, dated as of October 14, 2004. (Incorporated by reference to
Exhibit 4.1 to the Company’s Current Report on Form 8-K (SEC File No.
001-16383), filed on October 14, 2004)
|
|
4.4*
|
First
Amendment to Rights Agreement by and between the Company and U.S. Stock
Transfer Corp., as Rights Agent, dated January 24, 2005. (Incorporated by
reference to Exhibit 4.1 to the Company’s Current Report on Form 8-K (SEC
File No. 001-16383), filed on January 24, 2005)
|
|
4.5*
|
Second
Amendment to Rights Agreement by and between Cheniere Energy, Inc. and
Computershare Trust Company, N.A. (formerly U.S. Stock Transfer Corp.), as
Rights Agent, dated as of October 24, 2008 (filed herewith). (Incorporated
by reference to Exhibit 4.1 to the Company’s Current Report on Form 8-K
(SEC File No. 001-16383), filed on October 24, 2008)
|
|
4.6*
|
Certificate
of Designations of Series B Preferred Stock of Cheniere Energy, Inc.
(Incorporated by reference to Exhibit 3.1 to the Company’s Current Report
on Form 8-K (SEC File No. 001-16383), filed on August 18,
2008)
|
|
4.7*
|
Form
of Series B Preferred Stock Certificate of Cheniere Energy, Inc.
(Incorporated by reference to Exhibit 4.1 to the Company’s Current Report
on Form 8-K (SEC File No. 001-16383), filed on August 18,
2008)
|
|
4.8*
|
Indenture,
dated as of July 27, 2005, between the Company, as issuer, and The Bank of
New York, as trustee. (Incorporated by reference to Exhibit 4.3 to the
Company’s Current Report on Form 8-K (SEC File No.
001-
|
86
|
Exhibit
No.
|
Description
|
|
|
16383),
filed on July 27, 2005)
|
|
4.9*
|
Indenture,
dated as of November 9, 2006, between Sabine Pass LNG, L.P., as issuer,
and The Bank of New York, as trustee. (Incorporated by reference to
Exhibit 4.1 to the Company’s Current Report on Form 8-K (SEC File No.
001-16383), filed on November 16, 2006)
|
|
4.10*
|
Form
of 7.25% Senior Secured Note due 2013 (Included as Exhibit A1 to Exhibit
4.9 above)
|
|
4.11*
|
Form
of 7.50% Senior Secured Note due 2016 (Included as Exhibit A1 to Exhibit
4.9 above)
|
|
10.1*
|
LNG
Terminal Use Agreement, dated September 2, 2004, by and between Total LNG
USA, Inc. and Sabine Pass LNG, L.P. (Incorporated by reference to Exhibit
10.1 to the Company’s Quarterly Report on Form 10-Q (SEC File No.
001-16383), filed on November 15, 2004)
|
|
10.2*
|
Amendment
of LNG Terminal Use Agreement, dated January 24, 2005, by and between
Total LNG USA, Inc. and Sabine Pass LNG, L.P. (Incorporated by reference
to Exhibit 10.40 to the Company’s Annual Report on Form 10-K (SEC File No.
001-16383), filed on March 10, 2005)
|
|
10.3*
|
Omnibus
Agreement, dated September 2, 2004, by and between Total LNG USA, Inc. and
Sabine Pass LNG, L.P. (Incorporated by reference to Exhibit 10.2 to the
Company’s Quarterly Report on Form 10-Q (SEC File No. 001-16383), filed on
November 15, 2004)
|
|
10.4*
|
Guaranty,
dated as of November 9, 2004, by Total S.A. in favor of Sabine Pass
LNG, L.P. (Incorporated by reference to Exhibit 10.3 to the Company’s
Quarterly Report on Form 10-Q (SEC File No. 001 16383), filed on
November 15, 2004)
|
|
10.5*
|
LNG
Terminal Use Agreement, dated November 8, 2004, between Chevron U.S.A.
Inc. and Sabine Pass LNG, L.P. (Incorporated by reference to Exhibit 10.4
to the Company’s Quarterly Report on Form 10-Q (SEC File No. 001-16383),
filed on November 15, 2004)
|
|
10.6*
|
Amendment
to LNG Terminal Use Agreement, dated December 1, 2005, by and between
Chevron U.S.A., Inc. and Sabine Pass LNG, L.P. (Incorporated by reference
to Exhibit 10.28 to Sabine Pass LNG, L.P.’s Registration Statement on Form
S-4 (SEC File No. 333-138916), filed on November 22,
2006)
|
|
10.7*
|
Omnibus
Agreement, dated November 8, 2004, between Chevron U.S.A., Inc. and Sabine
Pass LNG, L.P. (Incorporated by reference to Exhibit 10.5 to the Company’s
Quarterly Report on Form 10-Q (SEC File No. 001-16383), filed on November
15, 2004)
|
|
10.8*
|
Guaranty
Agreement, dated as of December 15, 2004, from ChevronTexaco Corporation
to Sabine Pass LNG, L.P. (Incorporated by reference to Exhibit 10.12 to
Sabine Pass LNG, L.P.’s Registration Statement on Form S-4 (SEC File No.
333-138916), filed on November 22, 2006)
|
|
10.9*
|
Amended
and Restated Terminal Use Agreement, dated November 9, 2006, by and
between Cheniere Marketing, Inc. and Sabine Pass LNG, L.P. (Incorporated
by reference to Exhibit 10.6 to the Company’s Current Report on Form 8-K
(SEC File No. 001-16383), filed on November 16, 2006)
|
|
10.10*
|
Amendment
of LNG Terminal Use Agreement, dated June 25, 2007, by and between
Cheniere Marketing, Inc. and Sabine Pass LNG, L.P. (Incorporated by
reference to Exhibit 10.1 to the Company’s Current Report on Form 8-K (SEC
File No. 001-16383), filed on June 26, 2007)
|
|
10.11*
|
Cooperative
Endeavor Agreement & Payment in Lieu of Tax Agreement, dated October
23, 2007 (amending the Amended and Restated Terminal Use Agreement, dated
November 9, 2006, by and between Cheniere Marketing, Inc. and Sabine Pass
LNG, L.P.). (Incorporated by reference to Exhibit 10.7 to the Company’s
Quarterly Report on Form 10-Q (SEC File No. 001-16383), filed on November
6, 2007)
|
|
10.12*
|
LNG
Lease Agreement, dated June 24, 2008, between Cheniere Marketing, Inc. and
Sabine Pass LNG, L.P. (Incorporated by reference to Exhibit 10.7 to the
Company’s Quarterly Report on Form 10-Q (SEC File No. 001-16383), filed on
August 11, 2008)
|
|
10.13*
|
Guarantee
Agreement, dated as of November 9, 2006, by the Company. (Incorporated by
reference to Exhibit 10.7 to the Company’s Current Report on Form 8-K (SEC
File No. 001-16383), filed on November 16, 2006)
|
|
10.14*
|
Notice
of Commitment, dated May 31, 2007. (Incorporated by reference to Exhibit
10.1 to the Company’s Current Report on Form 8-K (SEC File No. 001-16383),
filed on June 1, 2007)
|
87
|
Exhibit
No.
|
Description
|
|
10.15*
|
Collateral
Trust Agreement, dated November 9, 2006, by and among Sabine Pass LNG,
L.P., The Bank of New York, as collateral trustee, Sabine Pass LNG-GP,
Inc. and Sabine Pass LNG-LP, LLC. (Incorporated by reference to Exhibit
10.1 to the Company’s Current Report on Form 8-K (SEC File No. 001-16383),
filed on November 16, 2006)
|
|
10.16*
|
Amended
and Restated Parity Lien Security Agreement, dated November 9, 2006, by
and between Sabine Pass LNG, L.P. and The Bank of New York, as collateral
trustee. (Incorporated by reference to Exhibit 10.2 to the Company’s
Current Report on Form 8-K (SEC File No. 001-16383), filed on November 16,
2006)
|
|
10.17*
|
Third
Amended and Restated Multiple Indebtedness Mortgage, Assignment of Rents
and Leases and Security Agreement, dated November 9, 2006, between
the Sabine Pass LNG, L.P. and The Bank of New York, as collateral trustee.
(Incorporated by reference to Exhibit 10.3 to the Company’s Current Report
on Form 8-K (SEC File No. 001-16383), filed on November 16,
2006)
|
|
10.18*
|
Amended
and Restated Parity Lien Pledge Agreement, dated November 9, 2006, by and
among Sabine Pass LNG, L.P., Sabine Pass LNG-GP, Inc., Sabine Pass LNG-LP,
LLC and The Bank of New York, as collateral trustee. (Incorporated by
reference to Exhibit 10.4 to the Company’s Current Report on Form 8-K (SEC
File No. 001-16383), filed on November 16, 2006)
|
|
10.19*
|
Security
Deposit Agreement, dated November 9, 2006, by and among Sabine Pass LNG,
L.P., The Bank of New York, as collateral trustee, and The Bank of New
York, as depositary agent. (Incorporated by reference to Exhibit 10.5 to
the Company’s Current Report on Form 8-K (SEC File No. 001-16383), filed
on November 16, 2006)
|
|
10.20*
|
Credit
Agreement, dated as of May 31, 2007, among Cheniere Subsidiary Holdings,
LLC, Perry Capital, L.L.C., the several lenders from time to time parties
thereto, and The Bank of New York, as Administrative Agent. (Incorporated
by reference to Exhibit 10.1 to the Company’s Current Report on Form 8-K
(SEC File No. 001-16383), filed on June 1,
2007)
|
|
10.21*
|
Guarantee
and Pledge Agreement, dated as of May 31, 2007, by Cheniere Energy, Inc.,
Cheniere LNG Holdings, LLC, Cheniere FLNG-GP, LLC, and Cheniere Subsidiary
Holdings, LLC in favor of The Bank of New York, as Administrative Agent.
(Incorporated by reference to Exhibit 10.2 to the Company’s Current Report
on Form 8-K (SEC File No. 001-16383), filed on June 1,
2007)
|
|
10.22*
|
Credit
Agreement, dated May 5, 2008, among Cheniere Common Units Holding, LLC,
the lenders party thereto and Credit Suisse, Cayman Islands Branch.
(Incorporated by reference to Exhibit 10.6 to the Company’s Quarterly
Report on Form 10-Q (SEC File No. 001-16383), filed on May 9,
2008)
|
|
10.23*
|
Pledge
Agreement, dated May 5, 2008, among Cheniere Common Units Holding, LLC,
Cheniere LNG Holdings, LLC, Cheniere Pipeline GP Interests, LLC, Grand
Cheniere Pipeline, LLC and Credit Suisse, Cayman Islands Branch.
(Incorporated by reference to Exhibit 10.7 to the Company’s Quarterly
Report on Form 10-Q (SEC File No. 001-16383), filed on May 9,
2008)
|
|
10.24*
|
Security
Agreement, dated May 5, 2008, between Cheniere Common Units Holding, LLC
and Credit Suisse, Cayman Islands Branch. (Incorporated by reference to
Exhibit 10.8 to the Company’s Quarterly Report on Form 10-Q (SEC File No.
001-16383), filed on May 9, 2008)
|
|
10.25*
|
Non-Recourse
Guaranty, dated May 5, 2008, by Cheniere Energy, Inc. in favor of Credit
Suisse. (Incorporated by reference to Exhibit 10.9 to the Company’s
Quarterly Report on Form 10-Q (SEC File No. 001-16383), filed on May 9,
2008)
|
|
10.26*
|
Credit
Agreement dated August 15, 2008, by and among Cheniere Common Units
Holding, LLC the other Loan Parties (as defined therein), The Bank of New
York Mellon, as administrative agent and collateral agent and the Lenders
(as defined therein). (Incorporated by reference to Exhibit 10.1 to
the Company’s Current Report on Form 8-K (SEC File No. 001-16383), filed
on August 18, 2008)
|
|
10.27*
|
First
Amendment to Credit Agreement, dated September 15, 2008, among Cheniere
Common Units Holding, LLC, the other Loan Parties (as defined therein),
The Bank of New York Mellon, as administrative agent and collateral agent
and the Lenders (as defined therein) (Incorporated by reference to Exhibit
10.63 to the Company’s Annual Report on Form 10-K (SEC File No.
001-16383), filed on February 27, 2009)
|
|
10.28*
|
Second
Amendment to Credit Agreement, First Amendment to Guarantee and Collateral
Agreement (Crest Entities) and First Amendment to Guarantee and Collateral
Agreement (Non-Crest Entities), dated December
|
88
|
Exhibit
No.
|
Description
|
|
|
31,
2008, by Cheniere Common Units Holding, LLC, the loan parties, the
guarantors and the grantors signatory thereto, the lenders signatory
thereto and The Bank of New York Mellon, as administrative agent and as
collateral agent (Incorporated by reference to Exhibit 10.64 to the
Company’s Annual Report on Form 10-K (SEC File No. 001-16383), filed on
February 27, 2009)
|
|
10.29*
|
Third
Amendment to Credit Agreement and Third Amendment to Guarantee and
Collateral Agreement (Non-Crest Entities), dated April 3, 2009, among
Cheniere Common Units Holding, LLC, the loan parties, the guarantors and
the grantors signatory thereto, the lenders signatory thereto and The Bank
of New York Mellon, as administrative agent and collateral agent
(Incorporated by reference to Exhibit 10.1 to the Company’s Quarterly
Report on Form 10-Q (SEC File No. 001-16383), filed on May 8,
2009)
|
|
10.30*
|
Fourth
Amendment to Credit Agreement, dated April 9, 2009, among Cheniere Common
Units Holding, LLC, the other Loan Parties (as defined therein), the
Lenders (as defined therein) and The Bank of New York Mellon, as
administrative agent and collateral agent (Incorporated by reference to
Exhibit 10.2 to the Company’s Quarterly Report on Form 10-Q (SEC File No.
001-16383), filed on May 8, 2009)
|
|
10.31*
|
Amendment
No. Four-A to Credit Agreement, dated April 27, 2009, among Cheniere
Common Units Holding, LLC, the other Loan Parties (as defined therein),
the Lenders (as defined therein) and The Bank of New York Mellon, as
administrative agent and collateral agent (Incorporated by reference to
Exhibit 10.3 to the Company’s Quarterly Report on Form 10-Q (SEC File No.
001-16383), filed on May 8, 2009)
|
|
10.32*
|
Amendment
No. Four-B to Credit Agreement, dated April 28, 2009, among Cheniere
Common Units Holding, LLC, the other Loan Parties (as defined therein),
the Lenders (as defined therein) and The Bank of New York Mellon, as
administrative agent and collateral agent (Incorporated by reference to
Exhibit 10.4 to the Company’s Quarterly Report on Form 10-Q (SEC File No.
001-16383), filed on May 8, 2009)
|
|
10.33*
|
Amendment
No. Four-C to Credit Agreement, dated June 23, 2009, among Cheniere Common
Units Holding, LLC, the other Loan Parties (as defined therein), the
Lenders (as defined therein) and The Bank of New York Mellon, as
administrative agent and collateral agent (Incorporated by reference to
Exhibit 10.3 to the Company’s Quarterly Report on Form 10-Q (SEC File No.
001-16383), filed on August 7, 2009)
|
|
10.34*
|
Amendment
No. Four-D to Credit Agreement, dated June 29, 2009, among Cheniere Common
Units Holding, LLC, the other Loan Parties (as defined therein), the
Lenders (as defined therein) and The Bank of New York Mellon, as
administrative agent and collateral agent (Incorporated by reference to
Exhibit 10.4 to the Company’s Quarterly Report on Form 10-Q (SEC File No.
001-16383), filed on August 7, 2009)
|
|
10.35*
|
Fifth
Amendment to Credit Agreement, dated September 17, 2009, by Cheniere
Common Units Holding, LLC, the Loan Parties (as defined therein), the
Lenders (as defined therein) and The Bank of New York Mellon, as
administrative agent and collateral agent (Incorporated by reference to
Exhibit 10.5 to the Company’s Quarterly Report on Form 10-Q (SEC File No.
001-16383), filed on November 6, 2009)
|
|
10.36*
|
Guarantee
and Collateral Agreement (Crest Entities), dated August 15, 2008, made by
the entities party thereto in favor of The Bank of New York Mellon, as
collateral agent. (Incorporated by reference to Exhibit 10.2 to the
Company’s Current Report on Form 8-K (SEC File No. 001-16383), filed on
August 18, 2008)
|
|
10.37*
|
Guarantee
and Collateral Agreement (Non-Crest Entities), dated August 15, 2008, by
Cheniere Common Units Holding, LLC and the other entities party thereto in
favor of The Bank of New York Mellon, as collateral agent. (Incorporated
by reference to Exhibit 10.3 to the Company’s Current Report on Form 8-K
(SEC File No. 001-16383), filed on August 18,
2008)
|
|
10.38*
|
Waiver
to Credit Agreement and Guarantee and Collateral Agreement (Non-Crest
Entities), dated December 13, 2008, among Cheniere Common Units Holding,
LLC, Cheniere Midstream Holdings, Inc., Cheniere LNG Services, Inc., GSO
Special Situations Fund LP, GSO Credit Opportunities Fund (Helios), L.P.,
GSO Special Situations Overseas Master Fund Ltd., Blackstone Distressed
Securities Fund L.P., Scorpion Capital Partners LP and The Bank of New
York Mellon, as collateral agent and administrative agent (Incorporated by
reference to Exhibit 10.67 to the Company’s Annual Report on Form 10-K
(SEC File No. 001-16383), filed on February 27, 2009)
|
|
10.39*
|
Second
Amendment to Guarantee and Collateral Agreements, dated December 31, 2008,
by Cheniere Midstream Holdings, Inc., Sabine Pass Tug Services, LLC,
Cheniere LNG, Inc., Cheniere LNG Terminals, Inc., Cheniere Marketing, LLC,
the Lenders signatory thereto and The Bank of New York Mellon, as
collateral agent (Incorporated by reference to Exhibit 10.68 to the
Company’s Annual Report on Form 10-K
|
|
|
|
|
|
|
89
|
Exhibit
No.
|
Description
|
| (SEC File No. 001-16383), filed on February 27, 2009) | |
|
10.40*
|
Third
Amendment to Guarantee and Collateral Agreement (Crest Entities) and
Fourth Amendment to Guarantee and Collateral Agreement (Non-Crest
Entities), dated September 17, 2009, by Cheniere Common Units Holding,
LLC, the guarantors and the grantors signatory thereto and The Bank of New
York Mellon, as collateral agent (Incorporated by reference to Exhibit
10.4 to the Company’s Quarterly Report on Form 10-Q (SEC File No.
001-16383), filed on November 6, 2009)
|
|
10.41*
|
Assumption
Agreement, dated September 17, 2009, by Cheniere Marketing, LLC (formerly
Cheniere Marketing, Inc.) in favor of The Bank of New York Mellon, as
collateral agent (Incorporated by reference to Exhibit 10.6 to the
Company’s Quarterly Report on Form 10-Q (SEC File No.
001-16383), filed on November 6, 2009)
|
|
10.42*
|
Security
Deposit Agreement, dated August 15, 2008, by and among Cheniere LNG
Holdings, LLC and The Bank of New York Mellon, as collateral agent and
depositary agent. (Incorporated by reference to Exhibit 10.4 to the
Company’s Current Report on Form 8-K (SEC File No. 001-16383), filed on
August 18, 2008)
|
|
10.43*
|
First
Amendment to Security Deposit Agreement, dated June 19, 2009, by and
between Cheniere LNG Holdings, LLC and The Bank of New York Mellon as
collateral agent and depositary agent (Incorporated by reference to
Exhibit 10.5 to the Company’s Quarterly Report on Form 10-Q (SEC File No.
001-16383), filed on May 7, 2009)
|
|
10.44*
|
Investors’
Agreement, dated August 15, 2008, by and between Cheniere Energy, Inc.,
Cheniere Common Units Holding, LLC and the investors named therein.
(Incorporated by reference to Exhibit 10.5 to the Company’s Current Report
on Form 8-K (SEC File No. 001-16383), filed on August 18,
2008)
|
|
10.45*
|
First
Amendment to Investors’ Agreement, dated November 11, 2008, among Cheniere
Energy, Inc., Cheniere Common Units Holding, LLC, GSO Special Situations
Fund LP, GSO Origination Funding Partners LP, Blackstone Distressed
Securities Fund L.P., GSO COF Facility LLC, and Scorpion Capital Partners
LP (Incorporated by reference to Exhibit 10.71 to the Company’s Annual
Report on Form 10-K (SEC File No. 001-16383), filed on February 27,
2009)
|
|
10.46*
|
Gas
Purchase and Sale Agreement, dated April 4, 2006, between Cheniere LNG
Marketing, Inc. and PPM Energy, Inc. (Incorporated by reference to Exhibit
10.2 to the Company’s Quarterly Report on Form 10-Q (SEC File No.
001-16383), filed on May 5, 2006)
|
|
10.47*
|
Master
Ex-Ship LNG Sales Agreement, dated April 26, 2007, between Cheniere
Marketing, Inc. and Gaz de France International Trading S.A.S., including
Letter Agreement, dated April 26, 2007, and Specific Order No. 1, dated
April 26, 2007. (Incorporated by reference to Exhibit 10.2 to the
Company’s Quarterly Report on Form 10-Q (SEC File No. 001-16383), filed on
May 8, 2007)
|
|
10.48*
|
GDF
Transatlantic Option Agreement, dated April 26, 2007, between Cheniere
Marketing, Inc. and Gaz de France International Trading S.A.S.
(Incorporated by reference to Exhibit 10.3 to the Company’s Quarterly
Report on Form 10-Q (SEC File No. 001-16383), filed on May 8,
2007)
|
|
10.49*†
|
Cheniere
Energy, Inc. Amended and Restated 1997 Stock Option Plan. (Incorporated by
reference to Exhibit 10.14 to the Company’s Quarterly on Form 10-Q (SEC
File No. 000-16383), filed on November 4, 2005)
|
|
10.50*†
|
Form
of Amendment to Nonqualified Stock Option Agreement under the Cheniere
Energy, Inc. Amended and Restated 1997 Stock Option Plan pursuant to the
Nonqualified Stock Option Agreement. (Incorporated by reference to Exhibit
10.6 to the Company’s Quarterly Report on Form 10-Q (SEC File No.
001-16383), filed on November 7, 2008)
|
|
10.51*†
|
Cheniere
Energy, Inc. Amended and Restated 2003 Stock Incentive Plan. (Incorporated
by reference to Exhibit 10.14 to the Company’s Quarterly Report on Form
10-Q (SEC File No. 001-16383), filed on November 4,
2005)
|
|
10.52*†
|
Addendum
to Cheniere Energy, Inc. Amended and Restated 2003 Stock Incentive Plan
(Incorporated by reference to Exhibit 10.3 to the Company’s Annual Report
on Form 10-K for the year ended December 31, 2005 (SEC File No.
001-16383), filed on March 13, 2006)
|
|
10.53*†
|
Amendment
No. 1 to Cheniere Energy, Inc. Amended and Restated 2003 Stock Incentive
Plan. (Incorporated by reference to Exhibit 4.10 to the Company’s
Registration Statement on Form S-8 (SEC File No.
333-
|
90
|
Exhibit
No.
|
Description
|
| 134886), filed on June 9, 2006) | |
|
10.54*†
|
Amendment
No. 2 to Cheniere Energy, Inc. Amended and Restated 2003 Stock Incentive
Plan (Incorporated by reference to Exhibit 10.84 to the Company’s Annual
Report on Form 10-K (SEC File No. 001-16383), filed on February 27,
2007)
|
|
10.55*†
|
Amendment
No. 3 to Cheniere Energy, Inc. Amended and Restated 2003 Stock Incentive
Plan (Incorporated by reference to Exhibit A to the Company’s Proxy
Statement (SEC File No. 001-16383), filed on April 23,
2008)
|
|
10.56*
|
Amendment
No. 4 to the Cheniere Energy, Inc. Amended and Restated 2003 Stock
Incentive plan (Incorporated by reference to Exhibit 10.2 to the Company’
Current Report on Form 8-K (SEC File No. 001-16383), filed on June 15,
2009)
|
|
10.57*†
|
Form
of Non-Qualified Stock Option Grant for Employees and Consultants
(three-year vesting) under the Cheniere Energy, Inc. Amended and Restated
2003 Stock Incentive Plan. (Incorporated by reference to Exhibit 10.2 to
the Company’ Current Report on Form 8-K (SEC File No. 001-16383), filed on
January 11, 2007)
|
|
10.58*†
|
Form
of Non-Qualified Stock Option Grant for Employees and Consultants
(four-year vesting) under the Cheniere Energy, Inc. Amended and Restated
2003 Stock Incentive Plan. (Incorporated by reference to Exhibit 10.3 to
the Company’ Current Report on Form 8-K (SEC File No. 001-16383), filed on
January 11, 2007)
|
|
10.59*†
|
Form
of Non-Qualified Stock Option Grant for Non-Employee Directors under the
Cheniere Energy, Inc. Amended and Restated 2003 Stock Incentive Plan.
(Incorporated by reference to Exhibit 10.4 to the Company’ Current Report
on Form 8-K (SEC File No. 001-16383), filed on January 11,
2007)
|
|
10.60*†
|
Form
of Amendment to Non-Qualified Stock Option Grant under the Cheniere
Energy, Inc. Amended and Restated 2003 Stock Incentive Plan. (Incorporated
by reference to Exhibit 10.7 to the Company’ Quarterly Report on Form 10-Q
(SEC File No. 001-16383), filed on November 7, 2008)
|
|
10.61*†
|
Form
of Restricted Stock Grant (three-year vesting) under the Cheniere Energy,
Inc. Amended and Restated 2003 Stock Incentive Plan. (Incorporated by
reference to Exhibit 10.5 to the Company’ Current Report on Form 8-K (SEC
File No. 001-16383), filed on January 11, 2007)
|
|
10.62*†
|
Form
of Restricted Stock Grant (four-year vesting) under the Cheniere Energy,
Inc. Amended and Restated 2003 Stock Incentive Plan. (Incorporated by
reference to Exhibit 10.6 to the Company’ Current Report on Form 8-K (SEC
File No. 001-16383), filed on January 11, 2007)
|
|
10.63*†
|
Form
of Restricted Stock Agreement for Non-Employee Directors. (Incorporated by
reference to Exhibit 10.2 to the Company’s Current Report on Form 8-K (SEC
File No. 001-16383), filed on June 1, 2007)
|
|
10.64*†
|
Form
of Cancellation and Grant of Non-Qualified Stock Options (three-year
vesting) under the Cheniere Energy, Inc. 2003 Stock Incentive Plan.
(Incorporated by reference to Exhibit 10.1 to the Company’s Current Report
on Form 8-K (SEC File No. 001-16383), filed on August 2,
2005)
|
|
10.65*†
|
Form
of Amendment to Non-Qualified Stock Option Agreement. (Incorporated by
reference to Exhibit 10.1 to the Company’s Current Report on Form 8-K (SEC
File No. 001-16383), filed on April 3, 2007)
|
|
10.66*†
|
Form
of French Stock Option Grant for Employees and Consultants (four-year
vesting) under the Cheniere Energy, Inc. Amended and Restated 2003 Stock
Incentive Plan (Incorporated by reference to Exhibit 10.91 to the
Company’s Annual Report on Form 10-K (SEC File No. 001-16383), filed on
February 27, 2007)
|
|
10.67*†
|
Form
of French Restricted Shares Grant for Employees, Consultants and
Non-Employee Directors (three-year vesting) under the Cheniere Energy,
Inc. Amended and Restated 2003 Stock Incentive Plan (Incorporated by
reference to Exhibit 10.92 to the Company’s Annual Report on Form 10-K
(SEC File No. 001-16383), filed on February 27,
2007)
|
|
10.68*†
|
Form
of French Restricted Shares Grant for Employees, Consultants and
Non-Employee Directors (four-year vesting) under the Cheniere Energy, Inc.
Amended and Restated 2003 Stock Incentive Plan (Incorporated by reference
to Exhibit 10.93 to the Company’s Annual Report on Form 10-K (SEC File No.
001-16383), filed on February 27, 2007)
|
|
10.69*†
|
Indefinite
Term Employment Agreement, dated February 20, 2006, between Cheniere
International, Inc. and Jean Abiteboul; Letter Agreement, dated February
23, 2006, between Cheniere Energy, Inc. and Jean
|
91
|
Exhibit
No.
|
Description
|
|
|
Abiteboul;
Amendment to a Contract of Employment, dated March 20, 2007, between
Cheniere LNG Services SARL and Jean Abiteboul; and Amendment to Indefinite
Term Contract of Employment, dated January 18, 2008, between Cheniere LNG
Services and Jean Abiteboul (Incorporated by reference to Exhibit 10.94 to
the Company’s Annual Report on Form 10-K (SEC File No. 001-16383), filed
on February 27, 2009)
|
|
10.70†
|
Summary
of Compensation for Executive Officers.
|
|
10.71*†
|
Summary
of Compensation to Non-Employee Directors. (Incorporated by reference to
Exhibit 10.1 to the Company’s Current Report on Form 8-K (SEC File
No. 001-16383), filed on June 15, 2009)
|
|
10.72*†
|
Summary
of 2007 Performance Bonus Plan. (Incorporated by reference to Exhibit 10.1
to the Company’s Current Report on Form 8-K (SEC File No. 001-16383),
filed on April 5, 2007)
|
|
10.73*†
|
Summary
of Terms for Cheniere Energy, Inc. Incentive Compensation Plan for
Executive Committee Members and Other Key Employees. (Incorporated by
reference to Exhibit 10.3 to the Company’s Current Report on Form 8-K (SEC
File No. 001-16383), filed on June 1, 2007)
|
|
10.74*†
|
Cheniere
Energy, Inc. 2008 Short-Term Retention Plan. (Incorporated by reference to
Exhibit 10.1 to the Company’s Current Report on Form 8-K (SEC File No.
001-16383), filed on May 14, 2008)
|
|
10.75*†
|
Form
of Cheniere Energy, Inc. 2008 Short-Term Retention Plan Restricted Stock
Grant. (Incorporated by reference to Exhibit 10.2 to the Company’s Current
Report on Form 8-K (SEC File No. 001-16383), filed on May 14,
2008)
|
|
10.76*†
|
Cheniere
Energy, Inc. 2008 Long-Term Retention Plan. (Incorporated by reference to
Exhibit 10.3 to the Company’s Current Report on Form 8-K (SEC File No.
001-16383), filed on May 14, 2008)
|
|
10.77*†
|
Form
of Cheniere Energy, Inc. 2008 Long-Term Retention Plan Restricted Stock
Grant. (Incorporated by reference to Exhibit 10.4 to the Company’s Current
Report on Form 8-K (SEC File No. 001-16383), filed on May 14,
2008)
|
|
10.78*†
|
Cheniere
Energy, Inc. 2008 Change of Control Cash Payment Plan. (Incorporated by
reference to Exhibit 10.5 to the Company’s Current Report on Form 8-K (SEC
File No. 001-16383), filed on May 14, 2008)
|
|
10.79*†
|
Form
of Change of Control Agreement. (Incorporated by reference to Exhibit 10.6
to the Company’s Current Report on Form 8-K (SEC File No. 001-16383),
filed on May 14, 2008)
|
|
10.80*†
|
Form
of Release and Separation Agreement. (Incorporated by reference to Exhibit
10.7 to the Company’s Current Report on Form 8-K (SEC File No. 001-16383),
filed on May 14, 2008)
|
|
10.81*†
|
Form
of Restricted Stock Grant for Senior Vice President and General Counsel.
(Incorporated by reference to Exhibit 10.8 to the Company’s Current Report
on Form 8-K (SEC File No. 001-16383), filed on May 14,
2008)
|
|
10.82*†
|
Form
of 2009 Phantom Stock Grant (Incorporated by reference to Exhibit 10.1 to
the Company’s Current Report on Form 8-K (SEC File No. 001-16383), filed
on February 27, 2009)
|
|
10.83*†
|
Form
of Indemnification Agreement for directors of Cheniere Energy, Inc.
(Incorporated by reference to Exhibit 10.1 to the Company’s Current Report
on Form 8-K (SEC File No. 001-16383), filed on December 19,
2008)
|
|
10.84*†
|
Form
of Indemnification Agreement for officers of Cheniere Energy, Inc.
(Incorporated by reference to Exhibit 10.1 to the Company’s Current Report
on Form 8-K (SEC File No. 001-16383), filed on April 6,
2009)
|
|
10.85*†
|
Charif
Souki’s U.K. Assignment Letter effective July 1, 2009 (Incorporated by
reference to Exhibit 10.1 to the Company’s Current Report on Form 8-K (SEC
File No. 001-16383), filed on July 2, 2009)
|
|
21.1
|
Subsidiaries
of Cheniere Energy, Inc.
|
|
23.1
|
Consent
of Ernst & Young LLP
|
|
31.1
|
Certification
by Chief Executive Officer required by Rule 13a-14(a) and 15d-14(a) under
the Exchange Act
|
|
31.2
|
Certification
by Chief Financial Officer required by Rule 13a-14(a) and 15d-14(a) under
the Exchange Act
|
92
|
Exhibit
No.
|
Description
|
|
32.1
|
Certification
by Chief Executive Officer pursuant to 18 U.S.C. Section 1350, as adopted
pursuant to Section 906 of the Sarbanes-Oxley Act of
2002
|
|
32.2
|
Certification
of Chief Financial Officer pursuant to 18 U.S.C. Section 1350, as adopted
pursuant to Section 906 of the Sarbanes-Oxley Act of
2002
|
|
*
|
Incorporated
by reference
|
|
†
|
Management
contract or compensatory plan or
arrangement
|
93
CHENIERE
ENERGY, INC.
CONDENSED
BALANCE SHEET
(in
thousands)
|
December
31,
|
|||||||
|
2009
|
2008
|
||||||
|
ASSETS
|
(As
adjusted)
|
||||||
|
CURRENT
ASSETS
|
|||||||
|
Cash
and cash equivalents
|
$
|
—
|
$
|
9,152
|
|||
|
Prepaid
expenses and other
|
—
|
20
|
|||||
|
Total
current assets
|
—
|
9,172
|
|||||
|
DEBT
RECEIVABLE—AFFILIATES
|
649,785
|
615,571
|
|||||
|
OTHER
|
1,298
|
2,833
|
|||||
|
Total
assets
|
$
|
651,083
|
$
|
627,576
|
|||
|
LIABILITIES
AND STOCKHOLDERS’ (DEFICIT) EQUITY
|
|||||||
|
CURRENT
LIABILITIES
|
$
|
1,953
|
$
|
3,080
|
|||
|
LONG-TERM
DEBT
|
165,132
|
242,635
|
|||||
|
LONG-TERM
DEBT—AFFILIATE
|
439,500
|
401,308
|
|||||
|
INVESTMENT
IN AND EQUITY IN LOSSES OF AFFILIATES
|
476,625
|
254,607
|
|||||
|
COMMITMENTS
AND CONTINGENCIES
|
—
|
—
|
|||||
|
STOCKHOLDERS’
(DEFICIT) EQUITY
|
(432,127
|
)
|
(274,054
|
)
|
|||
|
Total
liabilities and stockholders’ equity
|
$
|
651,083
|
$
|
627,576
|
|||
See accompanying notes to condensed
financial statements.
94
SCHEDULE
I—CONDENSED FINANCIAL INFORMATION OF REGISTRANT—
CHENIERE
ENERGY, INC.
CONDENSED
STATEMENT OF OPERATIONS
(in
thousands)
|
Year
Ended December 31,
|
||||||||||||
|
2009
|
2008
|
2007
|
||||||||||
|
(As
adjusted)
|
(As
adjusted)
|
|||||||||||
|
Revenues
|
$ | — | $ | — | $ | — | ||||||
|
Operating
costs and expenses
|
422 | 170 | 60 | |||||||||
|
Loss
from operations
|
(422 | ) | (170 | ) | (60 | ) | ||||||
|
Gain
on early extinguishment of debt
|
45,362 | — | — | |||||||||
|
Interest
expense, net
|
(21,312 | ) | (25,186 | ) | (23,501 | ) | ||||||
|
Interest
income
|
12 | 988 | 3,336 | |||||||||
|
Interest
income—affiliates
|
34,213 | 40,363 | 34,213 | |||||||||
|
Interest
expense—affiliates
|
(38,192 | ) | (44,341 | ) | (22,496 | ) | ||||||
|
Equity
losses of affiliates
|
(181,151 | ) | (344,613 | ) | (188,082 | ) | ||||||
|
Other
income
|
— | — | 10 | |||||||||
|
Income
tax (provision) benefit
|
— | — | — | |||||||||
|
Net
loss
|
$ | (161,490 | ) | $ | (372,959 | ) | $ | (196,580 | ) | |||
See
accompanying notes to condensed financial statements.
95
SCHEDULE
I—CONDENSED FINANCIAL INFORMATION OF REGISTRANT—
CHENIERE
ENERGY, INC.
CONDENSED
STATEMENT OF CASH FLOWS
(in
thousands)
|
Year
Ended December 31,
|
||||||||||||
|
2009
|
2008
|
2007
|
||||||||||
|
(As
Adjusted)
|
(As
Adjusted)
|
|||||||||||
|
NET
CASH USED IN OPERATING ACTIVITIES
|
$ | (6,773 | ) | $ | (23,127 | ) | $ | (33,348 | ) | |||
|
CASH
FLOWS FROM INVESTING ACTIVITIES:
|
||||||||||||
|
Return
of capital from (investments in) affiliates
|
28,635 | (10,236 | ) | 10,488 | ||||||||
|
NET
CASH PROVIDED BY (USED IN) INVESTING ACTIVITIES
|
$ | 28,635 | $ | (10,236 | ) | $ | 10,488 | |||||
|
CASH
FLOWS FROM FINANCING ACTIVITIES:
|
||||||||||||
|
Borrowings
from long-term debt
|
— | — | 391,708 | |||||||||
|
Purchase
of treasury shares
|
(985 | ) | (4,887 | ) | (325,062 | ) | ||||||
|
Repurchase
of long-term debt
|
(30,029 | ) | — | — | ||||||||
|
Sale
of common stock
|
— | 472 | 3,158 | |||||||||
|
Issuance
of restricted stock
|
— | (15 | ) | — | ||||||||
|
NET
CASH PROVIDED BY (USED IN) FINANCING ACTIVITIES
|
$ | (31,014 | ) | $ | (4,430 | ) | $ | 69,804 | ||||
|
NET
INCREASE (DECREASE) IN CASH AND CASH EQUIVALENTS
|
(9,152 | ) | (37,793 | ) | 46,944 | |||||||
|
CASH
AND CASH EQUIVALENTS—BEGINNING OF YEAR
|
9,152 | 46,945 | 1 | |||||||||
|
CASH
AND CASH EQUIVALENTS—END OF YEAR
|
$ | — | $ | 9,152 | $ | 46,945 | ||||||
See
accompanying notes to condensed financial statements
96
CHENIERE
ENERGY, INC.
NOTES
TO CONDENSED FINANCIAL STATEMENTS
NOTE
1—Summary of Significant Accounting Policies
The
condensed financial statements represent the financial information required by
Securities and Exchange Commission Regulation S-X 5-04 for Cheniere Energy, Inc
(“Cheniere”).
In the
condensed financial statements, Cheniere’s investments in affiliates are
presented under the equity method of accounting. Under this method, the assets
and liabilities of affiliates are not consolidated. The investments in net
assets of the affiliates are recorded in the balance sheets. The loss from
operations of the affiliates is reported on a net basis as equity in net losses
of affiliates.
A
substantial amount of Cheniere’s operating, investing, and financing activities
are conducted by its affiliates. The condensed financial statements should be
read in conjunction with Cheniere’s consolidated financial
statements.
Certain
reclassifications have been made to conform prior period information to the
current presentation on our December 31, 2009 Condensed Statement of Cash Flows.
The reclassifications had no effect on our overall financial position, condensed
balance sheets or condensed statement of operations.
NOTE
2—Debt
As of
December 31, 2009 and 2008, our long-term debt consisted of the following
(in thousands):
|
December
31,
|
||||||||
|
2009
|
2008
|
|||||||
|
(As
Adjusted)
|
||||||||
|
Convertible
Senior Unsecured Notes
|
$ | 165,132 | $ | 242,635 | ||||
|
Long-Term
Note—Affiliate
|
439,500 | 401,308 | ||||||
|
Total
Long-Term Debt
|
$ | 604,632 | $ | 643,943 | ||||
Below is
a schedule of future principal payments that we are obligated to make on our
outstanding long-term debt at December 31, 2009 (in
thousands):
|
Payments Due for Years Ended
December 31, (1)
|
||||||||||||||||||||
|
Total
|
2010
|
2011
to 2012
|
2013
to 2014
|
Thereafter
|
||||||||||||||||
|
Convertible
Senior Unsecured Notes
|
$ | 204,630 | $ | — | $ | 204,630 | $ | — | $ | — | ||||||||||
|
Long-Term
Note-Affiliate
|
439,500 | — | 439,500 | — | — | |||||||||||||||
|
Total
|
$ | 644,130 | $ | — | $ | 644,130 | $ | — | $ | — | ||||||||||
|
(1)
|
Based on the total debt balance,
scheduled maturities and interest rates in effect at December 31, 2009,
our cash payments for interest would be $47.5 million in 2010, $47.5
million in 2011 and $20.5 million in 2012 for a total of $115.5
million.
|
Long-Term
Note-Affiliate
In May
2007, we entered into a $391.7 million long-term note (“Long-Term
Note-Affiliate”) with Cheniere Subsidiary Holdings, LLC (“Cheniere Subsidiary”),
a wholly-owned subsidiary of Cheniere. Cheniere Subsidiary received the $391.7
million net proceeds from a $400 million credit agreement entered into in May
2007. Borrowings under the Long-Term Note-Affiliate bear interest equal to the
terms of Cheniere Subsidiary’s credit agreement at a fixed rate of 9¾% per
annum. Interest is calculated on the unpaid principal amount of the Long-Term
Note-Affiliate outstanding and is payable quarterly in arrears on March 31,
June 30, September 30 and December 31 of each year. The Long-Term
Note-Affiliate will mature on May 31, 2012. The $391.7 million of proceeds
from the Long-Term Note-Affiliate were used for general corporate purposes,
including our repurchase, completed during 2007, of approximately
9.2 million shares of our outstanding common stock pursuant to the exercise
of the call options acquired in the issuer call spread purchased by us in
connection with the issuance of the Convertible Senior Unsecured
Notes.
97
NOTE
3—GUARANTEES
Guarantees
on Behalf of Cheniere Marketing, LLC
TUA
Agreement
Cheniere
Marketing, LLC (“Cheniere Marketing”), a wholly owned subsidiary of Cheniere,
has a 20-year, firm commitment Terminal Use Agreement (“TUA”) with Sabine Pass
LNG, L.P. for regasification capacity at the Sabine Pass LNG receiving terminal.
Cheniere Marketing must make the full contracted amount of capacity reservation
fee payments under its TUA whether or not it uses any of its reserved
capacity. Cheniere Marketing is required to make monthly capacity
reservation fee payments aggregating approximately $250 million per year for the
period from January 1, 2009, through at least September 30, 2028. Cheniere
has guaranteed Cheniere Marketing’s obligations under its TUA.
Marketing
and Trading Guarantees
Our LNG
and natural gas marketing business segment is pursuing a two-front commercial
strategy focused on producing long-term recurring cash flow by capitalizing on
Cheniere Marketing’s reserved 2.0 Bcf/d of regasification capacity at the Sabine
Pass LNG receiving terminal. Our strategy is to remain engaged in the LNG
spot market as opportunities arise, and to maintain relationships with key
suppliers and market participants that we believe are candidates for entering
into long-term LNG cargo sales and/or the purchase of TUA capacity currently
reserved by Cheniere Marketing. Many of Cheniere Marketing’s natural gas
purchase, sale, transportation and shipping agreements have been guaranteed by
Cheniere. These contracts that have been guaranteed by Cheniere have a
$5.1 million maximum potential of future payments and various expiration
dates. The carrying amount of the liability related to these guaranteed
contracts was zero as of December 31, 2009.
Guarantee
on behalf of Sabine Pass Tug Services, LLC
In
November 2006, Sabine Pass Tug Services, LLC (“Sabine Pass Tug Services”), a
wholly-owned subsidiary of Cheniere, entered into a marine services agreement
for three tugs with Alpha Marine Services, LLC (“Alpha Marine Services”). The
initial term of the marine services agreement ends on the tenth anniversary of
the service date, with Sabine Pass Tug Services having the option for two
additional extension terms of five years each. This contract has been guaranteed
by Cheniere for up to $5.0 million.
NOTE
4 —SUPPLEMENTAL CASH FLOW INFORMATION AND DISCLOSURES OF NON-CASH
TRANSACTIONS
|
Year
Ended December 31,
|
|||||||||
|
2009
|
2008
|
2007
|
|||||||
|
(in
thousands)
|
|||||||||
|
Non-cash
capital contributions (1)
|
$
|
181,151
|
$
|
344,613
|
$
|
188,082
|
|||
|
(1)
|
Amounts
represent equity losses of affiliates not funded by
Cheniere.
|
98
SIGNATURES
Pursuant
to the requirements of Section 13 or 15(d) of the Securities Exchange Act
of 1934, the registrant has duly caused this report to be signed on its behalf
by the undersigned, thereunto duly authorized.
|
CHENIERE ENERGY, INC.
|
||
|
(Registrant)
|
||
|
By:
|
/s/ CHARIF SOUKI
|
|
|
Charif
Souki
Chief
Executive Officer, President and
Chairman
of the Board
|
||
|
|
Date:
February 25, 2010
|
Pursuant
to the requirements of the Securities Exchange Act of 1934, this report has been
signed below by the following persons on behalf of the registrant and in the
capacities and on the dates indicated.
|
Signature
|
Title
|
Date
|
|
/s/ CHARIF SOUKI
|
Chief
Executive Officer, President &
Chairman
of the Board (Principal Executive Officer)
|
February 25,
2009
|
|
Charif
Souki
|
||
|
/s/ MEG A. GENTLE
|
Senior
Vice President & Chief
Financial
Officer (Principal Financial Officer)
|
February 25,
2009
|
|
Meg
A. Gentle
|
||
|
/s/ JERRY D. SMITH
|
Vice
President and Chief Accounting Officer
(Principal
Accounting Officer)
|
February 25,
2009
|
|
Jerry
D. Smith
|
||
|
/s/ VICKY A. BAILEY
|
Director
|
February 25,
2009
|
|
Vicky
A. Bailey
|
||
|
/s/ NUNO BRANDOLINI
|
Director
|
February 25,
2009
|
|
Nuno
Brandolini
|
||
|
/s/ KEITH F. CARNEY
|
Director
|
February 25,
2009
|
|
Keith
F. Carney
|
||
|
/s/ JOHN DEUTCH
|
Director
|
February 25,
2009
|
|
John
Deutch
|
||
|
/s/ PAUL J. HOENMANS
|
Director
|
February 25,
2009
|
|
Paul
J. Hoenmans
|
||
|
/s/ DAVID B. KILPATRICK
|
Director
|
February 25,
2009
|
|
David
B. Kilpatrick
|
||
|
/s/ JASON NEW
|
Director
|
February 25,
2009
|
|
Jason
New
|
||
|
/s/ D. DWIGHT SCOTT
|
Director
|
February 25,
2009
|
|
D.
Dwight Scott
|
||
|
/s/ J.
ROBINSON WEST
|
Director
|
February 25,
2009
|
|
J.
Robinson West
|
||
|
/s/ WALTER L. WILLIAMS
|
Director
|
February 25,
2009
|
|
Walter
L. Williams
|
99