Attached files
| file | filename |
|---|---|
| 8-K - INTERFACE, INC. FORM 8-K INVESTOR PRESENTATION FEBRUARY 2010 - INTERFACE INC | form8-k.htm |
2
This
presentation contains forward-looking statements, including, in particular,
statements about Interface’s
plans, strategies and prospects. These are based on the Company’s current assumptions, expectations and
projections about future events.
plans, strategies and prospects. These are based on the Company’s current assumptions, expectations and
projections about future events.
Although
Interface believes that the expectations reflected in these forward-looking
statements are
reasonable, the Company can give no assurance that these expectations will prove to be correct or that
savings or other benefits anticipated in the forward-looking statements will be achieved. Important factors,
some of which may be beyond the Company’s control, that could cause actual results to differ materially from
management’s expectations are discussed under the heading “Risk Factors” included in Item 1A of the
Company’s most recent Annual Report on Form 10-K, filed with the Securities and Exchange Commission,
which discussion is hereby incorporated by reference. Forward-looking statements speak only as of the date
made. The Company assumes no responsibility to update or revise forward-looking statements and cautions
listeners and conference attendees not to place undue reliance on any such statements.
Forward
Looking Statements

3
Daniel
Hendrix
§ President
and Chief Executive Officer
Patrick
Lynch
§ Senior
Vice President and Chief Financial Officer
Presenters

4
§ Interface
is leading
the secular shift to modular carpet as
it moves from a niche
to a
category with the leading global market share.
category with the leading global market share.
§ Interface
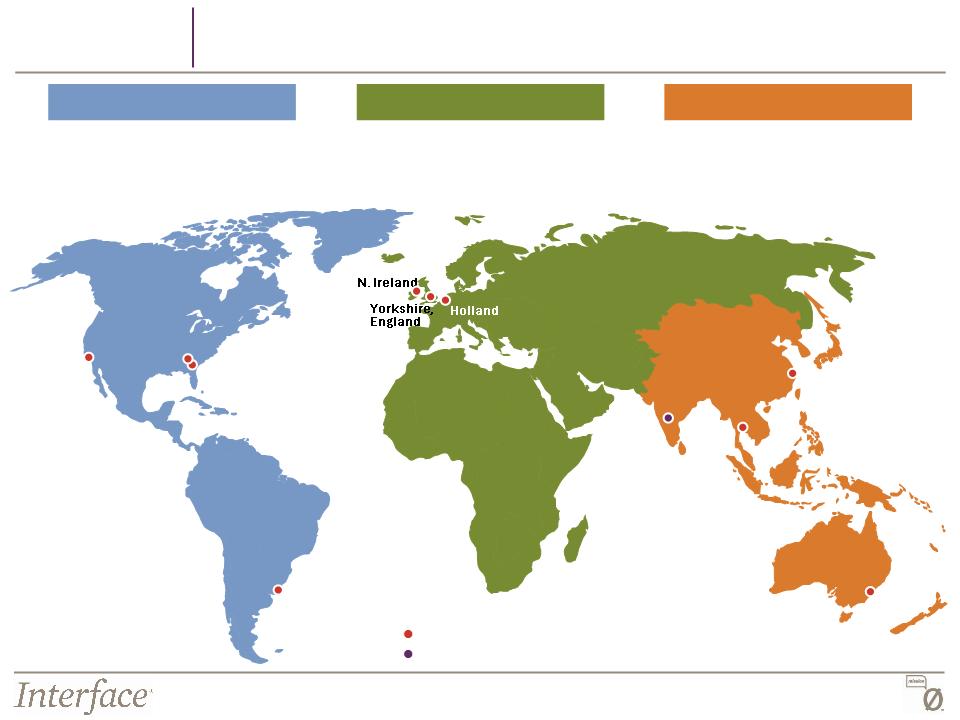
is the largest global
manufacturer
of
modular carpet with a presence on four
continents (United States, England, Holland, Ireland, Thailand, China, Australia).
continents (United States, England, Holland, Ireland, Thailand, China, Australia).
§ Interface
has established diversified
end markets
including emerging markets, non-
office commercial markets, and consumer representing nearly 55% of the overall
business.
office commercial markets, and consumer representing nearly 55% of the overall
business.
§ Interface
is creating a consumer
brand (FLOR)
as modular carpet is moving from a
concept to awareness for the home.
concept to awareness for the home.
§ Interface’s
global
sales and marketing capabilities have
created significant growth in
emerging markets which will experience growth faster than developed countries.
emerging markets which will experience growth faster than developed countries.
§ Interface
is the recognized thought leader in sustainability -
the marketplace is
rewarding our leading position.
rewarding our leading position.
Investment
Highlights

5
Interface
Brands - Most Recognized in the Industry
6
Leadership
Position in Sustainability
Global
Make-to-Order Manufacturing and Local Distribution
Rapid
Innovation and Designs
Invest
in the Growth
of Emerging Markets
of Emerging Markets
Grow a
Consumer
Brand
Diversify
End
Use
Markets
Maintain
Dominant
Share in the
Share in the
Office
Market
§ Establish
our position as
the leader in modular
carpet for the home
the leader in modular
carpet for the home
§ Drive
sales through direct
channels
channels
§ Potential
roll out of FLOR-
branded store network in
the U.S.
branded store network in
the U.S.
§ Drive
growth of carpet tile
market in China with local
manufacturing presence
market in China with local
manufacturing presence
§ Invest
in growth in Latin
America, Eastern Europe,
Middle East, Africa and
Indo-China
America, Eastern Europe,
Middle East, Africa and
Indo-China
§ Gain
share in commercial
non-office segments
non-office segments
§ Establish
“main street”
commercial presence in
the U.S. and Australia
commercial presence in
the U.S. and Australia
§ Pursue
the airline
transportation segment in
the U.S.
transportation segment in
the U.S.
§ Capture
opportunity as
the Office market
rebounds
the Office market
rebounds
§ Gain
share in European
carpet tile market
carpet tile market
Lead
the Secular Shift of Modular Carpet
Reduce
the Cyclical Nature of our Business
Customer
Intimacy
Interface
Strategy: Be the Global Category Leader for Modular
Carpet

7
Secular
Shift
1. Creative
DESIGN freedom
2. NO
glue, NO pad
3. LOWER
COST to change
4. Produces
LESS WASTE
5. FASTER
and more PROFITABLE
INSTALLATION for contractors
INSTALLATION for contractors
6. Easier
to RECONFIGURE and
MAINTAIN
MAINTAIN
7. Easily
RECYCLED and
REPURPOSED
REPURPOSED
2009
Floor Focus U.S. Top 250 Design Survey: Hot Products
Benefits
of Modular
Source: Floor
Focus
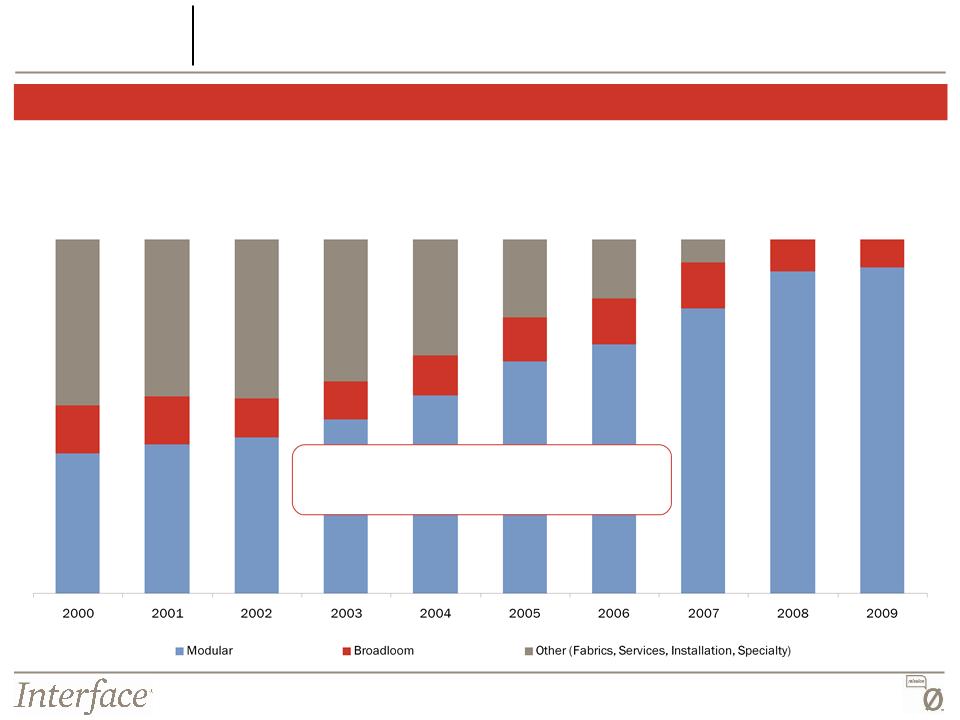
Modular
Carpet is Moving from a Niche to a Category for
Commercial Flooring
Commercial Flooring
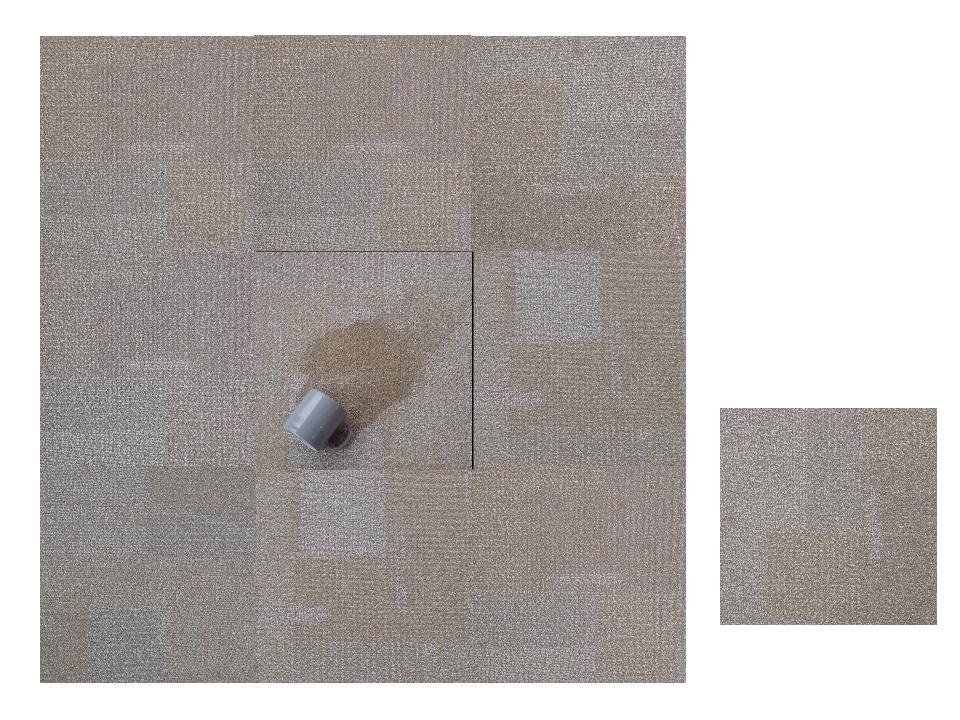
Easy
Repairs
9
Long-Term
Strategy Has Been to Focus on Organic Growth of
Modular Carpet
Modular Carpet
Sales
by Business Type
Divested
Raised Access
Flooring
Raised Access
Flooring
Divested
European
Fabrics
European
Fabrics
Divested
N.
American
Fabrics
Divested
European
Broadloom
Divested
Installation &
Maintenance
Installation &
Maintenance
Divested
Vinyl
Matting
Divested
$500M in Revenue Base and
Replaced
with Organic Modular Sales Growth
Secular
Shift
40%
92%

10
Functionality
and Design Create a Secular Shift in Modular
Carpet From a Niche to a Category
Carpet From a Niche to a Category
§ Preferred
interior design element
§ “Becoming
the Flooring of Choice”
§ Random
products merge design with function
§ Sustainability
drives recycled and repurposed
products
products
§ Stressed
the functionality of
modular carpet
modular carpet
§ Exploited
the benefits of
modular vs. broadloom
modular vs. broadloom
§ Limited
application and design
§ Open
office plans emerge
Pioneering
Stage
Functionality
Stage
Secular
Shift
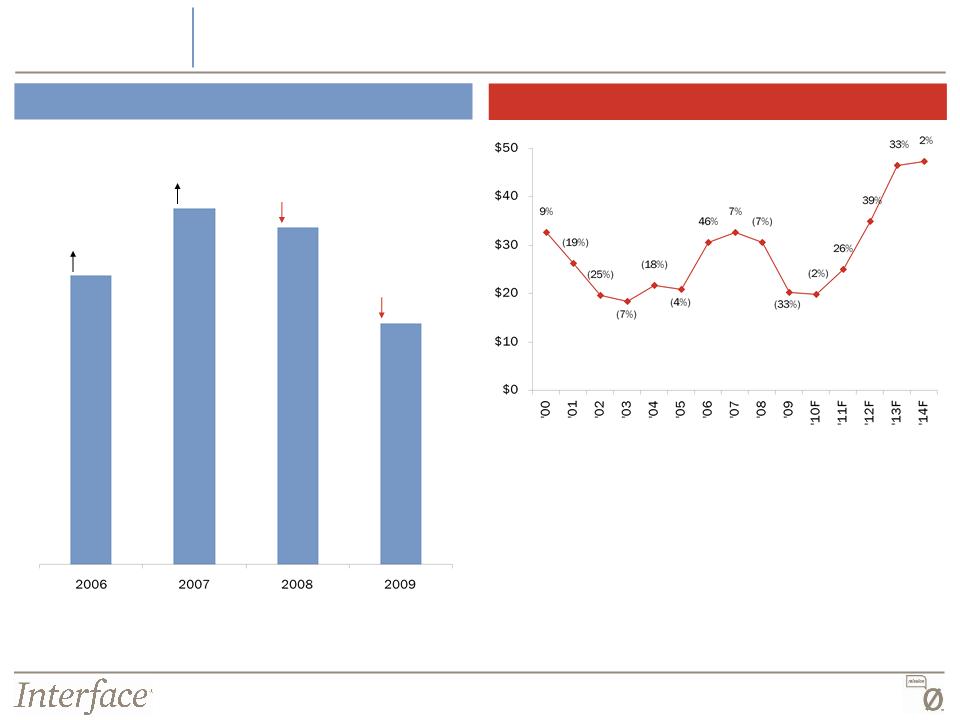
2009
Total U.S. Specified
Commercial
Carpet Market = $2.3B
§ Celebrating
the square
§ Sustainability
introduced
§ Pattern
by tile
Liberation
of Design
2020P
Total U.S. Specified
Commercial
Carpet Market = $3.3B
3%
CAGR
CAGR
2009
38%
Penetration
2020P
65%
Penetration
Carpet
Tile Share of U.S. Commercial Carpet Market
($
in millions)
What
if modular
carpet reached
65% market share
of the commercial
market by 2020?
carpet reached
65% market share
of the commercial
market by 2020?
2004
26%
Penetration
($
in millions)
Source: Invista,
Floor Focus, Carpet and Rug Institute, Catalina Research Inc., U.S. Flooring
Forecast and management estimates
Secular
Shift

11
Carpet
Tile Penetration of European Contract Soft Flooring Market
European
Market Opportunity
(millions
of square meters)
(Billions
of square meters)
Significant
Opportunity
65%
Penetration
8%
44%
24%
42%
24%
30%
23%
Carpet
Tile
Broadloom
and Other Soft Flooring
Source: BMW
Associates and management estimates
Secular
Shift
23%
Total
Europe

12
Carpet
Tile Penetration of the Asia-Pacific Contract Soft Flooring Market
Asia-Pacific
Market Opportunity
(millions
of square meters)
28%
($
in millions)
25%
Carpet
Tile
Broadloom
and Other Soft Flooring
Source: BMW
Associates and management estimates
Secular
Shift
65%
Penetration

13
Interface
has a Significant Share of the Global Carpet Tile Market
Secular
Shift
Americas
Europe
& MEAI
Australia/NZ
Source: BMW
Associates and management estimates
§ Interface
has significant market presence
in key major markets
in key major markets
§ Interface
has manufacturing, sales &
marketing support on four continents
marketing support on four continents

14
Segmented
Market Approach
Diversified
End Use Markets
Growth
Platforms

15
Diversify
End Use Markets
Current
Portfolio
Growth
Platforms
Target
Portfolio
Mature
Office Market
Non-Office
Commercial Segments
Emerging
Markets
Consumer
16
Capture
the Rebound in the Corporate Office Segment
Growth
Platforms
Modular
Mature Corporate Office Sales
Excludes
Latin America, Eastern Europe, Russia, Middle East, Africa, India and NE
Asia
23%
28%
18%
5%
U.S.
Office Construction Starts
§ U.S.
office construction is expected to
remain flat in 2010 and then rebound in
late 2011, returning to 2007 levels by the
end of 2012
remain flat in 2010 and then rebound in
late 2011, returning to 2007 levels by the
end of 2012
($
in Billions)
Source: McGraw-Hill
17
Strong
Growth from Non-Corporate Segments
Modular
Non-Office Commercial Sales
15%
14%
4%
10%
Non-Office
Commercial Sales by Segment
Growth
Platforms
18
New
Segment Opportunities - Main Street Commercial
§ Access
to secondary Contract and Main
Street commercial markets in smaller rural
and suburban areas
Street commercial markets in smaller rural
and suburban areas
§ Broadened
reach in primary markets
beyond specified market
beyond specified market
§ Exploring
several strategies to expand
reach and distribution
reach and distribution
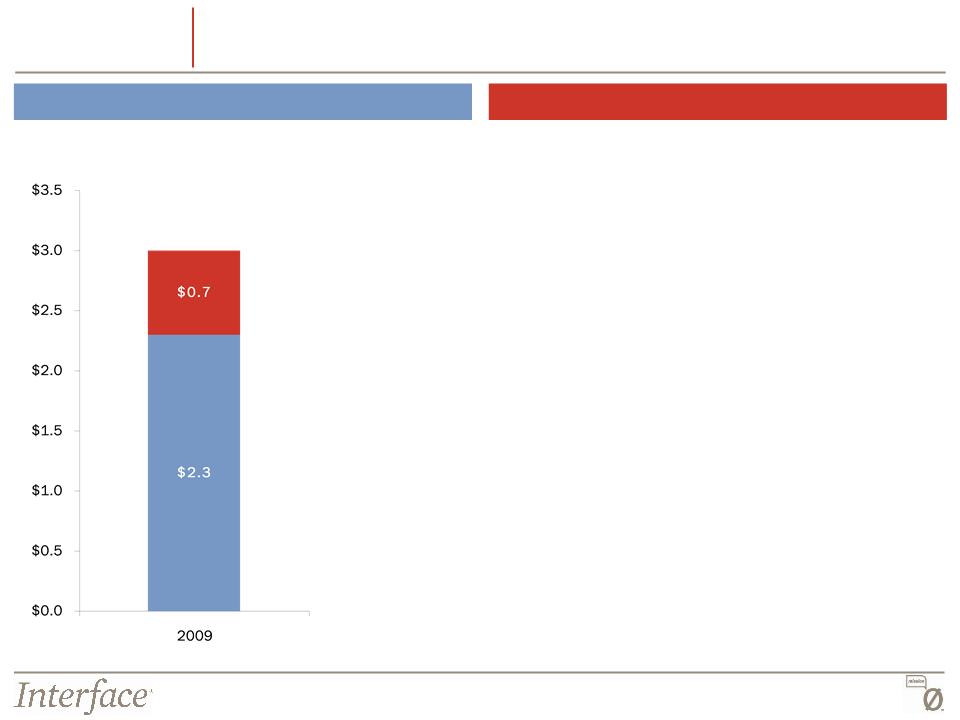
Opportunity
Main
Street Commercial Market
U.S.
Commercial Carpet Market
($
in billions)
Main
Street Commercial
Contract
Commercial
$3.0B
Growth
Platforms

19
New
Segment Opportunities - Transportation
§ Single
tile replace-ability
§ Longer
Life construction
§ Highest
standards of Smoke Toxicity with Nylon
§ Lighter
weight than current carpet options
§ Quick
replacement - no “out of service” time
required
required
§ Recycled
after use by manufacturer
Benefits
of Modular for Transportation
$200M
Airline
Opportunity
Southwest
Airlines Green Plane
§ Pilot
project serving as a test for new
environmentally responsible materials
environmentally responsible materials
§ InterfaceFLOR,
in collaboration with Boeing,
designed a carpet tile to meet Federal Aviation
requirements and Southwest’s environmental
expectations
designed a carpet tile to meet Federal Aviation
requirements and Southwest’s environmental
expectations
§ First
ever modular carpet product used for the
airline industry
airline industry
Growth
Platforms
20
Invest
in Emerging Markets
Growth
Platforms
Interface
Target Emerging Markets
§ Central
America
§ South
America
§ Eastern
Europe
§ Russia
§ Middle
East
§ Africa
§ India
§ China
§ Vietnam
§ Cambodia
§ Singapore
§ Indonesia
§ Philippines
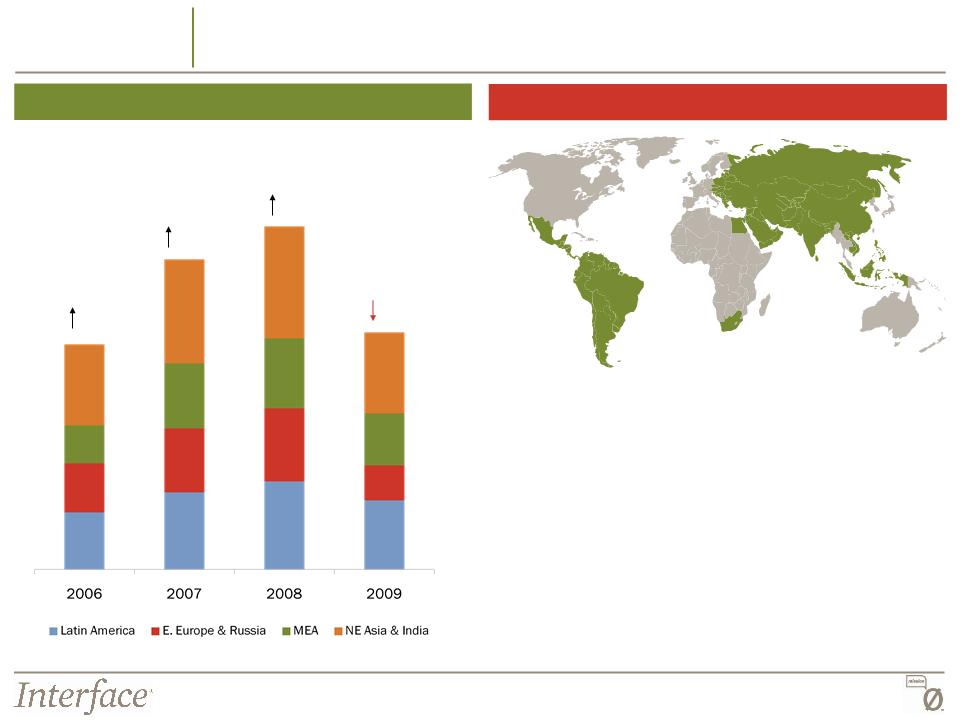
Emerging
Market Sales
38%
10%
31%
31%
21
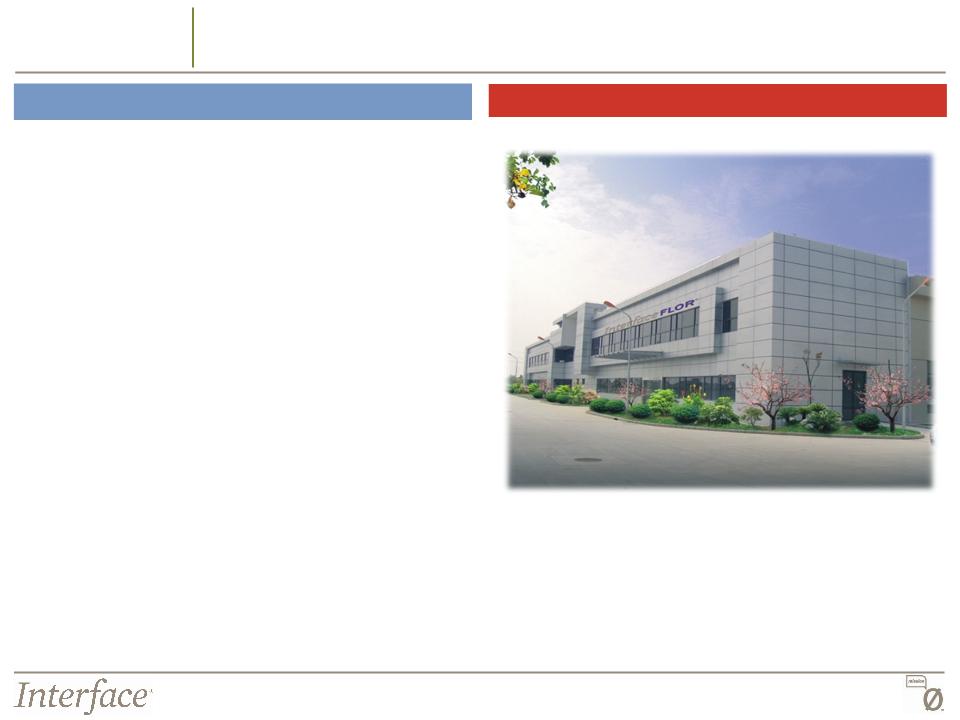
Invest
in Emerging Markets: Establishing Local Manufacturing
in High Growth China Market
in High Growth China Market
Growth
Platforms
InterfaceFLOR
Taicang Facility
§ Targeting
LEED Silver certification for Office and
Customer spaces
Customer spaces
§ Expect
to begin production by third quarter 2010
§ Greater
access to Local customers -
reduced exposure to Multi-National
Corporations
reduced exposure to Multi-National
Corporations
§ Improved
service speed
§ “Made
in China”
§ Leading
with our strengths
- Design
Flexibility & Responsiveness
- Local
Sustainability Position
§ Non-office
segment opportunities in
Institutional and Hospitality
Institutional and Hospitality
§ Future
opportunity to capitalize on
urbanization of population
urbanization of population
Benefits
of China Manufacturing Plant
22
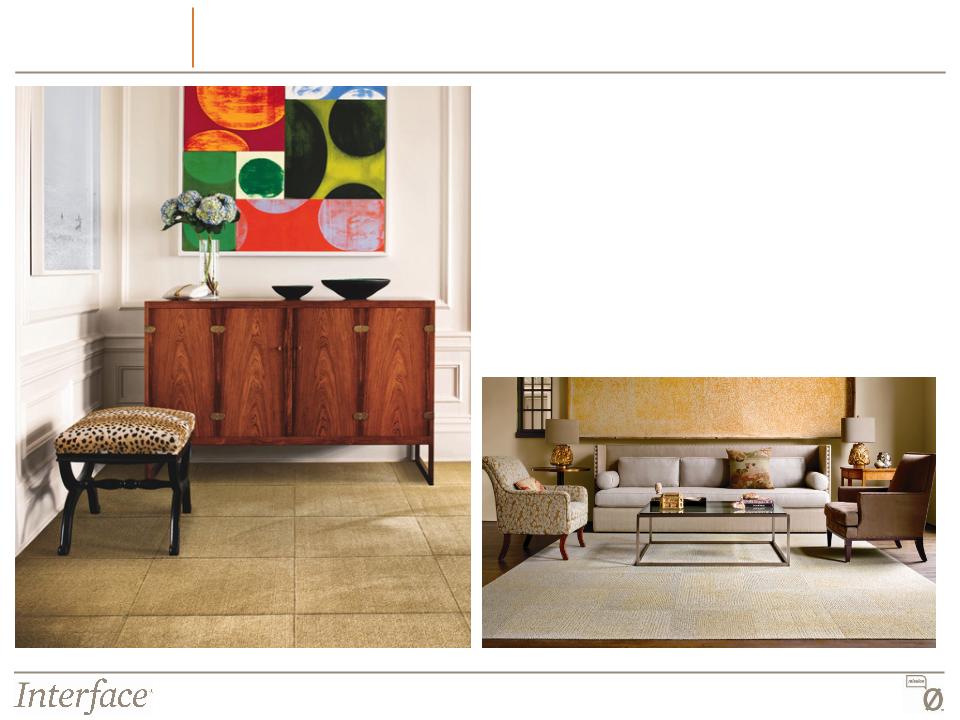
FLOR
is…
§
A new way to think about floor covering
§
A new kind of customer experience
§
A new way to design for your life
§
A new standard in sustainable residential
design
design
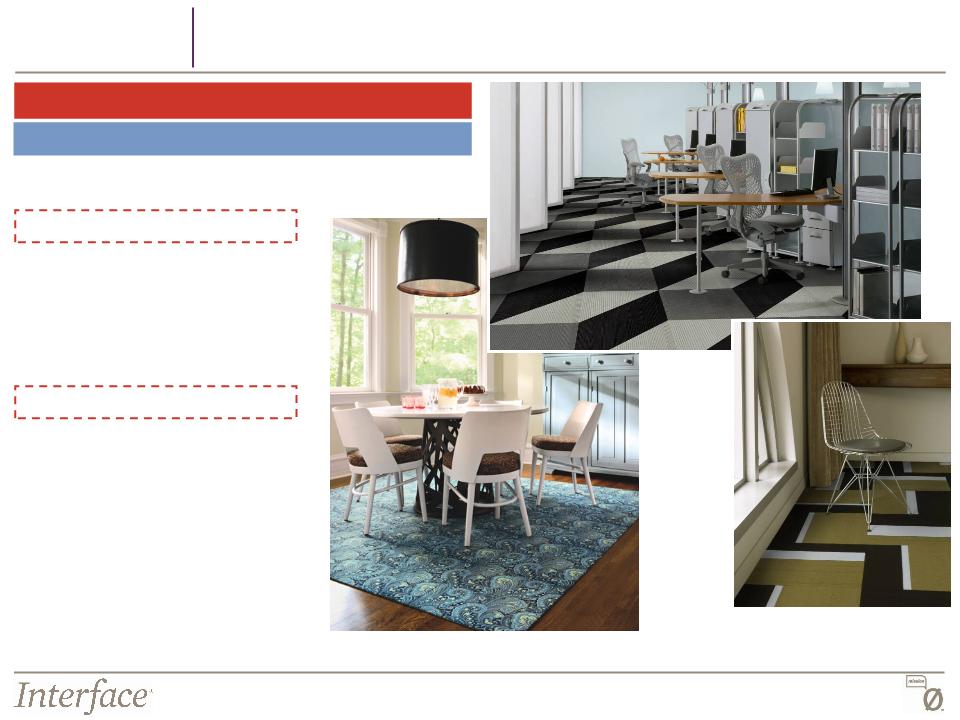
Grow
a Consumer Brand: Modular Goes in the Home
Growth
Platforms
23
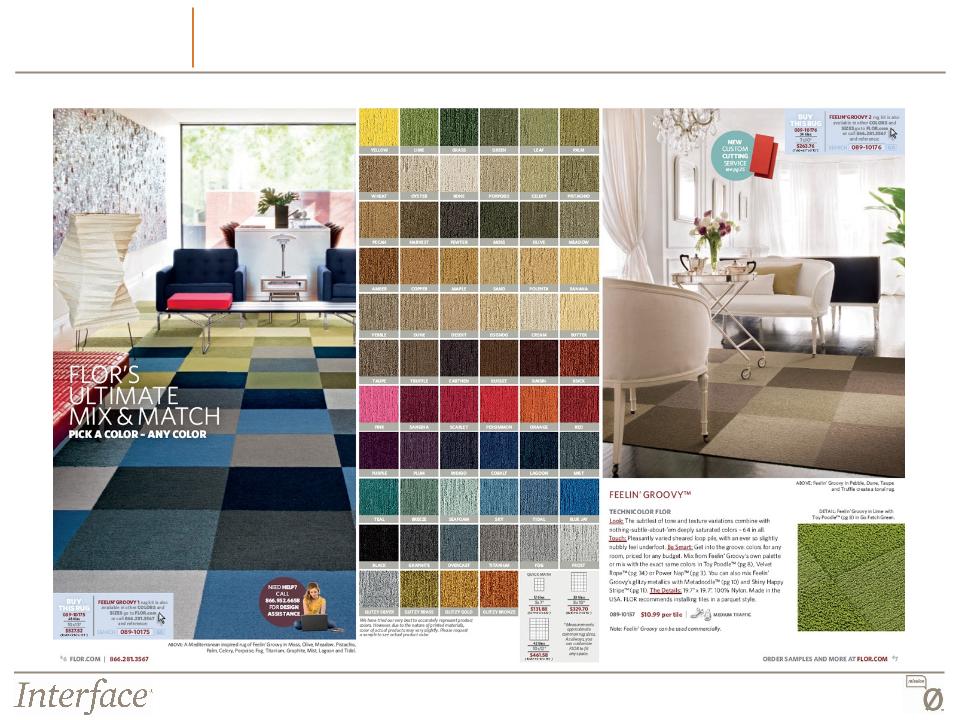
2010
catalog, online and in-store experiences bring the proposition to life for
consumers
Grow
a Consumer Brand: FLOR Connects Directly with
Consumers
Consumers
Growth
Platforms

24
FLOR
Sales by Channel
Grow
a Consumer Brand: FLOR is Creating a Category:
“Modular Carpet for the Home”
“Modular Carpet for the Home”
% Direct
Sales
Percent of Total
Percent of Total
75%
77%
88%
90%
of FLOR
sales
are
generated
Online
and via Catalog
and via Catalog
90%
Growth
Platforms

25
Grow
a Consumer Brand: FLOR Store Opened
§ First
store opened in Chicago in June 2009
§ Opportunity
to interact with the customer about
the modular concept, design and sustainability
the modular concept, design and sustainability
§ 8x10
grid allowing visitors to bring design ideas
to life
to life
§ Exceeded
budget in 2009
§ Exploring
opportunities for future stores
FLOR
Store Highlights
Growth
Platforms
26
Global
Manufacturing Capabilities and Local Distribution
City
of
Industry,
California
Bangkok,
Thailand
Thailand
Picton,
Australia
Australia
Current
Manufacturing Facility
LaGrange,
Georgia
Georgia
58%
of Sales
51%
of Production
30%
of Sales
34%
of Production
12%
of Sales
15%
of Production
Note:
Figures represent FYE 2009
Value
Drivers
Shanghai,
China
Americas
Europe
& MEAI
Asia-Pacific
Future
Manufacturing Facility
Uruguay
(commissioned)
India
27
1. Increases
speed to market
2. Promotes
innovation
3. Offers
unique custom product capabilities
4. Supports
a constant flow of new products
5. Offers
sales force the opportunity to visit the
customer with new products
customer with new products
6. Decreases
lead time to customers
7. Increases
inventory turns
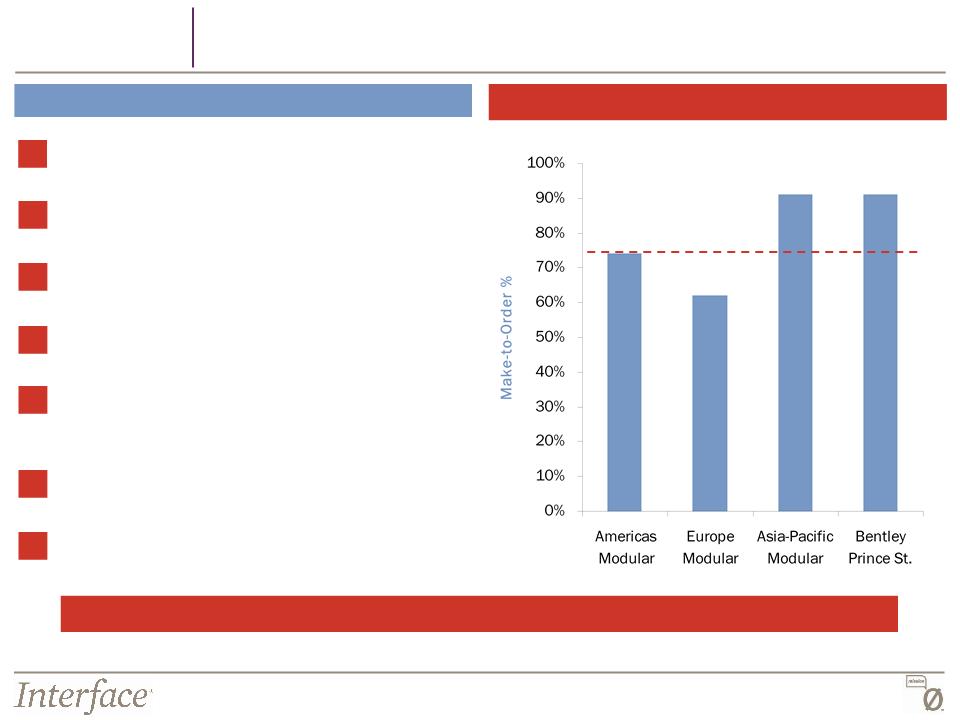
The
Made-to-Order Advantage
Interface
Modular Percentage Make-to-Order
Interface
is the ONLY company with a “make-to-order” approach to the market
75%
TARGET Level
Note:
Figures represent FYE 2009
Value
Drivers
Strong
Competitive Advantage Through Make-to-Order Philosophy
28
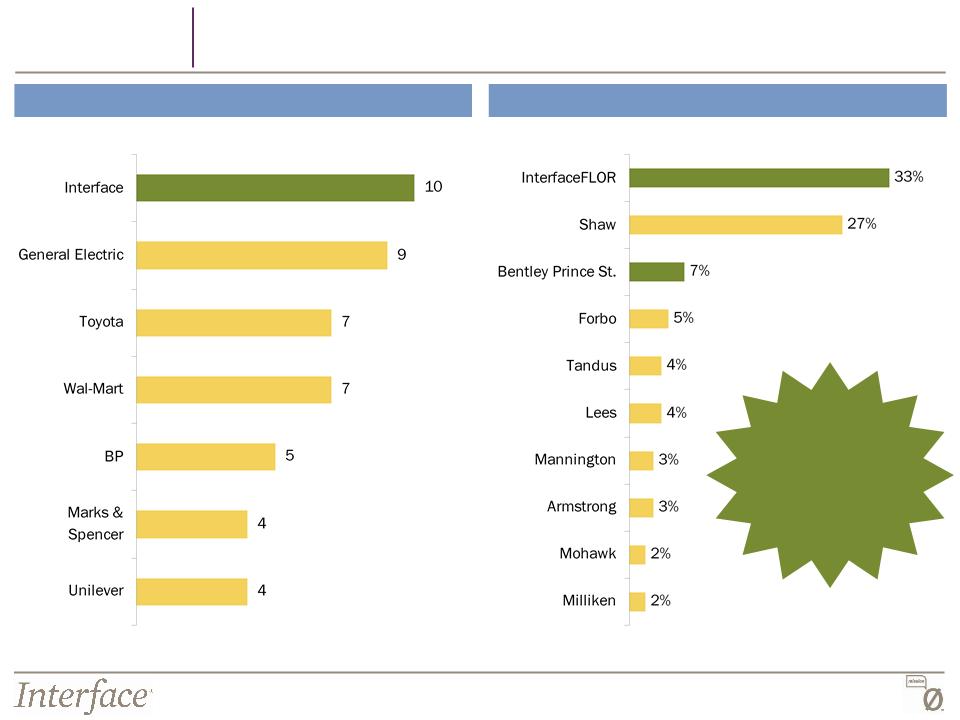
Contract
Magazine 2009 Brand Report
Value
Drivers
Top
Modular Carpet Brands
1. InterfaceFLOR
2. Shaw
Contract Group
3. Lees
Carpets
4. Milliken
5. Bentley
Prince Street
5. Tandus
7. Patcraft
Designweave
8. C&A
8. Mannington
10. J&J/Invision
Top-ranked
Modular Carpet brands for 2009
Source:
Contract Magazine 10th Annual Brand
Report
Market
Leader in Product Design and Fashion
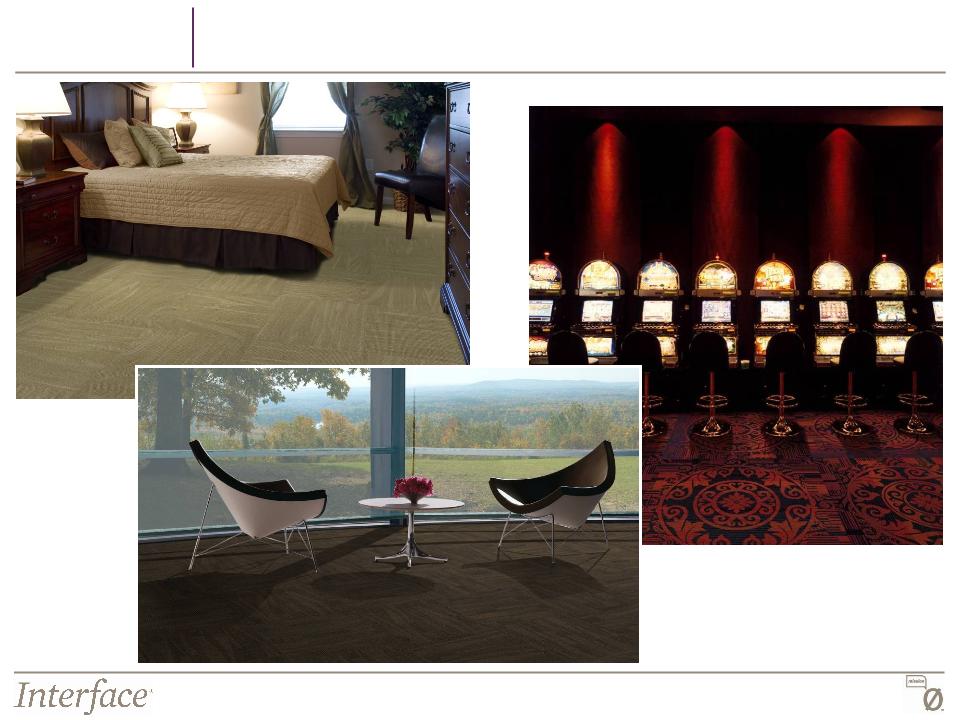
29
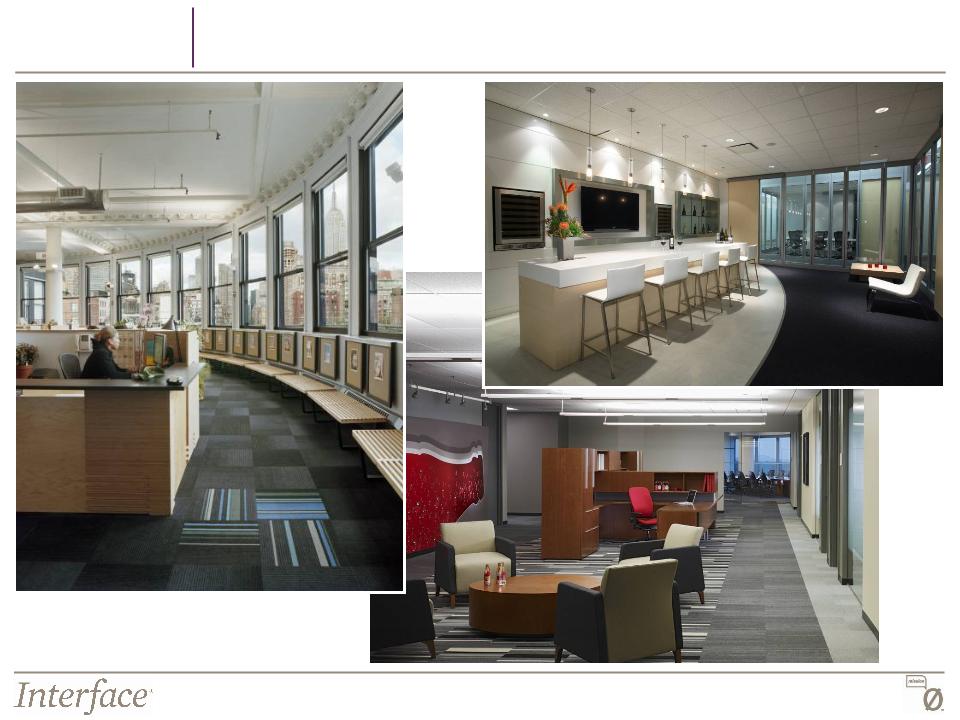
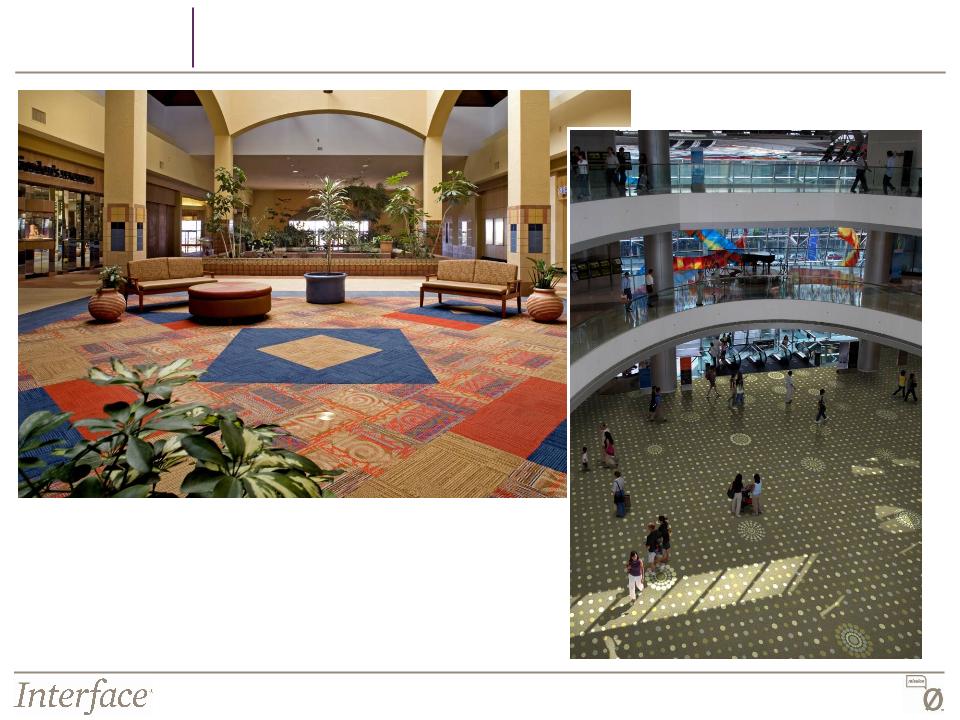
Corporate
Office
Value
Drivers
30
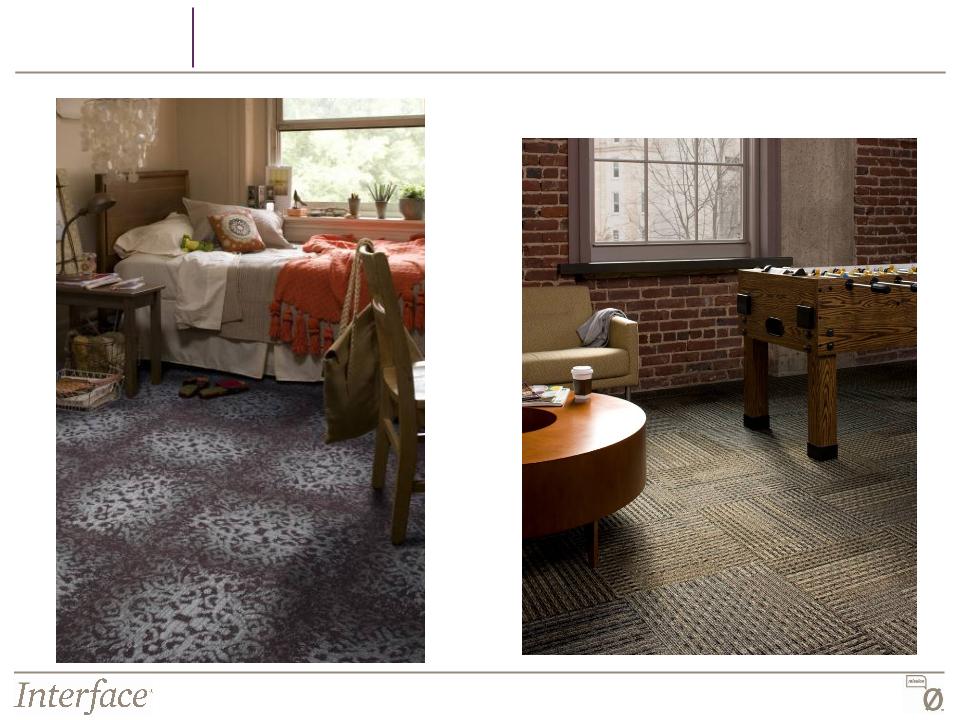
Retail
Value
Drivers
31
Colleges
& Universities
Value
Drivers
32
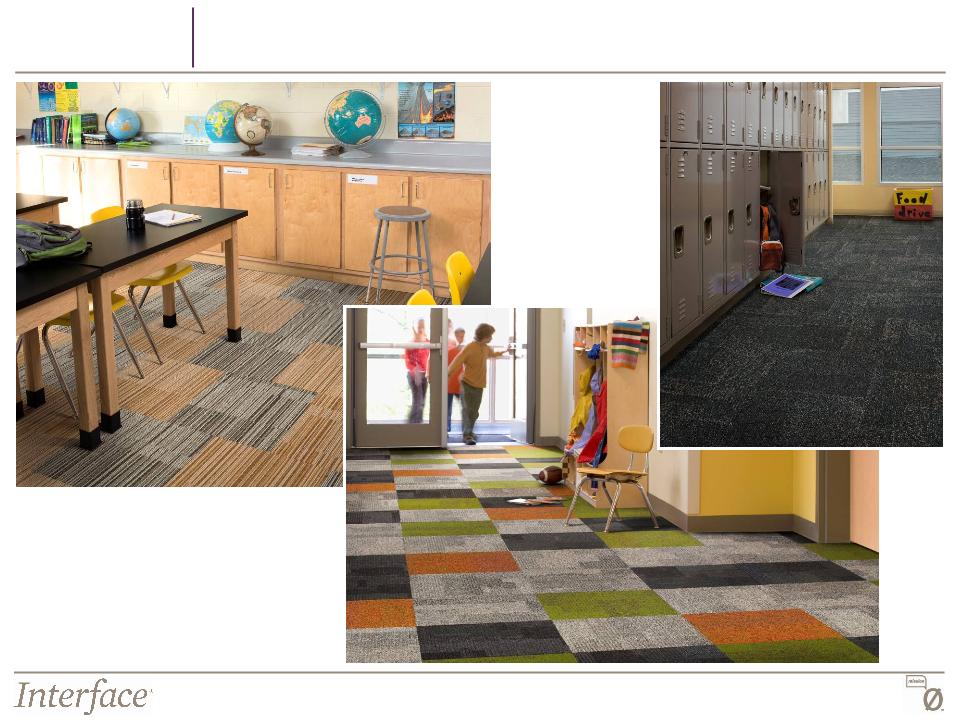
K-12
Education
Value
Drivers
33
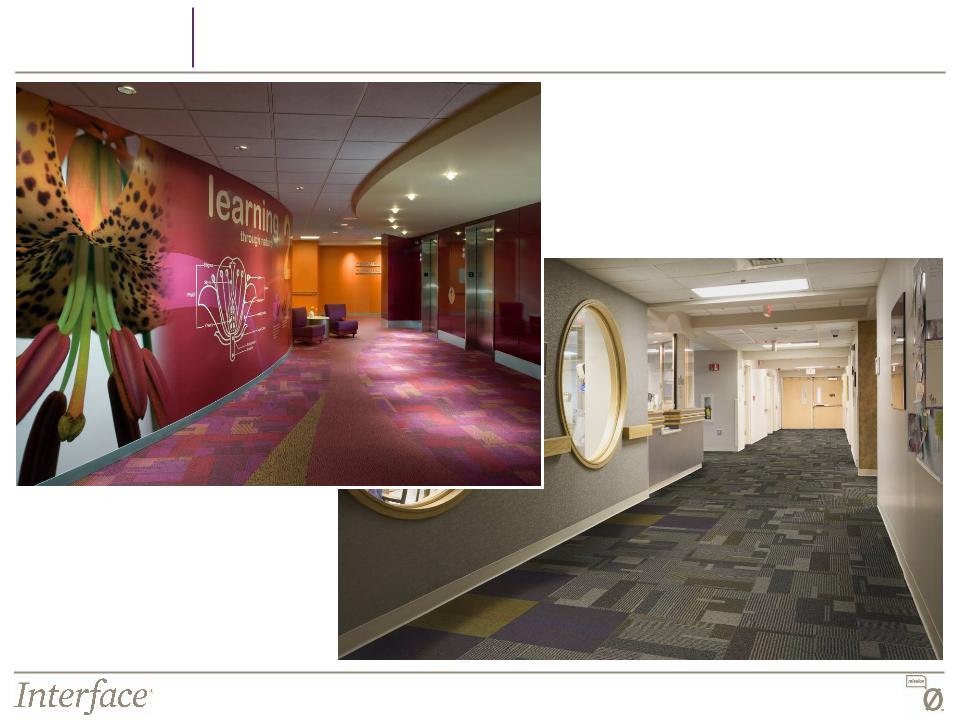
Healthcare
Value
Drivers

34
Government
& Public Spaces
Value
Drivers
35
Hospitality
Value
Drivers
36
Interface
is the Recognized Leader in Sustainability
GlobeScan
Corporate Sustainability Leaders 2009
Floor
Focus Green Leaders 2009
Unprompted,
Combined Mentions 2009
Value
Drivers
Source:
2009 Floor Focus Top 250 Design Survey (U.S. Market)
Interface
received
“Green
Kudos”
for
Sustainable
Products with good
Design options and
Closed Loop
Processes
Products with good
Design options and
Closed Loop
Processes
Source:
The Sustainability Survey from GlobeScan

37
Sustainability
Inspires Innovation
Value
Drivers
§ i2
Design Platform - biomimicry inspired
random carpet tile patent
random carpet tile patent
§ TacTiles
- no glue installation
§ Cool
Blue - 100% recycled backing process
§ Cool
Carpet - climate neutral product
§ ReEntry
2.0 - carpet reclamation and
recycling program
recycling program
§ Convert
- post-consumer recycled content
product platform
product platform
§ Southwest
Green Plane - pilot project
testing new environmentally responsible
materials for airplanes
testing new environmentally responsible
materials for airplanes
Sustainability-Focused
Innovation
Cool
Blue™
Greenbuild
2009
i2
Products
38
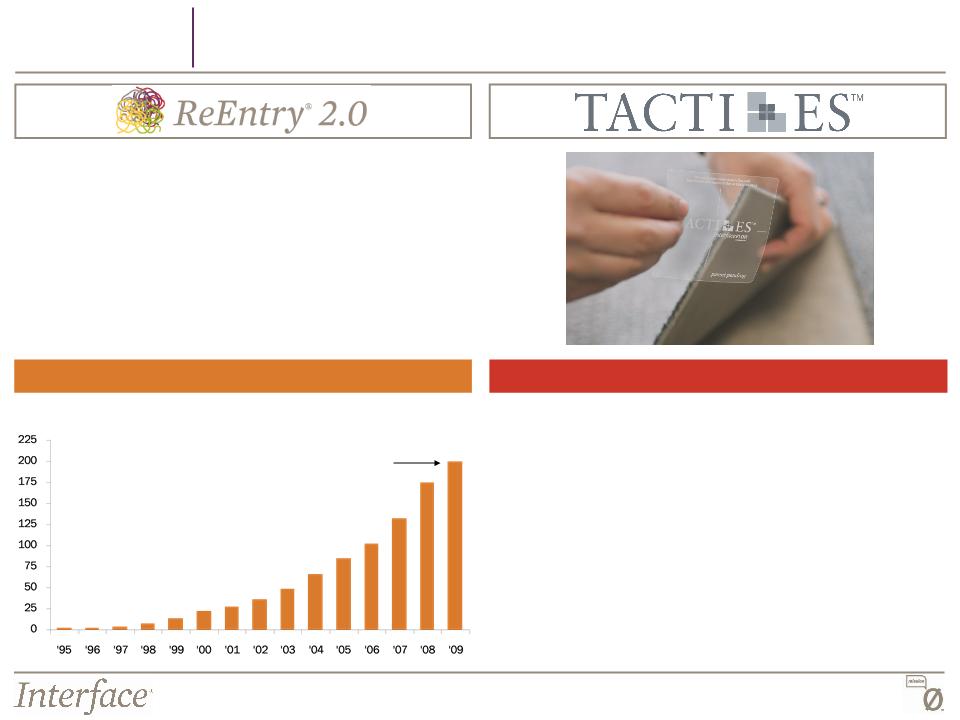
ReEntry
2.0 Brings Convert Product Platform
Value
Drivers
§ Reclaiming
both Interface and competitor carpet tile
and broadloom, sorting & separating
and broadloom, sorting & separating
§ Access
to recycled N6 and N6,6 face fiber, boosting
post consumer recycled content in our products
post consumer recycled content in our products
§ Diverted
200 million pounds of materials from
landfills from 1995-2009
landfills from 1995-2009
ReEntry
- Cumulative Carpet Diverted from Landfill
200m
pounds of
carpet
diverted
(millions
of lbs)
Benefits
of TacTiles
§ Patented
No Glue / No VOCs installation system
§ 25%
of current orders include TacTiles
§ High
margin product
§ Leading
to other new innovations - Moisture Guard
2.0 moisture vapor barrier
2.0 moisture vapor barrier
§ Integrating
TacTiles into Design - designing
installation patterns that drive TacTile demand
installation patterns that drive TacTile demand

Interface,
Inc. Financials
40
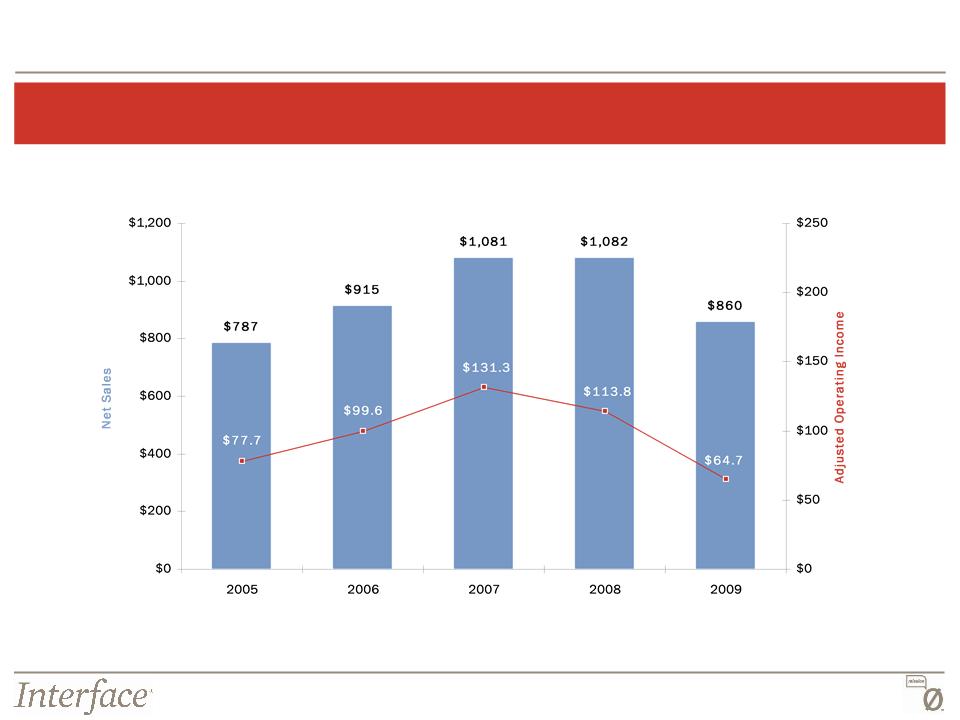
Consolidated
Financial Results
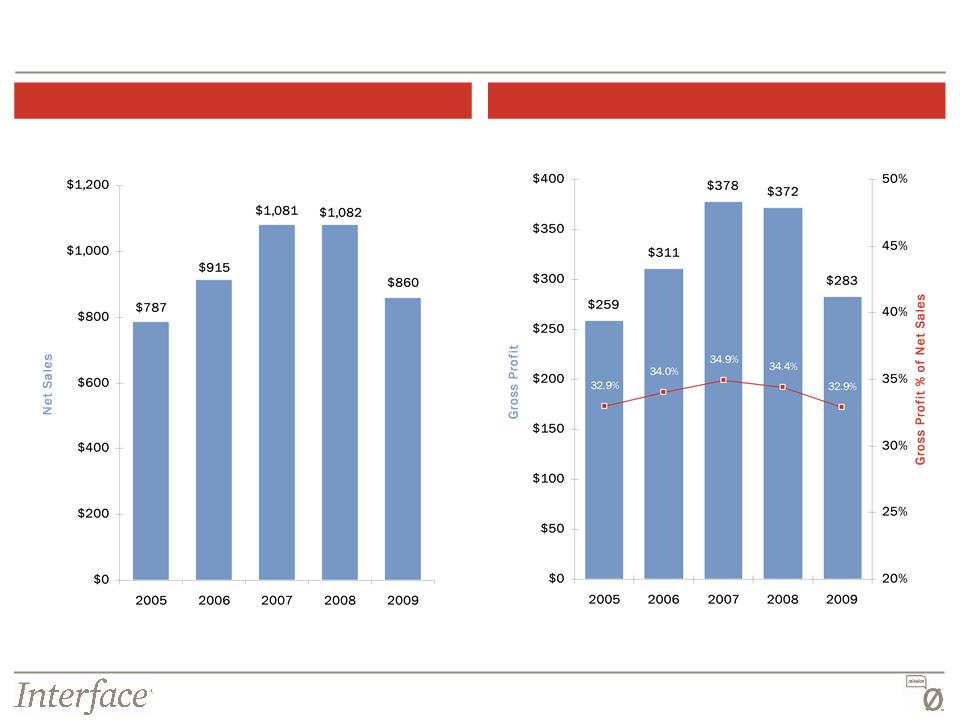
Net
Sales and Adjusted Operating Income
(Continuing
Operations)*
* See the Appendix for a
reconciliation of Adjusted Operating Income from Continuing
Operations
($
in millions)
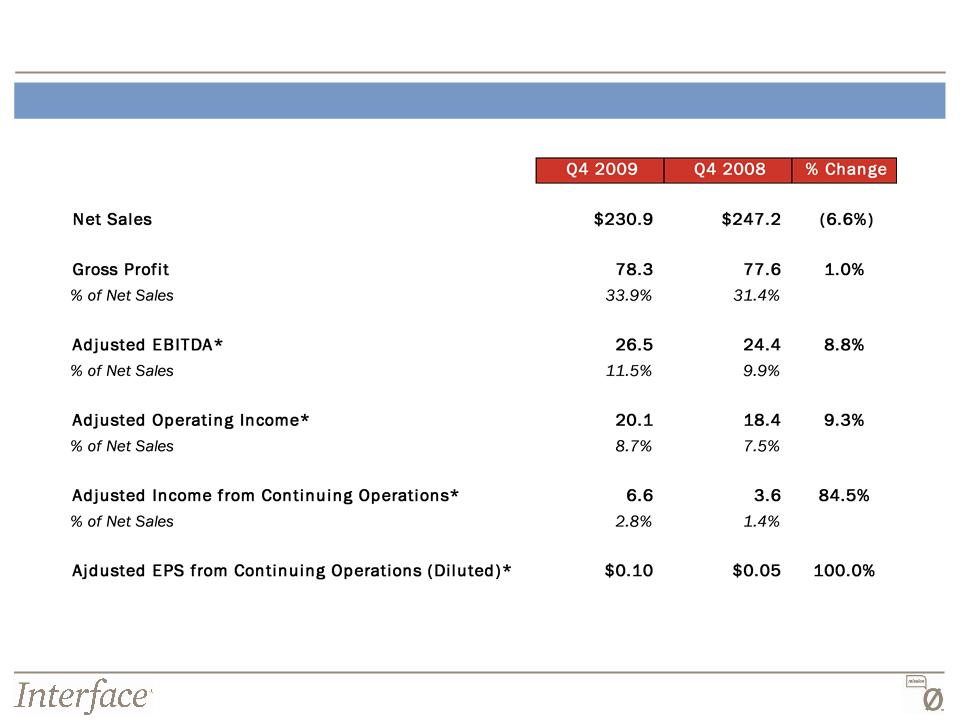
41
Quarterly
Results
Q4
Comparison*
* See the Appendix for a
reconciliation of adjusted figures
($
in millions)
42
Interface
Financial Results from Continuing Operations
Net
Sales
Gross
Profit
($
in millions)
($
in millions)
43
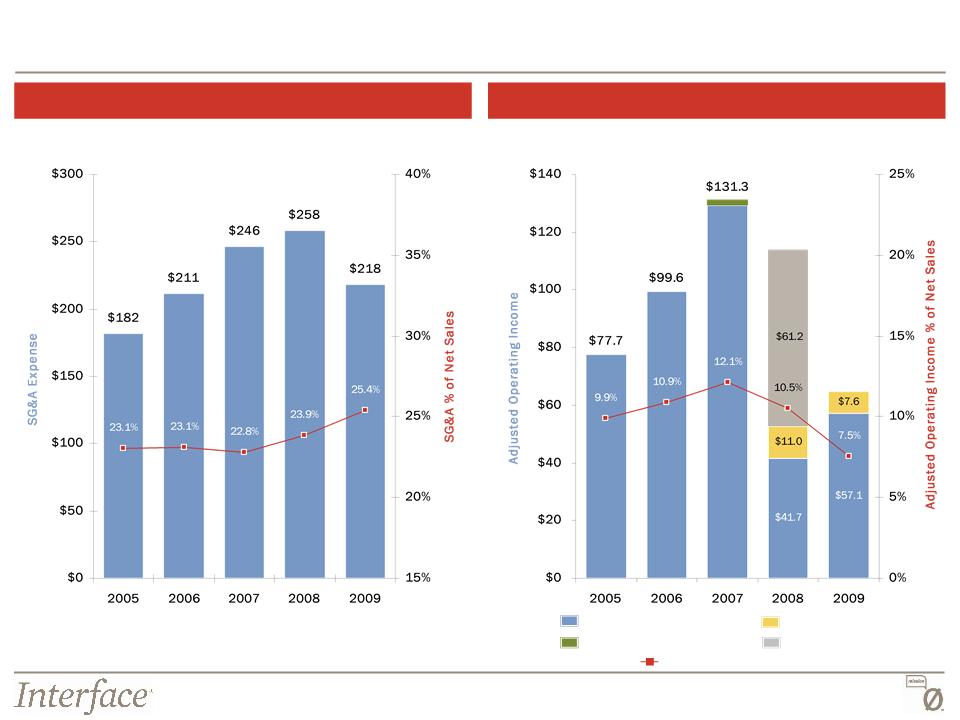
Interface
Financial Results from Continuing Operations
SG&A
Expense
Adjusted
Operating Income*
($
in millions)
($
in millions)
(1)
Reported Operating Income of $57.1M in 2009 excludes Income from Litigation
Settlements of $5.9M
* See the Appendix for a
reconciliation of Adjusted Operating Income
Reported
Operating Income
Restructuring
Charges
Loss
on Disposal ($1.9m)
Operating
Income % of Net Sales
Goodwill
Impairment
$113.8
$64.7
(1)
44
Interface
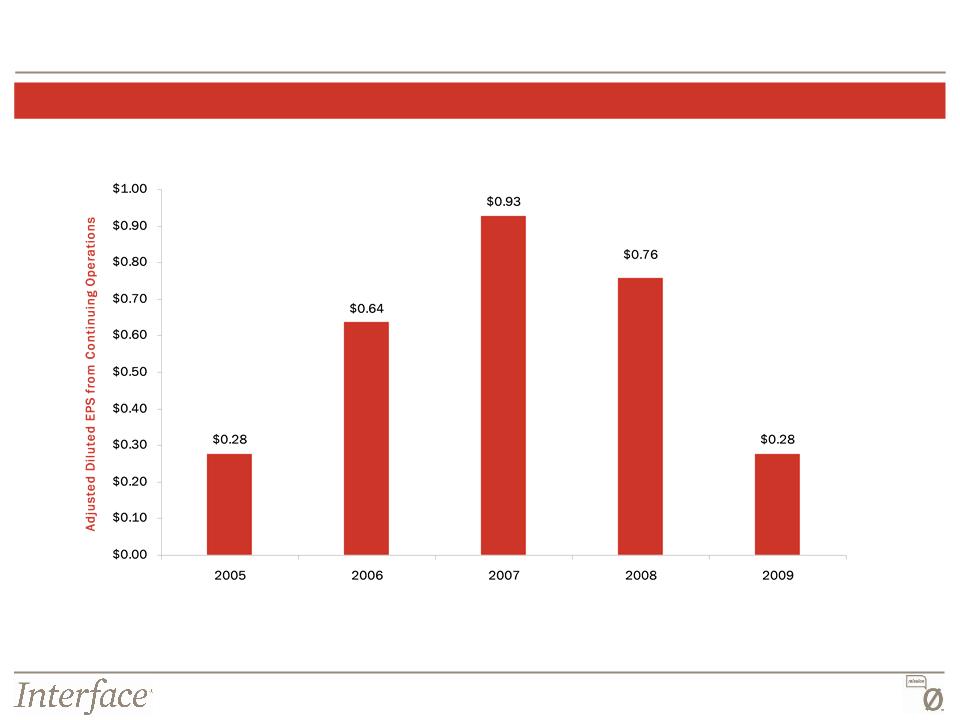
Financial Results from Continuing Operations
Adjusted
Diluted Earnings Per Share (Continuing Operations)*
* See the Appendix for a
reconciliation of Adjusted Diluted Earnings Per Share from Continuing
Operations

45
Key
Leverage Statistics
Ending
Cash Balance
Net
Debt*
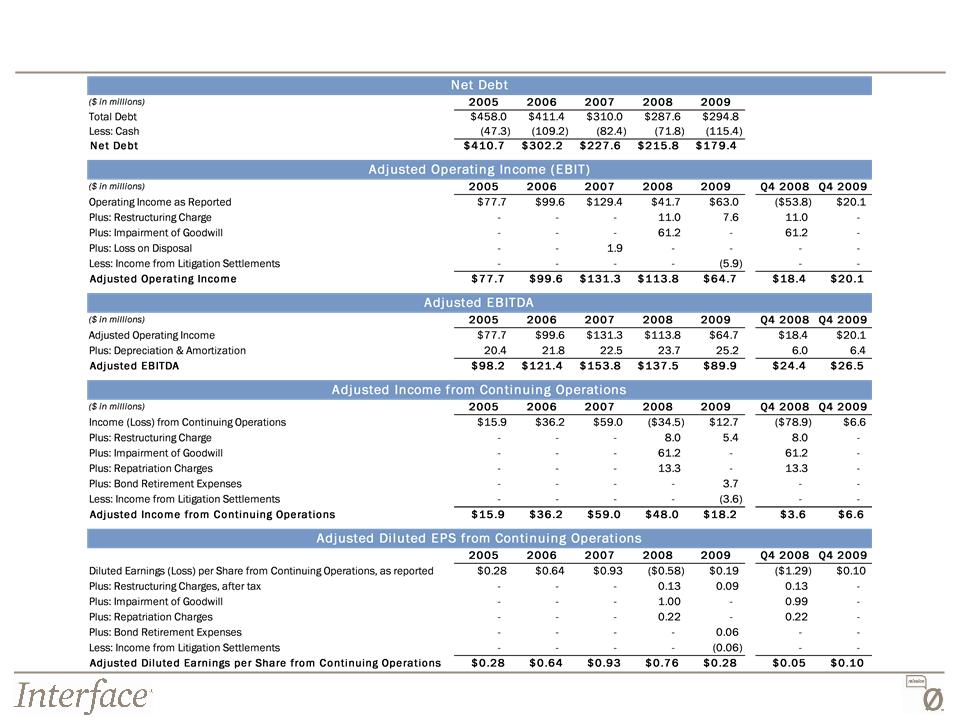
* See the Appendix for a
reconciliation of Net Debt and Adjusted EBITDA
46
Appendix:
Reconciliation of Non-GAAP Financial Measures